Priority Setting and Resource Allocation Data Presentation For Fiscal Year 2012 June 15, 2011 PSRA Data Presentation June 15, 2011 1

Priority Setting and Resource Allocation Data Presentation For Fiscal Year 2012 June 15, 2011 PSRA Data Presentation June 15, 20111.
Dec 25, 2015
Welcome message from author
This document is posted to help you gain knowledge. Please leave a comment to let me know what you think about it! Share it to your friends and learn new things together.
Transcript

Priority Setting and Resource Allocation Data Presentation
For Fiscal Year 2012
June 15, 2011
PSRA Data Presentation June 15, 2011 1

Introduction/Review Comprehensive PlanGoals and Objectives
Dorcas YoungRyan White Part A Program Manager
PSRA Data Presentation June 15, 2011 2

Memphis TGA Comprehensive Plan
The document was created in 2009 as a collaborative effort of the Ryan White Grantee, Planning Council and various community stakeholders and partners.
It serves as a “roadmap” for how we will work to design and implement an ideal system of HIV care for the Memphis TGA.
Planning and activities of the Ryan White program should be supportive of the goals and objectives outlined in the plan.
The plan will next be updated in May 2012.PSRA Data Presentation June 15, 2011 3
Using the Comprehensive Plan in the PSRA Process
Consider services identified in the Comprehensive Plan while making decisions about service priorities and resources allocated for services
Ensure that specific directives are provided around services that will ensure that goals and associated objectives are included in service provision (ex. use of peer models in implementing Early Intervention Services)
Maximize opportunities for coordination with existing funding streams and community partners by giving careful consideration of all resources available within the TGA
Consider activities that have already been implemented that are in line with goals and objectives within the plan. How can we build upon any past successes or modify activities that were not as successful?
PSRA Data Presentation June 15, 2011 4
GOAL #1: Ensure the availability and quality of all core medical services within the Memphis
TGA.
Objective 1.3: Develop a model of care that includes a local pharmaceutical assistance program that addresses various gaps in the State ADAP programs covering clients in the TGA.
PSRA Data Presentation June 15, 2011 5

GOAL #2: Eliminate disparities in access to core medical services and support services among disproportionately affected sub-populations and historically underserved communities.
• Objective 2.1: Develop a system that specifically addresses the challenges of transportation within the TGA.
•Objective 2.2: Continue to utilize Minority AIDS Initiative (MAI) funds to develop unique ways to get communities of color to access and stay in the system of care.
•Objective 2.3: Ensure that the services provided and allocations of funding adequately address the emergent support service needs of individuals living with HIV/AIDS.
•Objective 2.4: Ensure a system that adequately addresses the housing needs of PLWHA in the Memphis TGA.
•Objective 2.5: Ensure funding levels to Women, Infants, Children and Youth in the Memphis TGA are consistent with HRSA requirements.
PSRA Data Presentation June 15, 2011 6

GOAL #3: Specify strategies for identifying individuals who know their HIV status but are
not in care, informing them about available treatments and services, and assisting them in
the use of those services.• Objective 3.1: Develop a strategy for increasing awareness among clients and the community at large of the availability of Ryan White services.
•Objective 3.2: Develop models of care that focus on the use of peer advocates to assist in getting clients to access and keeping them in care.
PSRA Data Presentation June 15, 2011 7

GOAL #4: Include strategies that address the primary health care and treatment needs of
those who know their HIV status and are not in care, as well as the needs of those currently in
the HIV/AIDS care system.• Objective 4.3: Address the impact of low educational levels and poverty on those living with HIV/AIDS and those at risk throughout the TGA.
• Objective 4.4: Support existing programs and establish new program(s) to facilitate entry into the medical care system upon release from jail/prison. Ensure that such programs address disclosure concerns for soon-to-be released and recently released PLWHA.
• Objective 4.4: Support existing programs and establish new program(s) to facilitate entry into the medical care system upon release from jail/prison. Ensure that such programs address disclosure concerns for soon-to-be released and recently released PLWHA.
PSRA Data Presentation June 15, 2011 8

GOAL #5: Include strategies to coordinate the provision of services for HIV prevention,
including outreach and early intervention services.
• Objective 5.1: Support current initiatives seeking to increase prevention and outreach efforts within the faith community.
•Objective 5.3: Develop models that combine targeted outreach and medical care for PLWHA who are newly diagnosed or out-of-care.
PSRA Data Presentation June 15, 2011 9

GOAL #6: Create a system that reflects strategies for the provision and treatment of Substance Abuse and Mental Health services.
• Objective 6.3: Assess the capacity of available substance abuse and mental health services for PLWHA within the TGA and ensure that funding resources are maximized.
PSRA Data Presentation June 15, 2011 10

Final Thoughts……
Make sure to thoroughly review all of the goals and objectives of the Comprehensive Plan before the Priority Setting and Resource Allocation sessions.
Consider how some of the data presented connects to goals and objectives. Think about how plans for service delivery might support the data and the goals and objectives. Make notes and bring them to the next sessions!
Think ahead… the next Comprehensive Plan will be collaboratively submitted in May 2012.
PSRA Data Presentation June 15, 2011 11
Memphis TGA 2010 Epidemiologic Profile
Jennifer KmetSenior Epidemiologist
Shelby County Health Department
PSRA Data Presentation June 15, 2011 12

• AIDS: laboratory confirmed evidence of HIV infection and one of the following:- a CD4+ count less than 200 or - CD4+ percentage less than 14% or - one of the 27 AIDS-defining illnesses.
• HIV Disease:
- laboratory confirmed evidence of HIV infection, regardless of stage of disease.
Case Definitions
PSRA Data Presentation June 15, 201113

• What are the sociodemographic characteristics of the general population of the Memphis TGA?
• What is the scope of the HIV/AIDS epidemic in the Memphis TGA?
• What are the indicators of risk for HIV infection among disadvantaged and disproportionately impacted populations?
Key Questions
PSRA Data Presentation June 15, 2011 14

What are the sociodemographic characteristics of the general population of the Memphis TGA?
Question 1
PSRA Data Presentation June 15, 2011 15
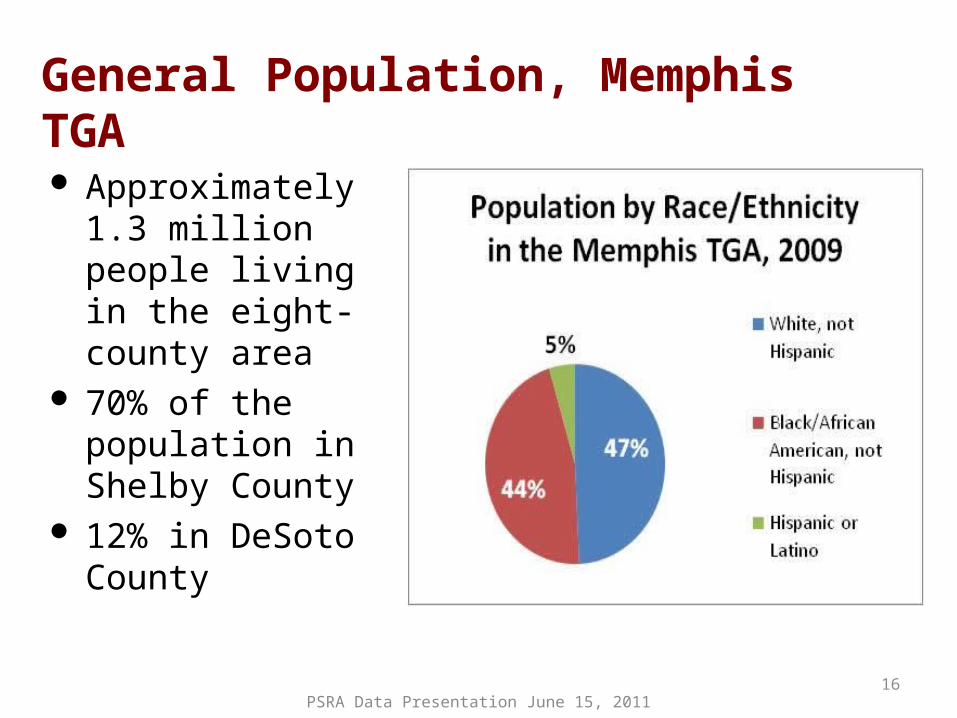
General Population, Memphis TGA
PSRA Data Presentation June 15, 2011
Approximately 1.3 million people living in the eight-county area
70% of the population in Shelby County
12% in DeSoto County
16

General Population, Memphis TGA
Source: US Census Bureau, American Community Survey 1-Year Estimates, 2009PSRA Data Presentation June 15, 2011 17
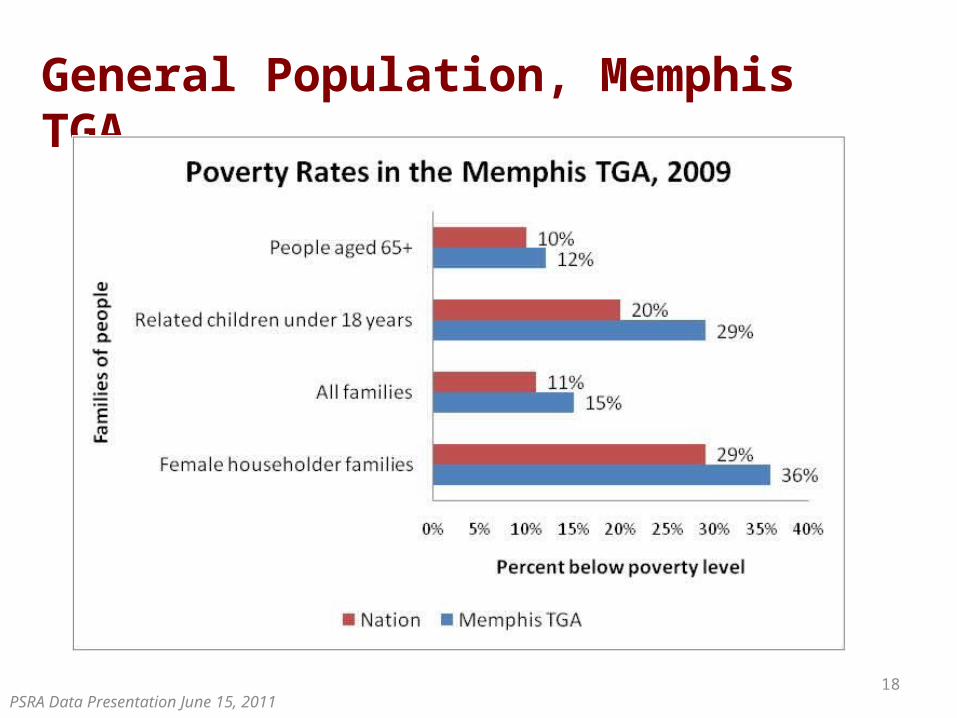
General Population, Memphis TGA
PSRA Data Presentation June 15, 201118
What is the scope of the HIV/AIDS epidemic in the Memphis TGA?
Question 2
PSRA Data Presentation June 15, 2011 19

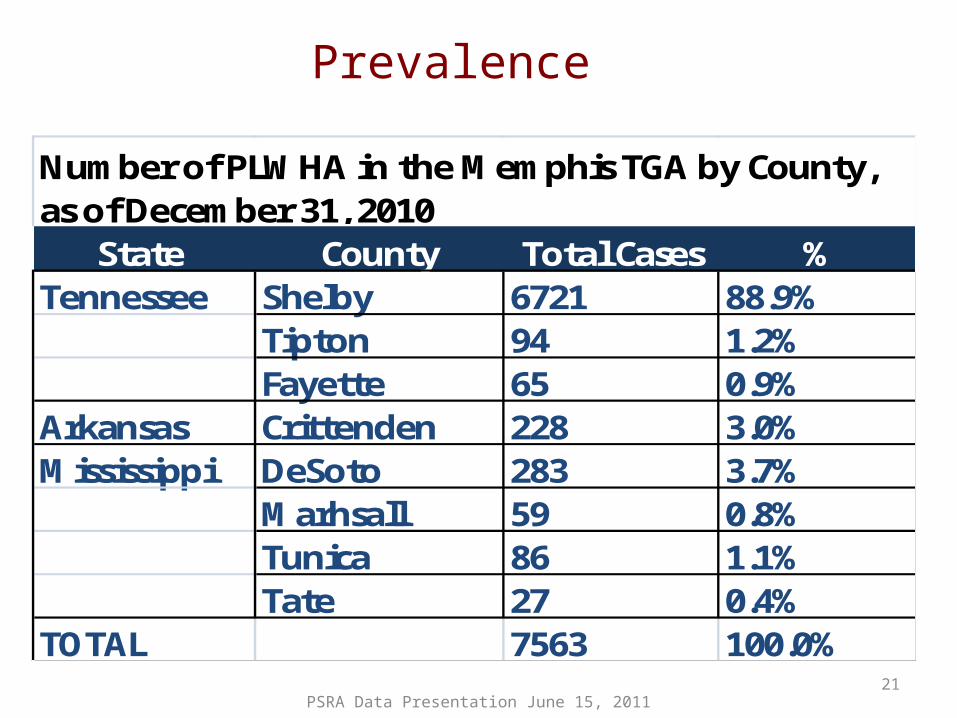
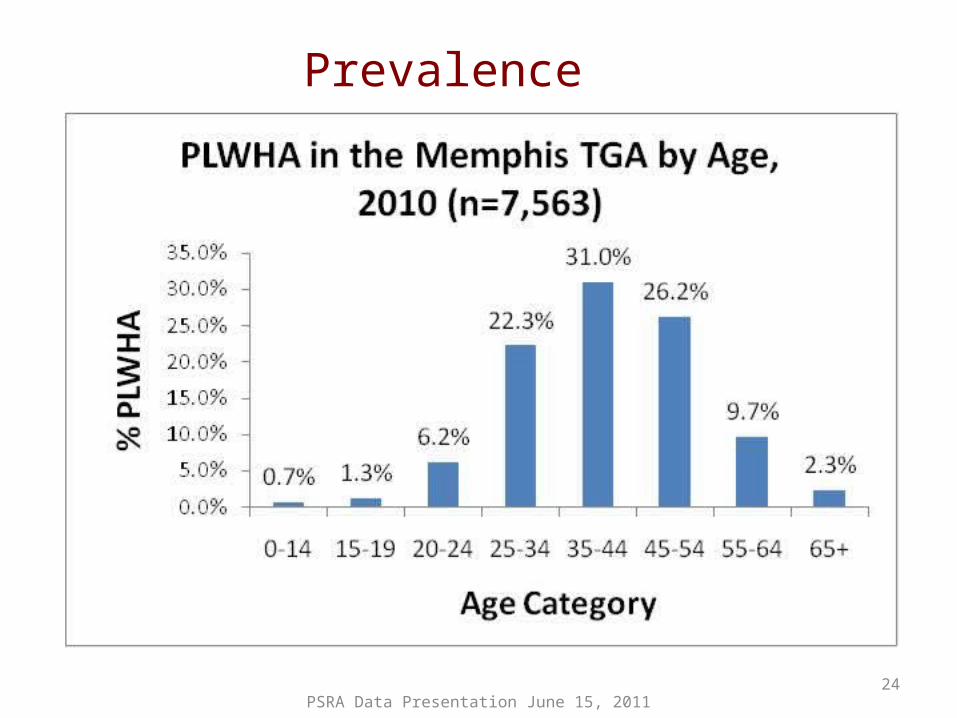
Prevalence
Total number of persons living with a specific disease in a population as of a specified date.
ex. 7,563 PLWHA in the Memphis TGA as of December 31, 2010.
PSRA Data Presentation June 15, 201120
Prevalence
State County Total Cases %Tennessee Shelby 6721 88.9%
Tipton 94 1.2%Fayette 65 0.9%
Arkansas Crittenden 228 3.0%Mississippi DeSoto 283 3.7%
Marhsall 59 0.8%Tunica 86 1.1%Tate 27 0.4%
TOTAL 7563 100.0%
Number of PLWHA in the Memphis TGA by County, as of December 31, 2010
PSRA Data Presentation June 15, 201121

Prevalence
PSRA Data Presentation June 15, 201122

Prevalence
PSRA Data Presentation June 15, 201123
Prevalence
PSRA Data Presentation June 15, 201124
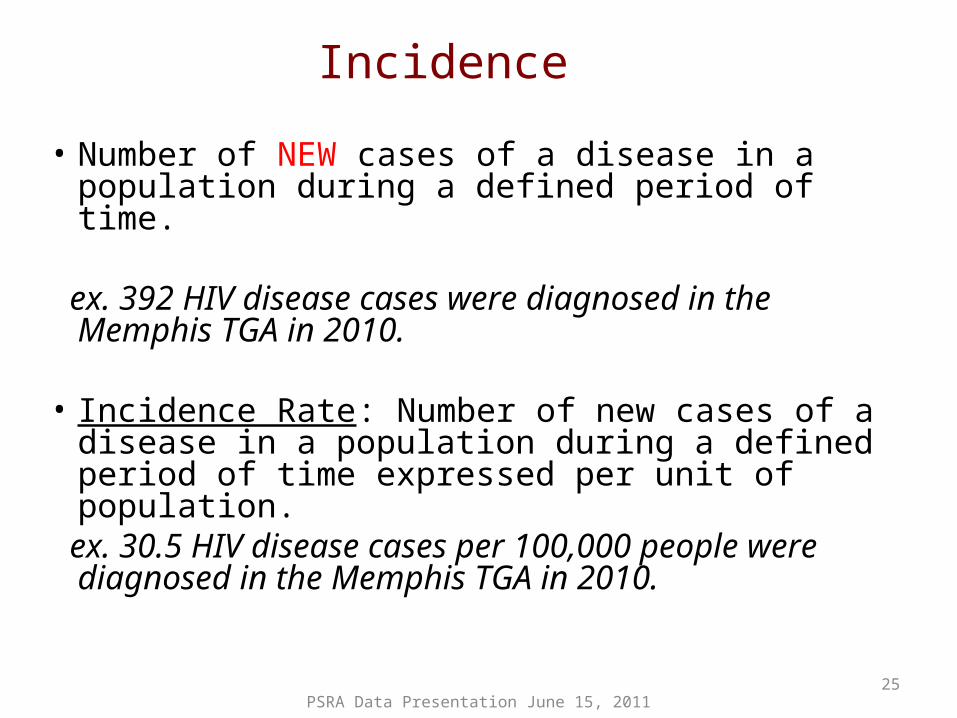
Incidence
• Number of NEW cases of a disease in a population during a defined period of time.
ex. 392 HIV disease cases were diagnosed in the Memphis TGA in 2010.
• Incidence Rate: Number of new cases of a disease in a population during a defined period of time expressed per unit of population.
ex. 30.5 HIV disease cases per 100,000 people were diagnosed in the Memphis TGA in 2010.
PSRA Data Presentation June 15, 201125
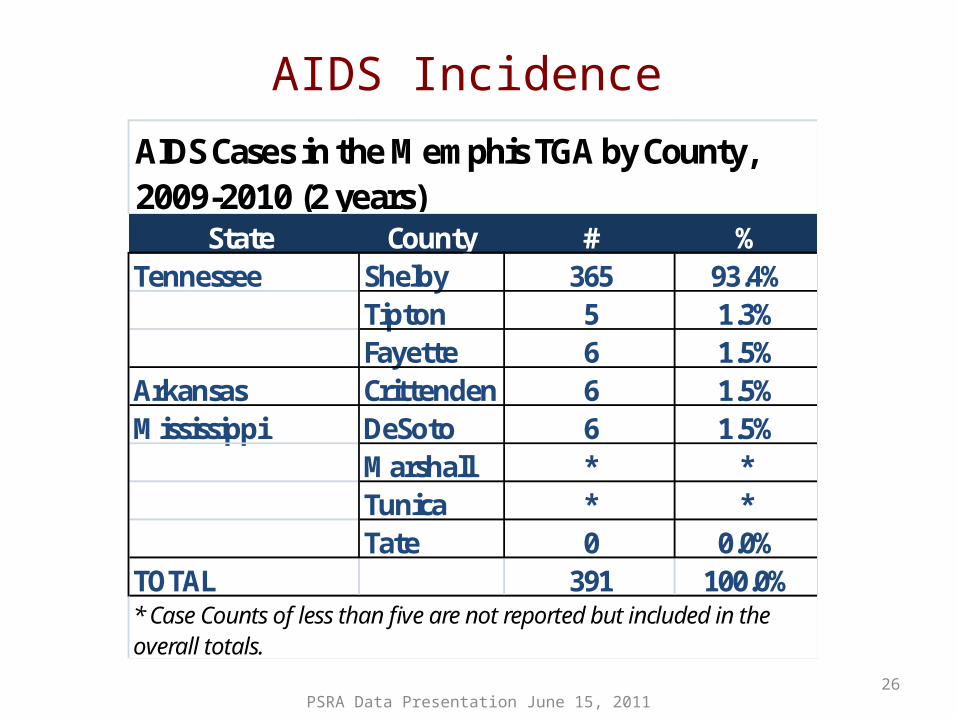
AIDS Incidence
PSRA Data Presentation June 15, 2011
State County # %Tennessee Shelby 365 93.4%
Tipton 5 1.3%Fayette 6 1.5%
Arkansas Crittenden 6 1.5%Mississippi DeSoto 6 1.5%
Marshall * *Tunica * *Tate 0 0.0%
TOTAL 391 100.0%
AIDS Cases in the Memphis TGA by County, 2009-2010 (2 years)
* Case Counts of less than five are not reported but included in the overall totals.
26

AIDS Incidence
PSRA Data Presentation June 15, 201127
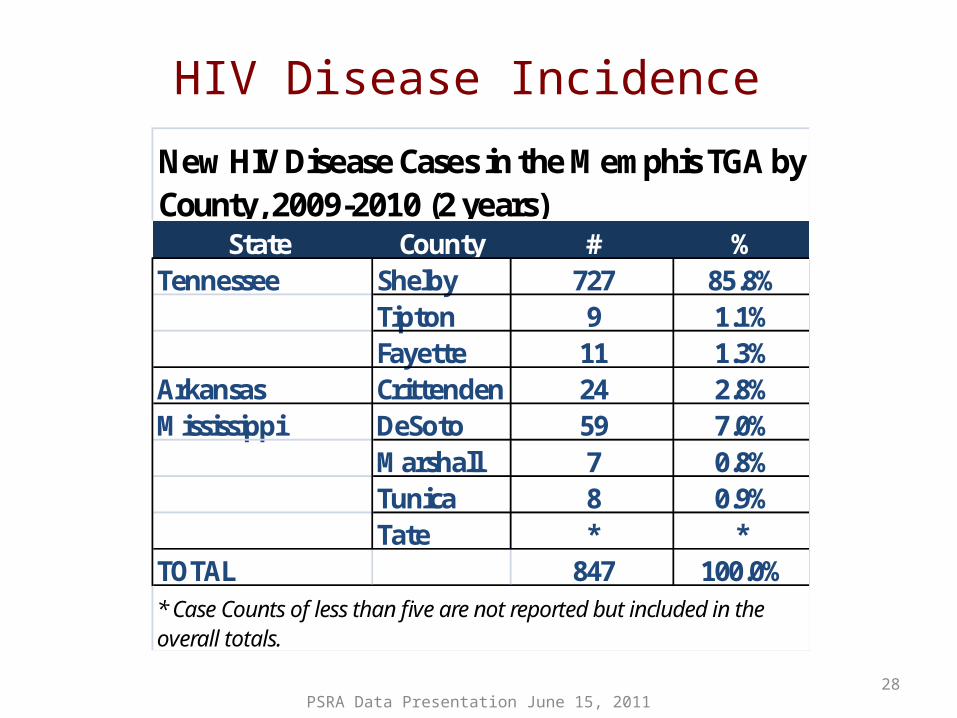
HIV Disease Incidence
PSRA Data Presentation June 15, 2011
State County # %Tennessee Shelby 727 85.8%
Tipton 9 1.1%Fayette 11 1.3%
Arkansas Crittenden 24 2.8%Mississippi DeSoto 59 7.0%
Marshall 7 0.8%Tunica 8 0.9%Tate * *
TOTAL 847 100.0%
New HIV Disease Cases in the Memphis TGA by County, 2009-2010 (2 years)
* Case Counts of less than five are not reported but included in the overall totals.
28

HIV Disease Incidence
PSRA Data Presentation June 15, 201129
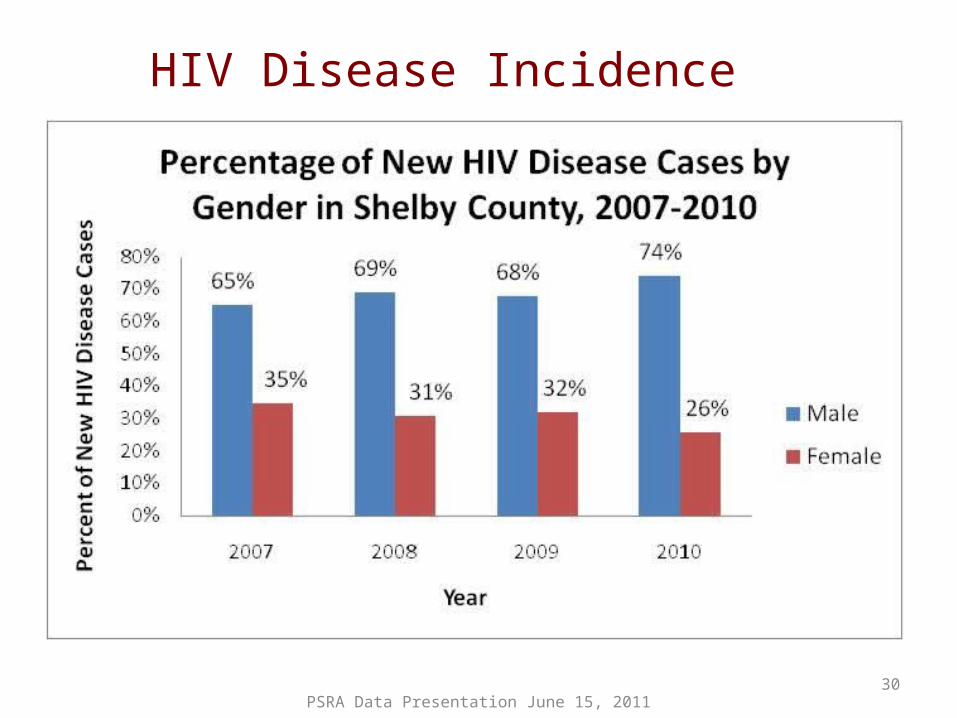
HIV Disease Incidence
PSRA Data Presentation June 15, 201130
HIV Disease Incidence
PSRA Data Presentation June 15, 201131
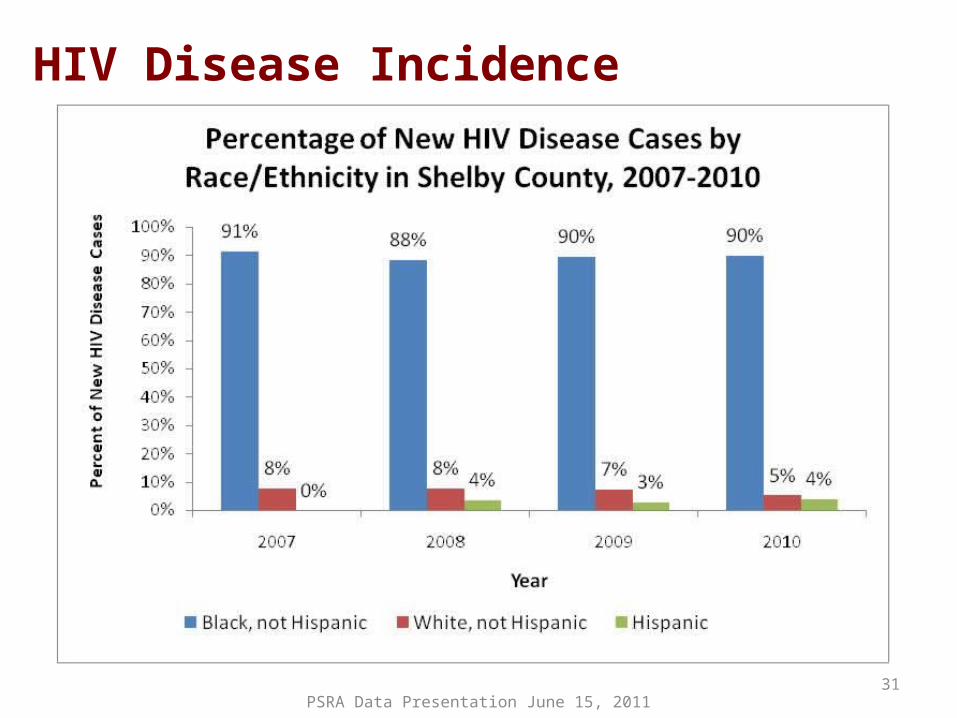
HIV Disease Incidence
PSRA Data Presentation June 15, 201132

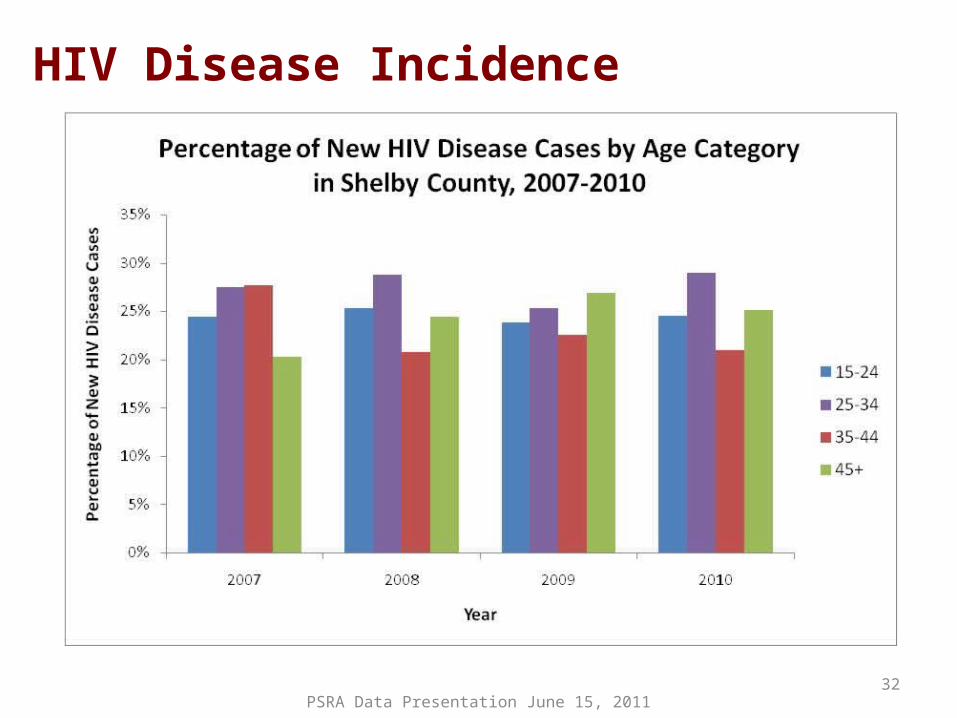
HIV Disease Incidence
PSRA Data Presentation June 15, 201133

STD Incidence
PSRA Data Presentation June 15, 2011
Co-Morbidity Memphis TGA Rate
National TGA Rate
Memphis TGA National Rank
Chlamydia 1039.7 442.6 1Gonorrhea 352.8 110.4 1P&S Syphilis 14.7 6.2 2* Rates are expressed per 100,000 persons
STD Incidence Rates in the Memphis TGA Compared to National TGA Rates, 2009
34

STD Co-Infection
PSRA Data Presentation June 15, 2011
* STD co-infection defined as a diagnosis of HIV and STD within the same year or diagnosis of STD after diagnosis of HIV; TB co-infection defined as concurrent diagnosis of HIV and TB.
Co-Morbidity PLWHA Rate General Population Rate
TB 172.5 7.0Syphilis 1688.7 74.7Gonorrhea 1317.0 421.1Chlamydia 1270.6 1191.5Acute Hepatitis ABC 78.4 4.6* Rates are expressed per 100,000 persons
Co-Infection Rates among PLWHA and the General Memphis TGA Population, 2009
35

Deaths due to HIV Disease
PSRA Data Presentation June 15, 201136

What are the indicators of risk for HIV infection among disproportionately impacted and disadvantaged populations?
Question 3
Black MSM Black women of childbearing age Hispanics Youth Incarcerated Homeless
PSRA Data Presentation June 15, 2011 37

Black MSM
• Almost 90% of all new HIV infections among males were Black, not Hispanic individuals in 2010 in Shelby County.
- Of these infections, 32% were among MSM and 55% had no reported/identified risk.
• In Shelby County, HIV+ MSM are at a 2.2 times increased risk for co-morbid Syphilis than HIV+ high-risk heterosexual men.
PSRA Data Presentation June 15, 201138

Black women of childbearing age
• 8 perinatal HIV cases reported between 2006-2010- 6 were Black, not Hispanic children
• 40 congenital syphilis cases were reported in Shelby County between 2005-2009
- 95% occurred among infants born to Black mothers.
PSRA Data Presentation June 15, 201139
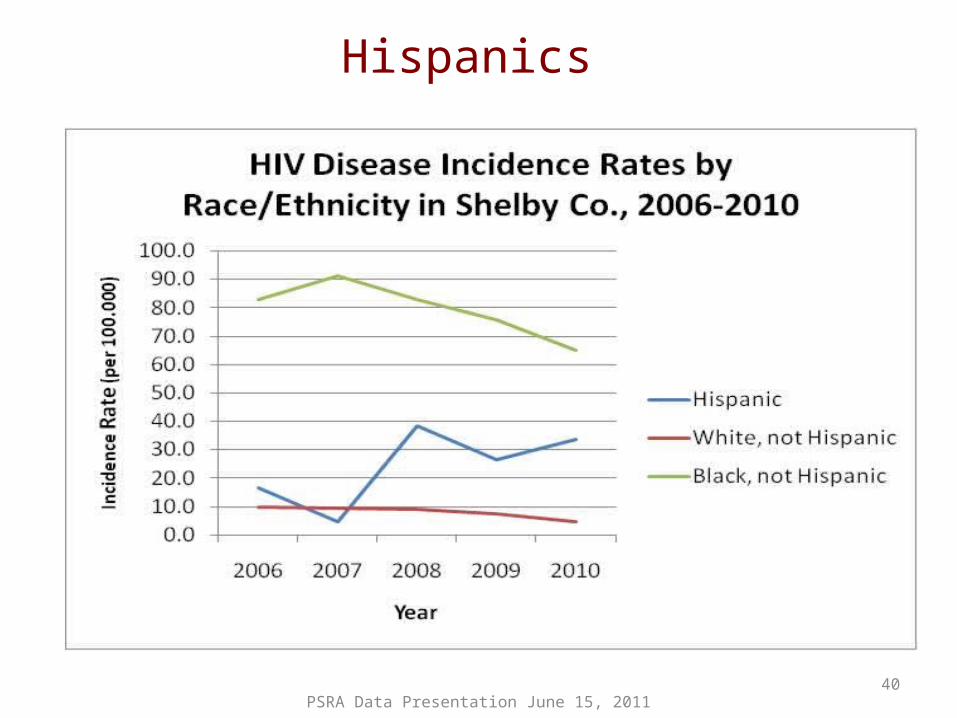
Hispanics
PSRA Data Presentation June 15, 201140
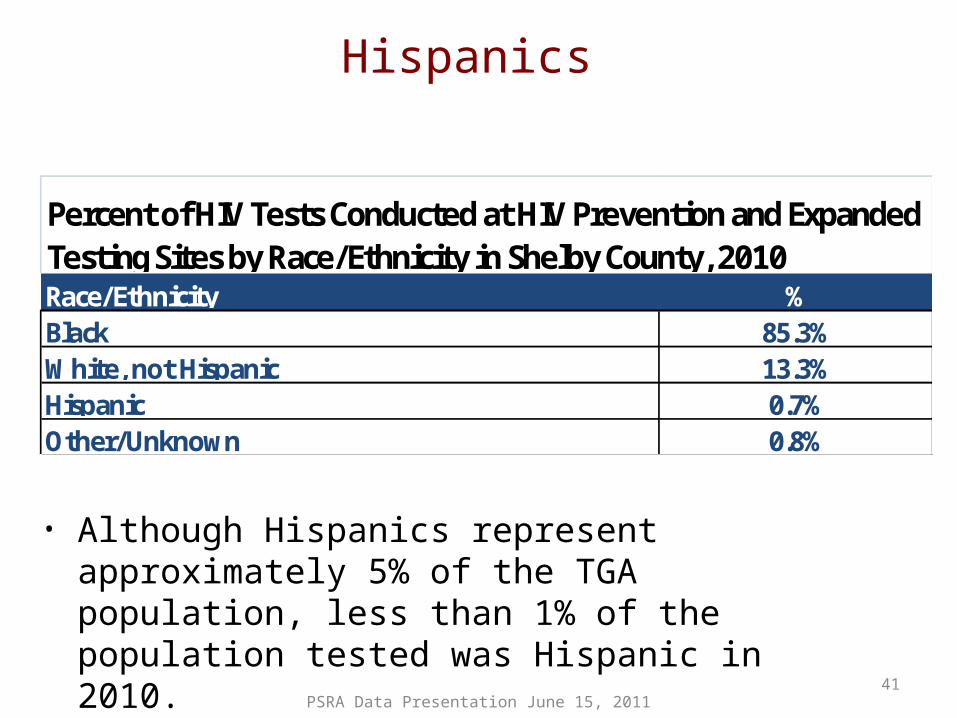
Hispanics
• Although Hispanics represent approximately 5% of the TGA population, less than 1% of the population tested was Hispanic in 2010.
PSRA Data Presentation June 15, 2011
Race/Ethnicity %Black 85.3%White, not Hispanic 13.3%Hispanic 0.7%Other/Unknown 0.8%
Percent of HIV Tests Conducted at HIV Prevention and Expanded Testing Sites by Race/Ethnicity in Shelby County, 2010
41

Incarcerated
PSRA Data Presentation June 15, 201142

Youth
2009 Youth Risk Behavior Surveillance Survey (YRBS) in Memphis City High Schools
• Ever had sexual intercourse: 61.6%• Sexual intercourse with at least one person in the
past 3 months: 44%• No condom use during last time had sexual
intercourse: 27.6%• Drank alcohol or used drugs before last sexual
intercourse: 15.3%• Never taught about HIV/AIDS in school: 20.6% PSRA Data Presentation June 15, 2011
43

YouthHIV and P&S Syphilis rates in Shelby County are highest among youth
aged 20-24.
PSRA Data Presentation June 15, 2011 44

Youth
Chlamydia rates in Shelby County are highest among youth aged 15-19.
PSRA Data Presentation June 15, 201145

Homeless• 2010 Ryan White Data Reports indicate that 9.2% percent of consumers lived in
an institution or were non-permanently housed.
• 22% of respondents to the 2010 Housing Needs Assessment had unstable housing
- approximately 13% of these respondents identified themselves as homeless or lived in a transitional shelter
• 43% of respondents to the 2009 Needs Assessment indicated they needed emergency housing services
PSRA Data Presentation June 15, 2011 46

Summary
• HIV disease incidence decreasing but AIDS incidence increasing; number of deaths due to HIV disease is high - increased need to prevent late stage HIV infection and diagnose new infections as early as possible!
• Black men represent the majority of new infections, but other vulnerable and disadvantaged groups should be considered for prevention efforts.
• Youth report very high STD rates and risky sexual behaviors, but new infections are spread across all age groups.
• STD co-infections remain high; HIV screening efforts should be coupled with STD screening whenever possible.
PSRA Data Presentation June 15, 2011 47

• All 2010 data are preliminary and subject to revision. Use of preliminary data is restricted to planning purposes for the Ryan White Planning Council and may not be released to the general public or media.
• Questions? Need more data? Contact:Kristen Morrell, HIV/STD EpidemiologistShelby County Health [email protected]
Note:
PSRA Data Presentation June 15, 2011 48

1. Centers for Disease Control and Prevention. (2008). AIDS Defining Conditions. Morbidity and Mortality Weekly Report. Retrieved May 1, 2011 from: http://www.cdc.gov/mmwr/preview/mmwrhtml/rr5710a2.htm
2. Centers for Disease Control and Prevention. (2008). Revised Surveillance Case Definitions for HIV Infection Among Adults, Adolescents, and Children Aged <18 Months and for HIV Infection and AIDS Among Children Aged 18 Months to <13 Years --- United States, 2008. Morbidity and Mortality Weekly Report. Retrieved May 1, 2011 from: http://www.cdc.gov/mmwr/preview/mmwrhtml/rr5710a1.htm
3. US Census Bureau. (2009). American Community Survey 2009 1-Year Estimates. Retrieved May 1, 2011 from: http://factfinder.census.gov/servlet/DatasetMainPageServlet?_program=ACS&_submenuId=datasets_2&_lang=en
4. Centers for Disease Control and Prevention. (2009). Diagnoses of HIV Infection and AIDS in the United States and Dependent Areas, 2009. Retrieved May 1, 2011 from: http://www.cdc.gov/hiv/surveillance/resources/reports/2009report/pdf/table1a.pdf
5. Centers for Disease Control and Prevention. (2009). YRBS: Youth Risk Behavior Survey, 2009. Retrieved May 1, 2011 from: http://apps.nccd.cdc.gov/youthonline/App/Results.aspx?LID=TN
References:
PSRA Data Presentation June 15, 2011 49

• HIV/STD Data:
Shelby County Health Department, Epidemiology Section, 814 Jefferson Ave, Memphis TN 38120.
Arkansas Department of Health, HIV/AIDS Registry Section, 4815 W. Markham, Little Rock AR 77205. The HIV/AIDS Registry Section is fully funded by a Cooperative Agreement with the Centers for Disease Control and Prevention (CDC).
Mississippi Department of Health, STD/HIV Office, P.O. Box 1700Jackson, MS 39215.
• National STD Data:
Centers for Disease Control and Prevention. Sexually Transmitted Disease Surveillance, 2009. Atlanta, GA: U.S. Department of Health and Human Services; November 2009.
References:
PSRA Data Presentation June 15, 2011 50
Memphis TGA Unmet Need and Unaware Data
Shelby County Health DepartmentRyan White Part A Memphis TGA Program
PSRA Data Presentation June 15, 2011
Lisa KrullContracts Coordinator
Ryan White Part A Program
51
• What is the level of unmet need among the PLWHA population in the Memphis TGA?
• What is the estimated number of persons unaware of their HIV status in the Memphis TGA?
• What data is used to guide and evaluate the strategy for early identification of individuals with HIV/AIDS (EIIHA) in the Memphis TGA?
Key Questions
PSRA Data Presentation June 15, 2011 52

What is the level of unmet need among the PLWHA population in the Memphis TGA?
Question 1
PSRA Data Presentation June 15, 2011 53

Unmet Need
• How many PLWHA are “out-of-care” or not receiving Primary Medical Care?
“Primary Medical Care” defined according to HRSA guidelines as having one of the following during a calendar year:– CD4+ count or– viral load or – provision of ARVs
PSRA Data Presentation June 15, 2011 54

Unmet Need
Data Sources:• CD4 and viral load tests are reported to the health
department • Lists of persons receiving ADAP, IAP• CD4 and viral load tests in CAREWare• Number of persons submitting pharmacy claims for
ARVs with TennCare
Limitations:• Reporting gap or lag between providers/labs• May not include those who are not Ryan White
eligiblePSRA Data Presentation June 15, 2011 55

Unmet Need
Percentage of PLWHA not receiving Primary Medical Care:
2007: 41%
2008: 42%
2009: 41%
PSRA Data Presentation June 15, 2011 56
Unmet Need
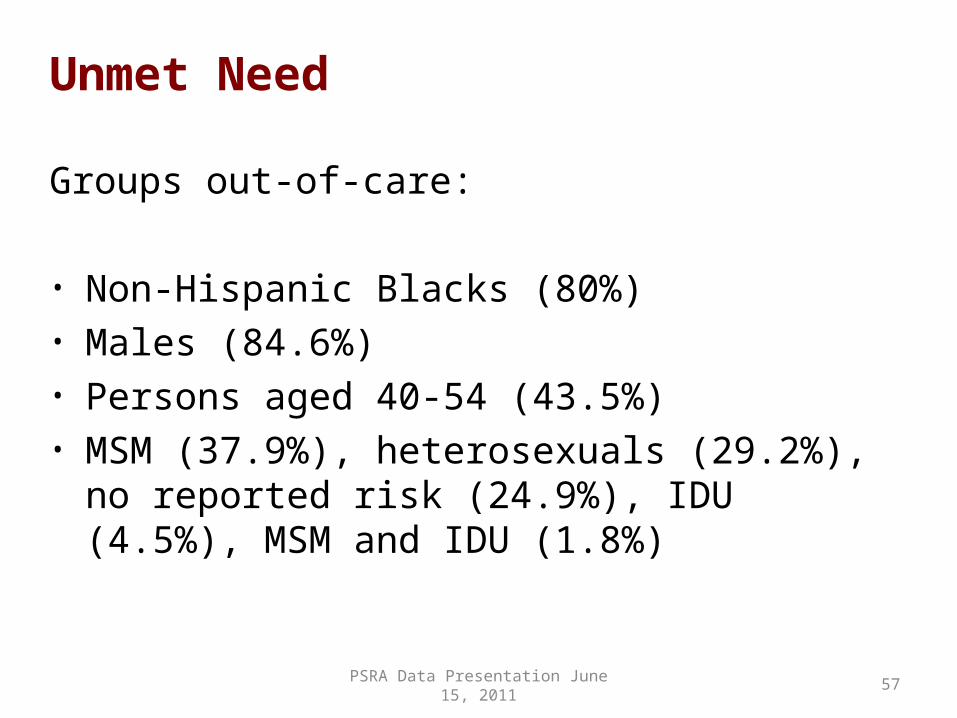
Groups out-of-care:
• Non-Hispanic Blacks (80%)• Males (84.6%)• Persons aged 40-54 (43.5%)• MSM (37.9%), heterosexuals (29.2%), no
reported risk (24.9%), IDU (4.5%), MSM and IDU (1.8%)
PSRA Data Presentation June 15, 2011 57

Unmet Need
PSRA Data Presentation June 15, 2011 58

Unmet Need
PSRA Data Presentation June 15, 2011 59

What is the estimated number of persons unaware of their HIV status in the Memphis TGA?
Question 2
PSRA Data Presentation June 15, 2011 60

• Extended Back Calculation Method uses Memphis TGA prevalence as of 2009
• National proportion of persons not diagnosed=21%
• A total of 1,902 HIV-positive unaware individuals are estimated to be living in the Memphis TGA
Unaware
PSRA Data Presentation June 15, 2011 61

What data is used to guide and evaluate the strategy for early identification of individuals with HIV/AIDS (EIIHA) in the Memphis TGA?
Question 3
PSRA Data Presentation June 15, 2011 62

EIIHA StrategyObjectives:
1) To promote awareness about the importance of early detection and treatment for HIV.
2) To promote awareness about available HIV testing services.
3) To increase access to and utilization of existing HIV testing services.
4) To expand the availability of HIV testing services to underserved geographic areas and demographic sub-populations.
PSRA Data Presentation June 15, 2011 63

EIIHA Strategy
Availability of HIV Testing Services:
• 32 sites offer free or affordable ( less than $25) testing in the Memphis TGA
• The majority of sites (17) are located in Shelby County
• Sites range from health departments (12), community health centers (9), CBO (7), hospitals (3), and church (1).
PSRA Data Presentation June 15, 2011 64
EIIHA Strategy
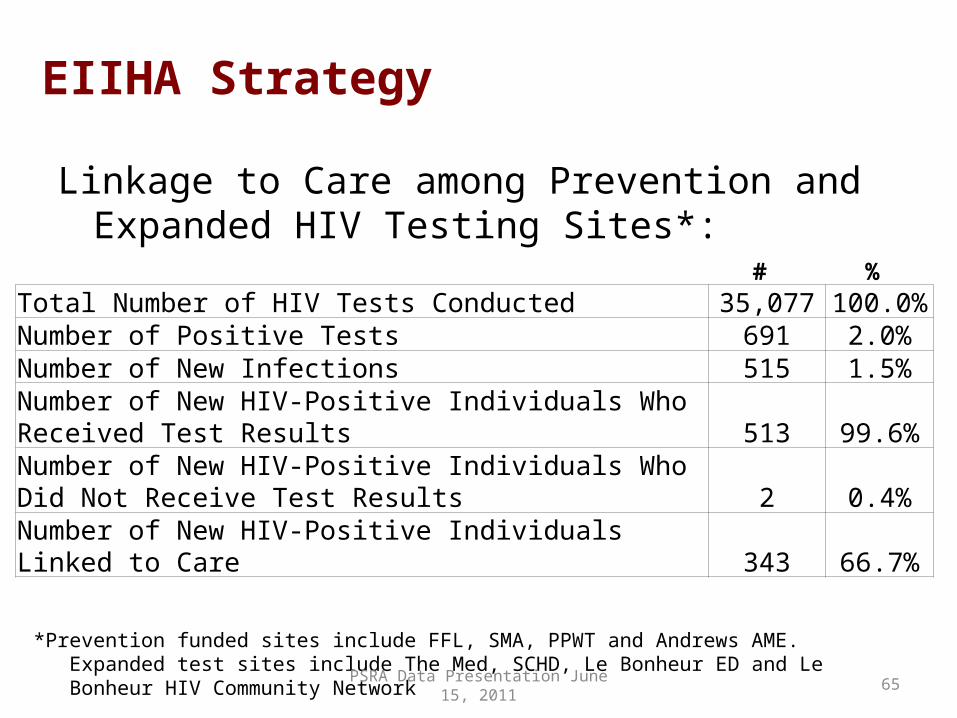
Linkage to Care among Prevention and Expanded HIV Testing Sites*:
# % Total Number of HIV Tests Conducted 35,077 100.0%Number of Positive Tests 691 2.0%Number of New Infections 515 1.5%Number of New HIV-Positive Individuals Who Received Test Results 513 99.6%Number of New HIV-Positive Individuals Who Did Not Receive Test Results 2 0.4%Number of New HIV-Positive Individuals Linked to Care 343 66.7%
*Prevention funded sites include FFL, SMA, PPWT and Andrews AME. Expanded test sites include The Med, SCHD, Le Bonheur ED and Le Bonheur HIV Community Network
PSRA Data Presentation June 15, 2011 65

EIIHA Strategy• Data from HIV Test Sites indicates 66% of new cases
are being linked to care.
• Unmet need has remained high for the past three years – this may indicate a major issue with retention in care.
• Unmet need is highest among black males, adults aged 40-54 and in Shelby, Crittenden, and DeSoto counties.
• Affordable testing services are available in a variety of locations/sites throughout Shelby Co., but these are limited in other counties.
PSRA Data Presentation June 15, 2011 66

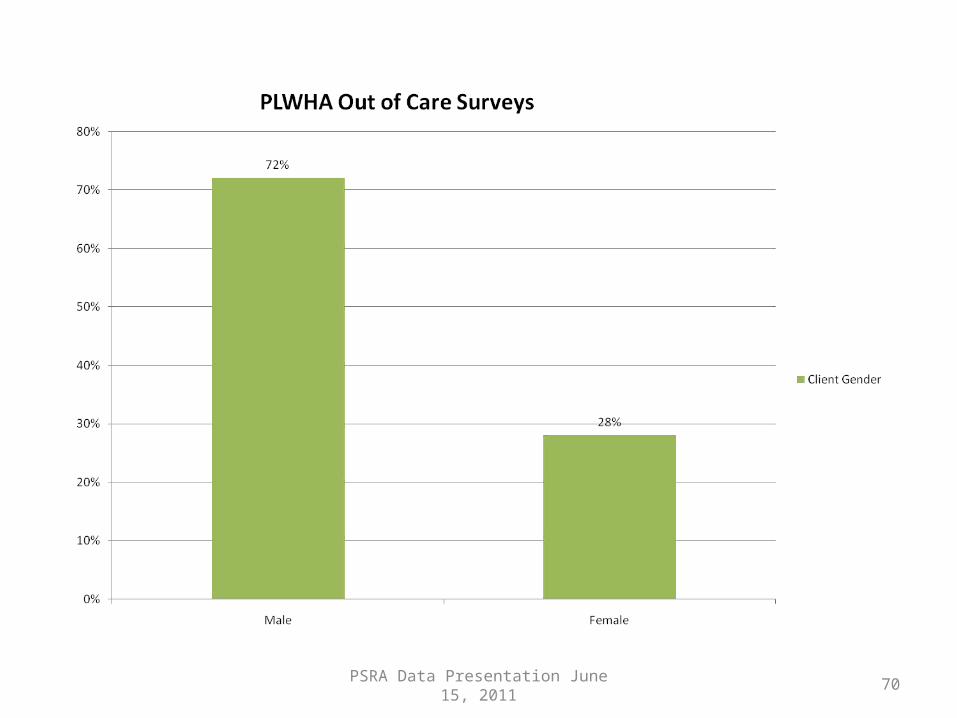
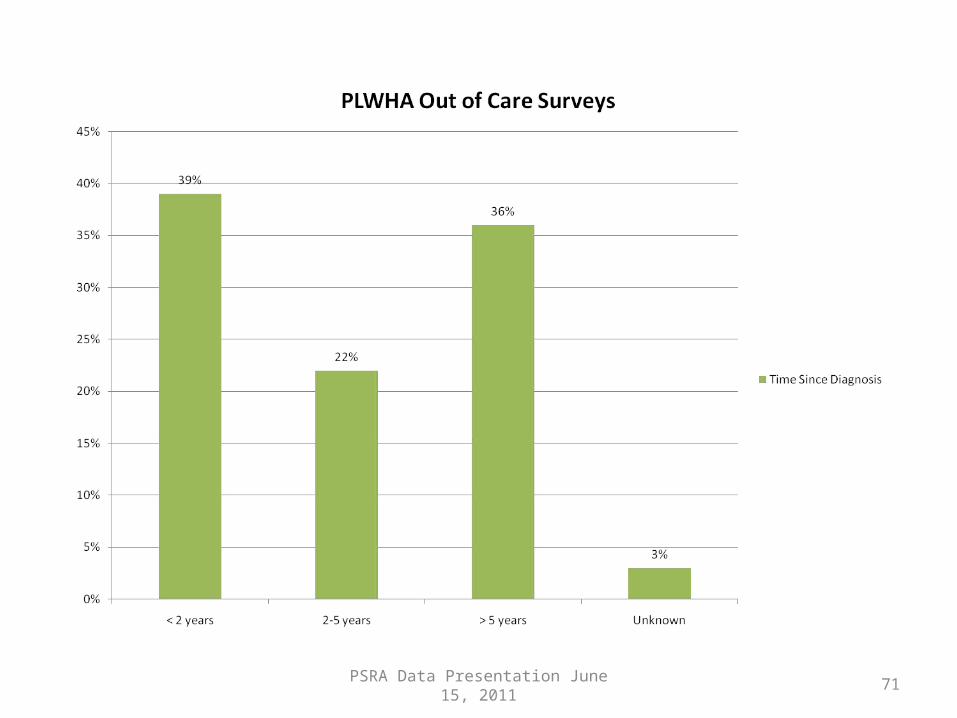
Early Intervention ServicesOut-of-Care Surveys
Lisa KrullContracts Coordinator
Ryan White Part A Program
PSRA Data Presentation June 15, 2011 67
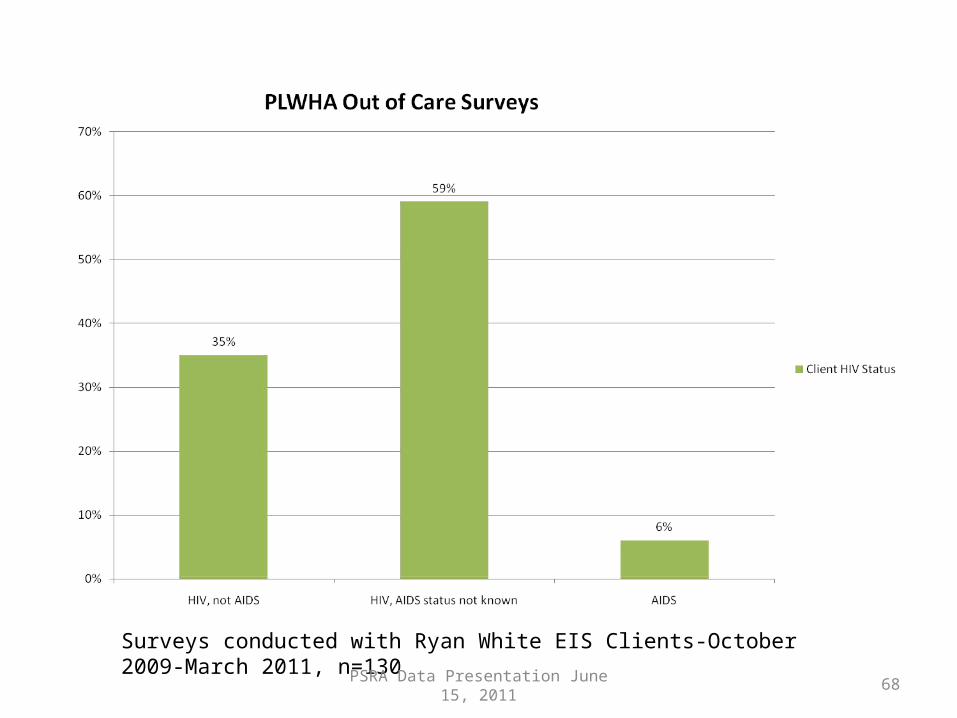
Surveys conducted with Ryan White EIS Clients-October 2009-March 2011, n=130
PSRA Data Presentation June 15, 2011 68

PSRA Data Presentation June 15, 2011 69
PSRA Data Presentation June 15, 2011 70
PSRA Data Presentation June 15, 2011 71

PSRA Data Presentation June 15, 2011 72

PSRA Data Presentation June 15, 2011 73

Transportation Needs Assessment
Special Study Revisited
Lisa KrullContracts Coordinator
Ryan White Part A Program
PSRA Data Presentation June 15, 2011 74
Transportation Study Review
• Report indicates that additional transportation services are needed, especially in rural areas
• Transportation services provided through Medicaid programs are not always reliable, and consumers express concern about confidentiality
• Report recommends making different forms of transportation services available (bus passes, gas cards, cab vouchers, client transport by provider)
• Report recommends paying for parking fees
PSRA Data Presentation June 15, 2011 75
Transportation Study Review
• September 2010- Planning Council approves reallocation of additional $50,000 to medical transportation services
• Grantee’s office revises guidance for medical transportation service providers to include all forms of transportation and increases awards
• Grantee request to HRSA project officer to use transportation funds for parking fees is denied
PSRA Data Presentation June 15, 2011 76

Ryan White DataReport Summary and Quality
Management Report
Tiffany FordQuality Management Coordinator
Ryan White Part A Program
PSRA Data Presentation June 15, 2011 77
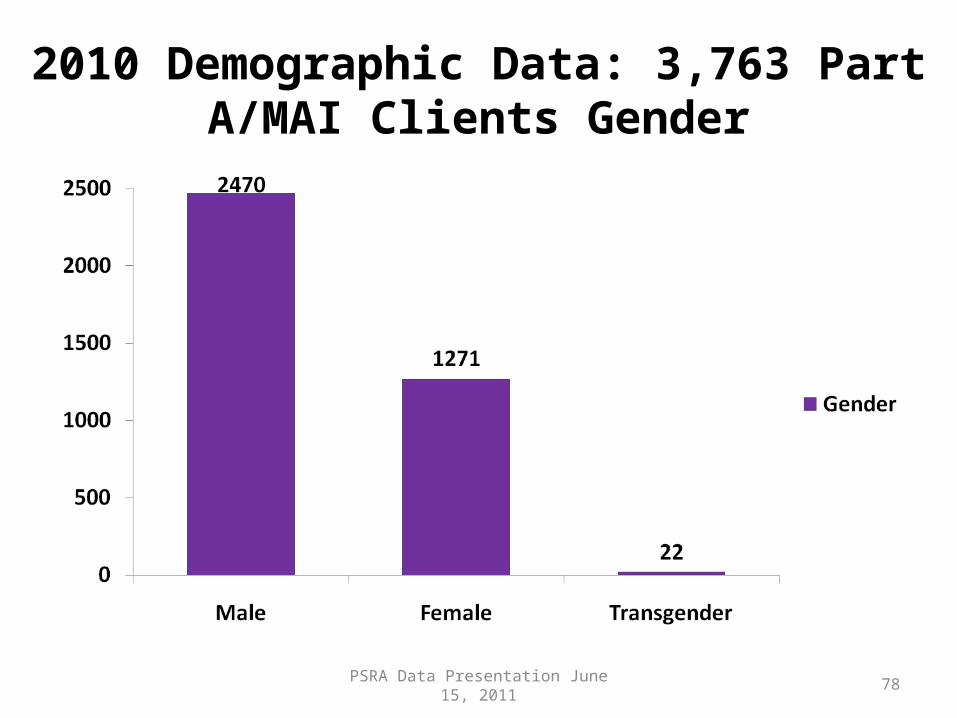
2010 Demographic Data: 3,763 Part A/MAI Clients Gender
PSRA Data Presentation June 15, 2011 78

2010 Demographic Data: 3,763 Part A/MAI ClientsAge
PSRA Data Presentation June 15, 2011 79

2010 Demographic Data: 3,763 Part A/MAI ClientsRace
PSRA Data Presentation June 15, 2011 80

2010 Demographic Data: 3,763 Part A/MAI ClientsEthnicity
PSRA Data Presentation June 15, 2011 81
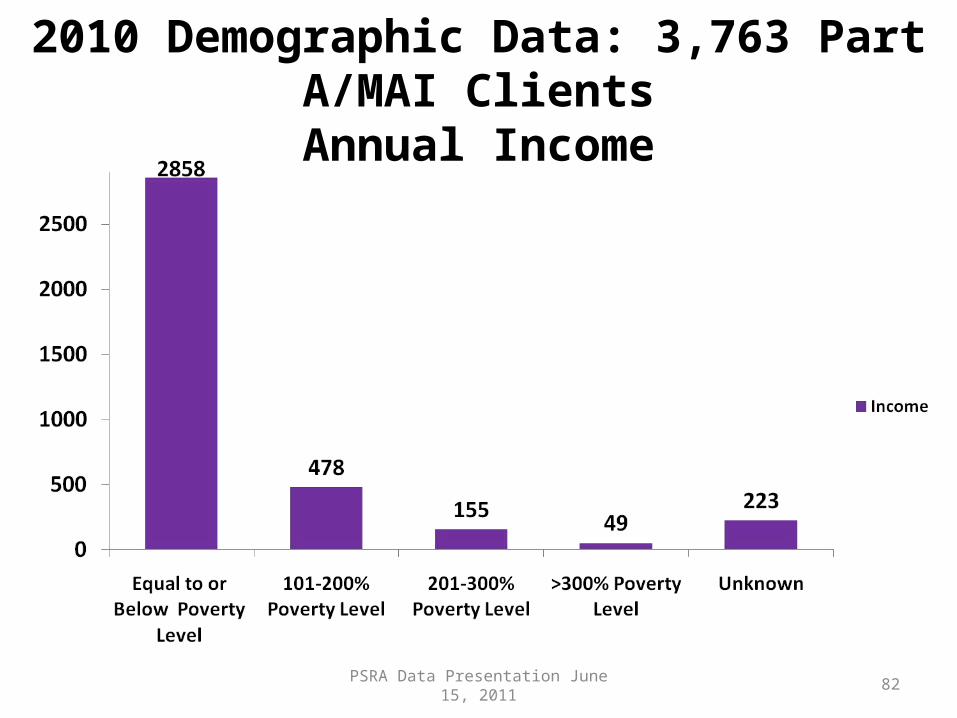
2010 Demographic Data: 3,763 Part A/MAI ClientsAnnual Income
PSRA Data Presentation June 15, 2011 82

2010 Demographic Data: 3,763 Part A/MAI ClientsHousing
PSRA Data Presentation June 15, 2011 83
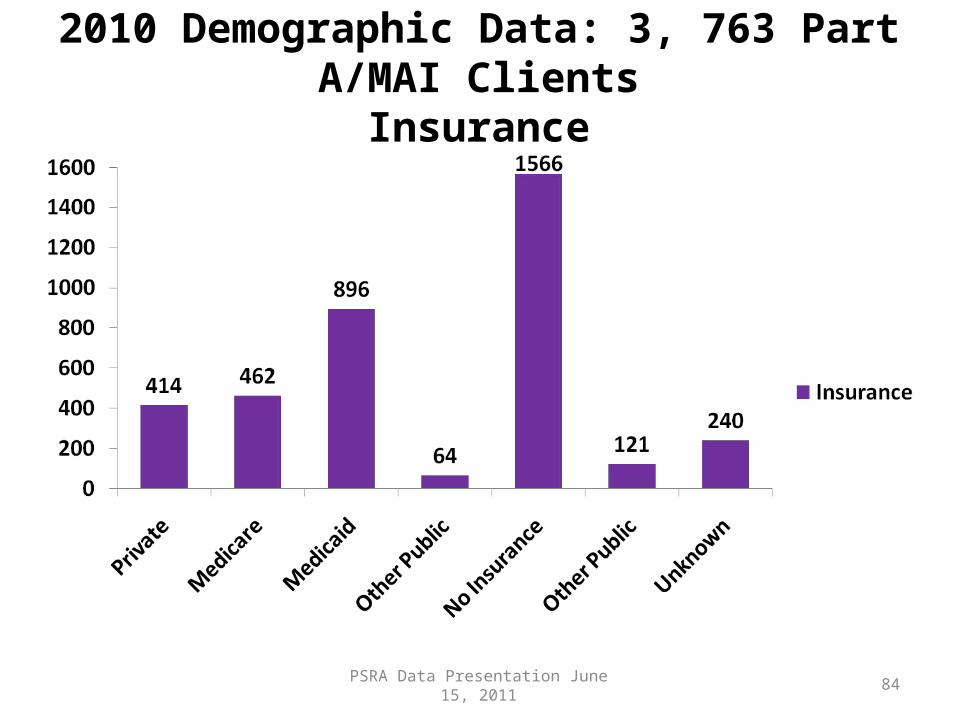
2010 Demographic Data: 3, 763 Part A/MAI ClientsInsurance
PSRA Data Presentation June 15, 2011 84

2010 Demographic Data: 3,763 Part A/MAI ClientsHIV Status
PSRA Data Presentation June 15, 2011 85

2010 Demographic Data: Part A/MAI Clients# Core Services Provided
PSRA Data Presentation June 15, 2011 86
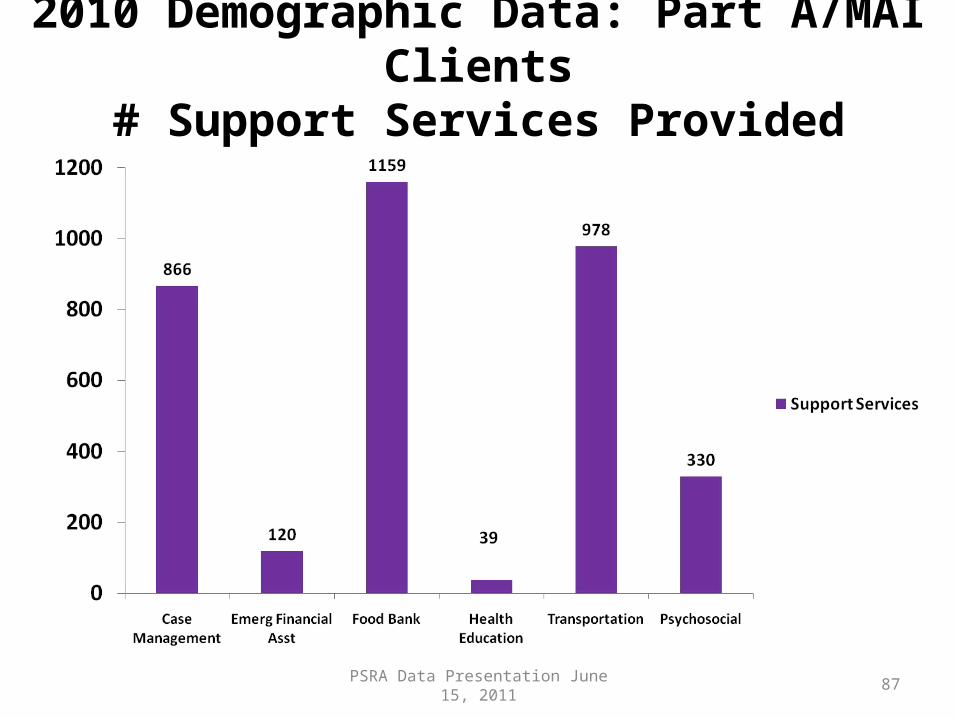
2010 Demographic Data: Part A/MAI Clients# Support Services Provided
PSRA Data Presentation June 15, 2011 87
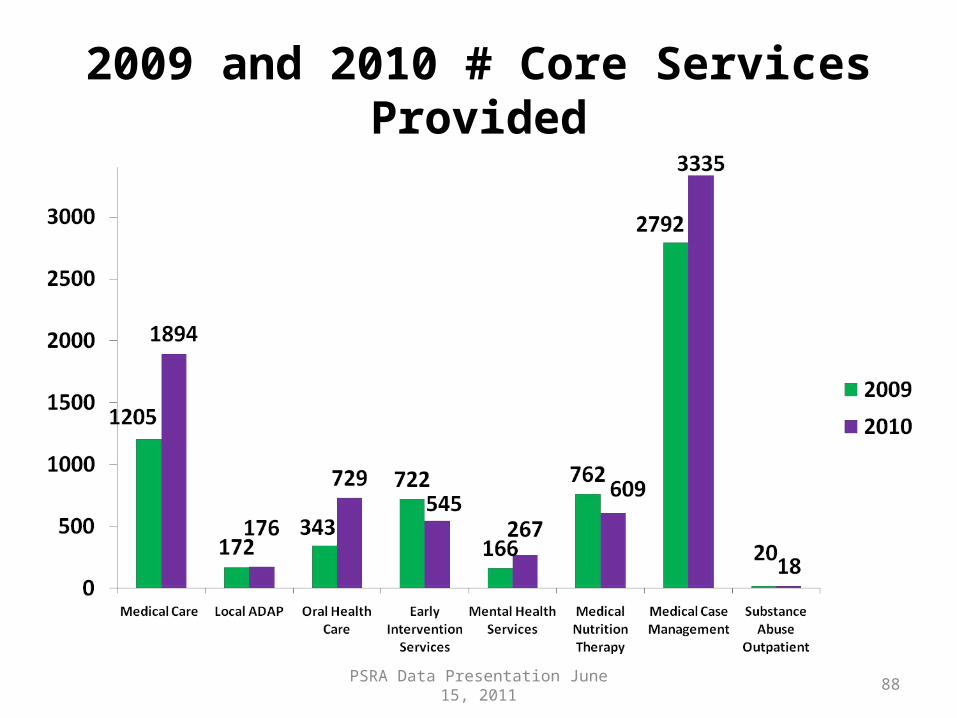
2009 and 2010 # Core Services Provided
PSRA Data Presentation June 15, 2011 88
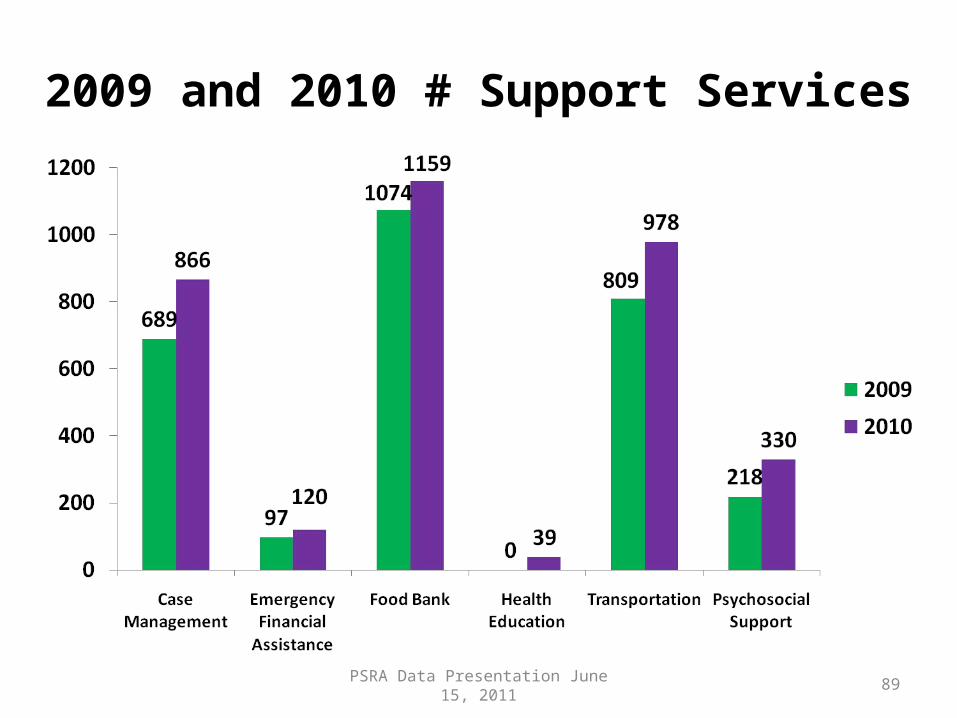
2009 and 2010 # Support Services
PSRA Data Presentation June 15, 2011 89
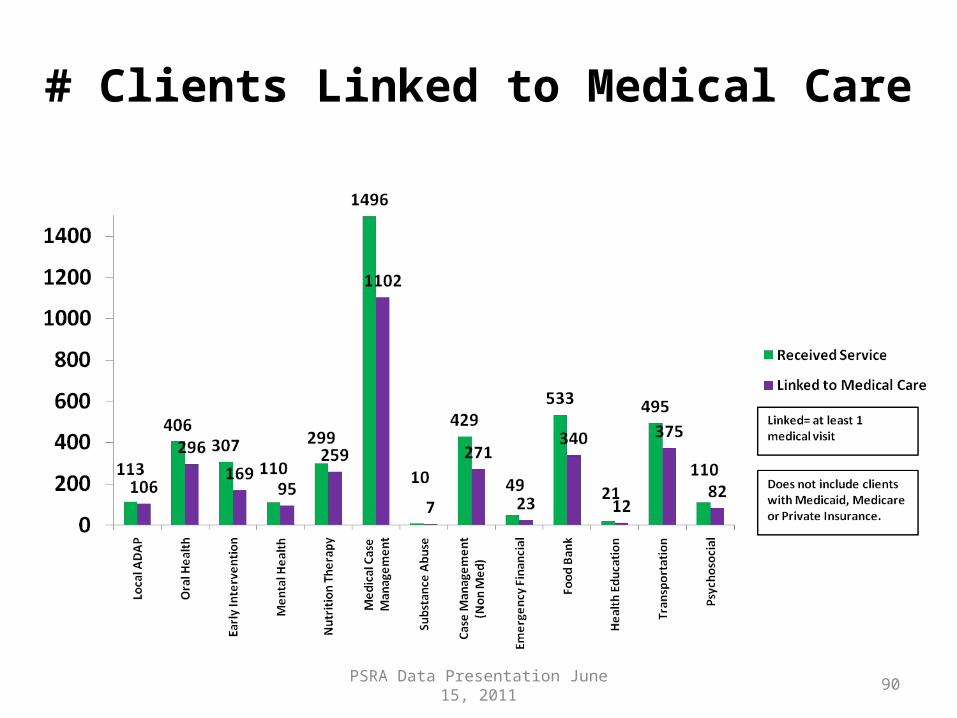
# Clients Linked to Medical Care
PSRA Data Presentation June 15, 2011 90

# Clients Retained in Medical Care
PSRA Data Presentation June 15, 2011 91

% of Clients Linked to Care and Retained in Care
Does not include clients with Medicaid, Medicare or Private Insurance.
PSRA Data Presentation June 15, 2011 92

2010 QM Data: Medical Providers
PSRA Data Presentation June 15, 2011 93
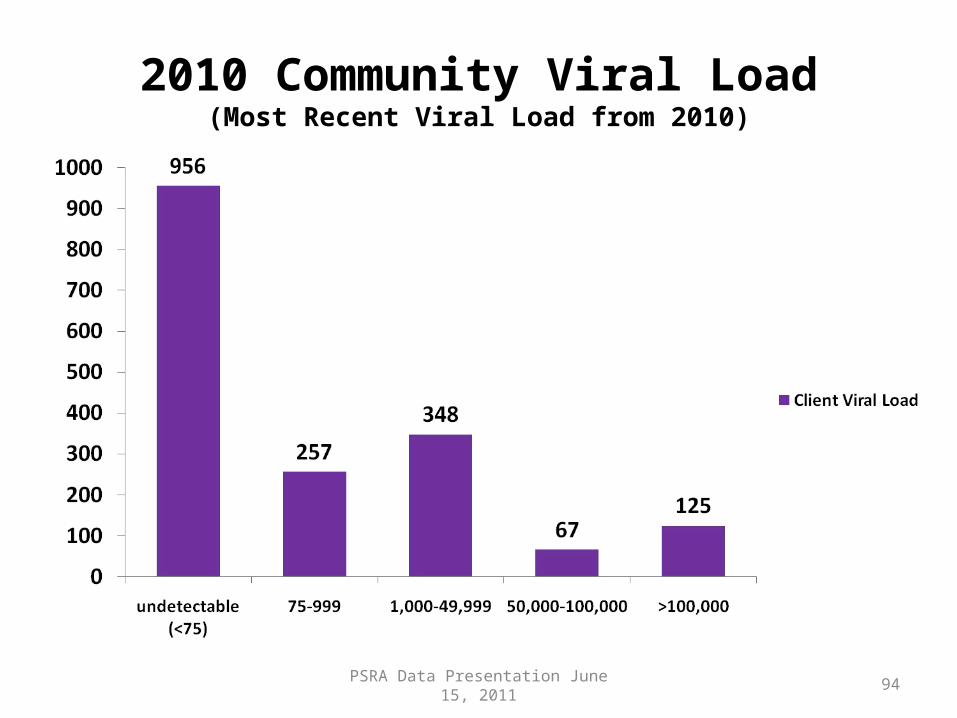
2010 Community Viral Load(Most Recent Viral Load from 2010)
PSRA Data Presentation June 15, 2011 94

Break
Please Return in 10 minutes
PSRA Data Presentation June 15, 2011 95

Housing Needs Assessment Study
Nycole AlstonData Analyst
Ryan White Part A Program
PSRA Data Presentation June 15, 2011 96
Ryan White Part A Needs Assessment
• As of Fall 2009, a Comprehensive Needs Assessment occur every three years instead of every year (Next Assessment 2012)
• Special studies held in between years to investigate service needs/subpopulations to increase planning efforts and improve access to care and treatment
PSRA Data Presentation June 15, 2011 97

Objectives of the Housing Needs Assessment
Consumer Survey:• Assess current living situation, housing history and housing services received among PLWHA• Assess perceptions around barriers in accessing and maintaining housing among PLWHA• Examine the predictors of unstable housing among PLWHA Provider Survey:• Determine the types of housing services offered to clients by providers• Assess administrators’ perceptions around barriers to provide or refer clients to housing
services• Assess providers’ perceptions around client needs for specific housing services and the
barriers faced in accessing housing services• Document administrators’ and providers’ suggestions to reduce barriers in accessing housing
services
PSRA Data Presentation June 15, 2011 98

Methodology• Face-to-face interviews with consumers (n=340)• Online self-administered surveys with Ryan-White
and non-Ryan White service providers (n=18)– 14 Ryan White providers– 4 Non Ryan-White providers– Providers: Case Managers, Social Workers, EIS, PALS, etc.
• Online self-administered surveys with Administrators (n=15)– Program Administrators, Managers, Coordinators,
Executives and DirectorsPSRA Data Presentation June 15, 2011 99

Summary of Key Findings:Housing Situation
PSRA Data Presentation June 15, 2011
• (41%) make rent/housing payments of less than $100 per month, while 34% of respondents make rent/housing payments of $300-$600
• More than 50% had monthly utility payments of less than $100 while 23% of respondents made utility payments between $100-$200
• 39% had rent an apartment, house or other type of housing unit followed by 37% that live/crash/stay with friends or relatives
• Average household size was 2.7 person • 84% received some type of assistance with rent or housing
– 11% reported receiving assistance from federal funding sources
• Barriers affecting consumer’s ability to access or maintain housing:– Low or no income and bad credit were the most common
• 68% has never been on a waiting list and 29% between one and three times in the last 12 months
100

Summary of Key Findings: Housing Status• Stable housing:
Owning a home; or Moving two or less times in the past 12 months
• Unstable housing: Homeless; or Currently living in a shelter, drug or alcohol
treatment center, halfway house, housing authority building, HIV/AIDS housing facility or building, hotel or motel or in a hospital; or
Having moved three or more times in the past 12 months
• Characteristics of Unstable Housing• Physical disability• Diagnosis of a mental health problem• Income ($0-$300 vs. $900+)• Criminal activity made it difficult to maintain housing• On a housing waitlist in the past 12 months
PSRA Data Presentation June 15, 2011 101
Summary of Key Findings:Provider and Administrator Perceptions
• Barriers affecting consumer’s ability to access or maintain housing:
– Low or no income and bad credit were the most common
• Housing service needs for clients:– Emergency/short-term financial assistance for rent and utilities– Long-term rental/mortgage assistance to keep people in their own home
• Service Needs for Clients to Maintain Housing:– Alcohol/drug treatment/counseling– Conflict resolution assistance
PSRA Data Presentation June 15, 2011 102

Priorities and Recommendations
1. Utilize Ryan White housing funding to support transitional housing services for PLWHA, while working with other housing programs to assist clients in obtaining assistance with permanent housing;
2. Ensure that Ryan White service providers are informed about all available housing services, eligibility criteria and application processes;
3. Develop strategies to advertise housing services available for PLWHA to ensure individuals are aware of housing opportunities; and
4. Develop more linkages with other housing programs and service providers.
PSRA Data Presentation June 15, 2011 103
Non-Ryan White and Other Funding Sources
Part BPart CPart DPart F
HOPWACDC
WIC/CSFPSubstance Abuse Prevention and Treatment
Medicare/Medicaid/VAMid-South AIDS Fund
Nycole AlstonData Analyst
Ryan White Part A Program
PSRA Data Presentation June 15, 2011 104

Overview of Ryan White Part B• Part B funding is distributed to States for specific
programs• State Programs offered in Tennessee:
– Dental Care– ADAP
• Insurance Assistance Program (IAP)• HIV Drug Assistance Program (HDAP)
– Fee for Service Medical Care
• Eligibility criteria are the same as for Part A• Part B funds ADAP in Memphis TGA
PSRA Data Presentation June 15, 2011 105

Distribution of Part B Funds• States may provide services directly, contract directly
with agencies, or work through subcontracts with Part B HIV Care Consortia
• Tennessee funds five regional (Southwest, West, Middle,
East, Southeast) Consortia with Lead Agencies who contract with agencies to provide services
PSRA Data Presentation June 15, 2011 106
PSRA Data Presentation June 15, 2011
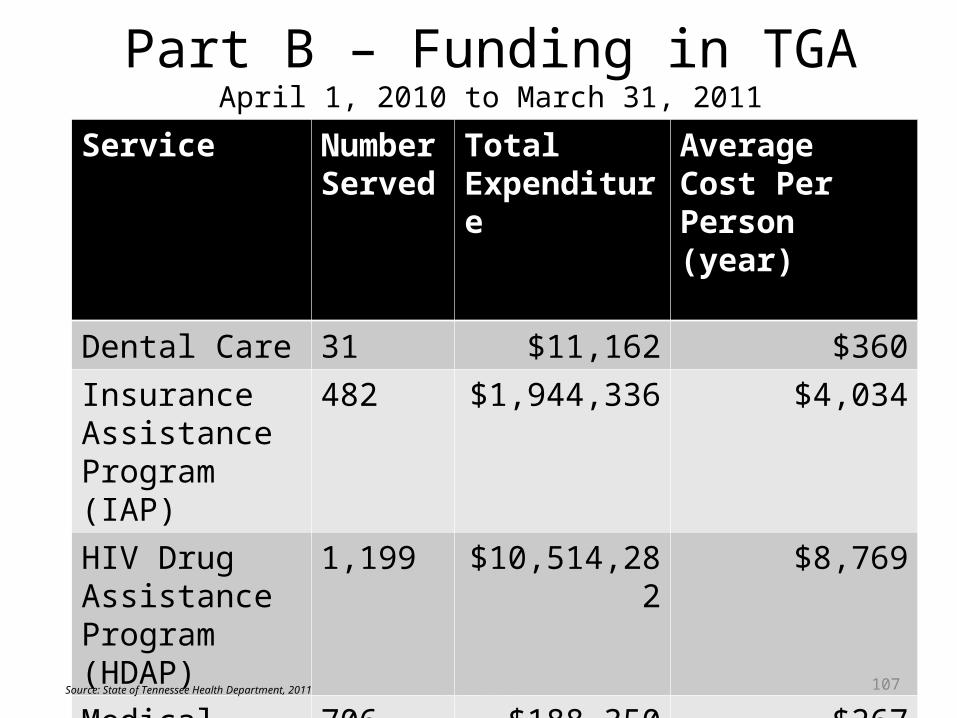
Part B – Funding in TGAApril 1, 2010 to March 31, 2011
Service Number Served
Total Expenditure
Average Cost Per Person (year)
Dental Care 31 $11,162 $360Insurance Assistance Program (IAP)
482 $1,944,336 $4,034
HIV Drug Assistance Program (HDAP)
1,199 $10,514,282 $8,769
Medical Case Management
706 $188,350 $267
Total 2,418 $12,469,780 $5,157Source: State of Tennessee Health Department, 2011 107

TN HIV Drug Assistance Program (HDAP)
PSRA Data Presentation June 15, 2011
April 1, 2010 to March 31, 2011
Number Served
HDAP Expenditure by County
Average Cost Per Person (year)
Shelby 1,171 $10,214,566 $8,723Tipton 18 $157,004 $8,722Fayette 10 $142,712 $14,271TN 1,199 $10,514,282 $8,769Source: State of Tennessee Health Department, 2011
108
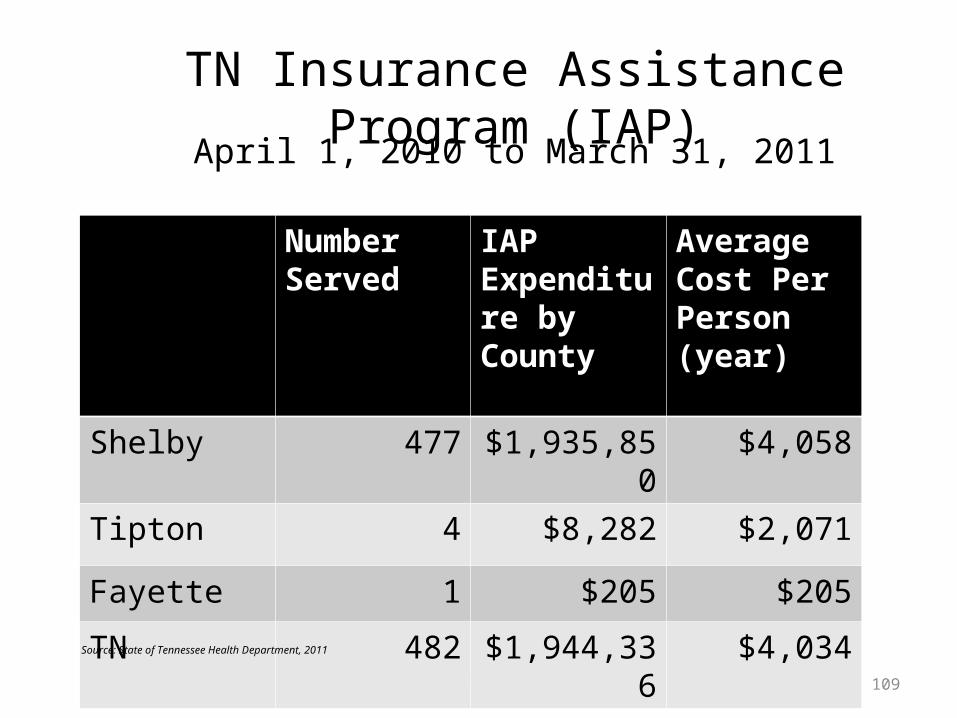
TN Insurance Assistance Program (IAP)
PSRA Data Presentation June 15, 2011
April 1, 2010 to March 31, 2011
Number Served
IAP Expenditure by County
Average Cost Per Person (year)
Shelby 477 $1,935,850 $4,058
Tipton 4 $8,282 $2,071
Fayette 1 $205 $205
TN 482 $1,944,336 $4,034
Source: State of Tennessee Health Department, 2011
109

Arkansas and Mississippi ADAPFor Grant Year 2010-2011
County PLWHA reported on ADAP
PLWHA as of 13/31/2010
ADAP Expenditure by County
Average Cost Per Person (year)
Crittenden 32 228 $244,148 $7,630Desoto 27 283 $187,794 $6,955Tunica 3 86 $40,741 $16,580Marshall 9 59 $41,767 $4,641Tate 1 27 $8,160 $8,160TOTAL 72 683 $522,610
PSRA Data Presentation June 15, 2011
Source: State of Arkansas Department of Health , 2011 and Mississippi State Department of Health , 2011.
110

Overview of Ryan White Part C• Part C funds comprehensive primary health care in
an outpatient setting for PLWHA
• Through a competitive application process, grants are made directly to agencies that provide medical care to PLWHA
• In the Memphis area, East AR Family Health Clinic and Adult Special Care Clinic at The Med currently receive Part C funds
PSRA Data Presentation June 15, 2011 111
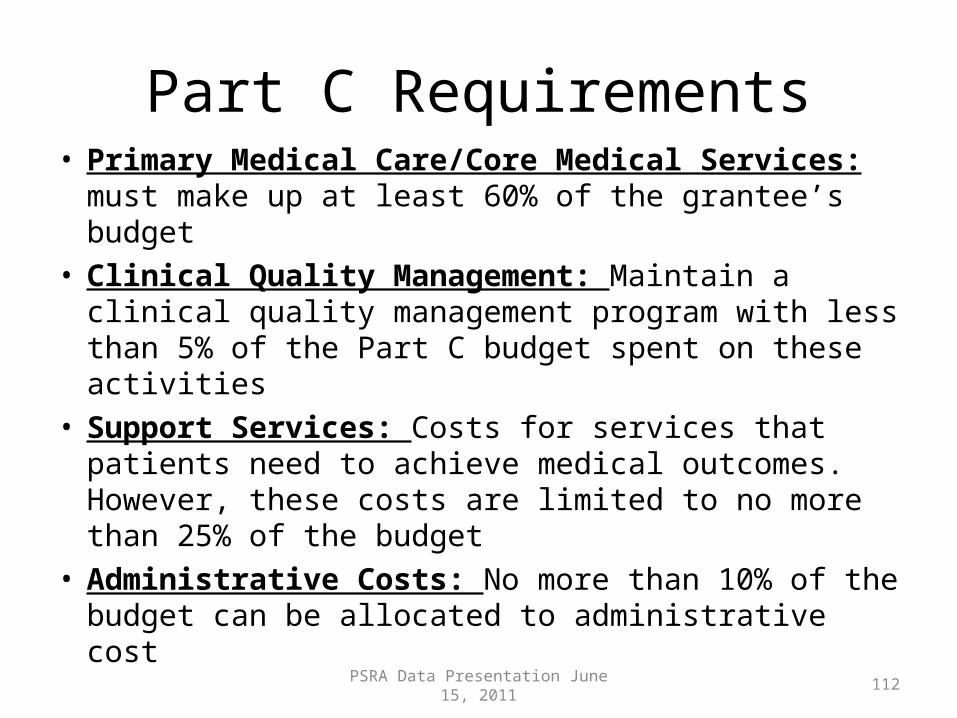
Part C Requirements• Primary Medical Care/Core Medical Services: must
make up at least 60% of the grantee’s budget• Clinical Quality Management: Maintain a clinical
quality management program with less than 5% of the Part C budget spent on these activities
• Support Services: Costs for services that patients need to achieve medical outcomes. However, these costs are limited to no more than 25% of the budget
• Administrative Costs: No more than 10% of the budget can be allocated to administrative cost
PSRA Data Presentation June 15, 2011 112
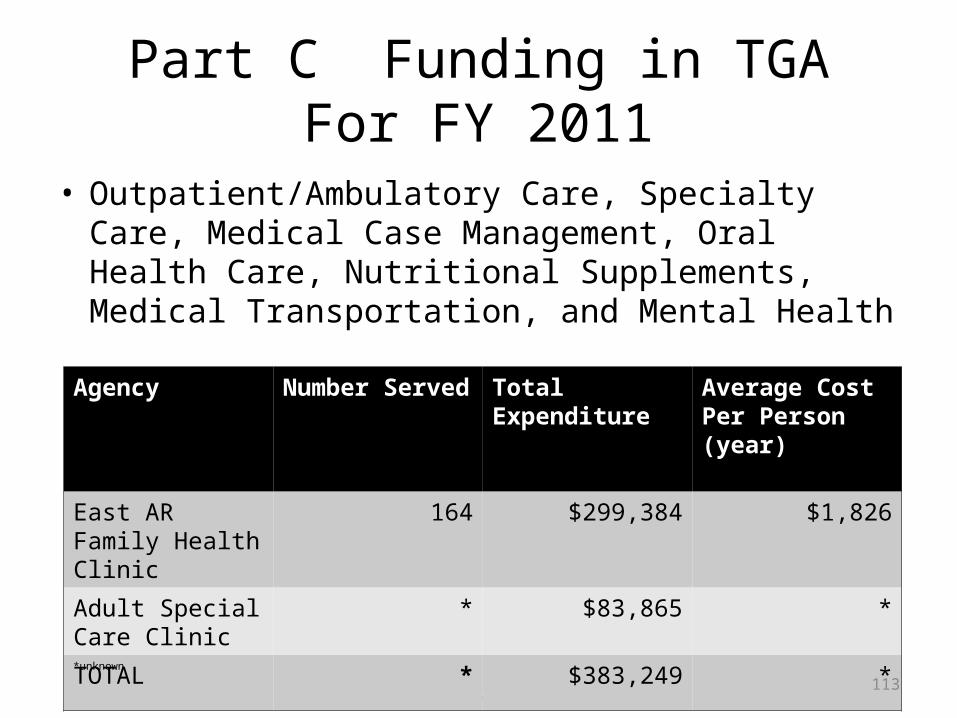
Part C Funding in TGAFor FY 2011
• Outpatient/Ambulatory Care, Specialty Care, Medical Case Management, Oral Health Care, Nutritional Supplements, Medical Transportation, and Mental Health
PSRA Data Presentation June 15, 2011
Agency Number Served Total Expenditure Average Cost Per Person (year)
East AR Family Health Clinic
164 $299,384 $1,826
Adult Special Care Clinic
* $83,865 *
TOTAL * $383,249 *
*unknown
113

Overview of Ryan White Part D• Part D funding is for women, children, infants and
youth• Part D funds are provided through networks in
regional areas• Community HIV Network serves:
– 3 counties in Tennessee (Shelby, Fayette, and Tipton)– 1 county in Mississippi (DeSoto)– 1 county in Arkansas (Crittenden)
• Any eligible consumer can receive services in those counties, even if they are from another county
PSRA Data Presentation June 15, 2011 114

Part D Programs
Memphis HIV Family Care Program (FCP)Partners:– Adult Special Care Center-Medical Care and Medical Case Management– Hope House-Psychosocial Support Services, Social Work– Planned Parenthood-HIV Testing and Education– St. Jude-Medical Care and Social Work– UTMG-Obstetrical Care (Social Work and Consumer Advocacy Services provided by
the Family Care Program Staff)– LeBonheur Infectious Disease Clinic (Medical Care provided by St. Jude staff; Social
Work and Consumer Advocacy Services provided by the Family Care Program Staff)
• Memphis Adolescent/Young Adult HIV Program (MAYAH)• Shelby County Health Department• Planned Parenthood
PSRA Data Presentation June 15, 2011 115

PSRA Data Presentation June 15, 2011
Part D Funding in TGAFor FY 2011
Program Number Served
Total Expenditure
Average Cost Per Person (year)
Family Care Program
182 $1,081,041 $5,940
Youth Program (MAYAH)
350 $516,943 $1,477
Total 532 $1,597,984 $3,004
116

Overview of Ryan White Part F• Special Projects of National Significance (SPNS)
– Funds innovative models of care and supports the development of effective delivery systems for HIV care
• AIDS Education and Training Centers (AETC)– Funds support education and training of health care
providers through a network of 11 regional and 4 national centers
• Dental Programs– Dental Reimbursement Program– Community-based Dental Partnership Program– No Part F dental funds in Memphis TGA
PSRA Data Presentation June 15, 2011 117

Availability of Other Public Funding Sources
• Housing Opportunities for People with AIDS (HOPWA)
• Centers for Disease Control and Prevention• Services for Women and Children• Substance Abuse Prevention and Treatment• Medicaid/Medicare• Veterans Administration• Mid South AIDS Fund
PSRA Data Presentation June 15, 2011 118

Housing Opportunities forPeople with AIDS (HOPWA)
Serve clients in Shelby, Tipton, Fayette, Tate, Tunica, Marshall, Desoto and Crittenden Counties
Budget for FY 2011: $1,810,416 for housing and
housing related programs• 66% was budgeted for housing costs (including
operating costs of housing, TBRA, STRMU and permanent housing placement)
• 28% was budgeted for supportive services required in the delivery of the housing services
• 6% was budgeted for administrative costs.
PSRA Data Presentation June 15, 2011
Source: City of Memphis, Division of Housing and Community Development Department, 2011
119

HOPWA Funding FY2010*Agencies Total
Number ServedServices Provided to Clients
Total Expenditures
•Friends For Life•Hope House•Case Management, Inc. House •Family Services of the Mid-South •Urban Family Ministries •Meritan
725 Tenant-Based Rental Assistance (TBRA)
Permanent Housing Facility – Operating
Short-term Rent, Mortgage & Utility Assistance (STRMU)
Permanent housing placement
Support Services Housing
information
$2,385,365
PSRA Data Presentation June 15, 2011
•Cover the program year 2010, which covers 7/1/09-6/30/2010. Source: City of Memphis, Division of Housing and Community Development ,2011
120

HOPWA Funding FY2010Agency Number
ServedServices Provided to Clients
Total Expenditures
Average Cost Per Person (year)
Friends for Life 470 households Tenant-Based Rental Assistance (TBRA)
Permanent Housing Facility – Operating
Short-term Rent, Mortgage & Utility Assistance (STRMU)
Permanent housing placement i.e. first month’s rent, rent/utility deposits
Support Services i.e. case management, etc.
$1,393,765 $2,965
PSRA Data Presentation June 15, 2011
Source: City of Memphis, Division of Housing and Community Development 2011
121

HOPWA Funding FY2010Agency Number
ServedServices Provided to Clients
Total Expenditures
Average Cost Per Person (year)
Hope House 10 households Tenant-Based Rental Assistance
Support Services i.e. case management , outreach
$202,012 $20,201
Case Management, Inc. House Peabody House
116 households Short-term Housing Facility
Support Services i.e. mental health/A & D sessions
Housing information i.e flyers, pamphlets
$306,992 $2,646
PSRA Data Presentation June 15, 2011
Source: City of Memphis, Division of Housing and Community Development , 2011
122

HOPWA Funding FY2010Agency Number
ServedServices Provided to Clients
Total Expenditures
Average Cost Per Person (year)
Family Services of the Mid-South
85 households Short-term Rent, Mortgage & Utility Assistance (STRMU)
Support Services i.e. case management
Permanent housing placement i.e. first month’s rent, rent/utility deposits
$226,709 $2,667
Urban Family Ministries
9 households Tenant-Based Rental Assistance
Supportive Services i.e. case management, transportation
$159,828 $17,759
Meritan 35 households Homemaker Services
Support services i.e. case management
$96,059$2,745
PSRA Data Presentation June 15, 2011Source: City of Memphis, Division of Housing and Community Development, 2011 123
Centers for Disease Controland Prevention (CDC)
• Provides funds to States for HIV Prevention and testing programs
• States distribute the funds to local programs via the Tennessee Department of Health (TDOH) or via Consortia
PSRA Data Presentation June 15, 2011 124

Tennessee Dept. of Health Projects (CDC)
Expenditures for Calendar Year 2010• Prevention and Expanded Testing Initiative: 33,580
– Shelby (32,395), Fayette (418) and Tipton (767 tests)
• 14 Testing Sites
• HIV Prevention Activities and Outreach Programs– 9 Agencies/Programs– 15,795 people – Total amount funded for $417,000
• TOTAL SPENT ON HIV TESTING - $1,066,600
PSRA Data Presentation June 15, 2011
Source: State of Tennessee Health Department, 2011
125

Arkansas Dept. of Health Projects (CDC)
Funding for CY 2011• Currently funds 6 Community Based organizations
for HIV prevention and testing• Total amount funded to Community Based
organizations: $329,409• Crittenden County was not covered in the scope of
work for any funded grantees• However, the grantees are not limited to serving only
clients that reside in their scope of work • Testing is available at Crittenden County Health
Department and Arkansas Delta AIDS Care
PSRA Data Presentation June 15, 2011
Source: State of Arkansas Department of Health , 2011.
126

Mississippi Dept. of Health Projects (CDC)Funding for CY 2011
• Funding for HIV Prevention and Expanded Testing Initiatives:CDC Cooperative Agreement for Prevention: $2,023,284CDC Expanded Testing Initiative: $821,152 40 sites in MS
• HIV Prevention Activities and Outreach Programs 7 Agencies/Programs in MS
• Testing sites in Desoto, Marshall, Tate and Tunica: Desoto County Health Department, Marshall County Health Department,
Byhalia Health Center, Mount Pleasant Family Health Clinic, Tate County Health Department, Tunica County Health Department and Aaron E. Henry Health Services Center
PSRA Data Presentation June 15, 2011
Source: Mississippi State Department of Health , 2011.
127
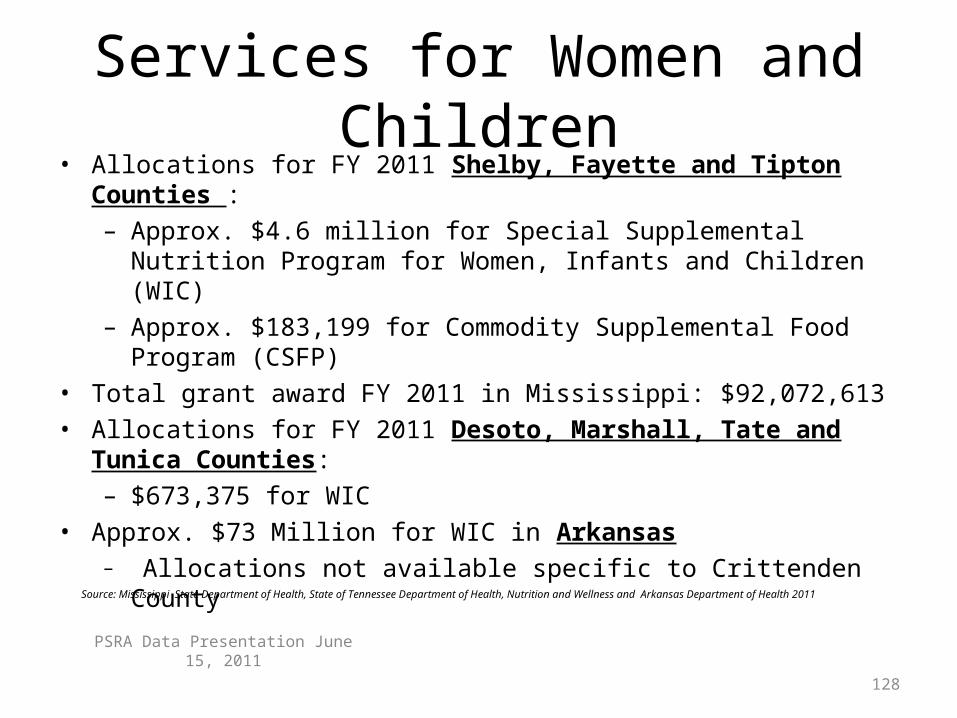
Services for Women and Children• Allocations for FY 2011 Shelby, Fayette and Tipton Counties :
– Approx. $4.6 million for Special Supplemental Nutrition Program for Women, Infants and Children (WIC)
– Approx. $183,199 for Commodity Supplemental Food Program (CSFP)• Total grant award FY 2011 in Mississippi: $92,072,613• Allocations for FY 2011 Desoto, Marshall, Tate and Tunica Counties:
– $673,375 for WIC • Approx. $73 Million for WIC in Arkansas
– Allocations not available specific to Crittenden County
PSRA Data Presentation June 15, 2011
Source: Mississippi State Department of Health, State of Tennessee Department of Health, Nutrition and Wellness and Arkansas Department of Health 2011
128
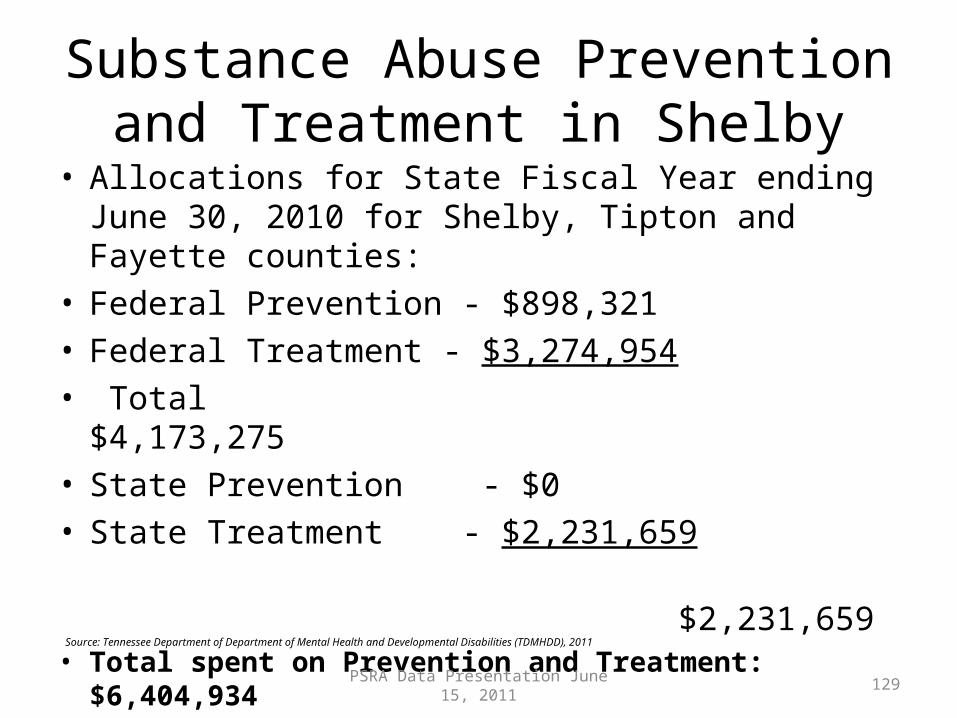
Substance Abuse Prevention and Treatment in Shelby
• Allocations for State Fiscal Year ending June 30, 2010 for Shelby, Tipton and Fayette counties:
• Federal Prevention - $898,321• Federal Treatment - $3,274,954• Total $4,173,275• State Prevention - $0• State Treatment - $2,231,659
$2,231,659• Total spent on Prevention and Treatment: $6,404,934
PSRA Data Presentation June 15, 2011
Source: Tennessee Department of Department of Mental Health and Developmental Disabilities (TDMHDD), 2011
129

• Type of Medicaid Services provided in Fayette, Shelby, and Tipton Counties: Hospice, Inpatient and Outpatient Services, Labs, Home Health, Long-term Care, Transportation, Home and Community-based Services, Durable Medical Equipment, Nursing Facilities
Total Clients Served: 1,987
PSRA Data Presentation June 15, 2011
Tennessee Medicaid/Tenncare*Services paid CY 2010
* Data was only collected for PLWHA
Source: Bureau of TennCare, 2011
130

Tennessee Medicaid/Tenncare*Services paid CY 2010
Number Served
Medical Expenditures
Pharmacy Expenditures
Total Expenditures**
Fayette
24 $25,528 $87,874 $113,402
Shelby
1,921 $6,001,238 9,649,878 $15,651,117
Tipton
42 $44,913 $85,353 $130,265
Total
1,987
$6,071,679
$9,823,105 $15,894,784 *Data was collected all only for PLWHA**Expenditure totals are based on the county where the recipient lived.
PSRA Data Presentation June 15, 2011
Source: Bureau of TennCare, 2011
131

Mississippi Medicaid*Services paid 2010-2011• Type of Medicaid services provided in Desoto,
Tunica, Marshall and Tate Counties: Clinics, Dental, Vision and Hearing, Inpatient Services, Labs, X-rays, Mental Health, Outpatient Services, Pharmacy, Medical Supplies and Transportation
• Number of Clients: 67• Total Amount Paid: $517,859
PSRA Data Presentation June 15, 2011
Source: Mississippi Division of Medicaid, 2011* Data was only collected for PLWHA
132

Arkansas Medicaid*
Services paid for June 1, 2010 -March 3, 2011• Type of Medicaid services provided in Crittenden
County: Medical Care, Private Duty Nurse, Surgery, Medical Services, Outpatient Services and Home Health
• Number of Clients Served: 78• Total Amount Paid for all Services: $28,210
PSRA Data Presentation June 15, 2011
Source: Arkansas Department of Health , Division of Medical Services, 2011* Data was only collected for PLWHA
133

Veteran Affairs• VA is the largest single provider of HIV care in the United
States, providing services to over 24,000 HIV infected Veterans 2010
• Typical HIV/AIDS Veteran: Male (97%), 53 years old and receive antiviral medications for treatment (80%)
• Number in Care*:– Arkansas: 253– Mississippi: 372– Tennessee: 646
• Limited data available specific to the Memphis TGA
PSRA Data Presentation June 15, 2011Source: Department of Veteran Affairs, HIV Infected Veterans in VHA Care by State ,CY 2010 and The State of Care for Veterans with HIV/AIDS, 2009.
*The number of HIV Infected Veterans in Veterans Health Administration (VHA) care in calendar year 2010 who filled a VHA outpatient prescription for a HIV antiviral medication (ARV) during the target calendar year and/or who ever had Clinical AIDS based on an AIDS-defining opportunistic infection (OI) prior to or during the target calendar year.
134

Mid South AIDS Fund• A community partnership of the National AIDS Fund,
which receives support from many sources, including the Elton John AIDS Foundation
• Requires matching funds – local fundraising• Transferred to the Methodist Healthcare Foundation
from the Community Foundation of Greater Memphis in March 2008
• Funding decisions made by the Board of Directors• Focuses on prevention services
• TOTAL FUNDING 2011 - $92,000
PSRA Data Presentation June 15, 2011 135

Service Utilization/Cost Data2010 Expenditures
Lisa KrullContracts Coordinator
PSRA Data Presentation June 15, 2011 136

FY 2010 Cost Utilization Data
Service Category Expenditures # Clients Cost/Client # Services Cost/Service# Services/
Client
Outpatient $2,046,199 1,894 $1,080 8,800 OP visits $233/visit 4.6
ADAP
Local Pharmacy $439,028 176 N/A 251 prescriptions N/A N/A
Oral Health $687,417 729 $943 2143 visits $321/visit 2.9
Mental Health $79,643 267 $298 1,122 visits $71/visit 4.2
Medical Nutrition Therapy $117,290 609 $193 959 encounters $122/encounter 1.6
Medical Case Management $846,937 3,335 $254 32,997 encounters $26 encounter 9.9
Early Intervention Services $688,971 545 $1,264 4,587 encounters $150/encounter 8.4
Substance Abuse Treatment $51,234 19 $2,697 651 encounters $79/encounter 34.3
Case Management (Non-medical) $169,812 866 $196 3,947 encounters $43/encounter 4.6
EFA $74,684 120 $622 213 payments $351/payment 1.9
Food Bank $421,466 1,159 $364 12,716 bags/vouchers$33/bag or
voucher11
Medical Transportation $69,194 978 $7110,138 bus pass, gas card,
cab trip, client transport$7/unit 10.4
Psychosocial Support $149,974 330 $454841 individual
encounter/group$81/encounter 5.6
HERR $13,260 39 $340 13 workshops $1020/workshop 1.0
Outreach $203,709 1, 162 $175website visits, hotline calls,
campaign ads, materialsN/A N/A
PSRA Data Presentation June 15, 2011137
Related Documents