Prioritizing Security Efforts with a Risk- Based Attack Surface Approximation Chris Theisen Advisor: Laurie Williams

Prioritizing Security Efforts with a Risk-Based Attack Surface Approximation
Mar 16, 2018
Welcome message from author
This document is posted to help you gain knowledge. Please leave a comment to let me know what you think about it! Share it to your friends and learn new things together.
Transcript

Prioritizing Security Efforts with a Risk-
Based Attack Surface Approximation
Chris Theisen
Advisor: Laurie Williams

Introduction
What is the “Attack Surface”? Quoting the Open Web Application
Security Project…
• All paths for data and commands in a software system
• The data that travels these paths
• The code that implements and protects both
Concept used for security effort prioritization.
3

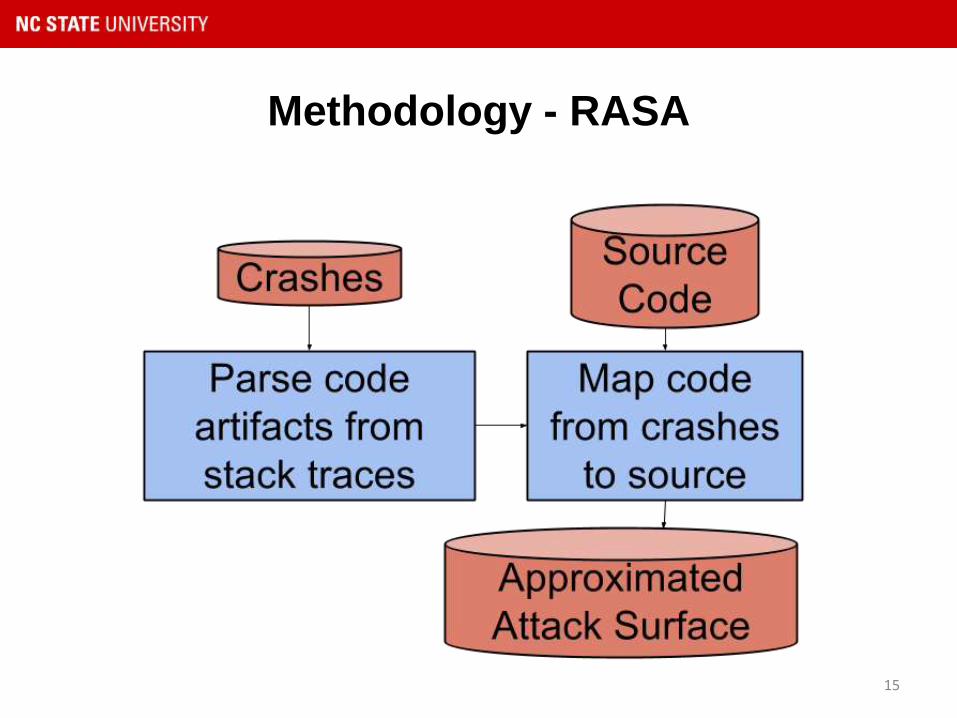
Crashes represent activity that put the system under
stress.
Stack Traces tell us what happened.
Binary Function
foo!foobarDeviceQueueRequest+0x68
foo!fooDeviceSetup+0x72
foo!fooAllDone+0xA8
bar!barDeviceQueueRequest+0xB6
bar!barDeviceSetup+0x08
bar!barAllDone+0xFF
center!processAction+0x1034
center!dontDoAnything+0x1030
Pull out individual code
artifacts from traces.
If code appears on a
crash dump stack trace,
it’s on the attack surface.
4
Called Risk-Based Attack Surface Approximation, or RASA.

5

Why “Risk Based?”
• Crashes are empirical evidence of…
– Data paths through software – with flaws
• Code that is covered by RASA are therefore…
– More likely to have vulnerabilities, as we have
evidence that there are flaws on RASA
– More likely to be exploited, as they’re on known
traversable paths
6

Methodology - RASA
7

Methodology - RASA
8

Methodology - RASA
9

Proposed Solution
10
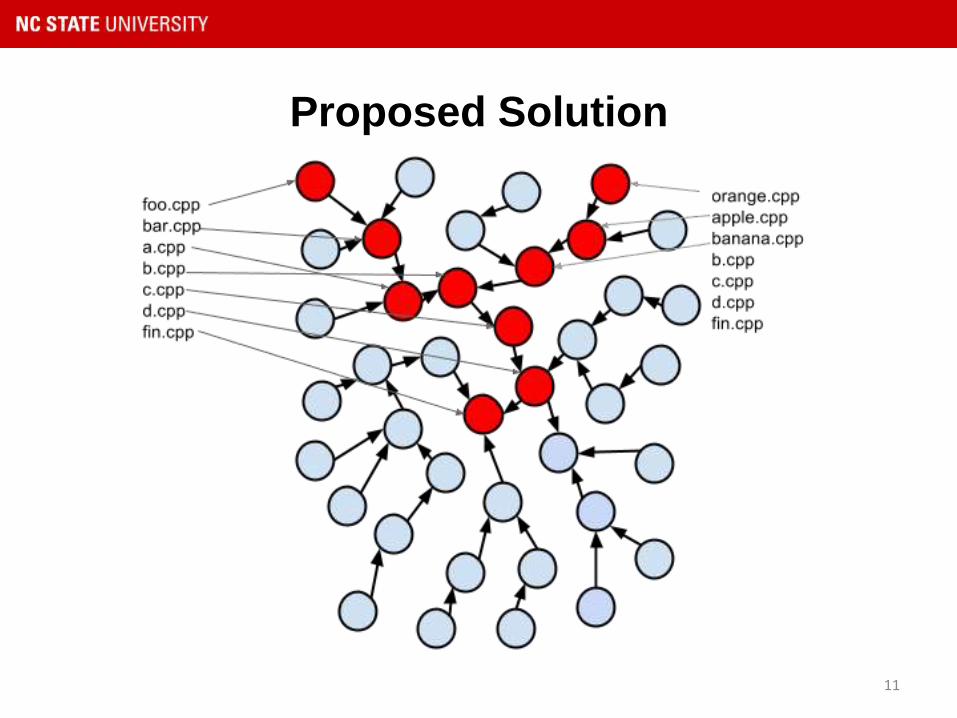
Proposed Solution
11

Proposed Solution
12

How effective is risk-based attack surface approximation in
predicting the location of security vulnerabilities in a
software system?
We are covering the majority of vulnerabilities seen!
Windows 8 User Crashes
%binaries 48.4%
%vulnerabilities 94.6%
Feasibility Study
13

Practitioner Problems
• Feasibility study used tens of millions of crashes.
• Previous study was per binary.
• Practitioners had some issues with it…
– “Binary prioritization isn’t actionable.”
– “We don’t have that much data!”
– “We don’t store every crash we received, we don’t
see the value in that.”
– “This is a new product; we don’t have reported
vulnerabilities to use as a goodness measure.”
14
Methodology - RASA
15
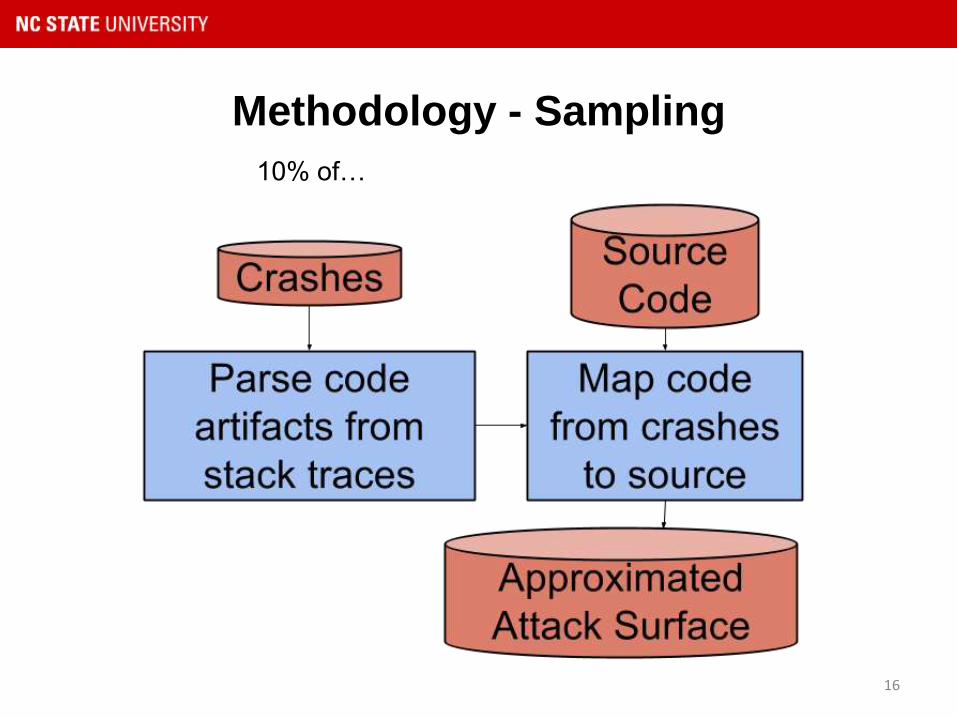
Methodology - Sampling
16
10% of…

Methodology - Sampling
17
10% of…20% of…
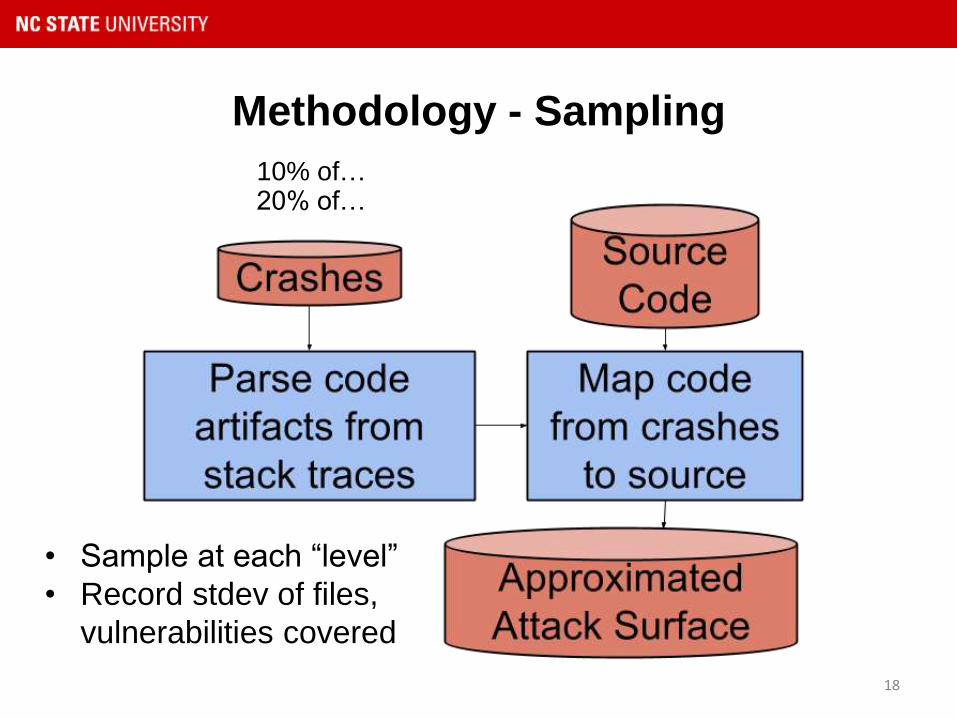
Methodology - Sampling
18
10% of…20% of…
• Sample at each “level”
• Record stdev of files,
vulnerabilities covered

19
12%
13%
14%
15%
16%
17%
70%
71%
72%
73%
74%
75%
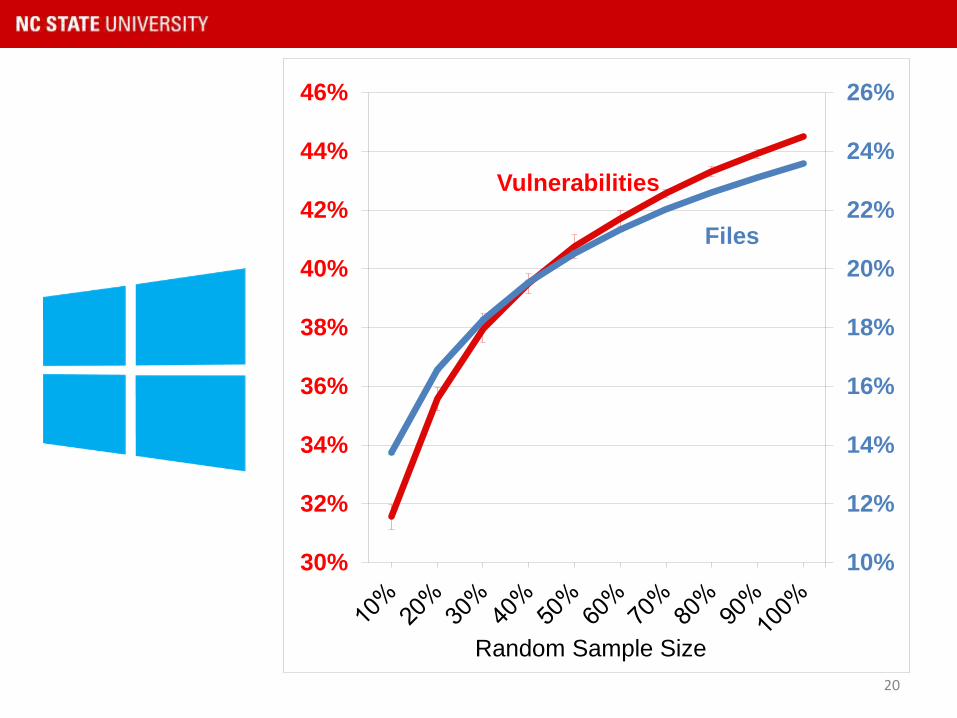
Random Sample Size
Files
Vulnerabilities
10%
12%
14%
16%
18%
20%
22%
24%
26%
30%
32%
34%
36%
38%
40%
42%
44%
46%
Random Sample Size
20
Files
Vulnerabilities

Better Precision?
Can crash dump stack traces be used to prioritize beyond
the attack surface?
“Change,” or code being added or falling off attack surface
“Complexity” of code in software systems
“Boundary,” or code appearing on the edge of software
21

Dropped Code (DC): Code that appears on earlier version, not later
New Code (NC): Code that appears on later version, not earlier
Persistent Code (PC): Code that appears on both versions
22
Total Files Percentage
Windows 8 to 8.1
DC 7951 23.1%
NC 5490 15.9%
PC 21025 61.0%
Windows 8.1 to 10
DC 13645 43.7%
NC 4677 15.0%
PC 12870 41.3%
Windows 10 – 2014 to 2015
DC 232 1.3%
NC 15497 89.0%
PC 1674 9.6%
Change in Attack Surface

Dropped Code (DC): Code that appears on earlier version, not later
New Code (NC): Code that appears on later version, not earlier
Persistent Code (PC): Code that appears on both versions
23
Total Files Percentage
Windows 8 to 8.1
DC 7951 23.1%
NC 5490 15.9%
PC 21025 61.0%
Windows 8.1 to 10
DC 13645 43.7%
NC 4677 15.0%
PC 12870 41.3%
Windows 10 – 2014 to 2015
DC 232 1.3%
NC 15497 89.0%
PC 1674 9.6%
Change in Attack Surface
The attack surface should be recomputed
between version changes and more
frequently during the development process.
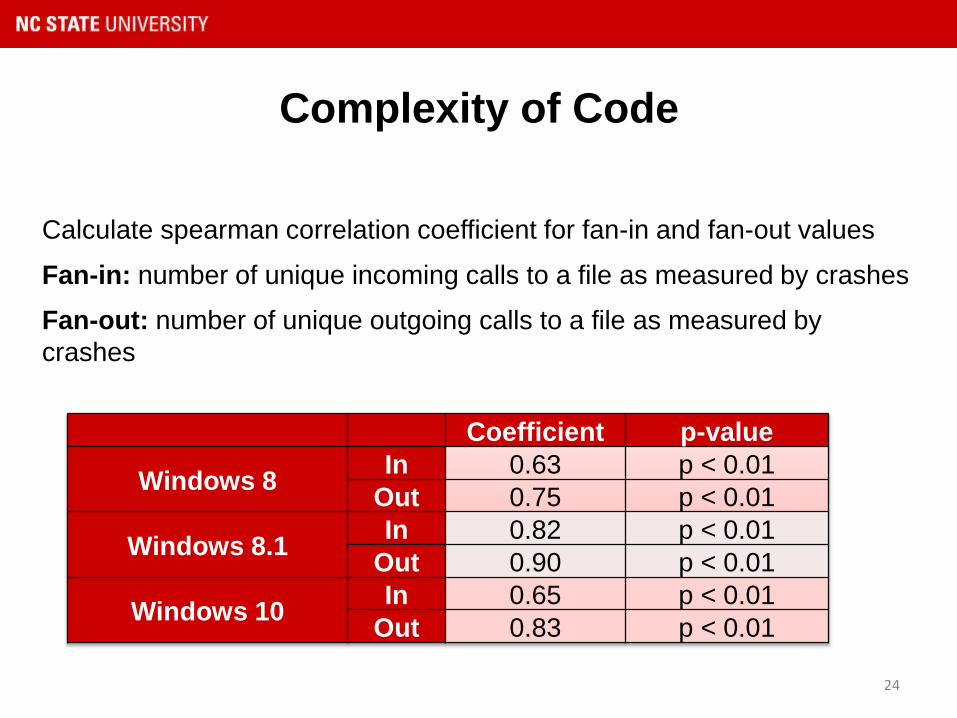
Calculate spearman correlation coefficient for fan-in and fan-out values
Fan-in: number of unique incoming calls to a file as measured by crashes
Fan-out: number of unique outgoing calls to a file as measured by
crashes
24
Coefficient p-value
Windows 8In 0.63 p < 0.01
Out 0.75 p < 0.01
Windows 8.1In 0.82 p < 0.01
Out 0.90 p < 0.01
Windows 10In 0.65 p < 0.01
Out 0.83 p < 0.01
Complexity of Code

Calculate spearman correlation coefficient for fan-in and fan-out values
Fan-in: number of unique incoming calls to a file as measured by crashes
Fan-out: number of unique outgoing calls to a file as measured by
crashes
25
Coefficient p-value
Windows 8In 0.63 p < 0.01
Out 0.75 p < 0.01
Windows 8.1In 0.82 p < 0.01
Out 0.90 p < 0.01
Windows 10In 0.65 p < 0.01
Out 0.83 p < 0.01
Complexity of Code
More complex code is more likely to have
security vulnerabilities.

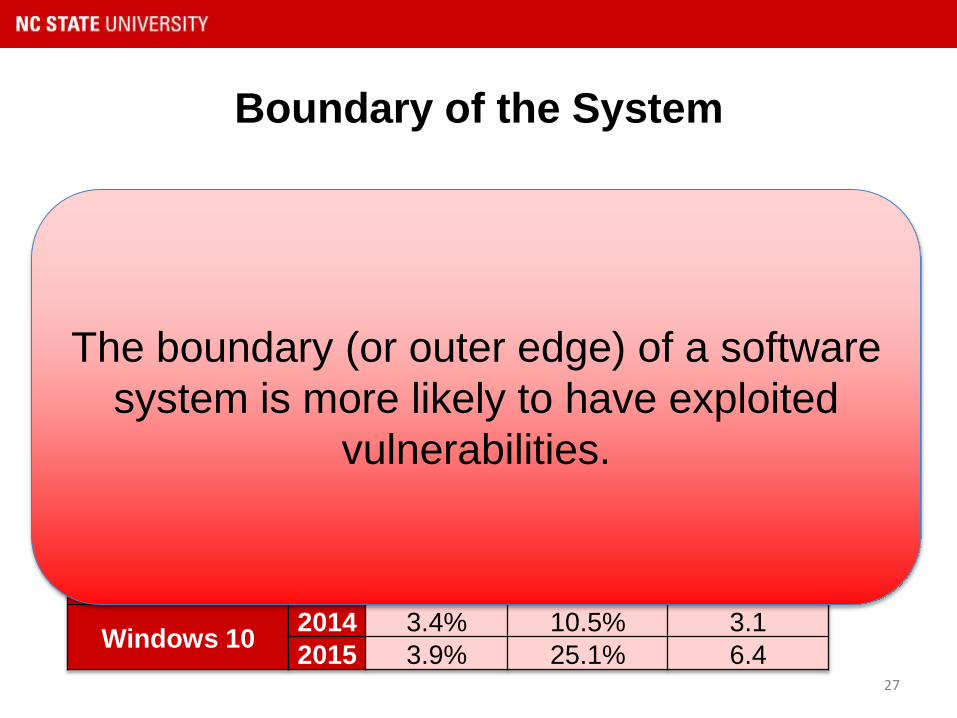
Boundary Code (BC): percentage of code that appears on the boundary,
or edge of a software system
Boundary Vulnerabilities (BV): percentage of vulnerabilities on
Boundary Code (BC).
26
BC BV Ratio
Windows 82014 4.5% 17.2% 3.8
2015 4.6% 18.6% 4.0
Windows 8.12014 4.6% 16.5% 3.6
2015 6.9% 23.7% 3.4
Windows 102014 3.4% 10.5% 3.1
2015 3.9% 25.1% 6.4
Boundary of the System
Boundary Code (BC): percentage of code that appears on the boundary,
or edge of a software system
Boundary Vulnerabilities (BV): percentage of vulnerabilities on
Boundary Code (BC).
27
BC BV Ratio
Windows 82014 4.5% 17.2% 3.8
2015 4.6% 18.6% 4.0
Windows 8.12014 4.6% 16.5% 3.6
2015 6.9% 23.7% 3.4
Windows 102014 3.4% 10.5% 3.1
2015 3.9% 25.1% 6.4
Boundary of the System
The boundary (or outer edge) of a software
system is more likely to have exploited
vulnerabilities.

Systematic Literature Review
28

Systematic Literature Review
29

Systematic Literature Review
30

Developer Tools: Visualization
• We have a list of vulnerable files; now what?
– Further prioritization to assist developers.
• We looked at
– Creating an approximation of the attack surface.
– How the attack surface changes over time.
– How the complexity of the attack surface predicts
vulnerabilities.
– How proximity to the boundary of a software
system predicts vulnerabilities.
31
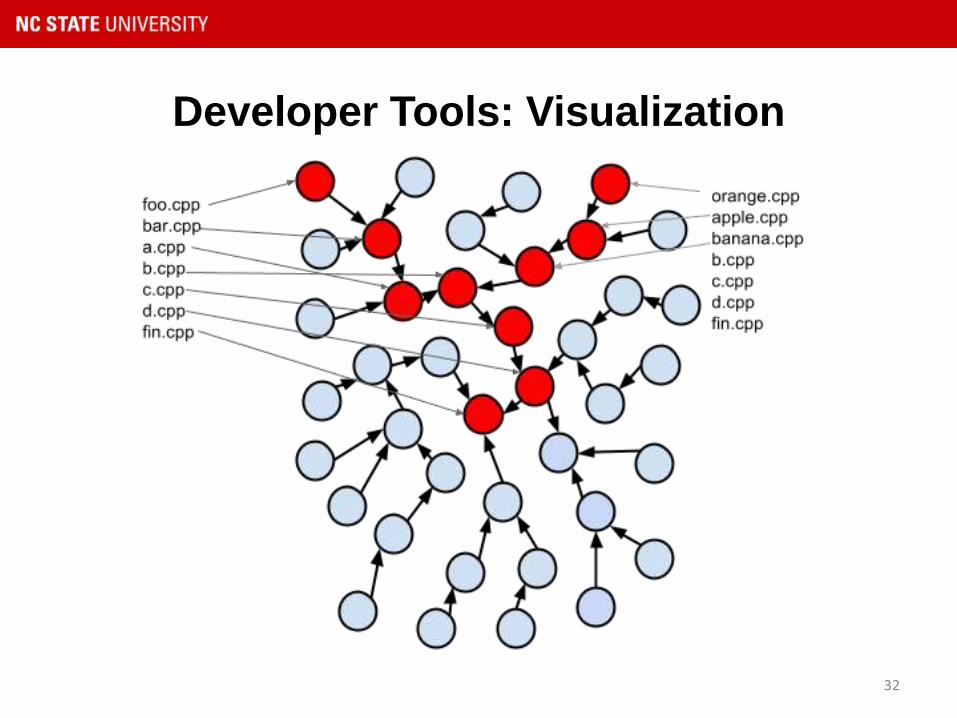
Developer Tools: Visualization
32

Comparing Against VPMs
There are many Vulnerability Prediction Models (VPMs)
• String Mining (Scandariato)
• Churn/Complexity (Shin)
• Development Metrics (Zimmermann)
• Static Analysis Alerts (Gegick)
How does RASA perform as standalone predictor?
Can RASA improve precision, recall of these approaches?
33

34
foo!foobarDeviceQueueRequest+0x68
foo!fooDeviceSetup+0x72
foo!fooAllDone+0xA8
bar!barDeviceQueueRequest+0xB6
bar!barDeviceSetup+0x08
bar!barAllDone+0xFF
@theisencr
theisencr.github.io
Related Documents

![Risk-Based Attack Surface Approximation: How Much Data is Enough? [ICSE - SEIP 2017]](https://static.cupdf.com/doc/110x72/5aab10db7f8b9ac7548b457b/risk-based-attack-surface-approximation-how-much-data-is-enough-icse-seip.jpg)