Prioritizing Climate Change Mitigation Technologies by Cost-Effectiveness: How do transportation options compare with other sectors? Nic Lutsey Ph.D. Candidate Institute of Transportation Studies University of California at Davis California Air Resources Board Chair’s Air Pollution Seminar Series April 30, 2008

Welcome message from author
This document is posted to help you gain knowledge. Please leave a comment to let me know what you think about it! Share it to your friends and learn new things together.
Transcript

Prioritizing Climate Change Mitigation Technologies by Cost-Effectiveness:
How do transportation options compare with other sectors?
Nic LutseyPh.D. Candidate
Institute of Transportation StudiesUniversity of California at Davis
California Air Resources BoardChair’s Air Pollution Seminar Series
April 30, 2008
April 30, 2008 2
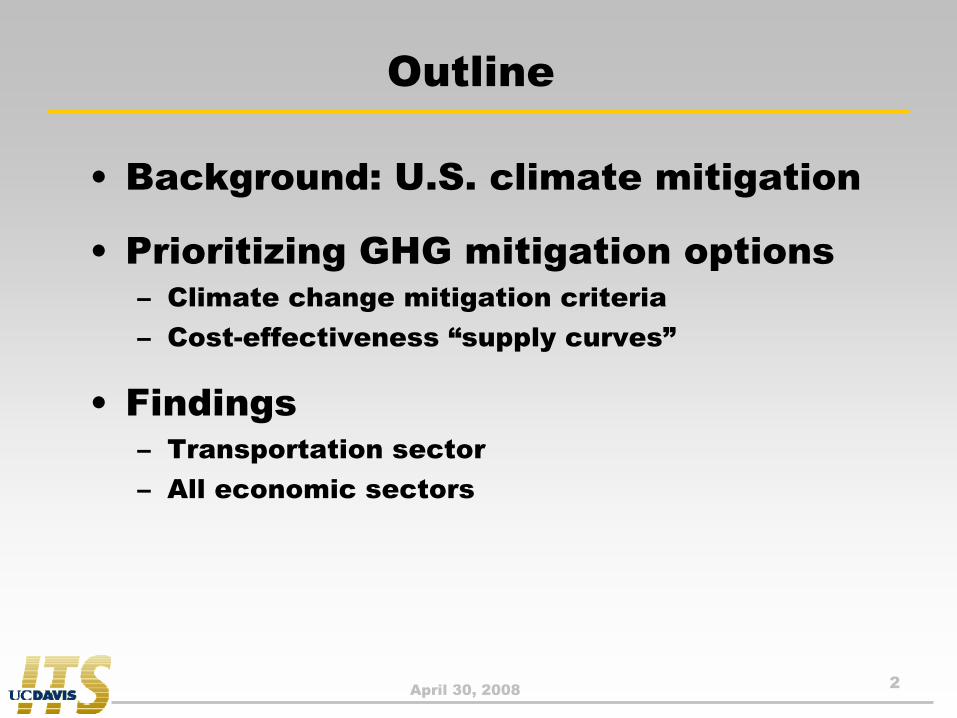
Outline
• Background: U.S. climate mitigation
• Prioritizing GHG mitigation options– Climate change mitigation criteria– Cost-effectiveness “supply curves”
• Findings– Transportation sector– All economic sectors
April 30, 2008 3
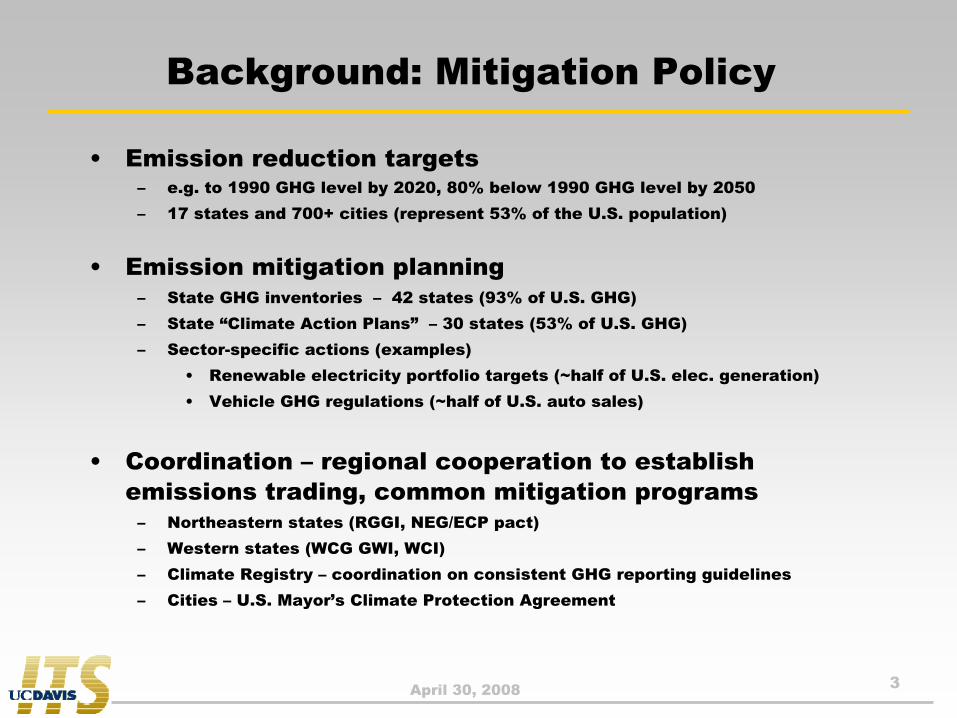
Background: Mitigation Policy
• Emission reduction targets – e.g. to 1990 GHG level by 2020, 80% below 1990 GHG level by 2050– 17 states and 700+ cities (represent 53% of the U.S. population)
• Emission mitigation planning– State GHG inventories – 42 states (93% of U.S. GHG)– State “Climate Action Plans” – 30 states (53% of U.S. GHG)– Sector-specific actions (examples)
• Renewable electricity portfolio targets (~half of U.S. elec. generation)• Vehicle GHG regulations (~half of U.S. auto sales)
• Coordination – regional cooperation to establish emissions trading, common mitigation programs
– Northeastern states (RGGI, NEG/ECP pact)– Western states (WCG GWI, WCI)– Climate Registry – coordination on consistent GHG reporting guidelines – Cities – U.S. Mayor’s Climate Protection Agreement
April 30, 2008 4
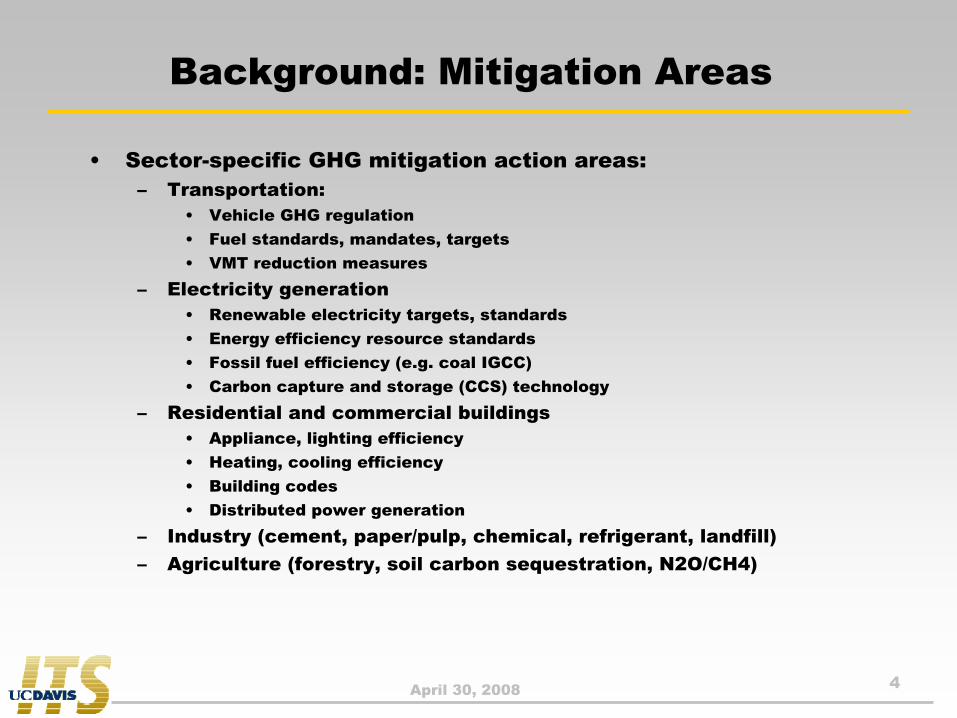
Background: Mitigation Areas
• Sector-specific GHG mitigation action areas:– Transportation:
• Vehicle GHG regulation• Fuel standards, mandates, targets• VMT reduction measures
– Electricity generation• Renewable electricity targets, standards• Energy efficiency resource standards• Fossil fuel efficiency (e.g. coal IGCC)• Carbon capture and storage (CCS) technology
– Residential and commercial buildings• Appliance, lighting efficiency• Heating, cooling efficiency• Building codes• Distributed power generation
– Industry (cement, paper/pulp, chemical, refrigerant, landfill)– Agriculture (forestry, soil carbon sequestration, N2O/CH4)
April 30, 2008 5
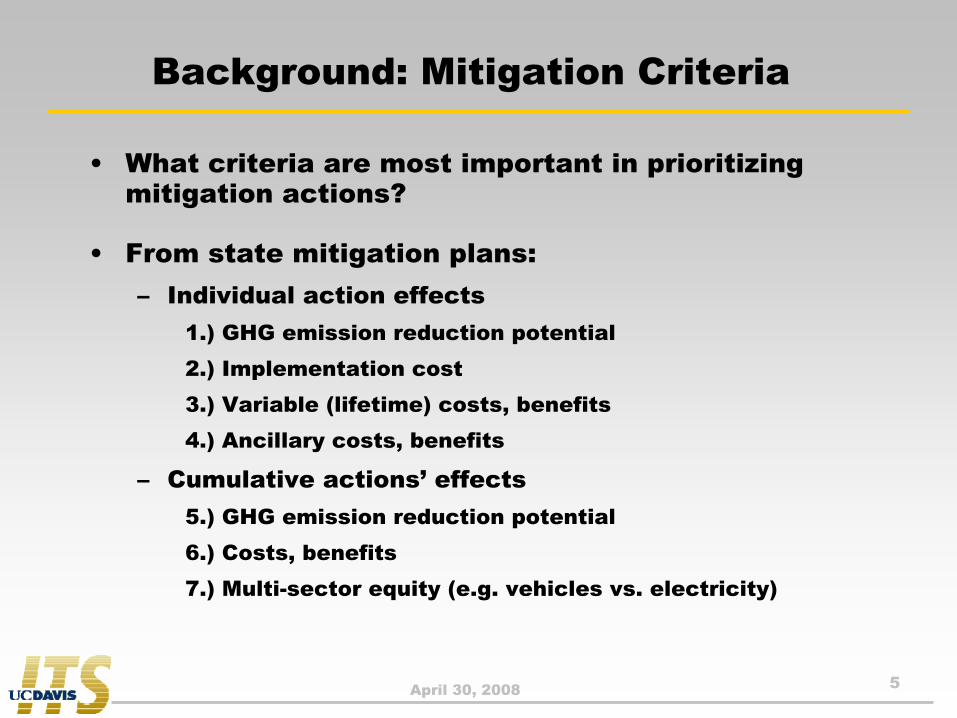
Background: Mitigation Criteria
• What criteria are most important in prioritizing mitigation actions?
• From state mitigation plans:– Individual action effects
1.) GHG emission reduction potential2.) Implementation cost3.) Variable (lifetime) costs, benefits4.) Ancillary costs, benefits
– Cumulative actions’ effects5.) GHG emission reduction potential6.) Costs, benefits7.) Multi-sector equity (e.g. vehicles vs. electricity)
April 30, 2008 6
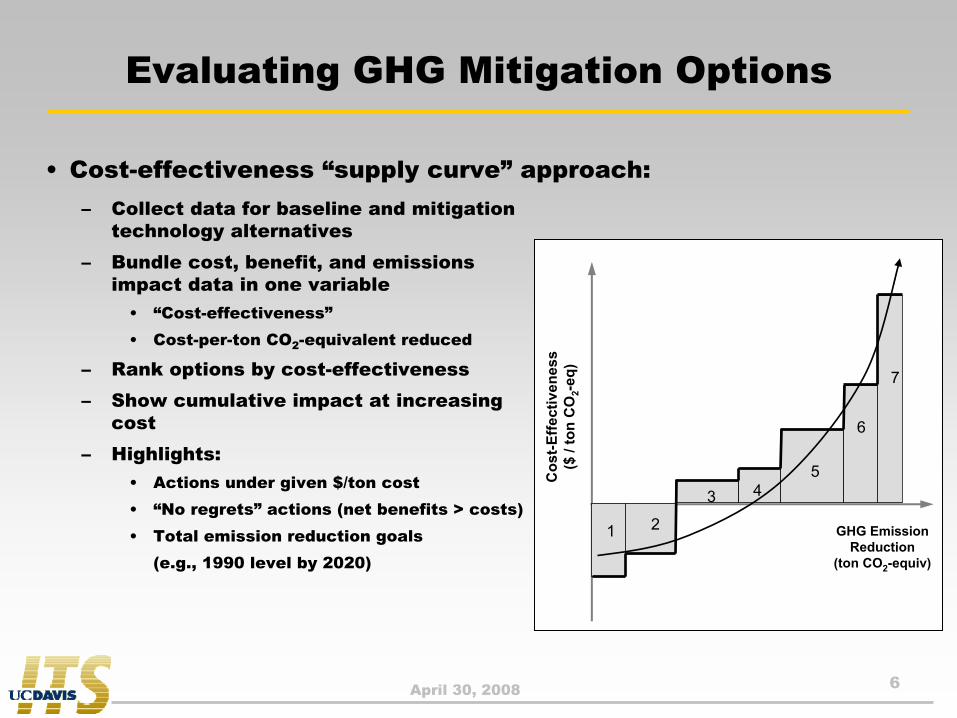
Evaluating GHG Mitigation Options
– Collect data for baseline and mitigation technology alternatives
– Bundle cost, benefit, and emissions impact data in one variable
• “Cost-effectiveness”• Cost-per-ton CO2-equivalent reduced
– Rank options by cost-effectiveness– Show cumulative impact at increasing
cost– Highlights:
• Actions under given $/ton cost• “No regrets” actions (net benefits > costs)• Total emission reduction goals
(e.g., 1990 level by 2020)
1 2
3 45
6
7
GHG Emission Reduction
(ton CO2-equiv)C
ost-E
ffect
iven
ess
($ /
ton
CO
2-eq)
• Cost-effectiveness “supply curve” approach:

April 30, 2008 7
Cost-Effectiveness Curve Approach
• Use in various forms
– Initial costs only:
– Include costs and direct benefits:
=
−
eductionREmissionGreenhouse
CostgyTechnoloInitial
tonneessEffectivenCost
)/($
+
=
−
eductionREmissionGreenhouse
mpactICostFuelLifetime
CostgyTechnoloInitial
tonneessEffectivenCost
)/($
Cumulative GHG Emission Reduction (ton CO2-equiv)
Cos
t-E
ffec
tiven
ess
($ /
ton
CO
2-eq
uiv)
123
4
56
7
Initial cost
Net costs (initial cost + direct benefits)
April 30, 2008 8
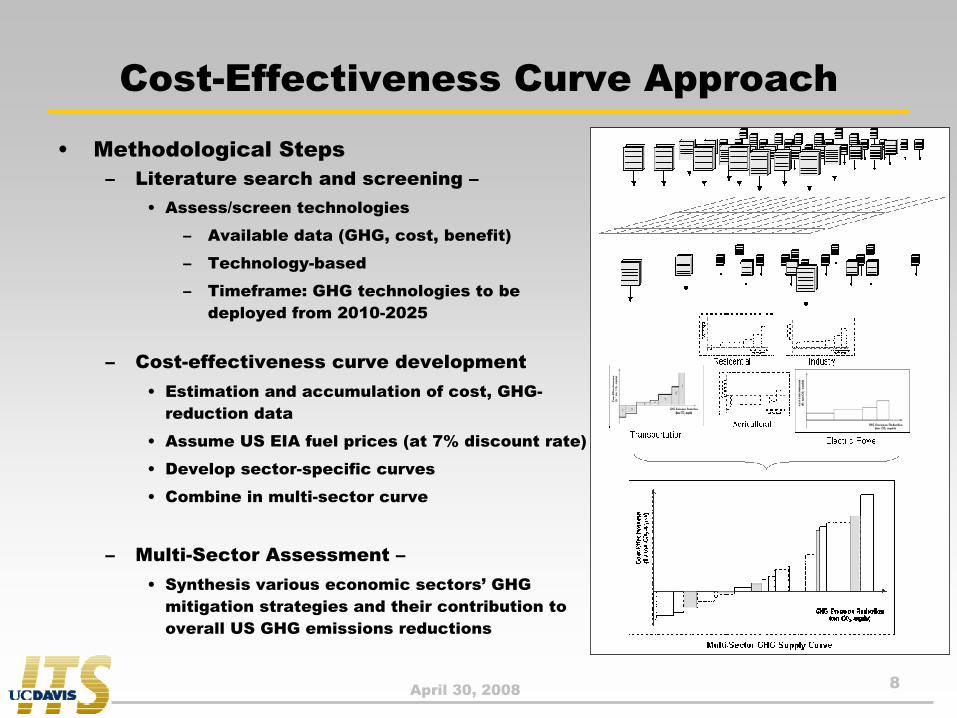
Cost-Effectiveness Curve Approach
• Methodological Steps– Literature search and screening –
• Assess/screen technologies
– Available data (GHG, cost, benefit)
– Technology-based
– Timeframe: GHG technologies to be deployed from 2010-2025
– Cost-effectiveness curve development • Estimation and accumulation of cost, GHG-
reduction data
• Assume US EIA fuel prices (at 7% discount rate)
• Develop sector-specific curves
• Combine in multi-sector curve
– Multi-Sector Assessment –• Synthesis various economic sectors’ GHG
mitigation strategies and their contribution to overall US GHG emissions reductions
April 30, 2008 9
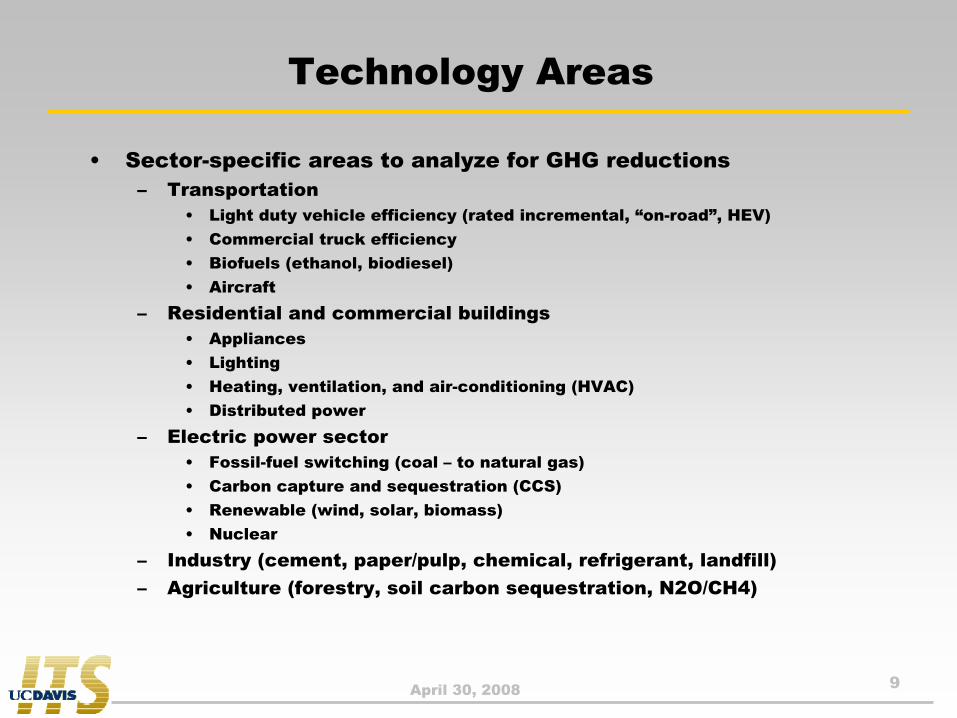
Technology Areas
• Sector-specific areas to analyze for GHG reductions– Transportation
• Light duty vehicle efficiency (rated incremental, “on-road”, HEV)• Commercial truck efficiency• Biofuels (ethanol, biodiesel)• Aircraft
– Residential and commercial buildings• Appliances• Lighting• Heating, ventilation, and air-conditioning (HVAC)• Distributed power
– Electric power sector• Fossil-fuel switching (coal – to natural gas)• Carbon capture and sequestration (CCS)• Renewable (wind, solar, biomass)• Nuclear
– Industry (cement, paper/pulp, chemical, refrigerant, landfill)– Agriculture (forestry, soil carbon sequestration, N2O/CH4)
April 30, 2008 10
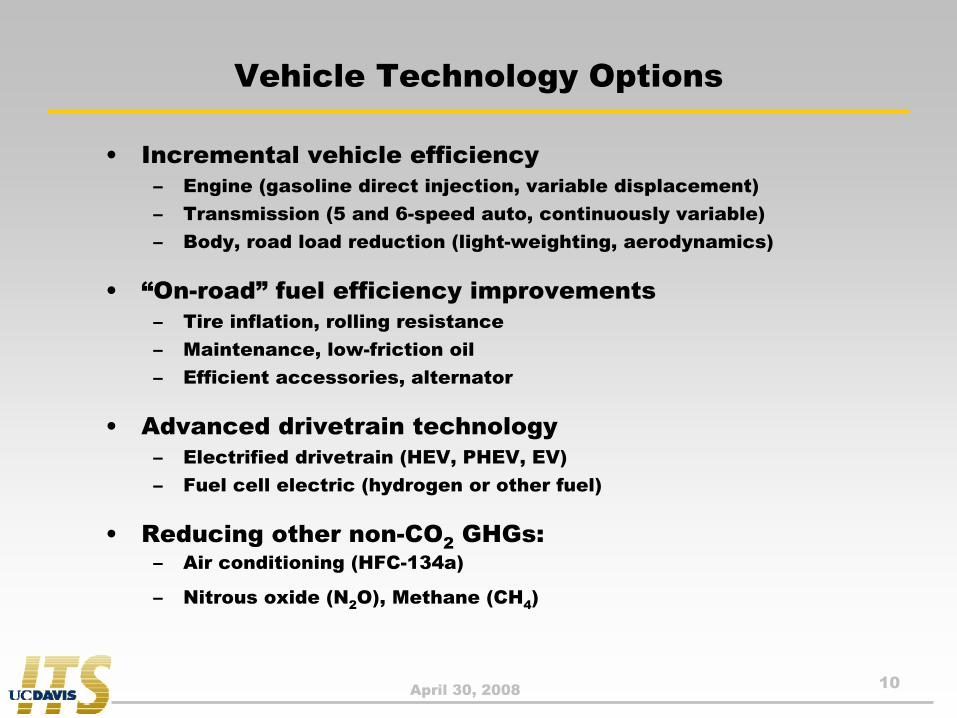
Vehicle Technology Options
• Incremental vehicle efficiency– Engine (gasoline direct injection, variable displacement)– Transmission (5 and 6-speed auto, continuously variable)– Body, road load reduction (light-weighting, aerodynamics)
• “On-road” fuel efficiency improvements– Tire inflation, rolling resistance– Maintenance, low-friction oil– Efficient accessories, alternator
• Advanced drivetrain technology– Electrified drivetrain (HEV, PHEV, EV)– Fuel cell electric (hydrogen or other fuel)
• Reducing other non-CO2 GHGs:– Air conditioning (HFC-134a)
– Nitrous oxide (N2O), Methane (CH4)
April 30, 2008 11
Austin, T.C., R.G. Dulla, and T.R. Carlson, 1999, Alternative and Future Technologies for Reducing Greenhouse Gas Emissions From Road Vehicles, Sierra Research, Inc., Sacramento, Calif., for Natural Resources Canada.
DeCicco, J.M, F. An, and M. Ross, 2001, “Technical Options for Improving the Fuel Economy of U.S. Cars and Light Trucks by 2012-2015,” forthcoming American Council for an Energy Efficient Economy (ACEEE), Washington, D.C.
Energy and Environmental Analysis, Inc (EEA), 1995, Automotive Technologies to Improve Fuel Economy to 2015, prepared for the U.S. Congress Office of Technology Assessment, June.
National Research Council (NRC), 2002, Effectiveness and Impact of Corporate Average Fuel Economy (CAFE) Standards, National Academy Press, Washington, D.C., July.
Plotkin, S., D. Greene, K.G. Duleep. 2002. Examining the Potential for Voluntary Fuel Economy Standards in the United States and Canada. ANL/ESD/02-5, Argonne National Laboratory, Argonne, Illinois.
Weiss, M.A., et al., 2000, On the Road in 2020, Energy Laboratory Report MIT EL 00-003, Massachusetts Institute of Technology, Cambridge, Mass., Oct.
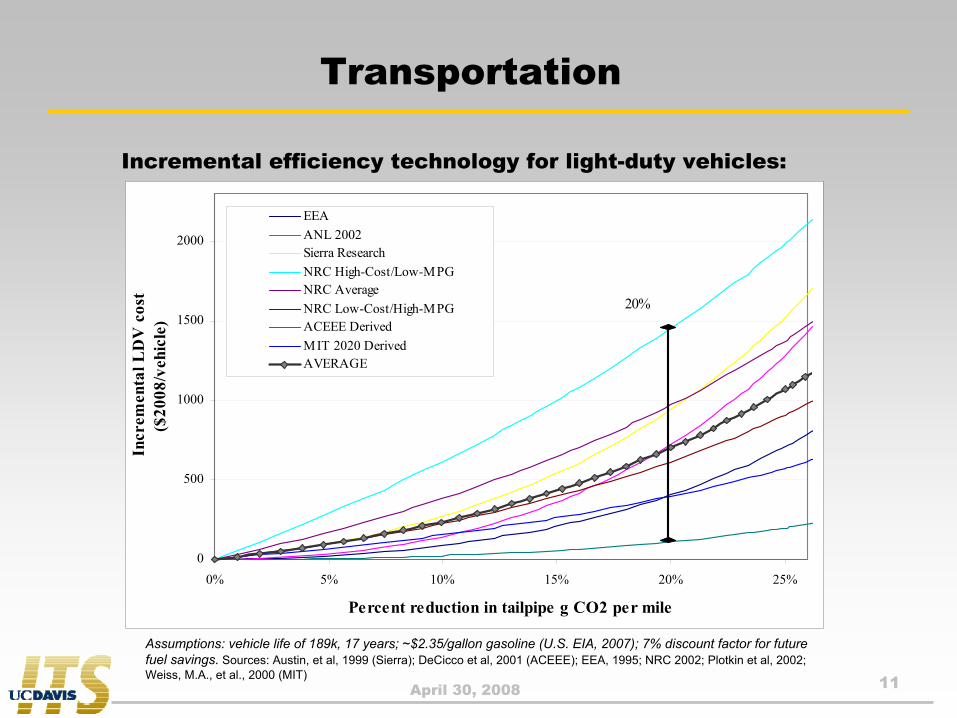
Transportation
Incremental efficiency technology for light-duty vehicles:
Assumptions: vehicle life of 189k, 17 years; ~$2.35/gallon gasoline (U.S. EIA, 2007); 7% discount factor for future fuel savings. Sources: Austin, et al, 1999 (Sierra); DeCicco et al, 2001 (ACEEE); EEA, 1995; NRC 2002; Plotkin et al, 2002; Weiss, M.A., et al., 2000 (MIT)
0
500
1000
1500
2000
0% 5% 10% 15% 20% 25%
Percent reduction in tailpipe g CO2 per mile
Incr
emen
tal L
DV
cos
t($
2008
/veh
icle
)
EEAANL 2002Sierra ResearchNRC High-Cost/Low-MPGNRC AverageNRC Low-Cost/High-MPGACEEE DerivedMIT 2020 DerivedAVERAGE
20%
April 30, 2008 12
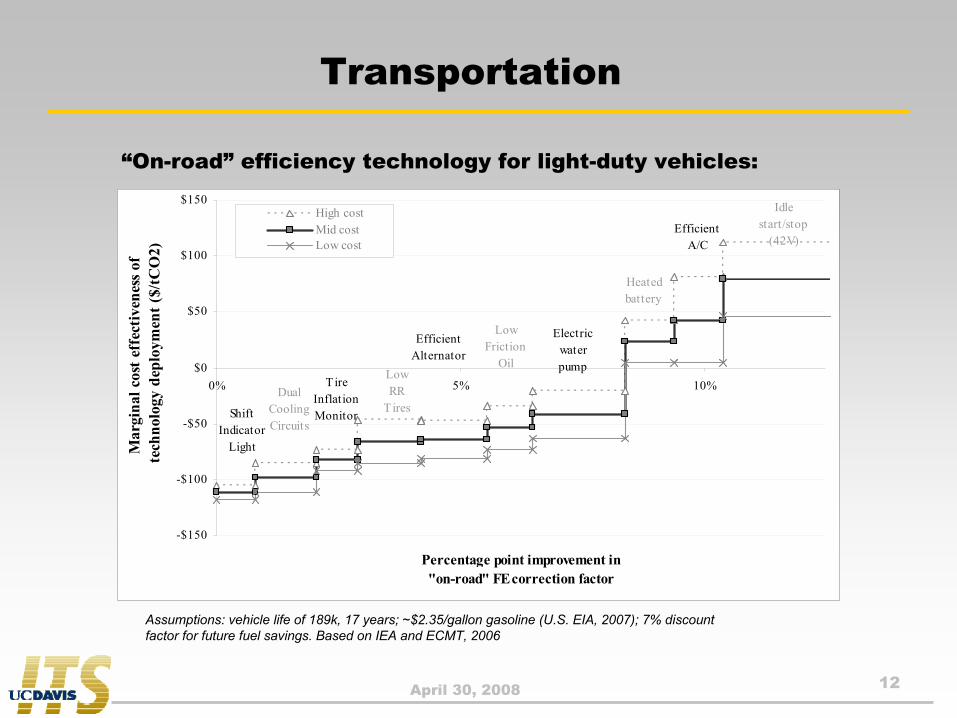
Transportation
“On-road” efficiency technology for light-duty vehicles:
Assumptions: vehicle life of 189k, 17 years; ~$2.35/gallon gasoline (U.S. EIA, 2007); 7% discount factor for future fuel savings. Based on IEA and ECMT, 2006
ShiftIndicator
Light
DualCoolingCircuits
Efficient A/C
TireInflationMonitor
LowRR
Tires
EfficientAlternator
LowFriction
Oil
-$150
-$100
-$50
$0
$50
$100
$150
0% 5% 10%
Percentage point improvement in "on-road" FE correction factor
Mar
gina
l cos
t eff
ectiv
enes
s of
tech
nolo
gy d
eplo
ymen
t ($/
tCO
2)
High costMid costLow cost
Idle start/stop
(42V)
Electric water pump
Heated battery
April 30, 2008 13
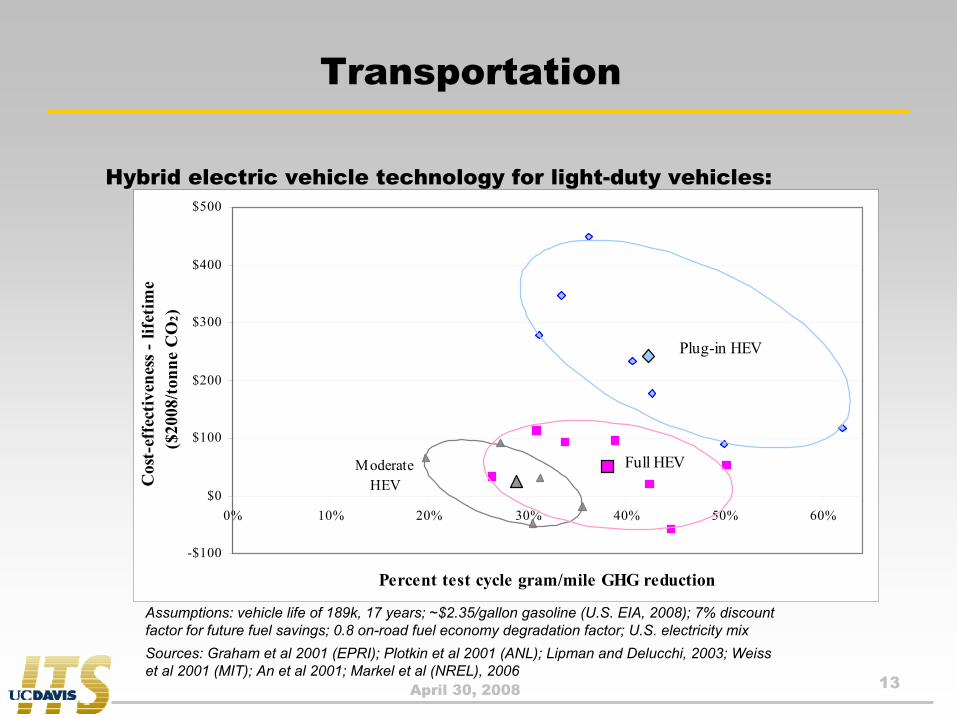
Transportation
Hybrid electric vehicle technology for light-duty vehicles:
Assumptions: vehicle life of 189k, 17 years; ~$2.35/gallon gasoline (U.S. EIA, 2008); 7% discount factor for future fuel savings; 0.8 on-road fuel economy degradation factor; U.S. electricity mix Sources: Graham et al 2001 (EPRI); Plotkin et al 2001 (ANL); Lipman and Delucchi, 2003; Weiss et al 2001 (MIT); An et al 2001; Markel et al (NREL), 2006
Moderate HEV
Full HEV
Plug-in HEV
-$100
$0
$100
$200
$300
$400
$500
0% 10% 20% 30% 40% 50% 60%
Percent test cycle gram/mile GHG reduction
Cos
t-ef
fect
iven
ess -
life
time
($20
08/to
nne
CO
2)
April 30, 2008 14
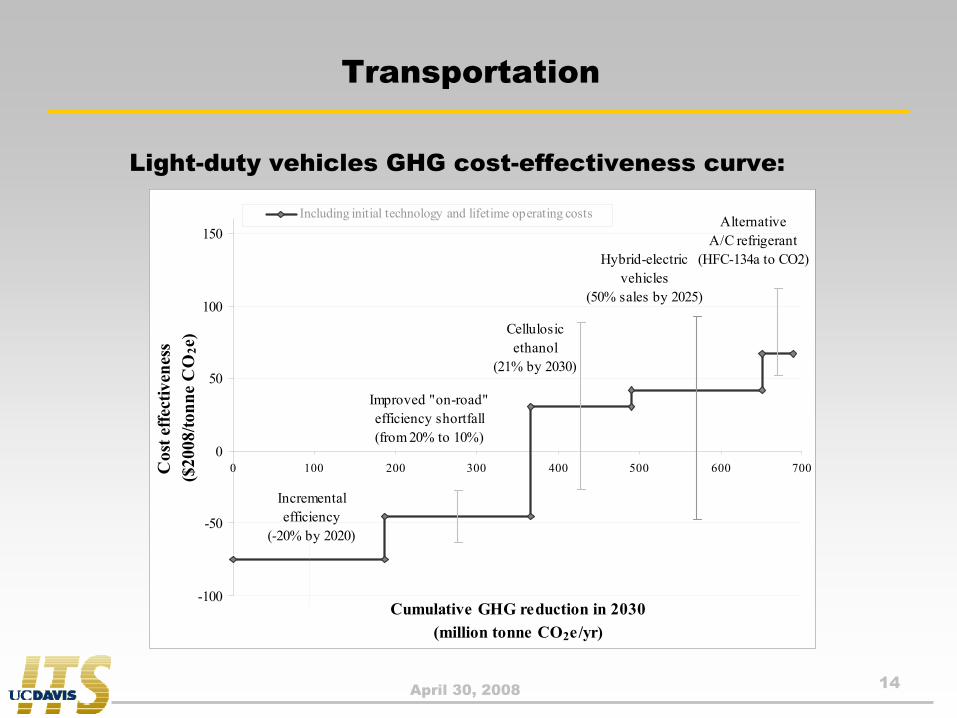
Transportation
Light-duty vehicles GHG cost-effectiveness curve:
Incremental efficiency
(-20% by 2020)
Improved "on-road" efficiency shortfall (from 20% to 10%)
Cellulosic ethanol
(21% by 2030)
Alternative A/C refrigerant
(HFC-134a to CO2)Hybrid-electric vehicles
(50% sales by 2025)
-100
-50
0
50
100
150
0 100 200 300 400 500 600 700
Cumulative GHG reduction in 2030 (million tonne CO2e/yr)
Cos
t effe
ctiv
enes
s ($
2008
/tonn
e C
O 2e
)Including initial technology and lifetime operating costs
April 30, 2008 15
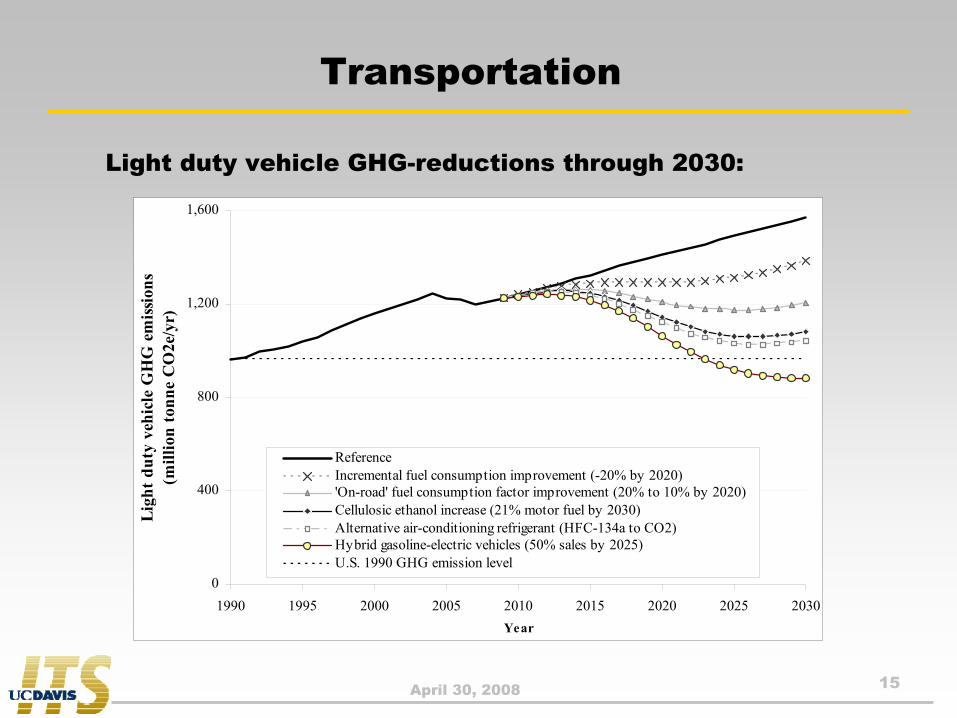
Transportation
Light duty vehicle GHG-reductions through 2030:
0
400
800
1,200
1,600
1990 1995 2000 2005 2010 2015 2020 2025 2030Year
Ligh
t dut
y ve
hicl
e G
HG
em
issio
ns
(mill
ion
tonn
e C
O2e
/yr)
ReferenceIncremental fuel consumption improvement (-20% by 2020)'On-road' fuel consumption factor improvement (20% to 10% by 2020)Cellulosic ethanol increase (21% motor fuel by 2030)Alternative air-conditioning refrigerant (HFC-134a to CO2)Hybrid gasoline-electric vehicles (50% sales by 2025)U.S. 1990 GHG emission level

April 30, 2008 16
Transportation
Commercial truck (Class 2b, Class 3-6, Class 8) GHG-reduction:
Based on An et al 2000; Langer, 2004; Vyas et al 2002; Schaefer and Jacoby, 2006; Muster, 2001; Lovins et al, 2004
Class 7-8 (Heavy Duty)
Efficiency
Biodiesel (B5 by 2020)
Cellulosic ethanol (21% by 2030)
Class 2b (Light Duty)
Efficiency
Class 3-6 (Medium Duty)
Efficiency
-150
-100
-50
0
50
100
150
0 25 50 75 100
Greenhouse Gas Emission Reduction in 2030(million tonne CO2e/yr)
Cos
t effe
ctiv
enes
s ($
2008
/tonn
e C
O 2
e)
April 30, 2008 17
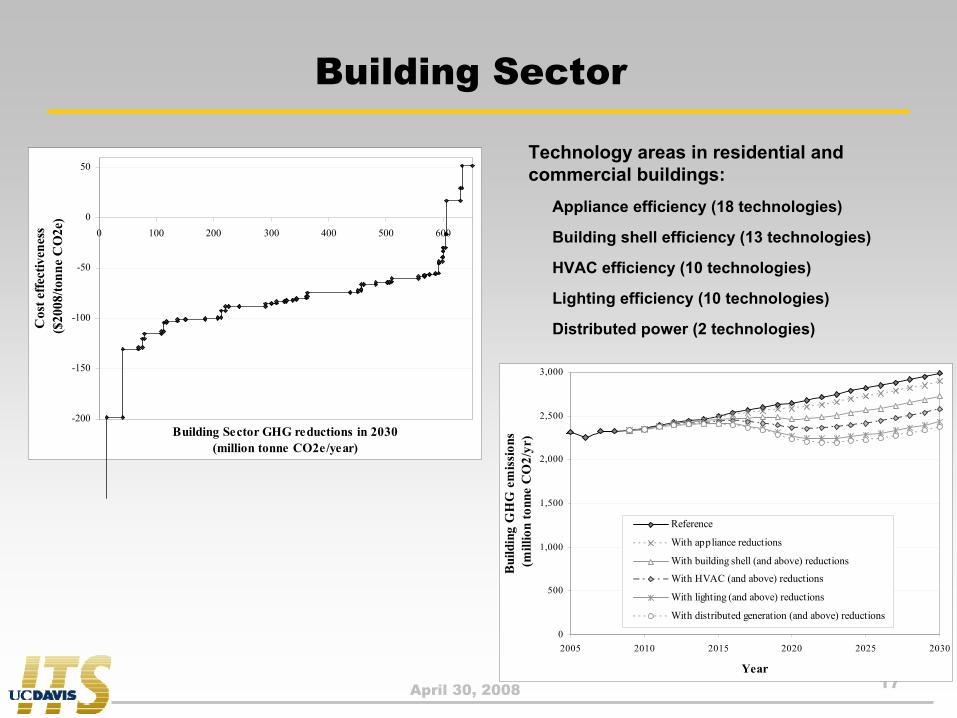
Building Sector
0
500
1,000
1,500
2,000
2,500
3,000
2005 2010 2015 2020 2025 2030
Year
Bui
ldin
g G
HG
em
issi
ons
(mill
ion
tonn
e C
O2/
yr)
Reference
With appliance reductions
With building shell (and above) reductions
With HVAC (and above) reductions
With lighting (and above) reductions
With distributed generation (and above) reductions
-200
-150
-100
-50
0
50
0 100 200 300 400 500 600
Building Sector GHG reductions in 2030 (million tonne CO2e/year)
Cos
t effe
ctiv
enes
s ($
2008
/tonn
e C
O2e
)
Appliance efficiency (18 technologies)
Building shell efficiency (13 technologies)
HVAC efficiency (10 technologies)
Lighting efficiency (10 technologies)
Distributed power (2 technologies)
Technology areas in residential and commercial buildings:
April 30, 2008 18
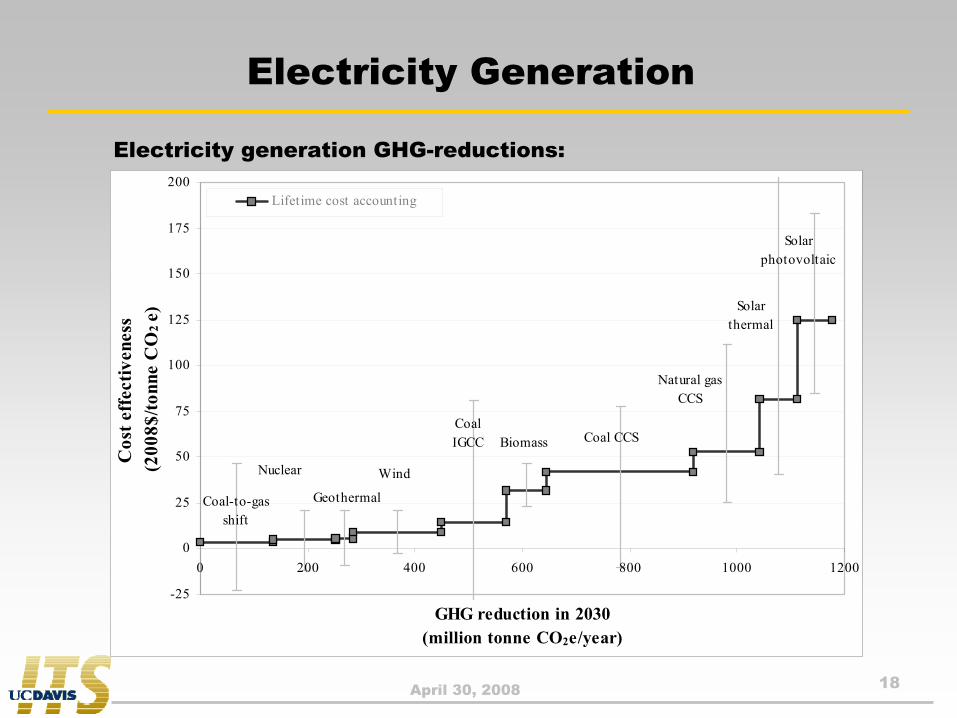
Electricity Generation
Electricity generation GHG-reductions:
Coal-to-gasshift
Nuclear
Geothermal
Coal IGCC Coal CCS
Natural gas CCS
Solar thermal
Solar photovoltaic
Wind
Biomass
-25
0
25
50
75
100
125
150
175
200
0 200 400 600 800 1000 1200
GHG reduction in 2030 (million tonne CO2e/year)
Cos
t eff
ectiv
enes
s (2
008$
/tonn
e C
O2
e)
Lifetime cost accounting

April 30, 2008 19
Industry Sector
GHG abatement in other industrial sectors:
High-GWP “F gases”
Steel and iron
Cement
Combined heat and power (CHP)
Landfill gas management
Paper and pulp
-200
-150
-100
-50
0
50
100
150
200
0 50 100 150 200 250 300 350 400 450
Industry GHG reductions in 2030 (million tonne CO2e/year)
Cos
t eff
ectiv
enes
s ($
2008
/tonn
e C
O2 e)
Initial cost accounting
Lifetime cost accounting Technology Areas:

April 30, 2008 20
Agricultural Sector
GHG abatement in agriculture and forestry:
Afforestation
Forest management
Soil carbon sequestration
Biofuel offsets (biomass for transp. Fuels, power plants)
Reduced fossil fuel inputs
Livestock manure management (enteric ferm. and manure CH4)
N2O-related soil management strategies
Areas included:
0
10
20
30
40
50
60
70
80
0 200 400 600 800 1,000 1,200 1,400 1,600 1,800 2,000
GHG reduction in 2030(million tonne CO2e/yr)
Cos
t eff
ectiv
enes
s ($
/tonn
e C
O2 e
)
US EPA, 2005
April 30, 2008 21
Multi-Sector GHG Abatement
• Issues in integrating GHG abatement measures– Interaction effects, or “double counting”
– Cross-sector linkages• Building sector efficiency – electricity generation technologies
• Agriculture sector biomass production – transportation/electricity biomass usage
• Handling of data– Choose mutually exclusive GHG-reduction measures
– Adjust baseline emissions characteristics for measures that interact (and recalculate GHG emission reductions and cost effectiveness ratios)
– Selection of studies and technologies to be consistent across sectors
April 30, 2008 22
Multi-Sector GHG Abatement
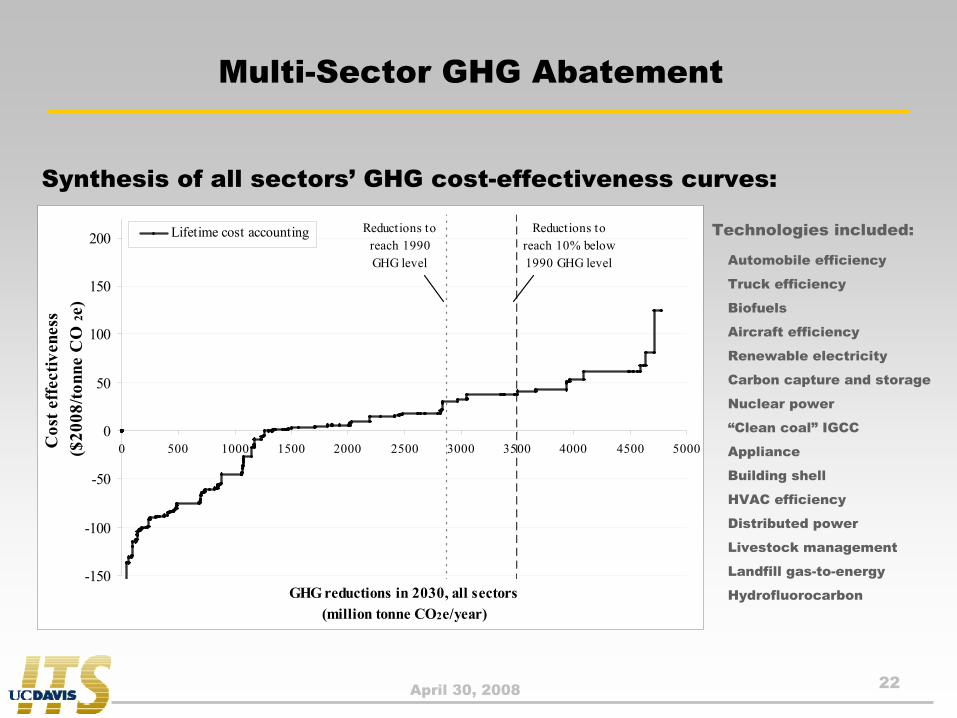
Synthesis of all sectors’ GHG cost-effectiveness curves:
Automobile efficiency
Truck efficiency
Biofuels
Aircraft efficiency
Renewable electricity
Carbon capture and storage
Nuclear power
“Clean coal” IGCC
Appliance
Building shell
HVAC efficiency
Distributed power
Livestock management
Landfill gas-to-energy
Hydrofluorocarbon
Technologies included:
-150
-100
-50
0
50
100
150
200
0 500 1000 1500 2000 2500 3000 3500 4000 4500 5000
GHG reductions in 2030, all sectors (million tonne CO2e/year)
Cos
t eff
ectiv
enes
s ($
2008
/tonn
e C
O 2e
)
Lifetime cost accounting Reductions to reach 1990 GHG level
Reductions to reach 10% below 1990 GHG level

April 30, 2008 23
Multi-Sector GHG Abatement
Impact of energy savings in GHG cost-effectiveness curves (Why aren’t “no regrets” technologies more widely adopted?):
Slow diffusion of technologies
Information availability
Consumers do not value or consider future energy savings
Principal-agent problem (purchaser ≠ energy-saver)
Other technology costs/limitations that are not included
Institutional barriers
“Efficiency gap” factors:
-150
-100
-50
0
50
100
150
200
0 500 1000 1500 2000 2500 3000 3500 4000 4500 5000
GHG reductions in 2030, all sectors (million tonne CO2e/year)
Cos
t eff
ectiv
enes
s ($
2008
/tonn
e C
O 2e
)
Initial cost accountingLifetime cost accounting
Reductions to reach 1990 GHG level
Reductions to reach 10% below 1990 GHG level
April 30, 2008 24
Multi-Sector GHG Abatement
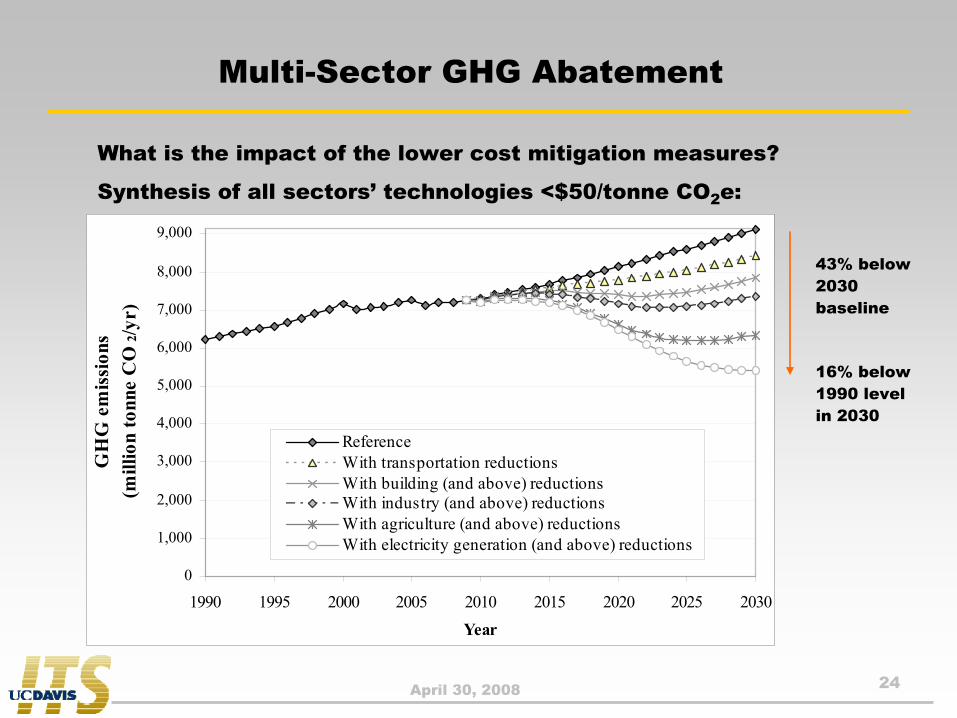
What is the impact of the lower cost mitigation measures?
Synthesis of all sectors’ technologies <$50/tonne CO2e:
43% below 2030 baseline
16% below 1990 level in 2030
0
1,000
2,000
3,000
4,000
5,000
6,000
7,000
8,000
9,000
1990 1995 2000 2005 2010 2015 2020 2025 2030Year
GH
G e
mis
sion
s (m
illio
n to
nne
CO
2/yr
)
ReferenceWith transportation reductionsWith building (and above) reductionsWith industry (and above) reductionsWith agriculture (and above) reductionsWith electricity generation (and above) reductions

April 30, 2008 25
Synthesis of all sectors’ GHG cost-effectiveness curves (selected transportation measures highlighted):
Multi-Sector GHG Abatement
-150
-100
-50
0
50
100
0 500 1000 1500 2000 2500 3000 3500 4000 4500
GHG reductions in 2030, all sectors (million tonne CO2e/year)
Cos
t effe
ctiv
enes
s ($
2008
/tonn
e C
O 2e
)
HD truck (Class 7-8) efficiency
LDV incremental efficiency
LDV "on-road" efficiency
MD truck (Class 3-6) efficiency
Cellulosic ethanol
LDV HEV efficiency A/C refrigerant
Reductions to reach 10% below 1990
GHG level
April 30, 2008 26
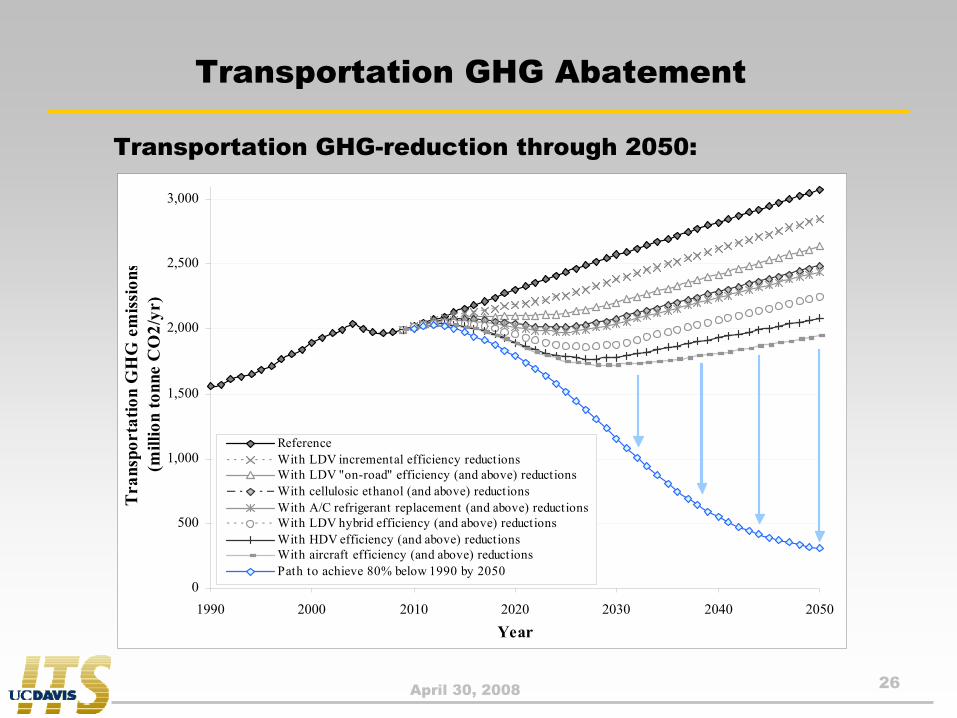
Transportation GHG Abatement
Transportation GHG-reduction through 2050:
0
500
1,000
1,500
2,000
2,500
3,000
1990 2000 2010 2020 2030 2040 2050
Year
Tra
nspo
rtat
ion
GH
G e
mis
sion
s(m
illio
n to
nne
CO
2/yr
)
ReferenceWith LDV incremental efficiency reductionsWith LDV "on-road" efficiency (and above) reductionsWith cellulosic ethanol (and above) reductionsWith A/C refrigerant replacement (and above) reductionsWith LDV hybrid efficiency (and above) reductionsWith HDV efficiency (and above) reductionsWith aircraft efficiency (and above) reductionsPath to achieve 80% below 1990 by 2050
April 30, 2008 27
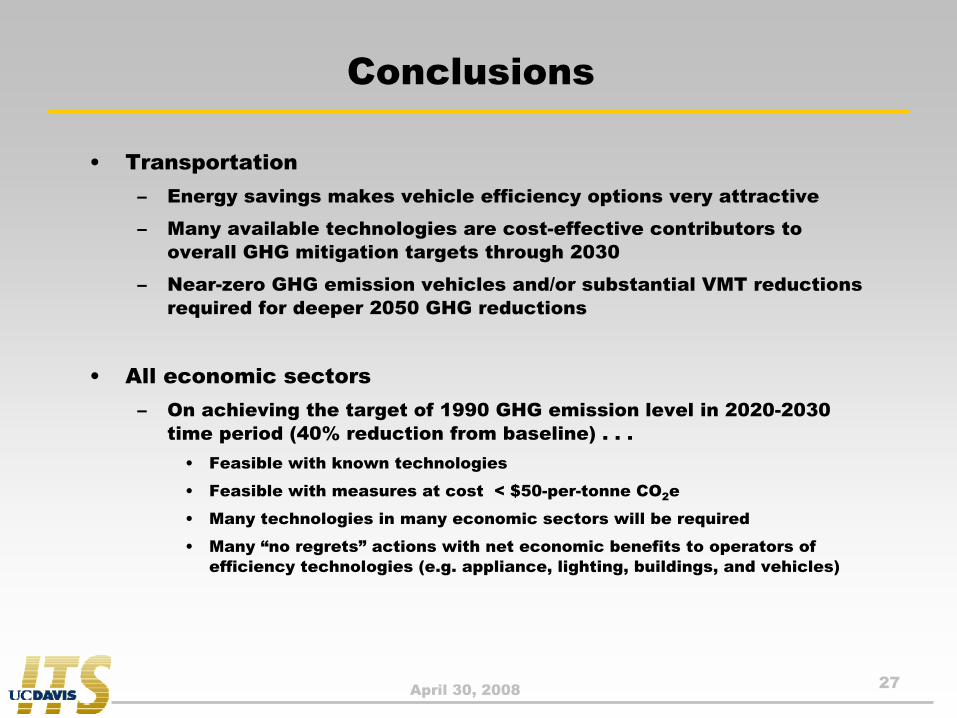
Conclusions
• Transportation– Energy savings makes vehicle efficiency options very attractive
– Many available technologies are cost-effective contributors to overall GHG mitigation targets through 2030
– Near-zero GHG emission vehicles and/or substantial VMT reductions required for deeper 2050 GHG reductions
• All economic sectors– On achieving the target of 1990 GHG emission level in 2020-2030
time period (40% reduction from baseline) . . .• Feasible with known technologies
• Feasible with measures at cost < $50-per-tonne CO2e
• Many technologies in many economic sectors will be required
• Many “no regrets” actions with net economic benefits to operators of efficiency technologies (e.g. appliance, lighting, buildings, and vehicles)

April 30, 2008 28
Conclusions
• Acknowledgements– Dissertation fellowship from ITS-Davis’ Sustainable Transportation
Center (STC), with funding from Caltrans and U.S. DOT
– Dissertation committee members: Dan Sperling, Joan Ogden, and Tim Lipman
• Contact– [email protected]
• Questions?
April 30, 2008 29
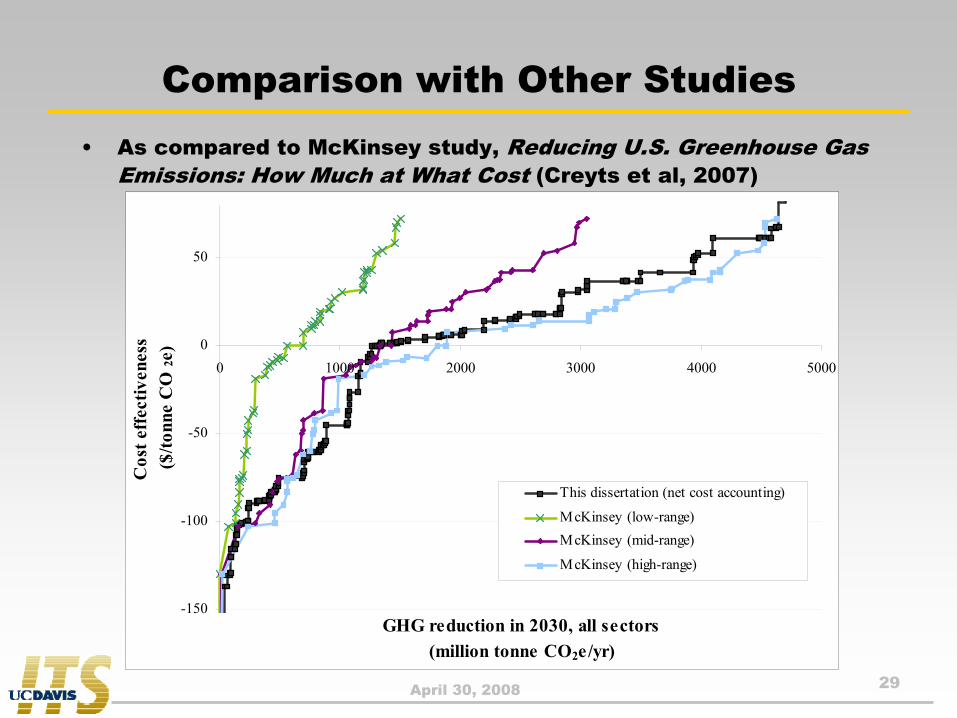
Comparison with Other Studies• As compared to McKinsey study, Reducing U.S. Greenhouse Gas
Emissions: How Much at What Cost (Creyts et al, 2007)
-150
-100
-50
0
50
0 1000 2000 3000 4000 5000
GHG reduction in 2030, all sectors (million tonne CO2e/yr)
Cos
t eff
ectiv
enes
s ($
/tonn
e C
O 2e
)
This dissertation (net cost accounting)
McKinsey (low-range)McKinsey (mid-range)
McKinsey (high-range)
April 30, 2008 30
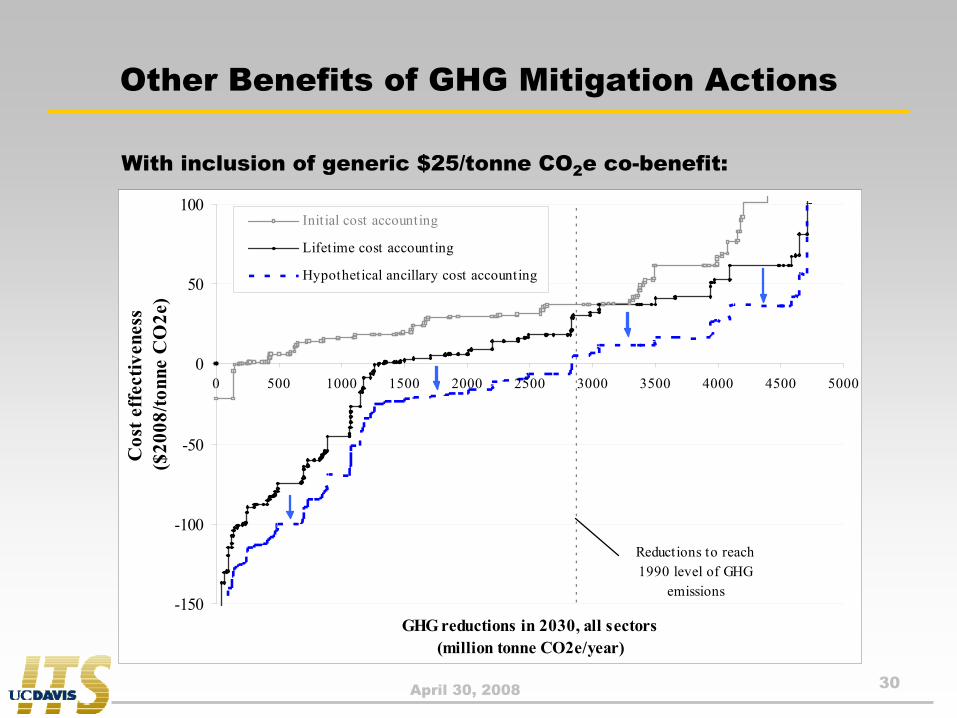
Other Benefits of GHG Mitigation Actions
With inclusion of generic $25/tonne CO2e co-benefit:
-150
-100
-50
0
50
100
0 500 1000 1500 2000 2500 3000 3500 4000 4500 5000
GHG reductions in 2030, all sectors (million tonne CO2e/year)
Cos
t eff
ectiv
enes
s ($
2008
/tonn
e C
O2e
)
Init ial cost accounting
Lifetime cost accounting
Hypothetical ancillary cost accounting
Reductions to reach 1990 level of GHG
emissions
Related Documents