NAICS 323 Prinng and Related Support Acvies Exclusive Commentary from Dr. Joe Webb and Richard Romano 1

Welcome message from author
This document is posted to help you gain knowledge. Please leave a comment to let me know what you think about it! Share it to your friends and learn new things together.
Transcript
NAICS 323
Printing and Related
Support Activities
Exclusive Commentary from Dr. Joe Webb and Richard Romano
1

NAICS 323
Exclusive Commentary
Printing and Related Support Activities [NAICS 323]
This sheet is a rollup of all the different commercial printing markets, including screen, and books, as well as prepress, postpress, and other “support” services. For detailed breakdowns of each of these markets, see the sheets for the individual sub-NAICS categories.
NAICS 323 is defined by the Census as:
Industries in the Printing and Related Support Activities subsector print products, such as newspapers, books, labels, business cards, stationery, business forms, and other materials, and perform support activities, such as data imaging, platemaking services, and bookbinding. The support activities included here are an integral part of the printing industry, and a product (a printing plate, a bound book, or a computer disk or file) that is an integral part of the printing industry is almost always provided by these operations.
Processes used in printing include a variety of methods used to transfer an image from a plate, screen, film, or computer file to some medium, such as paper, plastics, metal, textile articles, or wood. The printing processes employed include, but are not limited to, lithographic, gravure, screen, flexographic, digital, and letterpress. In contrast to many other classification systems that locate publishing of printed materials in manufacturing, NAICS classifies the publishing of printed products in Subsector 511, Publishing Industries (except Internet). Though printing and publishing are often carried out by the same enterprise (a newspaper, for example), it is less and less the case that these distinct activities are carried out in the same establishment. When publishing and printing are done in the same establishment, the establishment is classified in Sector 51, Information, in the appropriate NAICS industry even if the receipts for printing exceed those for publishing.
This subsector includes printing on clothing because the production process for that activity is printing, not clothing manufacturing. For instance, the printing of T-shirts is included in this subsector. In contrast, printing on fabric (or grey goods) is not included. This activity is part of the process of finishing the fabric and is included in the Textile Mills subsector in Industry 31331, Textile and Fabric Finishing Mills.
The commentary below refers to the aggregate data for all of the NAICS that comprise this industry. Each NAICS is covered in separate commentary and data sheets.
2
NAICS 323
Commentary (continued)
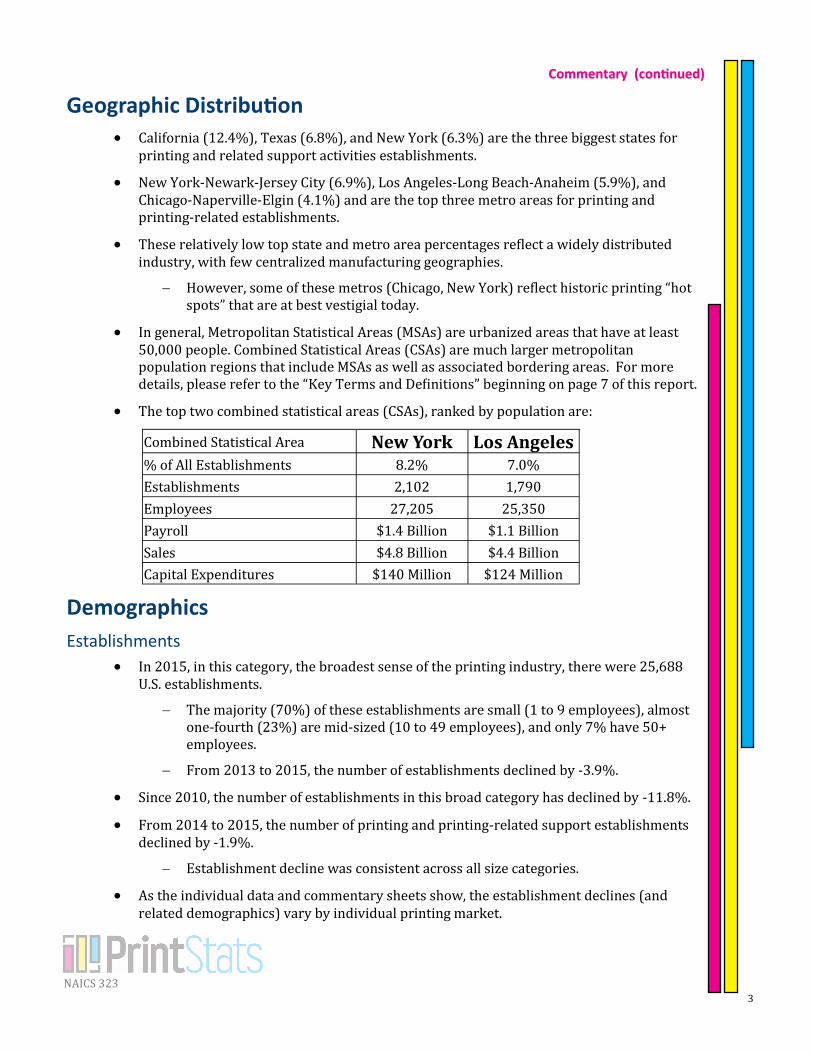
Geographic Distribution • California (12.4%), Texas (6.8%), and New York (6.3%) are the three biggest states for
printing and related support activities establishments.
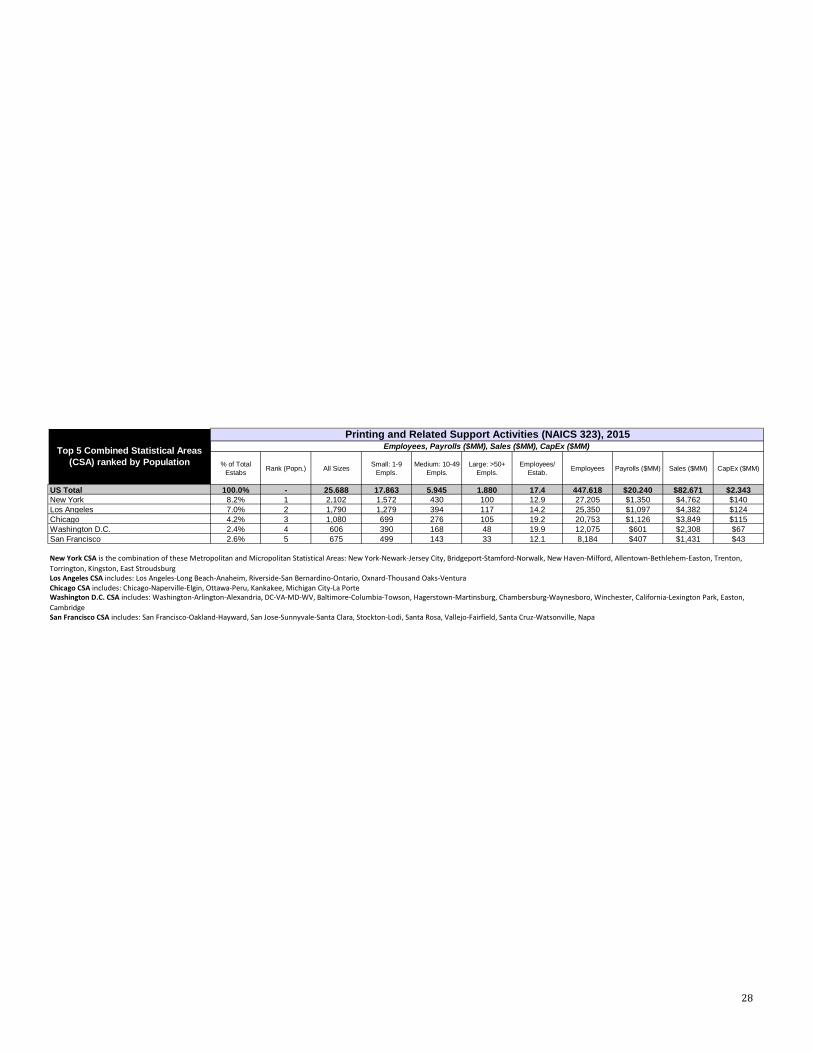
• New York-Newark-Jersey City (6.9%), Los Angeles-Long Beach-Anaheim (5.9%), and Chicago-Naperville-Elgin (4.1%) and are the top three metro areas for printing and printing-related establishments.
• These relatively low top state and metro area percentages reflect a widely distributed industry, with few centralized manufacturing geographies.
However, some of these metros (Chicago, New York) reflect historic printing “hot spots” that are at best vestigial today.
• In general, Metropolitan Statistical Areas (MSAs) are urbanized areas that have at least 50,000 people. Combined Statistical Areas (CSAs) are much larger metropolitan population regions that include MSAs as well as associated bordering areas. For more details, please refer to the “Key Terms and Definitions” beginning on page 7 of this report.
• The top two combined statistical areas (CSAs), ranked by population are:
Demographics
Establishments
• In 2015, in this category, the broadest sense of the printing industry, there were 25,688 U.S. establishments.
The majority (70%) of these establishments are small (1 to 9 employees), almost one-fourth (23%) are mid-sized (10 to 49 employees), and only 7% have 50+ employees.
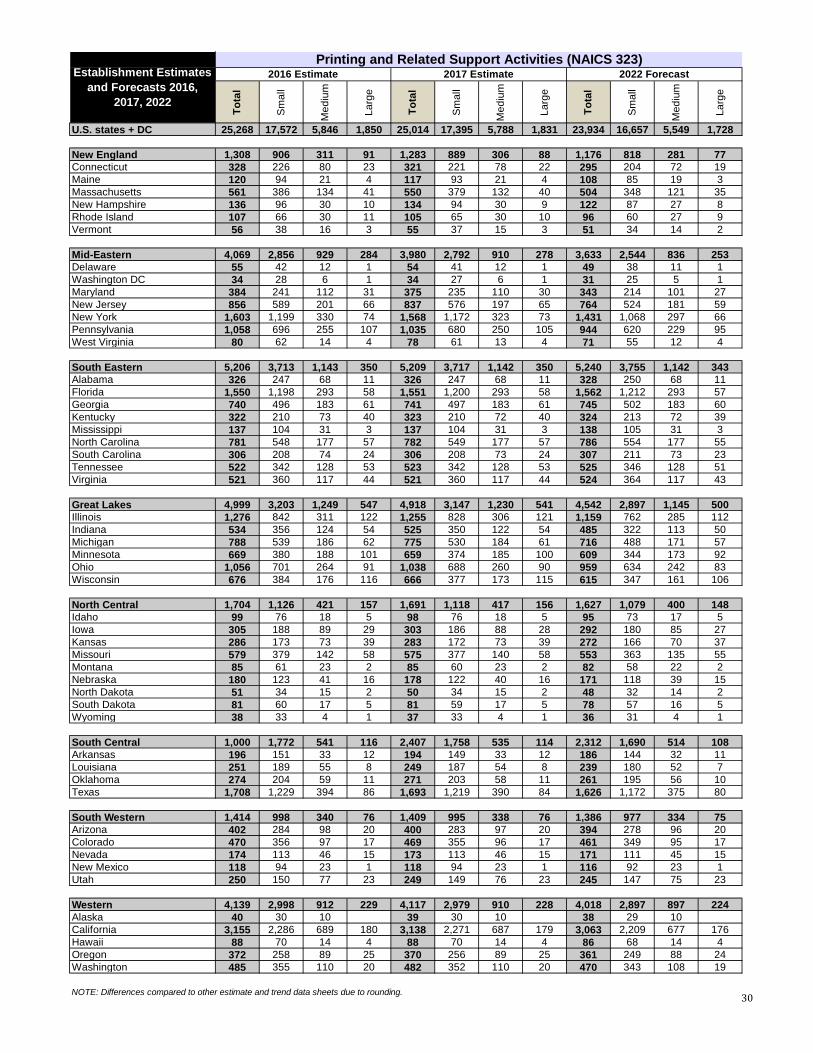
From 2013 to 2015, the number of establishments declined by -3.9%.
• Since 2010, the number of establishments in this broad category has declined by -11.8%.
• From 2014 to 2015, the number of printing and printing-related support establishments declined by -1.9%.
Establishment decline was consistent across all size categories.
• As the individual data and commentary sheets show, the establishment declines (and related demographics) vary by individual printing market.
Combined Statistical Area New York Los Angeles % of All Establishments 8.2% 7.0%
Establishments 2,102 1,790
Employees 27,205 25,350
Payroll $1.4 Billion $1.1 Billion
Sales $4.8 Billion $4.4 Billion
Capital Expenditures $140 Million $124 Million
3

NAICS 323
Commentary (continued)
Employees
• In 2015, there were a total of 447,618 employees in printing and printing-related establishments.
• Since 2010, printing and printing-related employees have declined -10.4%.
From 2014 to 2015, employment has declined -2.4%.
The 250- to 499-employee size class saw a +4.3% increase in employment from 2014 to 2015, likely the result of consolidation.
• Since 2010, payroll in printing and printing-related establishments has stayed somewhat steady.
From 2014 to 2015, payroll grew +0.5%.
Revenues/Value of Shipments
• In 2015, printing and printing-related support activity establishments reported revenues of $82.7 billion.
Large establishments accounted for 68% of revenues, even though they account for 7% of establishments.
Small establishments account for 8% of shipments, even though they account for 70% of establishments.
• Regionally, establishments in the Great Lakes region accounted for nearly one-third (30.3%) of revenues.
• Establishments in the South Western states only accounted for 4.1% of revenues, the lowest U.S. region.
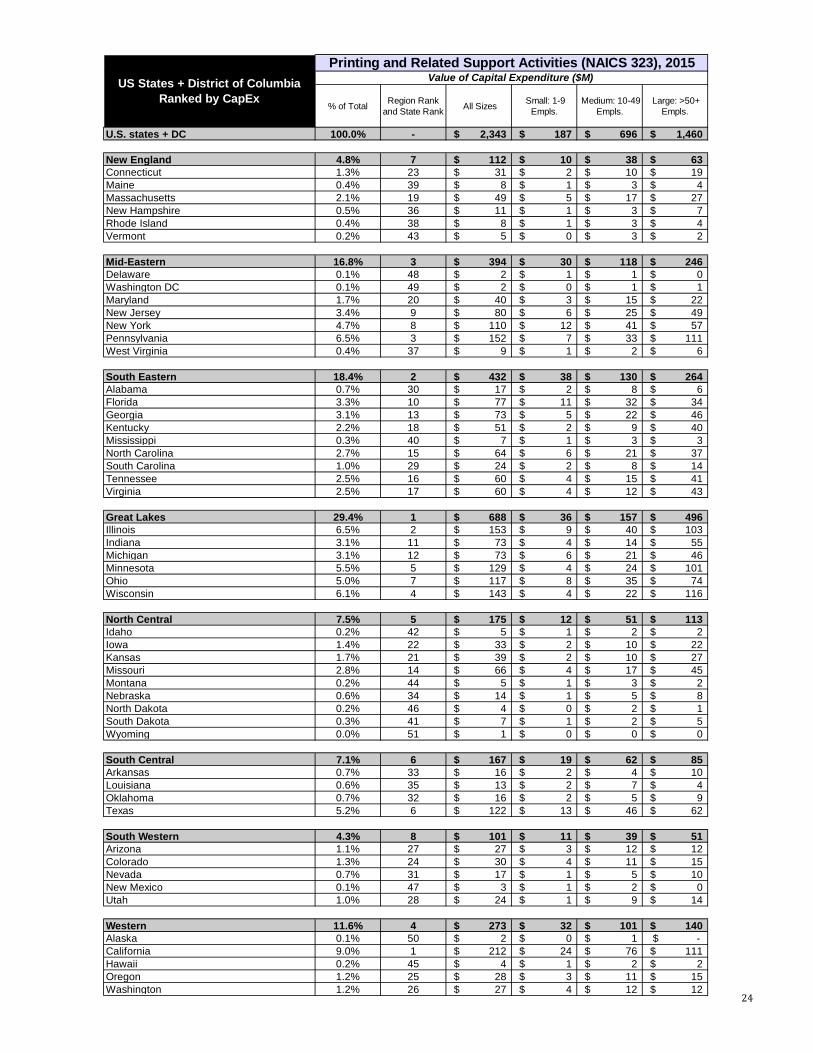
Capital Expenditures
• In 2015, printing and printing-related support activity establishments spent $2.3 billion on capital expenditures.
• 62% of those outlays were by large (50+-employee) establishments, 8% by small establishments.
Technology Impacts and Competitive Trends
General Commercial Printing
• The last “good” year for commercial printing shipments/revenues was 1998 when inflation-adjusted shipments and employees were at all-time highs.
• Impact of the Internet/electronic media on demand for printed materials has been long-documented.
• Digital printing (toner-based) became a driving force for print in late 1990s.
Digital inkjet printing is having a similar effect in 2010s.
4
NAICS 323
Commentary (continued)
• Long-term trend is increasing number of short-run vs. long-run jobs.
Versioning, customization, personalization, targeting are all driving down run lengths.
• Automation in all parts of the enterprise is increasingly mandatory.
• Increasing reliance on automated workflows has not seriously impacted overall employment.
Consolidation and closures are more of a factor on employment levels.
• Migration of some/all aspects of the enterprise to cloud computing is important for maximizing production efficiencies.
As well as improving acquisition appeal.
• Over the past two decades, the industry has seen tremendous consolidation.
• Much of commercial print has been commoditized not by excess production capabilities, but by desktop publishing software, digital photography, and color management that have narrowed the differences between printers especially in output quality.
• Web-to-print/ecommerce increasingly important for print buyers.
Templated approach to commodity print a competitive advantage.
• Focus on “marketing services” a priority for many establishments
However, the challenge is to know what that really means/entails.
• Prepress was brought in-house by content creators 10+ years ago; binding and finishing capabilities are now competitive differentiators.
• New emphasis on expanding into specialty items.
Wide-format printing, sign and display, ad specialties, other unique niches.
Screen Printing
• Growth in printed specialty items is driving this industry.
• Industrial printing also an important component of screen printing.
Demand for shorter runs is driving adoption of digital technologies like UV inkjet presses and digital dye-sublimation.
• Customization and personalization are also major drivers.
• Research conducted by trade associations (like SGIA) have found increases in mixed digital/analog shops.
• Versatility of digital technologies allows screen printers to expand the range of products they can offer.
• Digital technologies also increase competition from shops outside traditional screen.
5

NAICS 323
Commentary (continued)
Book Printing
• Small/self-publishing driving a lot of book publishing today.
• Digital printing transforming “vanity” publishing into a viable publishing model.
• Book printing was seen as an early market for production inkjet.
Penetration of inkjet into book printing continues.
• Amazon CreateSpace and other online book publishing/distribution sites enabling growth.
• Competition from ebooks is more acute in small/self-publishing than mainstream trade book publishing.
Support Activities for Print (Prepress/Postpress)
• The combination of both pre- and postpress services in this classification obscures overall trends.
• Prepress services as a business class have been declining since the 1990s.
• Postpress services such as binding and finishing are faring better thanks to better automation and the resulting productivity.
As well as the growth of “digital embellishments” (Scodix, MGI, Highcon).
• Competition for businesses in this category comes from printers insourcing these abilities.
• Prepress is the most susceptible to insourcing—if not complete elimination—although some film output still exists.
• As printers adopt digital printing—especially production inkjet—complementary finishing capabilities, inline or nearline, are becoming top considerations. even though they account for 7% of establishments.
• Offering digital embellishment services is perhaps the best competitive advantage for businesses specializing in finishing.
6

NAICS 323
Key Terms and Definitions
Annual Survey of Manufactures (Source) - The Annual Survey of Manufactures (ASM) provides key intercensal measures of manufacturing activity, products, and
location for the public and private sectors. The ASM provides the best measure of current U.S. manufacturing industry
outputs, inputs, operating status, and is the primary basis for updates of the Longitudinal Research Database (LRD). Census
Bureau staff and academic researchers use the LRD for micro data analysis.
Statistics are available on a sample universe of manufacturing establishments with one or more paid employees at any time
during the year for manufacturing classified in NAICS sectors 31–33. Employment, payroll, hours, cost of materials, receipts,
value added, capital expenditures, and relative standard errors data are available for the U.S. and states at the 2- through 4-
digit NAICS levels. Product shipments value data are available at the 6-digit North American Industry Classification System
(NAICS) level and 7-digit NAICS product class levels based on NAICS.
The ASM is conducted annually, except for years ending in 2 and 7, at which time ASM data are included in the manufacturing
sector of the Economic Census.
Consolidated (or Combined) Statistical Area (CSA) - Consolidated Statistical Areas are a combination of metropolitan areas that have significant economic interaction and
dependency. PrintStats includes the top five CSAs in each report based on total population, without regard to the number of
industry establishments. These CSAs are very large, and in fact, larger than many countries. These are the details of their
composition:
• New York CSA is the combination of these Metropolitan and Micropolitan Statistical Areas: New York-Newark-
Jersey City, Bridgeport-Stamford-Norwalk, New Haven-Milford, Allentown-Bethlehem-Easton, Trenton,
Torrington, Kingston, East Stroudsburg
• Los Angeles CSA includes: Los Angeles-Long Beach-Anaheim, Riverside-San Bernardino-Ontario, Oxnard-
Thousand Oaks-Ventura
• Chicago CSA includes: Chicago-Naperville-Elgin, Ottawa-Peru, Kankakee, Michigan City-La Porte
• Washington D.C. CSA includes: Washington-Arlington-Alexandria, DC-VA-MD-WV, Baltimore-Columbia-
Towson, Hagerstown-Martinsburg, Chambersburg-Waynesboro, Winchester, California-Lexington Park, Easton,
Cambridge
• San Francisco CSA includes: San Francisco-Oakland-Hayward, San Jose-Sunnyvale-Santa Clara, Stockton-Lodi,
Santa Rosa, Vallejo-Fairfield, Santa Cruz-Watsonville, Napa
(see also Metropolitan Statistical Area)
Content Creation (Source) - The contribution of information to any medium/media, especially to digital media for an end-user/audience in specific
contexts. “Content” can be text, photographic images, illustrations, graphic design, video, or any other intellectual property.
Typical forms of modern content creation include maintaining and updating web sites, blogging, photography, videography,
online commentary, the maintenance of social media accounts, and editing and distribution of digital media.
County Business Patterns [CBP] (Source) - CBP is an annual series that provides subnational economic data by industry. This series includes the number of
establishments, employment during the week of March 12, first quarter payroll, and annual payroll.
7

NAICS 323
Key Terms and Definitions (continued)
Demographics (Source) - The statistical characteristics of human populations (such as age or income) used especially to identify markets. In business, a
particular market or segment of the population.
Economic Census (Source) - The Economic Census is the U.S. Government's official five-year measure of American business and the economy. It is
conducted by the U.S. Census Bureau, and response is required by law.
Employee (Source) - An individual hired by another individual or business usually for wages or salary and in a position below the executive level.
Establishment (Source) - An establishment is a single physical location at which business is conducted or where services or industrial operations are
performed. It is not necessarily identical with a company or enterprise, which may consist of one or more establishments.
Estimate (Source) - A value that is usable for some purpose even if input data may be incomplete, uncertain, or unstable. The value is nonetheless
usable because it is derived from the best information available. Typically, deriving an estimate involves using the value of a
statistic derived from a sample to estimate the value of a corresponding population parameter. The sample provides
information that can be projected, through various formal or informal processes, to determine a range most likely to describe
the missing information.
Forecast (Source) - Forecasting is the use of historic data to determine the direction of future trends. Businesses use forecasting to determine
how to allocate their budgets or plan for anticipated expenses for an upcoming period of time. This is typically based on the
projected demand for the goods and services they offer.
In terms of PrintStats, the forecasts are limited to statistical trends based on past statistical data. They are not forecasts based
on industry surveys or assessment of economic, social, or technological changes. The PrintStats forecast data should be
viewed only as a starting point for a formal forecast process.
M3 Manufacturing Survey (Source) - The Manufacturers’ Shipments, Inventories, and Orders (M3) survey provides broad-based, monthly statistical data on
economic conditions in the domestic manufacturing sector. The survey measures current industrial activity and provides an
indication of future business trends.
Metropolitan Area (Source) - A metropolitan area, sometimes referred to as a metro area or commuter belt, is a region consisting of a densely populated
urban core and its less-populated surrounding territories, sharing industry, infrastructure, and housing. A metro area usually
comprises multiple jurisdictions and municipalities: neighborhoods, townships, boroughs, cities, towns, exurbs, suburbs,
counties, districts, states, and even nations like the eurodistricts. As social, economic, and political institutions have changed,
metropolitan areas have become key economic and political regions. Metropolitan areas include one or more urban areas, as
well as satellite cities, towns, and intervening rural areas that are socio-economically tied to the urban core, typically
measured by commuting patterns.
8
NAICS 323
Key Terms and Definitions (continued)
Metropolitan Statistical Area [MSA] (Source) - In the United States, a metropolitan statistical area (MSA) is a geographical region with a relatively high population density at
its core and close economic ties throughout the area. Such regions are neither legally incorporated as a city or town would
be, nor are they legal administrative divisions like counties or separate entities such as states. As such, the precise definition
of any given metropolitan area can vary with the source. A typical metropolitan area is centered on a single large city that
wields substantial influence over the region (e.g., Chicago or Atlanta). However, some metropolitan areas contain more than
one large city with no single municipality holding a substantially dominant position (e.g., Dallas–Fort Worth metroplex,
Norfolk-Virginia Beach [Hampton Roads], Riverside–San Bernardino [Inland Empire], or Minneapolis–Saint Paul).
MSAs are defined by the Office of Management and Budget (OMB) and used by the Census Bureau and other Federal
government agencies for statistical purposes.
(See also Consolidated Statistical Area)
NAICS (Source) - The North American Industry Classification System (NAICS) is the standard used by Federal statistical agencies in classifying
business establishments for the purpose of collecting, analyzing, and publishing statistical data related to the U.S. business
economy.
Nonemployer Statistics (Source) - Nonemployer Statistics is an annual series that provides subnational economic data for businesses that have no paid
employees and are subject to Federal income tax. The data consist of the number of businesses and total receipts by industry.
Most nonemployers are self-employed individuals operating unincorporated businesses (known as sole proprietorships),
which may or may not be the owner's principal source of income.
The majority of all business establishments in the United States are nonemployers, yet these firms average less than 4
percent of all sales and receipts nationally. Due to their small economic impact, these firms are excluded from most other
Census Bureau business statistics (the primary exception being the Survey of Business Owners). The Nonemployers Statistics
series is the primary resource available to study the scope and activities of nonemployers at a detailed geographic level. For
complementary statistics on the firms that do have paid employees, refer to the County Business Patterns. Additional sources
of data on small businesses include the Economic Census, and the Statistics of U.S. Businesses.
Packaging (Source) - Packaging is the technology of enclosing or protecting products for distribution, storage, sale, and use. Packaging also refers
to the process of designing, evaluating, and producing packages. Packaging can be described as a coordinated system of
preparing goods for transport, warehousing, logistics, sale, and end use. In the graphic arts, packaging refers to the design,
manufacturing, and decoration (usually via printing and related technologies) of corrugated paperboard containers, folding
cardboard cartons and containers, paper bags, flexible plastic packaging, and other paper, paperboard, and plastic materials.
Payroll (Source) - Payroll is the sum total of all compensation a business must pay to its employees for a set period of time or on a given date.
Payroll is reported before deductions for social security, income tax, insurance, union dues, etc. This definition of payroll is
the same as that used by the Internal Revenue Service.
9
NAICS 323
Key Terms and Definitions (continued)
Quarterly Census of Employment and Wages [QCEW] (Source) - The Quarterly Census of Employment and Wages (QCEW) program publishes a quarterly count of employment and wages
reported by employers covering more than 95 percent of U.S. jobs, available at the county, MSA, state, and national levels by
industry.
Quarterly Services Survey (Source) - The Quarterly Services Survey (QSS) is the only source of service industry indicator performance providing timely estimates
of revenue and expenses for selected service industries. The QSS is a principal economic indicator series that produces, for
selected service industries, quarterly estimates of total operating revenue and the percentage of revenue by class of
customer (government, business, consumers, and individuals). The survey also produces estimates of total operating
expenses from tax-exempt firms in industries that have a large not-for-profit component. In addition, for hospital services,
the survey estimates the number of inpatient days and discharges.
Region (Source) - Census Regions are groupings of states and the District of Columbia that subdivide the United States for the presentation of
Census data. There are four Census regions—Northeast, Midwest, South, and West. Each of the four Census regions is
divided into two or more Census divisions. Each Census region is identified by a single-digit Census code. Puerto Rico and
the Island Areas are not part of any Census region or Census division.
PrintStats uses eight regions based on industrial economic activity rather than the Census regions. The 50 U.S. states and
District of Columbia are allocated as follows:
• New England: Connecticut, Maine, Massachusetts, New Hampshire, Rhode Island, Vermont
• Mid-Eastern: Delaware, District of Columbia, Maryland, New Jersey, New York, Pennsylvania, West Virginia
• South Eastern: Alabama, Florida, Georgia, Kentucky, Mississippi, North Carolina, South Carolina, Tennessee,
Virginia
• Great Lakes: Illinois, Indiana, Michigan, Minnesota, Ohio, Wisconsin
• North Central: Idaho, Iowa, Kansas, Missouri, Montana, Nebraska, North Dakota, South Dakota, Wyoming
• South Central: Arkansas, Louisiana, Oklahoma, Texas
• South Western: Arizona, Colorado, Nevada, New Mexico, Utah
• Western: Alaska, California, Hawaii, Oregon, Washington
10
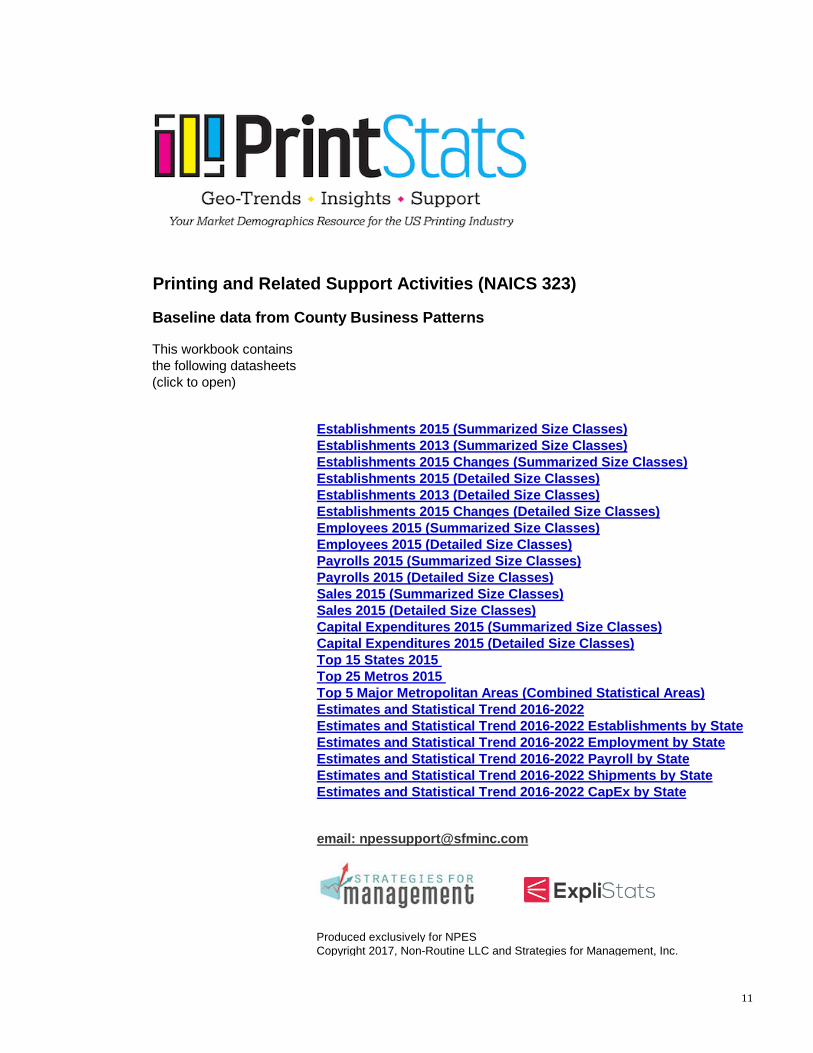
Printing and Related Support Activities (NAICS 323)
Baseline data from County Business Patterns
This workbook contains the following datasheets (click to open)
Establishments 2015 (Summarized Size Classes)Establishments 2013 (Summarized Size Classes)Establishments 2015 Changes (Summarized Size Classes)Establishments 2015 (Detailed Size Classes)Establishments 2013 (Detailed Size Classes)Establishments 2015 Changes (Detailed Size Classes)Employees 2015 (Summarized Size Classes)Employees 2015 (Detailed Size Classes)Payrolls 2015 (Summarized Size Classes)Payrolls 2015 (Detailed Size Classes)Sales 2015 (Summarized Size Classes)Sales 2015 (Detailed Size Classes)Capital Expenditures 2015 (Summarized Size Classes)Capital Expenditures 2015 (Detailed Size Classes)Top 15 States 2015 Top 25 Metros 2015 Top 5 Major Metropolitan Areas (Combined Statistical Areas)Estimates and Statistical Trend 2016-2022Estimates and Statistical Trend 2016-2022 Establishments by StateEstimates and Statistical Trend 2016-2022 Employment by StateEstimates and Statistical Trend 2016-2022 Payroll by StateEstimates and Statistical Trend 2016-2022 Shipments by StateEstimates and Statistical Trend 2016-2022 CapEx by State
email: [email protected]
Produced exclusively for NPESCopyright 2017, Non-Routine LLC and Strategies for Management, Inc.
11
% of Total Region Rank and State Rank All Sizes Small: 1-9
Empls.Medium: 10-49
Empls.Large: >50+
Empls.
Avg. Employees/
Estab.
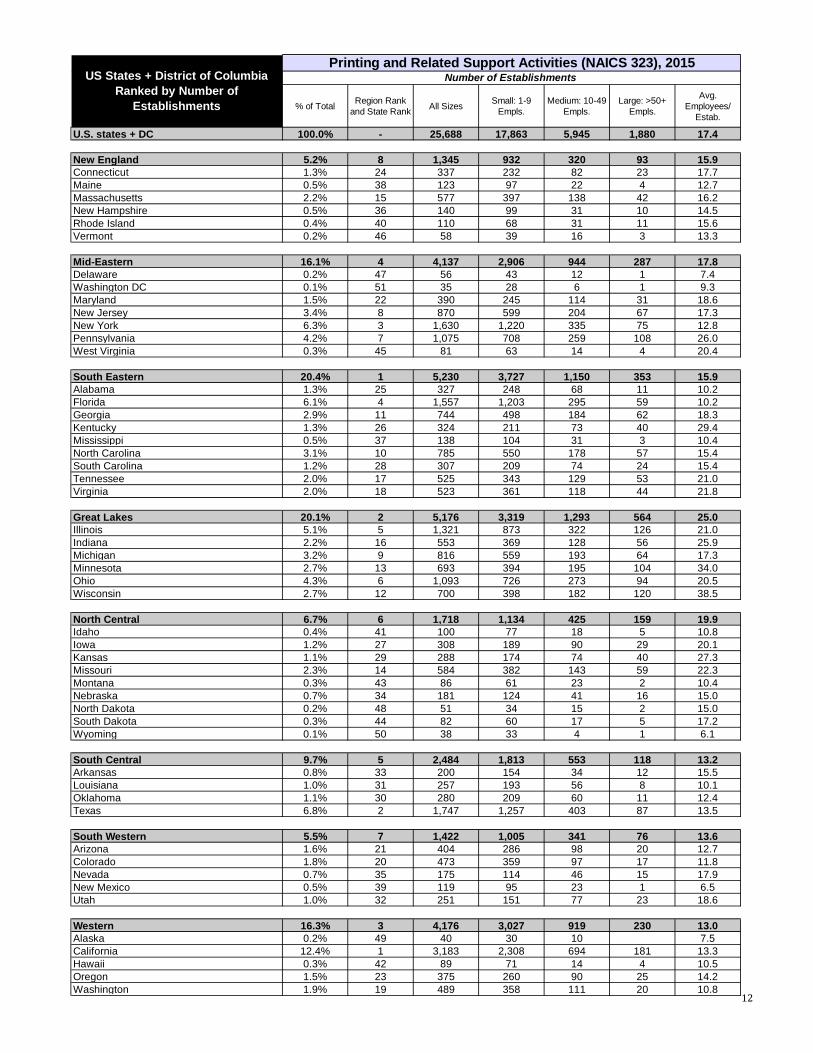
U.S. states + DC 100.0% - 25,688 17,863 5,945 1,880 17.4
New England 5.2% 8 1,345 932 320 93 15.9 Connecticut 1.3% 24 337 232 82 23 17.7 Maine 0.5% 38 123 97 22 4 12.7 Massachusetts 2.2% 15 577 397 138 42 16.2 New Hampshire 0.5% 36 140 99 31 10 14.5 Rhode Island 0.4% 40 110 68 31 11 15.6 Vermont 0.2% 46 58 39 16 3 13.3
Mid-Eastern 16.1% 4 4,137 2,906 944 287 17.8 Delaware 0.2% 47 56 43 12 1 7.4 Washington DC 0.1% 51 35 28 6 1 9.3 Maryland 1.5% 22 390 245 114 31 18.6 New Jersey 3.4% 8 870 599 204 67 17.3 New York 6.3% 3 1,630 1,220 335 75 12.8 Pennsylvania 4.2% 7 1,075 708 259 108 26.0 West Virginia 0.3% 45 81 63 14 4 20.4
South Eastern 20.4% 1 5,230 3,727 1,150 353 15.9 Alabama 1.3% 25 327 248 68 11 10.2 Florida 6.1% 4 1,557 1,203 295 59 10.2 Georgia 2.9% 11 744 498 184 62 18.3 Kentucky 1.3% 26 324 211 73 40 29.4 Mississippi 0.5% 37 138 104 31 3 10.4 North Carolina 3.1% 10 785 550 178 57 15.4 South Carolina 1.2% 28 307 209 74 24 15.4 Tennessee 2.0% 17 525 343 129 53 21.0 Virginia 2.0% 18 523 361 118 44 21.8
Great Lakes 20.1% 2 5,176 3,319 1,293 564 25.0 Illinois 5.1% 5 1,321 873 322 126 21.0 Indiana 2.2% 16 553 369 128 56 25.9 Michigan 3.2% 9 816 559 193 64 17.3 Minnesota 2.7% 13 693 394 195 104 34.0 Ohio 4.3% 6 1,093 726 273 94 20.5 Wisconsin 2.7% 12 700 398 182 120 38.5
North Central 6.7% 6 1,718 1,134 425 159 19.9 Idaho 0.4% 41 100 77 18 5 10.8 Iowa 1.2% 27 308 189 90 29 20.1 Kansas 1.1% 29 288 174 74 40 27.3 Missouri 2.3% 14 584 382 143 59 22.3 Montana 0.3% 43 86 61 23 2 10.4 Nebraska 0.7% 34 181 124 41 16 15.0 North Dakota 0.2% 48 51 34 15 2 15.0 South Dakota 0.3% 44 82 60 17 5 17.2 Wyoming 0.1% 50 38 33 4 1 6.1
South Central 9.7% 5 2,484 1,813 553 118 13.2 Arkansas 0.8% 33 200 154 34 12 15.5 Louisiana 1.0% 31 257 193 56 8 10.1 Oklahoma 1.1% 30 280 209 60 11 12.4 Texas 6.8% 2 1,747 1,257 403 87 13.5
South Western 5.5% 7 1,422 1,005 341 76 13.6 Arizona 1.6% 21 404 286 98 20 12.7 Colorado 1.8% 20 473 359 97 17 11.8 Nevada 0.7% 35 175 114 46 15 17.9 New Mexico 0.5% 39 119 95 23 1 6.5 Utah 1.0% 32 251 151 77 23 18.6
Western 16.3% 3 4,176 3,027 919 230 13.0 Alaska 0.2% 49 40 30 10 7.5 California 12.4% 1 3,183 2,308 694 181 13.3 Hawaii 0.3% 42 89 71 14 4 10.5 Oregon 1.5% 23 375 260 90 25 14.2 Washington 1.9% 19 489 358 111 20 10.8
US States + District of Columbia Ranked by Number of
Establishments
Printing and Related Support Activities (NAICS 323), 2015Number of Establishments
12

% of Total Region Rank and State Rank All Sizes Small: 1-9
Empls.Medium: 10-49
Empls.Large: >50+
Empls.
Avg. Employees/
Estab.
U.S. states + DC 100.0% - 26,718 18,653 6,131 1,934 17.3
New England 5.3% 8 1,429 999 331 99 15.4 Connecticut 1.4% 24 362 255 82 25 16.0 Maine 0.5% 38 127 98 25 4 10.0 Massachusetts 2.3% 14 611 414 149 48 17.2 New Hampshire 0.5% 37 146 105 32 9 14.4 Rhode Island 0.4% 40 120 83 29 8 12.2 Vermont 0.2% 46 63 44 14 5 13.4
Mid-Eastern 16.4% 3 4,386 3,059 1,006 321 17.6 Delaware 0.2% 48 53 38 14 1 8.3 Washington DC 0.1% 51 35 29 5 1 9.1 Maryland 1.6% 21 440 278 124 38 18.4 New Jersey 3.4% 8 901 606 225 70 17.2 New York 6.5% 3 1,724 1,297 336 91 13.2 Pennsylvania 4.3% 6 1,147 744 286 117 25.1 West Virginia 0.3% 43 86 67 16 3 17.7
South Eastern 20.1% 2 5,370 3,872 1,164 334 15.6 Alabama 1.2% 25 333 253 69 11 11.3 Florida 5.8% 4 1,549 1,201 287 61 10.6 Georgia 2.8% 11 758 522 182 54 16.6 Kentucky 1.2% 25 333 215 82 36 30.4 Mississippi 0.6% 36 147 110 34 3 9.9 North Carolina 3.2% 10 846 618 175 53 14.3 South Carolina 1.2% 27 314 221 71 22 13.9 Tennessee 2.1% 17 554 369 138 47 20.4 Virginia 2.0% 18 536 363 126 47 21.3
Great Lakes 20.3% 1 5,429 3,496 1,344 589 24.5 Illinois 5.3% 5 1,413 935 337 141 21.7 Indiana 2.2% 16 584 394 135 55 25.0 Michigan 3.2% 9 861 605 195 61 15.9 Minnesota 2.6% 13 703 395 194 114 33.6 Ohio 4.2% 7 1,135 741 291 103 20.1 Wisconsin 2.7% 12 733 426 192 115 37.4
North Central 6.6% 6 1,774 1,186 417 171 20.0 Idaho 0.4% 41 106 77 24 5 10.0 Iowa 1.1% 29 304 186 84 34 22.8 Kansas 1.1% 28 305 194 70 41 24.3 Missouri 2.3% 15 610 402 143 65 23.2 Montana 0.3% 44 84 63 20 1 9.7 Nebraska 0.7% 34 182 122 45 15 14.6 North Dakota 0.2% 47 57 42 12 3 13.3 South Dakota 0.3% 44 84 62 16 6 16.6 Wyoming 0.2% 49 42 38 3 1 6.5
South Central 9.5% 5 2,536 1,864 553 119 12.7 Arkansas 0.8% 33 203 156 35 12 16.8 Louisiana 1.0% 31 272 208 56 8 9.1 Oklahoma 1.0% 30 279 205 60 14 13.5 Texas 6.7% 2 1,782 1,295 402 85 12.6
South Western 5.5% 7 1,471 1,042 352 77 13.0 Arizona 1.6% 22 427 309 95 23 12.0 Colorado 1.8% 20 490 367 104 19 11.3 Nevada 0.6% 35 172 108 52 12 17.0 New Mexico 0.5% 38 127 106 20 1 6.2 Utah 1.0% 32 255 152 81 22 18.6
Western 16.2% 4 4,323 3,135 964 224 13.2 Alaska 0.1% 50 40 34 6 7.7 California 12.3% 1 3,285 2,380 729 176 13.6 Hawaii 0.3% 42 91 69 18 4 10.2 Oregon 1.5% 23 391 279 90 22 13.5 Washington 1.9% 19 516 373 121 22 11.4
US States + District of Columbia Ranked by Number of
Establishments
Printing and Related Support Activities (NAICS 323), 2013Number of Establishments
13

Region Rank and State Rank All Sizes Small: 1-9
Empls.Medium: 10-49
Empls.Large: >50+
Empls.
Avg. Employees/
Estab.
U.S. states + DC - (1,030) (790) (186) (54) 0.1
New England 4 (84) (67) (11) (6) 0.5 Connecticut 23 (25) (23) (2) 1.6 Maine 10 (4) (1) (3) 2.7 Massachusetts 29 (34) (17) (11) (6) (1.0)New Hampshire 12 (6) (6) (1) 1 0.0 Rhode Island 16 (10) (15) 2 3 3.4 Vermont 11 (5) (5) 2 (2) (0.1)
Mid-Eastern 7 (249) (153) (62) (34) 0.1 Delaware 3 3 5 (2) (0.9)Washington DC 6 (1) 1 0.3 Maryland 33 (50) (33) (10) (7) 0.2 New Jersey 27 (31) (7) (21) (3) 0.1 New York 37 (94) (77) (1) (16) (0.4)Pennsylvania 35 (72) (36) (27) (9) 0.8 West Virginia 12 (5) (4) (2) 1 2.8
South Eastern 5 (140) (145) (14) 19 0.3 Alabama 13 (6) (5) (1) (1.2)Florida 1 8 2 8 (2) (0.5)Georgia 18 (14) (24) 2 8 1.7 Kentucky 15 (9) (4) (9) 4 (1.1)Mississippi 16 (9) (6) (3) 0.5 North Carolina 34 (61) (68) 3 4 1.1 South Carolina 13 (7) (12) 3 2 1.5 Tennessee 26 (29) (26) (9) 6 0.6 Virginia 17 (13) (2) (8) (3) 0.6
Great Lakes 8 (253) (177) (51) (25) 0.5 Illinois 36 (92) (62) (15) (15) (0.7)Indiana 28 (31) (25) (7) 1 1.0 Michigan 32 (45) (46) (2) 3 1.4 Minnesota 17 (10) (1) 1 (10) 0.4 Ohio 31 (42) (15) (18) (9) 0.3 Wisconsin 28 (33) (28) (10) 5 1.1
North Central 3 (56) (52) 8 (12) (0.1)Idaho 13 (6) (6) 0.8 Iowa 2 4 3 6 (5) (2.7)Kansas 21 (17) (20) 4 (1) 3.0 Missouri 24 (26) (20) (6) (0.9)Montana 4 2 (2) 3 1 0.7 Nebraska 7 (1) 2 (4) 1 0.5 North Dakota 13 (6) (8) 3 (1) 1.7 South Dakota 8 (2) (2) 1 (1) 0.6 Wyoming 11 (4) (5) 1 (0.3)
South Central 2 (52) (51) (1) 0.5 Arkansas 9 (3) (2) (1) (1.3)Louisiana 19 (15) (15) 0.9 Oklahoma 5 1 4 (3) (1.1)Texas 30 (35) (38) 1 2 0.9
South Western 1 (49) (37) (11) (1) 0.6 Arizona 22 (23) (23) 3 (3) 0.6 Colorado 22 (17) (8) (7) (2) 0.6 Nevada 4 3 6 (6) 3 0.8 New Mexico 14 (8) (11) 3 0.3 Utah 11 (4) (1) (4) 1 0.0
Western 6 (147) (108) (45) 6 (0.3)Alaska 7 (4) 4 (0.2)California 38 (102) (72) (35) 5 (0.3)Hawaii 9 (2) 2 (4) 0.3 Oregon 20 (16) (19) 3 0.6 Washington 25 (27) (15) (10) (2) (0.6)
US States + District of Columbia Ranked by Change in Number of
Establishments
Printing and Related Support Activities (NAICS 323), 2015Change in Number of Establishments
14
% of TotalRegion Rank
and State Rank
All Sizes 1-4Empls.
5-9 Empls.
10-19Empls.
20-49Empls.
50-99Empls.
100-249Empls.
250-499Empls.
500+Empls.
Avg. Employees/
Estab.
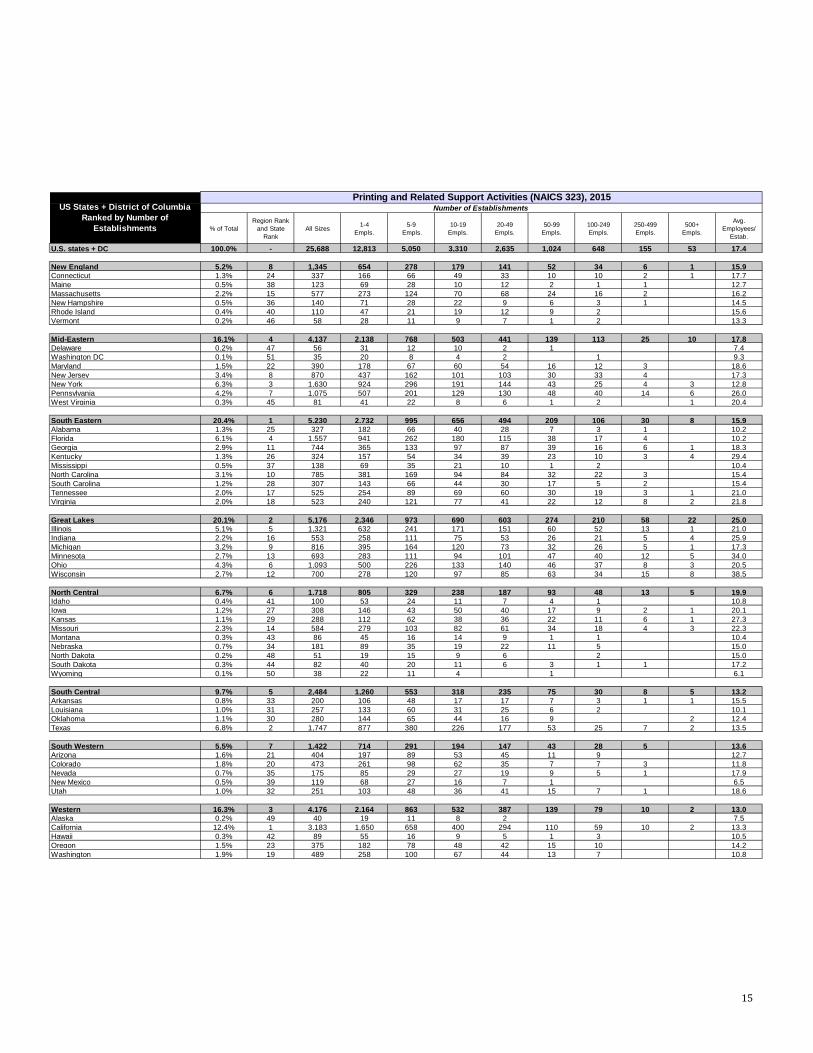
U.S. states + DC 100.0% - 25,688 12,813 5,050 3,310 2,635 1,024 648 155 53 17.4
New England 5.2% 8 1,345 654 278 179 141 52 34 6 1 15.9 Connecticut 1.3% 24 337 166 66 49 33 10 10 2 1 17.7 Maine 0.5% 38 123 69 28 10 12 2 1 1 12.7 Massachusetts 2.2% 15 577 273 124 70 68 24 16 2 16.2 New Hampshire 0.5% 36 140 71 28 22 9 6 3 1 14.5 Rhode Island 0.4% 40 110 47 21 19 12 9 2 15.6 Vermont 0.2% 46 58 28 11 9 7 1 2 13.3
Mid-Eastern 16.1% 4 4,137 2,138 768 503 441 139 113 25 10 17.8 Delaware 0.2% 47 56 31 12 10 2 1 7.4 Washington DC 0.1% 51 35 20 8 4 2 1 9.3 Maryland 1.5% 22 390 178 67 60 54 16 12 3 18.6 New Jersey 3.4% 8 870 437 162 101 103 30 33 4 17.3 New York 6.3% 3 1,630 924 296 191 144 43 25 4 3 12.8 Pennsylvania 4.2% 7 1,075 507 201 129 130 48 40 14 6 26.0 West Virginia 0.3% 45 81 41 22 8 6 1 2 1 20.4
South Eastern 20.4% 1 5,230 2,732 995 656 494 209 106 30 8 15.9 Alabama 1.3% 25 327 182 66 40 28 7 3 1 10.2 Florida 6.1% 4 1,557 941 262 180 115 38 17 4 10.2 Georgia 2.9% 11 744 365 133 97 87 39 16 6 1 18.3 Kentucky 1.3% 26 324 157 54 34 39 23 10 3 4 29.4 Mississippi 0.5% 37 138 69 35 21 10 1 2 10.4 North Carolina 3.1% 10 785 381 169 94 84 32 22 3 15.4 South Carolina 1.2% 28 307 143 66 44 30 17 5 2 15.4 Tennessee 2.0% 17 525 254 89 69 60 30 19 3 1 21.0 Virginia 2.0% 18 523 240 121 77 41 22 12 8 2 21.8
Great Lakes 20.1% 2 5,176 2,346 973 690 603 274 210 58 22 25.0 Illinois 5.1% 5 1,321 632 241 171 151 60 52 13 1 21.0 Indiana 2.2% 16 553 258 111 75 53 26 21 5 4 25.9 Michigan 3.2% 9 816 395 164 120 73 32 26 5 1 17.3 Minnesota 2.7% 13 693 283 111 94 101 47 40 12 5 34.0 Ohio 4.3% 6 1,093 500 226 133 140 46 37 8 3 20.5 Wisconsin 2.7% 12 700 278 120 97 85 63 34 15 8 38.5
North Central 6.7% 6 1,718 805 329 238 187 93 48 13 5 19.9 Idaho 0.4% 41 100 53 24 11 7 4 1 10.8 Iowa 1.2% 27 308 146 43 50 40 17 9 2 1 20.1 Kansas 1.1% 29 288 112 62 38 36 22 11 6 1 27.3 Missouri 2.3% 14 584 279 103 82 61 34 18 4 3 22.3 Montana 0.3% 43 86 45 16 14 9 1 1 10.4 Nebraska 0.7% 34 181 89 35 19 22 11 5 15.0 North Dakota 0.2% 48 51 19 15 9 6 2 15.0 South Dakota 0.3% 44 82 40 20 11 6 3 1 1 17.2 Wyoming 0.1% 50 38 22 11 4 1 6.1
South Central 9.7% 5 2,484 1,260 553 318 235 75 30 8 5 13.2 Arkansas 0.8% 33 200 106 48 17 17 7 3 1 1 15.5 Louisiana 1.0% 31 257 133 60 31 25 6 2 10.1 Oklahoma 1.1% 30 280 144 65 44 16 9 2 12.4 Texas 6.8% 2 1,747 877 380 226 177 53 25 7 2 13.5
South Western 5.5% 7 1,422 714 291 194 147 43 28 5 13.6 Arizona 1.6% 21 404 197 89 53 45 11 9 12.7 Colorado 1.8% 20 473 261 98 62 35 7 7 3 11.8 Nevada 0.7% 35 175 85 29 27 19 9 5 1 17.9 New Mexico 0.5% 39 119 68 27 16 7 1 6.5 Utah 1.0% 32 251 103 48 36 41 15 7 1 18.6
Western 16.3% 3 4,176 2,164 863 532 387 139 79 10 2 13.0 Alaska 0.2% 49 40 19 11 8 2 7.5 California 12.4% 1 3,183 1,650 658 400 294 110 59 10 2 13.3 Hawaii 0.3% 42 89 55 16 9 5 1 3 10.5 Oregon 1.5% 23 375 182 78 48 42 15 10 14.2 Washington 1.9% 19 489 258 100 67 44 13 7 10.8
US States + District of Columbia Ranked by Number of
Establishments
Printing and Related Support Activities (NAICS 323), 2015Number of Establishments
15

% of TotalRegion Rank
and State Rank
All Sizes 1-4Empls.
5-9 Empls.
10-19Empls.
20-49Empls.
50-99Empls.
100-249Empls.
250-499Empls.
500+Empls.
Avg. Employees/
Estab.
U.S. states + DC 100.0% - 26,718 13,416 5,237 3,430 2,701 1,037 689 149 59 17.3
New England 5.3% 8 1,429 699 300 185 146 54 40 4 1 15.4 Connecticut 1.4% 24 362 182 73 45 37 13 10 1 1 16.0 Maine 0.5% 38 127 72 26 13 12 2 2 10.0 Massachusetts 2.3% 14 611 276 138 84 65 25 21 2 17.2 New Hampshire 0.5% 37 146 79 26 20 12 4 4 1 14.4 Rhode Island 0.4% 40 120 57 26 16 13 7 1 12.2 Vermont 0.2% 46 63 33 11 7 7 3 2 13.4
Mid-Eastern 16.4% 3 4,386 2,292 767 560 446 171 112 24 14 17.6 Delaware 0.2% 48 53 28 10 10 4 1 8.3 Washington DC 0.1% 51 35 18 11 3 2 1 9.1 Maryland 1.6% 21 440 202 76 67 57 21 14 3 18.4 New Jersey 3.4% 8 901 460 146 125 100 34 31 5 17.2 New York 6.5% 3 1,724 995 302 191 145 53 30 4 4 13.2 Pennsylvania 4.3% 6 1,147 547 197 156 130 61 35 12 9 25.1 West Virginia 0.3% 43 86 42 25 8 8 1 1 1 17.7
South Eastern 20.1% 2 5,370 2,804 1,068 668 496 181 116 26 11 15.6 Alabama 1.2% 25 333 181 72 40 29 8 1 2 11.3 Florida 5.8% 4 1,549 923 278 188 99 36 22 1 2 10.6 Georgia 2.8% 11 758 378 144 102 80 31 18 3 2 16.6 Kentucky 1.2% 25 333 151 64 38 44 13 15 4 4 30.4 Mississippi 0.6% 36 147 76 34 23 11 1 2 9.9 North Carolina 3.2% 10 846 434 184 90 85 32 18 3 14.3 South Carolina 1.2% 27 314 149 72 43 28 15 6 1 13.9 Tennessee 2.1% 17 554 272 97 67 71 24 16 6 1 20.4 Virginia 2.0% 18 536 240 123 77 49 21 18 6 2 21.3
Great Lakes 20.3% 1 5,429 2,466 1,030 713 631 289 223 54 23 24.5 Illinois 5.3% 5 1,413 687 248 179 158 66 59 12 4 21.7 Indiana 2.2% 16 584 264 130 76 59 25 21 5 4 25.0 Michigan 3.2% 9 861 425 180 107 88 33 20 7 1 15.9 Minnesota 2.6% 13 703 289 106 97 97 58 39 13 4 33.6 Ohio 4.2% 7 1,135 513 228 154 137 49 48 3 3 20.1 Wisconsin 2.7% 12 733 288 138 100 92 58 36 14 7 37.4
North Central 6.6% 6 1,774 825 361 239 178 102 45 18 6 20.0 Idaho 0.4% 41 106 55 22 16 8 4 1 10.0 Iowa 1.1% 29 304 137 49 51 33 19 11 3 1 22.8 Kansas 1.1% 28 305 123 71 37 33 23 12 5 1 24.3 Missouri 2.3% 15 610 285 117 82 61 40 13 8 4 23.2 Montana 0.3% 44 84 41 22 8 12 1 9.7 Nebraska 0.7% 34 182 91 31 25 20 10 5 14.6 North Dakota 0.2% 47 57 26 16 8 4 1 2 13.3 South Dakota 0.3% 44 84 43 19 10 6 4 2 16.6 Wyoming 0.2% 49 42 24 14 2 1 1 6.5
South Central 9.5% 5 2,536 1,336 528 326 227 70 37 11 1 12.7 Arkansas 0.8% 33 203 112 44 21 14 5 4 2 1 16.8 Louisiana 1.0% 31 272 143 65 31 25 6 2 9.1 Oklahoma 1.0% 30 279 148 57 43 17 10 1 3 13.5 Texas 6.7% 2 1,782 933 362 231 171 49 30 6 12.6
South Western 5.5% 7 1,471 742 300 206 146 46 27 4 13.0 Arizona 1.6% 22 427 215 94 58 37 15 8 12.0 Colorado 1.8% 20 490 271 96 64 40 9 8 2 11.3 Nevada 0.6% 35 172 77 31 27 25 7 4 1 17.0 New Mexico 0.5% 38 127 74 32 14 6 1 6.2 Utah 1.0% 32 255 105 47 43 38 14 7 1 18.6
Western 16.2% 4 4,323 2,252 883 533 431 124 89 8 3 13.2 Alaska 0.1% 50 40 17 17 2 4 7.7 California 12.3% 1 3,285 1,708 672 402 327 98 67 8 3 13.6 Hawaii 0.3% 42 91 55 14 13 5 2 2 10.2 Oregon 1.5% 23 391 199 80 43 47 11 11 13.5 Washington 1.9% 19 516 273 100 73 48 13 9 11.4
US States + District of Columbia Ranked by Number of
Establishments
Printing and Related Support Activities (NAICS 323), 2013Number of Establishments
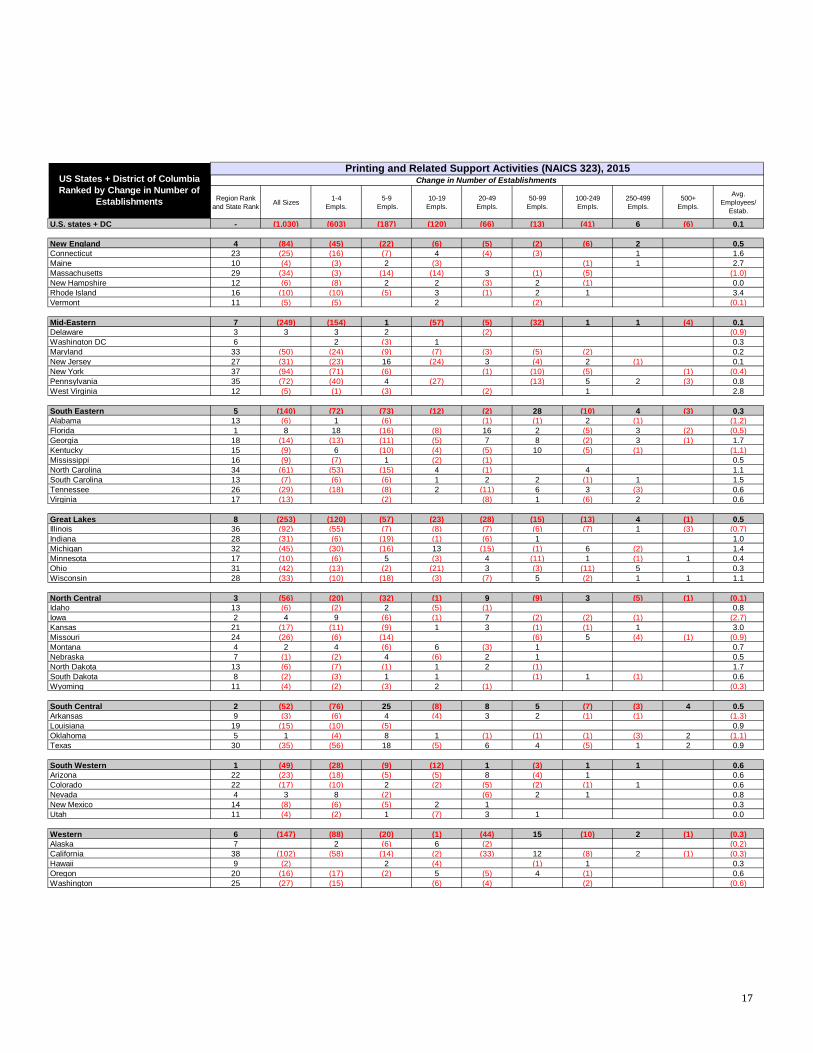
16
Region Rank and State Rank All Sizes 1-4
Empls.5-9
Empls.10-19
Empls.20-49
Empls.50-99
Empls.100-249Empls.
250-499Empls.
500+Empls.
Avg. Employees/
Estab.
U.S. states + DC - (1,030) (603) (187) (120) (66) (13) (41) 6 (6) 0.1
New England 4 (84) (45) (22) (6) (5) (2) (6) 2 0.5 Connecticut 23 (25) (16) (7) 4 (4) (3) 1 1.6 Maine 10 (4) (3) 2 (3) (1) 1 2.7 Massachusetts 29 (34) (3) (14) (14) 3 (1) (5) (1.0)New Hampshire 12 (6) (8) 2 2 (3) 2 (1) 0.0 Rhode Island 16 (10) (10) (5) 3 (1) 2 1 3.4 Vermont 11 (5) (5) 2 (2) (0.1)
Mid-Eastern 7 (249) (154) 1 (57) (5) (32) 1 1 (4) 0.1 Delaware 3 3 3 2 (2) (0.9)Washington DC 6 2 (3) 1 0.3 Maryland 33 (50) (24) (9) (7) (3) (5) (2) 0.2 New Jersey 27 (31) (23) 16 (24) 3 (4) 2 (1) 0.1 New York 37 (94) (71) (6) (1) (10) (5) (1) (0.4)Pennsylvania 35 (72) (40) 4 (27) (13) 5 2 (3) 0.8 West Virginia 12 (5) (1) (3) (2) 1 2.8
South Eastern 5 (140) (72) (73) (12) (2) 28 (10) 4 (3) 0.3 Alabama 13 (6) 1 (6) (1) (1) 2 (1) (1.2)Florida 1 8 18 (16) (8) 16 2 (5) 3 (2) (0.5)Georgia 18 (14) (13) (11) (5) 7 8 (2) 3 (1) 1.7 Kentucky 15 (9) 6 (10) (4) (5) 10 (5) (1) (1.1)Mississippi 16 (9) (7) 1 (2) (1) 0.5 North Carolina 34 (61) (53) (15) 4 (1) 4 1.1 South Carolina 13 (7) (6) (6) 1 2 2 (1) 1 1.5 Tennessee 26 (29) (18) (8) 2 (11) 6 3 (3) 0.6 Virginia 17 (13) (2) (8) 1 (6) 2 0.6
Great Lakes 8 (253) (120) (57) (23) (28) (15) (13) 4 (1) 0.5 Illinois 36 (92) (55) (7) (8) (7) (6) (7) 1 (3) (0.7)Indiana 28 (31) (6) (19) (1) (6) 1 1.0 Michigan 32 (45) (30) (16) 13 (15) (1) 6 (2) 1.4 Minnesota 17 (10) (6) 5 (3) 4 (11) 1 (1) 1 0.4 Ohio 31 (42) (13) (2) (21) 3 (3) (11) 5 0.3 Wisconsin 28 (33) (10) (18) (3) (7) 5 (2) 1 1 1.1
North Central 3 (56) (20) (32) (1) 9 (9) 3 (5) (1) (0.1)Idaho 13 (6) (2) 2 (5) (1) 0.8 Iowa 2 4 9 (6) (1) 7 (2) (2) (1) (2.7)Kansas 21 (17) (11) (9) 1 3 (1) (1) 1 3.0 Missouri 24 (26) (6) (14) (6) 5 (4) (1) (0.9)Montana 4 2 4 (6) 6 (3) 1 0.7 Nebraska 7 (1) (2) 4 (6) 2 1 0.5 North Dakota 13 (6) (7) (1) 1 2 (1) 1.7 South Dakota 8 (2) (3) 1 1 (1) 1 (1) 0.6 Wyoming 11 (4) (2) (3) 2 (1) (0.3)
South Central 2 (52) (76) 25 (8) 8 5 (7) (3) 4 0.5 Arkansas 9 (3) (6) 4 (4) 3 2 (1) (1) (1.3)Louisiana 19 (15) (10) (5) 0.9 Oklahoma 5 1 (4) 8 1 (1) (1) (1) (3) 2 (1.1)Texas 30 (35) (56) 18 (5) 6 4 (5) 1 2 0.9
South Western 1 (49) (28) (9) (12) 1 (3) 1 1 0.6 Arizona 22 (23) (18) (5) (5) 8 (4) 1 0.6 Colorado 22 (17) (10) 2 (2) (5) (2) (1) 1 0.6 Nevada 4 3 8 (2) (6) 2 1 0.8 New Mexico 14 (8) (6) (5) 2 1 0.3 Utah 11 (4) (2) 1 (7) 3 1 0.0
Western 6 (147) (88) (20) (1) (44) 15 (10) 2 (1) (0.3)Alaska 7 2 (6) 6 (2) (0.2)California 38 (102) (58) (14) (2) (33) 12 (8) 2 (1) (0.3)Hawaii 9 (2) 2 (4) (1) 1 0.3 Oregon 20 (16) (17) (2) 5 (5) 4 (1) 0.6 Washington 25 (27) (15) (6) (4) (2) (0.6)
US States + District of Columbia Ranked by Change in Number of
Establishments
Printing and Related Support Activities (NAICS 323), 2015Change in Number of Establishments
17

% of Total Region Rank and State Rank All Sizes Small: 1-9
Empls.Medium: 10-49
Empls.Large: >50+
Empls.
U.S. states + DC 100.0% - 447,618 58,528 126,790 262,300
New England 4.8% 7 21,527 3,128 6,930 11,469 Connecticut 1.3% 23 5,954 770 1,684 3,500 Maine 0.3% 39 1,557 298 534 725 Massachusetts 2.1% 19 9,344 1,389 3,030 4,925 New Hampshire 0.5% 36 2,028 320 622 1,086 Rhode Island 0.4% 37 1,714 228 643 844 Vermont 0.2% 44 930 123 418 390
Mid-Eastern 16.4% 3 73,500 9,181 20,919 43,399 Delaware 0.1% 48 413 158 188 67 Washington DC 0.1% 49 329 103 102 123 Maryland 1.6% 21 7,248 789 2,649 3,810 New Jersey 3.4% 10 15,036 1,903 4,555 8,578 New York 4.7% 8 20,910 3,658 7,313 9,939 Pennsylvania 6.2% 2 27,908 2,335 5,836 19,737 West Virginia 0.4% 38 1,656 235 276 1,145
South Eastern 18.5% 2 83,024 12,027 23,959 47,039 Alabama 0.7% 31 3,325 810 1,388 1,127 Florida 3.5% 9 15,865 3,559 6,027 6,279 Georgia 3.0% 13 13,619 1,577 4,008 8,034 Kentucky 2.1% 18 9,518 687 1,648 7,182 Mississippi 0.3% 40 1,437 389 549 499 North Carolina 2.7% 15 12,086 1,871 3,839 6,376 South Carolina 1.1% 28 4,736 696 1,467 2,574 Tennessee 2.5% 17 11,014 1,123 2,791 7,100 Virginia 2.6% 16 11,424 1,314 2,242 7,868
Great Lakes 28.9% 1 129,160 11,148 28,431 89,581 Illinois 6.2% 3 27,791 2,826 7,046 17,919 Indiana 3.2% 11 14,345 1,302 2,659 10,384 Michigan 3.2% 12 14,117 1,826 3,901 8,390 Minnesota 5.3% 6 23,548 1,300 4,459 17,789 Ohio 5.0% 7 22,381 2,515 6,351 13,515 Wisconsin 6.0% 4 26,978 1,378 4,015 21,585
North Central 7.6% 5 34,187 3,819 9,173 21,194 Idaho 0.2% 42 1,080 286 398 396 Iowa 1.4% 22 6,192 593 1,811 3,788 Kansas 1.8% 20 7,865 611 1,717 5,537 Missouri 2.9% 14 13,021 1,279 3,081 8,661 Montana 0.2% 45 898 193 451 254 Nebraska 0.6% 34 2,724 393 957 1,374 North Dakota 0.2% 47 764 143 335 286 South Dakota 0.3% 41 1,410 203 363 844 Wyoming 0.1% 51 233 118 59 56
South Central 7.3% 6 32,760 6,148 11,319 15,293 Arkansas 0.7% 33 3,094 521 773 1,800 Louisiana 0.6% 35 2,591 699 1,207 685 Oklahoma 0.8% 30 3,472 737 1,043 1,692 Texas 5.3% 5 23,603 4,191 8,296 11,116
South Western 4.3% 8 19,300 3,268 6,986 9,046 Arizona 1.1% 27 5,117 991 2,030 2,096 Colorado 1.3% 24 5,603 1,123 1,922 2,558 Nevada 0.7% 32 3,124 363 957 1,804 New Mexico 0.2% 46 776 302 410 64 Utah 1.0% 29 4,680 488 1,667 2,525
Western 12.1% 4 54,184 9,836 19,205 25,143 Alaska 0.1% 50 302 114 188 California 9.5% 1 42,367 7,454 14,566 20,347 Hawaii 0.2% 43 937 242 281 414 Oregon 1.2% 25 5,310 863 1,957 2,490 Washington 1.2% 26 5,268 1,163 2,213 1,892
US States + District of Columbia Ranked by Number of Employees
Printing and Related Support Activities (NAICS 323), 2015Number of Employees
18

% of Total Region Rank and State Rank All Sizes 1-4
Empls.5-9
Empls.10-19
Empls.20-49
Empls.50-99
Empls.100-249Empls.
250-499Empls.
500+Empls.
U.S. states + DC 100.0% - 447,618 25,300 33,228 44,979 81,811 71,684 97,712 53,757 39,147
New England 4.8% 7 21,527 1,330 1,798 2,445 4,486 3,676 5,286 1,958 549 Connecticut 1.3% 23 5,954 334 436 639 1,045 697 1,629 625 549 Maine 0.3% 39 1,557 125 173 122 412 159 169 397 Massachusetts 2.1% 19 9,344 570 819 935 2,095 1,781 2,474 670 New Hampshire 0.5% 36 2,028 148 173 332 290 371 449 266 Rhode Island 0.4% 37 1,714 99 129 274 369 593 250 Vermont 0.2% 44 930 55 68 143 275 75 314
Mid-Eastern 16.4% 3 73,500 4,108 5,074 6,877 14,042 9,925 16,951 8,835 7,688 Delaware 0.1% 48 413 68 90 129 59 67 Washington DC 0.1% 49 329 51 53 51 51 123 Maryland 1.6% 21 7,248 353 436 826 1,823 1,213 1,503 1,094 New Jersey 3.4% 10 15,036 834 1,069 1,341 3,214 2,144 5,243 1,191 New York 4.7% 8 20,910 1,711 1,947 2,633 4,680 2,921 3,526 1,565 1,927 Pennsylvania 6.2% 2 27,908 1,000 1,335 1,772 4,064 3,503 6,228 4,985 5,021 West Virginia 0.4% 38 1,656 91 144 126 150 77 328 740
South Eastern 18.5% 2 83,024 5,409 6,618 8,977 14,982 14,483 15,974 10,550 6,032 Alabama 0.7% 31 3,325 362 449 570 818 475 389 263 Florida 3.5% 9 15,865 1,802 1,757 2,433 3,594 2,592 2,537 1,150 Georgia 3.0% 13 13,619 715 862 1,354 2,654 2,667 2,536 2,176 655 Kentucky 2.1% 18 9,518 327 360 502 1,146 1,633 1,704 1,100 2,745 Mississippi 0.3% 40 1,437 158 231 285 264 95 404 North Carolina 2.7% 15 12,086 755 1,116 1,293 2,546 2,273 3,096 1,007 South Carolina 1.1% 28 4,736 265 431 581 886 1,086 680 808 Tennessee 2.5% 17 11,014 523 600 948 1,843 2,112 2,939 1,184 865 Virginia 2.6% 16 11,424 502 812 1,012 1,230 1,550 1,690 2,862 1,767
Great Lakes 28.9% 1 129,160 4,700 6,448 9,332 19,099 19,589 32,427 20,249 17,317 Illinois 6.2% 3 27,791 1,209 1,617 2,336 4,710 4,198 8,112 4,642 967 Indiana 3.2% 11 14,345 569 733 1,027 1,632 1,826 3,047 1,850 3,661 Michigan 3.2% 12 14,117 775 1,051 1,607 2,294 2,265 3,872 1,700 553 Minnesota 5.3% 6 23,548 538 762 1,282 3,177 3,508 6,317 4,703 3,261 Ohio 5.0% 7 22,381 1,033 1,482 1,800 4,551 3,421 5,769 2,465 1,860 Wisconsin 6.0% 4 26,978 576 803 1,280 2,735 4,371 5,310 4,890 7,014
North Central 7.6% 5 34,187 1,635 2,184 3,279 5,894 6,612 7,136 4,305 3,141 Idaho 0.2% 42 1,080 108 178 162 236 262 134 Iowa 1.4% 22 6,192 307 286 677 1,134 1,213 1,472 543 560 Kansas 1.8% 20 7,865 218 393 528 1,190 1,497 1,492 1,894 654 Missouri 2.9% 14 13,021 586 693 1,098 1,983 2,488 2,795 1,450 1,927 Montana 0.2% 45 898 82 111 207 244 81 173 Nebraska 0.6% 34 2,724 160 233 252 705 768 606 North Dakota 0.2% 47 764 52 91 120 215 286 South Dakota 0.3% 41 1,410 78 125 176 187 248 178 418 Wyoming 0.1% 51 233 44 74 59 56
South Central 7.3% 6 32,760 2,548 3,600 4,215 7,104 4,991 4,644 2,368 3,290 Arkansas 0.7% 33 3,094 203 318 243 530 486 436 301 577 Louisiana 0.6% 35 2,591 315 384 419 788 400 285 Oklahoma 0.8% 30 3,472 313 424 569 474 605 1,087 Texas 5.3% 5 23,603 1,717 2,474 2,984 5,312 3,500 3,923 2,067 1,626
South Western 4.3% 8 19,300 1,382 1,886 2,657 4,329 3,057 4,007 1,982 Arizona 1.1% 27 5,117 407 584 723 1,307 714 1,382 Colorado 1.3% 24 5,603 490 633 884 1,038 462 884 1,212 Nevada 0.7% 32 3,124 168 195 367 590 695 813 296 New Mexico 0.2% 46 776 137 165 208 202 64 Utah 1.0% 29 4,680 180 308 475 1,192 1,122 929 474
Western 12.1% 4 54,184 4,196 5,640 7,251 11,954 9,502 11,142 3,287 1,211 Alaska 0.1% 50 302 43 71 108 80 California 9.5% 1 42,367 3,150 4,304 5,434 9,132 7,488 8,361 3,287 1,211 Hawaii 0.2% 43 937 128 114 127 155 54 360 Oregon 1.2% 25 5,310 361 502 685 1,272 1,018 1,472 Washington 1.2% 26 5,268 514 649 898 1,315 943 949
US States + District of Columbia Ranked by Number of Employees
Printing and Related Support Activities (NAICS 323), 2015Number of Employees
19
% of Total Region Rank and State Rank All Sizes Small: 1-9
Empls.Medium: 10-49
Empls.Large: >50+
Empls.
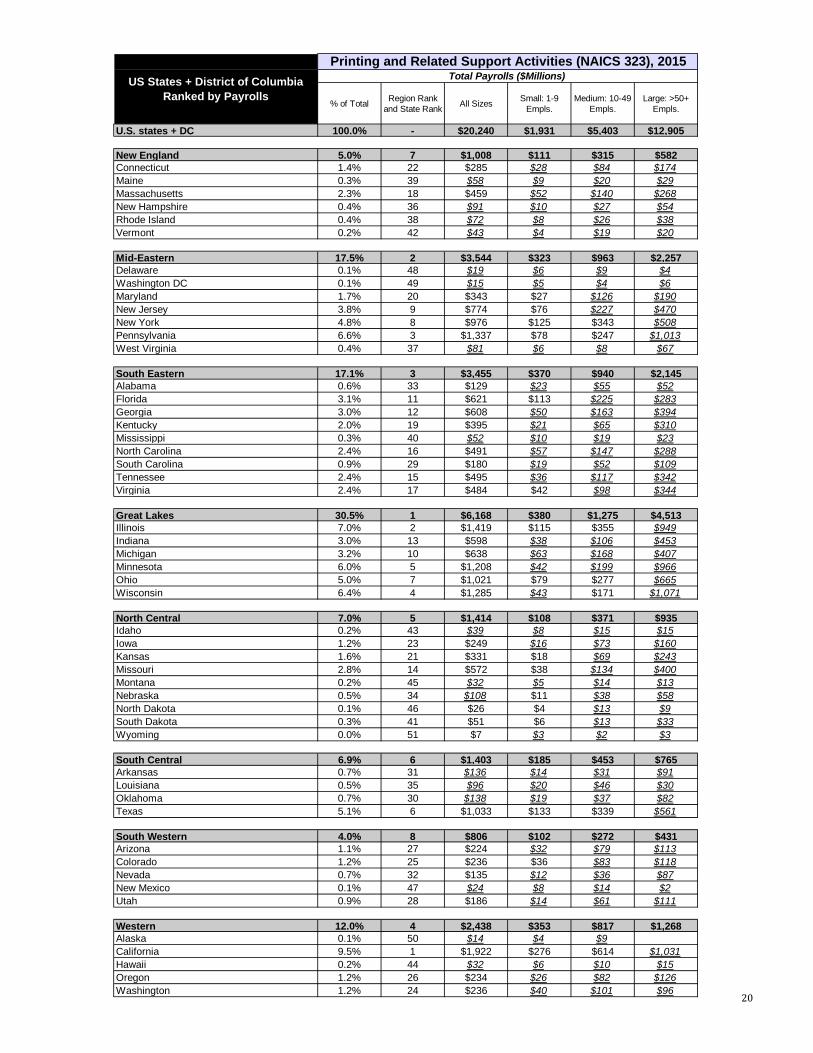
U.S. states + DC 100.0% - $20,240 $1,931 $5,403 $12,905
New England 5.0% 7 $1,008 $111 $315 $582Connecticut 1.4% 22 $285 $28 $84 $174Maine 0.3% 39 $58 $9 $20 $29Massachusetts 2.3% 18 $459 $52 $140 $268New Hampshire 0.4% 36 $91 $10 $27 $54Rhode Island 0.4% 38 $72 $8 $26 $38Vermont 0.2% 42 $43 $4 $19 $20
Mid-Eastern 17.5% 2 $3,544 $323 $963 $2,257Delaware 0.1% 48 $19 $6 $9 $4Washington DC 0.1% 49 $15 $5 $4 $6Maryland 1.7% 20 $343 $27 $126 $190New Jersey 3.8% 9 $774 $76 $227 $470New York 4.8% 8 $976 $125 $343 $508Pennsylvania 6.6% 3 $1,337 $78 $247 $1,013West Virginia 0.4% 37 $81 $6 $8 $67
South Eastern 17.1% 3 $3,455 $370 $940 $2,145Alabama 0.6% 33 $129 $23 $55 $52Florida 3.1% 11 $621 $113 $225 $283Georgia 3.0% 12 $608 $50 $163 $394Kentucky 2.0% 19 $395 $21 $65 $310Mississippi 0.3% 40 $52 $10 $19 $23North Carolina 2.4% 16 $491 $57 $147 $288South Carolina 0.9% 29 $180 $19 $52 $109Tennessee 2.4% 15 $495 $36 $117 $342Virginia 2.4% 17 $484 $42 $98 $344
Great Lakes 30.5% 1 $6,168 $380 $1,275 $4,513Illinois 7.0% 2 $1,419 $115 $355 $949Indiana 3.0% 13 $598 $38 $106 $453Michigan 3.2% 10 $638 $63 $168 $407Minnesota 6.0% 5 $1,208 $42 $199 $966Ohio 5.0% 7 $1,021 $79 $277 $665Wisconsin 6.4% 4 $1,285 $43 $171 $1,071
North Central 7.0% 5 $1,414 $108 $371 $935Idaho 0.2% 43 $39 $8 $15 $15Iowa 1.2% 23 $249 $16 $73 $160Kansas 1.6% 21 $331 $18 $69 $243Missouri 2.8% 14 $572 $38 $134 $400Montana 0.2% 45 $32 $5 $14 $13Nebraska 0.5% 34 $108 $11 $38 $58North Dakota 0.1% 46 $26 $4 $13 $9South Dakota 0.3% 41 $51 $6 $13 $33Wyoming 0.0% 51 $7 $3 $2 $3
South Central 6.9% 6 $1,403 $185 $453 $765Arkansas 0.7% 31 $136 $14 $31 $91Louisiana 0.5% 35 $96 $20 $46 $30Oklahoma 0.7% 30 $138 $19 $37 $82Texas 5.1% 6 $1,033 $133 $339 $561
South Western 4.0% 8 $806 $102 $272 $431Arizona 1.1% 27 $224 $32 $79 $113Colorado 1.2% 25 $236 $36 $83 $118Nevada 0.7% 32 $135 $12 $36 $87New Mexico 0.1% 47 $24 $8 $14 $2Utah 0.9% 28 $186 $14 $61 $111
Western 12.0% 4 $2,438 $353 $817 $1,268Alaska 0.1% 50 $14 $4 $9California 9.5% 1 $1,922 $276 $614 $1,031Hawaii 0.2% 44 $32 $6 $10 $15Oregon 1.2% 26 $234 $26 $82 $126Washington 1.2% 24 $236 $40 $101 $96
US States + District of Columbia Ranked by Payrolls
Printing and Related Support Activities (NAICS 323), 2015Total Payrolls ($Millions)
20
% of Total Region Rank and State Rank All Sizes 1-4
Empls.5-9
Empls.10-19
Empls.20-49
Empls.50-99
Empls.100-249Empls.
250-499Empls.
500+Empls.
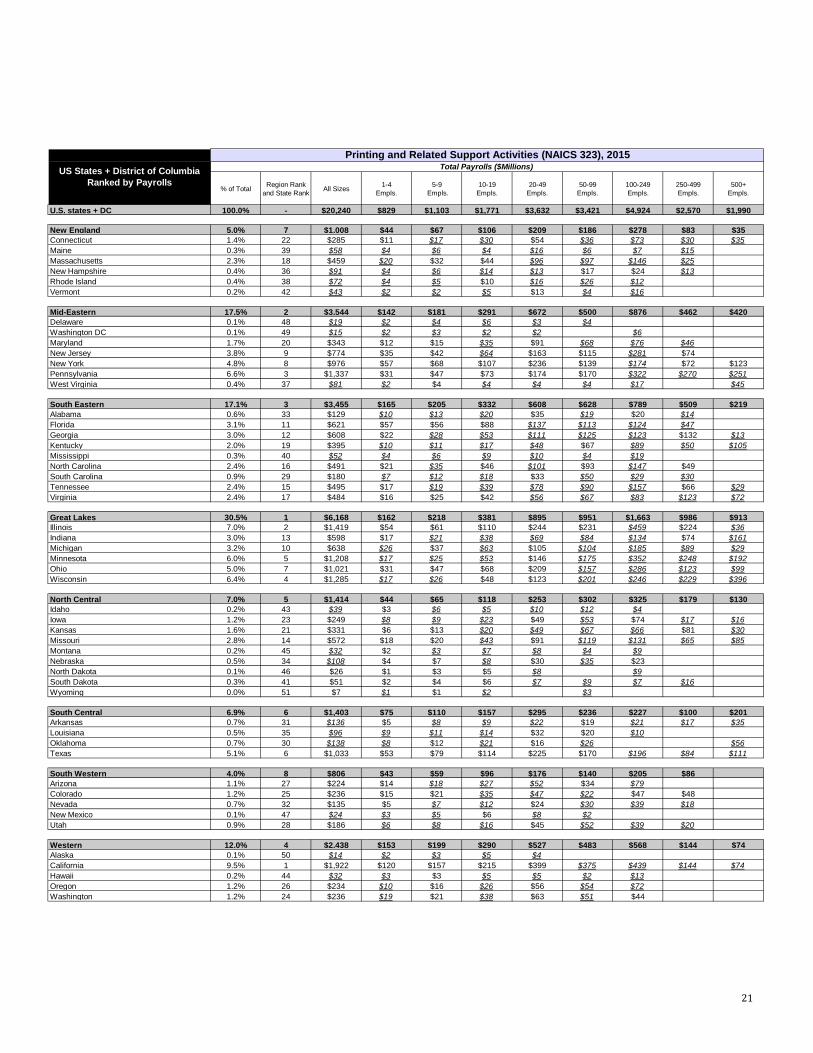
U.S. states + DC 100.0% - $20,240 $829 $1,103 $1,771 $3,632 $3,421 $4,924 $2,570 $1,990
New England 5.0% 7 $1,008 $44 $67 $106 $209 $186 $278 $83 $35Connecticut 1.4% 22 $285 $11 $17 $30 $54 $36 $73 $30 $35Maine 0.3% 39 $58 $4 $6 $4 $16 $6 $7 $15Massachusetts 2.3% 18 $459 $20 $32 $44 $96 $97 $146 $25New Hampshire 0.4% 36 $91 $4 $6 $14 $13 $17 $24 $13Rhode Island 0.4% 38 $72 $4 $5 $10 $16 $26 $12Vermont 0.2% 42 $43 $2 $2 $5 $13 $4 $16
Mid-Eastern 17.5% 2 $3,544 $142 $181 $291 $672 $500 $876 $462 $420Delaware 0.1% 48 $19 $2 $4 $6 $3 $4Washington DC 0.1% 49 $15 $2 $3 $2 $2 $6Maryland 1.7% 20 $343 $12 $15 $35 $91 $68 $76 $46New Jersey 3.8% 9 $774 $35 $42 $64 $163 $115 $281 $74New York 4.8% 8 $976 $57 $68 $107 $236 $139 $174 $72 $123Pennsylvania 6.6% 3 $1,337 $31 $47 $73 $174 $170 $322 $270 $251West Virginia 0.4% 37 $81 $2 $4 $4 $4 $4 $17 $45
South Eastern 17.1% 3 $3,455 $165 $205 $332 $608 $628 $789 $509 $219Alabama 0.6% 33 $129 $10 $13 $20 $35 $19 $20 $14Florida 3.1% 11 $621 $57 $56 $88 $137 $113 $124 $47Georgia 3.0% 12 $608 $22 $28 $53 $111 $125 $123 $132 $13Kentucky 2.0% 19 $395 $10 $11 $17 $48 $67 $89 $50 $105Mississippi 0.3% 40 $52 $4 $6 $9 $10 $4 $19North Carolina 2.4% 16 $491 $21 $35 $46 $101 $93 $147 $49South Carolina 0.9% 29 $180 $7 $12 $18 $33 $50 $29 $30Tennessee 2.4% 15 $495 $17 $19 $39 $78 $90 $157 $66 $29Virginia 2.4% 17 $484 $16 $25 $42 $56 $67 $83 $123 $72
Great Lakes 30.5% 1 $6,168 $162 $218 $381 $895 $951 $1,663 $986 $913Illinois 7.0% 2 $1,419 $54 $61 $110 $244 $231 $459 $224 $36Indiana 3.0% 13 $598 $17 $21 $38 $69 $84 $134 $74 $161Michigan 3.2% 10 $638 $26 $37 $63 $105 $104 $185 $89 $29Minnesota 6.0% 5 $1,208 $17 $25 $53 $146 $175 $352 $248 $192Ohio 5.0% 7 $1,021 $31 $47 $68 $209 $157 $286 $123 $99Wisconsin 6.4% 4 $1,285 $17 $26 $48 $123 $201 $246 $229 $396
North Central 7.0% 5 $1,414 $44 $65 $118 $253 $302 $325 $179 $130Idaho 0.2% 43 $39 $3 $6 $5 $10 $12 $4Iowa 1.2% 23 $249 $8 $9 $23 $49 $53 $74 $17 $16Kansas 1.6% 21 $331 $6 $13 $20 $49 $67 $66 $81 $30Missouri 2.8% 14 $572 $18 $20 $43 $91 $119 $131 $65 $85Montana 0.2% 45 $32 $2 $3 $7 $8 $4 $9Nebraska 0.5% 34 $108 $4 $7 $8 $30 $35 $23North Dakota 0.1% 46 $26 $1 $3 $5 $8 $9South Dakota 0.3% 41 $51 $2 $4 $6 $7 $9 $7 $16Wyoming 0.0% 51 $7 $1 $1 $2 $3
South Central 6.9% 6 $1,403 $75 $110 $157 $295 $236 $227 $100 $201Arkansas 0.7% 31 $136 $5 $8 $9 $22 $19 $21 $17 $35Louisiana 0.5% 35 $96 $9 $11 $14 $32 $20 $10Oklahoma 0.7% 30 $138 $8 $12 $21 $16 $26 $56Texas 5.1% 6 $1,033 $53 $79 $114 $225 $170 $196 $84 $111
South Western 4.0% 8 $806 $43 $59 $96 $176 $140 $205 $86Arizona 1.1% 27 $224 $14 $18 $27 $52 $34 $79Colorado 1.2% 25 $236 $15 $21 $35 $47 $22 $47 $48Nevada 0.7% 32 $135 $5 $7 $12 $24 $30 $39 $18New Mexico 0.1% 47 $24 $3 $5 $6 $8 $2Utah 0.9% 28 $186 $6 $8 $16 $45 $52 $39 $20
Western 12.0% 4 $2,438 $153 $199 $290 $527 $483 $568 $144 $74Alaska 0.1% 50 $14 $2 $3 $5 $4California 9.5% 1 $1,922 $120 $157 $215 $399 $375 $439 $144 $74Hawaii 0.2% 44 $32 $3 $3 $5 $5 $2 $13Oregon 1.2% 26 $234 $10 $16 $26 $56 $54 $72Washington 1.2% 24 $236 $19 $21 $38 $63 $51 $44
US States + District of Columbia Ranked by Payrolls
Printing and Related Support Activities (NAICS 323), 2015Total Payrolls ($Millions)
21

% of Total Region Rank and State Rank All Sizes Small: 1-9
Empls.Medium: 10-49
Empls.Large: >50+
Empls.
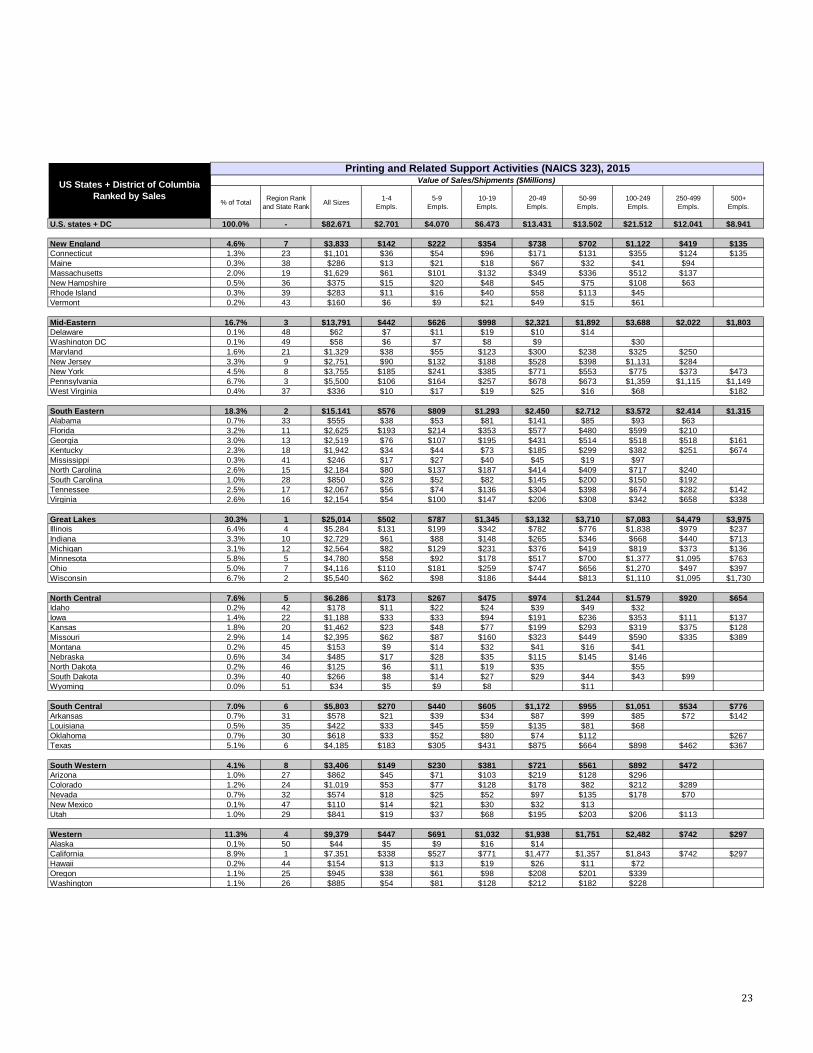
U.S. states + DC 100.0% - $82,671 $6,771 $19,904 $55,996
New England 4.6% 7 $3,833 $364 $1,091 $2,378Connecticut 1.3% 23 $1,101 $90 $267 $744Maine 0.3% 38 $286 $34 $84 $167Massachusetts 2.0% 19 $1,629 $163 $481 $985New Hampshire 0.5% 36 $375 $36 $92 $246Rhode Island 0.3% 39 $283 $27 $98 $158Vermont 0.2% 43 $160 $14 $69 $77
Mid-Eastern 16.7% 3 $13,791 $1,069 $3,319 $9,404Delaware 0.1% 48 $62 $19 $29 $14Washington DC 0.1% 49 $58 $12 $17 $30Maryland 1.6% 21 $1,329 $93 $423 $813New Jersey 3.3% 9 $2,751 $222 $717 $1,813New York 4.5% 8 $3,755 $426 $1,155 $2,174Pennsylvania 6.7% 3 $5,500 $270 $935 $4,296West Virginia 0.4% 37 $336 $27 $44 $265
South Eastern 18.3% 2 $15,141 $1,386 $3,743 $10,013Alabama 0.7% 33 $555 $91 $223 $241Florida 3.2% 11 $2,625 $407 $930 $1,288Georgia 3.0% 13 $2,519 $183 $626 $1,710Kentucky 2.3% 18 $1,942 $78 $258 $1,606Mississippi 0.3% 41 $246 $44 $85 $116North Carolina 2.6% 15 $2,184 $217 $601 $1,366South Carolina 1.0% 28 $850 $81 $227 $542Tennessee 2.5% 17 $2,067 $130 $441 $1,496Virginia 2.6% 16 $2,154 $154 $353 $1,647
Great Lakes 30.3% 1 $25,014 $1,289 $4,477 $19,248Illinois 6.4% 4 $5,284 $330 $1,124 $3,830Indiana 3.3% 10 $2,729 $149 $413 $2,167Michigan 3.1% 12 $2,564 $210 $607 $1,747Minnesota 5.8% 5 $4,780 $150 $695 $3,935Ohio 5.0% 7 $4,116 $291 $1,006 $2,820Wisconsin 6.7% 2 $5,540 $160 $631 $4,749
North Central 7.6% 5 $6,286 $440 $1,449 $4,397Idaho 0.2% 42 $178 $33 $63 $81Iowa 1.4% 22 $1,188 $66 $285 $838Kansas 1.8% 20 $1,462 $71 $276 $1,115Missouri 2.9% 14 $2,395 $149 $483 $1,763Montana 0.2% 45 $153 $22 $73 $58Nebraska 0.6% 34 $485 $45 $150 $290North Dakota 0.2% 46 $125 $17 $54 $55South Dakota 0.3% 40 $266 $23 $57 $186Wyoming 0.0% 51 $34 $14 $8 $11
South Central 7.0% 6 $5,803 $710 $1,776 $3,317Arkansas 0.7% 31 $578 $60 $122 $397Louisiana 0.5% 35 $422 $78 $194 $150Oklahoma 0.7% 30 $618 $85 $155 $379Texas 5.1% 6 $4,185 $488 $1,306 $2,391
South Western 4.1% 8 $3,406 $379 $1,102 $1,926Arizona 1.0% 27 $862 $116 $323 $424Colorado 1.2% 24 $1,019 $130 $305 $583Nevada 0.7% 32 $574 $42 $149 $383New Mexico 0.1% 47 $110 $35 $62 $13Utah 1.0% 29 $841 $56 $263 $522
Western 11.3% 4 $9,379 $1,138 $2,969 $5,272Alaska 0.1% 50 $44 $14 $30California 8.9% 1 $7,351 $864 $2,248 $4,239Hawaii 0.2% 44 $154 $27 $45 $83Oregon 1.1% 25 $945 $98 $306 $540Washington 1.1% 26 $885 $135 $340 $410
US States + District of Columbia Ranked by Sales
Printing and Related Support Activities (NAICS 323), 2015Value of Sales/Shipments ($Millions)
22
% of Total Region Rank and State Rank All Sizes 1-4
Empls.5-9
Empls.10-19
Empls.20-49
Empls.50-99
Empls.100-249Empls.
250-499Empls.
500+Empls.
U.S. states + DC 100.0% - $82,671 $2,701 $4,070 $6,473 $13,431 $13,502 $21,512 $12,041 $8,941
New England 4.6% 7 $3,833 $142 $222 $354 $738 $702 $1,122 $419 $135Connecticut 1.3% 23 $1,101 $36 $54 $96 $171 $131 $355 $124 $135Maine 0.3% 38 $286 $13 $21 $18 $67 $32 $41 $94Massachusetts 2.0% 19 $1,629 $61 $101 $132 $349 $336 $512 $137New Hampshire 0.5% 36 $375 $15 $20 $48 $45 $75 $108 $63Rhode Island 0.3% 39 $283 $11 $16 $40 $58 $113 $45Vermont 0.2% 43 $160 $6 $9 $21 $49 $15 $61
Mid-Eastern 16.7% 3 $13,791 $442 $626 $998 $2,321 $1,892 $3,688 $2,022 $1,803Delaware 0.1% 48 $62 $7 $11 $19 $10 $14Washington DC 0.1% 49 $58 $6 $7 $8 $9 $30Maryland 1.6% 21 $1,329 $38 $55 $123 $300 $238 $325 $250New Jersey 3.3% 9 $2,751 $90 $132 $188 $528 $398 $1,131 $284New York 4.5% 8 $3,755 $185 $241 $385 $771 $553 $775 $373 $473Pennsylvania 6.7% 3 $5,500 $106 $164 $257 $678 $673 $1,359 $1,115 $1,149West Virginia 0.4% 37 $336 $10 $17 $19 $25 $16 $68 $182
South Eastern 18.3% 2 $15,141 $576 $809 $1,293 $2,450 $2,712 $3,572 $2,414 $1,315Alabama 0.7% 33 $555 $38 $53 $81 $141 $85 $93 $63Florida 3.2% 11 $2,625 $193 $214 $353 $577 $480 $599 $210Georgia 3.0% 13 $2,519 $76 $107 $195 $431 $514 $518 $518 $161Kentucky 2.3% 18 $1,942 $34 $44 $73 $185 $299 $382 $251 $674Mississippi 0.3% 41 $246 $17 $27 $40 $45 $19 $97North Carolina 2.6% 15 $2,184 $80 $137 $187 $414 $409 $717 $240South Carolina 1.0% 28 $850 $28 $52 $82 $145 $200 $150 $192Tennessee 2.5% 17 $2,067 $56 $74 $136 $304 $398 $674 $282 $142Virginia 2.6% 16 $2,154 $54 $100 $147 $206 $308 $342 $658 $338
Great Lakes 30.3% 1 $25,014 $502 $787 $1,345 $3,132 $3,710 $7,083 $4,479 $3,975Illinois 6.4% 4 $5,284 $131 $199 $342 $782 $776 $1,838 $979 $237Indiana 3.3% 10 $2,729 $61 $88 $148 $265 $346 $668 $440 $713Michigan 3.1% 12 $2,564 $82 $129 $231 $376 $419 $819 $373 $136Minnesota 5.8% 5 $4,780 $58 $92 $178 $517 $700 $1,377 $1,095 $763Ohio 5.0% 7 $4,116 $110 $181 $259 $747 $656 $1,270 $497 $397Wisconsin 6.7% 2 $5,540 $62 $98 $186 $444 $813 $1,110 $1,095 $1,730
North Central 7.6% 5 $6,286 $173 $267 $475 $974 $1,244 $1,579 $920 $654Idaho 0.2% 42 $178 $11 $22 $24 $39 $49 $32Iowa 1.4% 22 $1,188 $33 $33 $94 $191 $236 $353 $111 $137Kansas 1.8% 20 $1,462 $23 $48 $77 $199 $293 $319 $375 $128Missouri 2.9% 14 $2,395 $62 $87 $160 $323 $449 $590 $335 $389Montana 0.2% 45 $153 $9 $14 $32 $41 $16 $41Nebraska 0.6% 34 $485 $17 $28 $35 $115 $145 $146North Dakota 0.2% 46 $125 $6 $11 $19 $35 $55South Dakota 0.3% 40 $266 $8 $14 $27 $29 $44 $43 $99Wyoming 0.0% 51 $34 $5 $9 $8 $11
South Central 7.0% 6 $5,803 $270 $440 $605 $1,172 $955 $1,051 $534 $776Arkansas 0.7% 31 $578 $21 $39 $34 $87 $99 $85 $72 $142Louisiana 0.5% 35 $422 $33 $45 $59 $135 $81 $68Oklahoma 0.7% 30 $618 $33 $52 $80 $74 $112 $267Texas 5.1% 6 $4,185 $183 $305 $431 $875 $664 $898 $462 $367
South Western 4.1% 8 $3,406 $149 $230 $381 $721 $561 $892 $472Arizona 1.0% 27 $862 $45 $71 $103 $219 $128 $296Colorado 1.2% 24 $1,019 $53 $77 $128 $178 $82 $212 $289Nevada 0.7% 32 $574 $18 $25 $52 $97 $135 $178 $70New Mexico 0.1% 47 $110 $14 $21 $30 $32 $13Utah 1.0% 29 $841 $19 $37 $68 $195 $203 $206 $113
Western 11.3% 4 $9,379 $447 $691 $1,032 $1,938 $1,751 $2,482 $742 $297Alaska 0.1% 50 $44 $5 $9 $16 $14California 8.9% 1 $7,351 $338 $527 $771 $1,477 $1,357 $1,843 $742 $297Hawaii 0.2% 44 $154 $13 $13 $19 $26 $11 $72Oregon 1.1% 25 $945 $38 $61 $98 $208 $201 $339Washington 1.1% 26 $885 $54 $81 $128 $212 $182 $228
US States + District of Columbia Ranked by Sales
Printing and Related Support Activities (NAICS 323), 2015Value of Sales/Shipments ($Millions)
23
% of Total Region Rank and State Rank All Sizes Small: 1-9
Empls. Medium: 10-49
Empls. Large: >50+
Empls.
U.S. states + DC 100.0% - $ 2,343 $ 187 $ 696 $ 1,460
New England 4.8% 7 $ 112 $ 10 $ 38 $ 63 Connecticut 1.3% 23 $ 31 $ 2 $ 10 $ 19 Maine 0.4% 39 $ 8 $ 1 $ 3 $ 4 Massachusetts 2.1% 19 $ 49 $ 5 $ 17 $ 27 New Hampshire 0.5% 36 $ 11 $ 1 $ 3 $ 7 Rhode Island 0.4% 38 $ 8 $ 1 $ 3 $ 4 Vermont 0.2% 43 $ 5 $ 0 $ 3 $ 2
Mid-Eastern 16.8% 3 $ 394 $ 30 $ 118 $ 246 Delaware 0.1% 48 $ 2 $ 1 $ 1 $ 0 Washington DC 0.1% 49 $ 2 $ 0 $ 1 $ 1 Maryland 1.7% 20 $ 40 $ 3 $ 15 $ 22 New Jersey 3.4% 9 $ 80 $ 6 $ 25 $ 49 New York 4.7% 8 $ 110 $ 12 $ 41 $ 57 Pennsylvania 6.5% 3 $ 152 $ 7 $ 33 $ 111 West Virginia 0.4% 37 $ 9 $ 1 $ 2 $ 6
South Eastern 18.4% 2 $ 432 $ 38 $ 130 $ 264 Alabama 0.7% 30 $ 17 $ 2 $ 8 $ 6 Florida 3.3% 10 $ 77 $ 11 $ 32 $ 34 Georgia 3.1% 13 $ 73 $ 5 $ 22 $ 46 Kentucky 2.2% 18 $ 51 $ 2 $ 9 $ 40 Mississippi 0.3% 40 $ 7 $ 1 $ 3 $ 3 North Carolina 2.7% 15 $ 64 $ 6 $ 21 $ 37 South Carolina 1.0% 29 $ 24 $ 2 $ 8 $ 14 Tennessee 2.5% 16 $ 60 $ 4 $ 15 $ 41 Virginia 2.5% 17 $ 60 $ 4 $ 12 $ 43
Great Lakes 29.4% 1 $ 688 $ 36 $ 157 $ 496 Illinois 6.5% 2 $ 153 $ 9 $ 40 $ 103 Indiana 3.1% 11 $ 73 $ 4 $ 14 $ 55 Michigan 3.1% 12 $ 73 $ 6 $ 21 $ 46 Minnesota 5.5% 5 $ 129 $ 4 $ 24 $ 101 Ohio 5.0% 7 $ 117 $ 8 $ 35 $ 74 Wisconsin 6.1% 4 $ 143 $ 4 $ 22 $ 116
North Central 7.5% 5 $ 175 $ 12 $ 51 $ 113 Idaho 0.2% 42 $ 5 $ 1 $ 2 $ 2 Iowa 1.4% 22 $ 33 $ 2 $ 10 $ 22 Kansas 1.7% 21 $ 39 $ 2 $ 10 $ 27 Missouri 2.8% 14 $ 66 $ 4 $ 17 $ 45 Montana 0.2% 44 $ 5 $ 1 $ 3 $ 2 Nebraska 0.6% 34 $ 14 $ 1 $ 5 $ 8 North Dakota 0.2% 46 $ 4 $ 0 $ 2 $ 1 South Dakota 0.3% 41 $ 7 $ 1 $ 2 $ 5 Wyoming 0.0% 51 $ 1 $ 0 $ 0 $ 0
South Central 7.1% 6 $ 167 $ 19 $ 62 $ 85 Arkansas 0.7% 33 $ 16 $ 2 $ 4 $ 10 Louisiana 0.6% 35 $ 13 $ 2 $ 7 $ 4 Oklahoma 0.7% 32 $ 16 $ 2 $ 5 $ 9 Texas 5.2% 6 $ 122 $ 13 $ 46 $ 62
South Western 4.3% 8 $ 101 $ 11 $ 39 $ 51 Arizona 1.1% 27 $ 27 $ 3 $ 12 $ 12 Colorado 1.3% 24 $ 30 $ 4 $ 11 $ 15 Nevada 0.7% 31 $ 17 $ 1 $ 5 $ 10 New Mexico 0.1% 47 $ 3 $ 1 $ 2 $ 0 Utah 1.0% 28 $ 24 $ 1 $ 9 $ 14
Western 11.6% 4 $ 273 $ 32 $ 101 $ 140 Alaska 0.1% 50 $ 2 $ 0 $ 1 $ - California 9.0% 1 $ 212 $ 24 $ 76 $ 111 Hawaii 0.2% 45 $ 4 $ 1 $ 2 $ 2 Oregon 1.2% 25 $ 28 $ 3 $ 11 $ 15 Washington 1.2% 26 $ 27 $ 4 $ 12 $ 12
US States + District of Columbia Ranked by CapEx
Printing and Related Support Activities (NAICS 323), 2015Value of Capital Expenditure ($M)
24

% of Total Region Rank and State Rank All Sizes 1-4
Empls. 5-9
Empls. 10-19Empls.
20-49Empls.
50-99Empls.
100-249Empls.
250-499Empls.
500+Empls.
U.S. states + DC 100.0% - $ 2,343 $ 75 $ 113 $ 232 $ 464 $ 383 $ 586 $ 295 $ 196
New England 4.8% 7 $ 112 $ 4 $ 6 $ 13 $ 25 $ 20 $ 31 $ 10 $ 3 Connecticut 1.3% 23 $ 31 $ 1 $ 1 $ 4 $ 6 $ 4 $ 9 $ 3 $ 3 Maine 0.4% 39 $ 8 $ 0 $ 1 $ 1 $ 2 $ 1 $ 1 $ 2 $ - Massachusetts 2.1% 19 $ 49 $ 2 $ 3 $ 5 $ 12 $ 10 $ 14 $ 3 $ - New Hampshire 0.5% 36 $ 11 $ 0 $ 1 $ 2 $ 1 $ 2 $ 3 $ 2 $ - Rhode Island 0.4% 38 $ 8 $ 0 $ 0 $ 1 $ 2 $ 3 $ 1 $ - $ - Vermont 0.2% 43 $ 5 $ 0 $ 0 $ 1 $ 2 $ 0 $ 2 $ - $ -
Mid-Eastern 16.8% 3 $ 394 $ 12 $ 18 $ 36 $ 82 $ 54 $ 100 $ 51 $ 41 Delaware 0.1% 48 $ 2 $ 0 $ 0 $ 1 $ 0 $ 0 $ - $ - $ - Washington DC 0.1% 49 $ 2 $ 0 $ 0 $ 0 $ 0 $ - $ 1 $ - $ - Maryland 1.7% 20 $ 40 $ 1 $ 2 $ 5 $ 10 $ 7 $ 9 $ 6 $ - New Jersey 3.4% 9 $ 80 $ 3 $ 4 $ 7 $ 19 $ 11 $ 30 $ 7 $ - New York 4.7% 8 $ 110 $ 5 $ 7 $ 14 $ 27 $ 16 $ 21 $ 9 $ 10 Pennsylvania 6.5% 3 $ 152 $ 3 $ 5 $ 9 $ 24 $ 19 $ 37 $ 28 $ 27 West Virginia 0.4% 37 $ 9 $ 0 $ 0 $ 1 $ 1 $ 0 $ 2 $ - $ 4
South Eastern 18.4% 2 $ 432 $ 16 $ 22 $ 46 $ 84 $ 76 $ 98 $ 59 $ 30 Alabama 0.7% 30 $ 17 $ 1 $ 1 $ 3 $ 5 $ 2 $ 3 $ 2 $ - Florida 3.3% 10 $ 77 $ 5 $ 6 $ 13 $ 19 $ 13 $ 17 $ 4 $ - Georgia 3.1% 13 $ 73 $ 2 $ 3 $ 7 $ 15 $ 15 $ 14 $ 13 $ 4 Kentucky 2.2% 18 $ 51 $ 1 $ 1 $ 3 $ 6 $ 8 $ 11 $ 6 $ 15 Mississippi 0.3% 40 $ 7 $ 0 $ 1 $ 1 $ 2 $ 1 $ 3 $ - $ - North Carolina 2.7% 15 $ 64 $ 2 $ 4 $ 7 $ 14 $ 12 $ 20 $ 6 $ - South Carolina 1.0% 29 $ 24 $ 1 $ 1 $ 3 $ 5 $ 6 $ 4 $ 5 $ - Tennessee 2.5% 16 $ 60 $ 1 $ 2 $ 5 $ 11 $ 11 $ 18 $ 7 $ 4 Virginia 2.5% 17 $ 60 $ 1 $ 3 $ 5 $ 7 $ 9 $ 9 $ 17 $ 8
Great Lakes 29.4% 1 $ 688 $ 14 $ 22 $ 49 $ 108 $ 106 $ 193 $ 111 $ 86 Illinois 6.5% 2 $ 153 $ 4 $ 6 $ 13 $ 27 $ 22 $ 51 $ 25 $ 5 Indiana 3.1% 11 $ 73 $ 2 $ 2 $ 5 $ 9 $ 10 $ 19 $ 11 $ 16 Michigan 3.1% 12 $ 73 $ 2 $ 4 $ 8 $ 13 $ 12 $ 22 $ 9 $ 3 Minnesota 5.5% 5 $ 129 $ 2 $ 3 $ 6 $ 18 $ 20 $ 38 $ 27 $ 16 Ohio 5.0% 7 $ 117 $ 3 $ 5 $ 9 $ 26 $ 19 $ 34 $ 12 $ 9 Wisconsin 6.1% 4 $ 143 $ 2 $ 3 $ 7 $ 15 $ 23 $ 29 $ 27 $ 37
North Central 7.5% 5 $ 175 $ 5 $ 7 $ 17 $ 34 $ 35 $ 42 $ 21 $ 14 Idaho 0.2% 42 $ 5 $ 0 $ 1 $ 1 $ 1 $ 1 $ 1 $ - $ - Iowa 1.4% 22 $ 33 $ 1 $ 1 $ 3 $ 7 $ 7 $ 10 $ 2 $ 3 Kansas 1.7% 21 $ 39 $ 1 $ 1 $ 3 $ 7 $ 8 $ 8 $ 8 $ 2 Missouri 2.8% 14 $ 66 $ 2 $ 2 $ 6 $ 11 $ 13 $ 16 $ 8 $ 8 Montana 0.2% 44 $ 5 $ 0 $ 0 $ 1 $ 1 $ 0 $ 1 $ - $ - Nebraska 0.6% 34 $ 14 $ 0 $ 1 $ 1 $ 4 $ 4 $ 4 $ - $ - North Dakota 0.2% 46 $ 4 $ 0 $ 0 $ 1 $ 1 $ - $ 1 $ - $ - South Dakota 0.3% 41 $ 7 $ 0 $ 0 $ 1 $ 1 $ 1 $ 1 $ 2 $ - Wyoming 0.0% 51 $ 1 $ 0 $ 0 $ 0 $ - $ 0 $ - $ - $ -
South Central 7.1% 6 $ 167 $ 7 $ 12 $ 21 $ 41 $ 27 $ 29 $ 13 $ 16 Arkansas 0.7% 33 $ 16 $ 1 $ 1 $ 1 $ 3 $ 3 $ 2 $ 2 $ 3 Louisiana 0.6% 35 $ 13 $ 1 $ 1 $ 2 $ 5 $ 2 $ 2 $ - $ - Oklahoma 0.7% 32 $ 16 $ 1 $ 1 $ 3 $ 2 $ 3 $ - $ - $ 6 Texas 5.2% 6 $ 122 $ 5 $ 8 $ 15 $ 30 $ 19 $ 25 $ 11 $ 7
South Western 4.3% 8 $ 101 $ 4 $ 6 $ 14 $ 25 $ 16 $ 24 $ 12 $ - Arizona 1.1% 27 $ 27 $ 1 $ 2 $ 4 $ 8 $ 4 $ 8 $ - $ - Colorado 1.3% 24 $ 30 $ 1 $ 2 $ 5 $ 6 $ 2 $ 6 $ 7 $ - Nevada 0.7% 31 $ 17 $ 0 $ 1 $ 2 $ 3 $ 4 $ 5 $ 2 $ - New Mexico 0.1% 47 $ 3 $ 0 $ 1 $ 1 $ 1 $ 0 $ - $ - $ - Utah 1.0% 28 $ 24 $ 1 $ 1 $ 2 $ 7 $ 5 $ 5 $ 3 $ -
Western 11.6% 4 $ 273 $ 12 $ 19 $ 36 $ 65 $ 49 $ 67 $ 18 $ 7 Alaska 0.1% 50 $ 2 $ 0 $ 0 $ 1 $ 1 $ - $ - $ - $ - California 9.0% 1 $ 212 $ 9 $ 15 $ 27 $ 49 $ 37 $ 50 $ 18 $ 7 Hawaii 0.2% 45 $ 4 $ 0 $ 0 $ 1 $ 1 $ 0 $ 2 $ - $ - Oregon 1.2% 25 $ 28 $ 1 $ 2 $ 3 $ 7 $ 6 $ 9 $ - $ - Washington 1.2% 26 $ 27 $ 1 $ 2 $ 5 $ 7 $ 5 $ 6 $ - $ -
US States + District of Columbia Ranked by CapEx
Printing and Related Support Activities (NAICS 323), 2015Value of Capital Expenditure ($M)
25
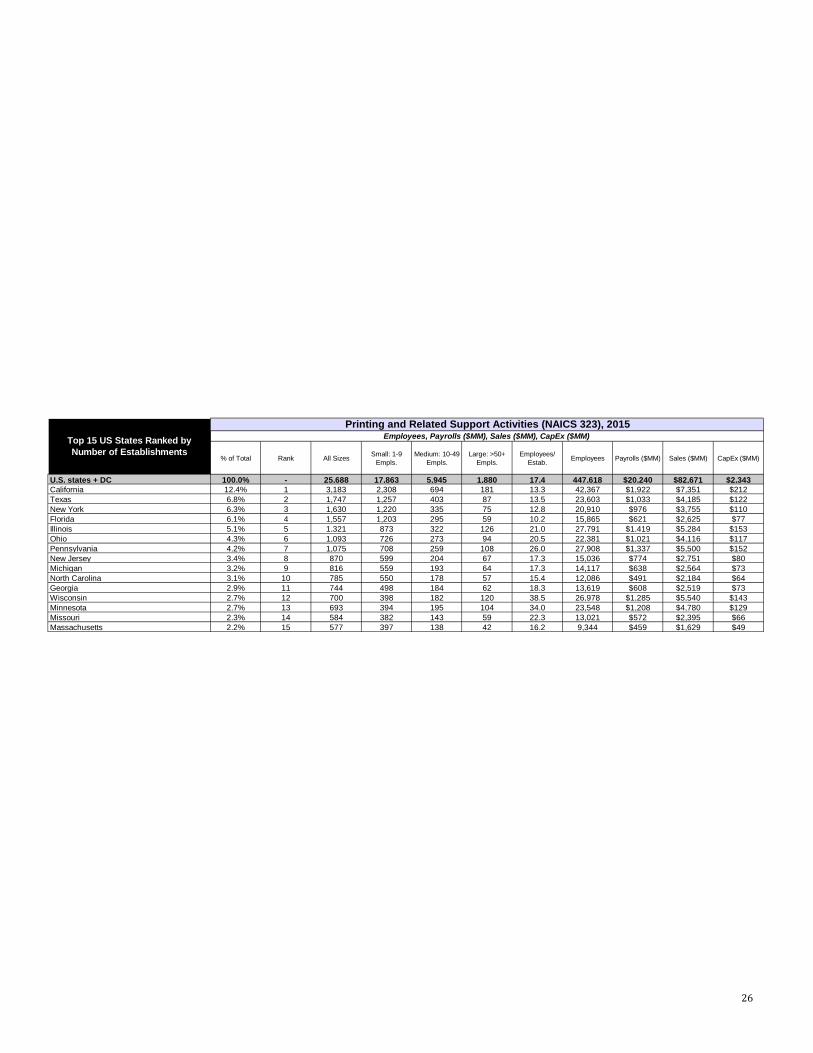
% of Total Rank All Sizes Small: 1-9 Empls.
Medium: 10-49 Empls.
Large: >50+ Empls.
Employees/Estab. Employees Payrolls ($MM) Sales ($MM) CapEx ($MM)
U.S. states + DC 100.0% - 25,688 17,863 5,945 1,880 17.4 447,618 $20,240 $82,671 $2,343California 12.4% 1 3,183 2,308 694 181 13.3 42,367 $1,922 $7,351 $212Texas 6.8% 2 1,747 1,257 403 87 13.5 23,603 $1,033 $4,185 $122New York 6.3% 3 1,630 1,220 335 75 12.8 20,910 $976 $3,755 $110Florida 6.1% 4 1,557 1,203 295 59 10.2 15,865 $621 $2,625 $77Illinois 5.1% 5 1,321 873 322 126 21.0 27,791 $1,419 $5,284 $153Ohio 4.3% 6 1,093 726 273 94 20.5 22,381 $1,021 $4,116 $117Pennsylvania 4.2% 7 1,075 708 259 108 26.0 27,908 $1,337 $5,500 $152New Jersey 3.4% 8 870 599 204 67 17.3 15,036 $774 $2,751 $80Michigan 3.2% 9 816 559 193 64 17.3 14,117 $638 $2,564 $73North Carolina 3.1% 10 785 550 178 57 15.4 12,086 $491 $2,184 $64Georgia 2.9% 11 744 498 184 62 18.3 13,619 $608 $2,519 $73Wisconsin 2.7% 12 700 398 182 120 38.5 26,978 $1,285 $5,540 $143Minnesota 2.7% 13 693 394 195 104 34.0 23,548 $1,208 $4,780 $129Missouri 2.3% 14 584 382 143 59 22.3 13,021 $572 $2,395 $66Massachusetts 2.2% 15 577 397 138 42 16.2 9,344 $459 $1,629 $49
Top 15 US States Ranked by Number of Establishments
Printing and Related Support Activities (NAICS 323), 2015Employees, Payrolls ($MM), Sales ($MM), CapEx ($MM)
26

% of Total Rank All Sizes Small: 1-9 Empls.
Medium: 10-49 Empls.
Large: >50+ Empls.
Employees/Estab. Employees Payrolls ($MM) Sales ($MM) CapEx ($MM)
US Total 100.0% - 25,688 17,863 5,945 1,880 17.4 447,618 $20,240 $82,671 $2,343New York-Newark-Jersey City 6.9% 1 1,780 1,347 355 78 12.3 21,861 $1,107 $3,808 $112Los Angeles-Long Beach-Anaheim 5.9% 2 1,508 1,072 332 104 14.6 22,012 $964 $3,835 $107Chicago-Naperville-Elgin 4.1% 3 1,054 684 266 104 19.4 20,475 $1,114 $3,803 $113Dallas-Fort Worth-Arlington 2.4% 4 606 402 150 54 18.5 11,231 $517 $2,072 $59
Miami-Fort Lauderdale-West Palm Beach 2.2% 5 566 458 89 19 8.7 4,921 $195 $837 $26
Philadelphia-Camden-Wilmington 2.1% 6 550 375 127 48 21.8 11,978 $653 $2,285 $67Minneapolis-St. Paul-Bloomington 1.9% 7 487 272 142 73 31.8 15,498 $868 $3,130 $86Atlanta-Sandy Springs-Roswell 1.9% 7 487 323 125 39 18.9 9,224 $429 $1,775 $51San Francisco-Oakland-Hayward 1.6% 9 414 303 89 22 12.1 5,028 $265 $872 $26Boston-Cambridge-Newton 1.6% 10 401 271 102 28 16.2 6,511 $319 $1,115 $33Houston-The Woodlands-Sugar Land 1.5% 11 385 284 88 13 12.5 4,831 $245 $855 $25Washington-Arlington-Alexandria 1.5% 12 379 254 98 27 18.4 6,975 $352 $1,356 $39Detroit-Warren-Dearborn 1.3% 13 331 238 73 20 14.2 4,716 $232 $852 $25St. Louis 1.2% 14 299 192 75 32 19.5 5,820 $274 $1,037 $30Phoenix-Mesa-Scottsdale 1.2% 15 298 205 78 15 13.2 3,923 $180 $662 $21Seattle-Tacoma-Bellevue 1.1% 16 294 199 76 19 13.3 3,899 $193 $687 $21San Diego-Carlsbad 1.1% 17 286 214 59 13 10.8 3,081 $140 $510 $15Denver-Aurora-Lakewood 1.1% 18 272 204 55 13 13.7 3,724 $174 $703 $21Tampa-St. Petersburg-Clearwater 1.0% 19 255 195 47 13 12.6 3,210 $128 $529 $14Cincinnati 1.0% 19 255 153 73 29 25.7 6,555 $337 $1,226 $35Portland-Vancouver-Hillsboro 1.0% 21 252 173 60 19 15.4 3,893 $187 $708 $21Cleveland-Elyria 0.9% 22 236 162 54 20 20.3 4,795 $209 $902 $25Milwaukee-Waukesha-West Allis 0.9% 23 227 122 64 41 42.2 9,587 $526 $2,040 $52Kansas City 0.9% 24 226 137 61 28 28.1 6,352 $295 $1,207 $31Riverside-San Bernardino-Ontario 0.9% 25 221 164 49 8 11.2 2,482 $98 $405 $12
Top 25 US MSAs Ranked by Number of Establishments
Printing and Related Support Activities (NAICS 323), 2015Employees, Payrolls ($MM), Sales ($MM), CapEx ($MM)
A Metropolitan Statistical Area (MSA) is a geographic entity defined by the Office of Management and Budget for use by federal statistical agencies. An MSA consists of the county or counties (or equivalent entities) that are associated with at least one urbanized area of at least 50,000 population, plus adjacent counties that have a high degree of social and economic integration with the core as measured through studies of worker and other commuting in the area.
27
% of Total Estabs Rank (Popn.) All Sizes Small: 1-9
Empls.Medium: 10-49
Empls.Large: >50+
Empls.Employees/
Estab. Employees Payrolls ($MM) Sales ($MM) CapEx ($MM)
US Total 100.0% - 25,688 17,863 5,945 1,880 17.4 447,618 $20,240 $82,671 $2,343New York 8.2% 1 2,102 1,572 430 100 12.9 27,205 $1,350 $4,762 $140Los Angeles 7.0% 2 1,790 1,279 394 117 14.2 25,350 $1,097 $4,382 $124Chicago 4.2% 3 1,080 699 276 105 19.2 20,753 $1,126 $3,849 $115Washington D.C. 2.4% 4 606 390 168 48 19.9 12,075 $601 $2,308 $67San Francisco 2.6% 5 675 499 143 33 12.1 8,184 $407 $1,431 $43
Chicago CSA includes: Chicago-Naperville-Elgin, Ottawa-Peru, Kankakee, Michigan City-La PorteWashington D.C. CSA includes: Washington-Arlington-Alexandria, DC-VA-MD-WV, Baltimore-Columbia-Towson, Hagerstown-Martinsburg, Chambersburg-Waynesboro, Winchester, California-Lexington Park, Easton, CambridgeSan Francisco CSA includes: San Francisco-Oakland-Hayward, San Jose-Sunnyvale-Santa Clara, Stockton-Lodi, Santa Rosa, Vallejo-Fairfield, Santa Cruz-Watsonville, Napa
Top 5 Combined Statistical Areas (CSA) ranked by Population
Printing and Related Support Activities (NAICS 323), 2015Employees, Payrolls ($MM), Sales ($MM), CapEx ($MM)
New York CSA is the combination of these Metropolitan and Micropolitan Statistical Areas: New York-Newark-Jersey City, Bridgeport-Stamford-Norwalk, New Haven-Milford, Allentown-Bethlehem-Easton, Trenton, Torrington, Kingston, East StroudsburgLos Angeles CSA includes: Los Angeles-Long Beach-Anaheim, Riverside-San Bernardino-Ontario, Oxnard-Thousand Oaks-Ventura
28

Total Small Medium Large Total Small Medium Large Total Small Medium Large Total Small Medium LargeNew England 1,345 932 320 93 1,308 906 311 91 1,282 889 306 88 1,174 818 281 77Mid-Eastern 4,137 2,906 944 287 4,069 2,856 929 284 3,981 2,792 910 278 3,634 2,544 836 253South Eastern 5,230 3,727 1,150 353 5,205 3,713 1,143 350 5,207 3,717 1,142 350 5,241 3,755 1,142 343Great Lakes 5,176 3,319 1,293 564 5,000 3,203 1,249 547 4,918 3,147 1,230 541 4,541 2,897 1,145 500North Central 1,718 1,134 425 159 1,705 1,126 421 157 1,691 1,118 417 156 1,627 1,079 400 148South Central 2,484 1,813 553 118 2,428 1,772 541 116 2,406 1,758 535 114 2,312 1,690 514 108South Western 1,422 1,005 341 76 1,413 998 340 76 1,410 995 338 76 1,386 977 334 75Western 4,176 3,027 919 230 4,140 2,998 912 229 4,116 2,979 910 228 4,019 2,897 897 224
Total 25,688 17,863 5,945 1,880 25,268 17,574 5,845 1,850 25,012 17,396 5,788 1,828 23,935 16,657 5,548 1,729
Total Small Medium Large Total Small Medium Large Total Small Medium Large Total Small Medium LargeNew England 21,527 3,128 6,931 11,469 21,379 3,109 6,933 11,337 21,111 3,085 6,890 11,133 19,744 2,982 6,646 10,118Mid-Eastern 73,500 9,182 20,919 43,399 73,231 9,142 20,845 43,243 71,793 9,013 20,553 42,226 66,031 8,569 19,587 37,874South Eastern 83,024 12,027 23,959 47,039 83,358 12,044 24,058 47,257 83,581 12,158 24,303 47,120 83,939 12,648 25,231 46,061Great Lakes 129,160 11,148 28,431 89,581 129,077 11,057 28,272 89,748 127,781 10,939 28,042 88,799 122,974 10,578 27,446 84,951North Central 34,187 3,819 9,173 21,194 34,826 3,927 9,354 21,546 33,695 3,798 9,095 20,802 31,593 3,663 8,655 19,274South Central 32,760 6,148 11,319 15,293 31,884 5,936 10,999 14,950 31,142 5,814 10,780 14,547 28,166 5,311 9,817 13,039South Western 19,300 3,267 6,986 9,047 19,672 3,317 7,126 9,229 19,560 3,283 7,087 9,191 19,560 3,217 7,077 9,265Western 54,184 9,836 19,205 25,143 52,790 9,469 18,644 24,676 53,526 9,589 18,977 24,960 52,889 9,273 18,762 24,854
Total 447,642 58,555 126,922 262,164 446,216 58,001 126,231 261,986 442,186 57,679 125,728 258,779 424,899 56,240 123,221 245,438
Total Small Medium Large Total Small Medium Large Total Small Medium Large Total Small Medium LargeNew England 1,008 111 315 582 998 110 314 574 982 109 311 562 904 103 298 503Mid-Eastern 3,544 323 963 2,257 3,532 320 958 2,254 3,459 315 943 2,201 3,168 296 892 1,980South Eastern 3,455 370 940 2,145 3,463 369 941 2,154 3,466 371 948 2,147 3,462 382 974 2,107Great Lakes 6,168 380 1,276 4,513 6,160 375 1,266 4,519 6,096 371 1,255 4,470 5,842 355 1,223 4,264North Central 1,415 109 371 935 1,442 111 378 953 1,393 107 367 919 1,302 102 348 852South Central 1,403 186 453 765 1,366 178 439 748 1,330 174 430 726 1,190 156 387 648South Western 806 103 272 431 821 104 277 440 817 103 276 439 819 100 276 444Western 2,438 353 817 1,268 2,383 338 795 1,250 2,411 342 808 1,262 2,384 328 798 1,258
Total 20,236 1,934 5,406 12,896 20,165 1,906 5,368 12,890 19,954 1,891 5,337 12,726 19,072 1,823 5,194 12,055
Total Small Medium Large Total Small Medium Large Total Small Medium Large Total Small Medium LargeNew England 3,833 364 1,091 2,378 3,732 350 1,061 2,321 3,643 342 1,040 2,261 3,255 309 948 1,999Mid-Eastern 13,791 1,069 3,319 9,404 13,692 1,044 3,274 9,374 13,393 1,020 3,215 9,158 12,188 928 2,979 8,281South Eastern 15,141 1,386 3,743 10,013 15,000 1,369 3,717 9,915 14,889 1,365 3,715 9,809 14,532 1,360 3,712 9,460Great Lakes 25,014 1,290 4,477 19,248 24,362 1,238 4,336 18,789 23,977 1,215 4,283 18,480 22,058 1,116 4,020 16,922North Central 6,286 440 1,449 4,397 6,229 433 1,434 4,363 6,158 428 1,423 4,307 5,844 407 1,365 4,071South Central 5,803 711 1,776 3,317 5,704 689 1,740 3,276 5,627 681 1,724 3,222 5,357 647 1,655 3,056South Western 3,406 379 1,102 1,926 3,401 374 1,098 1,929 3,391 372 1,096 1,923 3,362 363 1,083 1,916Western 9,379 1,138 2,969 5,272 9,348 1,120 2,955 5,273 9,309 1,111 2,949 5,250 9,220 1,076 2,926 5,218
Total 82,653 6,775 19,926 55,953 81,468 6,615 19,614 55,240 80,387 6,533 19,445 54,409 75,816 6,205 18,687 50,924
Total Small Medium Large Total Small Medium Large Total Small Medium Large Total Small Medium LargeNew England 112 10 38 63 109 10 37 62 106 9 36 60 94 8 33 53Mid-Eastern 394 30 118 246 391 29 116 245 382 28 114 240 347 25 106 216South Eastern 432 38 130 264 427 37 129 261 423 37 128 258 411 36 126 248Great Lakes 688 36 157 496 669 34 152 484 659 33 150 476 606 30 140 436North Central 175 12 51 113 173 12 50 112 171 12 49 110 161 11 47 104South Central 167 20 62 85 164 19 61 84 161 18 60 83 153 17 57 78South Western 101 11 39 52 101 10 39 52 100 10 39 51 99 10 38 51Western 273 32 101 140 272 31 101 140 270 31 100 140 266 29 99 139
Total 2,343 188 696 1,459 2,305 182 684 1,439 2,274 179 676 1,418 2,136 166 645 1,324
Shipments 2015 $MM Estimate 2016 $MM Estimate 2017 $MM Estimate 2022 $MM Forecast
Capex 2015 $MM Estimate 2016 $MM Estimate 2017 $MM Estimate 2022 $MM Forecast
Employment 2015 Actual 2016 Estimate 2017 Estimate 2022 Forecast
Payrolls 2015 $MM Actual 2016 $MM Estimate 2017 $MM Estimate 2022 $MM Forecast
Printing and Related Support Activities (NAICS 323), 20152015 Summary Data, 2016 and 2017 Estimated Data, 2022 Statistical Trend Forecast
Establishments 2015 Actual 2016 Estimate 2017 Estimate 2022 Forecast
29
Tota
l
Smal
l
Med
ium
Larg
e
Tota
l
Smal
l
Med
ium
Larg
e
Tota
l
Smal
l
Med
ium
Larg
e
U.S. states + DC 25,268 17,572 5,846 1,850 25,014 17,395 5,788 1,831 23,934 16,657 5,549 1,728
New England 1,308 906 311 91 1,283 889 306 88 1,176 818 281 77 Connecticut 328 226 80 23 321 221 78 22 295 204 72 19 Maine 120 94 21 4 117 93 21 4 108 85 19 3 Massachusetts 561 386 134 41 550 379 132 40 504 348 121 35 New Hampshire 136 96 30 10 134 94 30 9 122 87 27 8 Rhode Island 107 66 30 11 105 65 30 10 96 60 27 9 Vermont 56 38 16 3 55 37 15 3 51 34 14 2
Mid-Eastern 4,069 2,856 929 284 3,980 2,792 910 278 3,633 2,544 836 253 Delaware 55 42 12 1 54 41 12 1 49 38 11 1 Washington DC 34 28 6 1 34 27 6 1 31 25 5 1 Maryland 384 241 112 31 375 235 110 30 343 214 101 27 New Jersey 856 589 201 66 837 576 197 65 764 524 181 59 New York 1,603 1,199 330 74 1,568 1,172 323 73 1,431 1,068 297 66 Pennsylvania 1,058 696 255 107 1,035 680 250 105 944 620 229 95 West Virginia 80 62 14 4 78 61 13 4 71 55 12 4
South Eastern 5,206 3,713 1,143 350 5,209 3,717 1,142 350 5,240 3,755 1,142 343 Alabama 326 247 68 11 326 247 68 11 328 250 68 11 Florida 1,550 1,198 293 58 1,551 1,200 293 58 1,562 1,212 293 57 Georgia 740 496 183 61 741 497 183 61 745 502 183 60 Kentucky 322 210 73 40 323 210 72 40 324 213 72 39 Mississippi 137 104 31 3 137 104 31 3 138 105 31 3 North Carolina 781 548 177 57 782 549 177 57 786 554 177 55 South Carolina 306 208 74 24 306 208 73 24 307 211 73 23 Tennessee 522 342 128 53 523 342 128 53 525 346 128 51 Virginia 521 360 117 44 521 360 117 44 524 364 117 43
Great Lakes 4,999 3,203 1,249 547 4,918 3,147 1,230 541 4,542 2,897 1,145 500 Illinois 1,276 842 311 122 1,255 828 306 121 1,159 762 285 112 Indiana 534 356 124 54 525 350 122 54 485 322 113 50 Michigan 788 539 186 62 775 530 184 61 716 488 171 57 Minnesota 669 380 188 101 659 374 185 100 609 344 173 92 Ohio 1,056 701 264 91 1,038 688 260 90 959 634 242 83 Wisconsin 676 384 176 116 666 377 173 115 615 347 161 106
North Central 1,704 1,126 421 157 1,691 1,118 417 156 1,627 1,079 400 148 Idaho 99 76 18 5 98 76 18 5 95 73 17 5 Iowa 305 188 89 29 303 186 88 28 292 180 85 27 Kansas 286 173 73 39 283 172 73 39 272 166 70 37 Missouri 579 379 142 58 575 377 140 58 553 363 135 55 Montana 85 61 23 2 85 60 23 2 82 58 22 2 Nebraska 180 123 41 16 178 122 40 16 171 118 39 15 North Dakota 51 34 15 2 50 34 15 2 48 32 14 2 South Dakota 81 60 17 5 81 59 17 5 78 57 16 5 Wyoming 38 33 4 1 37 33 4 1 36 31 4 1
South Central 1,000 1,772 541 116 2,407 1,758 535 114 2,312 1,690 514 108 Arkansas 196 151 33 12 194 149 33 12 186 144 32 11 Louisiana 251 189 55 8 249 187 54 8 239 180 52 7 Oklahoma 274 204 59 11 271 203 58 11 261 195 56 10 Texas 1,708 1,229 394 86 1,693 1,219 390 84 1,626 1,172 375 80
South Western 1,414 998 340 76 1,409 995 338 76 1,386 977 334 75 Arizona 402 284 98 20 400 283 97 20 394 278 96 20 Colorado 470 356 97 17 469 355 96 17 461 349 95 17 Nevada 174 113 46 15 173 113 46 15 171 111 45 15 New Mexico 118 94 23 1 118 94 23 1 116 92 23 1 Utah 250 150 77 23 249 149 76 23 245 147 75 23
Western 4,139 2,998 912 229 4,117 2,979 910 228 4,018 2,897 897 224 Alaska 40 30 10 39 30 10 38 29 10 California 3,155 2,286 689 180 3,138 2,271 687 179 3,063 2,209 677 176 Hawaii 88 70 14 4 88 70 14 4 86 68 14 4 Oregon 372 258 89 25 370 256 89 25 361 249 88 24 Washington 485 355 110 20 482 352 110 20 470 343 108 19
NOTE: Differences compared to other estimate and trend data sheets due to rounding.
Establishment Estimates and Forecasts 2016,
2017, 2022
Printing and Related Support Activities (NAICS 323)2016 Estimate 2017 Estimate 2022 Forecast
30

Tota
l
Smal
l
Med
ium
Larg
e
Tota
l
Smal
l
Med
ium
Larg
e
Tota
l
Smal
l
Med
ium
Larg
e
U.S. states + DC 446,217 58,002 126,230 261,986 442,183 57,680 125,726 258,778 424,897 56,241 123,220 245,436
New England 21,378 3,109 6,932 11,337 21,107 3,085 6,889 11,133 19,745 2,982 6,645 10,118 Connecticut 5,910 765 1,685 3,460 5,831 759 1,674 3,397 5,437 734 1,615 3,088 Maine 1,547 297 534 717 1,529 294 530 704 1,436 285 512 640 Massachusetts 9,280 1,380 3,031 4,868 9,163 1,370 3,013 4,781 8,574 1,324 2,906 4,345 New Hampshire 2,014 318 622 1,074 1,988 316 618 1,054 1,860 305 596 958 Rhode Island 1,703 226 643 834 1,682 225 639 819 1,578 217 616 744 Vermont 925 122 418 385 915 121 415 378 862 117 401 344
Mid-Eastern 73,230 9,141 20,845 43,243 71,792 9,012 20,553 42,226 66,030 8,568 19,587 37,874 Delaware 411 157 187 67 405 155 185 65 382 148 176 58 Washington DC 328 103 102 123 322 102 100 120 300 97 96 108 Maryland 7,221 786 2,640 3,796 7,084 774 2,603 3,707 6,542 736 2,481 3,325 New Jersey 14,981 1,895 4,539 8,548 14,689 1,868 4,475 8,347 13,527 1,776 4,265 7,486 New York 20,832 3,642 7,287 9,903 20,446 3,591 7,185 9,670 18,935 3,414 6,847 8,674 Pennsylvania 27,806 2,325 5,815 19,666 27,229 2,292 5,734 19,204 24,868 2,179 5,464 17,224 West Virginia 1,650 234 275 1,141 1,616 230 271 1,114 1,477 219 258 999
South Eastern 83,358 12,044 24,058 47,257 83,580 12,158 24,303 47,120 83,939 12,648 25,231 46,061 Alabama 3,337 812 1,393 1,132 3,356 819 1,407 1,129 3,417 852 1,461 1,104 Florida 15,924 3,564 6,052 6,308 16,001 3,598 6,114 6,290 16,238 3,743 6,347 6,148 Georgia 13,675 1,579 4,025 8,071 13,708 1,594 4,066 8,048 13,746 1,658 4,221 7,867 Kentucky 9,559 688 1,655 7,216 9,562 695 1,672 7,195 9,492 723 1,736 7,033 Mississippi 1,442 390 551 501 1,450 394 556 500 1,476 410 578 489 North Carolina 12,134 1,874 3,855 6,405 12,172 1,892 3,894 6,387 12,254 1,968 4,043 6,243 South Carolina 4,755 697 1,473 2,586 4,769 703 1,488 2,578 4,796 732 1,544 2,520 Tennessee 11,060 1,124 2,803 7,133 11,079 1,135 2,831 7,112 11,073 1,181 2,940 6,952 Virginia 11,472 1,316 2,251 7,905 11,484 1,328 2,274 7,882 11,447 1,382 2,361 7,705
Great Lakes 129,077 11,057 28,272 89,748 127,780 10,939 28,042 88,799 122,975 10,578 27,446 84,951 Illinois 27,762 2,803 7,007 17,952 27,485 2,773 6,950 17,763 26,476 2,682 6,802 16,993 Indiana 14,339 1,292 2,644 10,403 14,194 1,278 2,622 10,293 13,650 1,236 2,567 9,847 Michigan 14,096 1,811 3,879 8,406 13,956 1,791 3,848 8,317 13,455 1,732 3,766 7,957 Minnesota 23,546 1,290 4,434 17,822 23,307 1,276 4,398 17,633 22,408 1,234 4,304 16,869 Ohio 22,350 2,494 6,315 13,540 22,129 2,468 6,264 13,397 21,334 2,386 6,131 12,816 Wisconsin 26,985 1,367 3,993 21,625 26,709 1,353 3,960 21,396 25,653 1,308 3,876 20,469
North Central 34,828 3,927 9,354 21,546 33,696 3,798 9,095 20,802 31,593 3,663 8,655 19,274 Idaho 1,103 294 406 402 1,068 285 395 389 1,010 274 375 360 Iowa 6,307 610 1,847 3,851 6,103 590 1,796 3,718 5,722 569 1,709 3,445 Kansas 8,008 628 1,751 5,629 7,745 608 1,703 5,434 7,241 586 1,620 5,035 Missouri 13,262 1,315 3,142 8,805 12,828 1,272 3,055 8,501 12,010 1,227 2,907 7,876 Montana 917 198 460 258 888 192 447 249 842 185 426 231 Nebraska 2,777 404 976 1,397 2,688 391 949 1,348 2,529 377 903 1,249 North Dakota 779 147 342 291 755 142 332 281 713 137 316 260 South Dakota 1,437 209 371 858 1,390 202 360 828 1,305 195 343 767 Wyoming 238 122 60 57 231 118 58 55 220 113 55 51
South Central 31,885 5,936 10,999 14,950 31,141 5,814 10,780 14,547 28,167 5,311 9,817 13,039 Arkansas 3,014 503 751 1,760 2,941 493 736 1,712 2,655 450 670 1,535 Louisiana 2,517 675 1,173 670 2,462 661 1,149 652 2,235 604 1,047 584 Oklahoma 3,379 712 1,014 1,654 3,300 697 993 1,609 2,984 637 905 1,443 Texas 22,975 4,046 8,061 10,867 22,438 3,963 7,901 10,574 20,293 3,620 7,195 9,478
South Western 19,672 3,318 7,126 9,228 19,561 3,284 7,087 9,190 19,559 3,218 7,077 9,264 Arizona 5,215 1,006 2,071 2,138 5,185 996 2,060 2,129 5,179 976 2,057 2,146 Colorado 5,710 1,140 1,961 2,609 5,677 1,128 1,950 2,599 5,672 1,106 1,947 2,620 Nevada 3,185 369 976 1,840 3,168 365 971 1,833 3,174 358 969 1,847 New Mexico 790 307 418 65 784 303 416 65 778 297 415 66 Utah 4,772 496 1,700 2,576 4,747 491 1,691 2,565 4,755 481 1,688 2,586
Western 52,789 9,469 18,644 24,676 53,526 9,589 18,977 24,960 52,889 9,273 18,762 24,854 Alaska 292 110 182 297 111 185 291 108 183 California 41,285 7,176 14,141 19,969 41,859 7,267 14,393 20,199 41,370 7,027 14,230 20,113 Hawaii 912 233 273 406 925 236 278 410 912 228 275 409 Oregon 5,174 831 1,900 2,444 5,247 841 1,934 2,472 5,187 814 1,912 2,461 Washington 5,125 1,120 2,148 1,857 5,199 1,134 2,187 1,878 5,129 1,097 2,162 1,870
NOTE: Differences compared to other estimate and trend data sheets due to rounding.
EmploymentEstimates and Forecasts
2016, 2017, 2022
Printing and Related Support Activities (NAICS 323)2016 Estimate 2017 Estimate 2022 Forecast
31
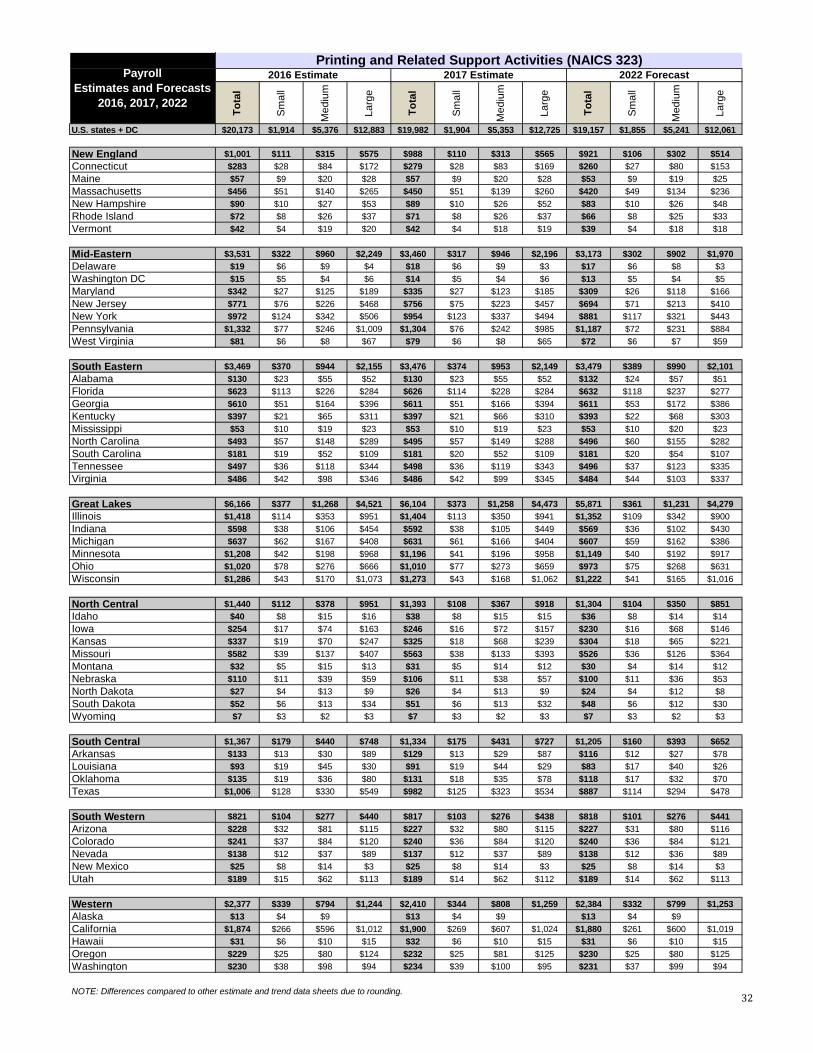
Tota
l
Smal
l
Med
ium
Larg
e
Tota
l
Smal
l
Med
ium
Larg
e
Tota
l
Smal
l
Med
ium
Larg
e
U.S. states + DC $20,173 $1,914 $5,376 $12,883 $19,982 $1,904 $5,353 $12,725 $19,157 $1,855 $5,241 $12,061
New England $1,001 $111 $315 $575 $988 $110 $313 $565 $921 $106 $302 $514Connecticut $283 $28 $84 $172 $279 $28 $83 $169 $260 $27 $80 $153Maine $57 $9 $20 $28 $57 $9 $20 $28 $53 $9 $19 $25Massachusetts $456 $51 $140 $265 $450 $51 $139 $260 $420 $49 $134 $236New Hampshire $90 $10 $27 $53 $89 $10 $26 $52 $83 $10 $26 $48Rhode Island $72 $8 $26 $37 $71 $8 $26 $37 $66 $8 $25 $33Vermont $42 $4 $19 $20 $42 $4 $18 $19 $39 $4 $18 $18
Mid-Eastern $3,531 $322 $960 $2,249 $3,460 $317 $946 $2,196 $3,173 $302 $902 $1,970Delaware $19 $6 $9 $4 $18 $6 $9 $3 $17 $6 $8 $3Washington DC $15 $5 $4 $6 $14 $5 $4 $6 $13 $5 $4 $5Maryland $342 $27 $125 $189 $335 $27 $123 $185 $309 $26 $118 $166New Jersey $771 $76 $226 $468 $756 $75 $223 $457 $694 $71 $213 $410New York $972 $124 $342 $506 $954 $123 $337 $494 $881 $117 $321 $443Pennsylvania $1,332 $77 $246 $1,009 $1,304 $76 $242 $985 $1,187 $72 $231 $884West Virginia $81 $6 $8 $67 $79 $6 $8 $65 $72 $6 $7 $59
South Eastern $3,469 $370 $944 $2,155 $3,476 $374 $953 $2,149 $3,479 $389 $990 $2,101Alabama $130 $23 $55 $52 $130 $23 $55 $52 $132 $24 $57 $51Florida $623 $113 $226 $284 $626 $114 $228 $284 $632 $118 $237 $277Georgia $610 $51 $164 $396 $611 $51 $166 $394 $611 $53 $172 $386Kentucky $397 $21 $65 $311 $397 $21 $66 $310 $393 $22 $68 $303Mississippi $53 $10 $19 $23 $53 $10 $19 $23 $53 $10 $20 $23North Carolina $493 $57 $148 $289 $495 $57 $149 $288 $496 $60 $155 $282South Carolina $181 $19 $52 $109 $181 $20 $52 $109 $181 $20 $54 $107Tennessee $497 $36 $118 $344 $498 $36 $119 $343 $496 $37 $123 $335Virginia $486 $42 $98 $346 $486 $42 $99 $345 $484 $44 $103 $337
Great Lakes $6,166 $377 $1,268 $4,521 $6,104 $373 $1,258 $4,473 $5,871 $361 $1,231 $4,279Illinois $1,418 $114 $353 $951 $1,404 $113 $350 $941 $1,352 $109 $342 $900Indiana $598 $38 $106 $454 $592 $38 $105 $449 $569 $36 $102 $430Michigan $637 $62 $167 $408 $631 $61 $166 $404 $607 $59 $162 $386Minnesota $1,208 $42 $198 $968 $1,196 $41 $196 $958 $1,149 $40 $192 $917Ohio $1,020 $78 $276 $666 $1,010 $77 $273 $659 $973 $75 $268 $631Wisconsin $1,286 $43 $170 $1,073 $1,273 $43 $168 $1,062 $1,222 $41 $165 $1,016
North Central $1,440 $112 $378 $951 $1,393 $108 $367 $918 $1,304 $104 $350 $851Idaho $40 $8 $15 $16 $38 $8 $15 $15 $36 $8 $14 $14Iowa $254 $17 $74 $163 $246 $16 $72 $157 $230 $16 $68 $146Kansas $337 $19 $70 $247 $325 $18 $68 $239 $304 $18 $65 $221Missouri $582 $39 $137 $407 $563 $38 $133 $393 $526 $36 $126 $364Montana $32 $5 $15 $13 $31 $5 $14 $12 $30 $4 $14 $12Nebraska $110 $11 $39 $59 $106 $11 $38 $57 $100 $11 $36 $53North Dakota $27 $4 $13 $9 $26 $4 $13 $9 $24 $4 $12 $8South Dakota $52 $6 $13 $34 $51 $6 $13 $32 $48 $6 $12 $30Wyoming $7 $3 $2 $3 $7 $3 $2 $3 $7 $3 $2 $3
South Central $1,367 $179 $440 $748 $1,334 $175 $431 $727 $1,205 $160 $393 $652Arkansas $133 $13 $30 $89 $129 $13 $29 $87 $116 $12 $27 $78Louisiana $93 $19 $45 $30 $91 $19 $44 $29 $83 $17 $40 $26Oklahoma $135 $19 $36 $80 $131 $18 $35 $78 $118 $17 $32 $70Texas $1,006 $128 $330 $549 $982 $125 $323 $534 $887 $114 $294 $478
South Western $821 $104 $277 $440 $817 $103 $276 $438 $818 $101 $276 $441Arizona $228 $32 $81 $115 $227 $32 $80 $115 $227 $31 $80 $116Colorado $241 $37 $84 $120 $240 $36 $84 $120 $240 $36 $84 $121Nevada $138 $12 $37 $89 $137 $12 $37 $89 $138 $12 $36 $89New Mexico $25 $8 $14 $3 $25 $8 $14 $3 $25 $8 $14 $3Utah $189 $15 $62 $113 $189 $14 $62 $112 $189 $14 $62 $113
Western $2,377 $339 $794 $1,244 $2,410 $344 $808 $1,259 $2,384 $332 $799 $1,253Alaska $13 $4 $9 $13 $4 $9 $13 $4 $9California $1,874 $266 $596 $1,012 $1,900 $269 $607 $1,024 $1,880 $261 $600 $1,019Hawaii $31 $6 $10 $15 $32 $6 $10 $15 $31 $6 $10 $15Oregon $229 $25 $80 $124 $232 $25 $81 $125 $230 $25 $80 $125Washington $230 $38 $98 $94 $234 $39 $100 $95 $231 $37 $99 $94
NOTE: Differences compared to other estimate and trend data sheets due to rounding.
PayrollEstimates and Forecasts
2016, 2017, 2022
Printing and Related Support Activities (NAICS 323)2016 Estimate 2017 Estimate 2022 Forecast
32

Tota
l
Smal
l
Med
ium
Larg
e
Tota
l
Smal
l
Med
ium
Larg
e
Tota
l
Smal
l
Med
ium
Larg
e
U.S. states + DC $81,467 $6,615 $19,613 $55,239 $80,387 $6,533 $19,445 $54,409 $75,816 $6,205 $18,688 $50,924
New England $3,732 $350 $1,061 $2,321 $3,643 $342 $1,040 $2,261 $3,255 $309 $948 $1,998Connecticut $1,072 $86 $259 $727 $1,046 $84 $254 $708 $933 $76 $231 $626Maine $278 $33 $82 $163 $272 $32 $80 $159 $243 $29 $73 $141Massachusetts $1,586 $157 $467 $962 $1,548 $153 $458 $937 $1,384 $138 $418 $828New Hampshire $365 $34 $90 $240 $356 $34 $88 $234 $318 $30 $80 $207Rhode Island $275 $26 $95 $154 $269 $25 $93 $150 $240 $23 $85 $133Vermont $156 $14 $67 $75 $152 $14 $66 $73 $137 $12 $60 $64
Mid-Eastern $13,692 $1,044 $3,274 $9,374 $13,394 $1,020 $3,215 $9,158 $12,188 $928 $2,979 $8,281Delaware $61 $18 $29 $13 $59 $18 $28 $13 $54 $16 $26 $12Washington DC $58 $12 $16 $30 $57 $12 $16 $29 $52 $11 $15 $26Maryland $1,319 $91 $417 $811 $1,290 $89 $410 $792 $1,176 $81 $380 $716New Jersey $2,731 $216 $707 $1,807 $2,672 $212 $694 $1,766 $2,432 $193 $643 $1,596New York $3,722 $416 $1,139 $2,167 $3,643 $407 $1,119 $2,117 $3,321 $370 $1,037 $1,914Pennsylvania $5,467 $263 $922 $4,282 $5,346 $258 $905 $4,183 $4,856 $234 $839 $3,783West Virginia $334 $27 $43 $265 $327 $26 $42 $258 $296 $24 $39 $234
South Eastern $15,000 $1,368 $3,717 $9,915 $14,889 $1,365 $3,715 $9,809 $14,532 $1,360 $3,712 $9,460Alabama $550 $90 $221 $239 $547 $90 $221 $236 $538 $89 $221 $228Florida $2,601 $402 $923 $1,276 $2,586 $401 $923 $1,262 $2,539 $400 $922 $1,217Georgia $2,496 $181 $621 $1,694 $2,477 $180 $621 $1,676 $2,416 $180 $620 $1,616Kentucky $1,924 $77 $257 $1,590 $1,907 $77 $256 $1,573 $1,850 $77 $256 $1,517Mississippi $243 $44 $84 $115 $242 $44 $84 $114 $238 $43 $84 $110North Carolina $2,164 $214 $597 $1,353 $2,148 $214 $597 $1,338 $2,099 $213 $596 $1,291South Carolina $842 $80 $225 $537 $836 $79 $225 $531 $816 $79 $225 $512Tennessee $2,048 $129 $438 $1,482 $2,031 $128 $437 $1,466 $1,978 $128 $437 $1,414Virginia $2,133 $152 $350 $1,631 $2,115 $152 $350 $1,613 $2,057 $151 $350 $1,556
Great Lakes $24,362 $1,238 $4,336 $18,789 $23,977 $1,215 $4,282 $18,480 $22,058 $1,116 $4,020 $16,922Illinois $5,144 $316 $1,089 $3,739 $5,064 $311 $1,076 $3,678 $4,663 $285 $1,010 $3,368Indiana $2,658 $143 $400 $2,116 $2,616 $140 $395 $2,081 $2,405 $129 $371 $1,905Michigan $2,495 $202 $588 $1,705 $2,456 $198 $581 $1,677 $2,263 $182 $545 $1,536Minnesota $4,658 $144 $673 $3,841 $4,584 $141 $665 $3,778 $4,213 $130 $624 $3,459Ohio $4,006 $279 $974 $2,752 $3,944 $274 $962 $2,707 $3,634 $252 $903 $2,479Wisconsin $5,400 $154 $611 $4,636 $5,314 $151 $603 $4,560 $4,880 $139 $567 $4,175
North Central $6,229 $433 $1,434 $4,363 $6,158 $428 $1,423 $4,307 $5,844 $407 $1,365 $4,071Idaho $176 $33 $62 $81 $174 $33 $62 $80 $166 $31 $59 $75Iowa $1,178 $65 $282 $831 $1,164 $64 $280 $820 $1,105 $61 $268 $776Kansas $1,449 $70 $273 $1,106 $1,432 $69 $271 $1,092 $1,358 $66 $260 $1,032Missouri $2,373 $146 $478 $1,749 $2,346 $145 $475 $1,726 $2,225 $138 $455 $1,632Montana $152 $22 $72 $57 $150 $22 $72 $57 $143 $21 $69 $54Nebraska $481 $44 $149 $288 $475 $44 $147 $284 $452 $42 $141 $269North Dakota $124 $16 $53 $54 $123 $16 $53 $54 $117 $15 $51 $51South Dakota $263 $22 $56 $185 $260 $22 $56 $182 $247 $21 $53 $172Wyoming $33 $14 $8 $11 $33 $13 $8 $11 $31 $13 $8 $11
South Central $5,704 $689 $1,740 $3,276 $5,627 $681 $1,724 $3,222 $5,358 $647 $1,655 $3,056Arkansas $569 $58 $119 $392 $561 $57 $118 $386 $534 $54 $114 $366Louisiana $414 $76 $190 $148 $409 $75 $188 $145 $390 $71 $181 $138Oklahoma $607 $82 $151 $374 $599 $81 $150 $368 $570 $77 $144 $349Texas $4,113 $473 $1,279 $2,362 $4,058 $467 $1,267 $2,323 $3,864 $444 $1,217 $2,203
South Western $3,401 $374 $1,098 $1,929 $3,391 $372 $1,096 $1,923 $3,362 $363 $1,083 $1,916Arizona $860 $114 $322 $425 $858 $114 $321 $423 $850 $111 $317 $422Colorado $1,017 $128 $304 $584 $1,014 $128 $304 $582 $1,005 $125 $300 $580Nevada $574 $42 $148 $384 $572 $42 $148 $383 $568 $40 $146 $381New Mexico $110 $35 $62 $13 $109 $34 $62 $13 $108 $34 $61 $13Utah $840 $55 $262 $523 $838 $55 $261 $521 $831 $54 $258 $519
Western $9,348 $1,120 $2,955 $5,273 $9,309 $1,111 $2,949 $5,250 $9,220 $1,076 $2,925 $5,218Alaska $44 $13 $30 $43 $13 $30 $43 $13 $30California $7,327 $850 $2,237 $4,240 $7,297 $844 $2,232 $4,221 $7,228 $817 $2,215 $4,196Hawaii $154 $26 $44 $83 $153 $26 $44 $83 $151 $25 $44 $82Oregon $942 $97 $305 $540 $938 $96 $304 $538 $930 $93 $302 $535Washington $881 $133 $339 $410 $878 $132 $338 $408 $868 $128 $335 $406
NOTE: Differences compared to other estimate and trend data sheets due to rounding.
ShipmentsEstimates and Forecasts
2016, 2017, 2022
Printing and Related Support Activities (NAICS 323)2016 Estimate 2017 Estimate 2022 Forecast
33

Tota
l
Smal
l
Med
ium
Larg
e
Tota
l
Smal
l
Med
ium
Larg
e
Tota
l
Smal
l
Med
ium
Larg
e
U.S. states + DC $2,304.8 $182.0 $683.6 $1,439.3 $2,273.4 $178.7 $676.4 $1,418.4 $2,135.5 $166.2 $645.0 $1,324.3
New England $108.5 $9.5 $37.2 $61.8 $105.7 $9.2 $36.3 $60.2 $93.5 $8.2 $32.6 $52.7Connecticut $29.9 $2.4 $9.3 $18.2 $29.1 $2.3 $9.1 $17.7 $25.7 $2.0 $8.2 $15.5Maine $8.0 $0.9 $2.8 $4.3 $7.8 $0.9 $2.7 $4.2 $6.9 $0.8 $2.5 $3.7Massachusetts $47.1 $4.3 $16.4 $26.4 $45.9 $4.2 $16.0 $25.7 $40.6 $3.7 $14.3 $22.5New Hampshire $10.5 $0.9 $3.0 $6.6 $10.2 $0.9 $2.9 $6.4 $9.0 $0.8 $2.6 $5.6Rhode Island $8.1 $0.7 $3.2 $4.1 $7.9 $0.7 $3.1 $4.0 $7.0 $0.6 $2.8 $3.5Vermont $5.0 $0.4 $2.5 $2.1 $4.9 $0.4 $2.4 $2.1 $4.3 $0.3 $2.2 $1.8
Mid-Eastern $390.7 $29.2 $116.2 $245.3 $382.1 $28.4 $114.1 $239.6 $346.7 $25.4 $105.4 $215.9Delaware $2.0 $0.5 $1.1 $0.4 $1.9 $0.5 $1.0 $0.4 $1.8 $0.4 $1.0 $0.3Washington DC $1.7 $0.3 $0.6 $0.8 $1.7 $0.3 $0.6 $0.8 $1.5 $0.3 $0.5 $0.7Maryland $39.6 $2.6 $14.8 $22.1 $38.7 $2.5 $14.6 $21.6 $35.2 $2.3 $13.5 $19.5New Jersey $79.3 $6.1 $24.7 $48.5 $77.6 $5.9 $24.2 $47.4 $70.4 $5.3 $22.4 $42.7New York $108.8 $11.8 $40.7 $56.4 $106.5 $11.5 $39.9 $55.1 $96.8 $10.2 $36.9 $49.6Pennsylvania $150.7 $7.2 $32.8 $110.7 $147.4 $7.0 $32.2 $108.1 $133.5 $6.2 $29.8 $97.4West Virginia $8.6 $0.7 $1.5 $6.3 $8.4 $0.7 $1.5 $6.2 $7.6 $0.6 $1.4 $5.6
South Eastern $426.8 $37.3 $128.6 $260.9 $423.3 $37.0 $128.1 $258.2 $410.4 $35.7 $126.3 $248.4Alabama $16.6 $2.3 $8.0 $6.3 $16.5 $2.3 $7.9 $6.3 $16.0 $2.2 $7.8 $6.0Florida $75.9 $11.0 $31.3 $33.6 $75.4 $10.9 $31.2 $33.2 $73.3 $10.5 $30.8 $32.0Georgia $71.7 $5.0 $21.7 $45.1 $71.1 $5.0 $21.6 $44.6 $69.0 $4.8 $21.3 $42.9Kentucky $50.4 $2.1 $8.8 $39.5 $49.9 $2.1 $8.8 $39.1 $48.2 $2.0 $8.6 $37.6Mississippi $7.4 $1.2 $3.0 $3.2 $7.3 $1.1 $3.0 $3.2 $7.1 $1.1 $2.9 $3.1North Carolina $63.2 $5.8 $20.6 $36.7 $62.7 $5.8 $20.5 $36.4 $60.8 $5.6 $20.2 $35.0South Carolina $24.0 $2.1 $7.7 $14.1 $23.8 $2.1 $7.7 $14.0 $23.1 $2.0 $7.6 $13.5Tennessee $58.9 $3.5 $15.2 $40.1 $58.4 $3.5 $15.2 $39.7 $56.5 $3.4 $15.0 $38.2Virginia $58.9 $4.3 $12.3 $42.3 $58.3 $4.2 $12.3 $41.8 $56.4 $4.1 $12.1 $40.2
Great Lakes $669.4 $34.2 $151.7 $483.5 $659.4 $33.4 $149.8 $476.2 $606.0 $30.2 $140.1 $435.7Illinois $148.2 $8.9 $38.8 $100.6 $146.0 $8.7 $38.3 $99.1 $134.3 $7.9 $35.8 $90.6Indiana $71.5 $3.8 $13.9 $53.8 $70.4 $3.7 $13.7 $53.0 $64.6 $3.4 $12.8 $48.5Michigan $71.1 $5.5 $20.7 $44.9 $70.1 $5.4 $20.4 $44.2 $64.5 $4.9 $19.1 $40.5Minnesota $125.4 $3.9 $23.4 $98.1 $123.5 $3.8 $23.1 $96.6 $113.5 $3.5 $21.6 $88.4Ohio $114.1 $7.7 $33.7 $72.7 $112.4 $7.5 $33.3 $71.6 $103.4 $6.8 $31.2 $65.5Wisconsin $139.0 $4.2 $21.3 $113.5 $137.0 $4.1 $21.0 $111.8 $125.7 $3.7 $19.7 $102.3
North Central $173.4 $11.8 $49.9 $111.7 $171.2 $11.5 $49.4 $110.3 $161.3 $10.8 $47.0 $103.5Idaho $5.4 $0.9 $2.2 $2.3 $5.3 $0.9 $2.1 $2.3 $5.0 $0.8 $2.0 $2.1Iowa $33.1 $1.7 $9.5 $21.8 $32.7 $1.6 $9.5 $21.6 $30.8 $1.5 $9.0 $20.2Kansas $38.2 $1.9 $9.6 $26.7 $37.8 $1.9 $9.5 $26.4 $35.6 $1.8 $9.0 $24.7Missouri $65.5 $4.1 $16.7 $44.7 $64.7 $4.0 $16.5 $44.1 $60.9 $3.7 $15.7 $41.4Montana $4.9 $0.6 $2.7 $1.6 $4.8 $0.6 $2.7 $1.6 $4.6 $0.6 $2.5 $1.5Nebraska $14.3 $1.2 $5.0 $8.1 $14.1 $1.1 $5.0 $8.0 $13.3 $1.1 $4.7 $7.5North Dakota $3.7 $0.4 $1.9 $1.3 $3.6 $0.4 $1.9 $1.3 $3.4 $0.4 $1.8 $1.2South Dakota $7.3 $0.6 $2.0 $4.8 $7.2 $0.6 $2.0 $4.7 $6.8 $0.5 $1.9 $4.4Wyoming $1.0 $0.4 $0.3 $0.3 $1.0 $0.4 $0.3 $0.3 $0.9 $0.3 $0.3 $0.3
South Central $163.6 $18.7 $60.6 $84.2 $161.2 $18.4 $59.9 $82.8 $152.3 $17.0 $56.9 $78.4Arkansas $15.4 $1.5 $4.2 $9.7 $15.2 $1.5 $4.1 $9.6 $14.4 $1.4 $3.9 $9.1Louisiana $13.0 $2.0 $6.8 $4.2 $12.8 $2.0 $6.7 $4.1 $12.1 $1.8 $6.4 $3.9Oklahoma $16.0 $2.2 $5.0 $8.8 $15.8 $2.2 $4.9 $8.6 $14.9 $2.0 $4.7 $8.2Texas $119.1 $12.9 $44.7 $61.5 $117.4 $12.7 $44.2 $60.5 $111.0 $11.8 $42.0 $57.3
South Western $100.7 $10.3 $38.8 $51.6 $100.3 $10.3 $38.6 $51.4 $98.9 $9.9 $37.9 $51.1Arizona $26.5 $3.1 $11.5 $11.9 $26.4 $3.1 $11.4 $11.8 $26.0 $3.0 $11.2 $11.8Colorado $29.7 $3.6 $11.0 $15.2 $29.6 $3.6 $10.9 $15.2 $29.2 $3.4 $10.7 $15.1Nevada $16.6 $1.2 $5.1 $10.3 $16.5 $1.2 $5.0 $10.3 $16.3 $1.1 $5.0 $10.2New Mexico $3.5 $1.0 $2.1 $0.4 $3.4 $1.0 $2.1 $0.4 $3.4 $0.9 $2.1 $0.4Utah $24.4 $1.5 $9.1 $13.8 $24.3 $1.5 $9.1 $13.8 $24.0 $1.4 $8.9 $13.7
Western $271.7 $31.0 $100.5 $140.2 $270.2 $30.5 $100.1 $139.6 $266.3 $29.0 $98.7 $138.6Alaska $1.5 $0.4 $1.1 $1.5 $0.4 $1.1 $1.5 $0.3 $1.1California $210.9 $23.7 $75.7 $111.5 $209.7 $23.3 $75.4 $111.0 $206.7 $22.2 $74.3 $110.2Hawaii $4.4 $0.7 $1.6 $2.1 $4.4 $0.7 $1.6 $2.1 $4.3 $0.6 $1.6 $2.1Oregon $28.2 $2.6 $10.5 $15.0 $28.0 $2.6 $10.5 $14.9 $27.6 $2.4 $10.3 $14.8Washington $26.8 $3.7 $11.6 $11.6 $26.7 $3.6 $11.5 $11.5 $26.2 $3.4 $11.4 $11.4
NOTE: Differences compared to other estimate and trend data sheets due to rounding.
CapExEstimates and Forecasts
2016, 2017, 2022
Printing and Related Support Activities (NAICS 323)2016 Estimate 2017 Estimate 2022 Forecast
34
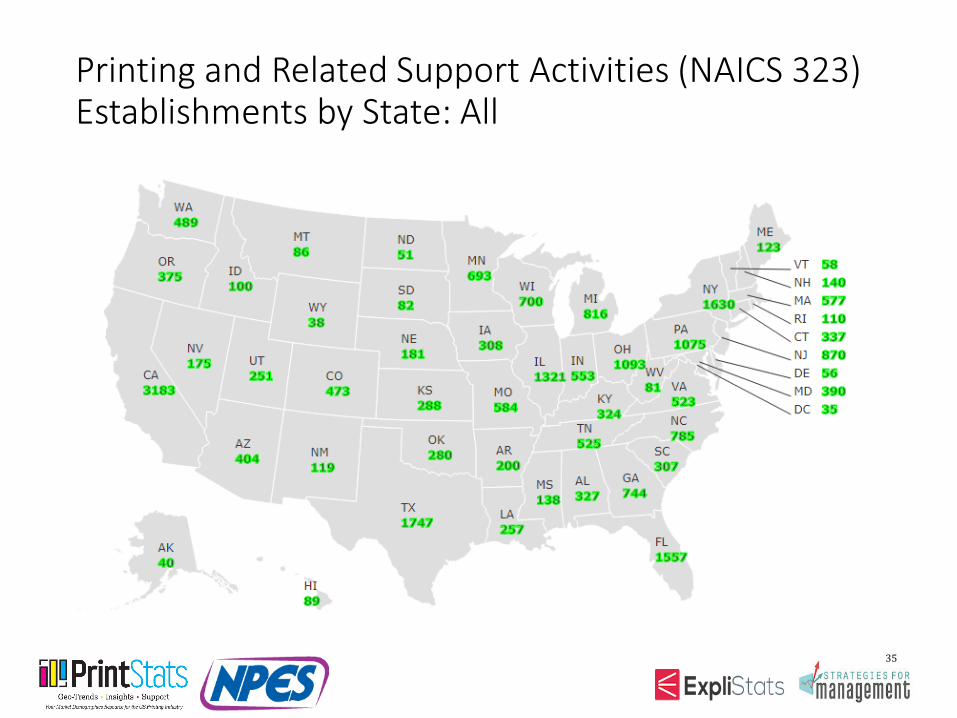
Printing and Related Support Activities (NAICS 323)Establishments by State: All
35
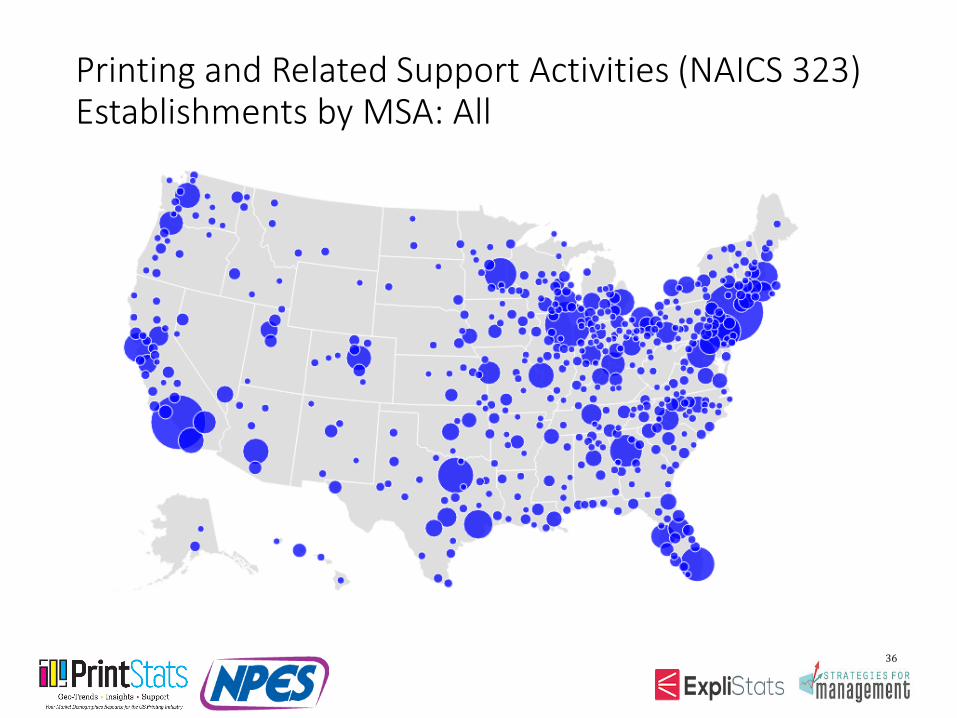
Printing and Related Support Activities (NAICS 323)Establishments by MSA: All
36

Printing and Related Support Activities (NAICS 323)Total Establishments by Region
37
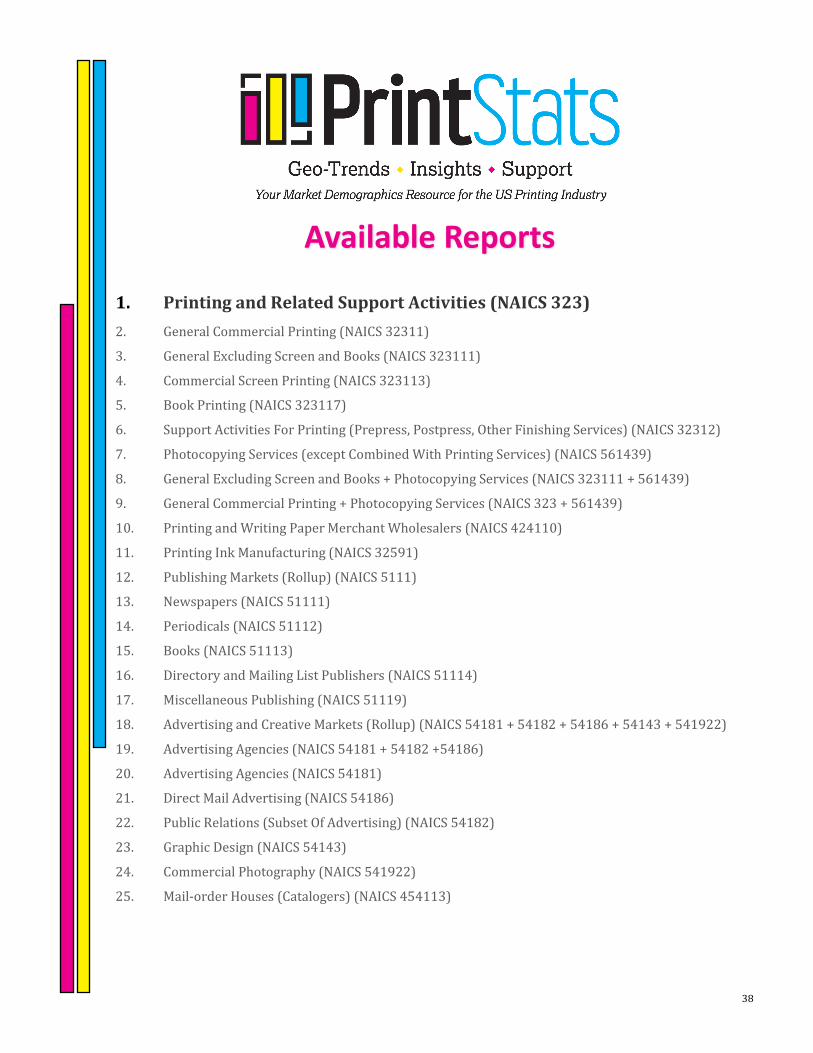
1. Printing and Related Support Activities (NAICS 323)
Available Reports
38

Available Reports (continued)
39
Related Documents