Bull. Chem. Soc. Ethiop. 2016, 30(1), 55-70. ISSN 1011-3924 Printed in Ethiopia 2016 Chemical Society of Ethiopia DOI: http://dx.doi.org/10.4314/bcse.v30i1.5 __________ *Corresponding author. E-mail: [email protected] EVALUATION OF DIFFERENT INTERNAL STANDARDS FOR PRECIOUS METALS QUANTIFICATION Trevor T. Chiweshe, Walter Purcell * and Johan A. Venter Department of Chemistry, University of the Free State, Nelson Mandela Drive, Bloemfontein, 9300, South Africa (Received May 26, 2015; revised November 30, 2015) ABSTRACT. The current study involved the evaluation of five different internal standards (Sc, Co, Y, In and La) as well as normal external or direct calibration methods in the simultaneous quantification of all six platinum group metals (PGMs) and gold (precious metals). The use of Sc as internal standard in the quantitative determination of precious metals in a liquid reference material (RM) and the geological Pyroxenite CRM was shown to yield excellent recoveries (> 99%) compared to the other metals used as internal standard in this study and the direct calibration method (> 91 %).Os recovered only 89% of the expected metal content. The evaluation of different proposed models (wavelength combinations, ionization and/or excitation energy) did not succeed in identifying or discriminating between the unsuccessful and successful internal standards. The robustness of the Sc internal standard addition method was evaluated with the variation in solution matrix (addition of HCl and NaCl). The analytical method (total metal recovery) proved to be very sensitive to elevated unmatched HCl matrix levels (above 1.0 mL of HCl (32% v/v) added) and Na + addition larger than 4 ppm sodium using ICP-OES. KEY WORDS: Internal standard, Scandium, Precious metals, Spectrometric techniques, ICP-OES INTRODUCTION Precious metals, in particular the platinum group metals (PGMs), i.e. Pt, Rh, Ru, Ir, Pd and Os, are extremely useful and important elements in modern life. These metals are used to reduce pollution, for energy applications, as well as construction of catalysts for the production of large-scale industrial chemicals. The automotive industry is the largest consumer of PGMs and utilizes approximately 55% of Pt and Pd world-wide production in the three-way catalyst, using up to 4 g of PGMs per vehicle [1]. The quantification and beneficiation of PGMs are difficult and plagued with numerous challenges, and thus still remains the most rarely studied group of metals despite the introduction of automated analytical techniques such as the ICP-OES/MS, XRF, AA, etc [2]. The first challenge in the quantification and beneficiation is the low concentrations of precious metals in the mineral ores with 350-900 kg ore needed to produce 1 g of pure metal. The concentrations of precious metals in a typical ore also vary significantly with Pt and Pd, which are 5 to 10 times higher than Rh and Ru and around 50 times higher than Os and Ir [3]. The separation of this group as well as the quantification of the individual elements is further complicated by very similar chemical and physical properties. Quantification is also hampered by the use of unreliable methods with poor limit of detection (LOD) and limit of quantification (LOQ), poor sensitivity, selectivity and method robustness. Other problems associated with precious metal quantification includes volatility and instability of some of the products (mainly Os and Ru), lack of certified reference materials (CRMs) and interference caused by easily ionized elements (EIEs). The challenges in analytical chemistry are mainly due to analytical difficulties such as spectral interferences, acid matrices, instrumental drifts and interferences caused by EIE’s, and background emissions involved in generating accurate and reliable quantification methods. These interferences are often reported to result in systematic and random errors, which

Welcome message from author
This document is posted to help you gain knowledge. Please leave a comment to let me know what you think about it! Share it to your friends and learn new things together.
Transcript
Bull. Chem. Soc. Ethiop. 2016, 30(1), 55-70. ISSN 1011-3924 Printed in Ethiopia 2016 Chemical Society of Ethiopia DOI: http://dx.doi.org/10.4314/bcse.v30i1.5
__________ *Corresponding author. E-mail: [email protected]
EVALUATION OF DIFFERENT INTERNAL STANDARDS FOR PRECIOUS METALS QUANTIFICATION
Trevor T. Chiweshe, Walter Purcell* and Johan A. Venter
Department of Chemistry, University of the Free State, Nelson Mandela Drive, Bloemfontein, 9300, South Africa
(Received May 26, 2015; revised November 30, 2015)
ABSTRACT. The current study involved the evaluation of five different internal standards (Sc, Co, Y, In and La) as well as normal external or direct calibration methods in the simultaneous quantification of all six platinum group metals (PGMs) and gold (precious metals). The use of Sc as internal standard in the quantitative determination of precious metals in a liquid reference material (RM) and the geological Pyroxenite CRM was shown to yield excellent recoveries (> 99%) compared to the other metals used as internal standard in this study and the direct calibration method (> 91 %).Os recovered only 89% of the expected metal content. The evaluation of different proposed models (wavelength combinations, ionization and/or excitation energy) did not succeed in identifying or discriminating between the unsuccessful and successful internal standards. The robustness of the Sc internal standard addition method was evaluated with the variation in solution matrix (addition of HCl and NaCl). The analytical method (total metal recovery) proved to be very sensitive to elevated unmatched HCl matrix levels (above 1.0 mL of HCl (32% v/v) added) and Na+ addition larger than 4 ppm sodium using ICP-OES. KEY WORDS: Internal standard, Scandium, Precious metals, Spectrometric techniques, ICP-OES
INTRODUCTION
Precious metals, in particular the platinum group metals (PGMs), i.e. Pt, Rh, Ru, Ir, Pd and Os, are extremely useful and important elements in modern life. These metals are used to reduce pollution, for energy applications, as well as construction of catalysts for the production of large-scale industrial chemicals. The automotive industry is the largest consumer of PGMs and utilizes approximately 55% of Pt and Pd world-wide production in the three-way catalyst, using up to 4 g of PGMs per vehicle [1].
The quantification and beneficiation of PGMs are difficult and plagued with numerous challenges, and thus still remains the most rarely studied group of metals despite the introduction of automated analytical techniques such as the ICP-OES/MS, XRF, AA, etc [2]. The first challenge in the quantification and beneficiation is the low concentrations of precious metals in the mineral ores with 350-900 kg ore needed to produce 1 g of pure metal. The concentrations of precious metals in a typical ore also vary significantly with Pt and Pd, which are 5 to 10 times higher than Rh and Ru and around 50 times higher than Os and Ir [3]. The separation of this group as well as the quantification of the individual elements is further complicated by very similar chemical and physical properties. Quantification is also hampered by the use of unreliable methods with poor limit of detection (LOD) and limit of quantification (LOQ), poor sensitivity, selectivity and method robustness. Other problems associated with precious metal quantification includes volatility and instability of some of the products (mainly Os and Ru), lack of certified reference materials (CRMs) and interference caused by easily ionized elements (EIEs).
The challenges in analytical chemistry are mainly due to analytical difficulties such as spectral interferences, acid matrices, instrumental drifts and interferences caused by EIE’s, and background emissions involved in generating accurate and reliable quantification methods. These interferences are often reported to result in systematic and random errors, which
Trevort Chiweshe et al.
Bull. Chem. Soc. Ethiop. 2016, 30(1)
56
eventually cause loss of accuracy and precision [4]. Research has shown that the most frequently used calibration method, namely direct calibration or ‘straight run’ in spectrometric analysis is severely affected by these interferences [5]. Different spectrometric methods have been developed in the past few years in an attempt to reduce or correct for these numerous matrix effects in spectrometric analysis. Common methods used in spectrometric techniques for correcting matrices are usually empirical and these methods include interactive matrix matching, matrix stripping, standard addition method, mathematical correction by curve fitting to an empirical function [6], matrix swamping, excitation buffering techniques and finally the use of internal standard addition [7]. The use of internal standard calibration method has been reported as one of the preferred methods of matrix correcting because of its cost effectiveness, accuracy and precision compared to the direct calibration and standard addition methods [8].
The application of these methods for precious metal determination is not very common due to the unavailability of suitable internal standard elements, complicated precious metal chemistry in aqueous solution, undefined sample matrix, instrumental drifts and interference caused by other metal impurities. A recent study, however, reported the use of Co as an internal standard for the quantification of Rh in a CRM, in pure metal sample as well as in numerous inorganic and organometallic compounds [9]. Quantification limits (LOQ) of 0.0041 (external calibration) and 0.0010 ppm (Co internal standard) were obtained using these methods. Excellent Rh recoveries between 98.0 and 100.1% were obtained for ten different compounds using Co as internal standard. However, the study also proved that this method is very sensitive to unmatched solution matrices, especially in the presence of excess EIEs (Na+, K+ and Rb+) and excessive acid (HNO3, HCl and HBr) [9].
The aim of this study was to determine the criteria of selecting the most suitable or ideal internal standard for the determination of precious metals and to evaluate Co as a possible internal standard for the quantification of all the precious metals. The objectives also included the evaluation of other possible internal standards such as In, Y, Sc and La in precious metal quantification and to explain (physical and chemical properties) why certain internal standards were more successful than others in the accurate quantification of the PGMs.
EXPERIMENTAL Reagents and glassware
Ammonium hydrogen difluoride (NH4F•HF) (98%), PGMs, gold and the scandium standard solutions (1000 ppm) together with all the mineral acids, HCl (32%) and HNO3 (65%) were bought from Merck Chemicals. The two reference materials used in this study, i.e. the geological CRM (PGMs bearing Pyroxenite Reference Material-Concentrate (IA-MIM C2) and the liquid reference material (RM) were purchased from Mintek and Inorganic Ventures, respectively. The beakers and volumetric flasks were of the Schott Duran type and the volumetric flasks were of Blaubrand, grade A type.
Liquid reference material (RM)
The liquid RM was prepared from mixing ultra-pure PGMs and gold inorganic salts as an analytical standard and stabilized in HCl matrix (3% v/v) to yield an analytical PGMs and gold solution of 10.00 ppm. The concentration of the PGMs and gold, and the uncertainty measurement of this liquid RM were determined using 95% confidence intervals.
Pyroxenite certified reference material (CRM)
The PGMs bearing CRM was the Pyroxenite Reference Material-Concentrate (IA-MIM C2). The material consisted of pyroxene, plagioclase, olivine and serpentine from the Mimosa
Evaluation of different internal standards for precious metals quantification
Bull. Chem. Soc. Ethiop. 2016, 30(1)
57
Mining Company and Zimasco Holdings, and prepared under standard conditions after flotation separation. The homogeneity of the stock was measured with respect to its Cr values and was confirmed by the supplier of the material. The material was then further homogenized and separated before bottling by a certified independent laboratory. The certified concentration values of Au, Rh, Ru and Ir were reported to be between 2-5 µg/g whilst for Pd and Pt between 33-45 µg/g. All the concentrations were reported at 95% confidence intervals using a coverage factor of k = 2. All the reported values were traceable to National Institute of Standards and Technology (NIST) and the values were obtained by independent methods [10].
Instrumentation
Microwave-assisted acid dissolution
An Anton PaarMultiwave 3000 microwave (supplied by Perkin-Elmer) digestion system equipped with an 8SXF 100 rotor and eight polytetrafluoroethylene (PTFE) reaction vessels was used for the acid digestion of the geological CRM. An internal program for the digestion of the PGMs (PGMs XF100-8) was selected with conditions as set in Table 1. Table 1. Microwave conditions (PGMs XF100-8) for the digestion of the geological CRM samples.
Parameter Condition (Mode PGMs XF100-8) Power 1400 Watts Ramp 15 min Hold 15, 45 and 60 min Pressure rate 0.5 bar/s Temperature 240 oC Pressure 60 bar Weight 0.5 g Volume of the acid 10 mL Acid matrix HCl (32%), HNO3 (65%) and aqua regia
Fusion digestion method
Fusion of the geological CRM samples was achieved by using the Barnstead Thermolyne furnace with temperatures ranging from 25 to 1300 ºC. The geological CRM samples were weighed on a Scaltec electronic balance, mixed thoroughly with an excess amount of flux in a known ratio, and then quantitatively transferred into separate platinum crucibles. The sample mixtures were placed in a heating chamber of the furnace for at least an hour until a molten liquid was formed. The resultant melt was cooled to room temperature until a glassy solid was formed. The glassy solid product was then dissolved in distilled water to yield a homogenous solution, which was quantitatively transferred into a volumetric flask for PGMs and Au determination. Table 2. ICP-OES optimum operating conditions for precious metal analysis.
Parameter Condition RF power 1.2 kW Coolant gas flow rate 14.0 L/min Plasma gas flow rate 1.2 L/min Carrier gas flow rate 0.7 L/min Sample uptake method Peristaltic pump Type of spray chamber Glass cyclonic Type of nebulizer Concentric Injector tube diameter 3.0 mm

Trevort Chiweshe et al.
Bull. Chem. Soc. Ethiop. 2016, 30(1)
58
Infrared (IR) spectroscopy and ICP-OES
Characterization of residues obtained after the dissolution/digestion of geological CRM samples were performed on a Digilab (FTS 2000) IR spectrometer. A Shimadzu ICPS-7510 ICP-OES was used for the wet chemical analysis. The ICP-OES with the torch vertically oriented (radial viewing plasma) was chosen for all experimental measurements based on its high sensitivity and good detection limits in this configuration. The ICP-OES optimum conditions for precious metal analysis are shown in Table 2 and were used in all experimental measurements.
General experimental procedure
Double distilled water prepared from an electronic distillatory vessel (Fisons w/FF9/4) was used for all the analytical solution preparations. All the samples were weighed accurately (0.1 mg) on a Scaltec (SBA 33) electronic balance, which was tested in compliance with ISO 9001. To avoid contamination all glassware, digestion vessels and beakers were soaked in freshly prepared 10% v/v HNO3 for at least 48 hours, and washed with double distilled water before use. A Transferpette micro-pipette (± 0.5 µL) was used for the accurate measurement of liquid chemicals and acids at room temperature. All the ICP-OES results were expressed as an average of three individual replicates with the standard deviations indicating the uncertainty in the last digit of the reported value.
Selection of ICP-OES wavelength(s) for the precious metals and internal standards and the determination of the limits of detection and quantification (LOD and LOQ)
The wavelength selection in the quantitative analysis of precious metals and the internal standards (Sc, Co, Y, In and La) was made using the ICP-OES profile function or the Win-image [11]. These programmes allow for a rapid semi-quantitative analysis for multiple wavelength analysis and function the same. The methods involve the recording of a number of background scans against that of the analyte solution. The spectra of the background and analyte are then superimposed upon each other and the resultant spectrum clearly shows the presence or absence of possible interferences on the selected lines for all the elements present in the sample. The most suitable atomic and ionic wavelengths (λ) for the internal standards and precious metals are shown in Table 6. The LOD and LOQ of precious metal for determination by ICP-OES werecalculated according to Equation 1 [12] by plotting the measured response at the selected wavelengths of the precious metals against their corresponding standard concentrations.
LOD = 3 x sblank
/m (1)
where sblank
is the standard deviation of the blank and m is the gradient of the calibration curve.
The average reported LOQ was a higher factor than the average LOD (see Table 3).
Preparation of the calibration standards
Preparation of the precious metal calibration standards (direct calibration method)
Calibration standards for the precious metals were prepared from the original PGMs and Au stock solutions (1000 ppm) to concentrations of 0.0 (blank), 0.05, 0.1, 0.2, 0.5 and 1.0 ppm in separate volumetric flasks (100.0 mL) using a ‘Transferpette’ micro-pipette. Equal volumes of HCl (5.0 mL; 32%) was added to these flasks and were filled to the mark using double distilled water. The solutions were homogenized and left to stabilize for an hour before use.
Evaluation of different internal standards for precious metals quantification
Bull. Chem. Soc. Ethiop. 2016, 30(1)
59
Preparation of the precious metal calibration standards (internal standard method)
Calibration standards for the precious metals were prepared from the original PGMs and Au stock solutions (1000 ppm) to concentrations of 0.0 (blank), 0.01, 0.05, 0.1, 0.2 and 1.0 ppm in separate volumetric flasks (100.0 mL) using a ‘Transferpette’ micro-pipette. To each standard solution, aliquots (0.2 mL; 1000 ppm) of the prepared internal standard solutions (Co, Y, Sc, La and In) were added. Equal volumes of HCl (5.0 mL; 32%) were added to each solution and the volumetric flasks were filled to the mark using double distilled water. The solutions were thoroughly mixed to ensure homogeneity and left to stabilize for an hour before use.
Evaluation of internal standards in the quantification of the precious metals present in the liquid reference material
Aliquots (triplicate) of the liquid RM solution (7.0 mL; 10.00 ppm) were pipetted into separate volumetric flasks (100.0 mL). To each flask, equal volumes of the different internal standards (0.2 mL; 1000 ppm) were added. The solutions were acidified with HCl (5.0 mL; 32%) and the volumetric flasks were filled to the mark using double distilled water. The solutions were homogenized and left to stabilize for an hour before analysis, three times for precious metal content after every 24 hours (see Table 4).
Quantification of precious metals in the geological certified reference material (CRM)
For digestion of the geological CRM all the solid lumps in the CRM were first reduced to a fine powder using a mortar and pestle before drying at 110 ºC in an oven for 48 hours to remove all traces of moisture. The theoretical concentrations (µg/g or ppm) of the precious metals in 0.5 g CRM sample (reported as 0.049 Au, 0.445 Pt, 0.334 Pd, 0.0401 Rh, 0.0376 Ru and 0.0218 Ir) were found to be well above the LOD’s for the different elements (see Table 3) if dissolved and diluted to 50.0 mL. This facilitated the continuation of this investigation using Sc as internal standard (see precious metal recovery using Sc in Table 5). All the qualitative and quantitative measurements for the CRM samples were done using ICP-OES, which is capable of handling large amounts of total dissolved solids (TDS) [13].
In the acid assisted microwave digestion of the geological CRM three solid geological CRM samples (ca. 0.5 g) were accurately weighed and quantitatively transferred to microwave polytetrafluoroethylene (PTFE) vessels. Equal volumes of either HCl (10.0 mL; 32%), HNO3 (10.0 mL; 65%) or aqua regia(10.0 mL) were added to each of the PTFE vessels and the mixtures were digested under microwave conditions specified in Table 1. The resultant mixtures were filtered to separate the soluble product from any possible insoluble residue remaining in the reaction mixture after microwave digestion. The remaining solid residue were dried and characterized by IR as described in the Fusion digestion method section and reported in Figure 1. The filtrates were heated to reduce the acid volume to yield a final volume of approximately 2 mL. Equal volumes of HCl (5.0 mL; 32%) were added to each filtrate solution to ensure matrix matching with the standard solutions. The analyte solutions were then quantitatively transferred to separate volumetric flasks (50.0 mL), the Sc internal standard (0.1 mL; 1000 ppm) was added and the flasks were filled to the mark using double distilled water. The samples were left to stabilize for an hour prior to quantification using both direct (external) calibration and Sc internal standard methods (see Table 5).
With the ammonium hydrogen bifluoride (NH4F•HF) flux fusion of the geological CRM, three powdered geological CRM samples (ca. 0.5 g) were thoroughly mixed in a 1:20 ratio with NH4F•HF. The mixtures were quantitatively transferred to platinum crucibles and further homogenized before heated in an oven. The sample mixtures were heated for an hour whilst gently increasing the temperature (optimum temperature 250 ºC) until homogeneous melts was formed. The resultant melts were cooled at room temperature until the melt turned glassy. The
Trevort Chiweshe et al.
Bull. Chem. Soc. Ethiop. 2016, 30(1)
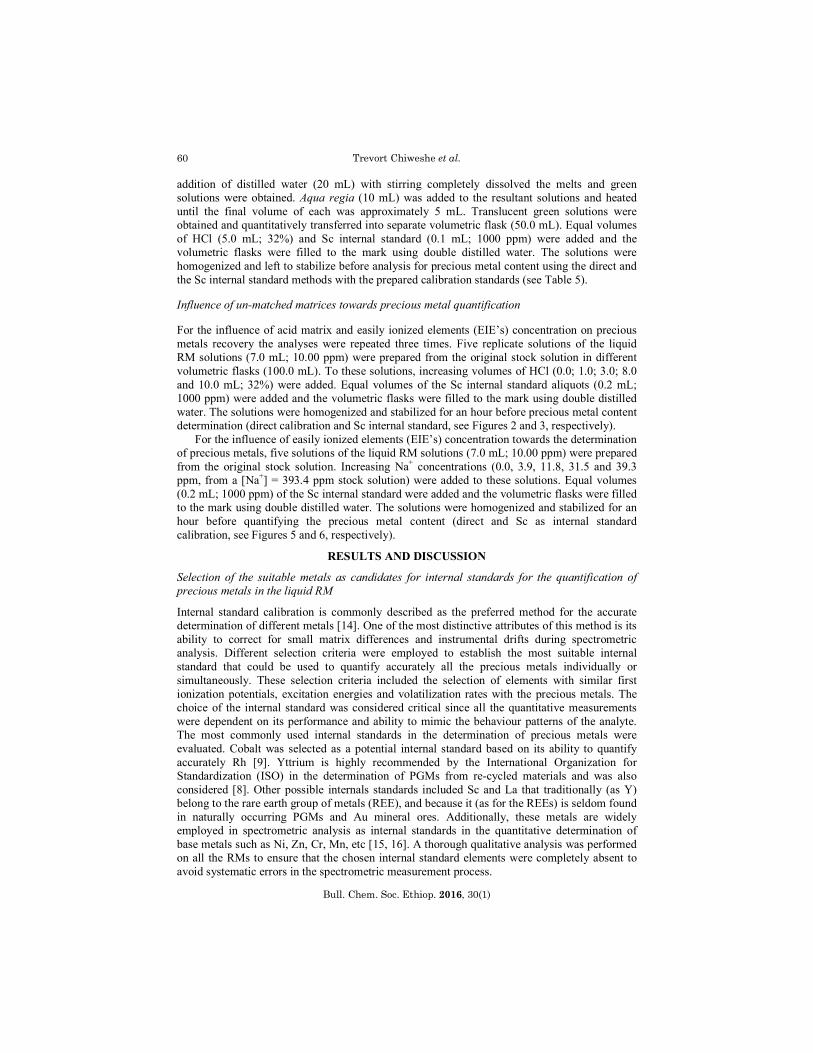
60
addition of distilled water (20 mL) with stirring completely dissolved the melts and green solutions were obtained. Aqua regia (10 mL) was added to the resultant solutions and heated until the final volume of each was approximately 5 mL. Translucent green solutions were obtained and quantitatively transferred into separate volumetric flask (50.0 mL). Equal volumes of HCl (5.0 mL; 32%) and Sc internal standard (0.1 mL; 1000 ppm) were added and the volumetric flasks were filled to the mark using double distilled water. The solutions were homogenized and left to stabilize before analysis for precious metal content using the direct and the Sc internal standard methods with the prepared calibration standards (see Table 5).
Influence of un-matched matrices towards precious metal quantification
For the influence of acid matrix and easily ionized elements (EIE’s) concentration on precious metals recovery the analyses were repeated three times. Five replicate solutions of the liquid RM solutions (7.0 mL; 10.00 ppm) were prepared from the original stock solution in different volumetric flasks (100.0 mL). To these solutions, increasing volumes of HCl (0.0; 1.0; 3.0; 8.0 and 10.0 mL; 32%) were added. Equal volumes of the Sc internal standard aliquots (0.2 mL; 1000 ppm) were added and the volumetric flasks were filled to the mark using double distilled water. The solutions were homogenized and stabilized for an hour before precious metal content determination (direct calibration and Sc internal standard, see Figures 2 and 3, respectively).
For the influence of easily ionized elements (EIE’s) concentration towards the determination of precious metals, five solutions of the liquid RM solutions (7.0 mL; 10.00 ppm) were prepared from the original stock solution. Increasing Na+ concentrations (0.0, 3.9, 11.8, 31.5 and 39.3 ppm, from a [Na+] = 393.4 ppm stock solution) were added to these solutions. Equal volumes (0.2 mL; 1000 ppm) of the Sc internal standard were added and the volumetric flasks were filled to the mark using double distilled water. The solutions were homogenized and stabilized for an hour before quantifying the precious metal content (direct and Sc as internal standard calibration, see Figures 5 and 6, respectively).
RESULTS AND DISCUSSION
Selection of the suitable metals as candidates for internal standards for the quantification of precious metals in the liquid RM
Internal standard calibration is commonly described as the preferred method for the accurate determination of different metals [14]. One of the most distinctive attributes of this method is its ability to correct for small matrix differences and instrumental drifts during spectrometric analysis. Different selection criteria were employed to establish the most suitable internal standard that could be used to quantify accurately all the precious metals individually or simultaneously. These selection criteria included the selection of elements with similar first ionization potentials, excitation energies and volatilization rates with the precious metals. The choice of the internal standard was considered critical since all the quantitative measurements were dependent on its performance and ability to mimic the behaviour patterns of the analyte. The most commonly used internal standards in the determination of precious metals were evaluated. Cobalt was selected as a potential internal standard based on its ability to quantify accurately Rh [9]. Yttrium is highly recommended by the International Organization for Standardization (ISO) in the determination of PGMs from re-cycled materials and was also considered [8]. Other possible internals standards included Sc and La that traditionally (as Y) belong to the rare earth group of metals (REE), and because it (as for the REEs) is seldom found in naturally occurring PGMs and Au mineral ores. Additionally, these metals are widely employed in spectrometric analysis as internal standards in the quantitative determination of base metals such as Ni, Zn, Cr, Mn, etc [15, 16]. A thorough qualitative analysis was performed on all the RMs to ensure that the chosen internal standard elements were completely absent to avoid systematic errors in the spectrometric measurement process.
Evaluation of different internal standards for precious metals quantification
Bull. Chem. Soc. Ethiop. 2016, 30(1)
61
Evaluation of internal standards in precious metal recovery in the liquid RM
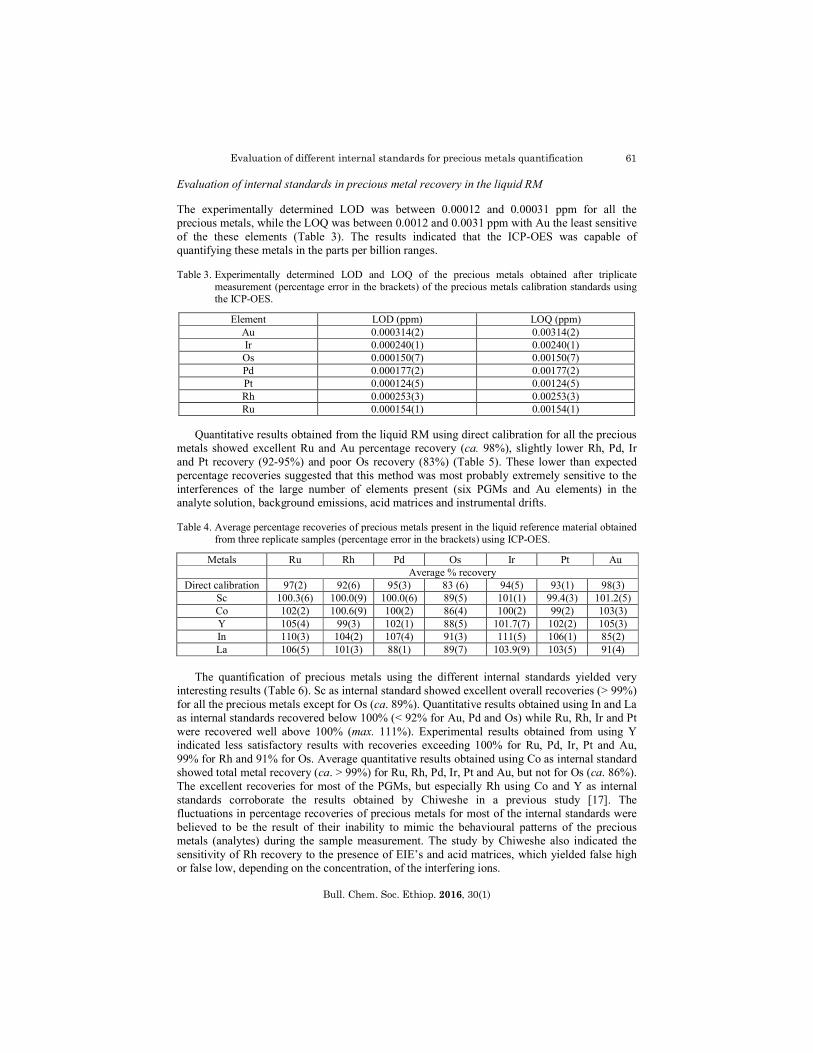
The experimentally determined LOD was between 0.00012 and 0.00031 ppm for all the precious metals, while the LOQ was between 0.0012 and 0.0031 ppm with Au the least sensitive of the these elements (Table 3). The results indicated that the ICP-OES was capable of quantifying these metals in the parts per billion ranges. Table 3. Experimentally determined LOD and LOQ of the precious metals obtained after triplicate
measurement (percentage error in the brackets) of the precious metals calibration standards using the ICP-OES.
Element LOD (ppm) LOQ (ppm) Au 0.000314(2) 0.00314(2) Ir 0.000240(1) 0.00240(1) Os 0.000150(7) 0.00150(7) Pd 0.000177(2) 0.00177(2) Pt 0.000124(5) 0.00124(5) Rh 0.000253(3) 0.00253(3) Ru 0.000154(1) 0.00154(1)
Quantitative results obtained from the liquid RM using direct calibration for all the precious metals showed excellent Ru and Au percentage recovery (ca. 98%), slightly lower Rh, Pd, Ir and Pt recovery (92-95%) and poor Os recovery (83%) (Table 5). These lower than expected percentage recoveries suggested that this method was most probably extremely sensitive to the interferences of the large number of elements present (six PGMs and Au elements) in the analyte solution, background emissions, acid matrices and instrumental drifts. Table 4. Average percentage recoveries of precious metals present in the liquid reference material obtained
from three replicate samples (percentage error in the brackets) using ICP-OES.
Metals Ru Rh Pd Os Ir Pt Au Average % recovery
Direct calibration 97(2) 92(6) 95(3) 83 (6) 94(5) 93(1) 98(3) Sc 100.3(6) 100.0(9) 100.0(6) 89(5) 101(1) 99.4(3) 101.2(5) Co 102(2) 100.6(9) 100(2) 86(4) 100(2) 99(2) 103(3) Y 105(4) 99(3) 102(1) 88(5) 101.7(7) 102(2) 105(3) In 110(3) 104(2) 107(4) 91(3) 111(5) 106(1) 85(2) La 106(5) 101(3) 88(1) 89(7) 103.9(9) 103(5) 91(4)
The quantification of precious metals using the different internal standards yielded very
interesting results (Table 6). Sc as internal standard showed excellent overall recoveries (> 99%) for all the precious metals except for Os (ca. 89%). Quantitative results obtained using In and La as internal standards recovered below 100% (< 92% for Au, Pd and Os) while Ru, Rh, Ir and Pt were recovered well above 100% (max. 111%). Experimental results obtained from using Y indicated less satisfactory results with recoveries exceeding 100% for Ru, Pd, Ir, Pt and Au, 99% for Rh and 91% for Os. Average quantitative results obtained using Co as internal standard showed total metal recovery (ca. > 99%) for Ru, Rh, Pd, Ir, Pt and Au, but not for Os (ca. 86%). The excellent recoveries for most of the PGMs, but especially Rh using Co and Y as internal standards corroborate the results obtained by Chiweshe in a previous study [17]. The fluctuations in percentage recoveries of precious metals for most of the internal standards were believed to be the result of their inability to mimic the behavioural patterns of the precious metals (analytes) during the sample measurement. The study by Chiweshe also indicated the sensitivity of Rh recovery to the presence of EIE’s and acid matrices, which yielded false high or false low, depending on the concentration, of the interfering ions.
Trevort Chiweshe et al.
Bull. Chem. Soc. Ethiop. 2016, 30(1)
62
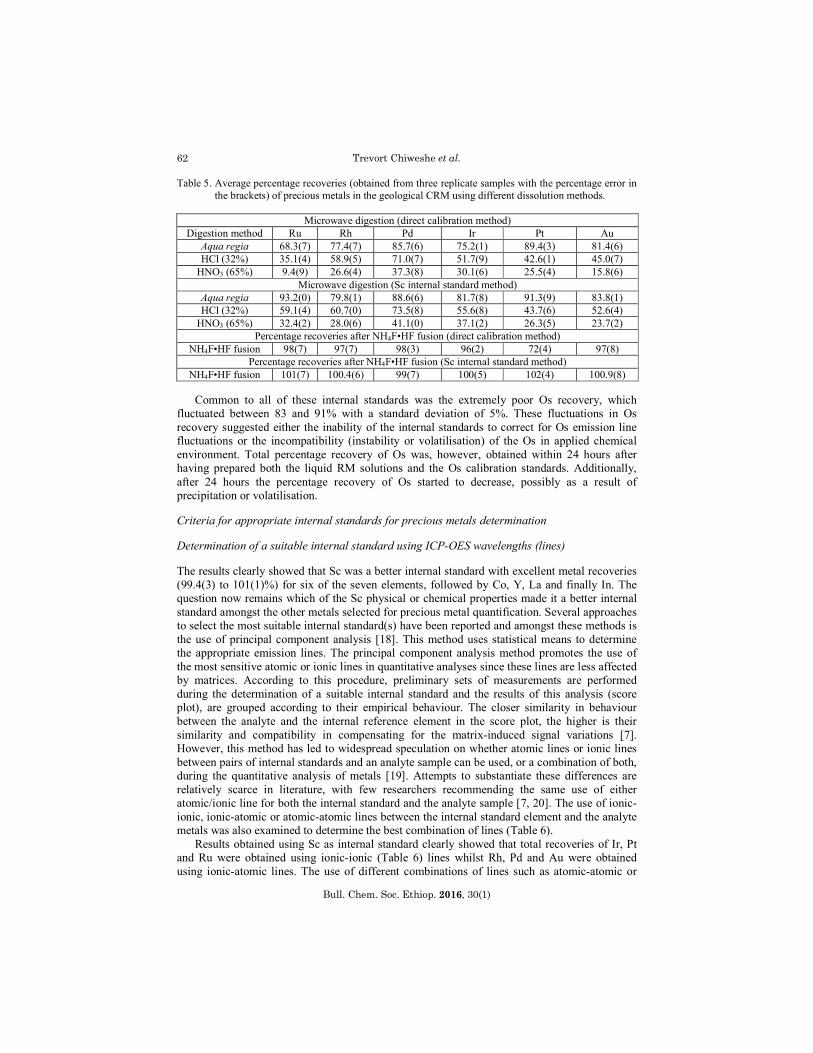
Table 5. Average percentage recoveries (obtained from three replicate samples with the percentage error in the brackets) of precious metals in the geological CRM using different dissolution methods.
Microwave digestion (direct calibration method)
Digestion method Ru Rh Pd Ir Pt Au Aqua regia 68.3(7) 77.4(7) 85.7(6) 75.2(1) 89.4(3) 81.4(6) HCl (32%) 35.1(4) 58.9(5) 71.0(7) 51.7(9) 42.6(1) 45.0(7)
HNO3 (65%) 9.4(9) 26.6(4) 37.3(8) 30.1(6) 25.5(4) 15.8(6) Microwave digestion (Sc internal standard method)
Aqua regia 93.2(0) 79.8(1) 88.6(6) 81.7(8) 91.3(9) 83.8(1) HCl (32%) 59.1(4) 60.7(0) 73.5(8) 55.6(8) 43.7(6) 52.6(4)
HNO3 (65%) 32.4(2) 28.0(6) 41.1(0) 37.1(2) 26.3(5) 23.7(2) Percentage recoveries after NH4F•HF fusion (direct calibration method)
NH4F•HF fusion 98(7) 97(7) 98(3) 96(2) 72(4) 97(8) Percentage recoveries after NH4F•HF fusion (Sc internal standard method)
NH4F•HF fusion 101(7) 100.4(6) 99(7) 100(5) 102(4) 100.9(8)
Common to all of these internal standards was the extremely poor Os recovery, which fluctuated between 83 and 91% with a standard deviation of 5%. These fluctuations in Os recovery suggested either the inability of the internal standards to correct for Os emission line fluctuations or the incompatibility (instability or volatilisation) of the Os in applied chemical environment. Total percentage recovery of Os was, however, obtained within 24 hours after having prepared both the liquid RM solutions and the Os calibration standards. Additionally, after 24 hours the percentage recovery of Os started to decrease, possibly as a result of precipitation or volatilisation.
Criteria for appropriate internal standards for precious metals determination
Determination of a suitable internal standard using ICP-OES wavelengths (lines)
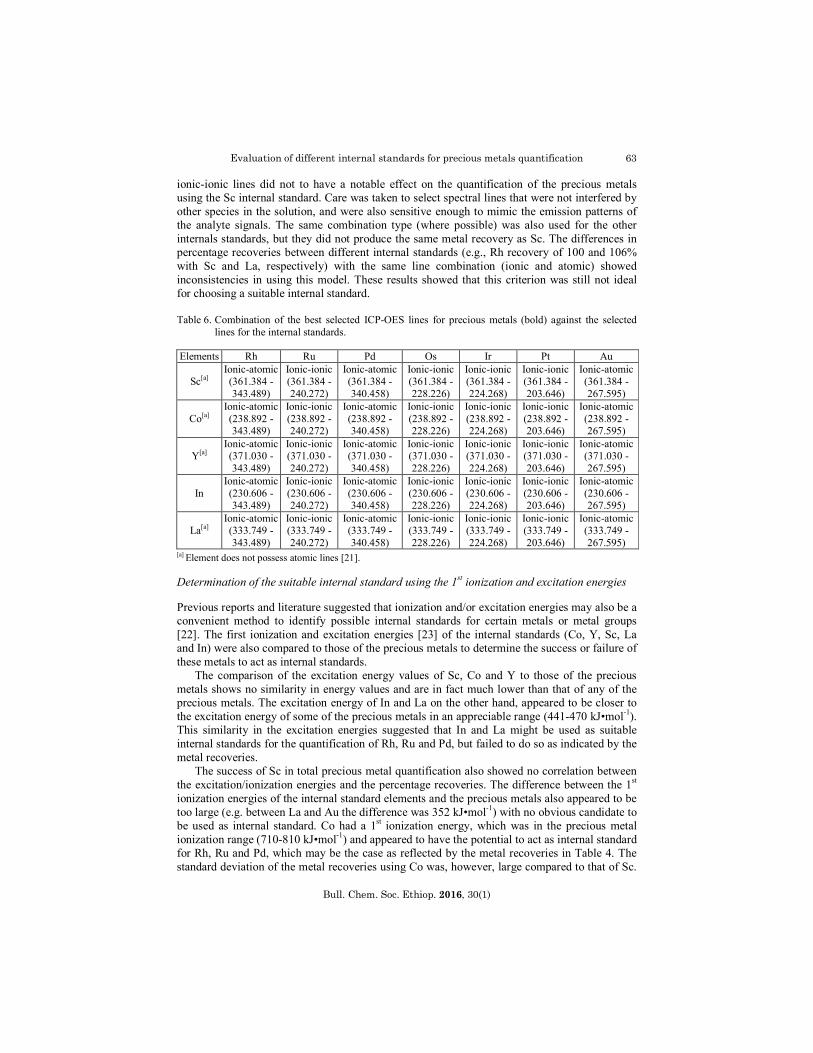
The results clearly showed that Sc was a better internal standard with excellent metal recoveries (99.4(3) to 101(1)%) for six of the seven elements, followed by Co, Y, La and finally In. The question now remains which of the Sc physical or chemical properties made it a better internal standard amongst the other metals selected for precious metal quantification. Several approaches to select the most suitable internal standard(s) have been reported and amongst these methods is the use of principal component analysis [18]. This method uses statistical means to determine the appropriate emission lines. The principal component analysis method promotes the use of the most sensitive atomic or ionic lines in quantitative analyses since these lines are less affected by matrices. According to this procedure, preliminary sets of measurements are performed during the determination of a suitable internal standard and the results of this analysis (score plot), are grouped according to their empirical behaviour. The closer similarity in behaviour between the analyte and the internal reference element in the score plot, the higher is their similarity and compatibility in compensating for the matrix-induced signal variations [7]. However, this method has led to widespread speculation on whether atomic lines or ionic lines between pairs of internal standards and an analyte sample can be used, or a combination of both, during the quantitative analysis of metals [19]. Attempts to substantiate these differences are relatively scarce in literature, with few researchers recommending the same use of either atomic/ionic line for both the internal standard and the analyte sample [7, 20]. The use of ionic-ionic, ionic-atomic or atomic-atomic lines between the internal standard element and the analyte metals was also examined to determine the best combination of lines (Table 6). Results obtained using Sc as internal standard clearly showed that total recoveries of Ir, Pt and Ru were obtained using ionic-ionic (Table 6) lines whilst Rh, Pd and Au were obtained using ionic-atomic lines. The use of different combinations of lines such as atomic-atomic or
Evaluation of different internal standards for precious metals quantification
Bull. Chem. Soc. Ethiop. 2016, 30(1)
63
ionic-ionic lines did not to have a notable effect on the quantification of the precious metals using the Sc internal standard. Care was taken to select spectral lines that were not interfered by other species in the solution, and were also sensitive enough to mimic the emission patterns of the analyte signals. The same combination type (where possible) was also used for the other internals standards, but they did not produce the same metal recovery as Sc. The differences in percentage recoveries between different internal standards (e.g., Rh recovery of 100 and 106% with Sc and La, respectively) with the same line combination (ionic and atomic) showed inconsistencies in using this model. These results showed that this criterion was still not ideal for choosing a suitable internal standard. Table 6. Combination of the best selected ICP-OES lines for precious metals (bold) against the selected
lines for the internal standards.
Elements Rh Ru Pd Os Ir Pt Au
Sc[a] Ionic-atomic (361.384 - 343.489)
Ionic-ionic (361.384 - 240.272)
Ionic-atomic (361.384 - 340.458)
Ionic-ionic (361.384 - 228.226)
Ionic-ionic (361.384 - 224.268)
Ionic-ionic (361.384 - 203.646)
Ionic-atomic (361.384 - 267.595)
Co[a] Ionic-atomic (238.892 - 343.489)
Ionic-ionic (238.892 - 240.272)
Ionic-atomic (238.892 - 340.458)
Ionic-ionic (238.892 - 228.226)
Ionic-ionic (238.892 - 224.268)
Ionic-ionic (238.892 - 203.646)
Ionic-atomic (238.892 - 267.595)
Y[a] Ionic-atomic (371.030 - 343.489)
Ionic-ionic (371.030 - 240.272)
Ionic-atomic (371.030 - 340.458)
Ionic-ionic (371.030 - 228.226)
Ionic-ionic (371.030 - 224.268)
Ionic-ionic (371.030 - 203.646)
Ionic-atomic (371.030 - 267.595)
In Ionic-atomic (230.606 - 343.489)
Ionic-ionic (230.606 - 240.272)
Ionic-atomic (230.606 - 340.458)
Ionic-ionic (230.606 - 228.226)
Ionic-ionic (230.606 - 224.268)
Ionic-ionic (230.606 - 203.646)
Ionic-atomic (230.606 - 267.595)
La[a] Ionic-atomic (333.749 - 343.489)
Ionic-ionic (333.749 - 240.272)
Ionic-atomic (333.749 - 340.458)
Ionic-ionic (333.749 - 228.226)
Ionic-ionic (333.749 - 224.268)
Ionic-ionic (333.749 - 203.646)
Ionic-atomic (333.749 - 267.595)
[a] Element does not possess atomic lines [21].
Determination of the suitable internal standard using the 1st ionization and excitation energies
Previous reports and literature suggested that ionization and/or excitation energies may also be a convenient method to identify possible internal standards for certain metals or metal groups [22]. The first ionization and excitation energies [23] of the internal standards (Co, Y, Sc, La and In) were also compared to those of the precious metals to determine the success or failure of these metals to act as internal standards.
The comparison of the excitation energy values of Sc, Co and Y to those of the precious metals shows no similarity in energy values and are in fact much lower than that of any of the precious metals. The excitation energy of In and La on the other hand, appeared to be closer to the excitation energy of some of the precious metals in an appreciable range (441-470 kJ•mol-1). This similarity in the excitation energies suggested that In and La might be used as suitable internal standards for the quantification of Rh, Ru and Pd, but failed to do so as indicated by the metal recoveries.
The success of Sc in total precious metal quantification also showed no correlation between the excitation/ionization energies and the percentage recoveries. The difference between the 1st ionization energies of the internal standard elements and the precious metals also appeared to be too large (e.g. between La and Au the difference was 352 kJ•mol-1) with no obvious candidate to be used as internal standard. Co had a 1st ionization energy, which was in the precious metal ionization range (710-810 kJ•mol-1) and appeared to have the potential to act as internal standard for Rh, Ru and Pd, which may be the case as reflected by the metal recoveries in Table 4. The standard deviation of the metal recoveries using Co was, however, large compared to that of Sc.

Trevort Chiweshe et al.
Bull. Chem. Soc. Ethiop. 2016, 30(1)
64
Another example was the 1st ionization energies of In and La. According to the selection criteria, these metals should theoretically be the most probable internal standards (close to 1st ionization energy) for the quantification of Ru, Rh and Pd. The analytical results, however, indicated recoveries in excess of 100% for both internal standards. Over-estimation/determination of results as shown by Y, In and La is commonly associated with substantial differences in the physical properties (ionization and emission intensities) of the internal standards and the analytes [24] while the under-estimation as indicated by the recovery of Os, Pd and Au (In and La) is mostly a result of the suppression of the analyte or internal standard’s emission intensities [25]. Chiweshe reported that the similarity in the 1st ionization energy of the Co and Rh analytes may be the reason for the total Rh recovery (100%) in the CRM, inorganic salts and different organometallic compounds, but it now seems to be coincidental [9]. This selection method using the excitation/ionization energies was found to be unsuccessful as most of the results obtained were either too high or low compared to the expected theoretical values. It is clear that current theories or models are still not able to predict accurately the success, or the identification of metals to be used as internal standards, and that only experimental evaluation ensuring that no spectral interferences occur and using validation parameters is currently useful to identify successful internal standards.
Determination of precious metals in the geological CRM sample
Acid assisted microwave digestion of the geological CRM
Visual inspection indicated that microwave digestion using aqua regia, HCl and HNO3was unsuccessful in the total dissolution of the mineral CRM. The colour of the collected residues obtained from the three mineral acids differed considerably. The residue after HNO3 dissolution was greyish, almost the same as that of the original geological CRM, while the solids obtained after HCl and aqua regia dissolution were brown and light yellow, respectively. Apart from the colour differences, no significant differences in the final masses (after drying) between the residues and the original geological CRM samples were observed. Further characterization of the residue was carried out using IR to quantify the chemical changes that occurred in the geological CRM during the digestion process (Figure 1).
Figure 1. Infrared spectrum of the digested geological CRM residues in different mineral acids.
Evaluation of different internal standards for precious metals quantification
Bull. Chem. Soc. Ethiop. 2016, 30(1)
65
Fairly high percentages of all the precious metals (see Table 6) were obtained using aqua regia with approximately 68% recovered using direct calibration and > 80% using Sc as internal standard [26]. HCl leached the next highest amount of precious metals with up to 73% of Pd recovered (Sc internal standard), while HNO3 only recovered 41% under the same conditions. In all the cases, recovery using Sc as internal standard improved dramatically compared to direct calibration, which was in accordance with the liquid RM study. The precious metals percentage recoveries were shown to increase in the order HNO3 < HCl < aqua regia using both calibration methods.
A comparison between the metal recoveries and the IR spectrum (Figure 1) revealed very interesting results. The IR spectra showed significant changes in the stretching frequency in the region of 1739 cm-1, which signified a change in the chemical composition between the original geological CRM and the resultant solids after digestion. The decrease in the stretching frequency at 1739 cm-1 (CRM > HNO3 > HCl > aqua regia) coincide with an increase in the percentage recovery of precious metals (see Table 5), suggesting that this stretching frequency may be associated with the precious metals in the mineral. The unchanged stretching frequencies in the region of 600-1000 cm-1 possibly represented the undissolved precious metals and other elements present in the CRM or silica (SiO2), which is traditionally highly inert in normal mineral acid digestions. This incomplete dissolution and poor metal recoveries in the geological CRM using microwave digestion prompted the search for an alternative dissolution method [27].
Fusion of the geological CRM using ammonium hydrogen bifluoride (NH4F•HF) flux
Visual inspection indicated the complete dissolution of the geological CRM using NH4F•HF as flux (to prevent the introduction of EIEs) in a 1:20 ratio at 250 oC. Qualitative determination of the completely dissolved geological CRM revealed the presence of 17 other elements (excluding the precious metals), which consisted mainly of the alkaline and transition metals in the 10-100 ppm range and included Mg, Al, Ca, Ti, V, Cr, Mn, Fe, Ni, Cu, Zn, Ga, Sr, Ba, Ag, TI and Pb. The selected precious metal and Sc spectral lines (Table 6) were re-evaluated prior to quantification to prevent spectral interference by this large group of elements with the previously selected wavelengths. Total percentage recoveries (> 99%) for all the precious metals were obtained using Sc as internal standard (see Table 5) with lower percentage recoveries using direct calibration.
Effect of the acid matrix on metal recovery in the liquid RM using Sc as internal standard
The effect of unmatched acid matrices in precious metals recovery was also investigated in order to determine the limitations and the robustness of the newly developed Sc internal standard method. These tests are necessary in order to establish the highest level of interference permissible with this method. Os was excluded from this study since its optimum conditions for accurate determination was still not established. The most commonly used acid (HCl) in sample preparation, and stabilization of precious metal standards and analyte solutions was used to determine the effects of the unmatched acid matrix. Optimum ICP-OES conditions, which were employed in the previous experimental determination, were used in this part of the study.
Quantitative results revealed that the increase in HCl volumes within the solution matrix had a profound (but different) effect on the total recovery of all the precious metals using both direct calibration and Sc as internal standard (Figures 2 and 3). Metal recovery using direct calibration methods were highly affected by this incremental HCl increase with decreasing recoveries for most the metals. Au, Ru, Rh, Pd and Pt recoveries decreased from 95 to 85% with the increase in HCl content. Ir on the other hand was found to yield higher than expected percentage recovery from approximately 98 to 105% with the increase in the HCl matrix.

Trevort Chiweshe et al.
Bull. Chem. Soc. Ethiop. 2016, 30(1)
66
Figure 2. Effects of unmatched HCl acid (32%) matrix in the percentage recovery of precious metals (obtained from three replicate samples) using direct calibration.
Figure 3. Effects of unmatched HCl acid (32%) matrix in the percentage recovery of precious metals (obtained from three replicate samples) using Sc as internal standard.
Total percentage recoveries of all the precious metals where initially obtained were the acid concentration of the standards were similar to those of the analyte solutions (match matrix). A slight difference in the in HCl (1.0 mL) concentration between the standards and the analyte solutions (unmatched matrix) had a smaller influence on precious metal recovery using Sc as internal standard method (Figure 3). The percentage recoveries fluctuated above (Ru and Rh) and below (Au, Pd, Ir and Pt) total recovery with increase in HCl. The decrease in the percentage recovery may be attributed to factors such as viscosity and mobility changes in the solution.
Evaluation of different internal standards for precious metals quantification
Bull. Chem. Soc. Ethiop. 2016, 30(1)
67
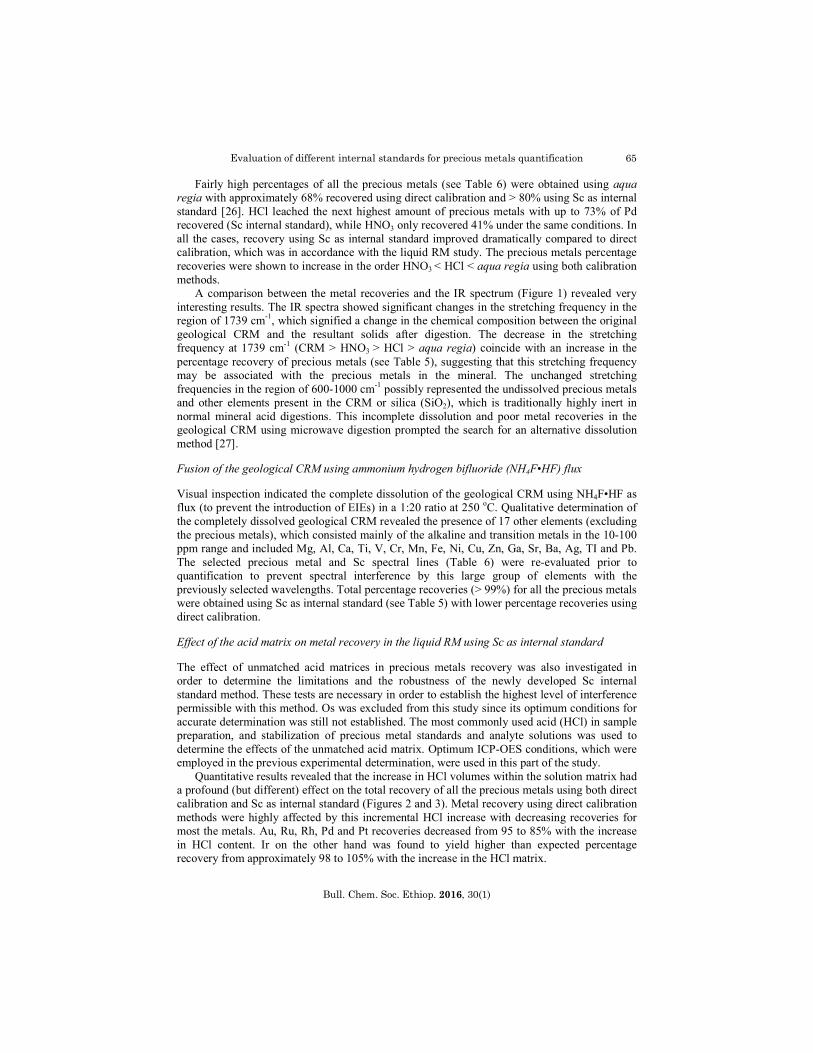
The emission intensities of Sc were monitored to determine the extent at which increasing amounts of HCl affected these emission signals. The Sc emission intensities decreased as the HCl volumes increased (Figure 4). The Sc emission signals obtained in the liquid RM solutions containing below 1.0 mL of HCl (32% v/v) were relative unaffected by this difference, which was also corroborated by the relatively good recoveries at these HCl increases. The relative stability of the Sc emission intensities below 1.0 mL of the HCl (32% v/v) indicated that it was able to suppress any changes of precious metals emission intensities at these levels. This ability to resist the emission ratio change (IPGMS/ISc) with an increase of the HCl content was consistent with the total percentage recovery (>100%) obtained for Au, Rh, Ru, Pd and Ir, except for Pt ca. 98%, at these unmatched acid levels.
Figure 4. The effects of increasing HCl acid (32%) matrices on the Sc emission intensities from
three replicate samples using ICP-OES.
Effects of increasing sodium content (EIEs) on the scandium internal standard method
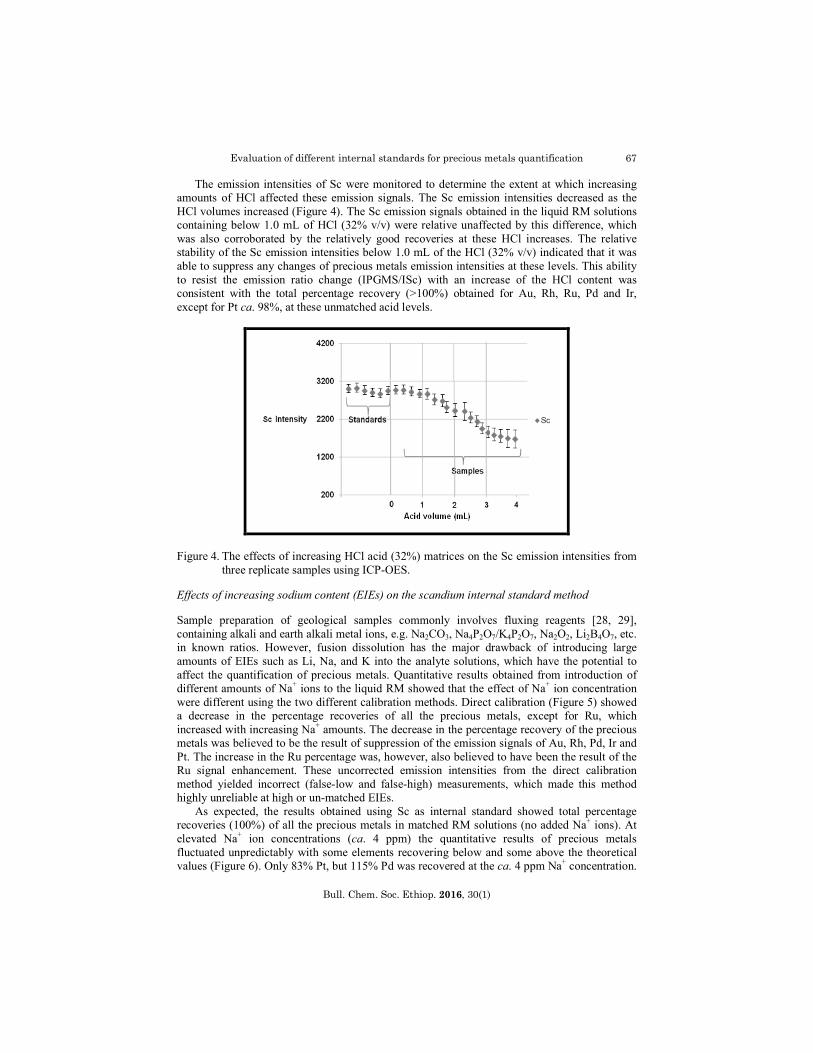
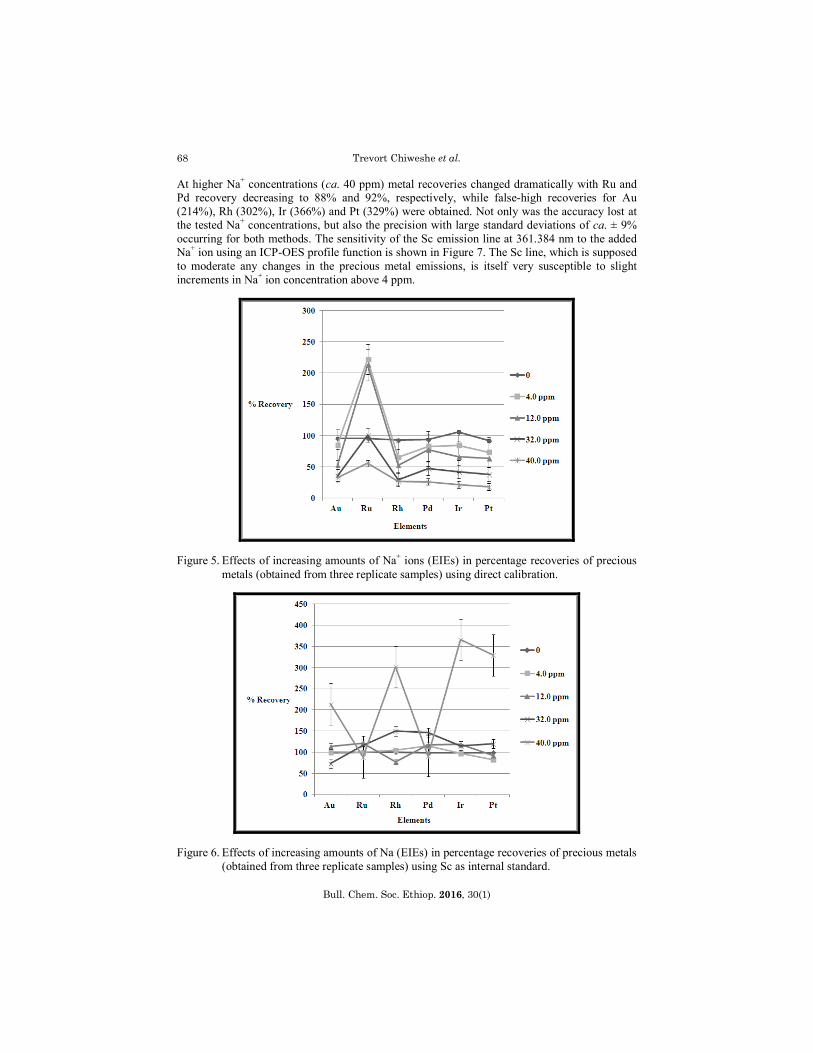
Sample preparation of geological samples commonly involves fluxing reagents [28, 29], containing alkali and earth alkali metal ions, e.g. Na2CO3, Na4P2O7/K4P2O7, Na2O2, Li2B4O7, etc. in known ratios. However, fusion dissolution has the major drawback of introducing large amounts of EIEs such as Li, Na, and K into the analyte solutions, which have the potential to affect the quantification of precious metals. Quantitative results obtained from introduction of different amounts of Na+ ions to the liquid RM showed that the effect of Na+ ion concentration were different using the two different calibration methods. Direct calibration (Figure 5) showed a decrease in the percentage recoveries of all the precious metals, except for Ru, which increased with increasing Na+ amounts. The decrease in the percentage recovery of the precious metals was believed to be the result of suppression of the emission signals of Au, Rh, Pd, Ir and Pt. The increase in the Ru percentage was, however, also believed to have been the result of the Ru signal enhancement. These uncorrected emission intensities from the direct calibration method yielded incorrect (false-low and false-high) measurements, which made this method highly unreliable at high or un-matched EIEs. As expected, the results obtained using Sc as internal standard showed total percentage recoveries (100%) of all the precious metals in matched RM solutions (no added Na+ ions). At elevated Na+ ion concentrations (ca. 4 ppm) the quantitative results of precious metals fluctuated unpredictably with some elements recovering below and some above the theoretical values (Figure 6). Only 83% Pt, but 115% Pd was recovered at the ca. 4 ppm Na+ concentration.
Trevort Chiweshe et al.
Bull. Chem. Soc. Ethiop. 2016, 30(1)
68
At higher Na+ concentrations (ca. 40 ppm) metal recoveries changed dramatically with Ru and Pd recovery decreasing to 88% and 92%, respectively, while false-high recoveries for Au (214%), Rh (302%), Ir (366%) and Pt (329%) were obtained. Not only was the accuracy lost at the tested Na+ concentrations, but also the precision with large standard deviations of ca. ± 9% occurring for both methods. The sensitivity of the Sc emission line at 361.384 nm to the added Na+ ion using an ICP-OES profile function is shown in Figure 7. The Sc line, which is supposed to moderate any changes in the precious metal emissions, is itself very susceptible to slight increments in Na+ ion concentration above 4 ppm.
Figure 5. Effects of increasing amounts of Na+ ions (EIEs) in percentage recoveries of precious metals (obtained from three replicate samples) using direct calibration.
Figure 6. Effects of increasing amounts of Na (EIEs) in percentage recoveries of precious metals (obtained from three replicate samples) using Sc as internal standard.

Evaluation of different internal standards for precious metals quantification
Bull. Chem. Soc. Ethiop. 2016, 30(1)
69
Figure 7. Effects of increasing Na content (EIEs) on the Sc internal standard in the
determination of precious metals using the ICP-OES at 361.384 nm.
Thus, the determination of precious metals using both the direct calibration and the Sc internal standard method was found to be affected by the increase in Na+ ions (EIEs) in solution. The effect of EIEs are reported to increase the electron density of the ICP-OES/MS plasma, which commonly results in the suppression of either the internal standard or analyte emission signals or both [30], resulting in poor accuracy and precision in precious metal recovery.
CONCLUSIONS
The selection of the suitable internal standard for precious metal quantification was achieved through the experimental evaluation of the percentage recoveries as the current theories or models could not be used to predict accurately the metal(s) to be used as internal standards for the precious metals. The use of either atomic-atomic or atomic-ionic lines combination between the Sc internal standard and the precious metals did not have any negative effects towards the determination of precious metals as long as the chosen line was not interfered with by any of the elements present in solution. The Sc internal addition method was found to be the most appropriate method for all the quantification of the precious metals based on its ability to yield total recovery of precious metals in both CRMs, except for Os. However, the use of Co as internal standard was found to yield false-high recoveries for Ru and Au (above 100%) and low Os recoveries (86%) which made it not ideal for the quantification of all the precious metals. The developed Sc internal standard method is affected by unmatched HCl and Na+ ion concentrations (EIEs) of more than 1.0 mL of the added HCl and 4 ppm, respectively. Poor Os recovery can be attributed to either the instability of the Os standards/analyte solutions or product volatility, which necessitates further investigation.
ACKNOWLEDGEMENTS
The authors thank the National Research Fund of SA, Research Fund of the University of the Free State and Inkabaye Afrika for the financial support.

Trevort Chiweshe et al.
Bull. Chem. Soc. Ethiop. 2016, 30(1)
70
REFERENCES
1. Pettrucci, F.; Bocca, B.; Alimonti, A.; Caroli, S. J. Anal. At. Spectrom. 2000, 15, 525. 2. Barefoot, R.R.; Van Loon, J.C. Talanta 1999, 49, 1. 3. Cawthorn R.G. Platinum Metals Rev. 2010, 54, 205. 4. Chan, G.C.Y.; Hieftje, G.M. J. Anal. At. Spectrom. 2009, 24, 439. 5. Steharnik, M.; Todorovic, M.; Manojlovic, D.; Stankovic, D.; Mutic, J.; Trujic, V. J. Serb.
Chem. Soc. 2013, 78, 565. 6. Al-Ammar, A.S. Spectrochim. Acta Part B 2003, 58, 1391. 7. Grotti, M.; Magi, E.; Leardi, R. J. Anal. At. Spectrom. 2003, 18, 274. 8. International Organization for Standardization Determination of platinum in platinum
jewellery alloys-method using inductively coupled plasma emission spectroscopy on a solution with yttrium as internal standard, Doc. ISO/DIS 11494.2; 2007.
9. Chiweshe, T.T.; Purcell, W.; Venter, J.A. S. Afr. J. Chem. 2012, 66, 7. 10. Mintek Analytical Services Division, Schedule of Srvices. Available at:
http://www.mintek.co.za/wp-content/uploads/2011/10/Analytical-Services-brochure.pdf, accessed on August 26, 2013.
11. Corre, N.L. ICP Atomic Emission Spectroscopy Application Note 31, JobinYvon S.A.S., Horiba Group: Longjumeau, France. Available at: http://www.horiba.com/fileadmin/uploads/Scientific/Documents/Emission/ICP31.pdf; accessed on January 22, 2016.
12. Skoog, D.A.; Holler, F.J.; Nieman, T.A. Principles of Instrumental Analysis, 5th ed., Saunders College Publishing: USA; 1998.
13. Zachariadis, G. A.; Sarafidou, P.C. Microchim. Acta 2009, 166, 77. 14. Hou, X.; Jones, B.T. Inductively Coupled Plasma/Optical Emission Spectrometry in
Encyclopedia of Analytical Chemistry, Meyers, R.A. (Ed.), John Wiley and Sons Ltd: Chichester; 2000; pp 9468- 9485.
15. Brenner, I.B.; Watson, A.E.; Russell, G.M.; Goncalves, M. Chem. Geol. 1980, 28, 321. 16. Mendes, T.M.F.F.; Baccan, S.; Cadore, S. J. Braz. Chem. Soc. 2006, 17, 168. 17. Chiweshe, T.T. Quantification of rhodium in series of inorganic and organometallic
compounds, MSc Thesis, University of the Free State, Bloemfontein, South Africa, 2010. 18. Bezerra, A.M.; Bruns, R.E.; Ferreira, S.L.C. Anal. Chim. Acta 2006, 580, 251. 19. Brill, M.; Wiedemann, K.H. Gold Bull. 1992, 25, 13. 20. Finley-Jones, H.J.; Molloyx, J.L.; Holcombe, J.A. J. Anal. At. Spectrom. 2008, 23, 1214. 21. Winge, R.K.; Fassel, V.A.; Peterson, V.J.; Floyd, M.A. Inductively Coupled Plasma-Atomic
Emission Spectroscopy, Elsevier Science Publishers B. V.: Amsterdam; 1985. 22. Beamish, F.E.; Van Loon, J.C.; Lewis, C.L. Analysis of Noble Metals: Overview and
Selected Methods, Academic Press: New York; 1977. 23. Sansonetti, J.E.; Martin, W.C.; Young, S.L. Handbook of Basic Atomic Spectroscopic Data
(Version 1.1), National Institute of Standards and Technology: Gaithersburg; 2004. 24. Rabb, S. A.; Olesik, J. W. Spectrochim. Acta Part B 2008, 63, 244. 25. Schmidt, G.J.; Slavin, W. Anal. Chem. 1982, 54, 2491. 26. Chiweshe, T.T. Quantification of iridium and other platinum group metals in the presence of
naturally occurring contaminants in geological ore, PhD Thesis, University of the Free State, Bloemfontein, South Africa, 2014.
27. Balcerzak, M. Anal. Sci. 2002, 18, 737. 28. Christian, G. D. Analytical Chemistry, 5th ed., John Wiley and Sons: New York; 1994. 29. Bassette, J.; Denney, R.C.; Jeffery, G.H.; Mendham, J. Vogel’s Textbook of Quantitative
Inorganic Analysis, 4th ed., John Wiley and Sons Inc: New York; 1978. 30. Brenner, I.B.; Zander, A.; Cole, M.; Wiseman, A. J. Anal. At. Spectrom. 1997, 12, 897.
Related Documents