24MAR201117103028

Welcome message from author
This document is posted to help you gain knowledge. Please leave a comment to let me know what you think about it! Share it to your friends and learn new things together.
Transcript

24MAR201117103028
PRINCIPAL FINANCIAL GROUP, INC.TABLE OF CONTENTS
PART I . . . . . . . . . . . . . . . . . . . . . . . . . . . . . . . . . . . . . . . . . . . . . . . . . . . . . . . . . . . . . . . . . . . . . . . . 4
Item 1. Business . . . . . . . . . . . . . . . . . . . . . . . . . . . . . . . . . . . . . . . . . . . . . . . . . . . . . . . . . . . . . . 4
Item 1A. Risk Factors . . . . . . . . . . . . . . . . . . . . . . . . . . . . . . . . . . . . . . . . . . . . . . . . . . . . . . . . . . . 17
Item 1B. Unresolved Staff Comments . . . . . . . . . . . . . . . . . . . . . . . . . . . . . . . . . . . . . . . . . . . . . . . . 29
Item 2. Properties . . . . . . . . . . . . . . . . . . . . . . . . . . . . . . . . . . . . . . . . . . . . . . . . . . . . . . . . . . . . . 29
Item 3. Legal Proceedings . . . . . . . . . . . . . . . . . . . . . . . . . . . . . . . . . . . . . . . . . . . . . . . . . . . . . . . 30
Executive Officers of the Registrant . . . . . . . . . . . . . . . . . . . . . . . . . . . . . . . . . . . . . . . . . . . . . . . . . . . 30
PART II . . . . . . . . . . . . . . . . . . . . . . . . . . . . . . . . . . . . . . . . . . . . . . . . . . . . . . . . . . . . . . . . . . . . . . . 31
Item 5. Market for Registrant’s Common Equity, Related Stockholder Matters and Issuer Purchasesof Equity Securities . . . . . . . . . . . . . . . . . . . . . . . . . . . . . . . . . . . . . . . . . . . . . . . . . . . . . . 31
Item 6. Selected Financial Data . . . . . . . . . . . . . . . . . . . . . . . . . . . . . . . . . . . . . . . . . . . . . . . . . . . 32
Item 7. Management’s Discussion and Analysis of Financial Condition and Results of Operations . . . 32
Item 7A. Quantitative and Qualitative Disclosures About Market Risk . . . . . . . . . . . . . . . . . . . . . . . . 77
Item 8. Financial Statements and Supplementary Data . . . . . . . . . . . . . . . . . . . . . . . . . . . . . . . . . . . 82Report of Independent Registered Public Accounting Firm on Internal Control OverFinancial Reporting . . . . . . . . . . . . . . . . . . . . . . . . . . . . . . . . . . . . . . . . . . . . . . . . . . . . . . 83Report of Independent Registered Public Accounting Firm . . . . . . . . . . . . . . . . . . . . . . . . . . 84Consolidated Statements of Financial Position . . . . . . . . . . . . . . . . . . . . . . . . . . . . . . . . . . . 85Consolidated Statements of Operations . . . . . . . . . . . . . . . . . . . . . . . . . . . . . . . . . . . . . . . . 86Consolidated Statements of Stockholders’ Equity . . . . . . . . . . . . . . . . . . . . . . . . . . . . . . . . . 87Consolidated Statements of Cash Flows . . . . . . . . . . . . . . . . . . . . . . . . . . . . . . . . . . . . . . . . 89Notes to Consolidated Financial Statements . . . . . . . . . . . . . . . . . . . . . . . . . . . . . . . . . . . . . 90
Item 9. Changes in and Disagreements with Accountants on Accounting and Financial Disclosure . . . 188Item 9A. Controls and Procedures . . . . . . . . . . . . . . . . . . . . . . . . . . . . . . . . . . . . . . . . . . . . . . . . . . . 188Item 9B. Other Information . . . . . . . . . . . . . . . . . . . . . . . . . . . . . . . . . . . . . . . . . . . . . . . . . . . . . . . 188PART III . . . . . . . . . . . . . . . . . . . . . . . . . . . . . . . . . . . . . . . . . . . . . . . . . . . . . . . . . . . . . . . . . . . . . . . 189Item 10. Directors, Executive Officers and Corporate Governance . . . . . . . . . . . . . . . . . . . . . . . . . . . 189Item 11. Executive Compensation . . . . . . . . . . . . . . . . . . . . . . . . . . . . . . . . . . . . . . . . . . . . . . . . . . . 189Item 12. Security Ownership of Certain Beneficial Owners and Management and Related Stockholder
Matters . . . . . . . . . . . . . . . . . . . . . . . . . . . . . . . . . . . . . . . . . . . . . . . . . . . . . . . . . . . . . . . 189Item 13. Certain Relationships and Related Transactions, and Director Independence . . . . . . . . . . . . . 190Item 14. Principal Accounting Fees and Services . . . . . . . . . . . . . . . . . . . . . . . . . . . . . . . . . . . . . . . . 190PART IV . . . . . . . . . . . . . . . . . . . . . . . . . . . . . . . . . . . . . . . . . . . . . . . . . . . . . . . . . . . . . . . . . . . . . . 191Item 15. Exhibits and Financial Statement Schedules . . . . . . . . . . . . . . . . . . . . . . . . . . . . . . . . . . . . . 191Signatures . . . . . . . . . . . . . . . . . . . . . . . . . . . . . . . . . . . . . . . . . . . . . . . . . . . . . . . . . . . . . . . . . . . . . . 192
Report of Independent Registered Public Accounting Firm on Schedules . . . . . . . . . . . . . . . . . . . . . . . 193Schedule I — Summary of Investments — Other Than Investments in Related Parties . . . . . . . . . . . . . 194Schedule II — Condensed Financial Information of Registrant (Parent Only) . . . . . . . . . . . . . . . . . . . 195Schedule III — Supplementary Insurance Information . . . . . . . . . . . . . . . . . . . . . . . . . . . . . . . . . . . . 199Schedule IV — Reinsurance . . . . . . . . . . . . . . . . . . . . . . . . . . . . . . . . . . . . . . . . . . . . . . . . . . . . . . . 201Exhibit Index . . . . . . . . . . . . . . . . . . . . . . . . . . . . . . . . . . . . . . . . . . . . . . . . . . . . . . . . . . . . . . . . . . 202
ADDITIONAL ITEM INCLUDED HEREIN NOT INCLUDED IN THE ANNUAL REPORT ONFORM 10-K FILED WITH THE SECURITIES AND EXCHANGE COMMISSION ONFEBRUARY 16, 2011:
Performance Graph . . . . . . . . . . . . . . . . . . . . . . . . . . . . . . . . . . . . . . . . . . . . . . . . . . . . . . . . . . . . . 205
2

NOTE CONCERNING FORWARD-LOOKING STATEMENTS
This Annual Report on Form 10-K, including the Management’s Discussion and Analysis of Financial Condition andResults of Operations, contains statements which constitute forward-looking statements within the meaning of thePrivate Securities Litigation Reform Act of 1995, including statements relating to trends in operations and financialresults and the business and the products of the Registrant and its subsidiaries, as well as other statements includingwords such as ‘‘anticipate,’’ ‘‘believe,’’ ‘‘plan,’’ ‘‘estimate,’’ ‘‘expect,’’ ‘‘intend’’ and other similar expressions. Forward-looking statements are made based upon management’s current expectations and beliefs concerning future developmentsand their potential effects on us. Such forward-looking statements are not guarantees of future performance.
Actual results may differ materially from those included in the forward-looking statements as a result of risks anduncertainties. Those risks and uncertainties include, but are not limited to the risk factors listed in Item 1A. ‘‘RiskFactors.’’
3

PART I
Item 1. Business
Principal Financial Group, Inc. (‘‘PFG’’) is a leading provider of retirement savings, investment and insuranceproducts and services with $318.8 billion in assets under management (‘‘AUM’’) and approximately 19.1 millioncustomers worldwide as of December 31, 2010.
Our U.S. and international operations concentrate primarily on asset accumulation and asset management. Inaddition, we offer a broad range of individual and group life insurance, individual and group disability insurance andgroup dental and vision insurance. On September 30, 2010, we announced our decision to exit the group medicalinsurance business and entered into an agreement with United Healthcare Services, Inc. to renew group medicalinsurance coverage for our customers as the business transitions.
We primarily focus on small and medium-sized businesses, which we define as companies with less than 1,000employees, providing a broad array of retirement and employee benefit solutions to meet the needs of the business, thebusiness owner and their employees. We are the leading provider of corporate defined contribution plans in the U.S.,according to Spectrem Group. We are also the leading employee stock ownership plan consultant. In addition, we are aleading provider of nonqualified plans, defined benefit plans and plan termination annuities. We are also one of thelargest providers of specialty benefits insurance product solutions.
We believe small and medium-sized businesses are an underserved market, offering attractive growth opportunitiesin the U.S. in retirement services and other employee benefits. We also believe there is a significant opportunity toleverage our U.S. retirement expertise into select international markets that have adopted or are moving toward privatesector defined contribution pension systems. This opportunity is particularly compelling as aging populations around theworld are driving increased demand for retirement accumulation, retirement asset management and retirement incomemanagement solutions.
Our Reportable Segments
We organize our businesses into the following reportable segments:
• Retirement and Investor Services;
• Principal Global Investors;
• Principal International and
• U.S. Insurance Solutions.
We also have a Corporate segment, which consists of the assets and activities that have not been allocated to anyother segment.
See Item 8. ‘‘Financial Statements and Supplementary Data, Notes to Consolidated Financial Statements, Note 16,Segment Information’’ for financial results of our segments, including our operating revenues for our products andservices described in each of the subsequent segment discussions.
Retirement and Investor Services Segment
Our asset accumulation activities in the U.S. date back to the 1940s when we first began providing pension planproducts and services. We now offer a comprehensive portfolio of asset accumulation products and services forretirement savings and investment:
• To businesses of all sizes with a concentration on small and medium-sized businesses, we offer products andservices for defined contribution pension plans, including 401(k) and 403(b) plans, defined benefit pension plans,nonqualified executive benefit plans and employee stock ownership plan (‘‘ESOP’’) consulting services. For morebasic investment needs, we offer SIMPLE Individual Retirement Accounts (‘‘IRA’’) and payroll deduction plans;
• To large institutional clients, we also offer investment-only products, including guaranteed investment contracts(‘‘GICs’’) and funding agreements and
• To employees of businesses and other individuals, we offer the ability to accumulate funds for retirement andsavings through mutual funds, individual annuities and bank products.
We organize our Retirement and Investor Services operations into six product and service categories: full serviceaccumulation, Principal Funds (our mutual fund business), individual annuities, bank and trust services, investment onlyand full service payout.
4

Full Service Accumulation
Products
We offer a wide variety of investment and administrative products for defined contribution pension plans, including401(k) and 403(b) plans, defined benefit pension plans, nonqualified executive benefit plans and ESOPs. A 403(b) plan isa plan described in Section 403(b) of the Internal Revenue Code that provides retirement benefits for employees oftax-exempt organizations and public schools.
Full service accumulation products respond to the needs of plan sponsors seeking both administrative andinvestment services for defined contribution plans or defined benefit plans. The investment component of both thedefined contribution and defined benefit plans may be in the form of a general account, separate account, a mutual fundoffering or a collective investment trust. In addition, defined contribution plans may also offer their own employersecurity as an investment option.
As of December 31, 2010, we provided full service accumulation products to over 30,000 defined contributionpension plans, of which approximately 24,500 were 401(k) plans, covering 3.1 million plan participants, and to over 2,500defined benefit pension plans, covering over 319,000 plan participants. As of December 31, 2010, approximately 58% ofour full service accumulation account values were managed by our affiliated asset manager, Principal Global Investors.Third-party asset managers provide asset management services with respect to the remaining assets.
We deliver both administrative and investment services to our defined contribution plan and defined benefit plancustomers through annuities and mutual funds. Annuities and the underlying investment options are not required to beregistered with the United States Securities and Exchange Commission (‘‘SEC’’). Our mutual fund offering is calledPrincipal Advantage. It is a qualified plan product based on our series mutual fund, Principal Funds, Inc. We offerinvestments covering the full range of stable value, equity, fixed income, real estate and international investment optionsmanaged by our Principal Global Investors segment as well as third-party asset managers.
Markets and Distribution
We offer our full service accumulation products and services to employer-sponsored pension plans, includingqualified and nonqualified defined contribution plans and defined benefit plans. Our primary target market is planssponsored by small and medium-sized businesses, which we believe remains under-penetrated. According to SpectremGroup, in 2009, only 20% of businesses with between 10 and 49 employees, 46% of businesses with between 50 and 99employees, 54% of businesses with between 100 and 249 employees and 61% of businesses with between 250 and 500employees offered a 401(k) plan. The same study indicates that 73% of employers with between 500 and 1,000 employees,84% of employers with between 1,000 and 5,000 employees and 95% of employers with 5,000 or more employees offereda 401(k) plan in 2009.
We distribute our full service accumulation products and services nationally, primarily through a captive retirementservices sales force. As of December 31, 2010, over 110 retirement services sales representatives in over 42 offices,operating as a wholesale distribution network, maintained relationships with over 11,000 independent brokers,consultants and agents. Retirement services sales representatives are an integral part of the sales process alongside thereferring consultant or independent broker. We compensate retirement services sales representatives through a blend ofsalary and production-based incentives, while we pay independent brokers, consultants and agents a commission or fee.
As of December 31, 2010, we had a separate staff of over 270 service and education specialists located in the salesoffices who play a key role in the ongoing servicing of pension plans by providing local services to our customers, such asreviewing plan performance, investment options and plan design; communicating the customers’ needs and feedback tous and helping employees understand the benefits of their pension plans. The following summarizes our distributionchannels:
• We distribute our annuity-based products through sales representatives, agents and brokers who are primarilystate licensed individuals.
• Principal Advantage, our mutual fund-based product, is targeted at defined contribution plans through broker-dealer distribution channels. Principal Advantage gives us access to Financial Industry Regulatory Authority-registered distributors who are not traditional sellers of annuity-based products and broadens opportunities for usin the investment advisor and broker-dealer distribution channels.
• Principal Retirement Income Edge� is designed to create a coordinated experience from accumulation to incomemanagement for advisors to use with their individual clients and plan participants who are nearing or enjoyingretirement. The Principal Retirement Income Edge� program provides education and planning tools as well as awide variety of products such as annuities, mutual funds and bank products to provide personalized incomemanagement solutions.
• Through our Retire Secure strategy we provide financial education and assistance to individual investors who areparticipants/members of employer-based accumulation solutions to help them achieve financial security.
5

We believe that our approach to full service accumulation plan services distribution gives us a local sales and servicepresence that differentiates us from many of our competitors. We have also established a number of marketing anddistribution relationships to increase the sales of our accumulation products.
Principal Funds
We have been providing mutual funds to customers since 1969. We offer mutual funds to individuals, businesses andinstitutional investors for use within variable life and variable annuity contracts, for use in employer-sponsored pensionplans, as a rollover investment option, and for general investment purposes.
Products and Services
Principal Funds plans to grow into a top advisor sold mutual fund company with a sales force focused on multiplechannels. As of November 2010, as reported by the Strategic Insight, we are ranked 23 according to AUM (long termfunds) of the top 50 intermediary sold mutual funds. We provide accounting, compliance, corporate governance andproduct development for all mutual funds we organize. As of December 31, 2010, our mutual fund operations servedapproximately 1.5 million mutual fund shareholder accounts.
Principal Funds, Inc. Principal Funds, Inc. (‘‘PFI’’) is a series mutual fund that, as of December 31, 2010, offered 63investment options. This fund’s five R class shares act as the funding vehicle for Principal Advantage, the definedcontribution product described above under ‘‘Retirement and Investor Services Segment-Full Service AccumulationProducts.’’ This fund also offers three retail classes of shares to individuals. One of the three retail share classes is forIRA rollovers (J shares) and two are for general investment purposes (A and C shares). Two additional classes of sharesare available: (1) I shares, which are offered primarily to specified institutional investors, and (2) P shares, which are usedprimarily in adviser fee-based programs. As of December 31, 2010, the retail classes of shares had $25.0 billion of AUM.All other share classes of Principal Funds, Inc., including seed money, had $35.7 billion of AUM. We report the results forthis fund, excluding the retail AUM, under ‘‘Full Service Accumulation.’’ We report the results of the retail AUM under‘‘Principal Funds.’’
Principal Variable Contracts Funds, Inc. Principal Variable Contracts Funds, Inc. is a series mutual fund that, as ofDecember 31, 2010, provided 35 investment options for variable annuity and variable life insurance contracts issued byPrincipal Life Insurance Company (‘‘Principal Life’’) and other insurance companies not affiliated with Principal Life. Asof December 31, 2010, this fund had $5.5 billion of AUM. AUM backing Principal Life variable annuity contracts isreported in this segment under ‘‘Individual Annuities.’’ AUM backing Principal Life variable life insurance contracts isreported in the U.S. Insurance Solutions segment.
Principal Managed Portfolio. Principal Managed Portfolio is an advisory product offered by our registered investmentadvisor, Princor Financial Services Corporation (‘‘Princor’’), which permits the client to invest only in PrincipalFunds, Inc. Clients are charged a quarterly asset-based fee on this product. As of December 31, 2010, Principal ManagedPortfolio had accumulated $604.8 million in assets.
Principal Advisory Select and Principal Dynamic Portfolios. These are advisory products offered by our registeredinvestment advisor, Princor, which permits the client to invest in a broad array of investments. Clients are charged aquarterly asset-based fee on these products. As of December 31, 2010, these products had accumulated $1.4 billion inassets.
Markets and Distribution
Our markets for PFI’s retail share classes are individuals seeking to accumulate savings for retirement and otherpurposes, as well as nonqualified individual savings plans utilizing payroll deductions. We also market PFI’s retail shareclasses to participants in pension plans who are departing their plans and reinvesting their retirement assets intoindividual retirement accounts.
We sell PFI’s retail share classes primarily through registered representatives from other broker-dealers; affiliatedfinancial representatives; independent brokers registered with our securities broker-dealer, Princor; direct deposits fromour employees and others and Principal Connection. As of December 31, 2010, 56 retail sales representatives across theUnited States, operating as a wholesale distribution network, maintained relationships with over 34,700 independentbrokers, consultants and agents. Principal Connection is our direct response distribution channel for retail financialservices products to individuals. Principal Connection’s services are available over the phone, on the Internet or by mail.Princor recruits, trains and supervises registered representatives selling our products through Principal Connection.
Individual Annuities
Individual annuities offer a tax-deferred means of accumulating retirement savings, as well as a tax-efficient sourceof income during the payout period.
6

Products
We offer both fixed and variable annuities to individuals and pension plans. Individual annuities may be categorizedin two ways: (1) deferred, in which case assets accumulate until the contract is surrendered, the customer dies or thecustomer begins receiving benefits under an annuity payout option, or (2) immediate/payout, in which case paymentsbegin within one year of issue and continue for a fixed period of time or for life.
Fixed Deferred Annuities. Our individual fixed deferred annuities consist of both single premium deferred annuitycontracts and flexible premium deferred annuity contracts (‘‘FPDAs’’). Some FPDA contracts limit the period of timedeposits are allowed (e.g., only one year). For most contracts, the principal amount is guaranteed. We credit thecustomer’s account with a fixed interest rate and for a specified time period, typically one, three or five years. Thereafter,we reset, typically annually, the interest rate credited to the contract based upon our discretion, taking into accountmarket and other conditions. We also offer a fixed deferred annuity where the interest credited is linked to an externalequity index, subject to maximum and minimum values. Our major source of income from fixed deferred annuities is thespread between the investment income earned on the underlying general account assets and the interest rate credited tothe contracts. We bear the investment risk because, while we credit customers’ accounts with a stated interest rate, wecannot be certain the investment income we earn on our general account assets will exceed that rate. The PrincipalGlobal Investors segment manages the assets supporting these contracts.
Variable Deferred Annuities. Individual variable deferred annuities are savings vehicles through which the customermakes one or more deposits of varying amounts and intervals. Customers have the flexibility to allocate their deposits toinvestment sub-accounts managed by the Principal Global Investors segment or other third-party asset managers. As ofDecember 31, 2010, 78% of our $5.5 billion in variable annuity account balances was allocated to investmentsub-accounts and our general account, which are managed by the Principal Global Investors segment and 22% wasallocated to investment sub-accounts managed by third-party asset managers. Generally speaking, the customers bear theinvestment risk and have the right to allocate their assets among various separate investment sub-accounts. The value ofthe annuity fluctuates in accordance with the experience of the investment sub-accounts chosen by the customer.Customers have the option to allocate all or a portion of their account to our general account, in which case we creditinterest at rates we determine, subject to contractual minimums. Customers may also elect an enhanced death benefitguarantee (commonly known in the industry as a guaranteed minimum death benefit, or ‘‘GMDB’’) and/or a livingbenefit guarantee (commonly known in the industry as a guaranteed minimum withdrawal benefit, or ‘‘GMWB’’). Webear the GMDB and GMWB investment risk. We attempt to hedge the GMWB investment risk through the use ofsophisticated risk management techniques. As of December 31, 2010, $2.3 billion of the $5.5 billion of variable annuityaccount value had the GMWB rider. Our major source of revenue from variable annuities is mortality and expense feeswe charge to the customer, generally determined as a percentage of the market value of the assets held in a separateinvestment sub-account.
Fixed Immediate Annuities. Our individual fixed immediate annuities consist almost exclusively of single premiumimmediate annuity contracts (‘‘SPIAs’’). SPIAs are products where the customer makes a single deposit and from whichperiodic benefit payments are made. Payments may be contingent upon the survival of one or two individuals or paymentsmay be fixed, meaning payments are contractually guaranteed and do not depend on the continuing survival of anyindividual. Our major source of income from fixed immediate annuities is the spread between the investment incomeearned on the underlying general account assets and the interest rate implied in the calculation of annuity benefitpayments. We bear the investment risk because we cannot be certain the investment income we earn on our generalaccount assets will exceed the rate implied in the SPIA contracts. The Principal Global Investors segment manages theassets supporting these contracts.
Markets and Distribution
Our target markets for individual annuities include owners, executives and employees of small and medium-sizedbusinesses and individuals seeking to accumulate and/or eventually receive distributions of assets for retirement. Wemarket both fixed and variable annuities to individuals for both qualified and nonqualified retirement savings.
We sell our individual annuity products through our affiliated financial representatives, who accounted for 43%,34% and 20% of annuity sales for the years ended December 31, 2010, 2009 and 2008, respectively. The remaining saleswere made through banks, brokerage general agencies, mutual fund companies, Principal Connection and unaffiliatedbroker-dealer firms. Affiliated financial representatives continued to be the primary distribution channel of our variabledeferred annuities. The majority of overall annuity sales, however, were from non-affiliated distribution channels, as aresult of focused efforts to increase fixed annuity sales through non-affiliated distribution channels.
Bank and Trust Services
Bank and Trust Services includes Principal Bank and Principal Trust Company. Principal Bank is a federal savingsbank that began its activities in February 1998. As of December 31, 2010, Principal Bank had over 254,000 customers andapproximately $2.4 billion in assets. Delaware Charter Guarantee & Trust Company, dba Principal Trust Company, is aDelaware state chartered non-deposit trust company that was chartered in 1899. It is one of the largest non-deposit trustcompanies in the U.S.. As of December 31, 2010, we served as trustee to over 400,000 accounts, which held assets of
7

approximately $91.0 billion. Principal Trust Company may not accept deposits and cannot make personal or commercialloans.
Products
Our current products and services include a suite of consumer checking and savings accounts, money marketaccounts, certificates of deposit (‘‘CDs’’), individual retirement accounts, small account rollovers from qualifiedretirement plans and health savings accounts (‘‘HSAs’’). In addition, we offer deposit and loan services to small andmedium-sized businesses. Principal Bank participates in the Certificate of Deposit Account Registry Service programthrough which certain customer CDs are exchanged for CDs of similar amounts from participating banks. The depositproducts provide a relatively stable source of funding and liquidity and are used to fund securities purchases and loanoriginations.
Principal Trust Company specializes in providing trust solutions for a full array of employee benefit plans andaccounts including 401(k) and 403(b) plans, defined benefit pension plans, nonqualified executive benefit plans, ESOPs,and self-directed tax-advantaged savings accounts, such as IRAs. Principal Trust Company also maintains a series ofcollective investment funds, The Principal TrustSM Target Date Funds, and provides personal trust services.
Markets and Distribution
We offer our bank products and services to prospects and existing customers, through Principal Connection, ouraffiliated financial representatives and other PFG affiliates with a primary focus on deepening existing relationships withcustomers of PFG. We also pursue asset retention strategies with customers who seek to transfer assets from our otherasset accumulation products by offering them our banking products and services. Principal Bank services customersthrough the telephone, mail or Internet.
We deliver our directed trust services to customers through our PFG affiliates. Administrative trust services forself-directed tax-advantaged savings accounts are sold through non-affiliated brokerage firms, clearing firms, financialadvisors and asset managers.
Investment Only
Products
The three primary products for which we provide investment only services are: GICs; funding agreements and otherinvestment only products.
GICs and funding agreements pay a specified rate of return. The rate of return can be a floating rate based on anexternal market index or a fixed rate. Our investment only products contain provisions disallowing or limiting earlysurrenders, including penalties for early surrenders and minimum notice requirements.
Deposits to investment only products are predominantly in the form of single payments. As a result, the level of newdeposits can fluctuate from one fiscal quarter to another. Assets invested in GICs and funding agreements generate aspread between the investment income earned by us and the amount credited to the customer. Our other investment onlyproducts consist of separate accounts invested in either equities or fixed income instruments. The Principal GlobalInvestors segment manages the assets supporting investment only account values.
Markets and Distribution
We market GICs and funding agreements primarily to pension plan sponsors and other institutions. We also offerthem as part of our full service accumulation products. We sell our GICs primarily to plan sponsors for funding oftax-qualified retirement plans. We sell our funding agreements directly to institutions that may or may not be pensionfunds and unconsolidated special purpose vehicles domiciled either in the U.S. or offshore for funding agreement-backednote programs. The funding agreements sold as part of these funding agreement-backed note programs work by havinginvestors purchase debt obligations from the special purpose vehicle which, in turn, purchases the funding agreementfrom us with terms similar to those of the debt obligations. The strength of this market is dependent on debt capitalmarket conditions. As a result, our sales through this channel can vary widely from one quarter to another. In addition tothe special purpose vehicle selling the funding agreement-backed notes to U.S. and foreign institutional investors, thespecial purpose vehicle may also sell notes to U.S. retail investors through a SEC-registered shelf debt issuance program.Due to a downturn in the credit market, we had no medium term note issuances in 2009 and 2010. As economicconditions change, we will reassess the use of our medium term note and GIC programs.
Full Service Payout
Products
Full service payout products respond to the needs of pension plan participants who, upon retirement or terminationof their employment, seek a guaranteed income stream. Plan participants who seek these services include those frompension plans we service, as well as pension plans other providers service. We primarily offer single premium group
8

annuities, which are immediate or deferred annuities that provide a current or future specific income amount, fullyguaranteed by us. These are available to defined contribution and defined benefit plan participants. We make regularpayments to individuals, invest the underlying assets on their behalf and provide tax reporting to them. We also reinsuresingle premium immediate annuities issued by another insurer.
Single premium group annuities are traditionally used in conjunction with defined benefit plans, particularly thosewhere the plan is being terminated. In such instances, the plan sponsor transfers all its obligations under the plan to aninsurer by paying a single premium. Increasingly, these products are purchased by defined contribution plan participantswho reach retirement age. Generally, plan sponsors restrict their purchases to insurance companies with superior orexcellent financial quality ratings because the Department of Labor has mandated that annuities be purchased only fromthe ‘‘safest available’’ insurers.
Premium received from full service payout products are generally in the form of single payments. As a result, thelevel of new premiums can fluctuate depending on the number of retirements and large-scale annuity sales in a particularfiscal quarter. The Principal Global Investors segment manages the assets supporting full service payout account values.
Markets and Distribution
Our primary distribution channel for full service payout products is comprised of several specialized home officesales consultants working through consultants and brokers that specialize in this type of business. Our sales consultantsalso make sales directly to institutions. Our nationally dispersed retirement services sales representatives act as asecondary distribution channel for these products. Principal Connection also distributes full service payout products toparticipants in plans we service who are terminating employment or retiring.
Principal Global Investors Segment
Our Principal Global Investors segment consists of Principal Global Investors and its affiliates. We focus onproviding a diverse range of asset management services covering a broad range of asset classes, investment styles andportfolio structures to our other segments and third-party institutional clients.
As of December 31, 2010, Principal Global Investors, together with its affiliates, Principal Real Estate Investors;Spectrum Asset Management; Post Advisory Group, LLC; Columbus Circle Investors; Edge Asset Management andMorley Financial Services managed $220.1 billion in assets. We have offices outside of the U.S. in Australia, Hong Kong,Japan, Singapore and the United Kingdom.
During the third quarter of 2008, we made a decision to terminate our commercial mortgage securities issuanceoperation. This termination does not qualify for discontinued operations treatment under U.S. generally acceptedaccounting principles (‘‘U.S. GAAP’’). Therefore, the results of the terminated commercial mortgage securities issuanceoperation are still included in our consolidated income from continuing operations.
Products and Services
Principal Global Investors provides focused investment advisory services across a broad range of asset classes,investment styles and portfolio structures. These services are provided for a fee as defined by the client mandate. We arediversified across three primary asset classes.
Equity Investments. As of December 31, 2010, Principal Global Investors, along with Columbus Circle Investors andEdge Asset Management managed $70.0 billion in global equity assets. Our equity capabilities encompass large-cap,mid-cap and small-cap stocks in developed and emerging markets worldwide. As of December 31, 2010, 43% of equityAUM was derived from our pension products, 24% from other products of PFG and the remaining 33% from third-partyinstitutional clients.
Fixed Income Investments. Principal Global Investors, along with Spectrum Asset Management; Post AdvisoryGroup, LLC; Edge Asset Management and Morley Financial Services managed $113.6 billion in global fixed incomeassets as of December 31, 2010. Collectively, we provide our clients with access to investment-grade corporate debt;government bonds; mortgage-backed, asset-backed and commercial mortgage-backed securities; high yield and municipalbonds; private and syndicated debt instruments and preferred securities. As of December 31, 2010, 32% of these assetswere derived from our pension products, 31% from other products of PFG, and the remaining 37% from third-partyinstitutional clients.
Real Estate Investments. Principal Global Investors, through its affiliate Principal Real Estate Investors, managed aportfolio of primarily U.S. commercial real estate assets of $34.7 billion as of December 31, 2010. Principal Real EstateInvestors provides our clients with a broad range of real estate investment options, including private real estate equity,commercial mortgages, credit tenant debt, construction-permanent financing, bridge/mezzanine loans, commercialmortgage-backed securities and real estate investment trusts. As of December 31, 2010, 31% of the commercial realestate portfolio was derived from our pension products, 30% from other products of PFG and the remaining 39% fromthird-party institutional clients.
9

Markets and Distribution
We employed 110 institutional sales, relationship management and client service professionals as of December 31,2010, who worked with consultants and directly with large investors to acquire and retain third-party institutional clients.As of December 31, 2010, Principal Global Investors and its affiliates had approximately 497 third-party institutionalclients with $78.7 billion of AUM in 21 countries.
Principal International Segment
Our Principal International segment has operations in Brazil, Chile, China, Hong Kong Special AdministrativeRegion (‘‘SAR’’), India, Indonesia, Malaysia, Mexico, Singapore and Thailand. We focus on countries with large middleclasses, favorable demographics, and growing long-term savings, ideally with defined contribution retirement markets. Weentered these countries through acquisitions, start-up operations and joint ventures.
The activities of our Principal International segment reflect our efforts to accelerate the growth of our AUM bycapitalizing on the international trend toward private sector defined contribution pension systems and individuallong-term savings. Through the Principal International segment, we offer retirement products and services, annuities,mutual funds, institutional asset management and life insurance accumulation products.
Products, Markets and Distribution
Brazil. We offer pension, retirement income and asset accumulation products through a co-managed(minority-held) joint venture, Brasilprev Seguros e Previdencia (‘‘Brasilprev’’) in which PFG owns 25% of the economicinterest and 50.01% of the voting shares. The partner is Banco do Brasil (‘‘Banco’’), which had approximately 5,060Brazilian branches as of September 30, 2010. Brasilprev has an exclusive agreement with Banco to distribute pension,retirement and long-term asset accumulation products. On April 30, 2010, we signed definitive agreements with Banco,including the Shareholders Agreement governing the operations of our pension joint venture, Brasilprev. The agreementsresult in Brasilprev having, for 23 years, the exclusive right to distribute pension and asset accumulation products withinthe Banco bank network and a reduction in our economic interest from 46% to 25%. Brasilprev will continue to be jointlymanaged and reported as an equity method investment in our Principal International segment. Due to the reduction inour economic interest, we expect to see a decline in our earnings from this operation in the near term. Our joint ventureprovides defined contribution products, complementary life protection and payout solutions for the retirement needs ofemployers and individuals. Banco’s employees sell these products directly to individual clients through its bank branches.In addition, our joint venture reaches corporate clients through two wholesale distribution channels: (1) a network ofindependent brokers who sell to the public and (2) Banco’s corporate account executives selling to existing andprospective corporate clients. According to Federacao Nacional de Previdencia e Vida, our joint venture ranked third inthe Brazilian private pension market based upon managed assets as of October 31, 2010.
Chile. We offer long-term savings products, retirement annuities, mutual funds, life insurance accumulationproducts, mortgage loans and institutional asset management services.
Retirement annuities are offered to individuals exiting the pre-retirement accumulation system. Annuity productsare distributed through a network of brokers and independent agents numbering approximately 670 as of December 31,2010.
We serve the individual and group voluntary/complementary long-term savings market by offering ‘‘APV plans’’(qualified individual retirement solutions) and ‘‘APVC plans’’ (qualified group retirement solutions that are similar to theU.S. 401(k) product line). According to the Asociacion de Adminstradoras de Fondos Mutuous de Chile, we ranked firstin AUM for mutual fund companies offering these plans in Chile as of December 31, 2010. The plans, together with nonqualified mutual fund products, are distributed to retail clients through our proprietary sales force, financial advisors,brokerage houses, alliances with financial institutions and the largest retailer in Chile, Falabella.
Life insurance accumulation products are also offered to individuals through brokers and financial advisors. Weoriginate, sell and service individual residential mortgage loans in Chile through our independent distribution network,which is composed primarily of real estate brokers and developers. We also offer institutional asset management servicesto pension funds, insurance companies, mutual fund companies and investment platforms through our proprietary salesforce.
China. We offer mutual funds and asset management services to individuals and institutions through aminority-held joint venture that includes China Construction Bank (‘‘CCB’’), the majority partner. We sell mutual fundsprimarily through our partner bank, CCB. The bank provides extensive distribution capabilities for the joint venture interms of brand awareness and the number of branch outlets, which number approximately 13,630.
Hong Kong SAR. We sell defined contribution pension, mutual fund and institutional asset management products.
We actively compete in the defined contribution pension plan market. The government currently requires bothemployers and employees to each contribute 5% of an employee’s income to a Mandatory Provident Fund (‘‘MPF’’). Wetarget small and medium-sized employers and distribute products through strategic alliances with insurance companies,
10

brokers, consultants, banks and direct marketing through our own sales representatives. Our alliance partners distributeour MPF products and services or use our administrative and investment services in their own products.
We sell mutual funds to retail customers primarily through strategic alliances with banks. To grow institutional assetmanagement, our operations in Hong Kong SAR leverage Principal Global Investors’ regional asset management andsales resources to jointly secure mandates.
India. We offer mutual funds and asset management services to both retail and corporate customers.
In the mutual funds market, we compete by managing and administering funds for both individuals and corporationsthrough a majority-owned joint venture. The minority partners are Punjab National Bank and Vijaya Bank, two largeIndian commercial banks with a combined network of approximately 6,180 branches as of December 31, 2010. Mutualfunds are sold through regional offices and other bank branches located throughout India. In addition to the currentmutual fund business, we are positioning ourselves to compete in the emerging pension and long-term savings market inIndia.
Malaysia. We offer conventional and Islamic mutual funds through our minority-held joint venture with CIMBGroup, the majority partner. CIMB Group is a large Malaysian bank holding company with a presence in many SoutheastAsian countries. The company has a sales force of approximately 4,650 agents selling to retail customers. We also marketmutual funds through wholesale bank channels. The joint venture’s main bank channels include approximately 1,100 bankbranches throughout Malaysia, Indonesia, Thailand and Singapore. According to Lipper, our joint venture companycombined with CIMB-Principal Islamic Asset Management (a joint venture between Principal Global Investors andCIMB Group) ranked second in total unit trust assets managed and second in Islamic unit trust assets managed in theMalaysian asset management industry as of November 30, 2010. The companies also manage a significant amount ofinstitutional asset mandates.
The joint venture also has operations in Singapore (CIMB-Principal Asset Management (S) Pte Ltd), Indonesia (PTCIMB-Principal Asset Management), and in June 2010 acquired an asset management company in Thailand, BT AssetManagement, and has since changed the name to CIMB-Principal Asset Management Company Limited.
Mexico. We offer defined contribution pension products, mutual funds, annuities and asset management services toinstitutional clients.
Through our Afore pension company we manage and administer approximately 2.8 million individual retirementaccounts under the mandatory privatized social security system for all non-government employees in Mexico. Wedistribute products and services through a proprietary sales force of approximately 915 sales representatives as ofDecember 31, 2010, as well as independent brokers who sell directly to individuals.
Our mutual fund company distributes products and services through a sales force of approximately 42 employees andthrough distribution agreements with other financial entities. We administer previously sold annuities and life products.Due to unfavorable market conditions, sales of our annuity and life products in Mexico were suspended in 2007.
Mexico has also initiated institutional asset management services, offering both domestic and international products.
U.S. Insurance Solutions Segment
Our U.S. Insurance Solutions segment offers individual life insurance and specialty benefits, which include groupdental, group vision, group life, group disability, wellness and individual disability insurance. We focus on providingcomprehensive insurance solutions for small and medium-sized businesses.
Individual Life Insurance
We began as an individual life insurer in 1879. Our U.S. operations administer approximately 550,000 individual lifeinsurance policies with over $134.7 billion of individual life insurance in force as of December 31, 2010.
Small and medium-sized companies are challenged with how to build quality benefits packages for executives, how totransition the company’s ownership to a partner or family member and how to save for retirement. In addition, executivesand other key employees often have personal insurance needs. These needs are the focus of our products within theindividual life insurance arena.
Products and Services
We offer a variety of individual life insurance products, including universal life insurance, variable universal lifeinsurance and term life insurance. We target the personal insurance needs of owners and executives of small andmedium-sized businesses with an increasing focus on providing insurance solutions for nonqualified executive benefits. Inaddition, we market our products to meet traditional retail insurance needs.
Universal and Variable Universal Life Insurance. Universal and variable universal life insurance products offer thepolicyholder the option of adjusting both the premium and the death benefit amounts of the insurance contract.Universal life insurance typically includes a cash value account that accumulates at a credited interest rate based on the
11

investment returns of the block of business. Variable universal life insurance is credited with the investment returns of thevarious investment options selected. For the year ended December 31, 2010, 80% of individual life insurance annualizedfirst year premium sales were generated from universal and variable universal life insurance products. Universal andvariable universal life insurance represents 63% of individual life insurance premium and deposits for the year endedDecember 31, 2010, and 48% of individual life insurance in force as of December 31, 2010. Variable universal lifeinsurance products represented 32% of our universal and variable universal life insurance deposits for the year endedDecember 31, 2010.
After a deduction for policy level expenses, we credit net deposits to an account maintained for the policyholder. Foruniversal life contracts, the entire account balance is invested in the general account. Interest is credited to thepolicyholder’s account based on the earnings on general account investments. For variable universal life contracts, thepolicyholder may allocate the account balance among our general account and a variety of separate account choices.Interest is credited on amounts allocated to the Principal Life general account in the same manner as for universal life.Net investment performance on separate account investments is allocated directly to the policyholder accounts; thepolicyholder bears the investment risk. Some of our universal life and variable universal life insurance contracts containwhat are commonly referred to as ‘‘secondary’’ or ‘‘no-lapse’’ guarantee provisions. A no-lapse guarantee keeps thecontract in force, even if the contractholder’s account balance is insufficient to cover all of the contract charges, providedthat the contractholder has continually paid a specified minimum premium.
Traditional Life Insurance. Traditional life insurance includes participating whole life, adjustable life products andnon-participating term life insurance products. Participating products and non-participating term life insurance productsrepresented 6% and 14%, respectively, of our individual life insurance annualized first year premium sales for the yearended December 31, 2010, and 19% and 33%, respectively, of individual life insurance in force as of December 31, 2010.Adjustable life insurance products provide a guaranteed benefit in return for the payment of a fixed premium and allowthe policyholder to set the coverage period, premium and face amount combination. Term insurance products provide aguaranteed death benefit for a specified period of time in return for the payment of a fixed premium. Policyholderdividends are not paid on term insurance.
Specialty Benefits Insurance
Specialty benefits insurance, which includes group dental, vision, life and disability insurance and individual disabilityinsurance is an important component of the employee benefit offering at small and medium-sized businesses. We offertraditional employer sponsored and voluntary products for group dental, vision, life and disability. We also offer groupdental, vision, and disability on a fee-for-service basis. We began selling our first specialty benefit products in 1941 withgroup disability and group life insurance. We began selling individual disability insurance in 1952 and group dental andgroup vision insurance in the late 1960s. Effective January 1, 2011, Principal Wellness Company, a provider of wellnessservices since 2004, transitioned to the Specialty Benefits Insurance division. Also effective January 1, 2011, ourfee-for-service group dental, vision, and disability business transitioned to this division.
Products and Services
Group Dental and Vision Insurance. Group dental and vision insurance plans provide partial reimbursement fordental and vision expenses. As of December 31, 2010, we had nearly 33,000 group dental and vision insurance policies inforce covering over 868,000 employee lives. According to LIMRA, we were the 8th largest group dental insurer in termsof number of contracts/employer groups in force in 2009. In addition to indemnity and preferred provider organizationdental offered on both an employer paid and voluntary basis, we offer a prepaid dental plan in Arizona through ourEmployers Dental Services, Inc. subsidiary.
Group Life Insurance. Group life insurance provides coverage to employees and their dependents for a specifiedperiod. As of December 31, 2010, we had nearly 45,000 group policies providing nearly $105.8 billion of group lifeinsurance in force to approximately 1.8 million employee lives. According to LIMRA in 2009, we were ranked 3rd in theU.S. in terms of the number of group life insurance contracts in force. We currently sell traditional group life insurancethat does not provide for accumulation of cash values on both an employer paid and voluntary basis. Our group lifeinsurance business remains focused on the traditional, annually renewable term product. Group term life and groupuniversal life accounted for 96% and 4%, respectively, of our total group life insurance in force as of December 31, 2010.We no longer market group universal life insurance to new employer groups.
Group Disability Insurance. Group disability insurance provides a benefit to insured employees who become disabled.In most instances, this benefit is in the form of a monthly income. Our group disability products include both short-termand long-term disability, offered on both an employer paid and voluntary basis. Long-term disability represents 64% oftotal group disability premium, while short-term disability represents 36% of total group disability premium. In addition,we provide disability management services, also called rehabilitation services, to assist individuals in returning to work asquickly as possible following disability. We also work with disability claimants to improve the approval rate of SocialSecurity benefits, thereby reducing payment of benefits by the amount of Social Security payments received. As ofDecember 31, 2010, we served approximately 1.2 million employee lives under nearly 30,000 contracts, with our groupshort-term disability business being ranked 4th and our group long-term disability business being ranked 7th in the U.S.as of December 31, 2009, in terms of number of contracts/employer groups in force, according to LIMRA.
12

Individual Disability Insurance. Individual disability insurance products provide a benefit to the insured member inthe event he/she becomes disabled. In most instances, this benefit is in the form of a monthly income. In addition toincome replacement, we offer products to pay business-related costs such as overhead expenses for a disabled businessowner, buy-out costs for business owners purchasing a disabled owner’s interest in the business, expenditures forreplacement of a key person and business loan payments. As of December 31, 2010, we served approximately 131,000individual disability policyholders, with our individual disability business being ranked 7th in the U.S. as of December 31,2009, in terms of premium in force, according to LIMRA.
Principal Wellness Company. We recognize the importance of promoting healthy behavior. Principal WellnessCompany contributes expertise in providing wellness screenings, counseling and services to employers and theiremployees, designed to improve health, reduce health insurance claim costs, reduce absenteeism and increase employeeproductivity.
Fee-for-Service. We offer administration of group dental, disability and vision benefits on a fee-for-service basis.
U.S. Insurance Solutions Markets and Distribution
For each of our products, administration and distribution channels are customized to meet customer needs andexpectations for that product.
We sell our individual life and individual disability income products in all 50 states and the District of Columbia,primarily targeting owners and executives of small and medium-sized businesses. Small and medium-sized business salesrepresented 79% of individual life sales and 64% of individual disability sales for the year ended December 31, 2010,based on first year annualized premium. Our life insurance sales offer an enhanced focus to the Business Owner &Executive Solutions market. This strategy offers competencies to address business owner financial challenges such asexiting the business, business transition, retaining key employees and retirement planning. Key employees also haveneeds to supplement retirement income, survivor income, and business protection. We believe the Business Owner &Executive Solutions segment offers growth opportunities and we will continue to develop strategies to capitalize on thisexpanding market.
We distribute our individual life and individual disability insurance products through our affiliated financialrepresentatives and independent brokers, as well as other marketing and distribution alliances. Affiliated financialrepresentatives were responsible for 35% of individual life insurance sales based on first year annualized premium and15% of individual disability sales for the year ended December 31, 2010. We had 965 affiliated financial representatives in28 offices. Although they are independent contractors, we have a close tie with affiliated financial representatives and weoffer them benefits, training and access to tools and expertise. To meet the needs of the various marketing channels,particularly the independent brokers, we employ wholesale distributors — Regional Vice Presidents for individual lifeand Disability Income Regional Vice Presidents for individual disability. A key differentiator in the nonqualifiedexecutive benefit sale is our Regional Vice Presidents-Nonqualified Plans, who are not only wholesalers but alsoconsultants and subject-matter experts providing point-of-sale support in closing cases.
We market our group life, disability, dental and vision insurance products to small and medium-sized businesses,primarily targeting our sales toward owners and human resources professionals. We sell our group life, disability anddental products in all 50 states and the District of Columbia. We sell vision coverage in 48 states, plus the District ofColumbia. We continually adapt our products and pricing to meet local market conditions. We market our fee-for-servicecapabilities to employers that self-insure their employees’ dental, disability and vision benefits. We market our wellnessand fee-for-service businesses in all 50 states and the District of Columbia.
The group insurance market continues to see a shift to voluntary/worksite products. In keeping with this marketchange, which shifts the funding of such products from the employer to the employee, we have enhanced our focus on ourvoluntary benefits platform. We believe the voluntary/worksite market presents growth opportunities, and we willcontinue to develop strategies to capitalize on this expanding market.
As of December 31, 2010, we had 96 sales representatives and 102 service representatives in 35 offices. Our salesrepresentatives accounted for 94% of our group insurance sales for the year ended December 31, 2010. The group salesforce plays a key role in the ongoing servicing of the case by providing local, responsive services to our customers andtheir brokers, such as renewing contracts, revising plans and solving any administrative issues; communicating thecustomers’ needs and feedback to us and helping employees understand the benefits of their plans.
Corporate Segment
Our Corporate segment manages the assets representing capital that has not been allocated to any other segment.Financial results of the Corporate segment primarily reflect our financing activities (including interest expense andpreferred stock dividends), income on capital not allocated to other segments, inter-segment eliminations, income taxrisks and certain income, expenses and other after-tax adjustments not allocated to the segments based on the nature ofsuch items. Results of our exited group medical insurance business are reported in this segment. For further details, seeItem 7. ‘‘Management’s Discussion and Analysis of Financial Condition and Results of Operations — TransactionsAffecting Comparability.’’
13
Competition
Competition in our segments is based on a number of factors including: scale, service, product features, price,investment performance, commission structure, distribution capacity, financial strength ratings and name recognition. Wecompete with a large number of financial services companies such as banks, mutual funds, broker-dealers, insurers andasset managers. Some of these companies offer a broader array of products, more competitive pricing, greater diversity ofdistribution sources, better brand recognition or, with respect to insurers, higher financial strength ratings. Some may alsohave greater financial resources with which to compete or may have better investment performance at various times.
Competition in the retirement services market is very fragmented. Our main competitors in this market includeFidelity, ING, Mass Mutual, Vanguard and John Hancock. We believe the infrastructure and system support needed tomeet the needs of the small and medium-sized business market is a significant barrier to entry for our competitors. Manyof our competitors in the mutual fund industry are larger, have been established for a longer period of time, offer lessexpensive products, have deeper penetration in key distribution channels and have more resources than we do. Therewere over 7,600 mutual funds in the U.S. as of December 31, 2009, according to the Investment Company Institute 2010Investment Company Fact Book. The institutional asset management market has grown at a rapid pace over the lastdecade. Our primary competitors in this market are large institutional asset management firms, such as Black Rock,PIMCO, J.P. Morgan Chase, Morgan Stanley Investment Management and T. Rowe Price, some of which offer a broaderarray of investment products and services and are better known. The asset management business has relatively fewbarriers to entry and continually attracts new entrants. The variable annuity market is also highly competitive. We facestrong competition from Lincoln Financial Group and John Hancock. Competition in the international markets in whichwe operate comes primarily from local financial services firms and other international companies operating on a stand-alone basis or in a partnership with local firms, including ING, AXA, Allianz and American International Group, Inc. Inthe highly competitive U.S. insurance industry, our competitors include insurers such as Assurant, Guardian, UNUM,Lincoln Financial Group, MetLife, Sun Life, Prudential and John Hancock. We believe we distinguish ourselves from ourcompetitors through our:
• full service platform;
• strong customer relationships;
• focus on financial performance and
• performance-oriented culture.
Ratings
Insurance companies are assigned financial strength ratings by rating agencies based upon factors relevant topolicyholders. Financial strength ratings are generally defined as opinions as to an insurer’s financial strength and abilityto meet ongoing obligations to policyholders. Information about ratings provides both industry participants and insuranceconsumers meaningful insights on specific insurance companies. Higher ratings generally indicate financial stability and astronger ability to pay claims.
Principal Life and Principal National Life Insurance Company (‘‘PNLIC’’) have been assigned the following insurerfinancial strength ratings:
Rating Agency Financial Strength Rating Rating Structure
A.M. Best Company, Inc. . . . . . . . . . . . . A+ (‘‘Superior’’) with a stable outlook Second highest of 16 rating levelsFitch Ratings Ltd. . . . . . . . . . . . . . . . . AA- (‘‘Very Strong’’) with a negative outlook Fourth highest of 21 rating levelsMoody’s Investors Service . . . . . . . . . . . . Aa3 (‘‘Excellent’’) with a stable outlook Fourth highest of 21 rating levelsStandard & Poor’s . . . . . . . . . . . . . . . . A (‘‘Strong’’) with a positive outlook Sixth highest of 21 rating levels
A.M. Best’s ratings for insurance companies range from ‘‘A++’’ to ‘‘S’’. A.M. Best indicates that ‘‘A++’’ and ‘‘A+’’ratings are assigned to those companies that in A.M. Best’s opinion have superior ability to meet ongoing obligations topolicyholders. Fitch’s ratings for insurance companies range from ‘‘AAA’’ to ‘‘C’’. Fitch ‘‘AA’’ ratings indicate very strongcapacity to meet policyholder and contractholder obligations on a timely basis. Moody’s Investors Service ratings forinsurance companies range from ‘‘Aaa’’ to ‘‘C’’. Moody’s Investors Service indicates that ‘‘Aa’’ ratings are assigned tothose companies that have demonstrated excellent financial security. Standard & Poor’s ratings for insurance companiesrange from ‘‘AAA’’ to ‘‘R’’. Standard & Poor’s indicates that ‘‘A’’ ratings are assigned to those companies that havedemonstrated strong financial security characteristics. In evaluating a company’s financial and operating performance,these rating agencies review its profitability, leverage and liquidity, as well as its book of business, the adequacy andsoundness of its reinsurance, the quality and estimated market value of its assets, the adequacy of its policy reserves, thesoundness of its risk management programs, the experience and competency of its management and other factors. A.M.Best, Moody’s and Fitch have stable outlooks on the U.S. life insurance industry. Standard & Poor’s currently has anegative outlook on the U.S. life insurance industry but plans to review its outlook in early 2011. The rating agenciesindicate they believe the economic recovery will be slow moving, hampering earnings recovery, and creating the potentialfor further credit losses, particularly in the commercial and residential mortgage asset classes. However, all agencies alsoindicate there are positive signs for the U.S. life insurance sector.
14

We believe that our strong ratings are an important factor in marketing our products to our distributors andcustomers, since ratings information is broadly disseminated and generally used throughout the industry. Our ratingsreflect each rating agency’s opinion of our financial strength, operating performance and ability to meet our obligationsto policyholders and are not evaluations directed toward the protection of investors. Such ratings are neither a rating ofsecurities nor a recommendation to buy, hold or sell any security, including our common stock. For more information onratings, see Item 7. ‘‘Management’s Discussion and Analysis of Financial Condition and Results of Operations —Liquidity and Capital Resources — Financial Strength Rating and Credit Ratings.’’
Regulation
Our businesses are subject to regulation and supervision by U.S. federal and state regulatory authorities as well asnon-U.S. regulatory authorities for our operations outside the U.S., which can have a significant effect on our business.Our businesses are also affected by U.S. federal, state and local tax laws as well as tax laws for jurisdictions outside theU.S.
PFG, our parent holding company, is not licensed as an insurer, investment advisor, broker-dealer, bank or otherregulated entity. However, because it is the holding company for all of our operations, it is subject to regulation of ourregulated entities, including as an insurance holding company and savings and loan holding company. We are subject tolegal and regulatory requirements applicable to public companies, including public reporting and disclosure, securitiestrading, accounting and financial reporting and corporate governance.
U.S. Insurance Regulation
We are subject to the insurance holding company laws in the states where our insurance companies are domiciled.Principal Life and PNLIC are domiciled in Iowa and their principal insurance regulatory authority is the InsuranceDivision of the Department of Commerce of the State of Iowa. Our other U.S. insurance companies are principallyregulated by the insurance departments of the states in which they are domiciled. These laws generally require eachinsurance company directly or indirectly owned by the holding company to register with the insurance department in theinsurance company’s state of domicile and to furnish financial and other information about the operations of thecompanies within the holding company system. Transactions affecting the insurers in the holding company system must befair and at arm’s length. Most states have insurance laws that require regulatory approval of a direct or indirect change incontrol of an insurer or an insurer’s holding company and laws requiring prior notification of state insurance departmentsof a change in control of a non-domiciliary insurance company doing business in that state.
Annually, our U.S. insurance companies must submit an opinion from a board-appointed qualified actuary to stateinsurance regulators, where licensed, on whether the statutory assets held backing statutory reserves are sufficient tomeet contractual obligations and related expenses of the insurer. If such an opinion cannot be rendered noting thesufficiency of assets, then the insurance company must set up additional statutory reserves drawing from availablestatutory surplus until such an opinion can be given.
State insurance departments have broad administrative powers over the insurance business, including insurancecompany licensing and examination, agent licensing, establishment of reserve requirements and solvency standards,premium rate regulation, admittance of assets to statutory surplus, policy form approval, unfair trade and claims practicesregulation and other matters. State insurance statutes also typically place restrictions and limitations on the amount ofdividends or other distributions payable by insurance company subsidiaries to their parent companies. See Item 7.‘‘Management’s Discussion and Analysis of Financial Condition and Results of Operations — Liquidity and CapitalResources’’ for further detail.
In order to enhance the regulation of insurer solvency, the National Association of Insurance Commissioners(‘‘NAIC’’) has established risk-based capital standards. The standards require life insurers to submit a report to stateregulators on an annual basis regarding their risk-based capital based upon four categories of risk: asset risk, insurancerisk, interest rate risk and business risk. As of December 31, 2010, the statutory surplus of each of our U.S. life insurancecompanies exceeded the minimum level of risk-based capital requirements required before state insurance departmentswould take action against an insurer.
State and federal insurance and securities regulatory authorities and other state law enforcement agencies andattorneys general regularly make inquiries and conduct examinations or investigations regarding our compliance with,among other things, insurance laws and securities laws.
Each state has insurance guaranty association laws under which insurers doing business in a state can be assessed, upto prescribed limits, in order to cover contractual benefit obligations of insolvent insurance companies. The guarantyassociations levy assessments on each member insurer in a jurisdiction on the basis of the proportionate share of thepremiums written by such insurer in the lines of business in which the insolvent insurer is engaged. Some jurisdictionspermit the member insurers to recover the assessments paid through full or partial premium tax offsets.
Securities Regulation
Insurance and investment products such as variable annuities, variable life insurance and some funding agreementsthat constitute securities and mutual fund products are subject to securities laws and regulations, including state securities
15

regulation as well as federal regulation under the SEC, the Financial Industry Regulatory Authority and other regulatoryauthorities. These regulations affect investment advice, sales and related activities for these products.
We also have entities which are registered as investment advisers with the SEC under the Investment Advisers Act of1940.
Employee Retirement Income Security Act
As we provide products and services for U.S. employee benefit plans, we are subject to regulation under theEmployee Retirement Income Security Act (‘‘ERISA’’). ERISA provisions include reporting and disclosure requirementsand standards of conduct.
Banking Regulation
We are a savings and loan holding company for Principal Bank, a federal savings bank, which is regulated by theOffice of Thrift Supervision. Principal Bank is also a member of the Federal Deposit Insurance Corporation (‘‘FDIC’’)and subject to its regulations.
Environmental Regulation
As we own and operate real property, we are subject to federal, state and local environmental laws and could besubject to environmental liabilities and costs associated with required remediation of our properties. We routinely haveenvironmental assessments performed for real estate being acquired or used as collateral for commercial mortgages weuse for investment.
Regulation of International Businesses
Our international businesses are supervised by regulatory authorities in the jurisdictions in which they operate.
Risk Management
Like all financial services companies, we are exposed to a wide variety of financial, operational and other risks, asdescribed in Item 1A. ‘‘Risk Factors.’’ Effective enterprise risk management is, therefore, a key component of ourbusiness model. Enterprise risk management helps us to:
• identify and manage those risks that present profitable growth opportunities, and avoid those that do not and
• balance the sometimes competing demands of our various stakeholders, meet our customer obligations, satisfyregulatory requirements and optimize shareholder returns relative to the risks we take.
We use a variety of methods to help us identify, monitor, measure, communicate and manage our risks withinestablished limits and risk tolerances.
Our Board of Directors and senior management are knowledgeable of and accountable for key risks. Our Boardmeets at least quarterly and regularly hears reports from the Chief Executive Officer, the business unit Presidents, theChief Financial Officer and the Chief Investment Officer. The Board has several committees, which include the AuditCommittee, the Finance Committee, the Human Resources Committee and the Nominating and Governance Committeethat meet at least quarterly and address various aspects of risks. In addition, the Board of Directors and seniormanagement receive quarterly updates from the Chief Risk Officer.
We also have several senior management groups and committees that meet on a regular and frequent basis to discussvarious issues and risks associated with our businesses. These committees encompass numerous functions such asdiscussing and setting business unit and company strategy, reviewing and approving potential uses of corporate capitaland setting investment policy and reviewing its implementation. Many key members of senior management serve onmultiple committees, allowing them to provide oversight and take a holistic view of our key risks.
Our enterprise risk management program is executed via a federated model. The Chief Risk Officer and thecorporate risk units are independent of the business units, and work closely with the business units, providing oversightand integration of all risk management activities. Each business unit has its own risk committee and is responsible foridentifying, monitoring, measuring and managing its risks, as well as monitoring how its risks impact the enterprise’soverall risk exposure. The business units provide risk reports to the Chief Risk Officer quarterly with current riskmanagement information.
We have established risk tolerances from an overall corporate perspective as well as for specific types of risks. Allpotentially significant actions are considered in terms of the possible impact on our risk profile, including the capitalrequired, the impact on near term and long-term earnings and the ability to meet our targets with respect to return onequity, liquidity, debt/capital, cash coverage and other ratios and metrics. We monitor a variety of risk metrics on anongoing basis and make any necessary adjustments to help us stay within our established risk tolerances. We havedeveloped a Business Continuity Management Program that identifies critical business functions and includes plans fortheir protection and recovery in the event of a disaster or other business interruption. We continually monitor emerging
16
risks, and we regularly build upon our already strong risk management practices to incorporate updated modeling tools,processes and metrics, which we actively use to better understand and manage our business. We monitor three key riskmetrics as part of our enterprise risk management framework:
• Earnings at Risk, which is a measure of the potential volatility in operating earnings and net income relative tobaseline operating earnings and net income under relatively adverse business and economic conditions.
• Embedded Value at Risk, which is a measure of the potential volatility in embedded value relative to baselineembedded value under relatively adverse business and economic conditions.
• Economic Total Asset Requirement, which is the total assets required to ensure that we can meet all of ourobligations with a high degree of confidence. Economic Total Asset Requirement is the sum of Economic Reservesand Economic Capital.
Employees
As of December 31, 2010, we had 13,627 employees. None of our employees are subject to collective bargainingagreements governing employment with us. We believe that our employee relations are satisfactory.
Internet Website
Our Internet website can be found at www.principal.com. We make available free of charge on or through ourInternet website, access to our annual report on Form 10-K, quarterly reports on Form 10-Q, current reports onForm 8-K and amendments to those reports filed or furnished pursuant to Section 13(a) or 15(d) of the SecuritiesExchange Act of 1934 as soon as reasonably practicable after such material is filed with or furnished to the SEC. Alsoavailable free of charge on our Internet website is our code of business conduct and ethics, corporate governanceguidelines and charters for the audit, finance, human resources and nominating and governance committees of our Boardof Directors. Also see Item 10. ‘‘Directors, Executive Officers and Corporate Governance.’’
Item 1A. Risk Factors
This section provides an overview of the risks that may impact our performance in the future.
Adverse capital and credit market conditions may significantly affect our ability to meet liquidity needs, as well as ouraccess to capital and cost of capital.
Since mid 2007, the capital and credit markets have been experiencing extreme volatility and disruption. Beginningin the second half of 2008, the volatility and disruption reached unprecedented levels and the markets exerted downwardpressure on availability of liquidity and credit capacity for certain issuers. Although market conditions have improved, ourresults of operations, financial condition, cash flows and statutory capital position could be materially adversely affectedby continued disruptions in the capital and credit markets.
We maintain a level of cash and securities which, combined with expected cash inflows from investments andoperations, is believed adequate to meet anticipated short-term and long-term benefit and expense payment obligations.However, withdrawal and surrender levels may differ from anticipated levels for a variety of reasons, such as changes ineconomic conditions or changes in our claims paying ability and financial strength ratings. For additional informationregarding our exposure to interest rate risk and the impact of a downgrade in our financial strength ratings, see‘‘— Changes in interest rates or credit spreads may adversely affect our results of operations, financial condition andliquidity, and our net income can vary from period-to-period’’ and ‘‘— A downgrade in our financial strength or creditratings may increase policy surrenders and withdrawals, reduce new sales and terminate relationships with distributors,impact existing liabilities and increase our cost of capital, any of which could adversely affect our profitability andfinancial condition.’’ In the event our current internal sources of liquidity do not satisfy our needs, we may have to seekadditional financing and, in such case, we may not be able to successfully obtain additional financing on favorable terms,or at all. The availability of additional financing will depend on a variety of factors such as market conditions, the generalavailability of credit, the volume of trading activities, the overall availability of credit to the financial services industry, ourcredit ratings and credit capacity, as well as customers’ or lenders’ perception of our long- or short-term financialprospects. Similarly, our access to funds may be impaired if regulatory authorities or rating agencies take negative actionsagainst us.
Disruptions, uncertainty or volatility in the capital and credit markets may limit our access to capital required tooperate our business, most significantly our insurance operations. Such market conditions may limit our ability to replace,in a timely manner, maturing liabilities; satisfy statutory capital requirements; fund redemption requests on insurance orother financial products; generate fee income and market-related revenue to meet liquidity needs and access the capitalnecessary to grow our business. As such, we may be forced to delay raising capital, issue shorter tenor securities than weprefer, utilize available internal resources or bear an unattractive cost of capital, which could decrease our profitabilityand significantly reduce our financial flexibility and liquidity.
For further discussion on liquidity risk management, see Item 7. ‘‘Management’s Discussion and Analysis ofFinancial Condition and Results of Operations — Liquidity and Capital Resources.’’
17

Continued difficult conditions in the global capital markets and the economy generally may materially and adversely affectour business and results of operations.
Our results of operations are materially affected by conditions in the global capital markets and the economygenerally, both in the U.S. and elsewhere around the world. Recently, concerns over the slow economic recovery, level ofU.S. national debt and structural deficits, European sovereign debt crisis, the U.S. mortgage market, inflation levels,energy costs and geopolitical issues have contributed to increased volatility and diminished expectations for the economyand the markets going forward. These factors, combined with volatile oil prices, reduced business and consumerconfidence and continued high unemployment, have negatively impacted the U.S. economy. Initially, the concerns on thepart of market participants were focused on the subprime segment of the mortgage-backed securities market. However,these concerns expanded to include a broad range of mortgage- and asset-backed and other fixed income securities,including those rated investment grade, the U.S. and international credit and interbank money markets, generally, and awide range of financial institutions and markets, asset classes and sectors. Although liquidity has improved, the marketfor fixed income instruments has continued to experience some price volatility, credit downgrade events and elevatedprobabilities of default. Our AUM and revenues may decline in such circumstances and our profit margins could erode.In addition, in the event of extreme prolonged market events, such as the global credit crisis, we could incur significantlosses. Even in the absence of a market downturn, we are exposed to substantial risk of loss due to market volatility.
Factors such as consumer spending, business investment, government spending, the volatility and strength of thecapital markets, investor and consumer confidence and inflation levels all affect the business and economic environmentand, ultimately, the amount and profitability of our business. In an economic downturn characterized by higherunemployment, lower family income, lower corporate earnings, lower business investment, negative investor sentimentand lower consumer spending, the demand for our financial and insurance products could be adversely affected. Inaddition, we may experience an elevated incidence of claims and lapses or surrenders of policies. Our policyholders maychoose to defer paying insurance premiums or stop paying insurance premiums altogether. In addition, reductions inemployment levels of our existing employer customers may result in a reduction in membership levels and premiumincome for our specialty benefits products. Participants within the retirement plans for which we provide administrativeservices may elect to reduce or stop their payroll deferrals to these plans, which would reduce AUM and revenues. Inaddition, reductions in employment levels may result in a decline in employee deposits into retirement plans. Adversechanges in the economy could affect net income negatively and could have a material adverse effect on our business,results of operations and financial condition.
Continued volatility or further declines in the equity markets could reduce our AUM and may result in investorswithdrawing from the markets or decreasing their rates of investment, all of which could reduce our revenues and netincome.
Domestic and international equity markets experienced severe declines and heightened volatility in 2008 and early2009. Although equity markets have been recovering, equity values still remain below the values achieved in 2007.Because the revenues of our asset management and accumulation businesses are, to a large extent, based on the value ofAUM, a decline in domestic and global equity markets will decrease our revenues. Turmoil in these markets could leadinvestors to withdraw from these markets, decrease their rates of investment or refrain from making new investments,which may reduce our net income, revenues and AUM.
For further discussion on equity risk management, see Item 7A. ‘‘Quantitative and Qualitative Disclosures AboutMarket Risk — Equity Risk.’’
Changes in interest rates or credit spreads may adversely affect our results of operations, financial condition and liquidity,and our net income can vary from period-to-period.
We are exposed to significant financial and capital markets risk, including changes in interest rates, credit spreads,equity prices, real estate values, foreign currency exchange rates, market volatility, the performance of the economy ingeneral, the performance of the specific obligors included in our portfolio and other factors outside our control. Ourexposure to interest rate risk relates primarily to the market price and cash flow variability associated with changes ininterest rates. A rise in interest rates will increase unrealized losses in our investment portfolio and, if long-term interestrates rise dramatically within a six to twelve month time period, certain segments of our life insurance and annuitiesbusinesses may be exposed to disintermediation risk. Disintermediation risk refers to the risk that our policyholders maysurrender their contracts in a rising interest rate environment, requiring us to liquidate assets in an unrealized lossposition. Due to the long-term nature of the liabilities associated with certain segments of our life insurance businesses,sustained declines in long-term interest rates may subject us to reinvestment risks and increased hedging costs. In othersituations, declines in interest rates may result in increasing the duration of certain life insurance liabilities, creating assetand liability duration mismatches.
Our investment portfolio also contains interest rate sensitive instruments, such as fixed income securities, which maybe adversely affected by changes in interest rates from governmental monetary policies, domestic and internationaleconomic and political conditions and other factors beyond our control. A rise in interest rates would increase unrealizedlosses in our investment portfolio, offset by our ability to earn higher rates of return on funds reinvested. Conversely, adecline in interest rates would decrease the net unrealized loss position of our investment portfolio, offset by lower rates
18

of return on funds reinvested. Although we take measures to manage the economic risks of investing in a changinginterest rate environment, we may not be able to mitigate the interest rate risk of our assets relative to our liabilities.
Our exposure to credit spreads primarily relates to market price variability and reinvestment risk associated withchanges in credit spreads. A widening of credit spreads would increase unrealized losses in the investment portfolio,would increase losses associated with credit-based derivatives we have sold that do not qualify or have not beendesignated for hedge accounting where we assume credit exposure and, if issuer credit spreads increase as a result offundamental credit deterioration, would likely result in higher other-than-temporary impairments. Credit spreadtightening will reduce net investment income associated with new purchases of fixed maturities. Credit spread tighteningmay also cause an increase in the reported value of certain liabilities that are valued using a discount rate that reflects ourown credit spread. In addition, market volatility may make it difficult to value certain of our securities if trading becomesless frequent. As such, valuations may include assumptions or estimates that may have significant period-to-periodchanges from market volatility, which could have a material adverse effect on our results of operations or financialcondition. Continuing challenges include continued weakness in the U.S. residential and commercial real estate marketand increased mortgage delinquencies, investor anxiety over the U.S. economy, rating agency downgrades of variousstructured products and financial issuers, unresolved issues with structured investment vehicles and monolines,deleveraging of financial institutions and hedge funds and a serious dislocation in the inter-bank market. If significant,continued volatility, changes in interest rates, changes in credit spreads and defaults, a lack of pricing transparency,market liquidity, declines in equity prices, declines in inflation-adjusted investments and the strengthening or weakeningof foreign currencies against the U.S. dollar, individually or in tandem, could continue to have a material adverse effecton our results of operations, financial condition or cash flows through realized losses, impairments and changes inunrealized positions.
Our investment portfolio is subject to several risks that may diminish the value of our invested assets and the investmentreturns credited to customers, which could reduce our sales, revenues, AUM and net income.
An increase in defaults or write-downs on our fixed maturities portfolio may reduce our profitability.
We are subject to the risk that the issuers of the fixed maturities we own will default on principal and interestpayments, particularly if a major downturn in economic activity occurs. As of December 31, 2010, our U.S. investmentoperations held $46.3 billion of fixed maturities, or 77% of total U.S. invested assets, of which approximately 8.3% werebelow investment grade, including $633.7 million, or 1.37% of our total fixed maturities which we classified as either‘‘problem,’’ ‘‘potential problem’’ or ‘‘restructured.’’ See Item 7. ‘‘Management’s Discussion and Analysis of FinancialCondition and Results of Operations — Investments — U.S. Investment Operations — Fixed Maturities.’’
Our U.S. fixed maturities portfolio includes securities collateralized by residential and commercial mortgage loans.As of December 31, 2010, our U.S. investment operations held $4.8 billion of residential mortgage-backed securities, ofwhich $3.4 billion are Government National Mortgage Association, Federal National Mortgage Association or FederalHome Loan Mortgage Corporation pass-through securities, and $3.8 billion of commercial mortgage-backed securities,which represent in combination 19% of our total fixed maturities portfolio. For residential mortgage-backed securities,prepayment speeds, changes in mortgage delinquency or recovery rates, credit rating changes by rating agencies, changein property values underlying the loans and the quality of service provided by service providers on securities in ourportfolios could lead to write-downs on these securities. For commercial mortgage-backed securities, changes inmortgage delinquency or default rates, interest rate movements, credit quality and vintage of the underlying loans,changes in property values underlying the loans and credit rating changes by rating agencies could result in write-downsof those securities. See Item 7. ‘‘Management’s Discussion and Analysis of Financial Condition and Results ofOperations — Investments — U.S. Investment Operations — Fixed Maturities.’’
As of December 31, 2010, the international investment operations of our fully consolidated subsidiaries held$3.5 billion, or 65%, of total international invested assets in fixed maturities, of which 16% are government bonds. Somenon-government bonds have been rated on the basis of the issuer’s country credit rating. However, the ratingsrelationship between national ratings and global ratings is not linear with the U.S. The starting point for national ratingsdiffers by country, which makes the assessment of credit quality more difficult. See Item 7. ‘‘Management’s Discussionand Analysis of Financial Condition and Results of Operations — Investments — International Investment Operations.’’An increase in defaults on our fixed maturities portfolio could harm our financial strength and reduce our profitability.
An increased rate of delinquency and defaults on our commercial mortgage loans, especially those with amortizing balloonpayments, may adversely affect our profitability.
Our commercial mortgage loan portfolio faces both delinquency and default risk. Commercial mortgage loans of$9.6 billion represented 14% of our total invested assets as of December 31, 2010. As of December 31, 2010, loans thatwere in the process of foreclosure totaled $13.5 million, or 0.1% of our commercial mortgage loan portfolio. Theperformance of our commercial mortgage loan investments, however, may fluctuate in the future. An increase in thedelinquency rate of, and defaults under, our commercial mortgage loan portfolio could harm our financial strength anddecrease our profitability.
As of December 31, 2010, approximately $8.2 billion, or 85%, of our commercial mortgage loans before valuationallowance had amortizing balloon payment maturities. A balloon maturity is a loan with larger dollar amounts of
19

payments becoming due in the later years of the loan. The default rate on commercial mortgage loans with balloonpayment maturities has historically been higher than for commercial mortgage loans with standard repayment schedules.Since most of the principal is repaid at maturity, the amount of loss on a default is generally greater than on othercommercial mortgage loans. An increase in defaults on such loans as a result of the foregoing factors could harm ourfinancial strength and decrease our profitability.
We may have difficulty selling our privately placed fixed maturities, commercial mortgage loans and real estate investmentsbecause they are less liquid than our publicly traded fixed maturities.
We hold certain investments that may lack liquidity, such as privately placed fixed maturities, commercial mortgageloans and real estate investments. These asset classes represented approximately 38% of the value of our invested assetsas of December 31, 2010.
If we require significant amounts of cash on short notice, we may have difficulty selling these investments in a timelymanner, be forced to sell them for less than we otherwise would have been able to realize or both. The reported value ofour relatively illiquid types of investments, our investments in the asset classes described above and, at times, our highquality, generally liquid asset classes, do not necessarily reflect the lowest possible price for the asset. If we were forced tosell certain of our assets in the current market, there can be no assurance that we will be able to sell them for the prices atwhich we have recorded them and we may be forced to sell them at significantly lower prices.
The impairment of other financial institutions could adversely affect us.
We use derivative instruments to hedge various risks we face in our businesses. See Item 7A. ‘‘Quantitative andQualitative Disclosures About Market Risk.’’ We enter into a variety of derivative instruments, including interest rateswaps, interest rate collars, swaptions, futures, currency swaps, currency forwards, credit default swaps and options, with anumber of counterparties in the financial services industry, including brokers and dealers, commercial banks, investmentbanks and other investment funds and other institutions. For transactions where we are in-the-money, we are exposed tocredit risk in the event of default of our counterparty. We limit our exposure to credit risk by establishing collateralagreements with nominal thresholds for a large majority of our counterparties. However, our credit risk may beexacerbated when the collateral held by us cannot be realized upon or is liquidated at prices not sufficient to recover thefull amount of the loan or derivative exposure. With regards to our derivative exposure, we have over-collateralizationrequirements on the portion of collateral we hold, based on the riskiness of the assets posted as collateral. We also haveexposure to these financial institutions in the form of unsecured debt instruments and equity investments. Such losses orimpairments to the carrying value of these assets may materially and adversely affect our business and results ofoperations.
Our requirements to post collateral or make payments related to declines in market value of specified assets may adverselyaffect our liquidity and expose us to counterparty credit risk.
Many of our derivative transactions with financial and other institutions specify the circumstances under which theparties are required to post collateral. The amount of collateral we may be required to post under these agreements mayincrease under certain circumstances, which could adversely affect our liquidity. In addition, under the terms of some ofour transactions we may be required to make payment to our counterparties related to any decline in the market value ofthe specified assets. Such payments could have an adverse effect on our liquidity. Furthermore, with respect to any suchpayments, we will have unsecured risk to the counterparty as these amounts are not required to be segregated from thecounterparty’s other funds, are not held in a third-party custodial account, and are not required to be paid to us by thecounterparty until the termination of the transaction.
Environmental liability exposure may result from our commercial mortgage loan portfolio and real estate investments.
Liability under environmental protection laws resulting from our commercial mortgage loan portfolio and real estateinvestments may harm our financial strength and reduce our profitability. Under the laws of several states, contaminationof a property may give rise to a lien on the property to secure recovery of the costs of cleanup. In some states, this kind oflien has priority over the lien of an existing mortgage against the property, which would impair our ability to foreclose onthat property should the related loan be in default. In addition, under the laws of some states and under the federalComprehensive Environmental Response, Compensation and Liability Act of 1980, we may be liable for costs ofaddressing releases or threatened releases of hazardous substances that require remedy at a property securing a mortgageloan held by us, if our agents or employees have become sufficiently involved in the hazardous waste aspects of theoperations of the related obligor on that loan, regardless of whether or not the environmental damage or threat wascaused by the obligor. We also may face this liability after foreclosing on a property securing a mortgage loan held by us.This may harm our financial strength and decrease our profitability.
Regional concentration of our commercial mortgage loan portfolio in California may subject us to economic downturns orlosses attributable to earthquakes in that state.
Commercial mortgage lending in the state of California accounted for 22%, or $2.1 billion, of our commercialmortgage loan portfolio as of December 31, 2010. Due to this concentration of commercial mortgage loans in California,
20

we are exposed to potential losses resulting from the risk of an economic downturn in California as well as tocatastrophes, such as earthquakes, that may affect the region. While we generally do not require earthquake insurancefor properties on which we make commercial mortgage loans, we do take into account property specific engineeringreports, construction type and geographical concentration by fault lines in our investment underwriting guidelines. Ifeconomic conditions in California do not improve or continue to deteriorate or catastrophes occur, we may in the futureexperience delinquencies or defaults on the portion of our commercial mortgage loan portfolio located in California,which may harm our financial strength and reduce our profitability.
Our valuation of fixed maturities and equity securities may include methodologies, estimations and assumptions whichare subject to differing interpretations and could result in changes to investment valuations that may materially adverselyaffect our results of operations or financial condition.
Fixed maturities and equity securities reported at fair value on our consolidated statements of financial positionrepresented the majority of our total cash and invested assets. The fair value hierarchy prioritizes the inputs to valuationtechniques used to measure fair value into three levels. The level in the fair value hierarchy is based on the priority of theinputs to the respective valuation technique. The fair value hierarchy gives the highest priority to quoted prices in activemarkets for identical assets or liabilities (Level 1) and the lowest priority to unobservable inputs (Level 3). An asset orliability’s classification within the fair value hierarchy is based on the lowest level of significant input to its valuation.
• Level 1: Fair values are based on unadjusted quoted prices in active markets for identical assets or liabilities.
• Level 2: Fair values are based on inputs other than quoted prices within Level 1 that are observable for the assetor liability, either directly or indirectly.
• Level 3: Fair values are based on at least one significant unobservable input for the asset or liability.
Excluding separate account assets as of December 31, 2010, 2%, 96% and 2% of our net assets and liabilitiesreported at fair value represented Level 1, Level 2 and Level 3, respectively. Our Level 1 assets and liabilities primarilyinclude exchange traded equity securities, mutual funds and U.S. Treasury bonds. Our Level 2 assets and liabilitiesprimarily include fixed maturities (including public and private bonds), equity securities, over-the-counter derivatives andother investments for which public quotations are not available but that are priced by third-party pricing services orinternal models using substantially all observable inputs. Our Level 3 assets and liabilities include certain fixed maturities,private equity securities, commercial mortgage loan investments and obligations of consolidated variable interest entitiesfor which the fair value option was elected, complex derivatives and embedded derivatives. Level 3 securities contain atleast one significant unobservable market input and as a result considerable judgment may be used in determining thefair values. These fair values are generally obtained through the use of valuation models or methodologies using at leastone significant unobservable input or broker quotes. Prices provided by independent pricing services or independentbroker quotes that are used in the determination of fair value can vary for a particular security.
For additional information on our valuation methodology, see Item 8. ‘‘Financial Statements and SupplementaryData, Notes to Consolidated Financial Statements, Note 14, Fair Value Measurements.’’
During periods of market disruption including periods of significantly rising or high interest rates, rapidly wideningcredit spreads or illiquidity, it may be difficult to value certain of our securities, for example collateralized mortgageobligations and collateralized debt obligations, if trading becomes less frequent and/or market data becomes lessobservable. There may be certain asset classes that were in active markets with significant observable data that becomeilliquid due to the current financial environment. In such cases, more securities may fall to Level 3 and thus require moresubjectivity and management judgment. As such, valuations may include inputs and assumptions that are less observableor require greater estimation as well as valuation methods that require greater estimation, which could result in valuesthat are different from the value at which the investments may be ultimately sold. Further, rapidly changing credit andequity market conditions could materially impact the valuation of securities as reported within our consolidated financialstatements and the period-to-period changes in value could vary significantly. Decreases in value may have a materialadverse effect on our results of operations or financial condition.
The determination of the amount of allowances and impairments taken on our investments requires estimations andassumptions which are subject to differing interpretations and could materially impact our results of operations orfinancial position.
The determination of the amount of allowances and impairments vary by investment type and is based upon ourperiodic evaluation and assessment of known and inherent risks associated with the respective asset class. Suchevaluations and assessments are revised as conditions change and new information becomes available. There can be noassurance that our management has accurately assessed the level of impairments taken and allowances reflected in ourfinancial statements. Furthermore, additional impairments may need to be taken or allowances provided for in the future.Historical trends may not be indicative of future impairments or allowances.
Additionally, our management considers a wide range of factors about the instrument issuer and uses their bestjudgment in evaluating the cause of the decline in the estimated fair value of the instrument and in assessing theprospects for recovery. Inherent in management’s evaluation of the security are assumptions and estimates about theoperations of the issuer and its future earnings potential. For further information regarding our impairment
21
methodology, see Item 7. ‘‘Management’s Discussion and Analysis of Financial Condition and Results of Operations —Investments — U.S. Investment Operations — Fixed Maturities.’’
Gross unrealized losses may be realized or result in future impairments, resulting in a reduction in our net income.
Fixed maturities that are classified as available-for-sale (‘‘AFS’’) are reported on the consolidated statements offinancial position at fair value. Unrealized gains or losses on AFS securities are recognized as a component of equity andare, therefore, excluded from net income. Our U.S. investment operations held gross unrealized losses on fixed maturitiesof $1.4 billion pre-tax as of December 31, 2010, and the component of gross unrealized losses for securities trading down20% or more for over six months was approximately $1.0 billion pre-tax. The accumulated change in fair value of the AFSsecurities is recognized in net income when the gain or loss is realized upon the sale of the asset or in the event that thedecline in fair value is determined to be other than temporary (referred to as an other-than-temporary impairment).Realized losses or impairments may have a material adverse impact on our net income in a particular quarter or annualperiod.
Competition from companies that may have greater financial resources, broader arrays of products, higher ratings andstronger financial performance may impair our ability to retain existing customers, attract new customers and maintainour profitability.
We believe that our ability to compete is based on a number of factors including scale, service, product features,price, investment performance, commission structure, distribution capacity, financial strength ratings and namerecognition. We compete with a large number of financial services companies such as banks, mutual funds, broker-dealers, insurers and asset managers, many of which have advantages over us in one or more of the above competitivefactors.
Each of our segments faces strong competition. The primary competitors for our Retirement and Investor Servicesand Principal Global Investors segments are asset managers, banks, broker-dealers and insurers. Our ability to increaseand retain AUM is directly related to the performance of our investments as measured against market averages and theperformance of our competitors. Even when securities prices are generally rising, performance can be affected byinvestment styles. Also, there is a risk that we may not be able to attract and retain the top talent needed to compete inour industry.
Competition for our Principal International segment comes primarily from local financial services firms and otherinternational companies operating on a stand-alone basis or in partnership with local firms.
Our U.S. Insurance Solutions segment competes with insurers.
National banks, with their large existing customer bases, may increasingly compete with insurers as a result of courtrulings allowing national banks to sell annuity products in some circumstances, and as a result of legislation removingrestrictions on bank affiliations with insurers. Specifically, the Gramm-Leach-Bliley Act of 1999 permits mergers thatcombine commercial banks, insurers and securities firms under one holding company. These developments may increasecompetition, in particular for our asset management and accumulation businesses, by substantially increasing the number,size and financial strength of potential competitors who may be able to offer, due to economies of scale, morecompetitive pricing than we can.
In response to current market conditions, the U.S. and foreign governments in the markets we serve have takenactions, including but not limited to, direct government control or investment in certain entities. We may find that theseactions create, among other things, unforeseen competitive advantages for our competitors due to explicit or impliedsupport from the government.
A downgrade in our financial strength or credit ratings may increase policy surrenders and withdrawals, reduce new salesand terminate relationships with distributors, impact existing liabilities and increase our cost of capital, any of whichcould adversely affect our profitability and financial condition.
Nationally Recognized Statistical Rating Organizations (‘‘NRSROs’’) publish financial strength ratings on U.S. lifeinsurance companies that are indicators of an insurance company’s ability to meet contractholder and policyholderobligations. NRSROs also assign credit ratings on non-life insurance entities, such as PFG and Principal FinancialServices, Inc. (‘‘PFS’’). Credit ratings are indicators of a debt issuer’s ability to meet the terms of debt obligations in atimely manner, and are important factors in overall funding profile and ability to access external capital.
Ratings are important factors in establishing the competitive position of insurance companies and maintaining publicconfidence in products being offered. A ratings downgrade, or the potential for such a downgrade, could, among otherthings:
• materially increase the number of surrenders for all or a portion of the net cash values by the owners of policies,contracts and general account GICs we have issued, and materially increase the number of withdrawals bypolicyholders of cash values from their policies;
22

• result in the termination of our relationships with broker-dealers, banks, agents, wholesalers and other distributorsof our products and services;
• reduce new sales, particularly with respect to general account GICs and funding agreements purchased by pensionplans and other institutions;
• cause some of our existing liabilities to be subject to acceleration, additional collateral support, changes in terms,or creation of additional financial obligations and
• increase our cost of capital and limit our access to the capital markets.
Any of these consequences could adversely affect our profitability and financial condition.
Our efforts to reduce the impact of interest rate changes on our profitability and retained earnings may not be effective.
We attempt to significantly reduce the impact of changes in interest rates on the profitability and retained earningsof our asset accumulation and insurance operations. We accomplish this reduction primarily by managing the duration ofour assets relative to the duration of our liabilities. During a period of rising interest rates, policy surrenders, withdrawalsand requests for policy loans may increase as customers seek to achieve higher returns. Despite our efforts to reduce theimpact of rising interest rates, we may be required to sell assets to raise the cash necessary to respond to such surrenders,withdrawals and loans, thereby realizing capital losses on the assets sold. Because volatile interest rates and credit spreadsoften make it more difficult to sell certain fixed income securities, there is also a risk that we will find it difficult to raisethe cash necessary to fund a very large amount of withdrawal activity. An increase in policy surrenders and withdrawalsmay also require us to accelerate amortization of deferred policy acquisition costs (‘‘DPAC’’) relating to these contracts,which would further reduce our profitability.
During periods of declining interest rates, borrowers may prepay or redeem mortgages and bonds that we own,which would force us to reinvest the proceeds at lower interest rates. For some of our products, such as GICs and fundingagreements, we are unable to lower the rate we credit to customers in response to the lower return we will earn on ourinvestments. In addition, it may be more difficult for us to maintain our desired spread between the investment incomewe earn and the interest we credit to our customers during periods of declining interest rates, thereby reducing ourprofitability. Interest rates are currently at historically low levels. If interests rates were to remain low over a sustainedperiod of time, this would put additional pressure on our spreads, potentially resulting in unlocking of our DPAC assetand increases in reserves.
For further discussion on interest rate risk management, see Item 7A. ‘‘Quantitative and Qualitative DisclosuresAbout Market Risk — Interest Rate Risk.’’
If we are unable to attract and retain sales representatives and develop new distribution sources, sales of our products andservices may be reduced.
We distribute our asset accumulation, asset management and life and specialty benefit insurance products andservices through a variety of distribution channels, including our own internal sales representatives, independent brokers,banks, broker-dealers and other third-party marketing organizations. We must attract and retain sales representatives tosell our products. Strong competition exists among financial services companies for efficient sales representatives. Wecompete with other financial services companies for sales representatives primarily on the basis of our financial position,support services and compensation and product features. If we are unable to attract and retain sufficient salesrepresentatives to sell our products, our ability to compete and revenues from new sales would suffer.
Our international businesses face political, legal, operational and other risks that could reduce our profitability in thosebusinesses.
Our international businesses are subject to comprehensive regulation and supervision from central and/or localgovernmental authorities in each country in which we operate. New interpretations of existing laws and regulations or theadoption of new laws and regulations may harm our international businesses and reduce our profitability in thosebusinesses.
Our international businesses face political, legal, operational and other risks that we do not face in our operations inthe U.S. We face the risk of discriminatory regulation, nationalization or expropriation of assets, price controls andexchange controls or other restrictions that prevent us from transferring funds from these operations out of the countriesin which they operate or converting local currencies we hold into U.S. dollars or other currencies. Some of ourinternational businesses are, and are likely to continue to be, in emerging or potentially volatile markets. In addition, werely on local staff, including local sales forces, in these countries where there is a risk that we may encounter laborproblems with local staff, especially in countries where workers’ associations and trade unions are strong. If our businessmodel, including in some cases a joint venture model, is not successful in a particular country, we may lose all or most ofour investment in that country.
23

We may face losses if our actual experience differs significantly from our pricing and reserving assumptions.
Our profitability depends significantly upon the extent to which our actual experience is consistent with theassumptions used in setting prices for our products and establishing liabilities for future insurance and annuity policybenefits and claims. The premiums that we charge and the liabilities that we hold for future policy benefits are based onassumptions reflecting a number of factors, including the amount of premiums that we will receive in the future, rate ofreturn on assets we purchase with premiums received, expected claims, mortality, morbidity, expenses and persistency,which is the measurement of the percentage of insurance policies remaining in force from year to year. However, due tothe nature of the underlying risks and the high degree of uncertainty associated with the determination of the liabilitiesfor unpaid policy benefits and claims, we cannot determine precisely the amounts we will ultimately pay to settle theseliabilities. As a result, we may experience volatility in the level of our profitability and our reserves from period-to-period,particularly for our health and disability insurance products. To the extent that actual experience is less favorable than ourunderlying assumptions, we could be required to increase our liabilities, which may harm our financial strength andreduce our profitability.
For example, if mortality rates are higher than our pricing assumptions, we will be required to make greater claimspayments on our life insurance policies than we had projected. However, this risk may be partially offset by our payoutannuity business, where an increase in mortality rates will result in a decrease in benefit payments. Our use of third partyreinsurance also helps to mitigate this risk. Our results of operations may also be adversely impacted by an increase inmorbidity rates.
Our results of operations may also be adversely impacted if our actual investment earnings differ from our pricingand reserve assumptions. Changes in economic conditions may lead to changes in market interest rates or changes in ourinvestment strategies, either of which could cause our actual investment earnings to differ from our pricing and reserveassumptions.
For additional information on our insurance reserves, see Item 7. ‘‘Management’s Discussion and Analysis ofFinancial Condition and Results of Operations — Critical Accounting Policies and Estimates — Insurance Reserves.’’
Our ability to pay stockholder dividends and meet our obligations may be constrained by the limitations on dividends Iowainsurance laws impose on Principal Life.
We are an insurance holding company whose assets include all of the outstanding shares of the common stock ofPrincipal Life and other subsidiaries. Our ability to pay dividends to our stockholders and meet our obligations, includingpaying operating expenses and any debt service, depends upon the receipt of dividends from Principal Life. Iowainsurance laws impose limitations on the ability of Principal Life to pay dividends to us. Any inability of Principal Life topay dividends to us in the future may cause us to be unable to pay dividends to our stockholders and meet our otherobligations. See Item 7. ‘‘Management’s Discussion and Analysis of Financial Condition and Results of Operations —Liquidity and Capital Resources’’ for a discussion of regulatory restrictions on Principal Life’s ability to pay us dividends.
The pattern of amortizing our DPAC and other actuarial balances on our universal life-type insurance contracts,participating life insurance policies and certain investment contracts may change, impacting both the level of the assetand the timing of our net income.
Amortization of the DPAC asset depends on the actual and expected profits generated by the lines of business thatincurred the expenses. Expected profits are dependent on assumptions regarding a number of factors includinginvestment returns, benefit payments, expenses, mortality and policy lapse. Due to the uncertainty associated withestablishing these assumptions, we cannot, with precision, determine the exact pattern of profit emergence. As a result,amortization of DPAC will vary from period-to-period. To the extent that actual experience emerges less favorably thanexpected, or our expectation for future profits decreases, the DPAC asset may be reduced, reducing our profitability inthe current period.
For additional information, see Item 7. ‘‘Management’s Discussion and Analysis of Financial Condition and Resultsof Operation — Critical Accounting Policies and Estimates — Deferred Policy Acquisition Costs and Other ActuarialBalances.’’
We may need to fund deficiencies in our Closed Block assets.
In connection with its conversion in 1998 into a stock life insurance company, Principal Life established anaccounting mechanism, known as a ‘‘Closed Block’’ for the benefit of participating ordinary life insurance policies thathad a dividend scale in force on July 1, 1998. Dividend scales are the actuarial formulas used by life insurance companiesto determine amounts payable as dividends on participating policies based on experience factors relating to, among otherthings, investment results, mortality, lapse rates, expenses, premium taxes and policy loan interest and utilization rates.The Closed Block was designed to provide reasonable assurance to policyholders included in the Closed Block that, afterthe conversion, assets would be available to maintain the aggregate dividend scales in effect for 1997 if the experienceunderlying such scales were to continue.
We allocated assets to the Closed Block as of July 1, 1998, in an amount such that we expected their cash flows,together with anticipated revenues from the policies in the Closed Block, to be sufficient to support the Closed Block
24

business, including payment of claims, certain direct expenses, charges and taxes and to provide for the continuation ofaggregate dividend scales in accordance with the 1997 policy dividend scales if the experience underlying such scalescontinued, and to allow for appropriate adjustments in such scales if the experience changed. We bear the costs ofadministrative expenses associated with Closed Block policies and, accordingly, these costs were not funded as part of theassets allocated to the Closed Block. Any increase in such costs in the future will be borne by us. As of December 31,2010, Closed Block assets and liabilities were $4,583.6 million and $5,398.2 million, respectively.
We will continue to pay guaranteed benefits under the policies included in the Closed Block, in accordance with theirterms. The Closed Block assets, cash flows generated by the Closed Block assets and anticipated revenues from policiesincluded in the Closed Block may not be sufficient to provide for the benefits guaranteed under these policies. If they arenot sufficient, we must fund the shortfall. Even if they are sufficient, we may choose for business reasons to supportdividend payments on policies in the Closed Block with our general account funds.
The Closed Block assets, cash flows generated by the Closed Block assets and anticipated revenues from policies inthe Closed Block will benefit only the holders of those policies. In addition, to the extent that these amounts are greaterthan the amounts estimated at the time we funded the Closed Block, dividends payable in respect of the policies includedin the Closed Block may be greater than they would have been in the absence of a Closed Block. Any excess net incomewill be available for distribution over time to Closed Block policyholders but will not be available to our stockholders.
A pandemic, terrorist attack or other catastrophic event could adversely affect our net income.
Our mortality and morbidity experience could be adversely impacted by a catastrophic event. In addition, a severecatastrophic event may cause significant volatility in global financial markets, disruptions to commerce and reducedeconomic activity. The resulting macroeconomic conditions could adversely affect our cash flows, as well as the value andliquidity of our invested assets. We may also experience operational disruptions if our employees are unable or unwillingto come to work due to a pandemic or other catastrophe. We have developed extensive contingency plans to minimize therisk of operational disruptions. In addition, our use of reinsurance reduces our exposure to adverse mortality experience.Despite these measures, we may still be exposed to losses in the event of a pandemic, terrorist attack or othercatastrophe.
Our reinsurers could default on their obligations or increase their rates, which could adversely impact our net income andprofitability.
We cede life and health insurance to other insurance companies through reinsurance. See Item 8. ‘‘FinancialStatements and Supplementary Data, Notes to Consolidated Financial Statements, Note 1, Nature of Operations andSignificant Accounting Policies.’’ However, we remain liable to the policyholder, even if the reinsurer defaults on itsobligations with respect to the ceded business. If a reinsurer fails to meet its obligations, we will be forced to cover theclaims on the reinsured policies. In addition, a reinsurer insolvency may cause us to lose our reserve credits on the cededbusiness, in which case we would be required to establish additional reserves.
The premium rates that we charge are based, in part, on the assumption that reinsurance will be available at acertain cost. Some of our reinsurance contracts contain provisions which limit the reinsurer’s ability to increase rates onin-force business; however, some do not. If a reinsurer raises the rates that it charges on a block of in-force business, ourprofitability may be negatively impacted if we are not able to pass the increased costs on to the customer. If reinsurersraise the rates that they charge on new business, we may be forced to raise the premiums that we charge, which couldhave a negative impact on our competitive position.
To mitigate the risks associated with the use of reinsurance, we carefully select our reinsurers, and we monitor theirratings and financial condition on a regular basis. We also spread our business among several reinsurers, in order todiversify our risk exposure.
We face risks arising from acquisitions of businesses.
We have engaged in acquisitions of businesses in the past, and expect to continue to do so in the future. We face anumber of risks arising from acquisition transactions, including difficulties in integrating the acquired business into ouroperations, difficulties in assimilating and retaining employees and intermediaries, difficulties in retaining the existingcustomers of the acquired entity, unforeseen liabilities that arise in connection with the acquired business andunfavorable market conditions that could negatively impact our growth expectations for the acquired business. Theserisks may prevent us from realizing the expected benefits from acquisitions and could result in the impairment of goodwilland/or intangible assets recognized at the time of acquisition.
For additional information on our goodwill and other intangible assets, see Item 7. ‘‘Management’s Discussion andAnalysis of Financial Condition and Results of Operations — Critical Accounting Policies and Estimates — oGodwill andOther Intangible Assets.’’
25

Changes in laws, regulations or accounting standards may reduce our profitability.
Changes in regulations may reduce our profitability.
Our insurance business is subject to comprehensive state regulation and supervision throughout the U.S and in theinternational markets in which we operate. We are also impacted by federal legislation and administrative policies inareas such as employee benefit plan regulation, financial services regulations and federal taxation. The primary purposeof state regulation of the insurance business is to protect policyholders, not stockholders. The laws of the various statesestablish insurance departments with broad powers to regulate such matters as:
• licensing companies to transact business,
• licensing agents,
• admitting statutory assets,
• mandating a number of insurance benefits,
• regulating premium rates,
• approving policy forms,
• regulating unfair trade and claims practices,
• establishing statutory reserve requirements and solvency standards,
• fixing maximum interest rates on life insurance policy loans and minimum rates for accumulation of surrendervalues,
• restricting various transactions between affiliates and
• regulating the types, amounts and valuation of investments.
State insurance regulators, federal regulators and the NAIC continually reexamine existing laws and regulations, andmay impose changes in the future.
State insurance guaranty associations have the right to assess insurance companies doing business in their state forfunds to help pay the obligations of insolvent insurance companies to policyholders and claimants. Because the amountand timing of an assessment is beyond our control, the liabilities we have established for these potential assessments maynot be adequate.
Federal legislation and administrative policies in areas such as employee benefit plan regulation, financial servicesregulation and federal taxation can reduce our profitability. For example, the U.S. Congress has, from time to time,considered legislation relating to changes in the Employee Retirement Income Security Act of 1974 to permit applicationof state law remedies, such as consequential and punitive damages, in lawsuits for wrongful denial of benefits, which, ifadopted, could increase our liability for damages in future litigation. Additionally, new interpretations of existing lawsand the passage of new legislation may harm our ability to sell new policies and increase our claims exposure on policieswe issued previously. In addition, reductions in contribution levels to defined contribution plans may decrease ourprofitability.
Changes in tax laws could increase our tax costs and reduce sales of our insurance, annuity and investment products.
Current federal income tax laws generally permit the tax-deferred accumulation of earnings on the premiums paid bythe holders of annuities and life insurance products. Taxes, if any, are payable on income attributable to a distributionunder the contract for the year in which the distribution is made. The U.S. Congress has, from time to time, consideredlegislation that would reduce or eliminate the benefit of such deferral of taxation on the accretion of value within lifeinsurance and nonqualified annuity contracts. Enactment of this legislation, including a simplified ‘‘flat tax’’ incomestructure with an exemption from taxation for investment income, could result in fewer sales of our insurance, annuityand investment products.
From time to time, the U.S. Congress, as well as foreign, state and local governments, considers legislation that couldincrease our tax costs. If such legislation is adopted, our profitability could be negatively impacted. We continue toevaluate the impact of potential tax reform, which lacks sufficient detail and is relatively uncertain, may have on ourfuture results of operations and financial condition.
Repeal or modification of the federal estate tax could reduce our revenues.
The U.S. Congress has, from time to time, considered legislation modifying the federal estate tax regime. One suchpiece of legislation is the Tax Relief, Unemployment Insurance Reauthorization and Job Creation Act of 2010, whichbecame law on December 17, 2010. Among its many provisions were modifications to the estate tax for 2010, 2011 and2012. These changes, while generally beneficial to taxpayers, are temporary in nature.
26

If these favorable estate tax modifications are continued beyond 2012, there will potentially be some level ofcontraction in the estate planning market. It is possible that some segment of this existing business would be terminatedor sold to investor groups. On the other hand, a portion of this coverage would likely be retained to pay other expensessuch as state estate/inheritance taxes and/or capital gains taxes. In addition, increasing estate values may somewhat offsetfavorable estate tax changes.
We have nearly $27.6 billion of estate tax-related life insurance from just over 19,000 policies in force as ofDecember 31, 2010. This block of policies accounts for nearly $292.5 million of annual recurring life insurance premium.In addition, this block of business represents over $1.6 billion of policy cash value.
Based on an average of the last three years of estimated new sales of estate-tax related products, we have issuedapproximately 1,500 policies annually, representing $43.5 million of annual premium and nearly $4.2 billion of deathbenefits.
The health care reform legislation recently passed by Congress could adversely affect our profitability.
In March 2010, the Patient Protection and Affordable Care Act and the Health Care and Education ReconciliationAct of 2010 were signed into law. The provisions of these new laws include, among others, imposing significant newnon-deductible federal premium taxes and other assessments on health insurers, limiting Medicare Advantage paymentrates and reducing the Medicare Part D coverage gap, stipulating a prescribed minimum ratio for the amount of premiumrevenues to be expended on medical costs, guaranteed coverage requirements, elimination of preexisting conditionexclusions and annual and lifetime maximum limits, restrictions on the extent to which policies can be rescinded andadditional regulations governing premium rate increase requests. Implementation of the provisions of these new lawsgenerally varies from as early as six months from the date of enactment to as long as 2018.
There are numerous steps required to implement these laws including, for example, regulation necessary todetermine the methodology of calculating minimum ratios for medical expenditures. Further, various health insurancereform proposals are also emerging at the state level. Because of the unsettled nature of these reforms, the numeroussteps required to implement them and our third quarter 2010 decision to exit the group medical insurance business, wecannot predict what additional health insurance reforms will be implemented at the federal or state level or the effectthat any future legislation or regulation will have on our business.
Changes in federal, state and foreign securities laws may reduce our profitability.
Our asset management and accumulation and life insurance businesses are subject to various levels of regulationunder federal, state and foreign securities laws. These laws and regulations are primarily intended to protect investors inthe securities markets or investment advisory or brokerage clients and generally grant supervisory agencies broadadministrative powers, including the power to limit or restrict the conduct of business for failure to comply with such lawsand regulations. The downturn in the financial markets and resulting market-wide losses have caused legislative andregulatory bodies to consider various changes to existing securities laws and the legal framework governing the financialindustry. Changes to these laws or regulations that restrict the conduct of our business could significantly increase ourcompliance costs and reduce our profitability.
Financial services regulatory reform may reduce our profitability or impact how we do business.
On July 21, 2010, the Dodd-Frank Wall Street Reform and Consumer Protection Act of 2010 (the ‘‘Dodd-FrankAct’’) was enacted and signed into law. The Dodd-Frank Act makes extensive changes to the laws regulating financialservices firms and requires various federal agencies to adopt a broad range of new implementation rules and regulations.The federal agencies are given significant discretion in drafting the implementation rules and regulations, andconsequently, many of the details and much of the impact of the Dodd-Frank Act will not be known for many months oryears. In addition, the legislation mandates multiple studies and reports for Congress, which could result in additionallegislative or regulatory action.
It is anticipated that we will receive oversight from the Federal Reserve including various capital and liquidityrequirements due to our wholly-owned Savings & Loan subsidiary. It is possible that we could be labeled as ‘‘SystemicallyImportant’’ by the Financial Stability Oversight Council which brings with it even more oversight and prudentialstandards from the Federal Reserve. It is also possible that we will be labeled a ‘‘Major Swap Participant’’ that willrequire more oversight of current and future derivative transactions under the separate jurisdictions of the SEC and theCommodities Futures Trading Commission. This will include trading swaps through either regulated exchanges orapproved clearinghouses, and require additional collateral to support derivatives transactions.
The changes resulting from the Dodd-Frank Act and the yet to be written implementation rules and regulations maylower the profitability of our business activities, require changes to certain of our business practices or otherwiseadversely affect our business.
27

Changes in accounting standards may adversely impact our reported profitability and financial ratios.
Accounting standards are subject to change and can negatively impact our reported profitability. See Item 8.‘‘Financial Statements and Supplementary Data, Notes to Consolidated Financial Statements, Note 1, Nature ofOperations and Significant Accounting Policies.’’ In addition to recently issued accounting guidance, the U.S. andinternational standard setters have a full agenda of topics they plan to review, any of which have the potential tonegatively impact our reported profitability and financial ratios. The results for past accounting periods are notnecessarily indicative of the results to be expected for any future accounting period.
A computer system failure or security breach could disrupt our business, damage our reputation and adversely impact ourprofitability.
We rely on computer systems to conduct business, including customer service, marketing and sales activities,customer relationship management and producing financial statements. While we have policies, procedures, automationand backup plans designed to prevent or limit the effect of failure, our computer systems may be vulnerable todisruptions or breaches as the result of natural disasters, man-made disasters, criminal activity, pandemics, or otherevents beyond our control. The failure of our computer systems for any reason could disrupt our operations, result in theloss of customer business and adversely impact our profitability.
We retain confidential information on our computer systems, including customer information and proprietarybusiness information. Any compromise of the security of our computer systems that results in the disclosure of personallyidentifiable customer information could damage our reputation, expose us to litigation, increase regulatory scrutiny andrequire us to incur significant technical, legal and other expenses.
Results of litigation and regulatory investigations may affect our financial strength or reduce our profitability.
We are a plaintiff or defendant in actions arising out of our insurance businesses and investment operations. We are,from time to time, also involved in various governmental, regulatory and administrative proceedings and inquiries. Thesefactors may affect our financial strength or reduce our profitability. For further discussion on litigation and regulatoryinvestigation risk, see Item 3. ‘‘Legal Proceedings.’’
From time to time we may become subject to tax audits, tax litigation or similar proceedings, and as a result we may oweadditional taxes, interest and penalties in amounts that may be material.
We are subject to income taxes in the United States as well as many other jurisdictions. In determining ourprovisions for income taxes and our accounting for tax-related matters in general, we are required to exercise judgment.We regularly make estimates where the ultimate tax determination is uncertain. The final determination of any tax audit,appeal of the decision of a taxing authority, tax litigation or similar proceedings may be materially different from thatreflected in our historical financial statements. The assessment of additional taxes, interest and penalties could bematerially adverse to our current and future results of operations and financial condition.
Fluctuations in foreign currency exchange rates could reduce our profitability.
Principal International generally writes policies denominated in various local currencies and invests the premiumsand deposits in local currencies. Although investing in local currencies limits the effect of currency exchange ratefluctuation on local operating results, fluctuations in such rates affect the translation of these results into ourconsolidated financial statements. For further discussion on foreign currency exchange risk, see Item 7A. ‘‘Quantitativeand Qualitative Disclosures About Market Risk — Foreign Currency Risk.’’
Applicable laws and our stockholder rights plan, certificate of incorporation and by-laws may discourage takeovers andbusiness combinations that some stockholders might consider in their best interests.
State laws and our certificate of incorporation and by-laws may delay, defer, prevent, or render more difficult atakeover attempt that some stockholders might consider in their best interests. For instance, they may prevent ourstockholders from receiving the benefit from any premium to the market price of our common stock offered by a bidderin a takeover context. Even in the absence of a takeover attempt, the existence of these provisions may adversely affectthe prevailing market price of our common stock if they are viewed as discouraging takeover attempts in the future.
State laws and our certificate of incorporation and by-laws may also make it difficult for stockholders to replace orremove our management. These provisions may facilitate management entrenchment, which may delay, defer or preventa change in our control, which may not be in the best interests of our stockholders.
The following provisions, included in our certificate of incorporation and by-laws, may also have anti-takeovereffects and may delay, defer or prevent a takeover attempt that some stockholders might consider in their best interests.In particular, our certificate of incorporation and by-laws:
• permit our Board of Directors to issue one or more series of preferred stock;
• divide our Board of Directors into three classes;
28

• limit the ability of stockholders to remove directors;
• prohibit stockholders from filling vacancies on our Board of Directors;
• prohibit stockholders from calling special meetings of stockholders;
• impose advance notice requirements for stockholder proposals and nominations of directors to be considered atstockholder meetings and
• require the approval by the holders of at least 75% of our outstanding common stock for the amendment of ourby-laws and provisions of our certificate of incorporation governing:
• the classified board,
• the director’s discretion in determining what he or she reasonably believes to be in the best interests ofPrincipal Financial Group, Inc.,
• the liability of directors and
• the prohibition on stockholder actions by written consent.
In addition, Section 203 of the General Corporation Law of the State of Delaware may limit the ability of an‘‘interested stockholder’’ to engage in business combinations with us. An interested stockholder is defined to includepersons owning 15% or more of our outstanding voting stock.
Our stockholder rights plan may have anti-takeover effects. The stockholder rights plan is designed to protect ourstockholders in the event of unsolicited offers to acquire us and other coercive takeover tactics, which, in the opinion ofour Board of Directors, could impair the board’s ability to represent stockholder interests. Our stockholder rights planmight render an unsolicited takeover more difficult or less likely to occur, even though such a takeover might offer ourstockholders the opportunity to sell their stock at a price above the prevailing market price and may be favored by someof our stockholders.
Our financial results may be adversely impacted by global climate changes.
Atmospheric concentrations of carbon dioxide and other greenhouse gases have increased dramatically since theindustrial revolution, resulting in a gradual increase in global average temperatures and an increase in the frequency andseverity of natural disasters. These trends are expected to continue in the future and have the potential to impact nearlyall sectors of the economy to varying degrees. Our initial research indicates that climate change does not pose animminent or significant threat to our operations or business, but we will continue to monitor new developments in thefuture.
Potential impacts may include the following:
• Changes in temperatures and air quality may adversely impact our mortality and morbidity rates. For example,increases in the level of pollution and airborne allergens may cause an increase in upper respiratory andcardiovascular diseases, leading to increased claims in our insurance businesses. However, the risk of increasedmortality on our life insurance business may be partly offset by our payout annuity business, where an increase inmortality results in a decrease in benefit payments.
• Climate change may impact asset prices, as well as general economic conditions. For example, rising sea levels maylead to decreases in real estate values in coastal areas. Additionally, government policies to slow climate change(e.g., setting limits on carbon emissions) may have an adverse impact on sectors such as utilities, transportationand manufacturing. Changes in asset prices may impact the value of our fixed income, real estate and commercialmortgage investments. We manage our investment risks by maintaining a well-diversified portfolio, bothgeographically and by sector. We also monitor our investments on an ongoing basis, allowing us to adjust ourexposure to sectors and/or geographical areas that face severe risks due to climate change.
• A natural disaster that affects one of our office locations could disrupt our operations and pose a threat to thesafety of our employees. However, we have extensive Business Continuity and Disaster Recovery planningprograms in place to help mitigate this risk.
Item 1B. Unresolved Staff Comments
None.
Item 2. Properties
As of December 31, 2010, we own 26 properties in our home office complex in Des Moines, Iowa, and in variousother locations. Of these 26 properties, 12 are office buildings, 1 is a warehouse facility, 11 are parking lots and ramps, 1is a park/green space, and 1 is a childcare center. Of the office and warehouse space, we occupy approximately 92% of the2.7 million square feet of space in these buildings. The balance of the space in these buildings is rented to commercialtenants or is occupied by the property management company servicing these properties. Of the parking properties there
29

are approximately 6,728 stalls. We lease office space for various offices located throughout the U.S. and internationally.We believe that our owned and leased properties are suitable and adequate for our current business operations.
Item 3. Legal Proceedings
Disclosure concerning material legal proceedings can be found in Item 8. ‘‘Financial Statements and SupplementaryData, Notes to Consolidated Financial Statements, Note 12, Contingencies, Guarantees and Indemnifications’’ under thecaption, ‘‘Litigation and Regulatory Contingencies,’’ which is incorporated here by this reference.
Executive Officers of the Registrant
The following information is furnished with respect to our executive officers, each of whom is elected by and servesat the pleasure of the Board of Directors.
Daniel J. Houston, 49, who heads the Retirement and Investor Services and U.S. Insurance Solutions segments of ouroperations, was named President, Retirement, Insurance and Financial Services of the Company and Principal Life onJanuary 1, 2010. He was President, Retirement and Investor Services, from February 2008 until January 2010, and wasExecutive Vice President, Retirement and Investor Services, from June 2006 to February 2008. He has served as a SeniorVice President of Principal Life since 2000.
Ellen Z. Lamale, 57, has been Senior Vice President and Chief Risk Officer of the Company and Principal Life sinceMay 2008. Prior to that time, she was Senior Vice President and Chief Actuary of the Company since April 2001 and ofPrincipal Life since June 1999 and has served as the Company’s chief risk officer since 2005.
Julia M. Lawler, 51, has been Senior Vice President and Chief Investment Officer of the Company and of Principal Lifesince July 2002. From 2000 - 2002, she was President of the Real Estate Equity Group of Principal Global Investors, LLC.From 1999 - 2000, she was Vice President — Capital Markets.
Terrance J. Lillis, 58, has been Senior Vice President and Chief Financial Officer of the Company and of Principal Lifesince August 2008 and Senior Vice President of the Company and Principal Life since May 2008. Prior to that time, hewas Chief Financial Officer — Retirement and Investor Services division of Principal Life since December 2001.
James P. McCaughan, 57, who heads the Principal Global Investors segment of our operations, has been President,Principal Global Investors of the Company and of Principal Life since December 2003. Prior to that time, he served asExecutive Vice President and global head of asset management for the Company and Principal Life since April 2002.From 2000 - 2002, he was Chief Executive Officer of the Americas division of Credit Suisse Asset Management inNew York, New York.
Mary A. O’Keefe, 54, who heads Corporate Relations, has been Senior Vice President and Chief Marketing Officer ofthe Company and Principal Life since February 2005, Senior Vice President of the Company since April 2001, and SeniorVice President of Principal Life since January 1998.
Gary P. Scholten, 53, has been Senior Vice President and Chief Information Officer of the Company and Principal Lifesince November 2002. From 1998 - 2002, he was Vice President of retail information services of Principal Life.
Karen E. Shaff, 56, has been Executive Vice President and General Counsel of the Company and of Principal Life sinceFebruary 2004. Prior thereto, she was Senior Vice President and General Counsel of the Company since April 2001, andSenior Vice President and General Counsel of Principal Life since January 2000.
Norman R. Sorensen, 65, who heads the Principal International segment of our operations, was named president of thatsegment on February 24, 2010. He has been President and Chief Executive Officer of Principal International, Inc. since1998, and served as Executive Vice President, Principal International, of the Company and Principal Life since February2008, Senior Vice President, Principal International of the Company, since April 2001, and Senior Vice President ofPrincipal Life since December 1998.
Larry D. Zimpleman, 59, has been a Director of the Company and Principal Life since 2006. He has been Chairman,President and Chief Executive Officer of the Company and Principal Life since May 2009 and was President and ChiefExecutive Officer of the Company and Principal Life from May 2008 to May 2009. Prior thereto, he was President andChief Operating Officer of the Company and Principal Life from 2006 to May 2008. He was President, Retirement andInvestor Services of the Company and of Principal Life from December 2003 through May 2006. Mr. Zimpleman servedas chairman of the board and a director of the Principal Funds from December 2001 to December 2008.
30

PART II
Item 5. Market for Registrant’s Common Equity, Related Stockholder Matters and Issuer Purchases of EquitySecurities
Our common stock began trading on the New York Stock Exchange (‘‘NYSE’’) under the symbol ‘‘PFG’’ onOctober 23, 2001. Prior to such date, there was no established public trading market for our common stock. OnFebruary 9, 2011, there were 429,690 stockholders of record of our common stock.
The following table presents the high and low prices for our common stock on the NYSE for the periods indicatedand the dividends declared per share during such periods.
High Low Dividends
2010First quarter . . . . . . . . . . . . . . . . . . . . . . . . . . . . . . . . . . . . . . . . . . . . . . . . . . . . . . . . . . . $29.61 $20.89 —Second quarter . . . . . . . . . . . . . . . . . . . . . . . . . . . . . . . . . . . . . . . . . . . . . . . . . . . . . . . . . $31.41 $23.33 —Third quarter . . . . . . . . . . . . . . . . . . . . . . . . . . . . . . . . . . . . . . . . . . . . . . . . . . . . . . . . . . $26.64 $21.19 —Fourth quarter . . . . . . . . . . . . . . . . . . . . . . . . . . . . . . . . . . . . . . . . . . . . . . . . . . . . . . . . . . $33.34 $25.42 $0.55
2009First quarter . . . . . . . . . . . . . . . . . . . . . . . . . . . . . . . . . . . . . . . . . . . . . . . . . . . . . . . . . . . $24.80 $ 5.41 —Second quarter . . . . . . . . . . . . . . . . . . . . . . . . . . . . . . . . . . . . . . . . . . . . . . . . . . . . . . . . . $24.90 $ 7.74 —Third quarter . . . . . . . . . . . . . . . . . . . . . . . . . . . . . . . . . . . . . . . . . . . . . . . . . . . . . . . . . . $30.87 $16.77 —Fourth quarter . . . . . . . . . . . . . . . . . . . . . . . . . . . . . . . . . . . . . . . . . . . . . . . . . . . . . . . . . . $30.07 $22.20 $0.50
We declared an annual cash dividend of $0.55 per common share on November 1, 2010, and paid such dividend onDecember 3, 2010, to stockholders of record on the close of business on November 19, 2010. We declared an annual cashdividend of $0.50 per common share on October 26, 2009, and paid such dividend on December 4, 2009, to stockholdersof record on the close of business on November 13, 2009. Future dividend decisions will be based on and affected by anumber of factors, including our operating results and financial requirements and the impact of regulatory restrictions.See Item 7. ‘‘Management’s Discussion and Analysis of Financial Condition and Results of Operations — Liquidity andCapital Resources’’ for a discussion of regulatory restrictions on Principal Life’s ability to pay us dividends.
The following table presents the amount of our share purchase activity for the periods indicated:
Issuer Purchases of Equity Securities
Total Number Maximum Number (orof Shares Approximate Dollar Value)(or Units) of Shares (or Units) that
Total Number Average Purchased as Part May Yet Be Purchasedof Shares Price Paid of Publicly Under the Plans or(or Units) per Share Announced Plans Programs (in millions)
Period Purchased (1) (or Unit) or Programs (2)
January 1, 2010 — January 31, 2010 . . . . . . . . . . . . . 9,357 $24.11 — $250.0February 1, 2010 — February 28, 2010 . . . . . . . . . . . . 40 $25.26 — $250.0March 1, 2010 — March 31, 2010 . . . . . . . . . . . . . . . 66,944 $23.22 — $250.0April 1, 2010 — April 30, 2010 . . . . . . . . . . . . . . . . 9,411 $25.68 — $250.0May 1, 2010 — May 31, 2010 . . . . . . . . . . . . . . . . . 403 $23.24 — $250.0June 1, 2010 — June 30, 2010 . . . . . . . . . . . . . . . . . — $ — — $250.0July 1, 2010 — July 31, 2010 . . . . . . . . . . . . . . . . . . 8,794 $23.85 — $250.0August 1, 2010 — August 31, 2010 . . . . . . . . . . . . . . 891 $25.07 — $250.0September 1, 2010 — September 30, 2010 . . . . . . . . . 3,428 $23.21 — $250.0October 1, 2010 — October 31, 2010 . . . . . . . . . . . . . 1,657 $26.80 — $250.0November 1, 2010 — November 30, 2010 . . . . . . . . . . — $ — — $250.0December 1, 2010 — December 31, 2010 . . . . . . . . . . 6,077 $29.33 — $250.0
Total . . . . . . . . . . . . . . . . . . . . . . . . . . . . . . . . . 107,002 —
(1) Reflects the number of shares of common stock utilized to execute certain stock incentive awards in 2009.
(2) During November 2007, our Board of Directors authorized a share repurchase program of up to $500.0 million of our outstandingcommon stock. As of December 31, 2010, $250.0 million remained under the November 2007 authorization. We suspended purchases ofour common stock effective October 13, 2008, under the existing share repurchase program.
31
Item 6. Selected Financial Data
The following table sets forth certain selected historical consolidated financial information. We derived theconsolidated financial information (except for amounts referred to as ‘‘Other Supplemental Data’’) for each of the yearsended December 31, 2010, 2009 and 2008 and as of December 31, 2010 and 2009 from our audited consolidated financialstatements and notes to the financial statements included in this Form 10-K. We derived the consolidated financialinformation (except for amounts referred to as ‘‘Other Supplemental Data’’) for the years ended December 31, 2007 and2006 and as of December 31, 2008, 2007 and 2006 from our audited consolidated financial statements not included in thisForm 10-K. The following summary of consolidated financial information (except for amounts referred to as ‘‘OtherSupplemental Data’’) has been prepared in accordance with U.S. GAAP.
In order to fully understand our consolidated financial information, you should also read Item 7. ‘‘Management’sDiscussion and Analysis of Financial Condition and Results of Operations’’ and our audited consolidated financialstatements and the notes to the financial statements included in this Form 10-K. The results for past accounting periodsare not necessarily indicative of the results to be expected for any future accounting period.
As of or for the year ended December 31,
2010 (1) 2009 (1) 2008 (1) 2007 2006
($ in millions, except per share data and as noted)Income Statement Data:Revenues:
Premiums and other considerations . . . . . . . . . . . . . . . . . . . . . . $ 3,555.5 $ 3,750.6 $ 4,209.2 $ 4,634.1 $ 4,305.3Fees and other revenues . . . . . . . . . . . . . . . . . . . . . . . . . . . . . 2,298.1 2,096.0 2,426.5 2,634.7 1,902.5Net investment income . . . . . . . . . . . . . . . . . . . . . . . . . . . . . . 3,496.5 3,400.8 3,994.3 3,966.5 3,622.5Net realized capital gains (losses) . . . . . . . . . . . . . . . . . . . . . . . (191.5) (398.3) (694.1) (328.8) 44.7
Total revenues . . . . . . . . . . . . . . . . . . . . . . . . . . . . . . . . . . $ 9,158.6 $ 8,849.1 $ 9,935.9 $ 10,906.5 $ 9,875.0
Income from continuing operations, net of related income taxes . . . . . $ 717.2 $ 645.7 $ 465.8 $ 864.3 $ 1,055.7Net income . . . . . . . . . . . . . . . . . . . . . . . . . . . . . . . . . . . . . . $ 717.2 $ 645.7 $ 465.8 $ 884.5 $ 1,084.6Earnings per Common Share Data:Income from continuing operations, net of related income taxes, per
share:Basic . . . . . . . . . . . . . . . . . . . . . . . . . . . . . . . . . . . . . . . . . $ 2.08 $ 1.98 $ 1.64 $ 3.04 $ 3.67Diluted . . . . . . . . . . . . . . . . . . . . . . . . . . . . . . . . . . . . . . . $ 2.06 $ 1.97 $ 1.63 $ 3.01 $ 3.64
Net income per share:Basic . . . . . . . . . . . . . . . . . . . . . . . . . . . . . . . . . . . . . . . . . $ 2.08 $ 1.98 $ 1.64 $ 3.12 $ 3.78Diluted . . . . . . . . . . . . . . . . . . . . . . . . . . . . . . . . . . . . . . . $ 2.06 $ 1.97 $ 1.63 $ 3.09 $ 3.74
Cash dividends per common share . . . . . . . . . . . . . . . . . . . . . . . . $ 0.55 $ 0.50 $ 0.45 $ 0.90 $ 0.80Balance Sheet Data:Total assets . . . . . . . . . . . . . . . . . . . . . . . . . . . . . . . . . . . . . . $145,631.1 $137,759.4 $128,182.4 $154,520.2 $143,658.1
Long-term debt . . . . . . . . . . . . . . . . . . . . . . . . . . . . . . . . . . . . $ 1,583.7 $ 1,584.6 $ 1,290.5 $ 1,398.8 $ 1,511.3
Series A preferred stock . . . . . . . . . . . . . . . . . . . . . . . . . . . . . . $ — $ — $ — $ — $ —Series B preferred stock . . . . . . . . . . . . . . . . . . . . . . . . . . . . . . 0.1 0.1 0.1 0.1 0.1Total stockholders’ equity . . . . . . . . . . . . . . . . . . . . . . . . . . . . . 9,885.0 8,016.4 2,569.3 7,519.3 7,919.6Other Supplemental Data:AUM ($ in billions) . . . . . . . . . . . . . . . . . . . . . . . . . . . . . . . . . $ 318.8 $ 284.7 $ 247.0 $ 311.1 $ 256.9
(1) For a discussion of items materially affecting the comparability of 2010, 2009 and 2008, please see Item 7. ‘‘Management’s Discussion andAnalysis of Financial Condition and Results of Operations — Transactions Affecting Comparability of Results of Operations.’’
Item 7. Management’s Discussion and Analysis of Financial Condition and Results of Operations
The following analysis discusses our financial condition as of December 31, 2010, compared with December 31, 2009,and our consolidated results of operations for the years ended December 31, 2010, 2009 and 2008, and, whereappropriate, factors that may affect our future financial performance. The discussion should be read in conjunction withour audited consolidated financial statements and the related notes to the financial statements and the other financialinformation included elsewhere in this Form 10-K.
Forward-Looking Information
Our narrative analysis below contains forward-looking statements intended to enhance the reader’s ability to assessour future financial performance. Forward-looking statements include, but are not limited to, statements that representour beliefs concerning future operations, strategies, financial results or other developments, and contain words andphrases such as ‘‘anticipate,’’ ‘‘believe,’’ ‘‘plan,’’ ‘‘estimate,’’ ‘‘expect,’’ ‘‘intend,’’ and similar expressions. Forward-lookingstatements are made based upon management’s current expectations and beliefs concerning future developments andtheir potential effects on us. Such forward-looking statements are not guarantees of future performance.
Actual results may differ materially from those included in the forward-looking statements as a result of risks anduncertainties. Those risks and uncertainties include, but are not limited to the risk factors listed in Item 1A. ‘‘RiskFactors.’’
32

Overview
We provide financial products and services through the following reportable segments:
• Retirement and Investor Services, which consists of our asset accumulation operations that provide retirementsavings and related investment products and services. We provide a comprehensive portfolio of asset accumulationproducts and services to businesses and individuals in the U.S., with a concentration on small and medium-sizedbusinesses. We offer to businesses products and services for defined contribution pension plans, including 401(k)and 403(b) plans, defined benefit pension plans, nonqualified executive benefit plans and employee stockownership plan consulting services. We also offer annuities, mutual funds and bank products and services to theemployees of our business customers and other individuals.
• Principal Global Investors, which consists of our asset management operations, offers an extensive range of equity,fixed income and real estate investments as well as specialized overlay and advisory services to institutionalinvestors.
• Principal International, which offers retirement products and services, annuities, mutual funds, institutional assetmanagement and life insurance accumulation products through operations in Brazil, Chile, China, Hong KongSAR, India, Indonesia, Malaysia, Mexico, Singapore and Thailand.
• U.S. Insurance Solutions, which provides individual life insurance as well as specialty benefits in the U.S. Ourindividual life insurance products include universal and variable universal life insurance and traditional lifeinsurance. Our specialty benefit products include group dental and vision insurance, individual and groupdisability insurance and group life insurance. Effective January 1, 2011, wellness services and fee-for-service claimsadministration transitioned to the Specialty Benefits division from the Corporate segment.
• Corporate, which manages the assets representing capital that has not been allocated to any other segment.Financial results of the Corporate segment primarily reflect our financing activities (including interest expense andpreferred stock dividends), income on capital not allocated to other segments, inter-segment eliminations, incometax risks and certain income, expenses and other after-tax adjustments not allocated to the segments based on thenature of such items.
Economic Factors and Trends
Continuing improvement in the equity markets since the latter half of 2009 led to increases in our Retirement andInvestor Services segment’s account values and our Principal Global Investors segment’s AUM relative to year-end 2008.Since account values and AUM are the base by which these businesses generate profits, the increase in account valuesand AUM has contributed to the overall improvement of our profits.
In our Principal International segment, we continued to grow our business organically through our existingsubsidiaries and joint ventures and through strategic acquisitions. The global credit market disruptions, market illiquidityand foreign currency depreciation during the second half of 2008 resulted in a decrease in our Principal Internationalsegment’s AUM in 2008. AUM levels increased significantly during 2010 and 2009 as a result of positive net customercash flows, increasing equity markets and foreign currency appreciation.
In our U.S. Insurance Solutions segment, we continue to shift the marketing emphasis of our individual lifeinsurance business to universal life insurance products from traditional life insurance products. Our specialty benefitsinsurance business is experiencing a slowdown in growth relative to prior years due to a combination of lower sales andhigher lapses in our group lines, as well as reduced growth in salaries and the number of covered lives of our existinggroup customers. This slowdown is a direct reflection of the increasingly competitive marketplace and economicpressures facing our customers.
The credit market disruptions that began in 2008 resulted in an increase in our realized capital losses, which arereflected in net income, and volatility of unrealized capital losses, which are reflected in accumulated othercomprehensive income. Through this stressed environment our assets and liabilities have performed as expected, andaccordingly, a majority of our unrealized losses were never realized as we were not a forced seller of assets. Due to theaforementioned market conditions, we built additional liquidity in 2008 and into 2009 by increasing cash and cashequivalent holdings. During this period, new cash inflows were primarily invested in cash, short-term government-backedsecurities and other liquid investments. As a result of the move to increase cash holdings, yields were lower thanhistorically experienced. Although we will continue to invest a higher percentage of our assets in more liquid investmentsrelative to historical levels, recent market conditions have allowed us to incrementally invest in other investments that areexpected to enhance investment yields. During 2010, realized capital losses continued to decrease and we moved to a netunrealized capital gain position as compared to a net unrealized capital loss position at the end of 2009. Additionally,yields showed modest improvement in 2010 from 2009 levels.
33

Profitability
Our profitability depends in large part upon our:
• amount of AUM;
• spreads we earn on our general account asset accumulation business that result from the difference between whatwe earn and what we credit to policyholders;
• ability to generate fee revenues by providing administrative and investment management services;
• ability to price our insurance products at a level that enables us to earn a margin over the cost of providingbenefits and the related expenses;
• ability to manage our investment portfolio to maximize investment returns and minimize risks such as interest ratechanges or defaults or impairments of invested assets;
• ability to effectively hedge fluctuations in foreign currency to U.S. dollar exchange rates on certain transactionsand
• ability to manage our operating expenses.
Critical Accounting Policies and Estimates
The increasing complexity of the business environment and applicable authoritative accounting guidance requires usto closely monitor our accounting policies. Our significant accounting policies are described in Item 8. ‘‘FinancialStatements and Supplementary Data, Notes to Consolidated Financial Statements, Note 1, Nature of Operations andSignificant Accounting Policies.’’ We have identified seven critical accounting policies that are complex and requiresignificant judgment and estimates about matters that are inherently uncertain. A summary of our critical accountingpolicies is intended to enhance the reader’s ability to assess our financial condition and results of operations and thepotential volatility due to changes in estimates and changes in guidance. The identification, selection and disclosure ofcritical accounting estimates and policies have been discussed with the Audit Committee of the Board of Directors.
Valuation and Impairment of Fixed Income Investments
Fixed Maturities. Fixed maturities include bonds, mortgage-backed securities, redeemable preferred stock andcertain non-redeemable preferred stock. We classify our fixed maturities as either available-for-sale or trading and,accordingly, carry them at fair value in the consolidated statements of financial position. The fair values of our publicfixed maturities are primarily based on market prices from independent pricing services. In addition, 22% of our investedasset portfolio is invested in fixed maturities that are private market assets, where there are no readily available marketquotes to determine the fair market value. The majority of these assets are valued using a spread pricing matrix thatutilizes observable market inputs. Securities are grouped into pricing categories that vary by asset class, sector, rating andaverage life. Each pricing category is assigned a risk spread based on studies of observable public market data or marketclearing data from the investment professionals assigned to specific security classes. The expected cash flows of thesecurity are then discounted back at the current Treasury curve plus the appropriate risk spread. Certain market eventsthat could impact the valuation of securities include issuer credit ratings, business climate, management changes,litigation and government actions among others. See item 8. ‘‘Financial Statements and Supplementary Data, Notes toConsolidated Financial Statements, Note 14, Fair Value Measurements’’ for further discussion.
If we are unable to price a fixed maturity security from third party pricing vendors we may obtain a broker quote orutilize an internal pricing model specific to the asset utilizing relevant market information to the extent available. Lessthan 1% of our fixed maturities were valued using internal models.
A rate increase based on the combined movement of interest rates and credit spreads of 100 basis points wouldproduce a total value of approximately $39.5 billion, as compared to the recorded amount of $41.3 billion related to ourfixed maturity, available-for-sale assets held by the Principal Life general account as of December 31, 2010. Given therecent unprecedented market disruption, a 100 basis point movement in the combined portfolio rate is reasonably likely.
We had a $2,154.6 million increase in net unrealized gains within the U.S. fixed maturities, available-for-saleportfolio for the year ended December 31, 2010, of which an approximate $1.0 billion net unrealized gain can beattributed to an approximate 57 basis points decrease in interest rates and the remaining net unrealized gains related toother market factors. We had a $6,269.9 million decrease in net unrealized losses for the year ended December 31, 2009,of which an approximate $1.9 billion net unrealized loss can be attributed to an approximate 110 basis points increase ininterest rates. This was more than offset by net unrealized gains related to other market factors.
Fixed maturities classified as available-for-sale are subject to impairment reviews. When evaluating fixed maturitiesfor impairment, we consider relevant facts and circumstances in evaluating whether a credit or interest-relatedimpairment is other than temporary. Relevant facts and circumstances considered include: (1) the extent and length oftime the fair value has been below cost; (2) the reasons for the decline in value; (3) the financial position and access tocapital of the issuer, including the current and future impact of any specific events; (4) for structured securities, theadequacy of the expected cash flows and (5) our intent to sell a security or whether it is more likely than not we will be
34
required to sell the security before recovery of its amortized cost which, in some cases, may extend to maturity. Prior to2009, our ability and intent to hold fixed maturities for a period of time that allowed for the recovery in value wasconsidered rather than our intent to sell those securities. When it is determined that the decline in value is other thantemporary the carrying value of the security is reduced to its fair value, and a corresponding impairment loss is reportedprimarily in net income, with noncredit impairment losses for certain fixed maturities we do not intend to sell reported inother comprehensive income.
There are a number of significant risks and uncertainties inherent in the process of monitoring impairments anddetermining if an impairment is other than temporary. These risks and uncertainties include: (1) the risk that ourassessment of an issuer’s ability to meet all of its contractual obligations will change based on changes in the creditcharacteristics of that issuer; (2) the risk that the economic outlook will be worse than expected or have more of animpact on the issuer than anticipated; (3) the risk that our investment professionals are making decisions based onfraudulent or misstated information in the financial statements provided by issuers and (4) the risk that new informationobtained by us or changes in other facts and circumstances lead us to change our intent to hold the security until itrecovers in value. Any of these situations could result in a charge to net income in a future period. At December 31, 2010,we had $10,588.6 million in available-for-sale fixed maturities with gross unrealized losses totaling $1,488.8 million.Included in the gross unrealized losses are losses attributable to both movements in market interest rates as well asmovement in credit spreads. Net income would be reduced by approximately $1,488.8 million, on a pre-tax basis, if all thesecurities in an unrealized loss position were deemed to be other than temporarily impaired and our intent was to sell allsuch securities.
Mortgage Loans. Mortgage loans consist primarily of commercial mortgage loans. At December 31, 2010, thecarrying value of our commercial mortgage loans was $9,609.0 million. Commercial mortgage loans are generallyreported at cost adjusted for amortization of premiums and accrual of discounts, computed using the interest method andnet of valuation allowances.
Commercial mortgage loans are considered impaired when, based on current information and events, it is probablethat we will be unable to collect all amounts due according to contractual terms of the loan agreement. When wedetermine that a loan is impaired, a valuation allowance is created for the difference between the carrying amount of themortgage loan and the estimated value less cost to sell. Estimated value is based on either the present value of theexpected future cash flows discounted at the loan’s effective interest rate, the loan’s observable market price or the fairvalue of the collateral.
The determination of the calculation and the adequacy of the mortgage loan valuation allowance and mortgageimpairments are subjective. Our periodic evaluation and assessment of the adequacy of the mortgage loan valuationallowance and the need for mortgage impairments is based on known and inherent risks in the portfolio, adversesituations that may affect the borrower’s ability to repay, the estimated value of the underlying collateral, composition ofthe loan portfolio, current economic conditions, loss experience and other relevant factors. The calculation fordetermining mortgage impairment amounts requires estimating the amounts and timing of future cash flows expected tobe received on specific loans, estimating the value of the collateral and gauging changes in the economic environment ingeneral. The total valuation allowance can be expected to increase when economic conditions worsen and decrease wheneconomic conditions improve. For more detailed information concerning mortgage loan valuation allowances andimpairments, see Item 7. ‘‘Management’s Discussion and Analysis of Financial Condition and Results of Operations —Investments — U.S. Investment Operations — Mortgage Loans,’’ and Item 8. ‘‘Financial Statements and SupplementaryData — Notes to Consolidated Financial Statements — Footnote 4, Investments — Mortgage Loan ValuationAllowance.’’
We utilize an internally developed model to provide estimates and timing of loan losses. To assess the sensitivity ofthe loans to foreclosure and loss severities, the loans were stressed using a base downside scenario and a severe downsidescenario. The base downside scenario stressed the portfolio to an economic state that included delinquencies increasingto the 1%-3% range, higher than average commercial property vacancies in excess of equilibrium levels and flat tominimal space absorption. The severe downside scenario assumed another recession starting with the worst historicaleconomic state and persistence of that state for four years. Characteristics of the worst economic state includesignificantly above average commercial mortgage delinquencies in excess of 5%, very high commercial real estateproperty vacancies significantly above equilibrium levels and zero to negative space absorption. The maximum negativeeffect on one year pre-tax net income from use of these models was $25 - $40 million in the base downside scenario and$90 - $115 million under the severe downside scenario.
We have a large experienced commercial real estate staff centrally located in Des Moines, which includescommercial mortgage underwriters, loan closers, loan servicers, engineers, appraisers, credit analysts, research staff, legalstaff, information technology personnel and portfolio managers. Experienced commercial real estate senior managementadheres to a disciplined process in reviewing all transactions for approval on a consistent basis. The typical commercialmortgage loan for us averages in the mid 40% percent loan-to-value range at origination with a net operating incomecoverage ratio of 3.5 times the annual debt service and is internally rated AA- on a bond equivalent basis. Based on themost recent analysis, our commercial mortgage loan portfolio, excluding mortgage loans held in our Principal GlobalInvestors segment, has an overall loan-to-value ratio of 66% with a 1.8 times debt service coverage. The large equitycushion and strong debt service coverage in our commercial mortgage investments will help insulate us from stress duringtimes of weak commercial real estate fundamentals.
35

Derivatives
We primarily use derivatives to hedge or reduce exposure to market risks. The fair values of exchange-tradedderivatives are determined through quoted market prices. The fair values of over-the-counter derivative instruments aredetermined using either pricing valuation models that utilize market observable inputs or broker quotes. On an absolutefair value basis, 90.9% of our over-the-counter derivative assets and liabilities are valued using pricing valuation models,while the remaining 9.1% are valued using broker quotes. See Item 8. ‘‘Financial Statements and Supplementary Data,Notes to Consolidated Financial Statements, Note 14, Fair Value Measurements’’ for further discussion. The fair valuesof our derivative instruments can be impacted by changes in interest rates, foreign exchange rates, credit spreads, equityindices, and volatility, as well as other contributing factors.
We also issue certain annuity contracts and other insurance contracts that include embedded derivatives that havebeen bifurcated from the host contract. They are valued using a combination of historical data and actuarial judgment.See Item 8. ‘‘Financial Statements and Supplementary Data, Notes to Consolidated Financial Statements, Note 14, FairValue Measurements’’ for further discussion. We include our assumption for own non-performance risk in the valuationof these embedded derivatives. As our credit spreads widen or tighten, the fair value of the embedded derivativeliabilities decrease or increase, leading to an increase or decrease in net income. If the current market credit spreadsreflecting our own creditworthiness move to zero (tighten), the reduction to net income would be approximately$2.1 million, net of DPAC and income taxes, based on December 31, 2010, reported amounts. The use of risk margins forthe valuation of embedded derivatives increases the fair value of the embedded derivative liabilities.
The accounting for derivatives is complex and interpretations of the applicable accounting standards continue toevolve. Judgment is applied in determining the availability and application of hedge accounting designations and theappropriate accounting treatment. Judgment and estimates are used to determine the fair value of some of ourderivatives. Volatility in net income can result from changes in fair value of derivatives that do not qualify or are notdesignated for hedge accounting and changes in fair value of embedded derivatives.
Deferred Policy Acquisition Costs and Other Actuarial Balances
Commissions and other costs (underwriting, issuance and agency expenses) that vary with and are primarily relatedto the acquisition of new and renewal insurance policies and investment contract business are capitalized to the extentrecoverable. Maintenance costs and acquisition costs that are not deferrable are charged to net income as incurred.
Amortization Based on Estimated Gross Profits. DPAC for universal life-type insurance contracts, participating lifeinsurance policies and certain investment contracts are amortized over the expected lifetime of the policies in relation toestimated gross profits (‘‘EGP’’). In addition to DPAC, the following actuarial balances are also amortized in relation toEGP or contract assessments.
• Sales inducement asset — Sales inducements are amounts that are credited to the contractholder’s accountbalance as an inducement to purchase the contract. Like DPAC, the cost of the sales inducement is capitalized andamortized over the expected life of the contract, in proportion to EGP.
• Unearned revenue liability — An unearned revenue liability is established when we collect fees or otherpolicyholder assessments that represent compensation for services to be provided in future periods. Theserevenues are deferred and then amortized over the expected life of the contract, in proportion to EGP.
• Reinsurance asset or liability — For universal-life type products that are reinsured, a reinsurance asset or liabilityis established to spread the net reinsurance costs or profits in proportion to the EGP on the underlying business.
• Present value of future profits (‘‘PVFP’’) — This is an intangible asset that arises in connection with theacquisition of a life insurance company or a block of insurance business. PVFP for universal life-type insurancecontracts, participating life insurance policies and certain investment contracts is amortized over the expected lifeof the contracts acquired, in proportion to EGP.
• Additional benefit reserves — These are additional liabilities that are established for annuity or universal life-typecontracts that provide benefit guarantees, or for contracts that are expected to produce profits followed by losses.The liabilities are accrued in relation to estimated contract assessments.
At issue and each valuation date, we develop an estimate of the expected future gross profits that containsassumptions relating to mortality, morbidity, lapses, investment yield and expenses. As actual experience emerges, thegross profits may vary from those expected either in magnitude or timing, in which case a true-up to actual occurs as acharge or credit to current net income. In addition, we are required to revise our assumptions regarding futureexperience if actual experience or other evidence suggests that earlier estimates should be revised. Both actions,reflecting actual experience and changing future estimates, can change both the current amount and the futureamortization pattern of the DPAC asset and related actuarial balances.
For individual variable life insurance, individual variable annuities and group annuities which have separate accountU.S. equity investment options, we utilize a mean reversion methodology (reversion to the mean assumption), a commonindustry practice, to determine the future domestic equity market growth rate assumption used for the calculation ofEGP. If actual annualized U.S. equity market performance varies from our 8% long-term assumption, we assume
36
different performance levels in the short term such that the mean return is equal to the long-term assumption over themean reversion period. However, our mean reversion process generally limits assumed returns to a range of 4 - 12%during the mean reversion period. The 12% cap was reached during the third quarter of 2008, and the mean reversionrate has remained at the 12% cap since then. Therefore, until the mean reversion rate falls below the 12% cap, we willnot adjust the equity return assumption by the amount needed to result in a mean return equal to the long-termassumption.
Amortization Based on Premium-Paying Period. DPAC of non-participating term life insurance and individualdisability policies are amortized over the premium-paying period of the related policies using assumptions consistent withthose used in computing policyholder liabilities. Once these assumptions are made for a given policy or group of policies,they will not be changed over the life of the policy unless a loss recognition event occurs. As of December 31, 2010, thesepolicies accounted for 10% of our total DPAC balance.
Internal Replacements. We review polices for modifications that result in the exchange of an existing contract for anew contract. If the new contract is determined to be an internal replacement that is substantially changed from thereplaced contract, any unamortized DPAC and related actuarial balances are written off and acquisition costs related tothe new contract are capitalized as appropriate. If the new contract is substantially unchanged, we continue to amortizethe existing DPAC and related actuarial balances.
Recoverability. DPAC and sales inducement assets are subject to recoverability testing at the time of policy issue andloss recognition testing on an annual basis, or when an event occurs that may warrant loss recognition. Likewise, PVFP issubject to impairment testing on an annual basis, or when an event occurs that may warrant impairment. If lossrecognition or impairment is necessary, the asset balances are written off to the extent that it is determined that futurepolicy premiums and investment income or gross profits are not adequate to cover related losses and expenses.
Sensitivities. As of December 31, 2010, the net balance of DPAC and related actuarial balances, excluding balancesaffected by changes in other comprehensive income, was a $3,447.8 million asset. We perform sensitivity analyses toassess the impact that certain assumptions have on our DPAC and related actuarial balances. The following table showsthe estimated immediate impact of various assumption changes on our DPAC and related actuarial balances.
Estimated impact tonet income (1)
(in millions)Reducing the future equity return assumption by 1% . . . . . . . . . . . . . . . . . . . . . . . . . . . . . . . . . . . . . . . . . $ (7.4)Reducing the future general account net investment return assumption by 0.5% (2) . . . . . . . . . . . . . . . . . . . . . $(131.6)Removing the mean reversion methodology from the EGP calculation . . . . . . . . . . . . . . . . . . . . . . . . . . . . . . $ (15.7)A one-time, 10% drop in equity market values . . . . . . . . . . . . . . . . . . . . . . . . . . . . . . . . . . . . . . . . . . . . $ (12.9)Increasing all future lapse rate assumptions by 10% of the baseline assumption (3) . . . . . . . . . . . . . . . . . . . . . $ (27.1)
(1) Reflects the net impact of changes to the DPAC asset, sales inducement asset, unearned revenue liability, reinsurance asset or liability,PVFP and additional benefit reserves. Includes the impact on net income of changes in DPAC and related balances for our equity methodsubsidiaries. The DPAC and related balances of the equity method subsidiaries are not included in the total DPAC balance listed above asthey are not fully consolidated.
(2) Net investment return represents net investment income plus net realized capital gains (losses).
(3) This calculation reflects an increase in lapse rates only for products where increasing the lapse rate leads to a net write-down of the DPACasset and related actuarial balances. Lapse rates were left unchanged for those products where an increase in lapse rates would lead to anet write-up of the DPAC asset and related actuarial balances.
Goodwill and Other Intangible Assets
Goodwill and other intangible assets include the cost of acquired subsidiaries in excess of the fair value of the nettangible assets recorded in connection with acquisitions. Goodwill and intangible assets with indefinite lives are notamortized; rather, we test the carrying value for impairment at least annually at the reporting unit level, which is abusiness one level below the operating segment. We formally conduct our annual goodwill and other intangible assetimpairment testing during the fourth quarter. Under certain circumstances, interim impairment tests may be required ifevents occur or circumstances change that would more likely than not reduce the fair value of a reporting unit below itscarrying value. See Item 8. ‘‘Financial Statements and Supplementary Data, Notes to Consolidated Financial Statements,Note 1, Nature of Operations and Significant Accounting Policies’’ for further discussion.
We are required to perform a two-step test in our evaluation of the carrying value of goodwill. In Step 1 of theevaluation, the fair value of each reporting unit is determined and compared to the carrying value of the reporting unit. Ifthe fair value is greater than the carrying value, then the carrying value of the reporting unit is deemed to be recoverable,and Step 2 is not required. If the fair value estimate is less than the carrying value, it is an indicator that impairment mayexist, and Step 2 is required. In Step 2, the reporting unit’s goodwill implied fair value is determined. The reporting unit’sfair value as determined in Step 1 is assigned to all of its net assets (recognized and unrecognized) as if the reporting unitwere acquired in a business combination as of the date of the impairment test. If the implied fair value of the reportingunit’s goodwill is lower than its carrying amount, goodwill is impaired and written down to its implied fair value.
37
The determination of fair value for our reporting units is primarily based on an income approach whereby we usediscounted cash flows for each reporting unit. When available, and as appropriate, we use market approaches or othervaluation techniques to corroborate discounted cash flow results. The discounted cash flow model used for each reportingunit is based on either income or distributable cash flow, depending on the reporting unit being valued.
For the income model, we determine fair value based on the present value of the most recent income projections foreach reporting unit and calculate a terminal value utilizing a terminal growth rate. The significant assumptions in theoperating income model include: income projections, including the underlying assumptions; discount rate and terminalgrowth rate.
For the distributable cash flow model, we determine fair value based on the present value of projected statutory netincome and changes in required capital to determine distributable income for the respective reporting unit. Thesignificant assumptions in the distributable cash flow model include: required capital levels; income projections, includingthe underlying assumptions; discount rate; new business projection period and new business production growth.
We performed an interim goodwill impairment test as of September 30, 2010, in response to our decision to exit thegroup medical insurance business. As a result of the shortened period of projected cash flows, we determined thegoodwill related to this reporting unit within our Corporate operating segment was impaired and it was written down to avalue of zero. We recorded a $43.6 million pre-tax impairment loss as an operating expense during third quarter 2010 inthe consolidated statements of operations.
Intangible assets with useful lives are amortized as related benefits emerge and are reviewed periodically forindicators of impairment in value. If facts and circumstances suggest possible impairment, the sum of the estimatedundiscounted future cash flows expected to result from the use of the asset is compared to the current carrying value ofthe asset. If the undiscounted future cash flows are less than the carrying value, an impairment loss is recognized for theexcess of the carrying amount of assets over their fair value. For those assets amortized as related benefits emerge, themost significant assumptions involved in the estimation of future benefits include surrender/lapse rates, interest marginsand mortality.
Other than impairments related to our decision to exit the group medical insurance business, we did not recognize amaterial impairment in our 2010 consolidated statement of operations. Investment management contracts acquired inour 2006 purchase of WM Advisors, Inc. are considered an indefinite lived intangible and are the most materialintangible asset included in our 2010 consolidated statement of financial position with a carrying value of $608.0 million.Positive net cash flows and expected future flows combined with significantly lower than expected expenses more thanoffset lower than expected market returns on the underlying assets acquired. As a result, the fair value of this intangibleasset as of December 31, 2010, was in excess of its carrying value. We cannot predict certain future events that mightadversely affect the reported value of goodwill and other intangible assets that totaled $345.4 million and $834.6 million,respectively, as of December 31, 2010. Such events include, but are not limited to, strategic decisions made in response toeconomic and competitive conditions, the impact of the economic environment on our customer base, interest ratemovements, declines in the equity markets, the legal environment in which the businesses operate or a material negativechange in our relationships with significant customers. Additional information about impairments is described in Item 8.‘‘Financial Statements and Supplementary Data, Notes to Consolidated Financial Statements, Note 2, Goodwill andOther Intangible Assets.’’
Insurance Reserves
Reserves are liabilities representing estimates of the amounts that will come due, at some point in the future, to oron behalf of our policyholders. U.S. GAAP, allowing for some degree of managerial judgment, prescribes the methods ofestablishing reserves.
Future policy benefits and claims include reserves for individual traditional and group life insurance, accident andhealth insurance and individual and group annuities that provide periodic income payments, which are computed usingassumptions of mortality, morbidity, lapse, investment performance and expense. These assumptions are based on ourexperience and are periodically reviewed against industry standards to ensure actuarial credibility. For long durationinsurance contracts, once these assumptions are made for a given policy or group of policies, they will not be changedover the life of the policy. However, significant changes in experience or assumptions may require us to provide forexpected future losses on a product by establishing premium deficiency reserves. Premium deficiency reserves may alsobe established for short duration contracts to provide for expected future losses. Our reserve levels are reviewedthroughout the year using internal analysis including, among other things, experience studies, claim development analysisand annual statutory asset adequacy analysis. To the extent experience indicates potential loss recognition, we recognizelosses on certain lines of business. The ultimate accuracy of the assumptions on these long-tailed insurance productscannot be determined until the obligation of the entire block of business on which the assumptions were made isextinguished. Short-term variances of actual results from the assumptions used in the computation of the reserves arereflected in current period net income and can impact quarter-to-quarter net income.
Future policy benefits and claims also include reserves for incurred but unreported health, disability and lifeinsurance claims. We recognize claims costs in the period the service was provided to our policyowners. However, claimscosts incurred in a particular period are not known with certainty until after we receive, process and pay the claims. We
38
determine the amount of this liability using actuarial methods based on historical claim payment patterns as well asemerging medical cost trends, where applicable, to determine our estimate of claim liabilities. We also look back to assesshow our prior periods’ estimates developed. To the extent appropriate, changes in such development are recorded as achange to current period claim expense. Historically, the amount of the claim reserve adjustment made in subsequentreporting periods for prior period estimates was within a reasonable range given our normal claim fluctuations.
Benefit Plans
The reported expense and liability associated with pension and other postretirement benefit plans requires the use ofassumptions. Numerous assumptions are made regarding the discount rate, expected long-term rate of return on planassets, turnover, expected compensation increases, health care claim costs, health care cost trends, retirement rates andmortality. The discount rate and the expected return on plan assets have the most significant impact on the level ofexpense.
The assumed discount rate is determined by projecting future benefit payments inherent in the Projected BenefitObligation and discounting those cash flows using a spot yield curve. For 2010 year-end, this yield curve was the PrincipalPension Discount Yield Curve (‘‘Principal curve’’), while for 2009 we utilized the Mercer Pension Discount Yield Curve(‘‘Mercer curve’’). Prior to 2009 we used the Citigroup Pension Liability Discount Yield Curve. We changed curves basedon research performed in 2009 and believe the Mercer and Principal curves better comply with applicable accountingstandards. We used the Mercer curve only as a temporary measure until the Principal curve was available. Based on thismethodology for the 2010 year-end, we set the discount rate at 5.65%. A 0.25% decrease in the discount rate wouldincrease the pension benefits Projected Benefit Obligation and the 2011 Net Periodic Pension Cost (‘‘NPPC’’) byapproximately $72.4 million and $11.0 million, respectively. A 0.25% decrease in the discount rate would increase theother postretirement benefits Accumulated Postretirement Benefit Obligation by approximately $3.8 million and wouldhave a nominal impact on the 2011 Net Periodic Benefit Cost (‘‘NPBC’’). A 0.25% increase in the discount rate wouldresult in decreases in benefit obligations and expenses at a level generally commensurate with those noted above.
The assumed long-term rate of return on plan assets is set at the long-term rate expected to be earned based on thelong-term investment policy of the plans and the various classes of the invested funds. Historical and future expectedreturns of multiple asset classes were analyzed to develop a risk-free real rate of return and risk premiums for each assetclass. The overall long-term rate for each asset class was developed by combining a long-term inflation component, thereal risk free rate of return and the associated risk premium. A weighted average rate was developed based on long-termreturns for each asset class, the plan’s target asset allocation policy and the tax structure of the trusts. For the 2010 NPPCand 2010 NPBC, an 8.00% and 7.30% weighted average long-term rate of return was used, respectively. For the 2011NPPC and 2011 NPBC, an 8.00% and 7.30% weighted average long-term rate of return assumption, respectively, will alsobe used. A 0.25% decrease in the assumed long-term rate of return would increase 2011 NPPC by approximately$3.5 million and the 2011 NPBC by approximately $1.2 million. A 0.25% increase in this rate would result in a decrease toexpense at the same levels. The assumed return on plan assets is based on the fair market value of plan assets as ofDecember 31, 2010.
The compensation increase assumption is generally set at a rate consistent with current and expected long-termcompensation and salary policy, including inflation. Actuarial gains and losses are amortized using a straight-lineamortization method over the average remaining service period of employees, which is approximately 7 years for pensioncosts and approximately 12 years for other postretirement benefit costs. Prior service costs are amortized on a weightedaverage basis over approximately 4 years for pension and 5 years for other postretirement benefit costs.
See Item 8. ‘‘Financial Statements and Supplementary Data, Notes to Consolidated Financial Statements, Note 11,Employee and Agent Benefits.’’
Income Taxes
We provide for income taxes based on our estimate of the liability for taxes due. Our tax accounting representsmanagement’s best estimate of various events and transactions, such as completion of tax audits or establishment of, orchanges to, a valuation allowance associated with certain deferred tax assets, which could affect our estimates andeffective income tax rate in a particular quarter or annual period. In determining the need for a valuation allowance, weconsider many factors, including future reversals of existing taxable temporary differences, future taxable incomeexclusive of reversing temporary differences and carryforwards, taxable income in prior carryback years and any taxplanning strategies we would employ to realize the tax benefit.
Inherent in the provision for income taxes are estimates regarding the deductibility of certain items, the timing ofincome and expense recognition and the current or future realization of capital losses and certain tax credits. In the eventour estimates of the ultimate deductibility of certain items, the timing of the recognition of income and expense or thecurrent or future realization of capital losses and certain tax credits differ from prior estimates due to the receipt of newinformation, we may be required to significantly change the provision for income taxes recorded in the consolidatedfinancial statements. Any such change could significantly affect the amounts reported in the consolidated financialstatements in the year these estimates change. A further significant decline in value of assets incorporated into our taxplanning strategies could lead to an increase of our valuation allowance on deferred tax assets having an adverse effect oncurrent and future results.
39
In addition, the amount of income taxes paid is subject to audits in various jurisdictions. Tax benefits are recognizedfor book purposes when the more-likely-than-not threshold is met with regard to the validity of an uncertain tax position.Once this threshold is met, for each uncertain tax position we recognize in earnings the largest amount of benefit that isgreater than 50% likely of being realized upon ultimate settlement with the Internal Revenue Service or other incometaxing authorities for audits ongoing or not yet commenced.
We had $230.9 million and $243.6 million of current income tax receivables associated with outstanding audit issuesreported as other assets in our consolidated statements of financial position as of December 31, 2010 and 2009,respectively. We believe that we have adequate defenses against, or sufficient provisions for, the contested issues, butfinal resolution of contested issues could take several years while legal remedies are pursued. Consequently, we do notanticipate the ultimate resolution of audits ongoing or not yet commenced to have a material impact on our net income.
Transactions Affecting Comparability of Results of Operations
Dispositions
We entered into disposition agreements or disposed of the following businesses, among others, during the past threeyears:
Post Advisory Group, LLC. Effective January 1, 2009, we sold certain fixed income asset management contracts withinour Post Advisory Group, LLC subsidiary, at which time we realized benefits from the cancellation of deferredcompensation agreements. The AUM associated with this sale totaled $3.8 billion. The total cash proceeds of up to$50.0 million are expected to be received over a four year time period. The initial $2.2 million cash down payment wasreceived in the second quarter of 2009.
The transaction does not qualify for discontinued operations treatment under U.S. GAAP. The realized capital gainfrom the sale, which is reflected in our Principal Global Investors segment, is not material.
Other
Group Medical Insurance Business. On September 30, 2010, we announced our decision to exit the group medicalinsurance business (insured and administrative services only) and entered into an agreement with United HealthcareServices, Inc. to renew group medical insurance coverage for our customers as the business transitions. The exiting of thegroup medical insurance business does not yet qualify for discontinued operations treatment under U.S. GAAP.Therefore, the results of operations for the group medical insurance business are still included in our consolidatedincome from continuing operations.
As a result of our decision to exit the group medical insurance business, amounts for our group medical insurancebusiness, which had previously been reported in the Life and Health Insurance segment, are now reported in theCorporate segment and the Life and Health Insurance segment has been renamed the U.S. Insurance Solutions segment.Our segment results for 2009 and 2008 have been restated to conform to the current segment presentation. With theexception of corporate overhead, amounts related to our group medical insurance business previously included insegment operating earnings have been removed from operating earnings for all periods presented and are reported asother after-tax adjustments. The operating revenues associated with our exited group medical insurance business were$1,403.9 million, $1,610.6 million and $1,762.5 million for the years ended December 31, 2010, 2009 and 2008,respectively. The other after-tax adjustments associated with the after-tax earnings of our exited group medical insurancebusiness were $24.0 million, $70.5 million and $96.3 million for the years ended December 31, 2010, 2009 and 2008,respectively.
Brasilprev Seguros e Previdencia S.A. On April 30, 2010, we signed definitive agreements with Banco, including theShareholders Agreement governing the operations of our pension joint venture, Brasilprev. The agreements result inBrasilprev having, for 23 years, the exclusive right to distribute pension products within the Banco bank network and areduction in our economic interest from 46% to 25%, which resulted in a $72.1 million after-tax net realized capital gainin the second quarter of 2010. Brasilprev will continue to be jointly managed and reported as an equity methodinvestment in our Principal International segment. Due to the reduction in our economic interest, we expect to see adecline in our earnings from this operation in the near term.
Senior Note Issuance. On May 18, 2009, we issued $750.0 million of senior notes. We issued a $400.0 million series ofnotes that bear interest at 7.875% and will mature on May 15, 2014, and a $350.0 million series of notes that bear interestat 8.875% and will mature on May 15, 2019. Interest on the notes is payable semi-annually on May 15 and November 15each year, beginning on November 15, 2009. The proceeds were primarily used to refinance $440.9 million of notes thatmatured on August 15, 2009, with the remaining proceeds being used for general corporate purposes.
Common Stock Issuance. On May 11, 2009, we issued 58.2 million shares of common stock at a price of $19.75 pershare. Net proceeds from the issuance were $1,109.1 million. The proceeds from this offering will be used for generalcorporate purposes.
Commercial Mortgage Securities Issuance Operation. During the third quarter of 2008, we made a decision to terminateour commercial mortgage securities issuance operation. This termination does not qualify for discontinued operationstreatment under U.S. GAAP. Therefore, the results of the terminated commercial mortgage securities issuance operationare still included in our consolidated income from continuing operations.
40

As a result of our decision to terminate our commercial mortgage securities issuance operation, amounts previouslyincluded in our Principal Global Investors segment operating earnings related to our commercial mortgage securitiesissuance operation have been removed from operating earnings for all periods presented and are reported as otherafter-tax adjustments. Our commercial mortgage securities issuance operation had operating revenues of $(0.8) million,$(0.5) million and $(32.2) million for the years ended December 31, 2010, 2009 and 2008, respectively, and after-taxoperating losses of $0.5 million, $0.7 million and $28.1 million for the years ended December 31, 2010, 2009 and 2008,respectively.
Fluctuations in Foreign Currency to U.S. Dollar Exchange Rates
Fluctuations in foreign currency to U.S. dollar exchange rates for countries in which we have operations can affectreported financial results. In years when foreign currencies weaken against the U.S. dollar, translating foreign currenciesinto U.S. dollars results in fewer U.S. dollars to be reported. When foreign currencies strengthen, translating foreigncurrencies into U.S. dollars results in more U.S. dollars to be reported.
Foreign currency exchange rate fluctuations create variances in our financial statement line items but have not had amaterial impact on our consolidated financial results. The Principal International segment’s operating earnings werepositively impacted $15.2 million, negatively impacted $19.6 million and positively impacted $6.0 million for the yearsended December 31, 2010, 2009 and 2008, respectively, as a result of fluctuations in foreign currency to U.S. dollarexchange rates for our foreign operations. For a discussion of our approaches to foreign currency exchange rate risk, seeItem 7A. ‘‘Quantitative and Qualitative Disclosures About Market Risk — Foreign Currency Risk.’’
Effects of Inflation
The impact of inflation has not had a material effect on our annual consolidated results of operations over the pastthree years. However, we may be materially affected by inflation in the future. For further discussion on inflation, seeItem 1A. ‘‘Risk Factors — Continued difficult conditions in the global capital markets and the economy generally maymaterially and adversely affect our business and results of operations.’’
Stock-Based Compensation Plans
For information related to our stock-based compensation plans, see Item 8. ‘‘Financial Statements andSupplementary Data, Notes to Consolidated Financial Statements, Note 17, Stock-Based Compensation Plans.’’
Defined Benefit Pension Expense
The 2010 annual defined benefit pension expense for substantially all of our employees and certain agents was$109.5 million pre-tax, which was a $48.1 million decrease from the 2009 pre-tax pension expense of $157.6 million. Thisdecrease is primarily due to actual asset returns in 2009 that were greater than expected, resulting in an actuarial gain andhigher than expected plan assets as of December 31, 2009. The higher asset value increased the expected return on planassets in 2010 and the actuarial gain reduced the previous actuarial loss and its amortization in 2010. The expectedlong-term return on plan assets and the discount rate used to develop the 2010 expense remained at the same 8.0% and6.0% rates, respectively, used to develop the 2009 expense.
The 2011 annual defined benefit pension expense for substantially all of our employees and certain agents isexpected to be $90.9 million pre-tax, which is an $18.6 million decrease from the 2010 pre-tax pension expense of$109.5 million. This decrease is primarily due to actual asset returns in 2010 that were higher than expected asset returns.The expected long-term return on plan assets used to develop the 2011 expense remained at the same 8.0% as was usedto develop the 2010 expense, while the discount rate declined from 6.0% to 5.65%. Due to the exit of the group medicalinsurance business, the expense will be re-measured quarterly during 2011, with updated asset values and potentiallydifferent discount rates. The final expense for 2011 could be greater or less than $90.9 million.
Healthcare Reform
During the first quarter of 2010, federal legislation was enacted that reformed the healthcare system. Among themany changes, the newly enacted healthcare legislation eliminates the tax deductibility of retiree prescription drugexpenses incurred after 2012, up to the Medicare Part D subsidy amount, which had been allowed to encourageemployers to offer retiree drug coverage. We recognized a $7.8 million negative impact to net income for the year endedDecember 31, 2010, associated with the release of the portion of our deferred tax asset on accrued retiree prescriptiondrug expenses related to our employees that will no longer be tax-deductible after December 31, 2012.
For additional healthcare reform information, see Item 1A. ‘‘Risk Factors — Changes in laws, regulations oraccounting standards may reduce our profitability.’’
Recent Accounting Changes
For recent accounting changes, see Item 8. ‘‘Financial Statements and Supplementary Data, Notes to ConsolidatedFinancial Statements, Note 1, Nature of Operations and Significant Accounting Policies.’’
41

Results of Operations
The following table presents summary consolidated financial information for the years indicated:
For the year endedDecember 31, Increase (decrease)
2010 2009 2008 2010 vs. 2009 2009 vs. 2008
(in millions)Revenues:
Premiums and other considerations . . . . . . . . . . . . . . . . . . . . . . $3,555.5 $3,750.6 $4,209.2 $(195.1) $ (458.6)Fees and other revenues . . . . . . . . . . . . . . . . . . . . . . . . . . . . . 2,298.1 2,096.0 2,426.5 202.1 (330.5)Net investment income . . . . . . . . . . . . . . . . . . . . . . . . . . . . . . 3,496.5 3,400.8 3,994.3 95.7 (593.5)Net realized capital gains (losses), excluding impairment losses on
available-for-sale securities . . . . . . . . . . . . . . . . . . . . . . . . . . 48.7 54.9 (214.8) (6.2) 269.7Total other-than-temporary impairment losses on available-for-sale
securities . . . . . . . . . . . . . . . . . . . . . . . . . . . . . . . . . . . . . (296.3) (714.1) (479.3) 417.8 (234.8)Portion of impairment losses on fixed maturities, available-for-sale
recognized in other comprehensive income . . . . . . . . . . . . . . . . 56.1 260.9 — (204.8) 260.9
Net impairment losses on available-for-sale securities . . . . . . . . . . . (240.2) (453.2) (479.3) 213.0 26.1
Net realized capital losses . . . . . . . . . . . . . . . . . . . . . . . . . . . . (191.5) (398.3) (694.1) 206.8 295.8
Total revenues . . . . . . . . . . . . . . . . . . . . . . . . . . . . . . . . . . 9,158.6 8,849.1 9,935.9 309.5 (1,086.8)Expenses:
Benefits, claims and settlement expenses . . . . . . . . . . . . . . . . . . . 5,338.4 5,334.5 6,219.9 3.9 (885.4)Dividends to policyholders . . . . . . . . . . . . . . . . . . . . . . . . . . . . 219.9 242.2 267.3 (22.3) (25.1)Operating expenses . . . . . . . . . . . . . . . . . . . . . . . . . . . . . . . . 2,759.0 2,526.6 2,987.4 232.4 (460.8)
Total expenses . . . . . . . . . . . . . . . . . . . . . . . . . . . . . . . . . . 8,317.3 8,103.3 9,474.6 214.0 (1,371.3)
Income before income taxes . . . . . . . . . . . . . . . . . . . . . . . . . . . . 841.3 745.8 461.3 95.5 284.5Income taxes (benefits) . . . . . . . . . . . . . . . . . . . . . . . . . . . . . . . 124.1 100.1 (4.5) 24.0 104.6
Net income . . . . . . . . . . . . . . . . . . . . . . . . . . . . . . . . . . . . . . . 717.2 645.7 465.8 71.5 179.9Net income attributable to noncontrolling interest . . . . . . . . . . . . . . 17.9 23.0 7.7 (5.1) 15.3
Net income attributable to Principal Financial Group, Inc. . . . . . . . . . 699.3 622.7 458.1 76.6 164.6Preferred stock dividends . . . . . . . . . . . . . . . . . . . . . . . . . . . . . . 33.0 33.0 33.0 — —
Net income available to common stockholders . . . . . . . . . . . . . . . $ 666.3 $ 589.7 $ 425.1 $ 76.6 $ 164.6
Year Ended December 31, 2010 Compared to Year Ended December 31, 2009
Net Income Available to Common Stockholders
Net income available to common stockholders increased primarily due to higher fees in our Retirement and InvestorServices segment stemming from an increase in average account values, which resulted from continuing equity marketimprovement since the latter half of 2009. Our Principal Global Investors segment also had higher profitability due tohigher fee revenues driven by an increase in average AUM, which resulted from continuing market improvement, as wellas higher borrower fees from our real estate business resulting from higher transaction volumes and higher servicing fees.In addition, our Principal International segment had higher profitability primarily due to the strengthening of the LatinAmerican currencies against the U.S. dollar, higher investment returns on assets not backing segment insurance productsas a result of inflation in Chile during 2010 compared to deflation in 2009, and higher fee revenues driven by higheraverage AUM as a result of net customer cash flows and market performance. These increases in net income available tocommon stockholders were partially offset by an impairment of goodwill and severance accruals in the Corporatesegment in the third quarter of 2010 associated with our decision to exit the group medical insurance business.
The reduction in net realized capital losses was mostly offset by a corresponding increase in related DPACamortization expense. Higher net realized capital losses in 2009 within our full service accumulation and individualannuities businesses resulted in lower DPAC amortization expense in 2009.
Total Revenues
Premiums decreased $205.3 million for the Corporate segment primarily due to a reduction in average coveredmedical members in our exited group medical insurance business. In addition, U.S. Insurance Solutions segmentpremiums decreased $90.9 million primarily due to a decrease in membership in our specialty benefits insurance businessand the expected continued decline from the decreasing block of traditional life insurance business. Partially offsettingthese decreases was an $85.0 million increase in Retirement and Investor Services segment premiums primarily due to anincrease in sales of annuities with life contingencies within our individual annuities and full service payout businesses.
Fees increased $115.5 million for our Retirement and Investor Services segment primarily due to higher fee incomestemming from an increase in average account values as a result of continuing equity market improvement since the latterhalf of 2009. Fees also increased $37.9 million for our Principal Global Investors segment primarily due to higher feerevenues driven by an increase in average AUM as well as higher borrower fees from our real estate business resultingfrom higher transaction volumes and higher servicing fees. In addition, fees increased $31.7 million for our PrincipalInternational segment primarily due to higher investment management fees driven by higher average AUM as a result of
42

local market performance and net customer cash flows coupled with the strengthening of the Latin American currenciesagainst the U.S. dollar.
Net investment income increased primarily due to higher inflation-based investment returns on average investedassets and cash as a result of inflation in Chile during 2010 compared to deflation in 2009. This increase was partiallyoffset by a decrease in average invested assets and cash, excluding the fair value adjustment associated with fixedmaturities and equity securities, primarily due to our decision to scale back our investment only business. For additionalinformation, see ‘‘Investments — Investment Results.’’
Net realized capital gains (losses) can be volatile due to other than temporary impairments of invested assets,mark-to market-adjustments of certain invested assets and our decision to sell invested assets. Net realized capital lossesdecreased primarily due to lower impairments, net of noncredit losses recognized in other comprehensive income andrecoveries from sales, on fixed maturities, available-for-sale; a gain associated with the second quarter 2010 signing of ourShareholders Agreement with Banco pertaining to our Brasilprev joint venture and lower losses on commercial mortgageloans. These items were partially offset by an increase in the residential mortgage loan loss provision for our Bank andTrust Services business in 2010, which primarily related to the home equity portfolio. For additional information, see‘‘Investments — Investment Results.’’
Total Expenses
Benefits, claims and settlement expenses increased $169.2 million for the Principal International segment, primarilydue to higher inflation-based interest crediting rates to customers in Chile and the strengthening of the Chilean pesoagainst the U.S. dollar. Benefits, claims and settlement expenses also increased $89.4 million for the U.S. InsuranceSolutions segment primarily due to higher gross claims and larger increases in reserves. Partially offsetting these increaseswas a $192.4 million decrease for the Corporate segment primarily due to a reduction in average covered medicalmembers in our exited group medical insurance business. In addition, Retirement and Investor Services segment benefits,claims and settlement expenses decreased $62.3 million primarily due to a decrease in cost of interest credited stemmingfrom lower variable crediting rates and a decline in average account values in our investment only business, whichprimarily resulted from our decision to scale back this business.
Retirement and Investor Services operating expenses increased $177.8 million, primarily due to an increase in DPACamortization expense resulting from more favorable DPAC unlocking in 2009 and, to a lesser extent, higher commissionand distribution expenses resulting from an increase in sales and average account values. Operating expenses alsoincreased $51.0 million for the Corporate segment primarily due to an impairment of goodwill and severance accrualsassociated with our decision to exit the group medical insurance business.
Income Taxes
The effective income tax rates were 15% and 13% for the years ended December 31, 2010 and 2009, respectively.The effective income tax rates were lower than the U.S. corporate income tax rate of 35% (‘‘U.S. statutory rate’’)primarily due to income tax deductions allowed for corporate dividends received, taxes on our share of earningsgenerated from equity method investments, which are reflected in net investment income, and the interest exclusion fromtaxable income.
Year Ended December 31, 2009 Compared to Year Ended December 31, 2008
Net Income Available to Common Stockholders
Due to the challenging economic environment, our revenues decreased while our employee defined benefit pensionand other postretirement benefit costs increased relative to 2008. In order to minimize the impact to net income availableto common stockholders, we undertook extensive company-wide expense savings initiatives to better align our expenseswith the declining revenue base.
Net income available to common stockholders increased primarily due to a $211.5 million after-tax decrease in netrealized capital losses. The change in net realized capital losses was primarily driven by mark-to-market gains versuslosses on fixed maturities and equity securities classified as trading and higher gains on sales of fixed maturities. Partiallyoffsetting this increase were lower earnings in our Principal Global Investors segment primarily due to the severedownturn in the global financial markets in 2008, which led to a significant reduction in AUM and revenues.
Total Revenues
Retirement and Investor Services segment premiums decreased $276.0 million primarily due to a decrease in sales ofannuities with life contingencies within our individual annuities and full service payout businesses. In addition, premiumsdecreased $127.9 million for the Corporate segment primarily due to a reduction in average covered medical members inour exited group medical insurance business.
Fees decreased $208.8 million for our Retirement and Investor Services segment resulting from an equity market-driven decrease in average account values in 2009 compared to 2008. Fees also decreased $153.6 million for our PrincipalGlobal Investors segment due to a decrease in AUM as a result of declining market conditions as well as the 2009 sale ofcertain asset management contracts within Post Advisory Group, LLC.
43

Net investment income decreased primarily due to lower inflation-based investment returns related to deflation inChile during 2009, lower yields on floating rate investments supporting floating rate liabilities, and a decrease in averageinvested assets. For additional information, see ‘‘Investments — Investment Results.’’
Net realized capital gains (losses) can be volatile due to mark-to-market adjustments of certain invested assets, otherthan temporary impairments of invested assets and our decision to sell invested assets. Net realized capital lossesdecreased primarily due to mark-to-market gains versus losses on fixed maturities and equity securities classified astrading and higher gains on sales of fixed maturities. For additional information, see ‘‘Investments — InvestmentResults.’’
Total ExpensesBenefits, claims and settlement expenses decreased $538.1 million for our Retirement and Investor Services
segment, primarily due to a decrease in our investment only business resulting from our decision to scale back thisbusiness and lower variable crediting rates. Also contributing to the decline within the segment was a decrease in thechange in reserves resulting from lower sales of annuities with life contingencies in our full service payout and individualannuities businesses. In addition, benefits, claims and settlement expenses decreased $257.4 million for our PrincipalInternational segment, primarily due to lower interest crediting rates to customers in Chile, which were impacted bydeflation, and the weakening of the Chilean peso against the U.S. dollar.
Despite a $177.0 million increase in employee defined benefit pension and other postretirement benefit costs,operating expenses (excluding the impacts of DPAC and commissions) for our organization decreased as a result ofcompany-wide expense savings initiatives. Retirement and Investor Services operating expenses decreased $358.5 million,primarily due to a decrease in DPAC amortization related to favorable true-up impacts from equity markets in 2009compared to unfavorable true-up impacts from equity markets in 2008. In addition, lower commission expense and feespaid to advisors stemming from a decrease in average account values in our Principal Funds business contributed to adecline in segment operating expenses. Furthermore, operating expenses decreased $115.6 million for the U.S. InsuranceSolutions segment, primarily due to lower DPAC amortization and lower non-deferred sales-related expenses in ourindividual life insurance business.
Income TaxesThe effective income tax rates were 13% and �1% for the years ended December 31, 2009 and 2008, respectively.
The effective income tax rate for the year ended December 31, 2009, was lower than the U.S. statutory rate primarily dueto income tax deductions allowed for corporate dividends received, taxes on our share of earnings generated from equitymethod investments reflected in net investment income and the interest exclusion from taxable income. The effectiveincome tax rate for the year ended December 31, 2008, was lower than the U.S. statutory rate primarily due to income taxdeductions allowed for corporate dividends received, interest exclusion from taxable income and additional U.S. foreigntax credits resulting from the second quarter 2008 enactment of legislation to increase the Brazilian tax rate. The effectiveincome tax rate increased to 13% from �1% for the years ended December 31, 2009 and 2008, respectively, primarilydue to a decrease in our net realized capital losses with no proportionate change in permanent items and additional U.S.foreign tax credits reflected in 2008 resulting from the Brazilian tax rate increase. The net increase in deferred taxliabilities associated with the 2008 enacted Brazilian income tax rate is reflected in net investment income because theequity method of accounting is applied to our Brazilian operations; however, the benefit from additional U.S. foreign taxcredits is reflected in income tax expense.
Results of Operations by SegmentFor results of operations by segment see Item 8. ‘‘Financial Statements and Supplementary Data, Notes to
Consolidated Financial Statements, Note 16, Segment Information.’’
Retirement and Investor Services SegmentRetirement and Investor Services Trends
Account values are a key indicator of earnings growth for the segment, as account values are the base by which thesegment generates its fee and spread-based profits. Net cash flow and market performance are the two main drivers ofaccount value growth. Net cash flow reflects the segment’s ability to attract and retain client deposits. Marketperformance reflects not only the equity market performance, but also the investment performance of fixed incomeinvestments supporting our spread business. The percentage growth in earnings of the segment should generally track thepercentage growth in account values. This trend may vary due to changes in business and/or product mix.
The following table presents the Retirement and Investor Services account value rollforward for the years indicated:
For the year endedDecember 31,
2010 2009 2008
(in billions)Account values, beginning of period . . . . . . . . . . . . . . . . . . . . . . . . . . . . . . . . . . . . . . . . . . . . . . . . $163.9 $146.1 $180.8Net cash flow (1) . . . . . . . . . . . . . . . . . . . . . . . . . . . . . . . . . . . . . . . . . . . . . . . . . . . . . . . . . . . . (2.1) (3.4) 5.0Credited investment performance . . . . . . . . . . . . . . . . . . . . . . . . . . . . . . . . . . . . . . . . . . . . . . . . . 17.1 22.3 (37.6)Other . . . . . . . . . . . . . . . . . . . . . . . . . . . . . . . . . . . . . . . . . . . . . . . . . . . . . . . . . . . . . . . . . . . (0.6) (1.1) (2.1)
Account values, end of period . . . . . . . . . . . . . . . . . . . . . . . . . . . . . . . . . . . . . . . . . . . . . . . . . . . . $178.3 $163.9 $146.1
(1) Includes net cash flow of $(3.7) and $(5.2) billion for the years ended December 31, 2010 and 2009, respectively, resulting from thedecision to scale back our investment only business.
44
Retirement and Investor Services Segment Summary Financial Data
The following table presents certain summary financial data relating to the Retirement and Investor Servicessegment for the years indicated:
For the year endedDecember 31, Increase (decrease)
2010 2009 2008 2010 vs. 2009 2009 vs. 2008
(in millions)Operating revenues:
Premiums and other considerations . . . . . . . . . . . . . . . . . . . . . . $ 332.2 $ 247.2 $ 523.2 $ 85.0 $(276.0)Fees and other revenues . . . . . . . . . . . . . . . . . . . . . . . . . . . . . 1,361.3 1,243.9 1,455.1 117.4 (211.2)Net investment income . . . . . . . . . . . . . . . . . . . . . . . . . . . . . . 2,430.9 2,550.4 2,820.1 (119.5) (269.7)
Total operating revenues . . . . . . . . . . . . . . . . . . . . . . . . . . . . 4,124.4 4,041.5 4,798.4 82.9 (756.9)Expenses:
Benefits, claims and settlement expenses, including dividends topolicyholders . . . . . . . . . . . . . . . . . . . . . . . . . . . . . . . . . . . 2,128.7 2,217.5 2,711.5 (88.8) (494.0)
Operating expenses . . . . . . . . . . . . . . . . . . . . . . . . . . . . . . . . 1,240.8 1,169.4 1,417.2 71.4 (247.8)
Total expenses . . . . . . . . . . . . . . . . . . . . . . . . . . . . . . . . . . 3,369.5 3,386.9 4,128.7 (17.4) (741.8)
Operating earnings before income taxes . . . . . . . . . . . . . . . . . . . . . 754.9 654.6 669.7 100.3 (15.1)Income taxes . . . . . . . . . . . . . . . . . . . . . . . . . . . . . . . . . . . . . . 170.5 144.2 138.2 26.3 6.0Operating earnings attributable to noncontrolling interest . . . . . . . . . . — — 0.2 — (0.2)
Operating earnings . . . . . . . . . . . . . . . . . . . . . . . . . . . . . . . . . . $ 584.4 $ 510.4 $ 531.3 $ 74.0 $ (20.9)
Year Ended December 31, 2010 Compared to Year Ended December 31, 2009
Operating Earnings
Operating earnings increased $48.9 million and $16.2 million in our full service accumulation and Principal Fundsbusinesses, respectively, primarily due to higher fees stemming from an increase in average account values, which resultedfrom continuing equity market improvement since the latter half of 2009. In addition, operating earnings increased in ourPrincipal Fund business due to strong cash flows into the Global Diversified Income Fund, Preferred Securities Fund andHigh Yield Fund. Furthermore, operating earnings increased $17.8 million in our individual annuities business due to anincrease in average account values, which resulted from continuing equity market improvement since the latter half of2009 and growth in this block of business. Partially offsetting the increase in operating earnings was an $18.5 milliondecrease in our investment only business primarily due to an opportunistic early extinguishment of medium-term notes in2009 with limited corresponding activity in 2010.
Operating Revenues
Premiums increased $49.0 million in our full service payout business primarily due to an increase in sales of singlepremium group annuities with life contingencies. The single premium product, which is typically used to fund definedbenefit plan terminations, can generate large premiums from very few customers and therefore tends to vary from periodto period. In addition, premiums increased $36.0 million in our individual annuities business primarily due to an increasein sales of annuities with life contingencies.
Fees increased $73.0 million and $16.6 million in our full service accumulation and individual annuities businesses,respectively, primarily due to higher fee income stemming from an increase in average account values as a result ofcontinuing equity market improvement since the latter half of 2009. In addition, fees increased $51.6 million in ourPrincipal Funds business primarily due to an increase in management fee income and distribution income stemming froman increase in sales and average account values, which primarily resulted from continuing equity market improvementsince the latter half of 2009. Partially offsetting the increase in fees was a $26.8 million decrease in our investment onlybusiness primarily due to fees received in 2009 relating to an opportunistic early extinguishment of medium-term noteswith limited corresponding activity in 2010.
Net investment income decreased primarily due to a decrease in average invested assets, excluding the fair valueadjustment associated with fixed maturities and equity securities, resulting from our decision to scale back our investmentonly business.
Total Expenses
Benefits, claims and settlement expenses decreased $123.1 million in our investment only business primarily due to adecrease in cost of interest credited stemming from lower variable crediting rates and a decline in average account values,which primarily resulted from our decision to scale back this business. In addition, benefits, claims and settlementexpenses decreased $41.4 million in our full service accumulation business primarily due to a decrease in cost of interestcredited stemming from lower variable crediting rates. Partially offsetting the decrease in benefits, claims and settlementexpenses was a $45.4 million increase in our full service payout business primarily due to an increase in change of reservesresulting from an increase in sales of single premium group annuities with life contingencies. Furthermore, benefits,claims and settlement expenses increased $31.6 million in our individual annuities business primarily due to an increase in
45
change of reserves resulting from higher sales of annuities with life contingencies and continued growth in the block ofbusiness.
Operating expenses in our full service accumulation business increased $34.7 million primarily due to an increase inDPAC amortization expense resulting from more favorable DPAC unlocking in 2009. In addition, operating expensesincreased $24.1 million in our Principal Funds business primarily due to higher distribution expenses resulting from anincrease in sales and average account values. Furthermore, operating expenses in our individual annuities businessincreased $16.7 million primarily due to an increase in DPAC amortization expense resulting from continued growth inthe block of business.
Income Taxes
The effective income tax rates for the segment were 23% and 22% for the years ended December 31, 2010 and 2009,respectively. The effective income tax rates were lower than the U.S. statutory rate primarily as a result of income taxdeductions allowed for corporate dividends received and the interest exclusion from taxable income.
Year Ended December 31, 2009 Compared to Year Ended December 31, 2008
Operating Earnings
Operating earnings in our investment only and full service payout businesses decreased $38.6 million and$18.5 million, respectively, primarily due to a decrease in spread between net investment income and interest credited topolicyholders. In addition, operating earnings in our full service accumulation business decreased $13.5 million primarilydue to lower fee income resulting from an equity market driven decrease in average account values in 2009 compared to2008 and an increase in employee defined benefit pension and other postretirement benefit costs. The decline in our fullservice accumulation business was partially offset by a decrease in DPAC amortization related to favorable true-upimpacts from equity markets in 2009 compared to unfavorable true-up impacts from equity markets in 2008. Partiallyoffsetting the decrease in segment operating earnings was a $47.0 million increase in our individual annuities businessprimarily due to a decrease in DPAC amortization related to favorable true-up impacts from equity markets in 2009compared to unfavorable true-up impacts from equity markets in 2008.
Operating Revenues
Premiums decreased $170.1 million in our individual annuities business primarily due to a decrease in sales ofannuities with life contingencies resulting from increasing competition. Premiums in our full service payout businessdecreased $105.9 million primarily due to a decrease in sales of single premium group annuities with life contingencies.The single premium group annuity product, which is typically used to fund defined benefit plan terminations, cangenerate large premiums from very few customers and therefore tends to vary from period to period.
Fees in our full service accumulation business decreased $106.0 million primarily resulting from an equity market-driven decrease in average account values in 2009 compared to 2008 and shifts in the mix of business. Fees in ourPrincipal Funds business decreased $97.7 million primarily due to a decline in distribution income and management feeincome resulting from an equity market-driven decrease in average account values in 2009 compared to 2008.
Net investment income decreased primarily due to lower investment returns on invested assets and cash related toour more liquid investment strategy for the segment.
Total Expenses
Benefits, claims and settlement expenses decreased $282.3 million in our investment only business primarily due toour decision to scale back this business and lower variable crediting rates. In addition, our full service payout businessbenefits, claims and settlement expenses decreased $106.1 million primarily due to a decrease in the change in reservesresulting from lower sales of annuities with life contingencies. Furthermore, benefits, claims and settlement expensesdecreased $96.9 million in our individual annuities business primarily due to a decrease in the change in reserves resultingfrom lower sales of annuities with life contingencies, partially offset by an increase in interest credited and an increase inbenefit expense related to a growing block of fixed annuities.
Operating expenses in our full service accumulation business decreased $104.2 million primarily due to a decrease inDPAC amortization related to favorable true-up impacts from equity markets in 2009 compared to unfavorable true-upimpacts from equity markets in 2008, which was partially offset by an increase in employee defined benefit pension andother postretirement benefit costs. To a lesser extent, a decrease in expenses due to expense savings initiatives and lowerfees paid to advisors, which resulted from a decrease in average account values, contributed to the decline in operatingexpenses in our full service accumulation business. In addition, operating expenses within Principal Funds decreased$87.5 million primarily due to lower commission expense and fees paid to advisors resulting from a decrease in averageaccount values. Furthermore, operating expenses in our individual annuities business decreased $46.3 million primarilydue to a decrease in DPAC amortization related to favorable true-up impacts from equity markets in 2009 compared tounfavorable true-up impacts from equity markets in 2008. Also, to a lesser extent, a decrease in non-deferred commissionexpense resulting from a decline in sales of annuities with life contingencies contributed to the decrease in operatingexpenses within our individual annuities business.
46

Income Taxes
The effective income tax rates for the segment were 22% and 21% for the years ended December 31, 2009 and 2008,respectively. The effective income tax rates were lower than the U.S. statutory rate primarily as a result of income taxdeductions allowed for corporate dividends received and the interest exclusion from taxable income.
Principal Global Investors Segment
Principal Global Investors Trends
Our overall AUM increased $14.8 billion in 2010 primarily due to improved market performance. While we havecontinued to experience success in winning institutional asset management mandates and other client deposits, we havealso continued to see client withdrawals driven by portfolio rebalancing and asset allocation strategies and client mergers.
The following table provides a summary of Principal Global Investor’s affiliated and third-party AUM as of theperiods indicated:
Principal Global Investors
Affiliated Third-partyAs of AUM AUM Total AUM
(in billions)December 31, 2010 . . . . . . . . . . . . . . . . . . . . . . . . . . . . . . . . . . . . . . . . . . . . . . . . . . $141.4 $78.7 $220.1December 31, 2009 . . . . . . . . . . . . . . . . . . . . . . . . . . . . . . . . . . . . . . . . . . . . . . . . . . 131.5 73.8 205.3December 31, 2008 . . . . . . . . . . . . . . . . . . . . . . . . . . . . . . . . . . . . . . . . . . . . . . . . . . 119.7 70.3 190.0
Principal Global Investors Segment Summary Financial Data
AUM is a key indicator of earnings growth for our Principal Global Investors segment, as AUM is the base by whichwe generate revenues. Net cash flow and market performance are the two main drivers of AUM growth. Net cash flowreflects our ability to attract and retain client deposits. Market performance reflects equity, fixed income and real estatemarket performance. The percentage growth in earnings of the segment will generally track with the percentage growthin AUM. This trend may vary due to changes in business and/or product mix.
The following table presents the AUM rollforward for assets managed by Principal Global Investors for the yearsindicated:
For the year endedDecember 31,
2010 2009 2008
(in billions)AUM, beginning of period . . . . . . . . . . . . . . . . . . . . . . . . . . . . . . . . . . . . . . . . . . . . . . . . . . . . . . $205.3 $190.0 $236.0Net cash flow (1) . . . . . . . . . . . . . . . . . . . . . . . . . . . . . . . . . . . . . . . . . . . . . . . . . . . . . . . . . . . . (7.0) (7.7) 3.3Investment performance . . . . . . . . . . . . . . . . . . . . . . . . . . . . . . . . . . . . . . . . . . . . . . . . . . . . . . . 22.3 28.5 (46.0)Operations disposed (2) . . . . . . . . . . . . . . . . . . . . . . . . . . . . . . . . . . . . . . . . . . . . . . . . . . . . . . . — (3.8) —Other . . . . . . . . . . . . . . . . . . . . . . . . . . . . . . . . . . . . . . . . . . . . . . . . . . . . . . . . . . . . . . . . . . . (0.5) (1.7) (3.3)
AUM, end of period . . . . . . . . . . . . . . . . . . . . . . . . . . . . . . . . . . . . . . . . . . . . . . . . . . . . . . . . . . $220.1 $205.3 $190.0
(1) Includes net cash flow of $(3.7) billion and $(5.2) billion for the year ended December 31, 2010 and 2009, respectively, resulting from theRetirement and Investor Services segment’s decision to scale back its investment only business.
(2) Includes disposition of certain asset management contracts within Post Advisory Group, LLC in 2009.
The following table presents certain summary financial data relating to the Principal Global Investors segment forthe years indicated:
For the year endedDecember 31, Increase (decrease)
2010 2009 2008 2010 vs. 2009 2009 vs. 2008
(in millions)Operating revenues:
Fees and other revenues . . . . . . . . . . . . . . . . . . . . . . . . . . . . . . . . $467.2 $429.2 $577.3 $38.0 $(148.1)Net investment income . . . . . . . . . . . . . . . . . . . . . . . . . . . . . . . . . 14.2 10.2 21.2 4.0 (11.0)
Total operating revenues . . . . . . . . . . . . . . . . . . . . . . . . . . . . . . . 481.4 439.4 598.5 42.0 (159.1)Expenses:
Total expenses . . . . . . . . . . . . . . . . . . . . . . . . . . . . . . . . . . . . . 384.2 375.6 442.9 8.6 (67.3)
Operating earnings before income taxes . . . . . . . . . . . . . . . . . . . . . . . . 97.2 63.8 155.6 33.4 (91.8)Income taxes . . . . . . . . . . . . . . . . . . . . . . . . . . . . . . . . . . . . . . . . . 33.7 21.0 50.9 12.7 (29.9)Operating earnings attributable to noncontrolling interest . . . . . . . . . . . . . 5.0 4.6 10.3 0.4 (5.7)
Operating earnings . . . . . . . . . . . . . . . . . . . . . . . . . . . . . . . . . . . . . $ 58.5 $ 38.2 $ 94.4 $20.3 $ (56.2)
47

Year Ended December 31, 2010 Compared to Year Ended December 31, 2009
Operating Earnings
Operating earnings increased primarily due to higher fee revenues driven by an increase in average AUM as a resultof continued market improvement since the latter half of 2009. In addition, operating earnings increased due to higherborrower fees from our real estate business resulting from higher transaction volumes and higher servicing fees.
Operating Revenues
Fees increased primarily due to an increase in average AUM as well as higher borrower fees from our real estatebusiness.
Net investment income increased primarily due to losses in our equity method investment in 2009 with very littleactivity in 2010.
Total Expenses
Total expenses increased primarily due to higher staff related costs resulting from higher compensation expense,which was partially offset by lower intangible amortization expense as certain intangibles were fully amortized as ofDecember 31, 2009.
Income Taxes
The effective income tax rates for the segment were 35% and 33% for the years ended December 31, 2010 and 2009,respectively. The effective income tax rate was lower than the U.S. statutory rate for the year ended December 31, 2009,primarily due to inclusion of income attributable to noncontrolling interest in pre-tax operating earnings with nocorresponding change in income taxes reported by us as the controlling interest.
Year Ended December 31, 2009 Compared to Year Ended December 31, 2008
Operating Earnings
Operating earnings decreased primarily due to a decline in performance fee revenues. In addition, the severedownturn in global financial markets in the latter half of 2008 led to a significant reduction in our AUM and revenuesrelative to early 2008 levels and thus a reduction in 2009 operating earnings. Additionally, we sold certain assetmanagement contracts to a non-affiliated entity in the first quarter of 2009, resulting in lower fee revenues. Thesedeclines were offset in part by a series of expense management initiatives, which had been undertaken in response to themarket downturn.
Operating Revenues
Fees decreased primarily due to a decrease in AUM as well as the 2009 sale of certain asset management contractswithin Post Advisory Group, LLC. In addition, a performance fee was earned in the fourth quarter of 2008 related toperformance delivered over the previous five years, with no corresponding fee earned in 2009. Borrower fees and realestate transaction fees decreased due to a decline in real estate activity.
Net investment income decreased as a result of lower investment income earned on our loan portfolio and a declinein the interest rate environment.
Total Expenses
Total expenses decreased due to lower staff related costs resulting from lower head count, lower incentivecompensation paid on performance fees due to a decrease in fees received in 2009 compared to 2008 and other expensemanagement initiatives.
Income Taxes
The effective income tax rate for the segment was 33% for both the years ended December 31, 2009 and 2008. Theeffective income tax rate was lower than the U.S. statutory rate, primarily due to inclusion of income attributable tononcontrolling interest in pre-tax operating earnings with no corresponding change in income taxes reported by us as thecontrolling interest.
Principal International Segment
Principal International Trends
Our Principal International businesses focus on countries with favorable demographics and growing long-termsavings and defined contribution markets. With variations depending upon the specific country, we have targeted thesemarkets for sales of retirement and related products and services, including defined contribution pension plans, annuitiesand mutual funds to businesses and individuals. In some of our international markets, we complement our sales of theseproducts with institutional asset management and life insurance accumulation products.
We have pursued our international strategy through a combination of start-ups, acquisitions and joint ventures,which require infusions of capital consistent with our strategy of long-term growth and profitability.
48

Principal International Segment Summary Financial Data
AUM is a key indicator of earnings growth for the segment, as AUM is the base by which we can generate localcurrency profits. Net customer cash flow and market performance are the two main drivers of local currency AUMgrowth. Net customer cash flow reflects our ability to attract and retain client deposits. Market performance reflects theinvestment returns on our underlying AUM. The percentage growth or decline in the earnings of our PrincipalInternational segment will generally track with the percentage growth or decline in AUM. This trend may vary due tochanges in business and/or product mix. Our financial results are also impacted by fluctuations of the foreign currency toU.S. dollar exchange rates for the countries in which we have business. AUM of our foreign subsidiaries is translated intoU.S. dollar equivalents at the end of the reporting period using the spot foreign exchange rates. Revenue and expensesfor our foreign subsidiaries are translated into U.S. dollar equivalents at the average foreign exchange rates for thereporting period.
The following table presents the Principal International segment AUM rollforward for the years indicated:
For the year endedDecember 31,
2010 2009 2008
(in billions)AUM, beginning of period . . . . . . . . . . . . . . . . . . . . . . . . . . . . . . . . . . . . . . . . . . . . . . . . . . . . . . . . $34.6 $23.1 $28.7Net cash flow . . . . . . . . . . . . . . . . . . . . . . . . . . . . . . . . . . . . . . . . . . . . . . . . . . . . . . . . . . . . . . . . 4.7 3.2 1.0Investment performance . . . . . . . . . . . . . . . . . . . . . . . . . . . . . . . . . . . . . . . . . . . . . . . . . . . . . . . . . 4.1 4.0 (1.6)Effect of exchange rates . . . . . . . . . . . . . . . . . . . . . . . . . . . . . . . . . . . . . . . . . . . . . . . . . . . . . . . . . . 1.9 4.5 (5.0)Other . . . . . . . . . . . . . . . . . . . . . . . . . . . . . . . . . . . . . . . . . . . . . . . . . . . . . . . . . . . . . . . . . . . . . 0.5 (0.2) —
AUM, end of period . . . . . . . . . . . . . . . . . . . . . . . . . . . . . . . . . . . . . . . . . . . . . . . . . . . . . . . . . . . . $45.8 $34.6 $23.1
The following table presents certain summary financial data of the Principal International segment for the yearsindicated:
For the year endedDecember 31, Increase (decrease)
2010 2009 2008 2010 vs. 2009 2009 vs. 2008
(in millions)Operating revenues:
Premiums and other considerations . . . . . . . . . . . . . . . . . . . . . . . . . . $255.2 $239.1 $204.1 $ 16.1 $ 35.0Fees and other revenues . . . . . . . . . . . . . . . . . . . . . . . . . . . . . . . . 147.7 116.0 123.1 31.7 (7.1)Net investment income . . . . . . . . . . . . . . . . . . . . . . . . . . . . . . . . . 377.0 207.0 521.8 170.0 (314.8)
Total operating revenues . . . . . . . . . . . . . . . . . . . . . . . . . . . . . . . 779.9 562.1 849.0 217.8 (286.9)Expenses:
Benefits, claims and settlement expenses . . . . . . . . . . . . . . . . . . . . . . 497.2 327.6 586.6 169.6 (259.0)Operating expenses . . . . . . . . . . . . . . . . . . . . . . . . . . . . . . . . . . . . 145.1 115.2 152.5 29.9 (37.3)
Total expenses . . . . . . . . . . . . . . . . . . . . . . . . . . . . . . . . . . . . . 642.3 442.8 739.1 199.5 (296.3)
Operating earnings before income taxes . . . . . . . . . . . . . . . . . . . . . . . . 137.6 119.3 109.9 18.3 9.4Income taxes (benefits) . . . . . . . . . . . . . . . . . . . . . . . . . . . . . . . . . . . (0.4) 0.5 (14.5) (0.9) 15.0Operating earnings (losses) attributable to noncontrolling interest . . . . . . . . 1.1 (0.1) (1.9) 1.2 1.8
Operating earnings . . . . . . . . . . . . . . . . . . . . . . . . . . . . . . . . . . . . . $136.9 $118.9 $126.3 $ 18.0 $ (7.4)
Year Ended December 31, 2010 Compared to Year Ended December 31, 2009
Operating Earnings
Operating earnings increased primarily due to the strengthening of the Latin America currencies against the U.S.dollar, higher investment returns on assets not backing segment insurance products as a result of inflation in Chile during2010 compared to deflation in 2009 and higher fee revenues driven by higher average AUM as a result of net customercash flows and market performance. These increases were partially offset by 2009 expense savings initiatives to align with2009 revenues and lower earnings in our equity method investment in Brazil as a result of the reduction in our economicinterest.
Operating Revenues
Premiums in Chile increased $15.7 million primarily due to the strengthening of the Chilean peso against the U.S.dollar, which was partially offset by lower sales of single premium annuities with life contingencies.
Fees and other revenues in Mexico and Chile collectively increased $25.5 million primarily due to higher investmentmanagement fees driven by higher average AUM as a result of local market performance and net customer cash flows. Inaddition, fees and other revenues increased due to the strengthening of the Latin American currencies against the U.S.dollar.
49

Net investment income in Chile increased $169.8 primarily due to higher inflation-based investment returns onaverage invested assets and cash as a result of inflation in 2010 compared to deflation in 2009 and the strengthening ofthe Chilean peso against the U.S. dollar.
Total Expenses
Benefits, claims and settlement expenses in Chile increased $166.8 million primarily due to higher inflation-basedinterest crediting rates to customers and the strengthening of the Chilean peso against the U.S. dollar.
Operating expenses increased primarily due to 2009 expense savings initiatives to align with 2009 revenues, higherDPAC amortization resulting from net unlocking and true-up adjustments in Mexico and the strengthening of the LatinAmerica currencies against the U.S. dollar.
Income Taxes
The effective income tax rate for the segment was 0% for both the years ended December 31, 2010 and 2009. Theeffective income tax rate was lower than the U.S. statutory rate primarily due to taxes on our share of earnings generatedfrom our equity method investments. Specifically, our share of earnings generated from equity method investments, netof foreign taxes incurred, are reported within net investment income whereas any residual U.S. tax expense or benefitrelated to equity method investments is reported in income taxes. Lower tax rates of foreign jurisdictions also contributedto the lower effective income tax rate.
Year Ended December 31, 2009 Compared to Year Ended December 31, 2008
Operating Earnings
Operating earnings decreased primarily due to lower investment returns on assets not backing segment insuranceproducts as a result of deflation in Chile during 2009 coupled with weakening currencies in Latin America. Thesedecreases were partially offset by increased earnings in our equity method investment in Brazil as a result of higher feerevenues and realized investment gains coupled with expense savings initiatives for the segment in 2009.
Operating Revenues
Premiums in Chile increased $35.3 million primarily due to higher sales of single premium annuities with lifecontingencies in the first half of 2009, which was partially offset by the weakening of the Chilean peso against the U.S.dollar.
Fees and other revenues in Mexico decreased $8.2 million primarily due to the weakening of the Mexican pesoagainst the U.S. dollar, which was partially offset by higher investment management fees driven by higher AUM.
Net investment income decreased in Chile primarily due to lower inflation-based investment returns on averageinvested assets and cash as a result of deflation in 2009 and the weakening of the Chilean peso against the U.S. dollar.
Total Expenses
Benefits, claims and settlement expenses decreased $247.3 million in Chile, primarily due to lower inflation-basedinterest crediting rates to customers, and the weakening of the Chilean peso against the U.S. dollar.
Operating expenses decreased primarily due to expense savings efforts in 2009, the weakening of the Latin Americacurrencies against the U.S. dollar, a reduction in fund expenses passed to our asset management company in India andlower PVFP and DPAC amortization resulting from net unlocking and true-up adjustments in Mexico.
Income Taxes
The effective income tax rates for the segment were 0% and �13% for the years ended December 31, 2009 and2008, respectively. The effective income tax rate for the year ended December 31, 2009, was lower than the U.S. statutoryrate primarily due to taxes on our share of earnings generated from our equity method investments that are included innet investment income and the lower tax rates of foreign jurisdictions. The effective income tax rate for the year endedDecember 31, 2008, was lower than the U.S. statutory rate primarily due to additional U.S. foreign tax credits resultingfrom the second quarter 2008 enactment of legislation to increase the Brazilian tax rate, taxes on our share of earningsgenerated from our equity method investments being reflected in net investment income and the lower tax rates offoreign jurisdictions. The net increase in deferred tax liabilities associated with the 2008 enacted Brazilian income tax rateis reflected in net investment income because the equity method of accounting is applied to our Brazilian operations;however, the benefit from additional U.S. foreign tax credits is reflected in income tax expense, the result of which was adecrease to the effective income tax rate.
50

U.S. Insurance Solutions Segment
Individual Life Insurance Trends
Our life insurance premiums are influenced by both economic and industry trends. In addition, we continue to shiftour marketing emphasis to universal life insurance products from traditional life insurance products. Due to this shift inmarketing emphasis, premiums related to our traditional life insurance products have declined, while fee revenues fromour universal and variable universal life insurance products have grown.
The following table provides a summary of our individual universal and variable universal life insurance fee revenuesand our individual traditional life insurance premiums for the years indicated:
Universal andvariable universal life Traditional
insurance life insurance
For the year ended Fee revenues Premiums
(in millions)December 31, 2010 . . . . . . . . . . . . . . . . . . . . . . . . . . . . . . . . . . . . . . . . . . . . . . . . . . $382.5 $517.9December 31, 2009 . . . . . . . . . . . . . . . . . . . . . . . . . . . . . . . . . . . . . . . . . . . . . . . . . . 354.4 557.3December 31, 2008 . . . . . . . . . . . . . . . . . . . . . . . . . . . . . . . . . . . . . . . . . . . . . . . . . . 338.8 591.7
Specialty Benefits Insurance Trends
Premium and fee growth for the individual disability line of our specialty benefits insurance business was driven bysolid sales and retention. The group lines, however, experienced a decline between 2009 and 2010 due to decreases inmembership of existing employer customers, as well as slightly lower sales as we maintained pricing discipline in a verycompetitive environment.
The following table provides a summary of our specialty benefits insurance premium and fees for the years indicated:
Premium and fees
Group IndividualGroup dental and Group life disability disability
For the year ended vision insurance insurance insurance insurance
(in millions)December 31, 2010 . . . . . . . . . . . . . . . . . . . . . . . . . . . . . . . . . . . . . . $518.9 $315.0 $265.6 $196.5December 31, 2009 . . . . . . . . . . . . . . . . . . . . . . . . . . . . . . . . . . . . . . 539.9 333.2 290.8 181.6December 31, 2008 . . . . . . . . . . . . . . . . . . . . . . . . . . . . . . . . . . . . . . 557.3 348.2 303.5 172.6
U.S. Insurance Solutions Segment Summary Financial Data
There are several key indicators for earnings growth in our U.S. Insurance Solutions business. The ability of ourdistribution channels to generate new sales and retain existing business drives growth in our block of business, premiumrevenue and fee revenues. Our earnings growth also depends on our ability to price our products at a level that enables usto earn a margin over the cost of providing benefits and the expense of acquiring and administering those products.Factors impacting pricing decisions include competitive conditions, persistency, our ability to assess and manage trends inmortality and morbidity and our ability to manage operating expenses.
The following table presents certain summary financial data relating to the U.S. Insurance Solutions segment for theyears indicated:
For the year endedDecember 31, Increase (decrease)
2010 2009 2008 2010 vs. 2009 2009 vs. 2008
(in millions)Operating revenues:
Premiums and other considerations . . . . . . . . . . . . . . . . . . . . . . $1,685.7 $1,776.6 $1,866.3 $(90.9) $(89.7)Fees and other revenues . . . . . . . . . . . . . . . . . . . . . . . . . . . . . 422.7 399.2 382.5 23.5 16.7Net investment income . . . . . . . . . . . . . . . . . . . . . . . . . . . . . . 666.7 636.8 644.8 29.9 (8.0)
Total operating revenues . . . . . . . . . . . . . . . . . . . . . . . . . . . . 2,775.1 2,812.6 2,893.6 (37.5) (81.0)Expenses:
Benefits, claims and settlement expenses . . . . . . . . . . . . . . . . . . . 1,718.0 1,651.2 1,635.8 66.8 15.4Dividends to policyholders . . . . . . . . . . . . . . . . . . . . . . . . . . . . 218.4 239.4 265.7 (21.0) (26.3)Operating expenses . . . . . . . . . . . . . . . . . . . . . . . . . . . . . . . . 553.5 620.1 684.5 (66.6) (64.4)
Total expenses . . . . . . . . . . . . . . . . . . . . . . . . . . . . . . . . . . 2,489.9 2,510.7 2,586.0 (20.8) (75.3)
Operating earnings before income taxes . . . . . . . . . . . . . . . . . . . . . 285.2 301.9 307.6 (16.7) (5.7)Income taxes . . . . . . . . . . . . . . . . . . . . . . . . . . . . . . . . . . . . . . 91.5 97.8 99.6 (6.3) (1.8)
Operating earnings . . . . . . . . . . . . . . . . . . . . . . . . . . . . . . . . . . $ 193.7 $ 204.1 $ 208.0 $(10.4) $ (3.9)
51

Year Ended December 31, 2010 Compared to Year Ended December 31, 2009
Operating Earnings
Operating earnings in our U.S. Insurance Solutions segment decreased primarily due to lowering our long-terminterest rate assumptions, which impacted reserves, DPAC and other actuarial balances in our individual life insurancebusiness.
Operating Revenues
Premiums decreased $47.3 million in our specialty benefits insurance business due to a decrease in membershipdriven by lapses exceeding sales during the first half of the year and a slight decline in existing-case covered lives.Premiums decreased $43.6 million in our individual life insurance business primarily due to the expected continueddecline from the decreasing block of traditional life insurance business.
Fees and other revenues increased $25.7 million in our individual life insurance business due to growth in theuniversal life and variable universal life lines of business.
Net investment income increased primarily due to an increase in average annualized investment yields and, to alesser extent, an increase in average invested assets.
Total Expenses
Benefits, claims and settlement expenses increased $96.2 million in our individual life insurance business as a resultof higher gross claims and larger increases in reserves. While a substantial amount of the higher gross claims are offset bythe benefit of reinsurance, under U.S. GAAP we defer much of the benefit of reinsurance, which causes an increase inreported net benefits in the current period and lower DPAC amortization. Partially offsetting this increase in benefits,claims and settlement expenses was a decrease of $29.4 million in our specialty benefits insurance business due to adecrease in membership.
Dividends to policyholders decreased $21.0 million, primarily from updating the policyholder dividend scale toreflect the experience of the Closed Block.
Operating expenses decreased $55.4 million in our individual life insurance business primarily related to lowerDPAC amortization, which was offset by a corresponding increase in gross claims.
Income Taxes
The effective income tax rate for the segment was 32% for both the years ended December 31, 2010 and 2009. Theeffective income tax rate was lower than the U.S. statutory rate as a result of the interest exclusion from taxable incomeand income tax deductions allowed for corporate dividends received.
Year Ended December 31, 2009 Compared to Year Ended December 31, 2008
Operating Earnings
Operating earnings in our specialty benefits insurance business decreased $19.9 million, primarily due to an increasein employee defined benefit pension and other postretirement benefit costs and the adverse impacts of the economicenvironment on investment income and premium growth. In addition, this decrease was due to a favorable change inreserve assumptions related to our individual disability business in 2008, with no comparable change in 2009. Thedecrease in operating earnings for our specialty benefits insurance business was partially offset by a $16.0 million increasein our individual life insurance business due to lower DPAC amortization related to favorable true-up impacts fromequity markets in 2009 compared to unfavorable true-up impacts from equity markets in 2008 and lower non-deferredsales-related expenses.
Operating Revenues
Premiums decreased $54.7 million in our individual life insurance business primarily due to the expected continueddecline from the decreasing block of traditional life insurance business and an increase in reinsurance ceded on growingblocks of universal life and variable universal life insurance lines of business. Premiums decreased $35.0 million in ourspecialty benefits insurance business due to an increase in lapse rates in the first half of 2009, a decline in employmentlevels of our existing employer customers and a slight decrease in sales.
Fees and other revenues increased $17.8 million in our individual life insurance business due to growth in theuniversal life and variable universal life lines of business.
Net investment income decreased primarily due to lower investment returns on invested assets and cash related toour more liquid investment strategy for the segment.
52

Total Expenses
Benefits, claims and settlement expenses increased $26.9 million in our individual life insurance business due tohigher cost of interest credited related to growth in the universal life and variable universal life insurance lines of businessand an increase in death benefit costs net of reinsurance. Partially offsetting this increase in benefits, claims andsettlement expenses was an $11.5 million decrease in our specialty benefits insurance business due to a decrease inmembership.
Dividends to policyholders decreased $26.3 million, primarily from updating the policyholder dividend scale toreflect the experience of the Closed Block.
Operating expenses decreased $60.3 million in our individual life insurance business primarily related to lowerDPAC amortization and lower non-deferred sales-related expenses.
Income Taxes
The effective income tax rate for the segment was 32% for both the years ended December 31, 2009 and 2008. Theeffective income tax rate was lower than the U.S. statutory rate as a result of the interest exclusion from taxable incomeand income tax deductions allowed for corporate dividends received.
Corporate Segment
Corporate Segment Summary Financial Data
The following table presents certain summary financial data relating to the Corporate segment for the yearsindicated:
For the year endedDecember 31, Increase (decrease)
2010 2009 2008 2010 vs. 2009 2009 vs. 2008
(in millions)Operating revenues:
Total operating revenues . . . . . . . . . . . . . . . . . . . . . . . . . . . . . $(118.9) $(143.4) $(176.8) $24.5 $ 33.4Expenses:
Total expenses . . . . . . . . . . . . . . . . . . . . . . . . . . . . . . . . . . . . . 38.0 33.4 (32.1) 4.6 65.5
Operating losses before income taxes and preferred stock dividends . . . . . (156.9) (176.8) (144.7) 19.9 (32.1)Income tax benefits . . . . . . . . . . . . . . . . . . . . . . . . . . . . . . . . . . . (61.4) (71.4) (62.3) 10.0 (9.1)Preferred stock dividends . . . . . . . . . . . . . . . . . . . . . . . . . . . . . . . . 33.0 33.0 33.0 — —Operating earnings (losses) attributable to noncontrolling interest . . . . . . 0.2 (0.1) — 0.3 (0.1)
Operating losses . . . . . . . . . . . . . . . . . . . . . . . . . . . . . . . . . . . . . $(128.7) $(138.3) $(115.4) $ 9.6 $(22.9)
Year Ended December 31, 2010 Compared to Year Ended December 31, 2009
Operating Losses
Operating losses decreased due to an increase in earnings on average invested assets for the segment, representingcapital that has not been allocated to any other segment. This decrease was partially offset by higher interest expense oncorporate debt.
Income Taxes
Income tax benefits decreased due to a decrease in operating loss before income taxes.
Year Ended December 31, 2009 Compared to Year Ended December 31, 2008
Operating Losses
Operating losses increased due to higher interest expense on corporate debt as a result of the issuance of debt inMay 2009, which was partially offset by the maturity of corporate debt in August 2009. In addition, operating lossesincreased due to the release of state deferred income tax liabilities associated with the reorganization of certainsubsidiaries in 2008 with no corresponding activity in 2009.
Operating Revenues
Operating revenues increased due to a decrease in inter-segment eliminations included in this segment, which wasoffset by a corresponding change in total expenses.
53

24MAR201112140575
Total Expenses
Total expenses increased due to a decrease in inter-segment eliminations included in this segment, which was offsetby a corresponding change in operating revenues. In addition, total expenses increased due to higher interest expense oncorporate debt as a result of the issuance of debt in May 2009, which was partially offset by the maturity of corporate debtin August 2009.
Income Taxes
Income tax benefits increased due to an increase in operating loss before income taxes. Partially offsetting theincreased income tax benefits was the release of state deferred income tax liabilities associated with the reorganization ofcertain subsidiaries in 2008 with no corresponding activity in 2009.
Liquidity and Capital Resources
Liquidity and capital resources represent the overall strength of a company and its ability to generate strong cashflows, borrow funds at a competitive rate and raise new capital to meet operating and growth needs. Our legal entitystructure has an impact on our ability to meet cash flow needs as an organization. Following is a simplified organizationalstructure.
OtherSubsidiaries
Principal LifeInsurance Company
Principal InternationalEntities
OtherSubsidiaries
Principal Financial Services, Inc.
Principal Financial Group, Inc.
Liquidity
Our liquidity requirements have been and will continue to be met by funds from consolidated operations as well asthe issuance of commercial paper, common stock, debt or other capital securities and borrowings from credit facilities.We believe that cash flows from these sources are sufficient to satisfy the current liquidity requirements of ouroperations, including reasonably foreseeable contingencies.
We maintain a level of cash and securities which, combined with expected cash inflows from investments andoperations, is believed to be adequate to meet anticipated short-term and long-term payment obligations. We willcontinue our prudent capital management practice of regularly exploring options available to us to maximize capitalflexibility, including accessing the capital markets and careful attention to and management of expenses.
As of December 31, 2010, approximately $11.7 billion, or 98%, of our institutional guaranteed investment contractsand funding agreements cannot be redeemed by contractholders prior to maturity. Our life insurance and annuityliabilities contain provisions limiting early surrenders. Given market conditions, we maintained a historically high positionof cash and cash equivalent holdings through much of 2009. As market conditions improved through 2010 we have beenreducing our cash and cash equivalent holdings. Our liquidity is also supported by a portfolio of U.S. government andagency and residential pass-through government-backed securities, of which we held $4.3 billion as of December 31, 2010,that may be utilized to bolster our liquidity position, as collateral for secured borrowing transactions with various thirdparties or by disposing of the securities in the open market, if needed.
As of December 31, 2010 and 2009, we had short-term credit facilities with various financial institutions in anaggregate amount of $719.8 million and $681.9 million, respectively. As of December 31, 2010 and 2009, we had$107.9 million and $101.6 million, respectively, of outstanding borrowings related to our credit facilities, with$28.4 million of assets pledged as support as of December 31, 2010. None of these credit arrangements, other than ourcommercial paper back-stop facility, are committed facilities. Due to the financial strength and the strong relationshipswe have with these providers, as well as the small size of these facilities, we are comfortable that there is a very low riskthat the financial institutions would not be able to fund these facilities. As of both December 31, 2010 and 2009, ourcredit facilities included a $579.0 million commercial paper program, of which $50.0 million and $75.0 million wasoutstanding as of December 31, 2010 and 2009, respectively. Our commercial paper program has a back-stop facility toprovide 100% support for our commercial paper program, of which there were no outstanding balances as ofDecember 31, 2010 and 2009. The back-stop facility is a five year facility that matures in June 2012. The facility issupported by fourteen banks, most if not all of which have other relationships with us. We have no reason to believe thatour current providers would be unable or unwilling to fund the facility if necessary.
54

The Holding Companies: Principal Financial Group, Inc. and Principal Financial Services, Inc. The principal sources offunds available to our parent holding company, PFG, to meet its obligations, including the payments of dividends oncommon stock, debt service and the repurchase of stock, are dividends from subsidiaries as well as its ability to borrowfunds at competitive rates and raise capital to meet operating and growth needs. Dividends from Principal Life, ourprimary subsidiary, are limited by Iowa law. Under Iowa laws, Principal Life may pay dividends only from the earnedsurplus arising from its business and must receive the prior approval of the Insurance Commissioner of the State of Iowa(‘‘the Commissioner’’) to pay stockholder dividends or make any other distribution if such distributions would exceedcertain statutory limitations. Iowa law gives the Commissioner discretion to disapprove requests for distributions in excessof these limits. In general, the current statutory limitations are the greater of (i) 10% of Principal Life’s statutorypolicyholder surplus as of the previous year-end or (ii) the statutory net gain from operations from the previous calendaryear. Based on these limitations, Principal Life could distribute approximately $509.7 million in 2011.
Principal Life could have paid approximately $608.7 million in statutory dividends in 2010 based on its 2009 statutoryfinancial results without being subject to the limitations on payment of stockholder dividends. No dividends were paid asof December 31, 2010; however, on June 21, 2010, Principal Life distributed paid-in and contributed surplus in theamount of $300.0 million to its parent company.
Principal Life could have paid approximately $651.3 million in statutory dividends in 2009 based on its 2008 statutoryfinancial results without being subject to the limitations on payment of stockholder dividends. On March 27, 2009, a$645.0 million ordinary dividend was paid by Principal Life to its parent company from internal sources of liquidity.Following our second quarter issuance of debt and equity, on May 20, 2009, a $500.0 million capital contribution wasmade to Principal Life from its parent company. An additional $300.0 million capital contribution was made to PrincipalLife from its parent company on December 31, 2009.
Principal Life could have paid approximately $686.5 million in statutory dividends in 2008 based on its 2007 statutoryfinancial results without being subject to the limitations on payment of stockholder dividends. Total stockholder dividendspaid by Principal Life to its parent company in 2008 were $5.5 million, which consisted of a non-cash dividend of anequity method investment.
Operations. Our primary consolidated cash flow sources are premiums from insurance products, pension andannuity deposits, asset management fee revenues, administrative services fee revenues, income from investments andproceeds from the sales or maturity of investments. Cash outflows consist primarily of payment of benefits topolicyholders and beneficiaries, income and other taxes, current operating expenses, payment of dividends topolicyholders, payments in connection with investments acquired, payments made to acquire subsidiaries, paymentsrelating to policy and contract surrenders, withdrawals, policy loans, interest expense and repayment of short-term debtand long-term debt. Our investment strategies are generally intended to provide adequate funds to pay benefits withoutforced sales of investments. For a discussion of our investment objectives, strategies and a discussion of durationmatching, see ‘‘Investments’’ as well as Item 7A. ‘‘Quantitative and Qualitative Disclosures About Market Risk —Interest Rate Risk.’’
Cash Flows. Activity, as reported in our consolidated statements of cash flows, provides relevant informationregarding our sources and uses of cash. The following discussion of our operating, investing and financing portions of thecash flows excludes cash flows attributable to the separate accounts.
Net cash provided by operating activities was $ 2,791.7 million, $2,243.0 million and $2,224.8 million for the yearsended December 31, 2010, 2009 and 2008, respectively. As an insurance business, we typically generate positive cashflows from operating activities, as premiums collected from our insurance products and income received from ourinvestments exceed policy acquisition costs, benefits paid, redemptions and operating expenses. These positive cash flowsare then invested to support the obligations of our insurance products and required capital supporting these products.Our cash flows from operating activities are affected by the timing of premiums, fees, and investment income receivedand expenses paid. The increase in cash provided by operating activities in 2010 compared to 2009 was the result ofincreased cash flows from trading securities as well as an increase in fees and other revenue received. The increase incash provided by operating activities in 2009 compared to 2008 was primarily the result of fluctuations in receivables andpayables associated with the timing of settlement, offset by a decline in premium, fees and other revenue received.
Net cash provided by investing activities was $27.5 million and $1,026.8 million for the years ended December 31,2010 and 2009, respectively, compared to net cash used by investing activities of $2,917.2 million for the year endedDecember 31, 2008. The decrease in cash provided by investing activities in 2010 compared to 2009 was primarily due toan increase in net purchases of investments. The increase in cash provided by investing activities in 2009 compared to2008 was primarily the result of an increase in net sales and maturities of investments as we were holding higher cashbalances to cover potential near term obligations, given the challenging economic conditions that existed.
Net cash used in financing activities was $3,182.2 million and $3,637.4 million for the years ended December 31, 2010and 2009, respectively, compared to net cash provided by financing activities of $1,956.0 million for the year endedDecember 31, 2008. The decrease in cash used in financing activities in 2010 compared to 2009 is primarily due to adecrease in net withdrawals of Principal Life general account investment contracts; net withdrawals were higher in 2009primarily due to our decision to scale back our investment only business. Also contributing to the decrease in cash used infinancing activities was net proceeds from short-term debt in 2010 compared to net repayments of short-term debt in
55

2009. These increases were partially offset by cash received from the issuance of common stock and long-term debt in2009 with no corresponding activity in 2010. The increase in cash used in financing activities in 2009 compared to 2008 isprimarily due to an increase in net withdrawals of Principal Life general account investment contracts, partially due toour decision to scale back our investment only business, as well as payments of short-term debt in 2009, compared toproceeds from short-term debt in 2008. This increase in cash used in financing activities was partially offset by theissuance of common stock and long-term debt in 2009.
Shelf Registration. We currently have an effective shelf registration which allows us the ability to issue, in unlimitedamounts, unsecured senior debt securities or subordinated debt securities, junior subordinated debt, preferred stock,common stock, warrants, depository shares, stock purchase contracts and stock purchase units of PFG, trust preferredsecurities of three subsidiary trusts and guarantees by PFG of these trust preferred securities. Our wholly ownedsubsidiary, PFS, may guarantee, fully and unconditionally or otherwise, our obligations with respect to anynon-convertible securities, other than common stock, described in the shelf registration. In May 2009, we issued commonstock and senior debt securities under the shelf registration. For information on senior notes issued from our shelfregistration, see Item 8. ‘‘Financial Statements and Supplementary Data, Notes to Consolidated Financial Statements,Note 9, Debt.’’
Short-Term Debt and Long-Term Debt. For debt information, see Item 8. ‘‘Financial Statements and SupplementaryData, Notes to Consolidated Financial Statements, Note 9, Debt.’’
Stockholders’ Equity. Proceeds from the issuance of our common stock were $20.6 million, $1,123.0 million and$36.4 million in 2010, 2009 and 2008, respectively.
The following table summarizes our return of capital to common stockholders.
For the year endedDecember 31,
2010 2009 2008
(in millions)Dividends to stockholders . . . . . . . . . . . . . . . . . . . . . . . . . . . . . . . . . . . . . . . . . . . . . . . . . . . . . . $176.2 $159.5 $116.7Repurchase of common stock . . . . . . . . . . . . . . . . . . . . . . . . . . . . . . . . . . . . . . . . . . . . . . . . . . . . 2.6 4.1 6.4
Total cash returned to stockholders . . . . . . . . . . . . . . . . . . . . . . . . . . . . . . . . . . . . . . . . . . . . . . . $178.8 $163.6 $123.1
Number of shares repurchased . . . . . . . . . . . . . . . . . . . . . . . . . . . . . . . . . . . . . . . . . . . . . . . . . . . 0.1 0.3 1.0
For additional stockholders’ equity information, see Item 8. ‘‘Financial Statements and Supplementary Data, Notesto Consolidated Financial Statements, Note 13, Stockholders’ Equity.’’
Capitalization
The following table summarizes our capital structure.December 31,
2010 2009
(in millions)Debt:
Short-term debt . . . . . . . . . . . . . . . . . . . . . . . . . . . . . . . . . . . . . . . . . . . . . . . . . . . . . . . . . . . . . . $ 107.9 $ 101.6Long-term debt . . . . . . . . . . . . . . . . . . . . . . . . . . . . . . . . . . . . . . . . . . . . . . . . . . . . . . . . . . . . . . 1,583.7 1,584.6
Total debt . . . . . . . . . . . . . . . . . . . . . . . . . . . . . . . . . . . . . . . . . . . . . . . . . . . . . . . . . . . . . . . . . 1,691.6 1,686.2Stockholders’ equity:
Equity excluding accumulated other comprehensive income . . . . . . . . . . . . . . . . . . . . . . . . . . . . . . . . . . 9,455.4 8,935.5
Total capitalization excluding accumulated other comprehensive income . . . . . . . . . . . . . . . . . . . . . . . . . . . . $11,147.0 $10,621.7
Debt to equity excluding accumulated other comprehensive income . . . . . . . . . . . . . . . . . . . . . . . . . . . . . . 18% 19%Debt to capitalization excluding accumulated other comprehensive income . . . . . . . . . . . . . . . . . . . . . . . . . . 15% 16%
As of December 31, 2010, we had $821.6 million of excess capital, consisting of cash and highly liquid assets in theholding companies available for debt maturities, interest and preferred dividend expenses and other holding companyobligations. We continue to maintain sufficient capital levels in Principal Life based on our current financial strengthratings.
56

Contractual Obligations
The following table presents payments due by period for long-term contractual obligations as of December 31, 2010.Payments due in year ending
Total 2015 andContractual Obligations (1) Payments 2010 2011-2012 2013-2014 thereafter
(in millions)Contractholder funds (2) . . . . . . . . . . . . . . . . . . . . . . . . . . . . . . . . $53,890.1 $ 6,656.3 $11,733.2 $ 7,506.6 $27,994.0Future policy benefits and claims (3) . . . . . . . . . . . . . . . . . . . . . . . . 35,807.8 2,078.6 3,570.6 3,392.8 26,765.8Long-term debt (4) . . . . . . . . . . . . . . . . . . . . . . . . . . . . . . . . . . . 1,583.7 5.4 12.5 508.9 1,056.9Certificates of deposit (5) . . . . . . . . . . . . . . . . . . . . . . . . . . . . . . . 984.4 626.9 289.1 68.1 0.3Other long-term liabilities (6) . . . . . . . . . . . . . . . . . . . . . . . . . . . . . 1,945.2 1,792.4 44.8 31.0 77.0Capital leases . . . . . . . . . . . . . . . . . . . . . . . . . . . . . . . . . . . . . . . 4.4 3.0 1.4 — —Long-term debt interest . . . . . . . . . . . . . . . . . . . . . . . . . . . . . . . . . 1,635.4 115.1 229.3 174.2 1,116.8Operating leases (7) . . . . . . . . . . . . . . . . . . . . . . . . . . . . . . . . . . . 219.8 48.1 65.8 37.8 68.1Purchase obligations (8) . . . . . . . . . . . . . . . . . . . . . . . . . . . . . . . . 145.3 130.2 9.8 5.3 —
Total contractual obligations . . . . . . . . . . . . . . . . . . . . . . . . . . . . . . $96,216.1 $11,456.0 $15,956.5 $11,724.7 $57,078.9
(1) Excludes short-term liabilities, other policyholder funds, taxes and short-term debt as these are not long-term and/or not contractual innature. Also excludes obligations under our pension and other postretirement benefit plans as we do not anticipate contributions will beneeded to satisfy the minimum funding requirements of ERISA for our qualified pension plan. In addition, separate account liabilities areexcluded. Separate account liabilities represent the fair market value of funds that are separately administered by us. Generally, theseparate account contract owner, rather than us, bears the investment risk of these funds. The separate account liabilities are legallysegregated and are not subject to claims that arise out of any other business of ours. Net deposits, net investment income and realized andunrealized capital gains and losses on the separate accounts are not reflected in the consolidated statements of operations. The separateaccount obligations will be fully funded by cash flows from the separate account assets.
(2) Includes GICs, funding agreements, individual fixed annuities, universal life insurance and other investment-type contracts. See Item 8.‘‘Financial Statements and Supplementary Data, Notes to Consolidated Financial Statements, Note 8, Insurance Liabilities’’ for additionalinformation.
Amounts included in the contractholder funds line item reflect estimated cash payments to be made to policyholders. The sum of the cashoutflows shown for all years in the table exceeds the corresponding liability amount included in our consolidated statements of financialposition as of December 31, 2010. The liability amount in our consolidated statements of financial position reflects either the accountvalue (in the case of individual fixed annuities, universal life insurance and GICs) or the par value plus accrued interest and otheradjustments (in the case of funding agreements and other investment contracts).
(3) Amounts included in the future policy benefits and claims line item reflect estimated cash payments to be made to policyholders. The sumof the cash outflows shown for all years in the table exceeds the corresponding liability amount included in our consolidated statements offinancial position as of December 31, 2010. The liability amount in our consolidated statements of financial position reflects estimatedcash payments to policyholders, reductions for expected future premiums, assumptions with regard to the timing of cash payments anddiscounting for interest.
(4) For long-term debt information, see Item 8. ‘‘Financial Statements and Supplementary Data, Notes to Consolidated Financial Statements,Note 9, Debt.’’
(5) Amounts included in the certificates of deposit line item reflect estimated cash payments to be made, including expected interestpayments. Certificates of deposit are reported as other liabilities on our consolidated statements of financial position.
(6) Other long-term liabilities include other liabilities reflected in the consolidated statements of financial position that are contractual,non-cancelable and long-term in nature. The total payments primarily relate to checking and savings deposits as well as premiumassociated with purchased option contracts where payments are made over the life of the contract. This line item excludes accruals,short-term items and items not contractual in nature.
(7) As a lessee, we lease office space, data processing equipment and office furniture and equipment under various operating leases.
(8) Purchase obligations include material contracts where we have a non-cancelable commitment to purchase goods and services in addition tocommitments to originate loans and purchase investments.
Pension and Other Postretirement Plan Funding
We have defined benefit pension plans covering substantially all of our U.S. employees and certain agents. SeeItem 8. ‘‘Financial Statements and Supplementary Data, Notes to Consolidated Financial Statements, Note 11, Employeeand Agent Benefits’’ for a complete discussion of these plans and their effect on the consolidated financial statements.
We report the net funded status of our pension and other postretirement plans in the consolidated statements offinancial position. The net funded status represents the differences between the fair value of plan assets and the projectedbenefit obligation for pension plans and other postretirement plans. The measurement of the net funded status can varybased upon the fluctuations in the fair value of the plan assets and the actuarial assumptions used for the plans asdiscussed below. The net underfunded status of the pension and other postretirement benefit obligation at December 31,2010, was $207.0 million pre-tax, an improvement of $278.7 million from a net underfunded status of $485.7 millionpre-tax at December 31, 2009. Nonqualified pension plan assets are not included as part of the funding status mentionedabove. The nonqualified pension plan assets are held in Rabbi trusts for the benefit of all nonqualified plan participants.The assets held in a Rabbi trust are available to satisfy the claims of general creditors only in the event of bankruptcy.
57

Therefore, these assets are fully consolidated in our consolidated statements of financial position and are not reflected inour funded status as they do not qualify as plan assets under U.S. GAAP. The market value of assets held in these trustswas $265.3 million and $245.1 million as of December 31, 2010 and 2009, respectively.
Our funding policy for the qualified pension plan is to fund the plan annually in an amount at least equal to theminimum annual contributions required under ERISA and, generally, not greater than the maximum amount that can bededucted for federal income tax purposes. We do not anticipate contributions will be needed to satisfy the minimumfunding requirements of ERISA for our qualified pension plan. At this time, it is too early to estimate the amount thatmay be contributed, but it is possible that we may fund the plans in 2011 in the range of $60-$90 million. This includesfunding for both our qualified and nonqualified pension plans. We may contribute to our other postretirement benefitplans in 2011 pending further analysis.
Contractual Commitments
In connection with our banking business, we make additional commitments to extend credit, which are agreementsto lend to a customer as long as there is no violation of any conditions established in the contract. Commitments generallyhave fixed expiration dates or other termination clauses and may require payment of a fee. A majority of thesecommitments are lines of credit and are expected to expire without being drawn upon. Therefore, the total commitmentamounts do not necessarily represent future cash funding requirements. We evaluate each customer’s creditworthiness ona case-by-case basis. The total commitments to fund loans were $55.5 million as of December 31, 2010.
We have made commitments to fund certain limited partnerships in which we are a limited partner. As ofDecember 31, 2010, the amount of unfunded commitments was $50.3 million. We are only required to fund additionalequity under these commitments when called upon to do so by the general partner; therefore, these commitments are notliabilities on our consolidated statements of financial position.
Off-Balance Sheet Arrangements
Variable Interest Entities. We have relationships with various types of special purpose entities and other entities wherewe have a variable interest as described in Item 8. ‘‘Financial Statements and Supplementary Data, Notes to ConsolidatedFinancial Statements, Note 3, Variable Interest Entities.’’ We do not have a direct or contingent obligation related to ourunconsolidated variable interest entities (‘‘VIE’’).
Guarantees and Indemnifications. For guarantee and indemnification information, see Item 8. ‘‘Financial Statementsand Supplementary Data, Notes to Consolidated Financial Statements, Note 12, Contingencies, Guarantees andIndemnifications’’ under the caption, ‘‘Guarantees and Indemnifications.’’
Financial Strength Rating and Credit Ratings
Our ratings are influenced by the relative ratings of our peers/competitors as well as many other factors includingour operating and financial performance, asset quality, liquidity, asset/liability management, overall portfolio mix,financial leverage (i.e., debt), risk exposures, operating leverage, ratings and other factors.
NRSROs publish financial strength ratings on U.S. life insurance companies that are indicators of an insurancecompany’s ability to meet contractholder and policyholder obligations. NRSROs also assign credit ratings on non-lifeinsurance entities, such as PFG and PFS. Credit ratings are indicators of a debt issuer’s ability to meet the terms of debtobligations in a timely manner, and are important factors in overall funding profile and ability to access external capital.Such ratings are not a recommendation to buy, sell or hold securities. Ratings are subject to revision or withdrawal at anytime by the assigning NRSRO.
Each of A.M. Best Company, Inc., Fitch Rating Ltd., Moody’s Investors Service and Standard & Poor’s revised itsoutlook for the U.S. life insurance sector to negative from stable in mid-to-late 2008. During 2010, each of the fouragencies revised its outlook to stable from negative. Each rating agency indicates there are positive signs for the U.S. lifeinsurance sector, however, they also indicate a belief that the economic recovery will be slow moving, will hamperearnings recovery and will create potential for further credit losses, particularly in the commercial and residentialmortgage asset classes. Despite the stable outlook, a lingering result of the challenging economic conditions over the lastfew years has been changes in benchmarks for capital, liquidity, earnings and other factors used by these NRSROs thatare critical to a ratings assignment at a particular rating level.
In December 2010, Standard & Poor’s affirmed Principal Life and Principal National ratings and changed theoutlook to positive from stable; A.M. Best affirmed ratings and changed the outlook to stable from negative. InDecember 2010, Fitch affirmed Principal Life and Principal National ratings, although the outlook remains negative. Therating affirmations and positive outlook changes are reflective of the rating agencies’ positive view on our financialstrength. There is still some concern, as reflected by the continuing negative outlook on our ratings by Fitch, about thepotential impact of the economic conditions on our direct commercial and commercial mortgage-backed securities(‘‘CMBS’’) holdings.
58

The following table summarizes our significant financial strength and debt ratings from the major independent ratingorganizations. The debt ratings shown are indicative ratings. Outstanding issuances are rated the same as indicativeratings unless otherwise noted. Actual ratings can differ from indicative ratings based on contractual terms.
A.M. Best Fitch Standard & Poor’s Moody’s
Principal Financial GroupSenior Unsecured Debt (1) . . . . . . . . . . . . . . . . . . . . . . . . . . . . . . . . . . . BBB Baa1Preferred Stock (2) . . . . . . . . . . . . . . . . . . . . . . . . . . . . . . . . . . . . . . . . . BB+ Baa3Principal Financial ServicesSenior Unsecured Debt . . . . . . . . . . . . . . . . . . . . . . . . . . . . . . . . . . . . . . BBBCommercial Paper . . . . . . . . . . . . . . . . . . . . . . . . . . . . . . . . . . . . . . . . . F-1 A-2 P-2Principal Life Insurance CompanyInsurer Financial Strength . . . . . . . . . . . . . . . . . . . . . . . . . . . . . . . . . . . . A+ AA� A Aa3Enterprise Risk Management Rating . . . . . . . . . . . . . . . . . . . . . . . . . . . . . StrongPrincipal National Life Insurance CompanyInsurer Financial Strength . . . . . . . . . . . . . . . . . . . . . . . . . . . . . . . . . . . . A+ AA� A Aa3
(1) Moody’s has rated Principal Financial Group’s senior debt issuance ‘‘A3’’
(2) S&P has rated Principal Financial Group’s preferred stock issuance ‘‘BB’’
Impacts of Income Taxes
For income tax information, see Item 8. ‘‘Financial Statements and Supplementary Data, Notes to ConsolidatedFinancial Statements, Note 10, Income Taxes.’’
Fair Value Measurement
Fair value is the price that would be received to sell an asset or paid to transfer a liability in an orderly transactionbetween market participants at the measurement date (an exit price). The fair value hierarchy prioritizes the inputs tovaluation techniques used to measure fair value into three levels for disclosure purposes. The fair value hierarchy givesthe highest priority (Level 1) to quoted prices in active markets for identical assets or liabilities and gives the lowestpriority (Level 3) to unobservable inputs. An asset or liability’s classification within the fair value hierarchy is based onthe lowest level of significant input to its valuation. See Item 8. ‘‘Financial Statements and Supplementary Data, Notes toConsolidated Financial Statements, Note 14, Fair Value Measurements’’ for further details, including a reconciliation ofchanges in Level 3 fair value measurements.
As of December 31, 2010, 43% of our net assets (liabilities) were Level 1, 53% were Level 2 and 4% were Level 3.Excluding separate account assets as of December 31, 2010, 2% of our net assets (liabilities) were Level 1, 96% wereLevel 2 and 2% were Level 3.
As of December 31, 2009, 37% of our net assets (liabilities) were Level 1, 58% were Level 2 and 5% were Level 3.Excluding separate account assets as of December 31, 2009, 3% of our net assets (liabilities) were Level 1, 95% wereLevel 2 and 2% were Level 3.
Changes in Level 3 fair value measurements
Net assets (liabilities) measured at fair value on a recurring basis using significant unobservable inputs (Level 3) asof December 31, 2010, were $4,691.4 million as compared to $5,276.5 million as of December 31, 2009. The decrease isprimarily related to fixed maturities, available-for-sale and separate account assets. The decrease in fixed maturities,available-for-sale is primarily the result of our obtaining prices from third party pricing vendors versus relying on brokerquotes or internal pricing models for certain structured securities, resulting in the transfer of those assets out of Level 3to Level 2. Another large component of the decrease is the result of sales and settlements of certain corporate andstructured securities. Additionally, as a result of our implementation of new authoritative guidance related to theaccounting for embedded credit derivatives effective July 1, 2010, within the scope of the guidance we reclassified certainsecurities previously included in fixed maturities, available-for-sale, to fixed maturities, trading. The decrease in separateaccount assets is primarily a result of real estate sales. These decreases are partially offset by a net increase in fair value ofLevel 3 instruments related to the implementation of new authoritative guidance related to the accounting for VIEseffective January 1, 2010. As a result of the new guidance, certain previously unconsolidated VIEs were consolidated andcertain previously consolidated VIEs were deconsolidated. The fair value of Level 3 assets and liabilities of the newlyconsolidated and deconsolidated VIEs is primarily included in the net change for fixed maturities, trading; otherinvestments; derivative liabilities and other liabilities.
Net assets (liabilities) measured at fair value on a recurring basis using significant unobservable inputs (Level 3) asof December 31, 2009, were $5,276.5 million as compared to $7,002.0 million as of December 31, 2008. The decrease isprimarily attributed to separate account assets. The decrease in separate account assets is primarily a result of unrealizedlosses on real estate. Unrealized losses on separate accounts do not impact net income in the consolidated statements ofoperations, as the change in value of separate account assets is offset by a change in value of separate account liabilities.
59

Investments
We had total consolidated assets as of December 31, 2010, of $145.6 billion, of which $66.0 billion were investedassets. The rest of our total consolidated assets are comprised primarily of separate account assets for which we do notbear investment risk. Because we generally do not bear any investment risk on assets held in separate accounts, thediscussion and financial information below does not include such assets.
Overall Composition of Invested Assets
Invested assets as of December 31, 2010, were predominantly high quality and broadly diversified across asset class,individual credit, industry and geographic location. Asset allocation is determined based on cash flow and the risk/returnrequirements of our products. As shown in the following table, the major categories of invested assets are fixed maturitiesand commercial mortgage loans. The remainder is invested in residential mortgage loans, real estate, equity securitiesand other assets. In addition, policy loans are included in our invested assets.
December 31, 2010 December 31, 2009
Carrying amount % of total Carrying amount % of total
($ in millions)Fixed maturities:
Public . . . . . . . . . . . . . . . . . . . . . . . . . . . . . . . . . . . . . . . . . $35,426.8 54% $33,719.6 53%Private . . . . . . . . . . . . . . . . . . . . . . . . . . . . . . . . . . . . . . . . 14,329.8 22 13,533.4 21
Equity securities . . . . . . . . . . . . . . . . . . . . . . . . . . . . . . . . . . . . 486.8 1 435.5 1Mortgage loans:
Commercial . . . . . . . . . . . . . . . . . . . . . . . . . . . . . . . . . . . . . 9,609.0 14 10,129.3 16Residential . . . . . . . . . . . . . . . . . . . . . . . . . . . . . . . . . . . . . . 1,516.1 2 1,716.3 2
Real estate held for sale . . . . . . . . . . . . . . . . . . . . . . . . . . . . . . . 51.9 — 35.4 —Real estate held for investment . . . . . . . . . . . . . . . . . . . . . . . . . . 1,011.6 2 999.2 2Policy loans . . . . . . . . . . . . . . . . . . . . . . . . . . . . . . . . . . . . . . . 903.9 1 902.5 1Other investments . . . . . . . . . . . . . . . . . . . . . . . . . . . . . . . . . . . 2,641.6 4 2,465.3 4
Total invested assets . . . . . . . . . . . . . . . . . . . . . . . . . . . . . . . . 65,977.5 100% 63,936.5 100%
Cash and cash equivalents . . . . . . . . . . . . . . . . . . . . . . . . . . . . . . 1,877.4 2,240.4
Total invested assets and cash . . . . . . . . . . . . . . . . . . . . . . . . . . $67,854.9 $66,176.9
Investment Results
Net Investment Income
The following table presents the yield and investment income, excluding net realized capital gains and losses, for ourinvested assets for the years indicated. We calculate annualized yields using a simple average of asset classes at thebeginning and end of the reporting period. The yields for fixed maturities and equity securities are calculated usingamortized cost and cost, respectively. All other yields are calculated using carrying amounts.
For the year ended December 31, Increase (decrease)
2010 2009 2008 2010 vs. 2009 2009 vs. 2008
Yield Amount Yield Amount Yield Amount Yield Amount Yield Amount
($ in millions)Fixed maturities . . . . . . . . . . . . . . . . 5.7% $2,794.7 5.6% $2,717.2 6.5% $3,105.8 0.1% $ 77.5 (0.9)% $(388.6)Equity securities . . . . . . . . . . . . . . . . 3.0 14.2 4.2 19.3 3.6 18.9 (1.2) (5.1) 0.6 0.4Mortgage loans — commercial . . . . . . . 6.0 589.1 5.8 617.7 6.1 666.8 0.2 (28.6) (0.3) (49.1)Mortgage loans — residential . . . . . . . . 5.2 84.2 4.0 71.2 8.3 154.8 1.2 13.0 (4.3) (83.6)Real estate . . . . . . . . . . . . . . . . . . . 5.5 57.5 3.7 35.9 6.1 54.6 1.8 21.6 (2.4) (18.7)Policy loans . . . . . . . . . . . . . . . . . . . 6.7 60.9 6.9 62.0 6.6 58.3 (0.2) (1.1) 0.3 3.7Cash and cash equivalents . . . . . . . . . . 0.4 7.2 0.5 13.0 2.9 57.0 (0.1) (5.8) (2.4) (44.0)Other investments . . . . . . . . . . . . . . . (0.9) (21.8) (0.9) (24.0) 0.9 21.8 — 2.2 (1.8) (45.8)
Total before investment expenses . . . . 5.3 3,586.0 5.1 3,512.3 6.1 4,138.0 0.2 73.7 (1.0) (625.7)Investment expenses . . . . . . . . . . . . . . (0.1) (89.5) (0.1) (111.5) (0.2) (143.7) — 22.0 0.1 32.2
Net investment income . . . . . . . . . . 5.2% $3,496.5 5.0% $3,400.8 5.9% $3,994.3 0.2% $ 95.7 (0.9)% $(593.5)
Year Ended December 31, 2010 Compared to Year Ended December 31, 2009
Net investment income increased primarily due to higher inflation-based investment returns on average investedassets, most notably fixed maturities, related to inflation in Chile during 2010 versus deflation during 2009 and thestrengthening of the Chilean peso against the U.S. dollar. In addition, net investment income increased due to gains onsales of equity real estate. These increases were partially offset by a decrease in average invested assets due to ourdecision to scale back our investment only business.
60

Year Ended December 31, 2009 Compared to Year Ended December 31, 2008
Net investment income on fixed maturities decreased primarily due to lower inflation-based investment returnsrelated to deflation in Chile during 2009, lower yields on floating rate investments supporting floating rate liabilities and adecrease in average invested assets. In addition, net investment income on mortgage loans-residential decreasedprimarily due to deflation in Chile during 2009.
Net Realized Capital Gains (Losses)
The following table presents the contributors to net realized capital gains and losses for our invested assets for theyears indicated.
For the year endedDecember 31, Increase (decrease)
2010 2009 2008 2010 vs. 2009 2009 vs. 2008
(in millions)Fixed maturities, available-for-sale — credit impairments (1) . . . . . . . . . $(229.0) $(372.6) $(411.0) $143.6 $ 38.4Fixed maturities, available-for-sale — other . . . . . . . . . . . . . . . . . . . . 8.9 52.9 23.1 (44.0) 29.8Fixed maturities, trading . . . . . . . . . . . . . . . . . . . . . . . . . . . . . . . . 17.5 49.3 (61.7) (31.8) 111.0Equity securities — credit impairments . . . . . . . . . . . . . . . . . . . . . . . 3.7 (20.5) (47.3) 24.2 26.8Derivatives and related hedge activities (2) . . . . . . . . . . . . . . . . . . . . 30.8 (11.5) (36.1) 42.3 24.6Commercial mortgages . . . . . . . . . . . . . . . . . . . . . . . . . . . . . . . . . (53.0) (120.1) (44.3) 67.1 (75.8)Other gains (losses) . . . . . . . . . . . . . . . . . . . . . . . . . . . . . . . . . . . 29.6 24.2 (116.8) 5.4 141.0
Net realized capital gains (losses) . . . . . . . . . . . . . . . . . . . . . . . . . $(191.5) $(398.3) $(694.1) $206.8 $295.8
(1) Includes credit impairments as well as losses on sales of fixed maturities to reduce credit risk, net of realized credit recoveries on the saleof previously impaired securities. Credit gains on sales, excluding associated foreign currency fluctuations that are included in derivativesand related hedge activities, were a net gain of $15.0 million and $57.3 for the years ended December 31, 2010 and 2009, respectively.There were no credit gains on sales for the year ended December 31, 2008.
(2) Includes fixed maturities, available-for-sale impairment-related net gains of $0.1 million and net losses of $2.8 million and $21.0 million for2010, 2009 and 2008, respectively, which were hedged by derivatives reflected in this line.
Year Ended December 31, 2010 Compared to Year Ended December 31, 2009
Net realized capital losses on fixed maturities, available-for-sale — credit impairments decreased primarily due tolower impairments on corporate securities as a result of improved market conditions and lower net credit losses on salesin 2010 relative to 2009 due to our decision to reduce exposure to BBB rated securities in 2009, partially offset byincreased impairments on commercial mortgage-backed securities. Net realized capital gains on fixed maturities,available-for-sale -other decreased due to lower gains on sales in 2010.
Net realized capital gains on fixed maturities, trading decreased due to lower mark-to-market gains on thesesecurities resulting from market liquidity impacts and larger credit spread tightening in 2009 compared to 2010.
Net realized capital gains on derivatives and related hedge activities increased due to decreased losses on theGMWB embedded derivatives resulting from changes in the spread reflecting our own creditworthiness. These decreasedlosses were partially offset by lower gains from fair value hedge ineffectiveness, decreased gains on credit default swapsdue to changes in credit spreads and increased mark-to-market losses on interest rate swaps due to changes in interestrates.
Net realized capital losses on commercial mortgages decreased due to a lower valuation allowance provision in 2010than in 2009. For additional information, see ‘‘Commercial Mortgage Loan Valuation Allowance.’’
Other net realized capital gains included an $80.1 million gain in the second quarter of 2010 resulting from thesigning of our Shareholders Agreement with Banco pertaining to our Brasilprev joint venture. This gain was offset by a$64.7 million increase in our residential mortgage loan loss provision for our Bank and Trust Services business, whichprimarily related to the continued deterioration in our home equity portfolio resulting from sustained economic stress.
Year Ended December 31, 2009 Compared to Year Ended December 31, 2008
Net realized capital losses on fixed maturities, available-for-sale — credit impairments decreased and net realizedcapital gains on fixed maturities, available-for-sale-other increased as a result of actions to reduce asset ratings drift riskby selling and tendering certain securities.
Net realized capital gains on fixed maturities, trading increased due to mark-to-market gains versus losses on thesesecurities, resulting from narrowing credit spreads and improvement in market liquidity during the second, third andfourth quarters of 2009.
Net realized capital losses on derivatives and related hedge activities decreased due to gains versus losses from creditdefault swaps due to changes in credit spreads, fair value hedge ineffectiveness and mark-to-market adjustments onderivatives in our Principal International segment primarily due to changes in foreign currency. These decreased losses
61

were offset by net losses versus gains on the GMWB embedded derivative and associated hedging instruments primarilyresulting from changes in the spread reflecting our own creditworthiness.
Net realized capital losses on commercial mortgages increased primarily due to increases in the valuation allowance,reflecting a continued decline in the real estate market.
Other net realized capital gains increased due to gains versus losses on the mark-to-market of equity securitiesclassified as trading and certain seed money investments due to improvement in the equity market in 2009.
U.S. Investment Operations
Of our invested assets, $60.6 billion were held by our U.S. operations as of December 31, 2010. Our U.S. investedassets are managed primarily by our Principal Global Investors segment. Our primary investment objective is to maximizeafter-tax returns consistent with acceptable risk parameters. We seek to protect policyholders’ benefits by optimizing therisk/return relationship on an ongoing basis, through asset/liability matching, reducing the credit risk, avoiding high levelsof investments that may be redeemed by the issuer, maintaining sufficiently liquid investments and avoiding undue assetconcentrations through diversification. We are exposed to three primary sources of investment risk:
• credit risk, relating to the uncertainty associated with the continued ability of a given obligor to make timelypayments of principal and interest;
• interest rate risk, relating to the market price and/or cash flow variability associated with changes in market yieldcurves and
• equity risk, relating to adverse fluctuations in a particular common stock, which we have limited exposure to in ourportfolio.
Our ability to manage credit risk is essential to our business and our profitability. We devote considerable resourcesto the credit analysis of each new investment. We manage credit risk through industry, issuer and asset classdiversification. Our Investment Committee, appointed by our Board of Directors, is responsible for establishing allinvestment policies and approving or authorizing all investments, except the Executive Committee of the Board mustapprove any investment transaction exceeding $500.0 million. As of December 31, 2010, there are nine members on theInvestment Committee, one of whom is a member of our Board of Directors. The remaining members are seniormanagement members representing various areas of our company.
We also seek to reduce call or prepayment risk arising from changes in interest rates in individual investments. Welimit our exposure to investments that are prepayable without penalty prior to maturity at the option of the issuer and werequire additional yield on these investments to compensate for the risk that the issuer will exercise such option. Weassess option risk in all investments we make and, when we take that risk, we price for it accordingly.
Our Fixed Income Securities Committee, consisting of fixed income securities senior management members,approves the credit rating for the fixed maturities we purchase. Teams of security analysts, organized by industry, analyzeand monitor these investments. In addition, we have teams who specialize in residential mortgage-backed securities(‘‘RMBS’’), CMBS, asset-backed securities (‘‘ABS’’) and below investment grade securities. Our analysts monitor issuersheld in the portfolio on a continuous basis with a formal review documented annually or more frequently if materialevents affect the issuer. The analysis includes both fundamental and technical factors. The fundamental analysisencompasses both quantitative and qualitative analysis of the issuer. The qualitative analysis includes an assessment ofboth accounting and management aggressiveness of the issuer. In addition, technical indicators such as stock pricevolatility and credit default swap levels are monitored.
Our Fixed Income Securities Committee also reviews private transactions on a continuous basis to assess the qualityratings of our privately placed investments. We regularly review our investments to determine whether we should re-ratethem, employing the following criteria:
• material declines in the issuer’s revenues or margins;
• significant management or organizational changes;
• significant uncertainty regarding the issuer’s industry;
• debt service coverage or cash flow ratios that fall below industry-specific thresholds;
• violation of financial covenants and
• other business factors that relate to the issuer.
A dedicated risk management team is responsible for centralized monitoring of the commercial mortgage loanportfolio. We apply a variety of strategies to minimize credit risk in our commercial mortgage loan portfolio. Whenconsidering the origination of new commercial mortgage loans, we review the cash flow fundamentals of the property,make a physical assessment of the underlying security, conduct a comprehensive market analysis and compare againstindustry lending practices. We use a proprietary risk rating model to evaluate all new and substantially all existing loanswithin the portfolio. The proprietary risk model is designed to stress projected cash flows under simulated economic and
62
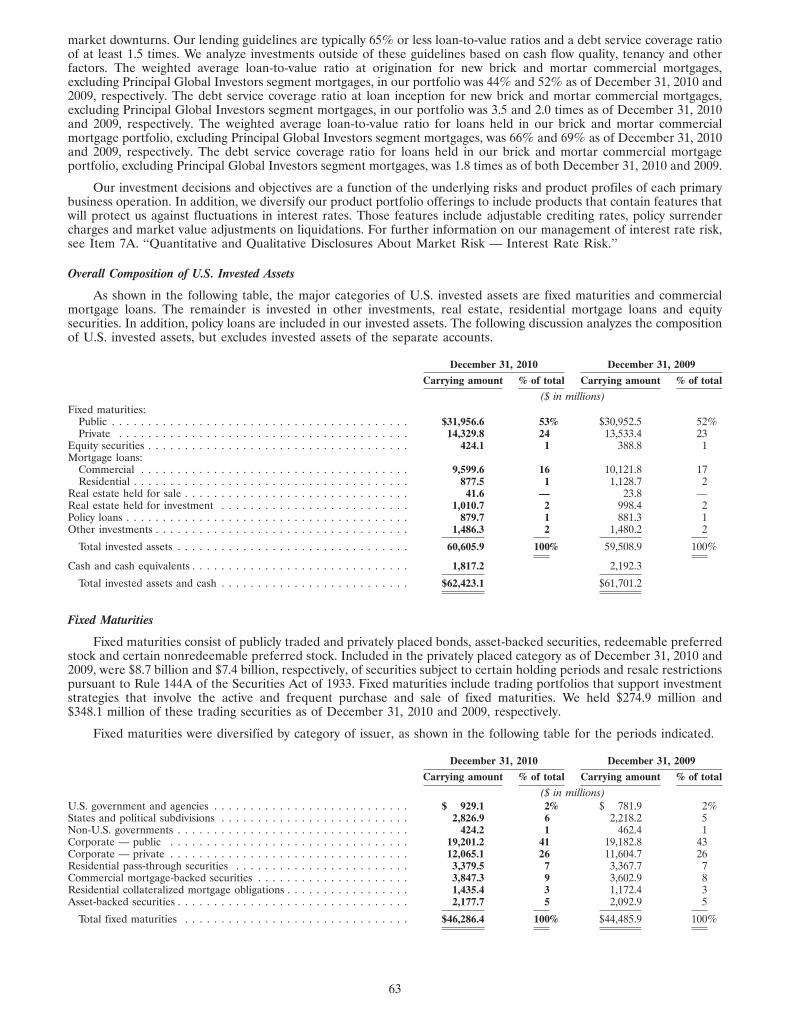
market downturns. Our lending guidelines are typically 65% or less loan-to-value ratios and a debt service coverage ratioof at least 1.5 times. We analyze investments outside of these guidelines based on cash flow quality, tenancy and otherfactors. The weighted average loan-to-value ratio at origination for new brick and mortar commercial mortgages,excluding Principal Global Investors segment mortgages, in our portfolio was 44% and 52% as of December 31, 2010 and2009, respectively. The debt service coverage ratio at loan inception for new brick and mortar commercial mortgages,excluding Principal Global Investors segment mortgages, in our portfolio was 3.5 and 2.0 times as of December 31, 2010and 2009, respectively. The weighted average loan-to-value ratio for loans held in our brick and mortar commercialmortgage portfolio, excluding Principal Global Investors segment mortgages, was 66% and 69% as of December 31, 2010and 2009, respectively. The debt service coverage ratio for loans held in our brick and mortar commercial mortgageportfolio, excluding Principal Global Investors segment mortgages, was 1.8 times as of both December 31, 2010 and 2009.
Our investment decisions and objectives are a function of the underlying risks and product profiles of each primarybusiness operation. In addition, we diversify our product portfolio offerings to include products that contain features thatwill protect us against fluctuations in interest rates. Those features include adjustable crediting rates, policy surrendercharges and market value adjustments on liquidations. For further information on our management of interest rate risk,see Item 7A. ‘‘Quantitative and Qualitative Disclosures About Market Risk — Interest Rate Risk.’’
Overall Composition of U.S. Invested Assets
As shown in the following table, the major categories of U.S. invested assets are fixed maturities and commercialmortgage loans. The remainder is invested in other investments, real estate, residential mortgage loans and equitysecurities. In addition, policy loans are included in our invested assets. The following discussion analyzes the compositionof U.S. invested assets, but excludes invested assets of the separate accounts.
December 31, 2010 December 31, 2009
Carrying amount % of total Carrying amount % of total
($ in millions)Fixed maturities:
Public . . . . . . . . . . . . . . . . . . . . . . . . . . . . . . . . . . . . . . . . . $31,956.6 53% $30,952.5 52%Private . . . . . . . . . . . . . . . . . . . . . . . . . . . . . . . . . . . . . . . . 14,329.8 24 13,533.4 23
Equity securities . . . . . . . . . . . . . . . . . . . . . . . . . . . . . . . . . . . . 424.1 1 388.8 1Mortgage loans:
Commercial . . . . . . . . . . . . . . . . . . . . . . . . . . . . . . . . . . . . . 9,599.6 16 10,121.8 17Residential . . . . . . . . . . . . . . . . . . . . . . . . . . . . . . . . . . . . . . 877.5 1 1,128.7 2
Real estate held for sale . . . . . . . . . . . . . . . . . . . . . . . . . . . . . . . 41.6 — 23.8 —Real estate held for investment . . . . . . . . . . . . . . . . . . . . . . . . . . 1,010.7 2 998.4 2Policy loans . . . . . . . . . . . . . . . . . . . . . . . . . . . . . . . . . . . . . . . 879.7 1 881.3 1Other investments . . . . . . . . . . . . . . . . . . . . . . . . . . . . . . . . . . . 1,486.3 2 1,480.2 2
Total invested assets . . . . . . . . . . . . . . . . . . . . . . . . . . . . . . . . 60,605.9 100% 59,508.9 100%
Cash and cash equivalents . . . . . . . . . . . . . . . . . . . . . . . . . . . . . . 1,817.2 2,192.3
Total invested assets and cash . . . . . . . . . . . . . . . . . . . . . . . . . . $62,423.1 $61,701.2
Fixed Maturities
Fixed maturities consist of publicly traded and privately placed bonds, asset-backed securities, redeemable preferredstock and certain nonredeemable preferred stock. Included in the privately placed category as of December 31, 2010 and2009, were $8.7 billion and $7.4 billion, respectively, of securities subject to certain holding periods and resale restrictionspursuant to Rule 144A of the Securities Act of 1933. Fixed maturities include trading portfolios that support investmentstrategies that involve the active and frequent purchase and sale of fixed maturities. We held $274.9 million and$348.1 million of these trading securities as of December 31, 2010 and 2009, respectively.
Fixed maturities were diversified by category of issuer, as shown in the following table for the periods indicated.
December 31, 2010 December 31, 2009
Carrying amount % of total Carrying amount % of total
($ in millions)U.S. government and agencies . . . . . . . . . . . . . . . . . . . . . . . . . . . $ 929.1 2% $ 781.9 2%States and political subdivisions . . . . . . . . . . . . . . . . . . . . . . . . . . 2,826.9 6 2,218.2 5Non-U.S. governments . . . . . . . . . . . . . . . . . . . . . . . . . . . . . . . . 424.2 1 462.4 1Corporate — public . . . . . . . . . . . . . . . . . . . . . . . . . . . . . . . . . 19,201.2 41 19,182.8 43Corporate — private . . . . . . . . . . . . . . . . . . . . . . . . . . . . . . . . . 12,065.1 26 11,604.7 26Residential pass-through securities . . . . . . . . . . . . . . . . . . . . . . . . 3,379.5 7 3,367.7 7Commercial mortgage-backed securities . . . . . . . . . . . . . . . . . . . . . 3,847.3 9 3,602.9 8Residential collateralized mortgage obligations . . . . . . . . . . . . . . . . . 1,435.4 3 1,172.4 3Asset-backed securities . . . . . . . . . . . . . . . . . . . . . . . . . . . . . . . . 2,177.7 5 2,092.9 5
Total fixed maturities . . . . . . . . . . . . . . . . . . . . . . . . . . . . . . . $46,286.4 100% $44,485.9 100%
63
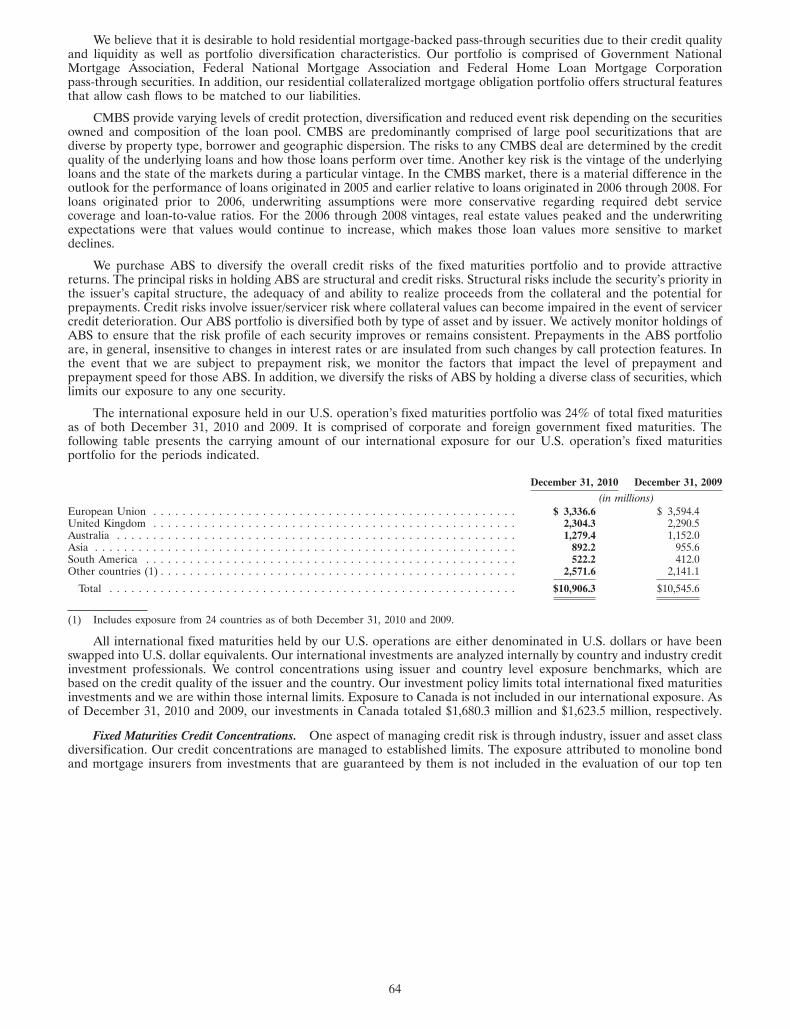
We believe that it is desirable to hold residential mortgage-backed pass-through securities due to their credit qualityand liquidity as well as portfolio diversification characteristics. Our portfolio is comprised of Government NationalMortgage Association, Federal National Mortgage Association and Federal Home Loan Mortgage Corporationpass-through securities. In addition, our residential collateralized mortgage obligation portfolio offers structural featuresthat allow cash flows to be matched to our liabilities.
CMBS provide varying levels of credit protection, diversification and reduced event risk depending on the securitiesowned and composition of the loan pool. CMBS are predominantly comprised of large pool securitizations that arediverse by property type, borrower and geographic dispersion. The risks to any CMBS deal are determined by the creditquality of the underlying loans and how those loans perform over time. Another key risk is the vintage of the underlyingloans and the state of the markets during a particular vintage. In the CMBS market, there is a material difference in theoutlook for the performance of loans originated in 2005 and earlier relative to loans originated in 2006 through 2008. Forloans originated prior to 2006, underwriting assumptions were more conservative regarding required debt servicecoverage and loan-to-value ratios. For the 2006 through 2008 vintages, real estate values peaked and the underwritingexpectations were that values would continue to increase, which makes those loan values more sensitive to marketdeclines.
We purchase ABS to diversify the overall credit risks of the fixed maturities portfolio and to provide attractivereturns. The principal risks in holding ABS are structural and credit risks. Structural risks include the security’s priority inthe issuer’s capital structure, the adequacy of and ability to realize proceeds from the collateral and the potential forprepayments. Credit risks involve issuer/servicer risk where collateral values can become impaired in the event of servicercredit deterioration. Our ABS portfolio is diversified both by type of asset and by issuer. We actively monitor holdings ofABS to ensure that the risk profile of each security improves or remains consistent. Prepayments in the ABS portfolioare, in general, insensitive to changes in interest rates or are insulated from such changes by call protection features. Inthe event that we are subject to prepayment risk, we monitor the factors that impact the level of prepayment andprepayment speed for those ABS. In addition, we diversify the risks of ABS by holding a diverse class of securities, whichlimits our exposure to any one security.
The international exposure held in our U.S. operation’s fixed maturities portfolio was 24% of total fixed maturitiesas of both December 31, 2010 and 2009. It is comprised of corporate and foreign government fixed maturities. Thefollowing table presents the carrying amount of our international exposure for our U.S. operation’s fixed maturitiesportfolio for the periods indicated.
December 31, 2010 December 31, 2009
(in millions)European Union . . . . . . . . . . . . . . . . . . . . . . . . . . . . . . . . . . . . . . . . . . . . . . . . . . $ 3,336.6 $ 3,594.4United Kingdom . . . . . . . . . . . . . . . . . . . . . . . . . . . . . . . . . . . . . . . . . . . . . . . . . . 2,304.3 2,290.5Australia . . . . . . . . . . . . . . . . . . . . . . . . . . . . . . . . . . . . . . . . . . . . . . . . . . . . . . . 1,279.4 1,152.0Asia . . . . . . . . . . . . . . . . . . . . . . . . . . . . . . . . . . . . . . . . . . . . . . . . . . . . . . . . . . 892.2 955.6South America . . . . . . . . . . . . . . . . . . . . . . . . . . . . . . . . . . . . . . . . . . . . . . . . . . . 522.2 412.0Other countries (1) . . . . . . . . . . . . . . . . . . . . . . . . . . . . . . . . . . . . . . . . . . . . . . . . . 2,571.6 2,141.1
Total . . . . . . . . . . . . . . . . . . . . . . . . . . . . . . . . . . . . . . . . . . . . . . . . . . . . . . . . $10,906.3 $10,545.6
(1) Includes exposure from 24 countries as of both December 31, 2010 and 2009.
All international fixed maturities held by our U.S. operations are either denominated in U.S. dollars or have beenswapped into U.S. dollar equivalents. Our international investments are analyzed internally by country and industry creditinvestment professionals. We control concentrations using issuer and country level exposure benchmarks, which arebased on the credit quality of the issuer and the country. Our investment policy limits total international fixed maturitiesinvestments and we are within those internal limits. Exposure to Canada is not included in our international exposure. Asof December 31, 2010 and 2009, our investments in Canada totaled $1,680.3 million and $1,623.5 million, respectively.
Fixed Maturities Credit Concentrations. One aspect of managing credit risk is through industry, issuer and asset classdiversification. Our credit concentrations are managed to established limits. The exposure attributed to monoline bondand mortgage insurers from investments that are guaranteed by them is not included in the evaluation of our top ten
64

exposures. We are not relying on said guarantors and are directly evaluating exposure to these investments. The followingtable presents our top ten exposures as of December 31, 2010.
Amortized cost
(in millions)Bank of America Corp. . . . . . . . . . . . . . . . . . . . . . . . . . . . . . . . . . . . . . . . . . . . . . . . . . . . . . . . . . . . . . . $ 247.0JP Morgan Chase & Co. . . . . . . . . . . . . . . . . . . . . . . . . . . . . . . . . . . . . . . . . . . . . . . . . . . . . . . . . . . . . . . 238.8General Electric Co. . . . . . . . . . . . . . . . . . . . . . . . . . . . . . . . . . . . . . . . . . . . . . . . . . . . . . . . . . . . . . . . . 233.6Wells Fargo & Co. (1) . . . . . . . . . . . . . . . . . . . . . . . . . . . . . . . . . . . . . . . . . . . . . . . . . . . . . . . . . . . . . . . 231.9Berkshire Hathaway Inc. . . . . . . . . . . . . . . . . . . . . . . . . . . . . . . . . . . . . . . . . . . . . . . . . . . . . . . . . . . . . . . 221.3AT&T Inc. . . . . . . . . . . . . . . . . . . . . . . . . . . . . . . . . . . . . . . . . . . . . . . . . . . . . . . . . . . . . . . . . . . . . . . 207.3Export Import Bank of U.S. . . . . . . . . . . . . . . . . . . . . . . . . . . . . . . . . . . . . . . . . . . . . . . . . . . . . . . . . . . . 203.8Credit Suisse Group AG (1) . . . . . . . . . . . . . . . . . . . . . . . . . . . . . . . . . . . . . . . . . . . . . . . . . . . . . . . . . . . . 159.7Prudential Financial Inc. . . . . . . . . . . . . . . . . . . . . . . . . . . . . . . . . . . . . . . . . . . . . . . . . . . . . . . . . . . . . . . 151.2Westpac Banking Corp. . . . . . . . . . . . . . . . . . . . . . . . . . . . . . . . . . . . . . . . . . . . . . . . . . . . . . . . . . . . . . . 149.7
Total top ten exposures . . . . . . . . . . . . . . . . . . . . . . . . . . . . . . . . . . . . . . . . . . . . . . . . . . . . . . . . . . . . . $2,044.3
(1) Includes actual counterparty exposure.
We had exposure to monoline bond and mortgage insurers with an amortized cost of $667.8 million and a carryingamount of $668.6 million as of December 31, 2010. The $667.8 million includes wrapped guarantees on $641.7 million ofunderlying municipal bonds, corporate credit or ABS. Our direct exposure to these insurers was $26.1 million. Of the$641.7 million in wrapped guarantees, 44% was investment grade municipal bonds; 39% was investment grade bankperpetual preferred securities; 10% was ABS backed by sub-prime or Alt-A first lien mortgages, of which 30% wasinvestment grade; and 7% was corporate fixed maturities, of which 93% was investment grade.
Fixed Maturities Valuation and Credit Quality. Valuation techniques for the fixed maturities portfolio vary by securitytype and the availability of market data. The use of different pricing techniques and their assumptions could producedifferent financial results. See Item 8. ‘‘Financial Statements and Supplementary Data, Notes to Consolidated FinancialStatements, Note 14, Fair Value Measurements’’ for further details regarding our pricing methodology. Once prices aredetermined, they are reviewed by pricing analysts for reasonableness based on asset class and observable market data. Inaddition, investment analysts who are familiar with specific securities review prices for reasonableness through directinteraction with external sources, review of recent trade activity or use of internal models. All fixed maturities placed onthe ‘‘watch list’’ are periodically analyzed by investment analysts or analysts that focus on troubled securities (‘‘WorkoutGroup’’). This group then meets with the Chief Investment Officer and the Portfolio Managers to determinereasonableness of prices. The valuation of impaired bonds for which there is no quoted price is typically based on thepresent value of the future cash flows expected to be received. Although we believe these values reasonably reflect thefair value of those securities, the key assumptions about risk premiums, performance of underlying collateral (if any) andother market factors involve qualitative and unobservable inputs.
The Securities Valuation Office (‘‘SVO’’) of the National Association of Insurance Commissioners (‘‘NAIC’’)monitors the bond investments of insurers for regulatory reporting purposes and, when required, assigns securities to oneof six investment categories. For corporate bonds, the NAIC designations closely mirror the NRSROs’ credit ratings formarketable bonds. NAIC designations 1 and 2 include bonds considered investment grade by such rating organizations.Bonds are considered investment grade when rated ‘‘Baa3’’ or higher by Moody’s, or ‘‘BBB�’’ or higher by Standard &Poor’s. NAIC designations 3 through 6 are referred to as below investment grade. Bonds are considered belowinvestment grade when rated ‘‘Ba1’’ or lower by Moody’s, or ‘‘BB+’’ or lower by Standard & Poor’s. However, forloan-backed and structured securities, as defined by the NAIC, the NAIC rating is not always equivalent to an NRSROrating. In 2009, the NAIC approved an initiative to create a new modeling and assessment process for non-agencyresidential mortgage-backed securities effective December 31, 2009. The NAIC retained PIMCO Advisors to undertakethe modeling and assignment of the NAIC ratings for these securities. The NAIC has agreed to continue its relationshipwith PIMCO Advisors with respect to RMBS designations for year-end 2010. Also in 2010, the NAIC extended itsinitiative to include CMBS and retained Blackrock Solutions to undertake the modeling and assignment of the NAICratings of CMBS holdings effective December 31, 2010. Additionally in 2010, for all other loan-backed and structuredsecurities, as defined by the NAIC, the designations are based on current NRSRO ratings within the last twelve monthswhich are then modified based on the carrying value on the insurer’s books. This may result in a final designation beinghigher or lower than the NRSRO credit rating. For those other loan-backed and structured securities without a currentrating, a NAIC 6 rating is assigned.
65

The following table presents our total fixed maturities by NAIC designation and the equivalent ratings of theNRSROs as of the periods indicated as well as the percentage, based on fair value, that each designation comprises.
December 31, 2010 December 31, 2009
% of total % of totalNAIC Rating agency Amortized Carrying carrying Amortized Carrying carryingrating equivalent cost amount amount cost amount amount
($ in millions)1 AAA/AA/A . . . . . . . . . . . . . . . . . . . $26,765.7 $27,433.1 59% $25,527.2 $25,341.5 57%2 BBB . . . . . . . . . . . . . . . . . . . . . . . 14,445.7 15,027.8 33 15,885.1 15,726.8 353 BB . . . . . . . . . . . . . . . . . . . . . . . . 2,599.5 2,460.0 5 2,824.1 2,259.4 54 B . . . . . . . . . . . . . . . . . . . . . . . . . 883.6 739.1 2 982.8 701.3 25 CCC and lower . . . . . . . . . . . . . . . . 567.1 451.5 1 376.1 253.0 16 In or near default . . . . . . . . . . . . . . . 329.0 174.9 — 349.4 203.9 —
Total fixed maturities . . . . . . . . . . . $45,590.6 $46,286.4 100% $45,944.7 $44,485.9 100%
Fixed maturities include 15 securities with an amortized cost of $111.2 million, gross gains of $0.6 million, grosslosses of $3.7 million and a carrying amount of $108.1 million as of December 31, 2010, that are still pending a review andassignment of a rating by the SVO. Due to the timing of when fixed maturities are purchased, legal documents are filedand the review by the SVO is completed, there will always be securities in our portfolio that are unrated over a reportingperiod. In these instances, an equivalent rating is assigned based on our fixed income analyst’s assessment.
Commercial Mortgage-Backed Securities and Home Equity Asset-Backed Securities Portfolios. As of December 31, 2010,based on amortized cost, 58% of our CMBS portfolio had ratings of A or higher and 49% was issued in 2005 or beforeand 37% of our ABS home equity portfolio had ratings of A or higher and 85% was issued in 2005 or before.
The following tables present our exposure by credit quality and year of issuance (‘‘vintage’’) for our CMBS portfolioas of the periods indicated.
December 31, 2010
AAA AA A BBB BB+ and Below Total
Amortized Carrying Amortized Carrying Amortized Carrying Amortized Carrying Amortized Carrying Amortized Carryingcost amount cost amount cost amount cost amount cost amount cost amount
(in millions)2003 & Prior . . . . . . . . . . $ 372.4 $ 368.5 $119.9 $120.8 $140.6 $136.5 $149.1 $138.9 $ 118.4 $ 77.3 $ 900.4 $ 842.02004 . . . . . . . . . . . . . . . 262.6 270.5 58.4 58.3 52.1 46.3 50.3 33.6 71.5 51.9 494.9 460.62005 . . . . . . . . . . . . . . . 411.0 439.3 28.6 30.8 25.3 20.4 92.8 75.3 214.2 120.4 771.9 686.22006 . . . . . . . . . . . . . . . 216.3 216.7 9.0 11.0 75.0 78.6 19.1 19.7 171.2 81.1 490.6 407.12007 . . . . . . . . . . . . . . . 376.8 374.2 65.7 70.3 179.8 191.4 278.4 280.2 648.1 317.5 1,548.8 1,233.62008 . . . . . . . . . . . . . . . — — 15.0 15.7 32.9 35.8 11.8 9.6 31.2 19.3 90.9 80.42009 . . . . . . . . . . . . . . . 91.3 95.0 — — — — — — — — 91.3 95.02010 . . . . . . . . . . . . . . . 37.9 39.0 3.3 3.4 — — — — — — 41.2 42.4
Total . . . . . . . . . . . . . . . $1,768.3 $1,803.2 $299.9 $310.3 $505.7 $509.0 $601.5 $557.3 $1,254.6 $667.5 $4,430.0 $3,847.3
December 31, 2009
AAA AA A BBB BB+ and Below Total
Amortized Carrying Amortized Carrying Amortized Carrying Amortized Carrying Amortized Carrying Amortized Carryingcost amount cost amount cost amount cost amount cost amount cost amount
(in millions)2003 & Prior . . . . . . . . . . $ 727.8 $ 722.2 $178.1 $170.6 $173.9 $151.2 $163.9 $135.8 $ 96.9 $ 36.8 $1,340.6 $1,216.62004 . . . . . . . . . . . . . . . 296.8 291.4 60.9 50.5 81.7 46.4 43.2 18.3 50.7 24.6 533.3 431.22005 . . . . . . . . . . . . . . . 451.9 446.4 59.5 41.7 88.5 47.1 106.4 46.0 127.1 43.2 833.4 624.42006 . . . . . . . . . . . . . . . 215.2 196.0 14.9 13.8 70.8 57.2 76.3 42.1 148.5 27.1 525.7 336.22007 . . . . . . . . . . . . . . . 355.4 326.4 48.5 42.2 176.6 147.2 282.8 196.6 680.1 191.3 1,543.4 903.72008 . . . . . . . . . . . . . . . 4.6 3.9 15.1 13.1 24.2 21.9 11.5 4.6 35.4 13.7 90.8 57.22009 . . . . . . . . . . . . . . . 34.0 33.6 — — — — — — — — 34.0 33.6
Total . . . . . . . . . . . . . . . $2,085.7 $2,019.9 $377.0 $331.9 $615.7 $471.0 $684.1 $443.4 $1,138.7 $336.7 $4,901.2 $3,602.9
66

The following tables present our exposure by credit quality and vintage for our ABS home equity portfolio supportedby subprime first lien mortgages as of the periods indicated.
December 31, 2010
AAA AA A BBB BB and below Total
Amortized Carrying Amortized Carrying Amortized Carrying Amortized Carrying Amortized Carrying Amortized Carryingcost amount cost amount cost amount cost amount cost amount cost amount
(in millions)2003 & prior . . . . . . . . . . $34.2 $33.7 $55.1 $50.5 $ 8.2 $ 7.4 $52.8 $45.0 $ 64.8 $ 48.0 $215.1 $184.62004 . . . . . . . . . . . . . . . 27.7 26.0 4.3 4.2 25.5 21.8 11.9 11.0 5.2 4.5 74.6 67.52005 . . . . . . . . . . . . . . . — — 3.1 3.2 — — 2.0 1.4 74.1 54.6 79.2 59.22006 . . . . . . . . . . . . . . . — — — — — — — — 15.7 11.0 15.7 11.02007 . . . . . . . . . . . . . . . — — — — — — — — 47.5 37.9 47.5 37.9
Total . . . . . . . . . . . . . . . $61.9 $59.7 $62.5 $57.9 $33.7 $29.2 $66.7 $57.4 $207.3 $156.0 $432.1 $360.2
December 31, 2009
AAA AA A BBB BB and below Total
Amortized Carrying Amortized Carrying Amortized Carrying Amortized Carrying Amortized Carrying Amortized Carryingcost amount cost amount cost amount cost amount cost amount cost amount
(in millions)2003 & prior . . . . . . . . . . $ 72.5 $ 62.3 $75.3 $55.6 $ 5.0 $ 3.3 $40.9 $25.7 $ 44.9 $23.0 $238.6 $169.92004 . . . . . . . . . . . . . . . 49.6 37.7 13.1 8.3 9.4 7.7 10.6 7.8 — — 82.7 61.52005 . . . . . . . . . . . . . . . 8.1 4.7 10.1 4.2 2.0 1.3 — — 75.1 34.0 95.3 44.22006 . . . . . . . . . . . . . . . — — — — — — — — 16.7 7.8 16.7 7.82007 . . . . . . . . . . . . . . . — — — — — — — — 53.8 30.6 53.8 30.6
Total . . . . . . . . . . . . . . . $130.2 $104.7 $98.5 $68.1 $16.4 $12.3 $51.5 $33.5 $190.5 $95.4 $487.1 $314.0
Fixed Maturities Watch List. We monitor any decline in the credit quality of fixed maturities through the designationof ‘‘problem securities,’’ ‘‘potential problem securities’’ and ‘‘restructured securities’’. We define problem securities in ourfixed maturity portfolio as securities: (i) as to which principal and/or interest payments are in default or where default isperceived to be imminent in the near term, or (ii) issued by a company that went into bankruptcy subsequent to theacquisition of such securities. We define potential problem securities in our fixed maturity portfolio as securities includedon an internal ‘‘watch list’’ for which management has concerns as to the ability of the issuer to comply with the presentdebt payment terms and which may result in the security becoming a problem or being restructured. The decisionwhether to classify a performing fixed maturity security as a potential problem involves significant subjective judgmentsby our management as to the likely future industry conditions and developments with respect to the issuer. We definerestructured securities in our fixed maturity portfolio as securities where a concession has been granted to the borrowerrelated to the borrower’s financial difficulties that would not have otherwise been considered. We determine thatrestructures should occur in those instances where greater economic value will be realized under the new terms thanthrough liquidation or other disposition and may involve a change in contractual cash flows. If the present value of therestructured cash flows is less than the current cost of the asset being restructured, a realized capital loss is recorded innet income and a new cost basis is established.
The following table presents the total carrying amount of our fixed maturities portfolio, as well as its problem andpotential problem fixed maturities for the periods indicated.
December 31, 2010 December 31, 2009
($ in millions)Total fixed maturities (public and private) . . . . . . . . . . . . . . . . . . . . . . . . . . . . . . . . . . $46,286.4 $44,485.9
Problem fixed maturities (1) . . . . . . . . . . . . . . . . . . . . . . . . . . . . . . . . . . . . . . . . . . . $ 378.7 $ 237.3Potential problem fixed maturities . . . . . . . . . . . . . . . . . . . . . . . . . . . . . . . . . . . . . . . 237.6 315.9Restructured problem fixed maturities . . . . . . . . . . . . . . . . . . . . . . . . . . . . . . . . . . . . . 17.4 —
Total problem, potential problem and restructured fixed maturities . . . . . . . . . . . . . . . . . $ 633.7 $ 553.2
Total problem, potential problem and restructured fixed maturities as a percent of total fixedmaturities . . . . . . . . . . . . . . . . . . . . . . . . . . . . . . . . . . . . . . . . . . . . . . . . . . . . 1.37% 1.24%
(1) The problem fixed maturities carrying amount is net of other-than-temporary impairment losses.
Fixed Maturities Impairments. We have a process in place to identify securities that could potentially have a creditimpairment that is other than temporary. This process involves monitoring market events that could impact issuers’ creditratings, business climate, management changes, litigation and government actions and other similar factors. This processalso involves monitoring late payments, pricing levels, downgrades by rating agencies, key financial ratios, financialstatements, revenue forecasts and cash flow projections as indicators of credit issues.
Each reporting period, a group of individuals including the Chief Investment Officer, our Portfolio Managers,members of our Workout Group and representatives from Investment Accounting review all securities to determinewhether an other-than-temporary decline in value exists and whether losses should be recognized. The analysis focuses on
67
each issuer’s ability to service its debts in a timely fashion. Formal documentation of the analysis and our decision isprepared and approved by management.
We consider relevant facts and circumstances in evaluating whether a credit or interest-rate related impairment of asecurity is other than temporary. Relevant facts and circumstances considered include: (1) the extent and length of timethe fair value has been below cost; (2) the reasons for the decline in value; (3) the financial position and access to capitalof the issuer, including the current and future impact of any specific events; (4) for structured securities, the adequacy ofthe expected cash flows and (5) our intent to sell the security or whether it is more likely than not we will be required tosell the security before recovery of its amortized cost which, in some cases, may extend to maturity. To the extent wedetermine that a security is deemed to be other-than-temporarily impaired, an impairment loss is recognized. Foradditional details, see Item 8. ‘‘Financial Statements and Supplementary Data, Notes to Consolidated FinancialStatements, Note 4, Investments.’’
When it is not our intent to sell a security with unrealized losses, it is not more likely than not that we would berequired to sell the security before recovery of the amortized cost, which may be maturity, and we expect to recover theamortized cost basis, we would not consider the security to be other-than-temporarily impaired. However, we do sellbonds under certain circumstances, such as when we have evidence of a significant deterioration in the issuer’screditworthiness, when a change in regulatory requirements modifies what constitutes a permissible investment or themaximum level of investments held or when there is an increase in capital requirements or a change in risk weights ofdebt securities. Sales generate both gains and losses.
There are a number of significant risks and uncertainties inherent in the process of monitoring credit impairmentsand determining if an impairment is other than temporary. These risks and uncertainties include: (1) the risk that ourassessment of an issuer’s ability to meet all of its contractual obligations will change based on changes in the creditcharacteristics of that issuer, (2) the risk that the economic outlook will be worse than expected or have more of animpact on the issuer than anticipated, (3) the risk that our investment professionals are making decisions based onfraudulent or misstated information in the financial statements provided by issuers and (4) the risk that new informationobtained by us or changes in other facts and circumstances lead us to change our intent to not sell the security prior torecovery of its amortized cost. Any of these situations could result in a charge to net income in a future period.
The net realized loss relating to other-than-temporary credit impairments of fixed maturities was $244.7 million,$428.5 million and $409.4 million for the years ended December 31, 2010, 2009, and 2008, respectively.
68

Fixed Maturities Available-for-Sale
The following tables present our fixed maturities available-for-sale by industry category and the associated grossunrealized gains and losses, including other-than-temporary impairment losses reported in AOCI, as of the periodsindicated.
December 31, 2010
Gross GrossAmortized unrealized unrealized Carrying
cost gains losses amount
(in millions)Finance — Banking . . . . . . . . . . . . . . . . . . . . . . . . . . . . . . . . . . . . . . . . . . $ 4,598.3 $ 110.2 $ 279.2 $ 4,429.3Finance — Brokerage . . . . . . . . . . . . . . . . . . . . . . . . . . . . . . . . . . . . . . . . . 418.4 16.8 2.6 432.6Finance — Finance Companies . . . . . . . . . . . . . . . . . . . . . . . . . . . . . . . . . . . 267.3 11.2 4.5 274.0Finance — Financial Other . . . . . . . . . . . . . . . . . . . . . . . . . . . . . . . . . . . . . . 446.6 36.1 2.3 480.4Finance — Insurance . . . . . . . . . . . . . . . . . . . . . . . . . . . . . . . . . . . . . . . . . 2,723.4 109.7 73.3 2,759.8Finance — REITS . . . . . . . . . . . . . . . . . . . . . . . . . . . . . . . . . . . . . . . . . . . 1,210.6 33.7 27.8 1,216.5Industrial — Basic Industry . . . . . . . . . . . . . . . . . . . . . . . . . . . . . . . . . . . . . . 1,750.4 107.7 5.1 1,853.0Industrial — Capital Goods . . . . . . . . . . . . . . . . . . . . . . . . . . . . . . . . . . . . . 2,262.3 137.8 7.3 2,392.8Industrial — Communications . . . . . . . . . . . . . . . . . . . . . . . . . . . . . . . . . . . . 2,184.4 163.4 11.9 2,335.9Industrial — Consumer Cyclical . . . . . . . . . . . . . . . . . . . . . . . . . . . . . . . . . . . 1,616.3 109.9 10.9 1,715.3Industrial — Consumer Non-Cyclical . . . . . . . . . . . . . . . . . . . . . . . . . . . . . . . 3,147.4 240.0 20.4 3,367.0Industrial — Energy . . . . . . . . . . . . . . . . . . . . . . . . . . . . . . . . . . . . . . . . . . 2,069.5 166.7 5.0 2,231.2Industrial — Other . . . . . . . . . . . . . . . . . . . . . . . . . . . . . . . . . . . . . . . . . . . 657.6 36.6 5.5 688.7Industrial — Technology . . . . . . . . . . . . . . . . . . . . . . . . . . . . . . . . . . . . . . . 793.8 42.0 5.8 830.0Industrial — Transportation . . . . . . . . . . . . . . . . . . . . . . . . . . . . . . . . . . . . . 679.7 39.9 11.3 708.3Utility — Electric . . . . . . . . . . . . . . . . . . . . . . . . . . . . . . . . . . . . . . . . . . . . 2,608.4 169.3 19.5 2,758.2Utility — Natural Gas . . . . . . . . . . . . . . . . . . . . . . . . . . . . . . . . . . . . . . . . . 1,073.2 75.1 3.4 1,144.9Utility — Other . . . . . . . . . . . . . . . . . . . . . . . . . . . . . . . . . . . . . . . . . . . . . 156.6 15.5 — 172.1FDIC guaranteed . . . . . . . . . . . . . . . . . . . . . . . . . . . . . . . . . . . . . . . . . . . . 95.6 2.0 — 97.6Government guaranteed . . . . . . . . . . . . . . . . . . . . . . . . . . . . . . . . . . . . . . . . 1,158.0 101.6 5.9 1,253.7
Total corporate securities . . . . . . . . . . . . . . . . . . . . . . . . . . . . . . . . . . . . . . 29,917.8 1,725.2 501.7 31,141.3
Residential pass-through securities . . . . . . . . . . . . . . . . . . . . . . . . . . . . . . . . . 3,047.8 122.1 5.9 3,164.0Commercial mortgage-backed securities . . . . . . . . . . . . . . . . . . . . . . . . . . . . . . 4,424.9 118.0 700.7 3,842.2Residential collateralized mortgage obligations (1) . . . . . . . . . . . . . . . . . . . . . . . 1,427.7 28.6 50.8 1,405.5Asset-backed securities — Home equity (2) . . . . . . . . . . . . . . . . . . . . . . . . . . . 432.1 0.6 72.5 360.2Asset-backed securities — All other . . . . . . . . . . . . . . . . . . . . . . . . . . . . . . . . 1,325.1 24.5 1.2 1,348.4Collateralized debt obligations — Credit . . . . . . . . . . . . . . . . . . . . . . . . . . . . . 90.8 — 36.4 54.4Collateralized debt obligations — CMBS . . . . . . . . . . . . . . . . . . . . . . . . . . . . . 113.8 0.4 36.8 77.4Collateralized debt obligations — Loans . . . . . . . . . . . . . . . . . . . . . . . . . . . . . 141.2 0.8 6.6 135.4Collateralized debt obligations — ABS (3) . . . . . . . . . . . . . . . . . . . . . . . . . . . . 34.7 0.5 9.4 25.8
Total mortgage-backed and other asset-backed securities . . . . . . . . . . . . . . . . . . 11,038.1 295.5 920.3 10,413.3
U.S. government and agencies . . . . . . . . . . . . . . . . . . . . . . . . . . . . . . . . . . . . 748.5 21.0 0.2 769.3States and political subdivisions . . . . . . . . . . . . . . . . . . . . . . . . . . . . . . . . . . . 2,615.0 64.7 23.3 2,656.4Non-U.S. governments . . . . . . . . . . . . . . . . . . . . . . . . . . . . . . . . . . . . . . . . . 389.3 34.9 — 424.2
Total fixed maturities, available-for-sale . . . . . . . . . . . . . . . . . . . . . . . . . . . . . $44,708.7 $2,141.3 $1,445.5 $45,404.5
(1) Includes exposure to Alt-a mortgage loans with an amortized cost of $54.9 million, gross unrealized gains of $0.2 million, gross unrealizedlosses of $5.5 million and a carrying amount of $49.6 million. The Alt-a portfolio has a weighted average rating of A- and 63% are 2005and prior vintages.
(2) This exposure is all related to sub-prime mortgage loans.
(3) Includes exposure to sub-prime mortgage loans with an amortized cost of $19.7 million, gross unrealized gains of $0.5 million, grossunrealized losses of $8.9 million and a carrying amount of $11.3 million.
69

December 31, 2009
Gross GrossAmortized unrealized unrealized Carrying
cost gains losses amount
(in millions)Finance — Banking . . . . . . . . . . . . . . . . . . . . . . . . . . . . . . . . . . . . . . . . . . $ 4,288.5 $ 68.2 $ 480.4 $ 3,876.3Finance — Brokerage . . . . . . . . . . . . . . . . . . . . . . . . . . . . . . . . . . . . . . . . . 428.6 11.0 6.4 433.2Finance — Finance Companies . . . . . . . . . . . . . . . . . . . . . . . . . . . . . . . . . . . 265.2 9.0 18.7 255.5Finance — Financial Other . . . . . . . . . . . . . . . . . . . . . . . . . . . . . . . . . . . . . . 535.6 26.0 8.6 553.0Finance — Insurance . . . . . . . . . . . . . . . . . . . . . . . . . . . . . . . . . . . . . . . . . 2,714.9 36.5 207.9 2,543.5Finance — REITS . . . . . . . . . . . . . . . . . . . . . . . . . . . . . . . . . . . . . . . . . . . 1,327.1 14.6 80.0 1,261.7Industrial — Basic Industry . . . . . . . . . . . . . . . . . . . . . . . . . . . . . . . . . . . . . . 1,921.4 74.9 19.1 1,977.2Industrial — Capital Goods . . . . . . . . . . . . . . . . . . . . . . . . . . . . . . . . . . . . . 2,364.0 99.1 33.0 2,430.1Industrial — Communications . . . . . . . . . . . . . . . . . . . . . . . . . . . . . . . . . . . . 2,761.6 174.3 21.8 2,914.1Industrial — Consumer Cyclical . . . . . . . . . . . . . . . . . . . . . . . . . . . . . . . . . . . 1,597.0 69.4 32.0 1,634.4Industrial — Consumer Non-Cyclical . . . . . . . . . . . . . . . . . . . . . . . . . . . . . . . 3,149.6 172.0 27.4 3,294.2Industrial — Energy . . . . . . . . . . . . . . . . . . . . . . . . . . . . . . . . . . . . . . . . . . 1,933.3 108.3 19.2 2,022.4Industrial — Other . . . . . . . . . . . . . . . . . . . . . . . . . . . . . . . . . . . . . . . . . . . 700.0 22.8 20.0 702.8Industrial — Technology . . . . . . . . . . . . . . . . . . . . . . . . . . . . . . . . . . . . . . . 765.0 31.6 11.2 785.4Industrial — Transportation . . . . . . . . . . . . . . . . . . . . . . . . . . . . . . . . . . . . . 934.9 41.7 18.4 958.2Utility — Electric . . . . . . . . . . . . . . . . . . . . . . . . . . . . . . . . . . . . . . . . . . . . 2,518.6 115.6 18.6 2,615.6Utility — Natural Gas . . . . . . . . . . . . . . . . . . . . . . . . . . . . . . . . . . . . . . . . . 1,086.2 66.0 7.4 1,144.8Utility — Other . . . . . . . . . . . . . . . . . . . . . . . . . . . . . . . . . . . . . . . . . . . . . 122.8 3.2 0.6 125.4FDIC guaranteed . . . . . . . . . . . . . . . . . . . . . . . . . . . . . . . . . . . . . . . . . . . . 96.1 1.4 — 97.5Government guaranteed . . . . . . . . . . . . . . . . . . . . . . . . . . . . . . . . . . . . . . . . 1,102.8 76.3 16.9 1,162.2
Total corporate securities . . . . . . . . . . . . . . . . . . . . . . . . . . . . . . . . . . . . . . 30,613.2 1,221.9 1,047.6 30,787.5
Residential pass-through securities . . . . . . . . . . . . . . . . . . . . . . . . . . . . . . . . . 3,019.1 86.0 3.8 3,101.3Commercial mortgage-backed securities . . . . . . . . . . . . . . . . . . . . . . . . . . . . . . 4,898.0 20.9 1,319.2 3,599.7Residential collateralized mortgage obligations (1) . . . . . . . . . . . . . . . . . . . . . . . 1,198.9 13.5 114.9 1,097.5Asset-backed securities — Home equity (2) . . . . . . . . . . . . . . . . . . . . . . . . . . . 487.1 — 173.1 314.0Asset-backed securities — All other . . . . . . . . . . . . . . . . . . . . . . . . . . . . . . . . 1,308.1 21.1 15.5 1,313.7Collateralized debt obligations — Credit . . . . . . . . . . . . . . . . . . . . . . . . . . . . . 197.2 1.5 67.0 131.7Collateralized debt obligations — CMBS . . . . . . . . . . . . . . . . . . . . . . . . . . . . . 257.0 — 129.4 127.6Collateralized debt obligations — Loans . . . . . . . . . . . . . . . . . . . . . . . . . . . . . 101.4 — 21.4 80.0Collateralized debt obligations — ABS (3) . . . . . . . . . . . . . . . . . . . . . . . . . . . . 51.9 0.3 21.9 30.3
Total mortgage-backed and other asset-backed securities . . . . . . . . . . . . . . . . . . 11,518.7 143.3 1,866.2 9,795.8
U.S. government and agencies . . . . . . . . . . . . . . . . . . . . . . . . . . . . . . . . . . . . 550.1 9.1 0.5 558.7States and political subdivisions . . . . . . . . . . . . . . . . . . . . . . . . . . . . . . . . . . . 2,008.7 53.4 13.5 2,048.6Non-U.S. governments . . . . . . . . . . . . . . . . . . . . . . . . . . . . . . . . . . . . . . . . . 421.1 42.4 1.1 462.4
Total fixed maturities, available-for-sale . . . . . . . . . . . . . . . . . . . . . . . . . . . . . $45,111.8 $1,470.1 $2,928.9 $43,653.0
(1) Includes exposure to Alt-a mortgage loans with an amortized cost of $59.6 million, gross unrealized losses of $18.2 million and a carryingamount of $41.4 million. The Alt-a portfolio has a weighted average rating of BBB and 66% are 2005 and prior vintages.
(2) This exposure is all related to sub-prime mortgage loans.
(3) Includes exposure to sub-prime mortgage loans with an amortized cost of $27.4 million, gross unrealized gains of $0.3 million, grossunrealized losses of $17.9 million and a carrying amount of $9.8 million.
Of the $1,445.5 million in gross unrealized losses as of December 31, 2010, there were $1.8 million in lossesattributed to securities scheduled to mature in one year or less, $50.5 million attributed to securities scheduled to maturebetween one to five years, $86.0 million attributed to securities scheduled to mature between five to ten years,$386.9 million attributed to securities scheduled to mature after ten years and $920.3 million related to mortgage-backedand other ABS that are not classified by maturity year. As of December 31, 2010, we were in a $695.8 million netunrealized gain position as compared to a $1,458.8 million net unrealized loss position as of December 31, 2009. Of the$2,154.6 million increase in net unrealized gains for the year ended December 31, 2010, an approximate $1.0 billion netunrealized gain can be attributed to an approximate 57 basis points decrease in interest rates and the remaining netunrealized gains related to other market factors.
Credit Disruption. The credit disruption in the market that began in the last half of 2007 from concerns in thesub-prime markets, and continued into 2008 and 2009 with concerns in the leveraged finance markets led to reducedliquidity and wider credit spreads. These credit concerns led to widespread forced selling into a very thinly traded market,which further strained market liquidity. This market disruption lowered valuations and, as a result, we saw an increase innet unrealized losses in our securities portfolio through the first quarter of 2009. The losses were more pronounced in theFinance sectors and in structured products such as collateralized debt obligations, ABS and CMBS. The decline in valuein large part reflected the illiquid markets. We concluded the prices of the securities in our securities portfolio weretemporarily depressed due to (1) the issuers’ continued satisfaction of the securities’ obligations in accordance with theircontractual terms, (2) the expectation the issuers will continue to satisfy their obligations given the evaluation of thefundamentals of the issuers’ financial condition and other objective evidence and (3) management not having the intentto sell these securities and as it is not more likely than not that we would be required to sell these securities before the
70

recovery of the amortized cost. During the second quarter of 2009 and continuing through the end of 2009, a narrowingof credit spreads and improvement in liquidity resulted in a decrease in the net unrealized losses in our securitiesportfolio. During the year ended December 31, 2010, gross unrealized losses continued to decrease relative to year-end2009, primarily due to a decline in interest rates and gross unrealized gains grew such that the securities portfolio is nowin a net unrealized gain position. Future changes in the fair value of these securities will be dependent on continuedimprovement in market liquidity and changes in general market conditions, including interest rates and credit spreadmovements.
Fixed Maturities Available-for-Sale Unrealized Losses. We believe that our long-term fixed maturities portfolio is welldiversified among industry types and between publicly traded and privately placed securities. Each year, we direct themajority of our net cash inflows into investment grade fixed maturities. The net cash inflows into investment grade fixedmaturities are less than prior years due to us investing in more liquid investments. Our current policy is to limit thepercentage of cash flow invested in below investment grade assets to 10% of cash flow. During 2010, we did not activelyincrease our investment in available-for-sale below investment grade assets. While Principal Life’s general accountinvestment returns have improved due to the below investment grade asset class, we manage its growth strategically bylimiting it to no more than 10% of the total fixed maturities portfolios.
We invest in privately placed fixed maturities to enhance the overall value of the portfolio, increase diversificationand obtain higher yields than are possible with comparable quality public market securities. Generally, privateplacements provide broader access to management information, strengthened negotiated protective covenants, callprotection features and, where applicable, a higher level of collateral. They are, however, generally not freely tradablebecause of restrictions imposed by federal and state securities laws and illiquid trading markets.
The following table presents our fixed maturities available-for-sale by investment grade and below investment gradeand the associated gross unrealized gains and losses, including other-than-temporary impairment losses reported in OCI,as of the periods indicated.
December 31, 2010 December 31, 2009
Gross Gross Gross GrossAmortized unrealized unrealized Carrying Amortized unrealized unrealized Carrying
cost gains losses amount cost gains losses amount
(in millions)Investment grade:
Public . . . . . . . . . . . . . . . . . . . . . . . . $28,496.5 $1,429.0 $ 394.5 $29,531.0 $28,439.8 $ 990.9 $1,015.0 $28,415.7Private . . . . . . . . . . . . . . . . . . . . . . . . 12,071.9 621.4 406.4 12,286.9 12,159.7 423.3 743.2 11,839.8
Below investment grade:Public . . . . . . . . . . . . . . . . . . . . . . . . 2,087.8 39.1 305.3 1,821.6 2,233.8 14.4 468.5 1,779.7Private . . . . . . . . . . . . . . . . . . . . . . . . 2,052.5 51.8 339.3 1,765.0 2,278.5 41.5 702.2 1,617.8
Total fixed maturities, available-for-sale . . . . $44,708.7 $2,141.3 $1,445.5 $45,404.5 $45,111.8 $1,470.1 $2,928.9 $43,653.0
The following tables present the carrying amount and the gross unrealized losses, including other-than-temporaryimpairment losses reported in OCI, on investment grade fixed maturities available-for-sale by aging category as of theperiods indicated.
December 31, 2010
Public Private Total
Gross Gross GrossCarrying unrealized Carrying unrealized Carrying unrealizedamount losses amount losses amount losses
(in millions)Three months or less . . . . . . . . . . . . . . . . . . . . . . . . . . $2,534.3 $ 45.9 $ 999.8 $ 21.9 $3,534.1 $ 67.8Greater than three to six months . . . . . . . . . . . . . . . . . . . 157.9 6.8 59.3 1.4 217.2 8.2Greater than six to nine months . . . . . . . . . . . . . . . . . . . 186.3 5.5 65.1 2.1 251.4 7.6Greater than nine to twelve months . . . . . . . . . . . . . . . . . 103.3 3.4 5.1 0.1 108.4 3.5Greater than twelve to twenty-four months . . . . . . . . . . . . 92.0 19.6 81.7 10.7 173.7 30.3Greater than twenty-four to thirty-six months . . . . . . . . . . . 541.6 86.1 437.0 89.4 978.6 175.5Greater than thirty-six months . . . . . . . . . . . . . . . . . . . . 1,440.9 227.2 1,485.5 280.8 2,926.4 508.0
Total fixed maturities, available-for-sale . . . . . . . . . . . . . $5,056.3 $394.5 $3,133.5 $406.4 $8,189.8 $800.9
71
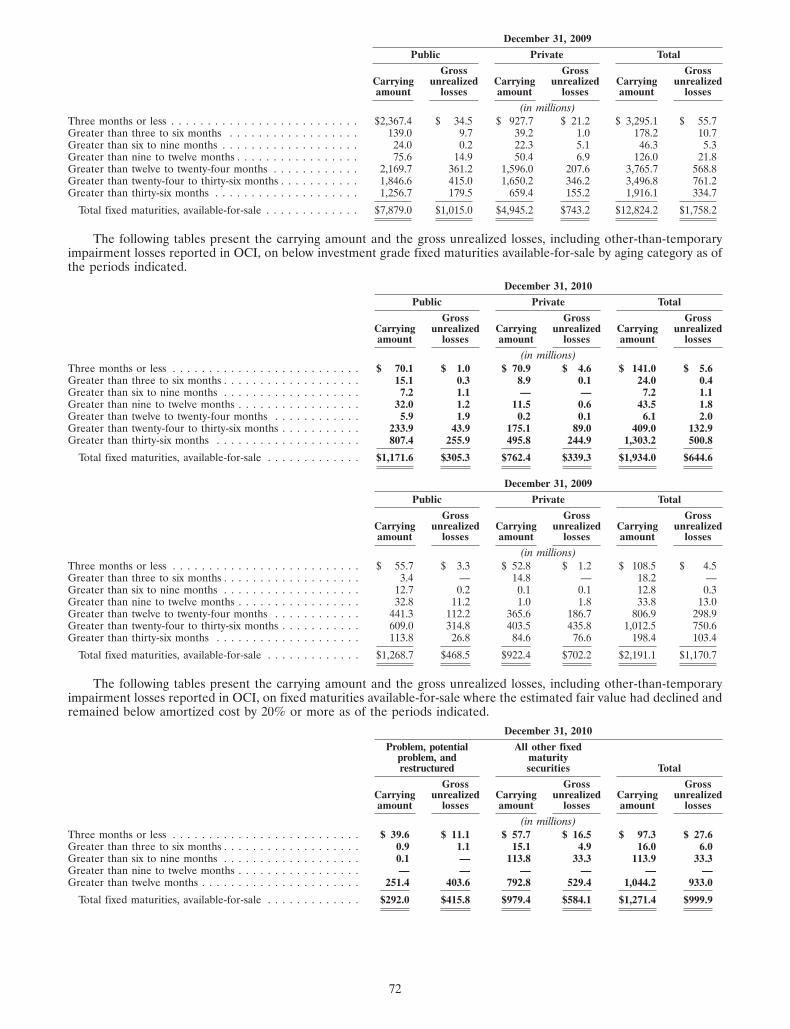
December 31, 2009
Public Private Total
Gross Gross GrossCarrying unrealized Carrying unrealized Carrying unrealizedamount losses amount losses amount losses
(in millions)Three months or less . . . . . . . . . . . . . . . . . . . . . . . . . . $2,367.4 $ 34.5 $ 927.7 $ 21.2 $ 3,295.1 $ 55.7Greater than three to six months . . . . . . . . . . . . . . . . . . 139.0 9.7 39.2 1.0 178.2 10.7Greater than six to nine months . . . . . . . . . . . . . . . . . . . 24.0 0.2 22.3 5.1 46.3 5.3Greater than nine to twelve months . . . . . . . . . . . . . . . . . 75.6 14.9 50.4 6.9 126.0 21.8Greater than twelve to twenty-four months . . . . . . . . . . . . 2,169.7 361.2 1,596.0 207.6 3,765.7 568.8Greater than twenty-four to thirty-six months . . . . . . . . . . . 1,846.6 415.0 1,650.2 346.2 3,496.8 761.2Greater than thirty-six months . . . . . . . . . . . . . . . . . . . . 1,256.7 179.5 659.4 155.2 1,916.1 334.7
Total fixed maturities, available-for-sale . . . . . . . . . . . . . $7,879.0 $1,015.0 $4,945.2 $743.2 $12,824.2 $1,758.2
The following tables present the carrying amount and the gross unrealized losses, including other-than-temporaryimpairment losses reported in OCI, on below investment grade fixed maturities available-for-sale by aging category as ofthe periods indicated.
December 31, 2010
Public Private Total
Gross Gross GrossCarrying unrealized Carrying unrealized Carrying unrealizedamount losses amount losses amount losses
(in millions)Three months or less . . . . . . . . . . . . . . . . . . . . . . . . . . $ 70.1 $ 1.0 $ 70.9 $ 4.6 $ 141.0 $ 5.6Greater than three to six months . . . . . . . . . . . . . . . . . . . 15.1 0.3 8.9 0.1 24.0 0.4Greater than six to nine months . . . . . . . . . . . . . . . . . . . 7.2 1.1 — — 7.2 1.1Greater than nine to twelve months . . . . . . . . . . . . . . . . . 32.0 1.2 11.5 0.6 43.5 1.8Greater than twelve to twenty-four months . . . . . . . . . . . . 5.9 1.9 0.2 0.1 6.1 2.0Greater than twenty-four to thirty-six months . . . . . . . . . . . 233.9 43.9 175.1 89.0 409.0 132.9Greater than thirty-six months . . . . . . . . . . . . . . . . . . . . 807.4 255.9 495.8 244.9 1,303.2 500.8
Total fixed maturities, available-for-sale . . . . . . . . . . . . . $1,171.6 $305.3 $762.4 $339.3 $1,934.0 $644.6
December 31, 2009
Public Private Total
Gross Gross GrossCarrying unrealized Carrying unrealized Carrying unrealizedamount losses amount losses amount losses
(in millions)Three months or less . . . . . . . . . . . . . . . . . . . . . . . . . . $ 55.7 $ 3.3 $ 52.8 $ 1.2 $ 108.5 $ 4.5Greater than three to six months . . . . . . . . . . . . . . . . . . . 3.4 — 14.8 — 18.2 —Greater than six to nine months . . . . . . . . . . . . . . . . . . . 12.7 0.2 0.1 0.1 12.8 0.3Greater than nine to twelve months . . . . . . . . . . . . . . . . . 32.8 11.2 1.0 1.8 33.8 13.0Greater than twelve to twenty-four months . . . . . . . . . . . . 441.3 112.2 365.6 186.7 806.9 298.9Greater than twenty-four to thirty-six months . . . . . . . . . . . 609.0 314.8 403.5 435.8 1,012.5 750.6Greater than thirty-six months . . . . . . . . . . . . . . . . . . . . 113.8 26.8 84.6 76.6 198.4 103.4
Total fixed maturities, available-for-sale . . . . . . . . . . . . . $1,268.7 $468.5 $922.4 $702.2 $2,191.1 $1,170.7
The following tables present the carrying amount and the gross unrealized losses, including other-than-temporaryimpairment losses reported in OCI, on fixed maturities available-for-sale where the estimated fair value had declined andremained below amortized cost by 20% or more as of the periods indicated.
December 31, 2010
Problem, potential All other fixedproblem, and maturityrestructured securities Total
Gross Gross GrossCarrying unrealized Carrying unrealized Carrying unrealizedamount losses amount losses amount losses
(in millions)Three months or less . . . . . . . . . . . . . . . . . . . . . . . . . . $ 39.6 $ 11.1 $ 57.7 $ 16.5 $ 97.3 $ 27.6Greater than three to six months . . . . . . . . . . . . . . . . . . . 0.9 1.1 15.1 4.9 16.0 6.0Greater than six to nine months . . . . . . . . . . . . . . . . . . . 0.1 — 113.8 33.3 113.9 33.3Greater than nine to twelve months . . . . . . . . . . . . . . . . . — — — — — —Greater than twelve months . . . . . . . . . . . . . . . . . . . . . . 251.4 403.6 792.8 529.4 1,044.2 933.0
Total fixed maturities, available-for-sale . . . . . . . . . . . . . $292.0 $415.8 $979.4 $584.1 $1,271.4 $999.9
72

December 31, 2009
Problem, potential All other fixedproblem, maturity
and restructured securities Total
Gross Gross GrossCarrying unrealized Carrying unrealized Carrying unrealizedamount losses amount losses amount losses
(in millions)Three months or less . . . . . . . . . . . . . . . . . . . . . . . . . . $ 6.1 $ 2.0 $ 243.8 $ 77.4 $ 249.9 $ 79.4Greater than three to six months . . . . . . . . . . . . . . . . . . . — — 31.8 9.2 31.8 9.2Greater than six to nine months . . . . . . . . . . . . . . . . . . . 0.1 0.1 46.0 22.5 46.1 22.6Greater than nine to twelve months . . . . . . . . . . . . . . . . . 28.8 24.8 49.9 25.4 78.7 50.2Greater than twelve months . . . . . . . . . . . . . . . . . . . . . . 276.8 438.3 1,812.8 1,578.5 2,089.6 2,016.8
Total fixed maturities, available-for-sale . . . . . . . . . . . . . $311.8 $465.2 $2,184.3 $1,713.0 $2,496.1 $2,178.2
Mortgage Loans
Mortgage loans consist of commercial mortgage loans on real estate and residential mortgage loans. The carryingamount of our commercial mortgage loan portfolio was $9,599.6 million and $10,121.8 million as of December 31, 2010and December 31, 2009, respectively. The carrying amount of our residential mortgage loan portfolio was $877.5 millionand $1,128.7 million as of December 31, 2010 and December 31, 2009, respectively.
Commercial Mortgage Loans. We generally report commercial mortgage loans on real estate at cost adjusted foramortization of premiums and accrual of discounts, computed using the interest method and net of valuation allowances.
Commercial mortgage loans play an important role in our investment strategy by:
• providing strong risk-adjusted relative value in comparison to other investment alternatives;
• enhancing total returns and
• providing strategic portfolio diversification.
As a result, we have focused on constructing a solid, high quality portfolio of mortgages. Our portfolio is generallycomprised of mortgages originated with conservative loan-to-value ratios, high debt service coverages and generalpurpose property types with a strong credit tenancy.
Our commercial mortgage loan portfolio consists of primarily non-recourse, fixed rate mortgages on fully or nearfully leased properties. The mortgage portfolio is comprised primarily of credit oriented retail properties, officeproperties and general-purpose industrial properties.
Our commercial mortgage loan portfolio is diversified by geography and specific collateral property type.Commercial mortgage lending in the state of California accounted for 22% and 20% of our commercial mortgage loanportfolio as of December 31, 2010 and 2009, respectively. We are, therefore, exposed to potential losses resulting fromthe risk of catastrophes, such as earthquakes, that may affect the region. Like other lenders, we generally do not requireearthquake insurance for properties on which we make commercial mortgage loans. With respect to Californiaproperties, however, we obtain an engineering report specific to each property. The report assesses the building’s designspecifications, whether it has been upgraded to meet seismic building codes and the maximum loss that is likely to resultfrom a variety of different seismic events. We also obtain a report that assesses, by building and geographic fault lines, theamount of loss our commercial mortgage loan portfolio might suffer under a variety of seismic events.
The typical borrower in our commercial loan portfolio is a single purpose entity or single asset entity. As ofDecember 31, 2010 and 2009, 30% and 31%, respectively, of the commercial mortgage loan portfolio was comprised ofmortgage loans with principal balances of less than $10.0 million. The total number of commercial mortgage loansoutstanding was 1,033 and 1,101 as of December 31, 2010 and 2009, respectively. The average loan size of our commercialmortgage portfolio was $9.4 million and $9.3 million as of December 31, 2010 and 2009, respectively.
Commercial Mortgage Loan Credit Monitoring. For further details on monitoring and management of our commercialmortgage loan portfolio, see Item 8. ‘‘Financial Statements and Supplementary Data, Notes to Consolidated FinancialStatements, Note 4, Investments — Mortgage Loan Credit Monitoring.’’
We categorize loans that are 60 days or more delinquent, loans in process of foreclosure and loans with borrowers orcredit tenants in bankruptcy that are delinquent as ‘‘problem’’ loans. Valuation allowances or charge-offs have beenrecognized on most problem loans. We categorize loans that are delinquent less than 60 days where the default isexpected to be cured and loans with borrowers or credit tenants in bankruptcy that are current as ‘‘potential problem’’loans. The decision whether to classify a loan delinquent less than 60 days as a potential problem involves significantsubjective judgments by management as to the likely future economic conditions and developments with respect to theborrower. We categorize loans for which the original note rate has been reduced below market and loans for which theprincipal has been reduced as ‘‘restructured’’ loans. We also consider loans that are refinanced more than one yearbeyond the original maturity or call date at below market rates as restructured.
73
The decrease in the level of problem, potential problem and restructured commercial mortgages during 2010 reflectsloan write downs, payoffs, loan sales and the internal refinance of several others at market terms. There was a significantincrease in the level of problem, potential problem, and restructured commercial mortgages during 2009 due to theimpact of the U.S. recession on commercial real estate. The job losses and record foreclosures in housing have negativelyimpacted property vacancy rates and rental rates. Areas significantly impacted by the recession include the SouthAtlantic, Mountain and Pacific regions, which account for the majority of the problem, potential problem andrestructured commercial mortgages as of December 31, 2010 and December 31, 2009. Apartment and retail properties inthose regions, which accounted for nearly half of the problem, potential problem and restructured commercial mortgagesas of December 31, 2010 and December 31, 2009, have been hit the hardest by the falling rents and occupancies. Many ofthe loans sold and refinanced during 2010 were apartments in the South Atlantic and Mountain regions.
The following table presents the carrying amounts of problem, potential problem and restructured commercialmortgages relative to the carrying amount of all commercial mortgages for the periods indicated.
December 31, December 31,2010 2009
($ in millions)Total commercial mortgages . . . . . . . . . . . . . . . . . . . . . . . . . . . . . . . . . . . . . . . . . . . $9,599.6 $10,121.8
Problem commercial mortgages (1) . . . . . . . . . . . . . . . . . . . . . . . . . . . . . . . . . . . . . . $ 35.7 $ 96.5Potential problem commercial mortgages . . . . . . . . . . . . . . . . . . . . . . . . . . . . . . . . . . . 317.7 521.0Restructured commercial mortgages . . . . . . . . . . . . . . . . . . . . . . . . . . . . . . . . . . . . . . 7.5 10.3
Total problem, potential problem and restructured commercial mortgages . . . . . . . . . . . . . $ 360.9 $ 627.8
Total problem, potential problem and restructured commercial mortgages as a percent oftotal commercial mortgages . . . . . . . . . . . . . . . . . . . . . . . . . . . . . . . . . . . . . . . . 3.76% 6.20%
(1) Includes $13.5 million of commercial mortgage loans in foreclosure as of December 31, 2010.
Commercial Mortgage Loan Valuation Allowance. The valuation allowance for commercial mortgage loans includesloan specific reserves for loans that are deemed to be impaired as well as reserves for pools of loans with similarcharacteristics where a property risk or market specific risk has not been identified but for which we expect to incur aloss. For further details on the commercial mortgage valuation allowance, see Item 8. ‘‘Financial Statements andSupplementary Data, Notes to Consolidated Financial Statements, Note 4, Investments — Mortgage Loan ValuationAllowance.’’
The valuation allowance for PFG decreased $51.9 million for the year ended December 31, 2010, and increased$75.5 million for the year ended December 31, 2009. The decrease in the level of valuation allowance during 2010 isprimarily related to loan write downs, payoffs and loan sales and the related release of valuation allowance, which ispartially offset by current period provisions. The increase in the level of valuation allowance during 2009 was related tothe same market factors as those causing the increase in the level of problem, potential problem and restructuredcommercial mortgages during 2009. The South Atlantic region accounts for the highest level of reserves at December 31,2010. The South Atlantic and Mountain regions account for the highest level of reserves at December 31, 2009.
The following table represents our commercial mortgage valuation allowance for the periods indicated.December 31, December 31,
2010 2009
($ in millions)Balance, beginning of period . . . . . . . . . . . . . . . . . . . . . . . . . . . . . . . . . . . . . . . . . . . . $ 132.5 $ 57.0Provision . . . . . . . . . . . . . . . . . . . . . . . . . . . . . . . . . . . . . . . . . . . . . . . . . . . . . . . . 54.1 115.4Charge-offs . . . . . . . . . . . . . . . . . . . . . . . . . . . . . . . . . . . . . . . . . . . . . . . . . . . . . . . (106.0) (39.9)
Balance, end of period . . . . . . . . . . . . . . . . . . . . . . . . . . . . . . . . . . . . . . . . . . . . . . . $ 80.6 $132.5
Valuation allowance as % of carrying value before reserves . . . . . . . . . . . . . . . . . . . . . . . . 0.83% 1.29%
Residential Mortgage Loans. The residential mortgage loan portfolio is composed of home equity mortgages of$719.3 million and $912.2 million and first lien mortgages of $195.9 million and $245.2 million as of December 31, 2010and 2009, respectively, primarily held by our Bank and Trust Services business. The home equity loans are generallysecond lien mortgages made up of closed-end loans and lines of credit. Non-performing residential mortgage loans, whichPFG defines as loans 90 days or greater delinquent plus non-accrual loans, totaled $24.0 million and $66.8 million as ofDecember 31, 2010 and 2009, respectively. We establish the residential mortgage loan valuation allowance at levelsconsidered adequate to absorb probable losses within the portfolio based on management’s evaluation of the size andcurrent risk characteristics of the portfolio. Such evaluation considers numerous factors, including, but not limited to netcharge-off trends, loss forecasts, collateral values, geographic location, borrower credit scores, delinquency rates, industrycondition and economic trends. The changes in the valuation allowance are reported in net realized capital gains (losses)on our consolidated statements of operations.
Our residential mortgage loan portfolio, and in particular our home equity loan portfolio, has experienced anincrease in loss severity from sustained elevated levels of unemployment along with continued depressed collateral
74

values. The deterioration has resulted in an increase in delinquencies. The following table represents our residentialmortgage valuation allowance for the periods indicated.
December 31, December 31,2010 2009
($ in millions)Balance, beginning of period . . . . . . . . . . . . . . . . . . . . . . . . . . . . . . . . . . . . . . . . . . . . $ 28.7 $ 12.1Provision . . . . . . . . . . . . . . . . . . . . . . . . . . . . . . . . . . . . . . . . . . . . . . . . . . . . . . . . 97.6 32.9Charge-offs/recoveries . . . . . . . . . . . . . . . . . . . . . . . . . . . . . . . . . . . . . . . . . . . . . . . . (88.6) (16.3)
Balance, end of period . . . . . . . . . . . . . . . . . . . . . . . . . . . . . . . . . . . . . . . . . . . . . . . $ 37.7 $ 28.7
Valuation allowance as % of carrying value before reserves . . . . . . . . . . . . . . . . . . . . . . . . 4.1% 2.5%
Real Estate
Real estate consists primarily of commercial equity real estate. As of December 31, 2010 and 2009, the carryingamount of our equity real estate investment was $1,052.3 million, or 2%, and $1,022.2 million, or 2%, of U.S. investedassets, respectively. Our commercial equity real estate is held in the form of wholly owned real estate, real estate acquiredupon foreclosure of commercial mortgage loans and majority owned interests in real estate joint ventures.
Equity real estate is categorized as either ‘‘real estate held for investment’’ or ‘‘real estate held for sale.’’ Real estateheld for investment totaled $1,010.7 million and $998.4 million as of December 31, 2010 and 2009, respectively. Thecarrying value of real estate held for investment is generally adjusted for impairment whenever events or changes incircumstances indicate that the carrying amount of the asset may not be recoverable. Such impairment adjustments arerecorded as net realized losses and, accordingly, are reflected in our consolidated results of operations. For the yearsended December 31, 2010 and 2009, there were no such impairment adjustments.
The carrying amount of real estate held for sale was $41.6 million and $23.8 million as of December 31, 2010 and2009, respectively. There were no valuation allowances as of December 31, 2010 or 2009. Once we identify a real estateproperty to be sold and commence a plan for marketing the property, we classify the property as held for sale. Weestablish a valuation allowance subject to periodic revisions, if necessary, to adjust the carrying value of the property toreflect the lower of its current carrying value or the fair value, less associated selling costs.
We use research, both internal and external, to recommend appropriate product and geographic allocations andchanges to the equity real estate portfolio. We monitor product, geographic and industry diversification separately andtogether to determine the most appropriate mix.
Equity real estate is distributed across geographic regions of the country with larger concentrations in the SouthAtlantic and West South Central regions of the United States as of December 31, 2010. By property type, there is aconcentration in office, industrial, retail, and apartments that represented approximately 92% of the equity real estateportfolio as of December 31, 2010.
Other Investments
Our other investments totaled $1,486.3 million as of December 31, 2010, compared to $1,480.2 million as ofDecember 31, 2009. Derivative assets accounted for $1,058.5 million and $1,212.7 million in other investments as ofDecember 31, 2010 and 2009, respectively. The remaining invested assets include equity method investments, whichinclude real estate properties owned jointly with venture partners and operated by the partners.
International Investment Operations
Of our invested assets, $5.4 billion were held by our Principal International segment as of December 31, 2010. Theassets are managed by either our Principal Global Investors segment or by the local Principal International affiliate. Dueto the regulatory constraints in each country, each company maintains its own investment policies. As shown in thefollowing table, the major categories of international invested assets as of December 31, 2010 and 2009, were fixed
75

maturities, other investments and residential mortgage loans. The following table excludes invested assets of the separateaccounts.
December 31, 2010 December 31, 2009
Carrying amount % of total Carrying amount % of total
($ in millions)Fixed maturities — Public . . . . . . . . . . . . . . . . . . . . . . . . $3,470.2 65% $2,767.1 62%Equity securities . . . . . . . . . . . . . . . . . . . . . . . . . . . . . . 62.7 1 46.7 1Mortgage loans — Commercial . . . . . . . . . . . . . . . . . . . . 9.4 — 7.5 —Mortgage loans — Residential . . . . . . . . . . . . . . . . . . . . . 638.6 12 587.6 14Real estate . . . . . . . . . . . . . . . . . . . . . . . . . . . . . . . . . 11.2 — 12.4 —Policy loans . . . . . . . . . . . . . . . . . . . . . . . . . . . . . . . . . 24.2 — 21.2 1Other investments . . . . . . . . . . . . . . . . . . . . . . . . . . . . . 1,155.3 22 985.1 22
Total invested assets . . . . . . . . . . . . . . . . . . . . . . . . . . 5,371.6 100% 4,427.6 100%
Cash and cash equivalents . . . . . . . . . . . . . . . . . . . . . . . . 60.2 48.1
Total invested assets and cash . . . . . . . . . . . . . . . . . . . . $5,431.8 $4,475.7
Investments in equity method subsidiaries and direct financing leases accounted for $667.0 million and$443.1 million, respectively, of other investments as of December 31, 2010. Investments in equity method subsidiaries anddirect financing leases accounted for $578.7 million and $375.2 million, respectively, of other investments as ofDecember 31, 2009. The remaining other investments as of both December 31, 2010 and 2009, are primarily related toderivative assets and other short-term investments.
76

Item 7A. Quantitative and Qualitative Disclosures About Market Risk
Market Risk Exposures and Risk Management
Market risk is the risk that we will incur losses due to adverse fluctuations in market rates and prices. Our primarymarket risk exposure is to changes in interest rates, although we also have exposures to changes in equity prices andforeign currency exchange rates.
We enter into market-sensitive instruments primarily for purposes other than trading. The active management ofmarket risk is an integral part of our operations. We manage our overall market risk exposure within established risktolerance ranges by using the following approaches:
• rebalance our existing asset or liability portfolios;
• control the risk structure of newly acquired assets and liabilities or
• use derivative instruments to modify the market risk characteristics of existing assets or liabilities or assetsexpected to be purchased.
Interest Rate Risk
Interest rate risk is the risk that we will incur economic losses due to adverse changes in interest rates. One source ofinterest rate risk is the inherent difficulty in obtaining assets that mature or have their rate reset at the exact same time asthe liabilities they support. Assets may have to be reinvested or sold in the future to meet the liability cash flows inunknown interest rate environments. Secondly, there may be timing differences between when new liabilities are pricedand when assets are purchased or procured that can cause fluctuations in profitability if interest rates move materially inthe interim. A third source of interest rate risk is the prepayment options embedded within asset and liability contractsthat can alter the cash flow profiles from what was originally expected.
One of the measures we use to quantify our exposure to interest rate risk is duration. To calculate duration, weproject asset and liability cash flows. These cash flows are discounted to a net present value basis using a spot yield curve,which is a blend of the spot yield curves for each of the asset types in the portfolio. Duration is calculated byre-calculating these cash flows, re-determining the net present value based upon an alternative level of interest rates, anddetermining the percentage change in fair value.
We manage interest rate risks in a number of ways. Differences in durations between assets and liabilities aremeasured and kept within acceptable tolerances. Derivatives are also commonly used to mitigate interest rate risk due tocash flow mismatches and timing differences. Prepayment risk is controlled by limiting our exposure to investments thatare prepayable without penalty prior to maturity at the option of the issuer. We also require additional yield on theseinvestments to compensate for the risk the issuer will exercise such option. Prepayment risk is also controlled by limitingthe sales of liabilities with features such as puts or other options that can be exercised against the company atinopportune times. For example, as of December 31, 2010, approximately $11.7 billion, or 98%, of our institutional GICsand funding agreements cannot be redeemed by contractholders prior to maturity.
We are also exposed to interest rate risk based upon the discount rate assumption used for purposes of valuing ourpension and other post retirement benefit obligations. For further discussion of interest rate risk associated with theseobligations, see Item 7. ‘‘Management’s Discussion and Analysis of Financial Condition and Results of Operation —Critical Accounting Policies and Estimates — Benefit Plans.’’
Duration-Managed. Our exposure to interest rate risk stems largely from our substantial holdings of guaranteedfixed rate liabilities in our Retirement and Investor Services segment. We actively manage the duration of assets andliabilities in these products by minimizing the difference between the two.
As of December 31, 2010, the difference between the asset and liability durations on our primary duration-managedportfolio was �0.28, as compared to �0.12 as of December 31, 2009. This duration gap indicates that, as ofDecember 31, 2010, the sensitivity of the fair value of our assets to interest rate movements is less than that of the fairvalue of our liabilities. Our goal is to minimize the duration gap. Currently, our guidelines indicate that total durationgaps between the asset and liability portfolios should be within +/-0.25. As of December 31, 2010, the mismatch is slightlyoutside of our duration gap guideline due to temporary asset and liability spread mismatches. However, our cash flowstudies reflect our general practice to hold assets and liabilities to maturity and indicate that the interest rate risk issufficiently managed. The value of the assets in this portfolio was $26,601.9 million and $28,377.1 million as ofDecember 31, 2010 and 2009, respectively.
Duration-Monitored. For products such as whole life insurance and term life insurance that are less sensitive tointerest rate risk, and for other products such as individual fixed deferred annuities, we manage interest rate risk based ona modeling process that considers the target average life, maturities, crediting rates and assumptions of policyholderbehavior. As of December 31, 2010, the weighted-average difference between the asset and liability durations on theseportfolios was �1.54, as compared to �0.16 as of December 31, 2009. This duration gap indicates that, as ofDecember 31, 2010, the sensitivity of the fair value of our assets to interest rate movements is less than that of the fairvalue of our liabilities. We attempt to monitor this duration gap consistent with our overall risk/reward tolerances. The
77

value of the assets in these portfolios was $24,720.0 million and $22,497.1 million as of December 31, 2010 and 2009,respectively.
Non Duration-Managed. We also have a block of participating general account pension business that passes most ofthe actual investment performance of the assets to the customer. The investment strategy of this block is to maximizeinvestment return to the customer on a ‘‘best efforts’’ basis, and there is little or no attempt to manage the duration ofthis portfolio since there is little or no interest rate risk. The value of the assets in these portfolios was $5,167.8 millionand $5,745.5 million as of December 31, 2010 and 2009, respectively.
Using the assumptions and data in effect as of December 31, 2010, we estimate that a 100 basis point immediate,parallel increase in interest rates increases the net fair value of our portfolio by approximately $455.4 million, comparedwith an estimated $71.1 million increase as of December 31, 2009. The following table details the estimated changes byrisk management strategy. The table also gives the weighted-average duration of the asset portfolio for each category,and the net duration gap (i.e., the weighted-average difference between the asset and liability durations).
December 31, 2010
Net NetValue of Duration duration fair value
Risk Management Strategy total assets of assets gap change
(in millions) (in millions)Primary duration-managed . . . . . . . . . . . . . . . . . . . . . . . . . . . . . . . . $26,601.9 3.53 (0.28) $ 74.5Duration-monitored . . . . . . . . . . . . . . . . . . . . . . . . . . . . . . . . . . . . 24,720.0 4.18 (1.54) 380.9Non duration-managed . . . . . . . . . . . . . . . . . . . . . . . . . . . . . . . . . . 5,167.8 3.86 N/A N/A
Total . . . . . . . . . . . . . . . . . . . . . . . . . . . . . . . . . . . . . . . . . . . . $56,489.7 $455.4
Our selection of a 100 basis point immediate, parallel increase or decrease in interest rates is a hypothetical ratescenario we use to demonstrate potential risk. While a 100 basis point immediate, parallel increase does not representour view of future market changes, it is a near term reasonably possible hypothetical change that illustrates the potentialimpact of such events. While these fair value measurements provide a representation of interest rate sensitivity, they arebased on our portfolio exposures at a point in time and may not be representative of future market results. Theseexposures will change as a result of ongoing portfolio transactions in response to new business, management’s assessmentof changing market conditions and available investment opportunities.
See Item 7. ‘‘Management’s Discussion and Analysis of Financial Condition and Results of Operation — CriticalAccounting Policies and Estimates — Valuation and Impairment of Fixed Income Investments’’ for additional discussionof the impact interest rate increases would have on fixed maturities, available-for-sale.
Debt Issued and Outstanding. The primary risk for our long-term borrowings is interest rate risk at the time ofmaturity or early redemption, when we may be required to refinance these obligations. We continue to monitor theinterest rate environment and to evaluate refinancing opportunities as maturity dates approach.
The aggregate fair value of long-term debt, excluding accrued interest, was $1,756.3 million and $1,608.4 million, asof December 31, 2010 and 2009, respectively. As of December 31, 2010, a 100 basis point immediate, parallel decrease ininterest rates would increase the fair value of debt by approximately $143.1 million, as compared to an estimated$132.6 million increase as of December 31, 2009. As of December 31, 2010, a 100 basis point immediate, parallel increasein interest rates would decrease the fair value of debt by approximately $128.4 million, as compared to an estimated$114.3 million decrease as of December 31, 2009. Debt is not recorded at fair value on the consolidated statements offinancial position.
Our selection of a 100 basis point immediate, parallel increase or decrease in interest rates is a hypothetical ratescenario we use to demonstrate potential risk. While a 100 basis point immediate, parallel increase or decrease does notrepresent our view of future market changes, it is a near term reasonably possible hypothetical change that illustrates thepotential impact of such events. While these fair value measurements provide a representation of interest rate sensitivity,they are based on our long-term debt obligations at a point in time and may not be representative of future obligations.These exposures will change as a result of ongoing changes to our outstanding long-term debt obligations.
For additional information regarding our debt, see Item 8. ‘‘Financial Statements and Supplementary Data, Notes toConsolidated Financial Statements, Note 9, Debt.’’
Use of Derivatives to Manage Interest Rate Risk. We use or have previously used various derivative financialinstruments to manage our exposure to fluctuations in interest rates, including interest rate swaps, interest rate collars,swaptions, futures and options. We use interest rate swaps and futures contracts to hedge changes in interest ratessubsequent to the issuance of an insurance liability, such as a guaranteed investment contract, but prior to the purchase ofa supporting asset, or during periods of holding assets in anticipation of near term liability sales. We use interest rateswaps primarily to more closely match the interest rate characteristics of assets and liabilities. They can be used to changethe sensitivity to the interest rate of specific assets and liabilities as well as an entire portfolio. We use interest rate collarsto manage interest rate risk related to guaranteed minimum interest rate liabilities in our individual annuities contracts.
78

We purchase swaptions to offset existing exposures. Occasionally, we have sold a callable investment-type agreement andused written interest rate swaptions to transform the callable liability into a fixed term liability.
Derivatives in our portfolio with interest rate sensitivity were in a net liability position with a fair value of$309.9 million and $130.7 million as of December 31, 2010 and 2009, respectively. The following table shows the interestrate sensitivity of our derivatives measured in terms of fair value. These exposures will change as a result of ongoingportfolio and risk management activities.
December 31, 2010
Fair value (no accrued interest)
Weighted average �100 basis point +100 basis pointNotional amount term (years) (1) change No change change
($ in millions)Interest rate swaps . . . . . . . . . . . . . . . . $19,803.0 5.35 $(361.8) $(311.7) $(255.7)Interest rate collars . . . . . . . . . . . . . . . 500.0 12.15 15.3 1.7 (8.4)Swaptions . . . . . . . . . . . . . . . . . . . . . . 68.5 1.16 — 0.1 0.5Futures (2) . . . . . . . . . . . . . . . . . . . . . 0.8 0.24 — — —
Total . . . . . . . . . . . . . . . . . . . . . . . $20,372.3 $(346.5) $(309.9) $(263.6)
(1) Based on maturity date.
(2) We use U.S. Treasury futures to manage our over/under commitment position, and our position in these contracts changes daily.
Our selection of a 100 basis point immediate, parallel increase or decrease in interest rates is a hypothetical ratescenario we use to determine potential risk. While a 100 basis point immediate, parallel increase or decrease does notrepresent our view of future market changes, it is a near term reasonably possible hypothetical change that illustrates thepotential impact of such events. While these fair value measurements provide a representation of interest rate sensitivity,they are based on our derivative portfolio exposures at a point in time and may not be representative of future marketresults. These exposures will change as a result of ongoing derivative transactions.
Foreign Currency Risk
Foreign currency risk is the risk that we will incur economic losses due to adverse fluctuations in foreign currencyexchange rates. This risk arises from foreign currency-denominated funding agreements issued to nonqualifiedinstitutional investors in the international market, foreign currency-denominated fixed maturities and our internationaloperations.
We estimate that as of December 31, 2010, a 10% immediate unfavorable change in each of the foreign currencyexchange rates to which we are exposed would result in no material change to the net fair value of our foreign currencydenominated instruments identified above because we effectively hedge foreign currency denominated instruments tominimize exchange rate impacts, which is consistent with our estimate as of December 31, 2009. However, fluctuations inforeign currency exchange rates do affect the translation of operating earnings and equity of our international operationsinto our consolidated financial statements.
For our Principal International segment, we estimate that a 10% immediate unfavorable change in each of theforeign currency exchange rates to which we were exposed would have resulted in a $161.6 million, or 10%, reduction inthe total equity excluding noncontrolling interests of our international operations as of December 31, 2010, as comparedto an estimated $135.7 million, or 10%, reduction as of December 31, 2009. We estimate that a 10% unfavorable changein the average foreign currency exchange rates to which we were exposed through our international operations wouldhave resulted in a $14.8 million, or 11%, reduction in the operating earnings of our international operations for the yearended December 31, 2010, as compared to an estimated $12.8 million, or 11%, reduction for the year endedDecember 31, 2009.
The selection of a 10% immediate unfavorable change in all currency exchange rates should not be construed as aprediction by us of future market events, but rather as an illustration of the potential impact of such an event. Theseexposures will change as a result of a change in the size and mix of our foreign operations.
Use of Derivatives to Manage Foreign Currency Risk. The foreign currency risk on funding agreements and fixedmaturities is mitigated by using currency swaps that swap the foreign currency interest and principal payments to ourfunctional currency. The notional amount of our currency swap agreements associated with foreign-denominatedliabilities was $2,995.4 million and $3,386.0 million as of December 31, 2010 and 2009, respectively. The notional amountof our currency swap agreements associated with foreign-denominated fixed maturities was $1,558.5 million and$1,867.2 million as of December 31, 2010 and 2009, respectively.
With regard to our international operations, we attempt to do as much of our business as possible in the functionalcurrency of the country of operation. At times, however, we are unable to do so, and in these cases, we use foreignexchange derivatives to economically hedge the resulting risks. Our operations in Chile had currency swaps with anotional amount of $61.3 million and $31.2 million as of December 31, 2010 and 2009, respectively, which were used toswap cash flows on U.S. dollar-denominated bonds to a local currency. Chile also utilized currency forwards with a
79

notional amount of $72.3 million and $91.5 million as of December 31, 2010 and 2009, respectively, in order to mitigatecurrency exposure related to bonds denominated in currencies other than Chilean pesos.
Additionally, from time to time we take measures to hedge our net equity investments in our foreign subsidiariesfrom currency risks. There were no outstanding net equity investment hedges in 2010 or 2009.
Equity Risk
Equity risk is the risk that we will incur economic losses due to adverse fluctuations in a particular common stock. Asof December 31, 2010 and 2009, the fair value of our equity securities was $486.8 million and $435.5 million, respectively.As of December 31, 2010, a 10% decline in the value of the equity securities would result in an unrealized loss of$48.7 million, as compared to an estimated unrealized loss of $43.6 million as of December 31, 2009.
We are also exposed to the risk that asset-based fees decrease as a result of declines in assets under management dueto change in investment prices and the risk that asset management fees calculated by reference to performance could belower. We estimate that an immediate 10% decline in the Standard & Poor’s index, followed by a 2% per quarter increasewould reduce our annual operating earnings by approximately four to six percent. The risk of decreased asset-based andasset management fees could also impact our estimates of total gross profits used as a basis for amortizing deferred policyacquisition costs and other actuarial balances. For further discussion, see Item 7. ‘‘Management’s Discussion and Analysisof Financial Condition and Results of Operation — Critical Accounting Policies and Estimates — Deferred PolicyAcquisition Costs and Other Actuarial Balances.’’
The selection of a 10% unfavorable change in the equity markets should not be construed as a prediction by us offuture market events, but rather as an illustration of the potential impact of such an event. Our exposure will change as aresult of changes in our mix of business.
We also have equity risk associated with (1) fixed deferred annuity contracts that credit interest to customers basedon changes in an external equity index; (2) variable annuity contracts that have a GMWB rider that allows the customerto receive at least the principal deposit back through withdrawals of a specified annual amount, even if the account valueis reduced to zero; (3) variable annuity contacts that have a GMDB that allows the death benefit to be paid, even if theaccount value has fallen below the GMDB amount; (4) investment-type contracts in which the return is tied to anexternal equity index and (5) investment-type contracts in which the return is subject to minimum contractual guarantees.We are also subject to equity risk based upon the assets that support our benefit plans. For further discussion of equityrisk associated with these plans, see Item 7. ‘‘Management’s Discussion and Analysis of Financial Condition and Resultsof Operation — Critical Accounting Policies and Estimates — Benefit Plans.’’
Use of Derivatives to Manage Equity Risk. We economically hedge the fixed deferred annuity product, where theinterest credited is linked to an external equity index, by purchasing options that match the product’s profile. Weeconomically hedge the GMWB exposure, which includes interest rate risk and equity risk, using futures, options andinterest rate swaps. We economically hedge the investment contract exposure to an external equity index using equity calloptions.
The fair value of both the GMWB embedded derivative and associated hedging instruments are sensitive to financialmarket conditions and the variance related to the change in fair value of these items for a given period is largelydependent on market conditions at the end of the period. We recognized a pre-tax gain (loss) on the derivatives used toeconomically hedge our GMWB market risk of $(21.2) million and $(191.7) million for the years ended December 31,2010 and 2009, respectively. We recognized a pre-tax gain (loss) on the change in fair value of the GMWB embeddedderivative that is primarily related to market risk impacts, of $16.2 million and $197.5 million for the years endedDecember 31, 2010 and 2009, respectively. Additionally, we recognized a pre-tax gain (loss) on the change in value of theGMWB liability, including the embedded derivative, of $(13.7) million and $(196.9) million for the years endedDecember 31, 2010 and 2009, respectively, primarily related to incorporating a spread reflecting our owncreditworthiness. We reflect the actual and expected changes in value of the GMWB embedded derivative and theassociated hedging instruments in our estimated gross profits, which resulted in a pre-tax increase (decrease) in DPACamortization of $9.4 million and $(78.6) million for the years ended December 31, 2010 and 2009, respectively.
Credit Risk
Credit risk relates to the uncertainty associated with the continued ability of a given obligor to make timely paymentsof principal and interest. Our ability to manage credit risk is essential to our business and our profitability. See Item 7.‘‘Management’s Discussion and Analysis of Financial Condition and Results of Operations — Investments’’ foradditional information about credit risk.
Use of Derivatives to Diversify or Hedge Credit Risk. We purchase credit default swaps to hedge credit exposures inour investment portfolio. We sell credit default swaps to offer credit protection to investors. When selling creditprotection, if there is an event of default by the referenced name, we are obligated to pay the counterparty the referencedamount of the contract and receive in return the referenced security. For further information on credit derivatives sold,see Item 8. ‘‘Financial Statements and Supplementary Data, Notes to Consolidated Financial Statements, Note 5,Derivative Financial Instruments’’ under the caption, ‘‘Credit Derivatives Sold.’’
80

We economically hedged credit exposure in our portfolio by purchasing credit default swaps with a notional amountof $374.5 million and $448.5 million as of December 31, 2010 and 2009, respectively. We had credit exposure throughcredit default swaps with a notional amount of $140.0 million and $15.0 million as of December 31, 2010 and 2009,respectively, by investing in various tranches of synthetic collateralized debt obligations. In addition, we sold creditdefault swaps creating replicated assets with a notional amount of $967.9 million and $1,122.9 million as of December 31,2010 and 2009, respectively.
Derivative Counterparty Risk
In conjunction with our use of derivatives, we are exposed to counterparty risk, or the risk that the counterparty failsto perform the terms of the derivative contract. We actively manage this risk by:
• obtaining approval of all new counterparties by the Investment Committee;
• establishing exposure limits that take into account non-derivative exposure we have with the counterparty as wellas derivative exposure;
• performing similar credit analysis prior to approval on each derivatives counterparty that we do when lendingmoney on a long-term basis;
• diversifying our risk across numerous approved counterparties;
• implementing credit support annex (collateral) agreements (‘‘CSAs’’) with majority of counterparties to furtherlimit counterparty exposures, which provide for netting of exposures;
• limiting exposure to A+ credit or better for counterparties without CSAs;
• conducting stress-test analysis to determine the maximum exposure created during the life of a prospectivetransaction and
• daily monitoring of counterparty credit ratings, exposures and associated collateral levels.
We believe the risk of incurring losses due to nonperformance by our counterparties is manageable. For furtherinformation on derivatives, see Item 8. ‘‘Financial Statements and Supplementary Data, Notes to Consolidated FinancialStatements, Note 5, Derivative Financial Instruments.’’
Based on our accounting policy, our disclosed exposure measures the fair value of derivatives that have becomefavorable to us and, therefore, is a combined credit exposure if all of the involved counterparties failed to fulfill theirobligations. In the hypothetical scenario where all of our counterparties fail to fulfill their obligations, our exposurewould be $1,177.0 million; however, including collateral received our exposure would be reduced to $927.8 million atDecember 31, 2010. For further information on derivative exposure, see Item 8. ‘‘Financial Statements andSupplementary Data, Notes to Consolidated Financial Statements, Note 5, Derivative Financial Instruments’’ under thecaption, ‘‘Exposure.’’
We manage our exposure on a net basis, whereby we net positive and negative exposures for each counterparty withagreements in place. Netting positive and negative exposures would yield an exposure of $315.3 million, which is reducedto $66.1 million with pledged collateral at December 31, 2010. As of December 31, 2010, we held total collateral of$249.2 million in the form of cash and securities and we posted $376.8 million in cash and securities as collateral to ourcounterparties. We have not incurred any material losses on derivative financial instruments due to counterpartynonperformance. As a result of our management of our counterparty risk and the collateralization of our derivativeportfolio, any deterioration in our derivative counterparties’ credit would not materially impact our financial statementsas of December 31, 2010.
81

Item 8. Financial Statements and Supplementary Data
Report of Independent Registered Public Accounting Firm on Internal Control Over Financial Reporting . . . . 83Report of Independent Registered Public Accounting Firm . . . . . . . . . . . . . . . . . . . . . . . . . . . . . . . . . . . . . 84Audited Consolidated Financial Statements
Consolidated Statements of Financial Position . . . . . . . . . . . . . . . . . . . . . . . . . . . . . . . . . . . . . . . . . . . . . 85Consolidated Statements of Operations . . . . . . . . . . . . . . . . . . . . . . . . . . . . . . . . . . . . . . . . . . . . . . . . . . 86Consolidated Statements of Stockholders’ Equity . . . . . . . . . . . . . . . . . . . . . . . . . . . . . . . . . . . . . . . . . . . 87Consolidated Statements of Cash Flows . . . . . . . . . . . . . . . . . . . . . . . . . . . . . . . . . . . . . . . . . . . . . . . . . 89Notes to Consolidated Financial Statements . . . . . . . . . . . . . . . . . . . . . . . . . . . . . . . . . . . . . . . . . . . . . . 90
82

Report of Independent Registered Public Accounting Firmon Internal Control Over Financial Reporting
The Board of Directors and StockholdersPrincipal Financial Group, Inc.
We have audited Principal Financial Group, Inc.’s internal control over financial reporting as of December 31, 2010,based on criteria established in Internal Control — Integrated Framework issued by the Committee of SponsoringOrganizations of the Treadway Commission (‘‘the COSO criteria’’). Management of Principal Financial Group, Inc. (‘‘theCompany’’) is responsible for maintaining effective internal control over financial reporting, and for its assessment of theeffectiveness of internal control over financial reporting included in the accompanying Management’s Report on InternalControl Over Financial Reporting. Our responsibility is to express an opinion on the Company’s internal control overfinancial reporting based on our audit.
We conducted our audit in accordance with the standards of the Public Company Accounting Oversight Board(United States). Those standards require that we plan and perform the audit to obtain reasonable assurance aboutwhether effective internal control over financial reporting was maintained in all material respects. Our audit includedobtaining an understanding of internal control over financial reporting, assessing the risk that a material weakness exists,testing and evaluating the design and operating effectiveness of internal control based on the assessed risk, andperforming such other procedures as we considered necessary in the circumstances. We believe that our audit provides areasonable basis for our opinion.
A company’s internal control over financial reporting is a process designed to provide reasonable assuranceregarding the reliability of financial reporting and the preparation of financial statements for external purposes inaccordance with generally accepted accounting principles. A company’s internal control over financial reporting includesthose policies and procedures that (1) pertain to the maintenance of records that, in reasonable detail, accurately andfairly reflect the transactions and dispositions of the assets of the company; (2) provide reasonable assurance thattransactions are recorded as necessary to permit preparation of financial statements in accordance with generallyaccepted accounting principles, and that receipts and expenditures of the company are being made only in accordancewith authorizations of management and directors of the Company; and (3) provide reasonable assurance regardingprevention or timely detection of unauthorized acquisition, use, or disposition of the Company’s assets that could have amaterial effect on the financial statements.
Because of its inherent limitations, internal control over financial reporting may not prevent or detect misstatements.Also, projections of any evaluation of effectiveness to future periods are subject to the risk that controls may becomeinadequate because of changes in conditions, or that the degree of compliance with the policies or procedures maydeteriorate.
In our opinion, Principal Financial Group, Inc. maintained, in all material respects, effective internal control overfinancial reporting as of December 31, 2010, based on the COSO criteria.
We also have audited, in accordance with the standards of the Public Company Accounting Oversight Board (UnitedStates), the consolidated statements of financial position of Principal Financial Group, Inc. as of December 31, 2010 and2009, and the related consolidated statements of operations, stockholders’ equity and cash flows for each of the threeyears in the period ended December 31, 2010, and our report dated February 16, 2011, expressed an unqualified opinionthereon.
/s/ Ernst & Young LLP
Des Moines, IowaFebruary 16, 2011
83
Report of Independent Registered Public Accounting Firm
The Board of Directors and StockholdersPrincipal Financial Group, Inc.
We have audited the accompanying consolidated statements of financial position of Principal Financial Group, Inc.(‘‘the Company’’) as of December 31, 2010 and 2009, and the related consolidated statements of operations,stockholders’ equity and cash flows for each of the three years in the period ended December 31, 2010. These financialstatements are the responsibility of the Company’s management. Our responsibility is to express an opinion on thesefinancial statements based on our audits.
We conducted our audits in accordance with the standards of the Public Company Accounting Oversight Board(United States). Those standards require that we plan and perform the audit to obtain reasonable assurance aboutwhether the financial statements are free of material misstatement. An audit includes examining, on a test basis, evidencesupporting the amounts and disclosures in the financial statements. An audit also includes assessing the accountingprinciples used and significant estimates made by management, as well as evaluating the overall financial statementpresentation. We believe that our audits provide a reasonable basis for our opinion.
In our opinion, the financial statements referred to above present fairly, in all material respects, the consolidatedfinancial position of Principal Financial Group, Inc. at December 31, 2010 and 2009, and the consolidated results of itsoperations and its cash flows for each of the three years in the period ended December 31, 2010, in conformity with U.S.generally accepted accounting principles.
As discussed in Note 1 to the consolidated financial statements, in response to new accounting standards, theCompany changed its methods of accounting for credit derivatives embedded in beneficial interests in securitizedfinancial assets effective July 1, 2010; for variable interest entities effective January 1, 2010; for other-than-temporaryimpairments on debt securities and for the treatment of noncontrolling interests effective January 1, 2009; and for itspension and other postretirement benefits effective January 1, 2008.
We also have audited, in accordance with the standards of the Public Company Accounting Oversight Board (UnitedStates), the Company’s internal control over financial reporting as of December 31, 2010, based on criteria established inInternal Control — Integrated Framework issued by the Committee of Sponsoring Organizations of the TreadwayCommission and our report dated February 16, 2011, expressed an unqualified opinion thereon.
/s/ Ernst & Young LLP
Des Moines, IowaFebruary 16, 2011
84

Principal Financial Group, Inc.
Consolidated Statements of Financial Position
December 31,
2010 2009
(in millions)AssetsFixed maturities, available-for-sale (2010 includes $257.9 million related to consolidated variable interest
entities) . . . . . . . . . . . . . . . . . . . . . . . . . . . . . . . . . . . . . . . . . . . . . . . . . . . . . . . . . . . . . . . . . $ 48,636.3 $ 46,220.6Fixed maturities, trading (2010 includes $131.4 million related to consolidated variable interest entities) . . . . . . 1,120.3 1,032.4Equity securities, available-for-sale . . . . . . . . . . . . . . . . . . . . . . . . . . . . . . . . . . . . . . . . . . . . . . . . . . 169.9 214.0Equity securities, trading (2010 includes $158.6 million related to consolidated variable interest entities) . . . . . . 316.9 221.5Mortgage loans . . . . . . . . . . . . . . . . . . . . . . . . . . . . . . . . . . . . . . . . . . . . . . . . . . . . . . . . . . . . . . 11,125.1 11,845.6Real estate . . . . . . . . . . . . . . . . . . . . . . . . . . . . . . . . . . . . . . . . . . . . . . . . . . . . . . . . . . . . . . . . . 1,063.5 1,034.6Policy loans . . . . . . . . . . . . . . . . . . . . . . . . . . . . . . . . . . . . . . . . . . . . . . . . . . . . . . . . . . . . . . . . 903.9 902.5Other investments (2010 includes $128.7 million related to consolidated variable interest entities of which
$128.3 million are measured at fair value under the fair value option) . . . . . . . . . . . . . . . . . . . . . . . . . . 2,641.6 2,465.3
Total investments . . . . . . . . . . . . . . . . . . . . . . . . . . . . . . . . . . . . . . . . . . . . . . . . . . . . . . . . . . . 65,977.5 63,936.5Cash and cash equivalents (2010 includes $100.0 million related to consolidated variable interest entities) . . . . . 1,877.4 2,240.4Accrued investment income . . . . . . . . . . . . . . . . . . . . . . . . . . . . . . . . . . . . . . . . . . . . . . . . . . . . . . 666.1 691.9Premiums due and other receivables . . . . . . . . . . . . . . . . . . . . . . . . . . . . . . . . . . . . . . . . . . . . . . . . . 1,063.0 1,065.4Deferred policy acquisition costs . . . . . . . . . . . . . . . . . . . . . . . . . . . . . . . . . . . . . . . . . . . . . . . . . . . 3,529.8 3,681.4Property and equipment . . . . . . . . . . . . . . . . . . . . . . . . . . . . . . . . . . . . . . . . . . . . . . . . . . . . . . . . 458.7 489.3Goodwill . . . . . . . . . . . . . . . . . . . . . . . . . . . . . . . . . . . . . . . . . . . . . . . . . . . . . . . . . . . . . . . . . . 345.4 386.4Other intangibles . . . . . . . . . . . . . . . . . . . . . . . . . . . . . . . . . . . . . . . . . . . . . . . . . . . . . . . . . . . . . 834.6 851.7Separate account assets . . . . . . . . . . . . . . . . . . . . . . . . . . . . . . . . . . . . . . . . . . . . . . . . . . . . . . . . . 69,555.3 62,738.5Other assets . . . . . . . . . . . . . . . . . . . . . . . . . . . . . . . . . . . . . . . . . . . . . . . . . . . . . . . . . . . . . . . . 1,323.3 1,677.9
Total assets . . . . . . . . . . . . . . . . . . . . . . . . . . . . . . . . . . . . . . . . . . . . . . . . . . . . . . . . . . . . . . . $145,631.1 $137,759.4
LiabilitiesContractholder funds . . . . . . . . . . . . . . . . . . . . . . . . . . . . . . . . . . . . . . . . . . . . . . . . . . . . . . . . . . $ 37,301.1 $ 39,801.9Future policy benefits and claims . . . . . . . . . . . . . . . . . . . . . . . . . . . . . . . . . . . . . . . . . . . . . . . . . . . 20,046.3 19,248.3Other policyholder funds . . . . . . . . . . . . . . . . . . . . . . . . . . . . . . . . . . . . . . . . . . . . . . . . . . . . . . . . 592.2 559.2Short-term debt . . . . . . . . . . . . . . . . . . . . . . . . . . . . . . . . . . . . . . . . . . . . . . . . . . . . . . . . . . . . . . 107.9 101.6Long-term debt . . . . . . . . . . . . . . . . . . . . . . . . . . . . . . . . . . . . . . . . . . . . . . . . . . . . . . . . . . . . . . 1,583.7 1,584.6Income taxes currently payable . . . . . . . . . . . . . . . . . . . . . . . . . . . . . . . . . . . . . . . . . . . . . . . . . . . . 6.2 2.8Deferred income taxes . . . . . . . . . . . . . . . . . . . . . . . . . . . . . . . . . . . . . . . . . . . . . . . . . . . . . . . . . 409.9 120.2Separate account liabilities . . . . . . . . . . . . . . . . . . . . . . . . . . . . . . . . . . . . . . . . . . . . . . . . . . . . . . . 69,555.3 62,738.5Other liabilities (2010 includes $433.6 million related to consolidated variable interest entities of which
$114.5 million are measured at fair value under the fair value option) . . . . . . . . . . . . . . . . . . . . . . . . . . 6,143.5 5,585.9
Total liabilities . . . . . . . . . . . . . . . . . . . . . . . . . . . . . . . . . . . . . . . . . . . . . . . . . . . . . . . . . . . . . 135,746.1 129,743.0
Stockholders’ equitySeries A preferred stock, par value $.01 per share with liquidation preference of $100 per share — 3.0 million
shares authorized, issued and outstanding in 2010 and 2009 . . . . . . . . . . . . . . . . . . . . . . . . . . . . . . . . . — —Series B preferred stock, par value $.01 per share with liquidation preference of $25 per share — 10.0 million
shares authorized, issued and outstanding in 2010 and 2009 . . . . . . . . . . . . . . . . . . . . . . . . . . . . . . . . . 0.1 0.1Common stock, par value $.01 per share — 2,500.0 million shares authorized, 448.5 million and 447.0 million
shares issued, and 320.4 million and 319.0 million shares outstanding in 2010 and 2009 . . . . . . . . . . . . . . . 4.5 4.5Additional paid-in capital . . . . . . . . . . . . . . . . . . . . . . . . . . . . . . . . . . . . . . . . . . . . . . . . . . . . . . . . 9,563.8 9,492.9Retained earnings . . . . . . . . . . . . . . . . . . . . . . . . . . . . . . . . . . . . . . . . . . . . . . . . . . . . . . . . . . . . 4,612.3 4,160.7Accumulated other comprehensive income (loss) . . . . . . . . . . . . . . . . . . . . . . . . . . . . . . . . . . . . . . . . . 272.4 (1,042.0)Treasury stock, at cost (128.1 million and 128.0 million shares in 2010 and 2009, respectively) . . . . . . . . . . . . . (4,725.3) (4,722.7)
Total stockholders’ equity attributable to Principal Financial Group, Inc. . . . . . . . . . . . . . . . . . . . . . . . . 9,727.8 7,893.5Noncontrolling interest . . . . . . . . . . . . . . . . . . . . . . . . . . . . . . . . . . . . . . . . . . . . . . . . . . . . . . . . . 157.2 122.9
Total stockholders’ equity . . . . . . . . . . . . . . . . . . . . . . . . . . . . . . . . . . . . . . . . . . . . . . . . . . . . . . 9,885.0 8,016.4
Total liabilities and stockholders’ equity . . . . . . . . . . . . . . . . . . . . . . . . . . . . . . . . . . . . . . . . . . . . . $145,631.1 $137,759.4
See accompanying notes.
85

Principal Financial Group, Inc.
Consolidated Statements of Operations
For the year endedDecember 31,
2010 2009 2008
(in millions, except per sharedata)
RevenuesPremiums and other considerations . . . . . . . . . . . . . . . . . . . . . . . . . . . . . . . . . . . . . . . . . . . . . $3,555.5 $3,750.6 $4,209.2Fees and other revenues . . . . . . . . . . . . . . . . . . . . . . . . . . . . . . . . . . . . . . . . . . . . . . . . . . . . 2,298.1 2,096.0 2,426.5Net investment income . . . . . . . . . . . . . . . . . . . . . . . . . . . . . . . . . . . . . . . . . . . . . . . . . . . . . 3,496.5 3,400.8 3,994.3Net realized capital gains (losses), excluding impairment losses on available-for-sale securities . . . . . . . . 48.7 54.9 (214.8)Total other-than-temporary impairment losses on available-for-sale securities . . . . . . . . . . . . . . . . . . . (296.3) (714.1) (479.3)Portion of impairment losses on fixed maturities, available-for-sale recognized in other comprehensive
income . . . . . . . . . . . . . . . . . . . . . . . . . . . . . . . . . . . . . . . . . . . . . . . . . . . . . . . . . . . . . 56.1 260.9 —
Net impairment losses on available-for-sale securities . . . . . . . . . . . . . . . . . . . . . . . . . . . . . . . . . . (240.2) (453.2) (479.3)
Net realized capital losses . . . . . . . . . . . . . . . . . . . . . . . . . . . . . . . . . . . . . . . . . . . . . . . . . . . (191.5) (398.3) (694.1)
Total revenues . . . . . . . . . . . . . . . . . . . . . . . . . . . . . . . . . . . . . . . . . . . . . . . . . . . . . . . . . 9,158.6 8,849.1 9,935.9ExpensesBenefits, claims and settlement expenses . . . . . . . . . . . . . . . . . . . . . . . . . . . . . . . . . . . . . . . . . . 5,338.4 5,334.5 6,219.9Dividends to policyholders . . . . . . . . . . . . . . . . . . . . . . . . . . . . . . . . . . . . . . . . . . . . . . . . . . . 219.9 242.2 267.3Operating expenses . . . . . . . . . . . . . . . . . . . . . . . . . . . . . . . . . . . . . . . . . . . . . . . . . . . . . . . 2,759.0 2,526.6 2,987.4
Total expenses . . . . . . . . . . . . . . . . . . . . . . . . . . . . . . . . . . . . . . . . . . . . . . . . . . . . . . . . . 8,317.3 8,103.3 9,474.6
Income before income taxes . . . . . . . . . . . . . . . . . . . . . . . . . . . . . . . . . . . . . . . . . . . . . . . . . . 841.3 745.8 461.3Income taxes (benefits) . . . . . . . . . . . . . . . . . . . . . . . . . . . . . . . . . . . . . . . . . . . . . . . . . . . . . 124.1 100.1 (4.5)
Net income . . . . . . . . . . . . . . . . . . . . . . . . . . . . . . . . . . . . . . . . . . . . . . . . . . . . . . . . . . . . 717.2 645.7 465.8Net income attributable to noncontrolling interest . . . . . . . . . . . . . . . . . . . . . . . . . . . . . . . . . . . . 17.9 23.0 7.7
Net income attributable to Principal Financial Group, Inc. . . . . . . . . . . . . . . . . . . . . . . . . . . . . . . 699.3 622.7 458.1Preferred stock dividends . . . . . . . . . . . . . . . . . . . . . . . . . . . . . . . . . . . . . . . . . . . . . . . . . . . 33.0 33.0 33.0
Net income available to common stockholders . . . . . . . . . . . . . . . . . . . . . . . . . . . . . . . . . . . . . . $ 666.3 $ 589.7 $ 425.1
Earnings per common shareBasic earnings per common share . . . . . . . . . . . . . . . . . . . . . . . . . . . . . . . . . . . . . . . . . . . . . $ 2.08 $ 1.98 $ 1.64
Diluted earnings per common share . . . . . . . . . . . . . . . . . . . . . . . . . . . . . . . . . . . . . . . . . . . $ 2.06 $ 1.97 $ 1.63
See accompanying notes.
86
Principal Financial Group, Inc.
Consolidated Statements of Stockholders’ Equity
AccumulatedSeries A Series B Additional other Totalpreferred preferred Common paid-in Retained comprehensive Treasury Noncontrolling stockholders’
stock stock stock capital earnings income (loss) stock interest equity
(in millions)Balances at January 1, 2008 . . . . . . $ — $0.1 $3.9 $8,295.4 $3,414.3 $ 420.2 $(4,712.2) $ 97.6 $ 7,519.3Common stock issued . . . . . . . . . . — — — 36.4 — — — — 36.4Capital transactions of equity method
investee, net of related incometaxes . . . . . . . . . . . . . . . . . . . . — — — 0.6 — — — — 0.6
Stock-based compensation andadditional related tax benefits . . . . — — — 44.1 (1.1) — — — 43.0
Treasury stock acquired, common . . . — — — — — — (6.4) — (6.4)Dividends to common stockholders . . — — — — (116.7) — — — (116.7)Dividends to preferred stockholders . — — — — (33.0) — — — (33.0)Distributions to noncontrolling
interest . . . . . . . . . . . . . . . . . . — — — — — — — (14.6) (14.6)Contributions from noncontrolling
interest . . . . . . . . . . . . . . . . . . — — — — — — — 7.0 7.0Effects of changing postretirement
benefit plan measurement date, netof related income taxes . . . . . . . . — — — — 0.9 (2.0) — — (1.1)
Comprehensive loss:Net income . . . . . . . . . . . . . . . — — — — 458.1 — — 7.7 465.8Net unrealized losses, net . . . . . . — — — — — (4,487.9) — — (4,487.9)Foreign currency translation
adjustment, net of relatedincome taxes . . . . . . . . . . . . . — — — — — (209.4) — (1.2) (210.6)
Unrecognized postretirementbenefit obligation, net of relatedincome taxes . . . . . . . . . . . . . — — — — — (632.5) — — (632.5)
Comprehensive loss . . . . . . . . . . . . (4,865.2)
Balances at December 31, 2008 . . . . — 0.1 3.9 8,376.5 3,722.5 (4,911.6) (4,718.6) 96.5 2,569.3Common stock issued . . . . . . . . . . — — 0.6 1,122.4 — — — — 1,123.0Stock-based compensation and
additional related tax benefits . . . . — — — 39.9 (1.9) — — — 38.0Treasury stock acquired, common . . . — — — — — — (4.1) — (4.1)Dividends to common stockholders . . — — — — (159.5) — — — (159.5)Dividends to preferred stockholders . — — — — (33.0) — — — (33.0)Distributions to noncontrolling
interest . . . . . . . . . . . . . . . . . . — — — — — — — (7.1) (7.1)Contributions from noncontrolling
interest . . . . . . . . . . . . . . . . . . — — — — — — — 10.1 10.1Purchase of subsidiary shares from
noncontrolling interest . . . . . . . . — — — (45.9) — — — 0.2 (45.7)Effects of reclassifying noncredit
component of previously recognizedimpairment losses on fixedmaturities, available-for-sale, net . . — — — — 9.9 (9.9) — — —
Comprehensive income:Net income . . . . . . . . . . . . . . . — — — — 622.7 — — 23.0 645.7Net unrealized gains, net . . . . . . . — — — — — 3,693.1 — — 3,693.1Noncredit component of
impairment losses on fixedmaturities, available-for-sale, net . — — — — — (152.9) — — (152.9)
Foreign currency translationadjustment, net of relatedincome taxes . . . . . . . . . . . . . — — — — — 168.2 — 0.2 168.4
Unrecognized postretirementbenefit obligation, net of relatedincome taxes . . . . . . . . . . . . . — — — — — 171.1 — — 171.1
Comprehensive income . . . . . . . . . 4,525.4
Balances at December 31, 2009 . . . . $ — $0.1 $4.5 $9,492.9 $4,160.7 $(1,042.0) $(4,722.7) $122.9 $ 8,016.4
87

Principal Financial Group, Inc.
Consolidated Statements of Stockholders’ Equity — (continued)
AccumulatedSeries A Series B Additional other Totalpreferred preferred Common paid-in Retained comprehensive Treasury Noncontrolling stockholders’
stock stock stock capital earnings income (loss) stock interest equity
(in millions)Balances at January 1, 2010 . . . . . . $ — $0.1 $4.5 $9,492.9 $4,160.7 $(1,042.0) $(4,722.7) $122.9 $ 8,016.4Common stock issued . . . . . . . . . . — — — 20.6 — — — — 20.6Stock-based compensation and
additional related tax benefits . . . . — — — 50.3 (2.4) — — — 47.9Treasury stock acquired, common . . . — — — — — — (2.6) — (2.6)Dividends to common stockholders . . — — — — (176.2) — — — (176.2)Dividends to preferred stockholders . — — — — (33.0) — — — (33.0)Distributions to noncontrolling
interest . . . . . . . . . . . . . . . . . . — — — — — — — (7.8) (7.8)Contributions from noncontrolling
interest . . . . . . . . . . . . . . . . . . — — — — — — — 24.0 24.0Effects of implementation of
accounting change related tovariable interest entities, net . . . . . — — — — (10.7) 10.7 — — —
Effects of electing fair value optionfor fixed maturities uponimplementation of accountingchange related to embedded creditderivatives, net . . . . . . . . . . . . . — — — — (25.4) 25.4 — — —
Comprehensive income:Net income . . . . . . . . . . . . . . . — — — — 699.3 — — 17.9 717.2Net unrealized gains, net . . . . . . . — — — — — 1,070.6 — — 1,070.6Noncredit component of
impairment losses on fixedmaturities, available-for-sale, net . — — — — — (33.5) — — (33.5)
Foreign currency translationadjustment, net of relatedincome taxes . . . . . . . . . . . . . — — — — — 33.2 — 0.2 33.4
Unrecognized postretirementbenefit obligation, net of relatedincome taxes . . . . . . . . . . . . . — — — — — 208.0 — — 208.0
Comprehensive income . . . . . . . . . 1,995.7
Balances at December 31, 2010 . . . . $ — $0.1 $4.5 $9,563.8 $4,612.3 $ 272.4 $(4,725.3) $157.2 $ 9,885.0
See accompanying notes.
88

Principal Financial Group, Inc.
Consolidated Statements of Cash Flows
For the year ended December 31,
2010 2009 2008
(in millions)Operating activitiesNet income . . . . . . . . . . . . . . . . . . . . . . . . . . . . . . . . . . . . . . . . . . . . . . . . . . . . . . . . . . $ 717.2 $ 645.7 $ 465.8Adjustments to reconcile net income to net cash provided by operating activities:
Amortization of deferred policy acquisition costs . . . . . . . . . . . . . . . . . . . . . . . . . . . . . . . . . 205.9 92.2 373.7Additions to deferred policy acquisition costs . . . . . . . . . . . . . . . . . . . . . . . . . . . . . . . . . . . . (496.3) (482.4) (680.3)Accrued investment income . . . . . . . . . . . . . . . . . . . . . . . . . . . . . . . . . . . . . . . . . . . . . . . 25.8 58.8 23.4Net cash flows for trading securities . . . . . . . . . . . . . . . . . . . . . . . . . . . . . . . . . . . . . . . . . 188.3 (127.4) (348.0)Premiums due and other receivables . . . . . . . . . . . . . . . . . . . . . . . . . . . . . . . . . . . . . . . . . (9.6) (126.9) (39.2)Contractholder and policyholder liabilities and dividends . . . . . . . . . . . . . . . . . . . . . . . . . . . . 1,384.2 1,530.9 2,394.2Current and deferred income taxes (benefits) . . . . . . . . . . . . . . . . . . . . . . . . . . . . . . . . . . . . 60.9 65.7 (219.7)Net realized capital losses . . . . . . . . . . . . . . . . . . . . . . . . . . . . . . . . . . . . . . . . . . . . . . . . 191.5 398.3 694.1Depreciation and amortization expense . . . . . . . . . . . . . . . . . . . . . . . . . . . . . . . . . . . . . . . 164.7 138.5 145.0Mortgage loans held for sale, acquired or originated . . . . . . . . . . . . . . . . . . . . . . . . . . . . . . . (60.6) (61.2) (92.0)Mortgage loans held for sale, sold or repaid, net of gain . . . . . . . . . . . . . . . . . . . . . . . . . . . . . 61.2 75.4 73.7Real estate acquired through operating activities . . . . . . . . . . . . . . . . . . . . . . . . . . . . . . . . . . — (19.8) (77.5)Real estate sold through operating activities . . . . . . . . . . . . . . . . . . . . . . . . . . . . . . . . . . . . 121.6 5.2 24.5Stock-based compensation . . . . . . . . . . . . . . . . . . . . . . . . . . . . . . . . . . . . . . . . . . . . . . . . 47.6 37.2 31.5Other . . . . . . . . . . . . . . . . . . . . . . . . . . . . . . . . . . . . . . . . . . . . . . . . . . . . . . . . . . . . . 189.3 12.8 (544.4)
Net adjustments . . . . . . . . . . . . . . . . . . . . . . . . . . . . . . . . . . . . . . . . . . . . . . . . . . . . . . . 2,074.5 1,597.3 1,759.0
Net cash provided by operating activities . . . . . . . . . . . . . . . . . . . . . . . . . . . . . . . . . . . . . . . . 2,791.7 2,243.0 2,224.8Investing activitiesAvailable-for-sale securities:
Purchases . . . . . . . . . . . . . . . . . . . . . . . . . . . . . . . . . . . . . . . . . . . . . . . . . . . . . . . . . . (7,187.9) (7,933.3) (6,605.8)Sales . . . . . . . . . . . . . . . . . . . . . . . . . . . . . . . . . . . . . . . . . . . . . . . . . . . . . . . . . . . . . 1,684.6 3,439.8 1,270.8Maturities . . . . . . . . . . . . . . . . . . . . . . . . . . . . . . . . . . . . . . . . . . . . . . . . . . . . . . . . . . 5,161.3 4,568.1 3,280.6
Mortgage loans acquired or originated . . . . . . . . . . . . . . . . . . . . . . . . . . . . . . . . . . . . . . . . . (1,272.0) (586.5) (3,484.9)Mortgage loans sold or repaid . . . . . . . . . . . . . . . . . . . . . . . . . . . . . . . . . . . . . . . . . . . . . . . 1,798.0 1,704.4 2,902.0Real estate acquired . . . . . . . . . . . . . . . . . . . . . . . . . . . . . . . . . . . . . . . . . . . . . . . . . . . . . (53.8) (62.2) (33.3)Real estate sold . . . . . . . . . . . . . . . . . . . . . . . . . . . . . . . . . . . . . . . . . . . . . . . . . . . . . . . . — 30.3 70.6Net purchases of property and equipment . . . . . . . . . . . . . . . . . . . . . . . . . . . . . . . . . . . . . . . (21.5) (26.2) (105.0)Purchases of interest in subsidiaries, net of cash acquired . . . . . . . . . . . . . . . . . . . . . . . . . . . . . — (45.7) (20.3)Net change in other investments . . . . . . . . . . . . . . . . . . . . . . . . . . . . . . . . . . . . . . . . . . . . . (81.2) (61.9) (191.9)
Net cash provided by (used in) investing activities . . . . . . . . . . . . . . . . . . . . . . . . . . . . . . . . . . 27.5 1,026.8 (2,917.2)Financing activitiesIssuance of common stock . . . . . . . . . . . . . . . . . . . . . . . . . . . . . . . . . . . . . . . . . . . . . . . . . 20.6 1,123.0 36.4Acquisition of treasury stock . . . . . . . . . . . . . . . . . . . . . . . . . . . . . . . . . . . . . . . . . . . . . . . . (2.6) (4.1) (6.4)Proceeds from financing element derivatives . . . . . . . . . . . . . . . . . . . . . . . . . . . . . . . . . . . . . . 79.3 122.0 142.2Payments for financing element derivatives . . . . . . . . . . . . . . . . . . . . . . . . . . . . . . . . . . . . . . . (46.5) (67.4) (114.6)Excess tax benefits from share-based payment arrangements . . . . . . . . . . . . . . . . . . . . . . . . . . . . 1.0 0.2 3.1Dividends to common stockholders . . . . . . . . . . . . . . . . . . . . . . . . . . . . . . . . . . . . . . . . . . . (176.2) (159.5) (116.7)Dividends to preferred stockholders . . . . . . . . . . . . . . . . . . . . . . . . . . . . . . . . . . . . . . . . . . . (33.0) (33.0) (33.0)Issuance of long-term debt . . . . . . . . . . . . . . . . . . . . . . . . . . . . . . . . . . . . . . . . . . . . . . . . . 2.3 745.1 7.9Principal repayments of long-term debt . . . . . . . . . . . . . . . . . . . . . . . . . . . . . . . . . . . . . . . . . (11.1) (468.2) (83.3)Net proceeds from (repayments of) short-term borrowings . . . . . . . . . . . . . . . . . . . . . . . . . . . . . 1.7 (405.1) 217.4Investment contract deposits . . . . . . . . . . . . . . . . . . . . . . . . . . . . . . . . . . . . . . . . . . . . . . . . 4,283.8 4,224.1 11,349.0Investment contract withdrawals . . . . . . . . . . . . . . . . . . . . . . . . . . . . . . . . . . . . . . . . . . . . . (7,343.4) (8,752.7) (9,813.7)Net increase in banking operation deposits . . . . . . . . . . . . . . . . . . . . . . . . . . . . . . . . . . . . . . . 46.2 43.9 373.1Other . . . . . . . . . . . . . . . . . . . . . . . . . . . . . . . . . . . . . . . . . . . . . . . . . . . . . . . . . . . . . . (4.3) (5.7) (5.4)
Net cash provided by (used in) financing activities . . . . . . . . . . . . . . . . . . . . . . . . . . . . . . . . . . (3,182.2) (3,637.4) 1,956.0
Net increase (decrease) in cash and cash equivalents . . . . . . . . . . . . . . . . . . . . . . . . . . . . . . . . (363.0) (367.6) 1,263.6Cash and cash equivalents at beginning of year . . . . . . . . . . . . . . . . . . . . . . . . . . . . . . . . . . . . 2,240.4 2,608.0 1,344.4
Cash and cash equivalents at end of year . . . . . . . . . . . . . . . . . . . . . . . . . . . . . . . . . . . . . . . . $ 1,877.4 $ 2,240.4 $ 2,608.0
Supplemental Information:Cash paid for interest . . . . . . . . . . . . . . . . . . . . . . . . . . . . . . . . . . . . . . . . . . . . . . . . . . . . $ 123.4 $ 129.9 $ 111.3Cash paid for income taxes . . . . . . . . . . . . . . . . . . . . . . . . . . . . . . . . . . . . . . . . . . . . . . . . $ 55.2 $ 75.4 $ 206.1
See accompanying notes.
89

Principal Financial Group, Inc.
Notes to Consolidated Financial Statements
December 31, 2010
1. Nature of Operations and Significant Accounting Policies
Description of Business
Principal Financial Group, Inc. (‘‘PFG’’), along with its consolidated subsidiaries, is a diversified financial servicesorganization engaged in promoting retirement savings and investment and insurance products and services in the U.S.and selected international markets.
Basis of Presentation
The accompanying consolidated financial statements, which include our majority-owned subsidiaries andconsolidated variable interest entities (‘‘VIEs’’), have been prepared in conformity with U.S. generally acceptedaccounting principles (‘‘U.S. GAAP’’). Less than majority-owned entities in which we have at least a 20% interest andlimited liability companies (‘‘LLCs’’), partnerships and real estate joint ventures in which we have at least a 5% interest,are reported on the equity basis in the consolidated statements of financial position as other investments. Investmentsin LLCs, partnerships and real estate joint ventures in which we have an ownership percentage of 3% to 5% areaccounted for under the equity or cost method depending upon the specific facts and circumstances of our ownership andinvolvement. All significant intercompany accounts and transactions have been eliminated. Information included in thenotes to the financial statements excludes information applicable to less than majority-owned entities reported on theequity and cost methods, unless otherwise noted.
Reclassifications have been made to prior period financial statements to conform to the December 31, 2010,presentation. See Recent Accounting Pronouncements for impact of new accounting guidance on prior period financialstatements.
Closed Block
Principal Life Insurance Company (‘‘Principal Life’’) operates a closed block (‘‘Closed Block’’) for the benefit ofindividual participating dividend-paying policies in force at the time of the 1998 mutual insurance holding company(‘‘MIHC’’) formation. See Note 6, Closed Block, for further details.
Recent Accounting Pronouncements
In October 2010, the Financial Accounting Standards Board (‘‘FASB’’) issued authoritative guidance that modifiesthe definition of the types of costs incurred by insurance entities that can be capitalized in the successful acquisition ofnew or renewal insurance contracts. Capitalized costs should include incremental direct costs of contract acquisition, aswell as certain costs related directly to acquisition activities such as underwriting, policy issuance and processing, medicaland inspection and sales force contract selling. This guidance will be effective for us on January 1, 2012, withretrospective application permitted but not required. We are currently evaluating the impact this guidance will have onour consolidated financial statements.
In July 2010, the FASB issued authoritative guidance that requires new and expanded disclosures related to thecredit quality of financing receivables and the allowance for credit losses. Reporting entities are required to providequalitative and quantitative disclosures on the allowance for credit losses, credit quality, impaired loans, modificationsand nonaccrual and past due financing receivables. The disclosures are required to be presented on a disaggregated basisby portfolio segment and class of financing receivable. Disclosures required by the guidance that relate to the end of areporting period were effective for us in our December 31, 2010, consolidated financial statements. See Note 4,Investments, for further details. Disclosures required by the guidance that relate to an activity that occurs during areporting period will be effective for us on January 1, 2011, and will not have a material impact on our consolidatedfinancial statements. In January 2011, the FASB issued authoritative guidance that deferred indefinitely the disclosuresrelating to troubled debt restructuring.
In April 2010, the FASB issued authoritative guidance addressing how investments held through the separateaccounts of an insurance entity affect the entity’s consolidation analysis. This guidance clarifies that an insurance entityshould not consider any separate account interests held for the benefit of policyholders in an investment to be theinsurer’s interests and should not combine those interests with its general account interest in the same investment whenassessing the investment for consolidation. This guidance will be effective for us on January 1, 2011, and will not have amaterial impact on our consolidated financial statements.
In March 2010, the FASB issued authoritative guidance that amends and clarifies the guidance on evaluation ofcredit derivatives embedded in beneficial interests in securitized financial assets, including asset-backed securities, credit-linked notes, collateralized loan obligations and collateralized debt obligations (‘‘CDOs’’). This guidance eliminates thescope exception for bifurcation of embedded credit derivatives in interests in securitized financial assets, unless they are
90
Principal Financial Group, Inc.
Notes to Consolidated Financial Statements — (continued)
1. Nature of Operations and Significant Accounting Policies — (continued)
created solely by subordination of one financial instrument to another. We adopted this guidance effective July 1, 2010,and within the scope of this guidance reclassified fixed maturities with a fair value of $75.3 million, from available-for-saleto trading. The cumulative change in accounting principle related to unrealized losses on these fixed maturities resultedin a net $25.4 million decrease to retained earnings, with a corresponding increase to accumulated other comprehensiveincome (‘‘AOCI’’).
In January 2010, the FASB issued authoritative guidance that requires new disclosures related to fair valuemeasurements and clarifies existing disclosure requirements about the level of disaggregation, inputs and valuationtechniques. Specifically, reporting entities now must disclose separately the amounts of significant transfers in and out ofLevel 1 and Level 2 fair value measurements and describe the reasons for the transfers. In addition, in the reconciliationfor Level 3 fair value measurements, a reporting entity should present separately information about purchases, sales,issuances and settlements. The guidance clarifies that a reporting entity needs to use judgment in determining theappropriate classes of assets and liabilities for disclosure of fair value measurement, considering the level ofdisaggregated information required by other applicable U.S. GAAP guidance and should also provide disclosures aboutthe valuation techniques and inputs used to measure fair value for each class of assets and liabilities. This guidance waseffective for us on January 1, 2010, except for the disclosures about purchases, sales, issuances and settlements in thereconciliation for Level 3 fair value measurements, which will be effective for us on January 1, 2011. This guidance willnot have a material impact on our consolidated financial statements.
In September 2009, FASB issued authoritative guidance for measuring the fair value of certain alternativeinvestments and to offer investors a practical means for measuring the fair value of investments in certain entities thatcalculate net asset value per share. This guidance was effective for us on October 1, 2009, and did not have a materialimpact on our consolidated financial statements.
In August 2009, the FASB issued authoritative guidance to provide additional guidance on measuring the fair valueof liabilities. This guidance clarifies that the quoted price for the identical liability, when traded as an asset in an activemarket, is also a Level 1 measurement for that liability when no adjustment to the quoted price is required. In theabsence of a quoted price in an active market, an entity must use one or more of the following valuation techniques toestimate fair value: (1) a valuation technique that uses a quoted price (a) of an identical liability when traded as an assetor (b) of a similar liability when traded as an asset; or (2) another valuation technique such as (a) a present valuetechnique or (b) a technique based on the amount an entity would pay to transfer the identical liability or would receiveto enter into an identical liability. This guidance was effective for us on October 1, 2009, and did not have a materialimpact on our consolidated financial statements.
In June 2009, the FASB issued authoritative guidance for the establishment of the FASB Accounting StandardsCodificationTM (‘‘Codification’’) as the source of authoritative accounting principles recognized by the FASB to be appliedby nongovernmental entities in the preparation of financial statements in conformity with U.S. GAAP. Rules andinterpretive releases of the Securities and Exchange Commission (‘‘SEC’’) under federal securities laws are also sourcesof authoritative U.S. GAAP for SEC registrants. All guidance contained in the Codification carries an equal level ofauthority. This guidance was effective for us on July 1, 2009, and did not have a material impact on our consolidatedfinancial statements.
In June 2009, the FASB issued authoritative guidance to improve the relevance, representational faithfulness andcomparability of the information that a reporting entity provides in its financial reports about a transfer of financialassets; the effects of a transfer on its financial position, financial performance and cash flows; and a transferor’scontinuing involvement in transferred financial assets. The most significant change is the elimination of the concept of aqualifying special-purpose entity (‘‘QSPE’’). Therefore, former QSPEs, as defined under previous accounting standards,should be evaluated for consolidation by reporting entities on and after the effective date in accordance with theapplicable consolidation guidance. This guidance was effective for us on January 1, 2010, and did not have a materialimpact on our consolidated financial statements.
Also in June 2009, the FASB issued authoritative guidance related to the accounting for VIEs, which amends priorguidance and requires an enterprise to perform an analysis to determine whether the enterprise’s variable interest orinterests give it a controlling financial interest in a VIE. This analysis identifies the primary beneficiary of a VIE as theenterprise with (1) the power to direct the activities of a VIE that most significantly impact the entity’s economicperformance and (2) the obligation to absorb losses of the entity or the right to receive benefits from the entity that couldpotentially be significant to the VIE. In addition, this guidance requires ongoing reassessments of whether an enterpriseis the primary beneficiary of a VIE. Furthermore, we are required to enhance disclosures that will provide users offinancial statements with more transparent information about an enterprise’s involvement in a VIE. We adopted thisguidance prospectively effective January 1, 2010. Due to the implementation of this guidance, certain previouslyunconsolidated VIEs were consolidated and certain previously consolidated VIEs were deconsolidated. The cumulative
91

Principal Financial Group, Inc.
Notes to Consolidated Financial Statements — (continued)
1. Nature of Operations and Significant Accounting Policies — (continued)
change in accounting principle from adopting this guidance resulted in a net $10.7 million decrease to retained earningsand a net $10.7 million increase to AOCI. In February 2010, the FASB issued an amendment to this guidance. Theamendment indefinitely defers the consolidation requirements for reporting enterprises’ interests in entities that have thecharacteristics of investment companies and regulated money market funds. This amendment was effective January 1,2010, and did not have a material impact to our consolidated financial statements. The required disclosures are includedin our consolidated financial statements. See Note 3, Variable Interest Entities, for further details.
In April 2009, the FASB issued authoritative guidance which relates to the recognition and presentation of another-than-temporary impairment (‘‘OTTI’’) of securities and requires additional disclosures. The recognition provisionsapply only to debt securities classified as available-for-sale and held-to-maturity, while the presentation and disclosurerequirements apply to both debt and equity securities. An impaired debt security will be consideredother-than-temporarily impaired if a holder has the intent to sell, or it more likely than not will be required to sell prior torecovery of the amortized cost. If a holder of a debt security does not expect recovery of the entire cost basis, even ifthere is no intention to sell the security, it will be considered an OTTI as well. This guidance also changes how an entityrecognizes an OTTI for a debt security by separating the loss between the amount representing the credit loss and theamount relating to other factors, if a holder does not have the intent to sell or it more likely than not will not be requiredto sell prior to recovery of the amortized cost less any current period credit loss. Credit losses will be recognized in netincome and losses relating to other factors will be recognized in other comprehensive income (‘‘OCI’’). If the holder hasthe intent to sell or it more likely than not will be required to sell before its recovery of amortized cost less any currentperiod credit loss, the entire OTTI will continue to be recognized in net income. Furthermore, this guidance requires acumulative effect adjustment to the opening balance of retained earnings in the period of adoption with a correspondingadjustment to accumulated OCI. We adopted this guidance effective January 1, 2009. The cumulative change inaccounting principle from adopting this guidance resulted in a net $9.9 million increase to retained earnings and acorresponding decrease to accumulated OCI. The required disclosures have been included in our consolidated financialstatements.
Also in April 2009, the FASB issued authoritative guidance which provides additional information on estimating fairvalue when the volume and level of activity for an asset or liability have significantly decreased in relation to normalmarket activity for the asset or liability and clarifies that the use of multiple valuation techniques may be appropriate. Italso provides additional guidance on circumstances that may indicate a transaction is not orderly. Further, it requiresadditional disclosures about fair value measurements in annual and interim reporting periods. We adopted this guidanceeffective January 1, 2009, and it did not have a material impact on our consolidated financial statements. See Note 14,Fair Value Measurements, for further details.
In January 2009, the FASB issued authoritative guidance related to the assessment of the OTTI of certain beneficialinterests in securitized financial assets, which eliminated the requirement that a financial instrument holder’s bestestimate of cash flows be based upon those that a market participant would use. Instead, this guidance requires the use ofmanagement’s judgment in the determination of whether it is probable there has been an adverse change in estimatedcash flow. This guidance was effective for us on October 1, 2008, and did not have a material impact on our consolidatedfinancial statements.
In December 2008, the FASB issued authoritative guidance requiring additional disclosures by public entities withcontinuing involvement in transfers of financial assets to special purpose entities and with variable interests in VIEs. Thisguidance was effective for us on October 1, 2008. We have included the required disclosures in our consolidated financialstatements. See Note 3, Variable Interest Entities for further details.
In September 2008, the FASB issued authoritative guidance (1) requiring disclosures by sellers of credit derivatives,including credit derivatives embedded in a hybrid instrument and (2) requiring an additional disclosure about the currentstatus of the payment/performance risk of a guarantee. This guidance was effective for us on October 1, 2008. We haveincluded the required disclosures in our consolidated financial statements. See Note 5, Derivative Financial Instruments,for further details relating to our credit derivatives.
In March 2008, the FASB issued authoritative guidance requiring (1) qualitative disclosures about objectives andstrategies for using derivatives, (2) quantitative disclosures about fair value amounts of gains and losses on derivativeinstruments and related hedged items and (3) disclosures about credit-risk-related contingent features in derivativeinstruments. The disclosures are intended to provide users of financial statements with an enhanced understanding ofhow and why derivative instruments are used, how they are accounted for and the financial statement impacts. Weadopted these changes on January 1, 2009. See Note 5, Derivative Financial Instruments, for further details.
In December 2007, the FASB issued authoritative guidance requiring that the acquiring entity in a businesscombination establish the acquisition-date fair value as the measurement objective for all assets acquired and liabilitiesassumed, including any noncontrolling interests, and requires the acquirer to disclose additional information needed to
92
Principal Financial Group, Inc.
Notes to Consolidated Financial Statements — (continued)
1. Nature of Operations and Significant Accounting Policies — (continued)
more comprehensively evaluate and understand the nature and financial effect of the business combination. In addition,direct acquisition costs are to be expensed. We adopted this guidance on January 1, 2009, and all requirements areapplied prospectively.
Also in December 2007, the FASB issued authoritative guidance mandating the following changes to noncontrollinginterests:
(1) Noncontrolling interests are to be treated as a separate component of equity, rather than as a liability or otheritem outside of equity.
(2) Net income includes the total income of all consolidated subsidiaries, with separate disclosures on the face ofthe statement of operations of the income attributable to controlling and noncontrolling interests. Previously,net income attributable to the noncontrolling interest was reported as an operating expense in arriving atconsolidated net income.
(3) This guidance revises the accounting requirements for changes in a parent’s ownership interest when the parentretains control and for changes in a parent’s ownership interest that results in deconsolidation.
We adopted this guidance on January 1, 2009. Presentation and disclosure requirements have been appliedretrospectively for all periods presented. All other requirements have been applied prospectively.
In February 2007, the FASB issued authoritative guidance permitting entities to choose, at specified election dates,to measure eligible financial instruments and certain other items at fair value that are not currently required to bereported at fair value. Unrealized gains and losses on items for which the fair value option is elected shall be reported innet income. The decision about whether to elect the fair value option (1) is applied instrument by instrument, withcertain exceptions (2) is irrevocable and (3) is applied to an entire instrument and not only to specified risks, specific cashflows, or portions of that instrument. This guidance also requires additional disclosures that are intended to facilitatecomparisons between entities that choose different measurement attributes for similar assets and liabilities and betweenassets and liabilities in the financial statements of an entity that selects different measurement attributes for similar assetsand liabilities. At the effective date, the fair value option may be elected for eligible items that exist at that date and theeffect of the first remeasurement to fair value for those items should be reported as a cumulative effect adjustment toretained earnings. We adopted this guidance on January 1, 2008, and the resulting cumulative effect of the change inaccounting principle was immaterial. Therefore, the pre-tax cumulative effect of the change in accounting principle isreflected in net realized capital gains (losses). Election of this option upon acquisition or assumption of eligible itemscould introduce period to period volatility in net income.
In September 2006, the FASB issued authoritative guidance related to defined benefit pension plans and otherpostretirement benefit plans, which eliminated the ability to choose a measurement date by requiring that plan assets andbenefit obligations be measured as of the annual balance sheet date. This guidance was effective for us on December 31,2008. For 2007, we used a measurement date of October 1 for the measurement of plan assets and benefit obligations.Two transition methods were available when implementing the change in measurement date for 2008. We chose thealternative that allowed us to use the October 1, 2007, measurement date as a basis for determining the 2008 expense andtransition adjustment. The effect of changing the measurement date resulted in a $0.9 million increase to retainedearnings and a $2.0 million decrease to accumulated OCI in the first quarter of 2008.
In September 2006, the FASB issued authoritative guidance for using fair value to measure assets and liabilities,which applies whenever other standards require or permit assets or liabilities to be measured at fair value, but does notexpand the use of fair value measurement. This guidance establishes a fair value hierarchy that gives the highest priorityto quoted prices in active markets and the lowest priority to unobservable data, and requires fair value measurements tobe separately disclosed by level within the hierarchy. In February 2008, the FASB deferred the effective date of thisguidance for one year for nonfinancial assets and nonfinancial liabilities that are recognized or disclosed at fair value on anonrecurring basis. In February 2008, the FASB issued authoritative guidance excluding instruments covered by leaseaccounting and its related interpretive guidance from the scope of its fair value measurement guidance. In October 2008,the FASB issued authoritative guidance which clarifies the application of its fair value measurement guidance in aninactive market and provides an illustrative example to demonstrate how the fair value of a financial asset is determinedwhen the market for that financial asset is inactive. Our adoption of the FASB’s fair value measurement guidance onJanuary 1, 2008, for assets and liabilities measured at fair value on a recurring basis and financial assets and liabilitiesmeasured at fair value on a nonrecurring basis did not have a material impact on our consolidated financial statements.We deferred the adoption for nonfinancial assets and liabilities measured at fair value on a nonrecurring basis untilJanuary 1, 2009, which also did not have a material impact on our consolidated financial statements. See Note 14, FairValue Measurements, for further details.
93
Principal Financial Group, Inc.
Notes to Consolidated Financial Statements — (continued)
1. Nature of Operations and Significant Accounting Policies — (continued)
Use of Estimates in the Preparation of Financial Statements
The preparation of our consolidated financial statements and accompanying notes requires management to makeestimates and assumptions that affect the amounts reported and disclosed. These estimates and assumptions couldchange in the future as more information becomes known, which could impact the amounts reported and disclosed in theconsolidated financial statements and accompanying notes. The most critical estimates include those used in determining:
• the fair value of investments in the absence of quoted market values;
• investment impairments and valuation allowances;
• the fair value of and accounting for derivatives;
• the deferred policy acquisition costs (‘‘DPAC’’) and other actuarial balances where the amortization is based onestimated gross profits;
• the measurement of goodwill, indefinite lived intangible assets, finite lived intangible assets and relatedimpairments or amortization, if any;
• the liability for future policy benefits and claims;
• the value of our pension and other postretirement benefit obligations and
• accounting for income taxes and the valuation of deferred tax assets.
A description of such critical estimates is incorporated within the discussion of the related accounting policies whichfollow. In applying these policies, management makes subjective and complex judgments that frequently requireestimates about matters that are inherently uncertain. Many of these policies, estimates and related judgments arecommon in the insurance and financial services industries; others are specific to our businesses and operations. Actualresults could differ from these estimates.
Cash and Cash Equivalents
Cash and cash equivalents include cash on hand, money market instruments and other debt issues with a maturitydate of three months or less when purchased.
Investments
Fixed maturities include bonds, mortgage-backed securities, redeemable preferred stock and certain nonredeemablepreferred stock. Equity securities include mutual funds, common stock and nonredeemable preferred stock. We classifyfixed maturities and equity securities as either available-for-sale or trading at the time of the purchase and, accordingly,carry them at fair value. See Note 14, Fair Value Measurements, for policies related to the determination of fair value.Unrealized gains and losses related to available-for-sale securities, excluding those in fair value hedging relationships, arereflected in stockholders’ equity, net of adjustments related to DPAC, sales inducements, unearned revenue reserves,derivatives in cash flow hedge relationships and applicable income taxes. Unrealized gains and losses related toavailable-for-sale securities in fair value hedging relationships and mark-to-market adjustments on certain tradingsecurities are reflected in net realized capital gains (losses). We also have trading securities portfolios that supportinvestment strategies that involve the active and frequent purchase and sale of fixed maturities. Mark-to-marketadjustments related to these trading securities are reflected in net investment income.
The cost of fixed maturities is adjusted for amortization of premiums and accrual of discounts, both computed usingthe interest method. The cost of fixed maturities and equity securities is adjusted for declines in value that are other thantemporary. Impairments in value deemed to be other than temporary are primarily reported in net income as acomponent of net realized capital gains (losses), with noncredit impairment losses for certain fixed maturities reported inOCI. See further discussion in Note 4, Investments. For loan-backed and structured securities, we recognize income usinga constant effective yield based on currently anticipated cash flows.
Real estate investments are reported at cost less accumulated depreciation. The initial cost bases of propertiesacquired through loan foreclosures are the lower of the fair market values of the properties at the time of foreclosure orthe outstanding loan balance. Buildings and land improvements are generally depreciated on the straight-line methodover the estimated useful life of improvements and tenant improvement costs are depreciated on the straight-line methodover the term of the related lease. We recognize impairment losses for properties when indicators of impairment arepresent and a property’s expected undiscounted cash flows are not sufficient to recover the property’s carrying value. Insuch cases, the cost bases of the properties are reduced to fair value. Real estate expected to be disposed is carried at the
94

Principal Financial Group, Inc.
Notes to Consolidated Financial Statements — (continued)
1. Nature of Operations and Significant Accounting Policies — (continued)
lower of cost or fair value, less cost to sell, with valuation allowances established accordingly and depreciation no longerrecognized. The carrying amount of real estate held for sale was $51.9 million and $35.4 million as of December 31, 2010and 2009, respectively. Any impairment losses and any changes in valuation allowances are reported in net income.
Commercial and residential mortgage loans are generally reported at cost adjusted for amortization of premiumsand accrual of discounts, computed using the interest method, net of valuation allowances. Interest income is accrued onthe principal amount of the loan based on the loan’s contractual interest rate. Interest income, as well as prepayment offees and the amortization of the related premium or discount, is reported in net investment income. Any changes in thevaluation allowances are reported in net income as net realized capital gains (losses). We measure impairment basedupon the difference between carrying value and estimated value less cost to sell. Estimated value is based on either thepresent value of expected cash flows discounted at the loan’s effective interest rate, the loan’s observable market price orthe fair value of the collateral. If foreclosure is probable, the measurement of any valuation allowance is based upon thefair value of the collateral.
Net realized capital gains and losses on sales of investments are determined on the basis of specific identification. Ingeneral, in addition to realized capital gains and losses on investment sales and periodic settlements on derivatives notdesignated as hedges, we report gains and losses related to the following in net realized capital gains (losses): other thantemporary impairments of securities and subsequent recoveries, mark-to-market adjustments on certain tradingsecurities, mark-to-market adjustments on certain seed money investments, fair value and cash flow hedgeineffectiveness, mark-to-market adjustments on derivatives not designated as hedges, changes in the mortgage loanvaluation allowance provision and subsequent commercial mortgage loan recoveries and impairments of real estate heldfor investment. Investment gains and losses on sales of certain real estate held for sale, which do not meet the criteria forclassification as a discontinued operation and mark-to-market adjustments on trading securities that support investmentstrategies that involve the active and frequent purchase and sale of fixed maturities are reported as net investmentincome and are excluded from net realized capital gains (losses).
Policy loans and other investments, excluding investments in unconsolidated entities, are primarily reported at cost.
Derivatives
Overview. Derivatives are financial instruments whose values are derived from interest rates, foreign exchangerates, financial indices or the values of securities. Derivatives generally used by us include interest rate swaps, interestrate collars, swaptions, futures, currency swaps, currency forwards, credit default swaps and options. Derivatives may beexchange traded or contracted in the over-the-counter market. Derivative positions are either assets or liabilities in theconsolidated statements of financial position and are measured at fair value, generally by obtaining quoted market pricesor through the use of pricing models. See Note 14, Fair Value Measurements, for policies related to the determination offair value. Fair values can be affected by changes in interest rates, foreign exchange rates, financial indices, values ofsecurities, credit spreads, and market volatility and liquidity.
Accounting and Financial Statement Presentation. We designate derivatives as either:
(a) a hedge of the exposure to changes in the fair value of a recognized asset or liability or an unrecognized firmcommitment, including those denominated in a foreign currency (‘‘fair value hedge’’);
(b) a hedge of a forecasted transaction or the exposure to variability of cash flows to be received or paid related to arecognized asset or liability, including those denominated in a foreign currency (‘‘cash flow hedge’’);
(c) a hedge of a net investment in a foreign operation or
(d) a derivative not designated as a hedging instrument.
Our accounting for the ongoing changes in fair value of a derivative depends on the intended use of the derivativeand the designation, as described above, and is determined when the derivative contract is entered into or at the time ofredesignation. Hedge accounting is used for derivatives that are specifically designated in advance as hedges and thatreduce our exposure to an indicated risk by having a high correlation between changes in the value of the derivatives andthe items being hedged at both the inception of the hedge and throughout the hedge period.
Fair Value Hedges. When a derivative is designated as a fair value hedge and is determined to be highly effective,changes in its fair value, along with changes in the fair value of the hedged asset, liability or firm commitment attributableto the hedged risk, are reported in net realized capital gains (losses). Any difference between the net change in fair valueof the derivative and the hedged item represents hedge ineffectiveness.
95
Principal Financial Group, Inc.
Notes to Consolidated Financial Statements — (continued)
1. Nature of Operations and Significant Accounting Policies — (continued)
Cash Flow Hedges. When a derivative is designated as a cash flow hedge and is determined to be highly effective,changes in its fair value are recorded as a component of OCI. Any hedge ineffectiveness is recorded immediately in netincome. At the time the variability of cash flows being hedged impacts net income, the related portion of deferred gainsor losses on the derivative instrument is reclassified and reported in net income.
Net Investment in a Foreign Operation Hedge. When a derivative is used as a hedge of a net investment in a foreignoperation, its change in fair value, to the extent effective as a hedge, is recorded as a component of OCI. Any hedgeineffectiveness is recorded immediately in net income. If the foreign operation is sold or upon complete or substantiallycomplete liquidation, the deferred gains or losses on the derivative instrument are reclassified into net income.
Non-Hedge Derivatives. If a derivative does not qualify or is not designated for hedge accounting, all changes in fairvalue are reported in net income without considering the changes in the fair value of the economically associated assetsor liabilities.
Hedge Documentation and Effectiveness Testing. At inception, we formally document all relationships between hedginginstruments and hedged items, as well as our risk management objective and strategy for undertaking various hedgetransactions. This process includes associating all derivatives designated as fair value or cash flow hedges with specificassets or liabilities on the statement of financial position or with specific firm commitments or forecasted transactions.Effectiveness of the hedge is formally assessed at inception and throughout the life of the hedging relationship. Even if aderivative is highly effective and qualifies for hedge accounting treatment, the hedge might have some ineffectiveness.
We use qualitative and quantitative methods to assess hedge effectiveness. Qualitative methods may includemonitoring changes to terms and conditions and counterparty credit ratings. Quantitative methods may include statisticaltests including regression analysis and minimum variance and dollar offset techniques.
Termination of Hedge Accounting. We prospectively discontinue hedge accounting when (1) the criteria to qualify forhedge accounting is no longer met, e.g., a derivative is determined to no longer be highly effective in offsetting the changein fair value or cash flows of a hedged item; (2) the derivative expires, is sold, terminated or exercised or (3) we removethe designation of the derivative being the hedging instrument for a fair value or cash flow hedge.
If it is determined that a derivative no longer qualifies as an effective hedge, the derivative will continue to be carriedon the consolidated statements of financial position at its fair value, with changes in fair value recognized prospectively innet realized capital gains (losses). The asset or liability under a fair value hedge will no longer be adjusted for changes infair value pursuant to hedging rules and the existing basis adjustment is amortized to the consolidated statements ofoperations line associated with the asset or liability. The component of OCI related to discontinued cash flow hedges thatare no longer highly effective is amortized to the consolidated statements of operations consistent with the net incomeimpacts of the original hedged cash flows. If a cash flow hedge is discontinued because it is probable the hedgedforecasted transaction will not occur, the deferred gain or loss is immediately reclassified from OCI into net income.
Embedded Derivatives. We purchase and issue certain financial instruments and products that contain a derivativethat is embedded in the financial instrument or product. We assess whether this embedded derivative is clearly andclosely related to the asset or liability that serves as its host contract. If we deem that the embedded derivative’s terms arenot clearly and closely related to the host contract, and a separate instrument with the same terms would qualify as aderivative instrument, the derivative is bifurcated from that contract and held at fair value on the consolidated statementsof financial position, with changes in fair value reported in net income.
Contractholder and Policyholder Liabilities
Contractholder and policyholder liabilities (contractholder funds, future policy benefits and claims and otherpolicyholder funds) include reserves for investment contracts and reserves for universal life, term life insurance,participating traditional individual life insurance, group life insurance, accident and health insurance and disabilityincome policies, as well as a provision for dividends on participating policies.
Investment contracts are contractholders’ funds on deposit with us and generally include reserves for pension andannuity contracts. Reserves on investment contracts are equal to the cumulative deposits less any applicable charges andwithdrawals plus credited interest. Reserves for universal life insurance contracts are equal to cumulative deposits lesscharges plus credited interest, which represents the account balances that accrue to the benefit of the policyholders.
We hold additional reserves on certain long duration contracts where benefit features result in gains in early yearsfollowed by losses in later years, universal life/variable universal life contracts that contain no lapse guarantee features, orannuities with guaranteed minimum death benefits.
96

Principal Financial Group, Inc.
Notes to Consolidated Financial Statements — (continued)
1. Nature of Operations and Significant Accounting Policies — (continued)
Reserves for nonparticipating term life insurance and disability income contracts are computed on a basis ofassumed investment yield, mortality, morbidity and expenses, including a provision for adverse deviation, which generallyvaries by plan, year of issue and policy duration. Investment yield is based on our experience. Mortality, morbidity andwithdrawal rate assumptions are based on our experience and are periodically reviewed against both industry standardsand experience.
Reserves for participating life insurance contracts are based on the net level premium reserve for death andendowment policy benefits. This net level premium reserve is calculated based on dividend fund interest rates andmortality rates guaranteed in calculating the cash surrender values described in the contract.
Participating business represented approximately 16%, 17% and 17% of our life insurance in force and 53%, 55%and 57% of the number of life insurance policies in force at December 31, 2010, 2009 and 2008, respectively. Participatingbusiness represented approximately 49%, 52% and 54% of life insurance premiums for the years ended December 31,2010, 2009 and 2008, respectively. The amount of dividends to policyholders is declared annually by Principal Life’sBoard of Directors. The amount of dividends to be paid to policyholders is determined after consideration of severalfactors including interest, mortality, morbidity and other expense experience for the year and judgment as to theappropriate level of statutory surplus to be retained by Principal Life. At the end of the reporting period, Principal Lifeestablishes a dividend liability for the pro rata portion of the dividends expected to be paid on or before the next policyanniversary date.
Some of our policies and contracts require payment of fees or other policyholder assessments in advance for servicesthat will be rendered over the estimated lives of the policies and contracts. These payments are established as unearnedrevenue liabilities upon receipt and included in other policyholder funds in the consolidated statements of financialposition. These unearned revenue reserves are amortized to operations over the estimated lives of these policies andcontracts in relation to the emergence of estimated gross profit margins.
The liability for unpaid accident and health claims is an estimate of the ultimate net cost of reported and unreportedlosses not yet settled. This liability is estimated using actuarial analyses and case basis evaluations. Although considerablevariability is inherent in such estimates, we believe that the liability for unpaid claims is adequate. These estimates arecontinually reviewed and, as adjustments to this liability become necessary, such adjustments are reflected in net income.
Recognition of Premiums and Other Considerations, Fees and Other Revenues and Benefits
Traditional individual life insurance products include those products with fixed and guaranteed premiums andbenefits and consist principally of whole life and term life insurance policies. Premiums from these products arerecognized as premium revenue when due. Related policy benefits and expenses for individual life products areassociated with earned premiums and result in the recognition of profits over the expected term of the policies andcontracts.
Immediate annuities with life contingencies include products with fixed and guaranteed annuity considerations andbenefits and consist principally of group and individual single premium annuities with life contingencies. Annuityconsiderations from these products are recognized as revenue. However, the collection of these annuity considerationsdoes not represent the completion of the earnings process, as we establish annuity reserves, using estimates for mortalityand investment assumptions, which include provision for adverse deviation as required by U.S. GAAP. We anticipateprofits to emerge over the life of the annuity products as we earn investment income, pay benefits and release reserves.
Group life and health insurance premiums are generally recorded as premium revenue over the term of thecoverage. Certain group contracts contain experience premium refund provisions based on a pre-defined formula thatreflects their claim experience. Experience premium refunds reduce revenue over the term of the coverage and areadjusted to reflect current experience. Related policy benefits and expenses for group life and health insurance productsare associated with earned premiums and result in the recognition of profits over the term of the policies and contracts.Fees for contracts providing claim processing or other administrative services are recorded as revenue over the period theservice is provided.
Universal life-type policies are insurance contracts with terms that are not fixed. Amounts received as payments forsuch contracts are not reported as premium revenues. Revenues for universal life-type insurance contracts consist ofpolicy charges for the cost of insurance, policy initiation and administration, surrender charges and other fees that havebeen assessed against policy account values and investment income. Policy benefits and claims that are charged toexpense include interest credited to contracts and benefit claims incurred in the period in excess of related policy accountbalances.
97
Principal Financial Group, Inc.
Notes to Consolidated Financial Statements — (continued)
1. Nature of Operations and Significant Accounting Policies — (continued)
Investment contracts do not subject us to significant risks arising from policyholder mortality or morbidity andconsist primarily of Guaranteed Investment Contracts (‘‘GICs’’), funding agreements and certain deferred annuities.Amounts received as payments for investment contracts are established as investment contract liability balances and arenot reported as premium revenues. Revenues for investment contracts consist of investment income and policyadministration charges. Investment contract benefits that are charged to expense include benefit claims incurred in theperiod in excess of related investment contract liability balances and interest credited to investment contract liabilitybalances.
Fees and other revenues are earned for asset management services provided to retail and institutional clients basedlargely upon contractual rates applied to the market value of the client’s portfolio. Additionally, fees and other revenuesare earned for administrative services performed including recordkeeping and reporting services for retirement savingsplans. Fees and other revenues received for performance of asset management and administrative services are recognizedas revenue when earned, typically when the service is performed.
Deferred Policy Acquisition Costs
Commissions and other costs (underwriting, issuance and field expenses) that vary with and are primarily related tothe acquisition of new and renewal insurance policies and investment contract business are capitalized to the extentrecoverable. Maintenance costs and acquisition costs that are not deferrable are charged to operations as incurred.
DPAC for universal life-type insurance contracts, participating life insurance policies and certain investmentcontracts are being amortized over the lives of the policies and contracts in relation to the emergence of estimated grossprofit margins. This amortization is adjusted in the current period when estimated gross profits are revised. For individualvariable life insurance, individual variable annuities and group annuities which have separate account equity investmentoptions, we utilize a mean reversion method (reversion to the mean assumption), a common industry practice, todetermine the future domestic equity market growth assumption used for the amortization of DPAC. The DPAC ofnonparticipating term life insurance and individual disability policies are being amortized over the premium-payingperiod of the related policies using assumptions consistent with those used in computing policyholder liabilities.
DPAC are subject to recoverability testing at the time of policy issue and loss recognition testing on an annual basis,or when an event occurs that may warrant loss recognition. If loss recognition is necessary, DPAC would be written off tothe extent that it is determined that future policy premiums and investment income or gross profits are not adequate tocover related losses and expenses.
Deferred Policy Acquisition Costs on Internal Replacements
All insurance and investment contract modifications and replacements are reviewed to determine if the internalreplacement results in a substantially changed contract. If so, the acquisition costs, sales inducements and unearnedrevenue associated with the new contract are deferred and amortized over the lifetime of the new contract. In addition,the existing DPAC, sales inducement costs and unearned revenue balances associated with the replaced contract arewritten off. If an internal replacement results in a substantially unchanged contract, the acquisition costs, salesinducements and unearned revenue associated with the new contract are immediately recognized in the period incurred.In addition, the existing DPAC, sales inducement costs or unearned revenue balance associated with the replacedcontract is not written off, but instead is carried over to the new contract.
Long-Term Debt
Long-term debt includes notes payable, nonrecourse mortgages and other debt with a maturity date greater than oneyear at the date of issuance. Current maturities of long-term debt are classified as long-term debt in our statement offinancial position.
Reinsurance
We enter into reinsurance agreements with other companies in the normal course of business. We may assumereinsurance from or cede reinsurance to other companies. Assets and liabilities related to reinsurance ceded are reportedon a gross basis. Premiums and expenses are reported net of reinsurance ceded. The cost of reinsurance related tolong-duration contracts is accounted for over the life of the underlying reinsured policies using assumptions consistentwith those used to account for the underlying policies. We are contingently liable with respect to reinsurance ceded toother companies in the event the reinsurer is unable to meet the obligations it has assumed. At December 31, 2010 and2009, our largest exposures to a single third-party reinsurer in our individual life insurance business was $23.3 billion and$22.0 billion of life insurance in force, representing 15% and 14% of total net individual life insurance in force,
98
Principal Financial Group, Inc.
Notes to Consolidated Financial Statements — (continued)
1. Nature of Operations and Significant Accounting Policies — (continued)
respectively. The financial statement exposure is limited to the reinsurance recoverable related to this single third partyreinsurer, which was $27.5 million and $26.8 million at December 31, 2010 and 2009, respectively.
The effects of reinsurance on premiums and other considerations and policy and contract benefits were as follows:
For the year endedDecember 31,
2010 2009 2008
(in millions)Premiums and other considerations:
Direct . . . . . . . . . . . . . . . . . . . . . . . . . . . . . . . . . . . . . . . . . . . . . . . . . . . . . . . . $3,859.8 $4,047.6 $4,495.1Assumed . . . . . . . . . . . . . . . . . . . . . . . . . . . . . . . . . . . . . . . . . . . . . . . . . . . . . . 3.5 5.2 9.7Ceded . . . . . . . . . . . . . . . . . . . . . . . . . . . . . . . . . . . . . . . . . . . . . . . . . . . . . . . . (307.8) (302.2) (295.6)
Net premiums and other considerations . . . . . . . . . . . . . . . . . . . . . . . . . . . . . . . . . . . . $3,555.5 $3,750.6 $4,209.2
Benefits, claims and settlement expenses:Direct . . . . . . . . . . . . . . . . . . . . . . . . . . . . . . . . . . . . . . . . . . . . . . . . . . . . . . . . $5,507.2 $5,564.5 $6,440.8Assumed . . . . . . . . . . . . . . . . . . . . . . . . . . . . . . . . . . . . . . . . . . . . . . . . . . . . . . 36.8 38.9 43.5Ceded . . . . . . . . . . . . . . . . . . . . . . . . . . . . . . . . . . . . . . . . . . . . . . . . . . . . . . . . (205.6) (268.9) (264.4)
Net benefits, claims and settlement expenses . . . . . . . . . . . . . . . . . . . . . . . . . . . . . . . . . $5,338.4 $5,334.5 $6,219.9
Separate Accounts
The separate account assets presented in the consolidated financial statements represent the fair value of funds thatare separately administered by us for contracts with equity, real estate and fixed income investments. The separateaccount contract owner, rather than us, bears the investment risk of these funds. The separate account assets are legallysegregated and are not subject to claims that arise out of any of our other business. We receive fees for mortality,withdrawal and expense risks, as well as administrative, maintenance and investment advisory services that are included inthe consolidated statements of operations. Net deposits, net investment income and realized and unrealized capital gainsand losses on the separate accounts are not reflected in the consolidated statements of operations.
At December 31, 2010 and 2009, the separate accounts include a separate account valued at $221.7 million and$191.5 million, respectively, which primarily includes shares of our stock that were allocated and issued to eligibleparticipants of qualified employee benefit plans administered by us as part of the policy credits issued under our 2001demutualization. These shares are included in both basic and diluted earnings per share calculations. In the consolidatedstatements of financial position, the separate account shares are recorded at fair value and are reported as separateaccount assets with a corresponding separate account liability to eligible participants of the qualified plan. Changes in fairvalue of the separate account shares are reflected in both the separate account assets and separate account liabilities anddo not impact our results of operations.
Income Taxes
We file a U.S. consolidated income tax return that includes all of our qualifying subsidiaries. In addition, we fileincome tax returns in all states and foreign jurisdictions in which we conduct business. Our policy of allocating income taxexpenses and benefits to companies in the group is generally based upon pro rata contribution of taxable income oroperating losses. We are taxed at corporate rates on taxable income based on existing tax laws. Current income taxes arecharged or credited to net income based upon amounts estimated to be payable or recoverable as a result of taxableoperations for the current year. Deferred income taxes are provided for the tax effect of temporary differences in thefinancial reporting and income tax bases of assets and liabilities and net operating losses using enacted income tax ratesand laws. The effect on deferred income tax assets and deferred income tax liabilities of a change in tax rates isrecognized in operations in the period in which the change is enacted.
Foreign Exchange
Assets and liabilities of our foreign subsidiaries and affiliates denominated in non-U.S. dollars, where the U.S. dollaris not the functional currency, are translated into U.S. dollar equivalents at the year-end spot foreign exchange rates.Resulting translation adjustments are reported as a component of stockholders’ equity, along with any related hedge andtax effects. Revenues and expenses for these entities are translated at the average exchange rates for the year. Revenue,expense and other foreign currency transaction and translation adjustments that affect cash flows are reported in netincome, along with related hedge and tax effects.
99

Principal Financial Group, Inc.
Notes to Consolidated Financial Statements — (continued)
1. Nature of Operations and Significant Accounting Policies — (continued)
Goodwill and Other Intangibles
Goodwill and other intangible assets include the cost of acquired subsidiaries in excess of the fair value of the nettangible assets recorded in connection with acquisitions. Goodwill and indefinite-lived intangible assets are notamortized. Rather, they are tested for impairment during the fourth quarter each year, or more frequently if events orchanges in circumstances indicate that the asset might be impaired. Goodwill is tested at the reporting unit level to whichit was assigned. A reporting unit is an operating segment or a business one level below that operating segment, if financialinformation is prepared and regularly reviewed by management at that level. Once goodwill has been assigned to areporting unit, it is no longer associated with a particular acquisition; therefore, all of the activities within a reportingunit, whether acquired or organically grown, are available to support the goodwill value. Impairment testing forindefinite-lived intangible assets consists of a comparison of the fair value of the intangible asset with its carrying value.
Intangible assets with a finite useful life are amortized as related benefits emerge and are reviewed periodically forindicators of impairment in value. If facts and circumstances suggest possible impairment, the sum of the estimatedundiscounted future cash flows expected to result from the use of the asset is compared to the current carrying value ofthe asset. If the undiscounted future cash flows are less than the carrying value, an impairment loss is recognized for theexcess of the carrying amount of assets over their fair value.
Earnings Per Common Share
Basic earnings per common share is calculated by dividing income available to common stockholders by theweighted-average number of common shares outstanding for the period and excludes the dilutive effect of equity awards.Diluted earnings per common share reflects the potential dilution that could occur if dilutive securities, such as optionsand non-vested stock grants, were exercised or resulted in the issuance of common stock.
2. Goodwill and Other Intangible Assets
Goodwill
The changes in the carrying amount of goodwill reported in our segments were as follows:
Retirement Principal U.S.and Investor Global Principal Insurance
Services Investors International Solutions Corporate Consolidated
(in millions)Balances at January 1, 2009 . . . . . . . . . . . . . . $72.6 $169.0 $45.4 $43.4 $ 45.1 $375.5Foreign currency translation . . . . . . . . . . . . . . — — 10.9 — — 10.9
Balances at December 31, 2009 . . . . . . . . . . . . 72.6 169.0 56.3 43.4 45.1 386.4Impairment . . . . . . . . . . . . . . . . . . . . . . . . . — — — — (43.6) (43.6)Foreign currency translation . . . . . . . . . . . . . . — — 4.2 — — 4.2Other . . . . . . . . . . . . . . . . . . . . . . . . . . . . . — — (1.6) — — (1.6)
Balances at December 31, 2010 . . . . . . . . . . . . $72.6 $169.0 $58.9 $43.4 $ 1.5 $345.4
On September 30, 2010, we announced our decision to exit the group medical insurance business. This eventconstituted a substantive change in circumstances that would more likely than not reduce the fair value of our groupmedical insurance reporting unit below its carrying amount. Accordingly, we performed an interim goodwill impairmenttest as of September 30, 2010. As a result of the shortened period of projected cash flows, we determined that thegoodwill related to this reporting unit within our Corporate operating segment was impaired and it was written down to avalue of zero. We recorded a $43.6 million pre-tax impairment loss as an operating expense in the consolidatedstatements of operations during the year ended December 31, 2010.
100
Principal Financial Group, Inc.
Notes to Consolidated Financial Statements — (continued)
2. Goodwill and Other Intangible Assets — (continued)
Finite Lived Intangible Assets
Amortized intangible assets that continue to be subject to amortization over a weighted average remaining expectedlife of 12 years were as follows:
December 31,
2010 2009
Gross Net Gross Netcarrying Accumulated carrying carrying Accumulated carryingamount amortization amount amount amortization amount
(in millions)Present value of future profits . . . . . . . . . . . . . . $148.7 $ 48.7 $100.0 $141.2 $ 42.8 $ 98.4Other finite lived intangible assets . . . . . . . . . . . 194.3 128.5 65.8 202.0 117.3 84.7
Total amortized intangible assets . . . . . . . . . . . . $343.0 $177.2 $165.8 $343.2 $160.1 $183.1
During 2010, we fully amortized other finite lived intangible assets of $1.7 million.
Present Value of Future Profits. Present value of future profits (‘‘PVFP’’) represents the present value of estimatedfuture profits to be generated from existing insurance contracts in-force at the date of acquisition and is amortized overthe expected policy or contract duration in relation to estimated gross profits. The PVFP asset and amortization may beadjusted if revisions to estimated gross profits occur.
The changes in the carrying amount of PVFP, reported in our Principal International segment were as follows (inmillions):
Balance at January 1, 2008 . . . . . . . . . . . . . . . . . . . . . . . . . . . . . . . . . . . . . . . . . . . . . . . . . . . . . . . . . . . . $113.6Interest accrued . . . . . . . . . . . . . . . . . . . . . . . . . . . . . . . . . . . . . . . . . . . . . . . . . . . . . . . . . . . . . . . . . . . 9.5Amortization . . . . . . . . . . . . . . . . . . . . . . . . . . . . . . . . . . . . . . . . . . . . . . . . . . . . . . . . . . . . . . . . . . . . . (15.8)Foreign currency translation . . . . . . . . . . . . . . . . . . . . . . . . . . . . . . . . . . . . . . . . . . . . . . . . . . . . . . . . . . . (22.9)
Balance at December 31, 2008 . . . . . . . . . . . . . . . . . . . . . . . . . . . . . . . . . . . . . . . . . . . . . . . . . . . . . . . . . . 84.4Interest accrued . . . . . . . . . . . . . . . . . . . . . . . . . . . . . . . . . . . . . . . . . . . . . . . . . . . . . . . . . . . . . . . . . . . 7.6Amortization . . . . . . . . . . . . . . . . . . . . . . . . . . . . . . . . . . . . . . . . . . . . . . . . . . . . . . . . . . . . . . . . . . . . . (8.9)Foreign currency translation . . . . . . . . . . . . . . . . . . . . . . . . . . . . . . . . . . . . . . . . . . . . . . . . . . . . . . . . . . . 5.1Other . . . . . . . . . . . . . . . . . . . . . . . . . . . . . . . . . . . . . . . . . . . . . . . . . . . . . . . . . . . . . . . . . . . . . . . . . . 10.2
Balance at December 31, 2009 . . . . . . . . . . . . . . . . . . . . . . . . . . . . . . . . . . . . . . . . . . . . . . . . . . . . . . . . . . 98.4Interest accrued . . . . . . . . . . . . . . . . . . . . . . . . . . . . . . . . . . . . . . . . . . . . . . . . . . . . . . . . . . . . . . . . . . . 8.0Amortization . . . . . . . . . . . . . . . . . . . . . . . . . . . . . . . . . . . . . . . . . . . . . . . . . . . . . . . . . . . . . . . . . . . . . (11.5)Foreign currency translation . . . . . . . . . . . . . . . . . . . . . . . . . . . . . . . . . . . . . . . . . . . . . . . . . . . . . . . . . . . 5.1
Balance at December 31, 2010 . . . . . . . . . . . . . . . . . . . . . . . . . . . . . . . . . . . . . . . . . . . . . . . . . . . . . . . . . . $100.0
At December 31, 2010, the estimated amortization expense, net of interest accrued, related to PVFP for the next fiveyears is as follows (in millions):
Year ending December 31:2011 . . . . . . . . . . . . . . . . . . . . . . . . . . . . . . . . . . . . . . . . . . . . . . . . . . . . . . . . . . . . . . . . . . . . . . . . . $3.22012 . . . . . . . . . . . . . . . . . . . . . . . . . . . . . . . . . . . . . . . . . . . . . . . . . . . . . . . . . . . . . . . . . . . . . . . . . 3.12013 . . . . . . . . . . . . . . . . . . . . . . . . . . . . . . . . . . . . . . . . . . . . . . . . . . . . . . . . . . . . . . . . . . . . . . . . . 3.72014 . . . . . . . . . . . . . . . . . . . . . . . . . . . . . . . . . . . . . . . . . . . . . . . . . . . . . . . . . . . . . . . . . . . . . . . . . 4.62015 . . . . . . . . . . . . . . . . . . . . . . . . . . . . . . . . . . . . . . . . . . . . . . . . . . . . . . . . . . . . . . . . . . . . . . . . . 5.4
Other Finite Lived Intangible Assets. During 2010, we recorded a $1.6 million pre-tax impairment loss as an operatingexpense related to finite lived intangible assets with a gross carrying amount of $6.0 million and $4.4 million ofaccumulated amortization at the time of impairment resulting from our decision to exit the group medical insurancebusiness. During 2009 and 2008, we recognized an impairment of $6.5 million and $12.3 million, respectively, associatedwith a customer-based intangible acquired as part of our acquisition of WM Advisors, Inc. This impairment had noimpact on our consolidated statement of operations for the Retirement and Investor Services segment, as the cash flowsassociated with this intangible are credited to an outside party.
101
Principal Financial Group, Inc.
Notes to Consolidated Financial Statements — (continued)
2. Goodwill and Other Intangible Assets — (continued)
The amortization expense for intangible assets with finite useful lives was $18.9 million, $35.2 million and$44.6 million for 2010, 2009 and 2008, respectively. At December 31, 2010, the estimated amortization expense for thenext five years is as follows (in millions):
Year ending December 31:2011 . . . . . . . . . . . . . . . . . . . . . . . . . . . . . . . . . . . . . . . . . . . . . . . . . . . . . . . . . . . . . . . . . . . . . . . . $10.22012 . . . . . . . . . . . . . . . . . . . . . . . . . . . . . . . . . . . . . . . . . . . . . . . . . . . . . . . . . . . . . . . . . . . . . . . . 7.32013 . . . . . . . . . . . . . . . . . . . . . . . . . . . . . . . . . . . . . . . . . . . . . . . . . . . . . . . . . . . . . . . . . . . . . . . . 5.52014 . . . . . . . . . . . . . . . . . . . . . . . . . . . . . . . . . . . . . . . . . . . . . . . . . . . . . . . . . . . . . . . . . . . . . . . . 4.12015 . . . . . . . . . . . . . . . . . . . . . . . . . . . . . . . . . . . . . . . . . . . . . . . . . . . . . . . . . . . . . . . . . . . . . . . . 2.3
Indefinite Lived Intangible Assets
The net carrying amount of unamortized indefinite lived intangible assets was $668.8 million and $668.6 million as ofDecember 31, 2010 and 2009, respectively. As of both December 31, 2010 and 2009, $608.0 million relates to investmentmanagement contracts associated with our December 31, 2006, acquisition of WM Advisors, Inc.
3. Variable Interest Entities
We have relationships with and may have a variable interest in various types of special purpose entities. Following isa discussion of our interest in entities that meet the definition of a VIE. When we are the primary beneficiary we arerequired to consolidate the entity in our financial statements. On January 1, 2010, we adopted authoritative guidance thatchanged the method of determining the primary beneficiary of a VIE. Prior to January 1, 2010, the primary beneficiarywas the enterprise who absorbed the majority of the entity’s expected losses, received a majority of the expected residualreturns or both. The new guidance identifies the primary beneficiary of a VIE as the enterprise with (1) the power todirect the activities of a VIE that most significantly impact the entity’s economic performance and (2) the obligation toabsorb losses of the entity or the right to receive benefits from the entity that could potentially be significant to the VIE.We assess whether we are the primary beneficiary of VIEs we have relationships with on an ongoing basis. See furtherdiscussion of the adoption in Note 1, Nature of Operations and Significant Accounting Policies.
Consolidated Variable Interest Entities
Grantor Trusts
We contributed undated subordinated floating rate notes to three grantor trusts. The trusts separated the cash flowsby issuing an interest-only certificate and a residual certificate related to each note contributed. Each interest-onlycertificate entitles the holder to interest on the stated note for a specified term, while the residual certificate entitles theholder to interest payments subsequent to the term of the interest-only certificate and to all principal payments. Weretained the interest-only certificates and the residual certificates were subsequently sold to third parties.
We have determined these grantor trusts are VIEs due to insufficient equity to sustain them. As our interest-onlycertificates are exposed to the majority of the risk of loss due to interest rate risk, we determined we were the primarybeneficiary prior to January 1, 2010. Beginning January 1, 2010, we determined we remain the primary beneficiary as aresult of our contribution of securities into the trusts.
Collateralized Private Investment Vehicles
We invest in synthetic CDOs, collateralized bond obligations, collateralized loan obligations, collateralizedcommodity obligations and other collateralized structures, which are VIEs due to insufficient equity to sustain the entities(collectively known as ‘‘collateralized private investment vehicles’’). The performance of the notes of these structures isprimarily linked to a synthetic portfolio by derivatives; each note has a specific loss attachment and detachment point.The notes and related derivatives are collateralized by a pool of permitted investments. The investments are held by atrustee and can only be liquidated to settle obligations of the trusts. These obligations primarily include derivatives,financial guarantees and the notes due at maturity or termination of the trusts.
Prior to January 1, 2010, we determined we were the primary beneficiary of a certain number of these entities due tothe nature of our direct investment in the VIEs. As of December 31, 2009, we consolidated five collateralized privateinvestment vehicles with assets of $135.6 million. Upon adoption of the new accounting guidance as of January 1, 2010,we determined we were no longer the primary beneficiary of three of these entities with assets of $65.4 million. For thesethree entities, we do not control the decisions affecting the economic performance of the entities and we were notinvolved with the design of the entities. As of December 31, 2010, we continue to hold $53.9 million of investments inthese entities classified on the consolidated statements of financial position as fixed maturities, available-for-sale or fixedmaturities, trading. We also determined we are the primary beneficiary of two additional collateralized private investment
102
Principal Financial Group, Inc.
Notes to Consolidated Financial Statements — (continued)
3. Variable Interest Entities — (continued)
vehicles. For all the collateralized structures consolidated as of December 31, 2010, we are the primary beneficiarybecause we act as the investment manager of the underlying portfolio and we have an ownership interest.
In October 2009, a synthetic CDO we had previously consolidated was terminated. During the year endedDecember 31, 2009, we recognized a pre-tax gain of $49.8 million related to the change in fair value and termination ofthe credit default swaps within the VIE. We were considered the primary beneficiary due to our direct investment in theVIE and management of the synthetic reference portfolios.
Commercial Mortgage-Backed Securities
In September 2000, we sold commercial mortgage loans to a real estate mortgage investment conduit trust. The trustissued various commercial mortgage-backed securities (‘‘CMBS’’) certificates using the cash flows of the underlyingcommercial mortgages it purchased. Prior to January 1, 2010, this entity was scoped out of the consolidation guidance asa QSPE. Based on the new accounting guidance, the previous scope exception for QSPEs no longer exists and this entityis now a VIE due to the entity having insufficient equity to sustain itself. We have determined we are the primarybeneficiary as we retained the special servicing role for the assets within the trust as well as the ownership of the bondclass which controls the unilateral kick out rights of the special servicer.
Hedge Funds
We are a general partner with an insignificant equity ownership in various hedge funds. These entities are deemedVIEs due to the equity owners not having decision-making ability. Before January 1, 2010, we consolidated these VIEsdue to our related parties’ ownership. Beginning January 1, 2010, we continue to consolidate these entities due to ourcontrol through our management relationship, related party ownership and our fee structure in certain of these funds.These entities contain various fixed maturities held as available-for-sale and trading and equity securities held as trading.
The carrying amounts of our consolidated VIE assets, which can only be used to settle obligations of consolidatedVIEs, and liabilities of consolidated VIEs for which creditors do not have recourse are as follows:
Collateralizedprivate investment
Grantor trusts vehicles CMBS Hedge funds (2) Total
(in millions)December 31, 2010Fixed maturities, available-for-sale . . . . . . . . . . . . . . . . . $243.1 $ 14.8 $ — $ — $257.9Fixed maturities, trading . . . . . . . . . . . . . . . . . . . . . . . — 131.4 — — 131.4Equity securities, trading . . . . . . . . . . . . . . . . . . . . . . . — — — 158.6 158.6Other investments . . . . . . . . . . . . . . . . . . . . . . . . . . . — — 128.4 0.3 128.7Cash and cash equivalents . . . . . . . . . . . . . . . . . . . . . . — 55.0 — 45.0 100.0Accrued investment income . . . . . . . . . . . . . . . . . . . . . 0.7 0.1 0.8 — 1.6Premiums due and other receivables . . . . . . . . . . . . . . . . — 1.6 — 13.9 15.5
Total assets . . . . . . . . . . . . . . . . . . . . . . . . . . . . . . $243.8 $202.9 $129.2 $217.8 $793.7
Deferred income taxes . . . . . . . . . . . . . . . . . . . . . . . . $ 2.4 $ — $ — $ — $ 2.4Other liabilities (1) . . . . . . . . . . . . . . . . . . . . . . . . . . 135.8 132.6 94.1 71.1 433.6
Total liabilities . . . . . . . . . . . . . . . . . . . . . . . . . . . . $138.2 $132.6 $ 94.1 $ 71.1 $436.0
December 31, 2009Fixed maturities, available-for-sale . . . . . . . . . . . . . . . . . $226.6 $ 59.2 $ — $ — $285.8Fixed maturities, trading . . . . . . . . . . . . . . . . . . . . . . . — 19.8 — — 19.8Equity securities, trading . . . . . . . . . . . . . . . . . . . . . . . — — — 90.9 90.9Cash and cash equivalents . . . . . . . . . . . . . . . . . . . . . . — 55.0 — 45.1 100.1Accrued investment income . . . . . . . . . . . . . . . . . . . . . 0.8 0.2 — — 1.0Premiums due and other receivables . . . . . . . . . . . . . . . . — 1.4 — 18.1 19.5
Total assets . . . . . . . . . . . . . . . . . . . . . . . . . . . . . . $227.4 $135.6 $ — $154.1 $517.1
Deferred income taxes . . . . . . . . . . . . . . . . . . . . . . . . $ 2.7 $ — $ — $ — $ 2.7Other liabilities (1) . . . . . . . . . . . . . . . . . . . . . . . . . . 89.1 24.6 — 43.1 156.8
Total liabilities . . . . . . . . . . . . . . . . . . . . . . . . . . . . $ 91.8 $ 24.6 $ — $ 43.1 $159.5
(1) Grantor trusts contain an embedded derivative of a forecasted transaction to deliver the underlying securities; collateralized privateinvestment vehicles include derivative liabilities, financial guarantees and obligation to redeem notes at maturity or termination of thetrust; CMBS includes obligation to the bondholders; and hedge funds include liabilities to securities brokers.
(2) The consolidated statements of financial position included a $145.9 million and $110.2 million as of December 31, 2010 and 2009,respectively, noncontrolling interest for hedge funds.
103

Principal Financial Group, Inc.
Notes to Consolidated Financial Statements — (continued)
3. Variable Interest Entities — (continued)
We did not provide financial or other support to investees designated as VIEs for the years ended December 31,2010 and 2009.
Unconsolidated Variable Interest Entities
Invested Securities
We hold a variable interest in a number of VIEs where we are not the primary beneficiary. Our investments insecurities issued by these VIEs are reported in fixed maturities, available-for-sale and fixed maturities, trading in theconsolidated statements of financial position and are described below.
VIEs include CMBS, residential mortgage-backed securities and asset-backed securities. All of these entities weredeemed VIEs upon the removal of the QSPE scope exception because the equity within these entities is insufficient tosustain them. We currently are not the primary beneficiary in any of the entities within these categories of investments.This determination was based primarily on the fact we do not own the class of security that controls the unilateral right toreplace the special servicer or equivalent function.
As previously discussed, we invest in several types of collateralized private investment vehicles, which are VIEs.These include cash and synthetic structures that we do not manage. We are currently not the primary beneficiary of thesecollateralized private investment vehicles primarily because we do not control the economic performance of the entitiesand were not involved with the design of the entities.
We have invested in various VIE trusts as a debt holder. All of these entities are classified as VIEs due to insufficientequity to sustain them. Prior to January 1, 2010, we had performed a quantitative analysis and concluded that althoughwe held a significant variable interest in these entities we were not the primary beneficiary due to lack of majority of therisk of loss or because they were scoped out as a QSPE. Beginning January 1, 2010, we concluded we are not the primarybeneficiary primarily because we do not control the economic performance of the entities and were not involved with thedesign of the entities.
Prior to January 1, 2010, we were only required to disclose information about carrying value and maximum lossexposure for our significant unconsolidated VIEs. The carrying value and maximum loss exposure for our unconsolidatedVIEs as of December 31, 2010, and for our significant unconsolidated VIEs as of December 31, 2009, were as follows:
Maximum exposureAsset carrying value to loss (1)
(in millions)December 31, 2010Fixed maturities, available-for-sale:
Corporate . . . . . . . . . . . . . . . . . . . . . . . . . . . . . . . . . . . . . . . . . . . . . . . . . . . . $ 429.0 $ 367.7Residential mortgage-backed securities . . . . . . . . . . . . . . . . . . . . . . . . . . . . . . . . . 3,196.2 3,077.9Commercial mortgage-backed securities . . . . . . . . . . . . . . . . . . . . . . . . . . . . . . . . . 3,842.2 4,424.9Collateralized debt obligations . . . . . . . . . . . . . . . . . . . . . . . . . . . . . . . . . . . . . . . 293.0 380.5Other debt obligations . . . . . . . . . . . . . . . . . . . . . . . . . . . . . . . . . . . . . . . . . . . . 3,114.1 3,184.9
Fixed maturities, trading:Residential mortgage-backed securities . . . . . . . . . . . . . . . . . . . . . . . . . . . . . . . . . 215.5 215.5Commercial mortgage-backed securities . . . . . . . . . . . . . . . . . . . . . . . . . . . . . . . . . 5.1 5.1Collateralized debt obligations . . . . . . . . . . . . . . . . . . . . . . . . . . . . . . . . . . . . . . . 87.2 87.2Other debt obligations . . . . . . . . . . . . . . . . . . . . . . . . . . . . . . . . . . . . . . . . . . . . 118.8 118.8
December 31, 2009Fixed maturities, available-for-sale:
Corporate . . . . . . . . . . . . . . . . . . . . . . . . . . . . . . . . . . . . . . . . . . . . . . . . . . . . $ 162.8 $ 144.2
(1) Our risk of loss is limited to our initial investment measured at amortized cost for fixed maturities, available-for-sale and to fair value forour fixed maturities, trading.
Sponsored Investment Funds
We are the investment manager for certain money market mutual funds that are deemed to be VIEs. We are not theprimary beneficiary of these VIEs since our involvement is limited primarily to being a service provider, and our variableinterest does not absorb the majority of the variability of the entities’ net assets. As of December 31, 2010, these VIEsheld $1.7 billion in total assets. During 2010, we chose to contribute $3.2 million to these VIEs for competitive reasonsand have no contractual obligation to further contribute to the funds.
We provide asset management and other services to certain investment structures that are considered VIEs as wegenerally earn management fees and in some instances performance based fees. We are not the primary beneficiary ofthese entities as we do not have the obligation to absorb losses of the entities that could be potentially significant to theVIE or the right to receive benefits from these entities that could be potentially significant.
104

Principal Financial Group, Inc.
Notes to Consolidated Financial Statements — (continued)
4. Investments
Fixed Maturities and Equity Securities
The amortized cost, gross unrealized gains and losses, other-than-temporary impairments in AOCI and fair value offixed maturities and equity securities available-for-sale are summarized as follows:
Other-than-Gross Gross temporary
Amortized unrealized unrealized impairments in Faircost gains losses AOCI value
(in millions)December 31, 2010Fixed maturities, available-for-sale:
U.S. government and agencies . . . . . . . . . . . . . . . . . . . $ 748.5 $ 21.0 $ 0.2 $ — $ 769.3Non-U.S. governments . . . . . . . . . . . . . . . . . . . . . . . . 744.7 127.9 — — 872.6States and political subdivisions . . . . . . . . . . . . . . . . . . 2,615.0 64.7 23.3 — 2,656.4Corporate . . . . . . . . . . . . . . . . . . . . . . . . . . . . . . . . 32,523.8 1,913.7 527.0 18.0 33,892.5Residential mortgage-backed securities . . . . . . . . . . . . . 3,077.9 124.2 5.9 — 3,196.2Commercial mortgage-backed securities . . . . . . . . . . . . . 4,424.9 118.0 506.1 194.6 3,842.2Collateralized debt obligations . . . . . . . . . . . . . . . . . . . 380.5 1.7 51.8 37.4 293.0Other debt obligations . . . . . . . . . . . . . . . . . . . . . . . . 3,184.9 53.7 40.0 84.5 3,114.1
Total fixed maturities, available-for-sale . . . . . . . . . . . . . . $47,700.2 $2,424.9 $1,154.3 $334.5 $48,636.3
Total equity securities, available-for-sale . . . . . . . . . . . . . . $ 180.0 $ 8.1 $ 18.2 $ 169.9
December 31, 2009Fixed maturities, available-for-sale:
U.S. government and agencies . . . . . . . . . . . . . . . . . . . $ 550.1 $ 9.1 $ 0.5 $ — $ 558.7Non-U.S. governments . . . . . . . . . . . . . . . . . . . . . . . . 741.5 114.8 1.4 — 854.9States and political subdivisions . . . . . . . . . . . . . . . . . . 2,008.7 53.4 13.5 — 2,048.6Corporate . . . . . . . . . . . . . . . . . . . . . . . . . . . . . . . . 32,767.0 1,296.8 1,075.0 58.0 32,930.8Residential mortgage-backed securities . . . . . . . . . . . . . 3,049.5 87.4 3.8 — 3,133.1Commercial mortgage-backed securities . . . . . . . . . . . . . 4,898.0 20.9 1,211.5 107.7 3,599.7Collateralized debt obligations . . . . . . . . . . . . . . . . . . . 607.5 1.8 200.7 39.0 369.6Other debt obligations . . . . . . . . . . . . . . . . . . . . . . . . 2,994.1 34.6 229.8 73.7 2,725.2
Total fixed maturities, available-for-sale . . . . . . . . . . . . . . $47,616.4 $1,618.8 $2,736.2 $278.4 $46,220.6
Total equity securities, available-for-sale . . . . . . . . . . . . . . $ 231.1 $ 17.2 $ 34.3 $ 214.0
The amortized cost and fair value of fixed maturities available-for-sale at December 31, 2010, by expected maturity,were as follows:
Amortized Faircost value
(in millions)Due in one year or less . . . . . . . . . . . . . . . . . . . . . . . . . . . . . . . . . . . . . . . . . . . . . . . . . . . $ 2,548.1 $ 2,587.5Due after one year through five years . . . . . . . . . . . . . . . . . . . . . . . . . . . . . . . . . . . . . . . . . . 13,441.5 14,023.1Due after five years through ten years . . . . . . . . . . . . . . . . . . . . . . . . . . . . . . . . . . . . . . . . . . 8,770.4 9,199.6Due after ten years . . . . . . . . . . . . . . . . . . . . . . . . . . . . . . . . . . . . . . . . . . . . . . . . . . . . . . 11,872.0 12,380.6
Subtotal . . . . . . . . . . . . . . . . . . . . . . . . . . . . . . . . . . . . . . . . . . . . . . . . . . . . . . . . . . . . . 36,632.0 38,190.8Mortgage-backed and other asset-backed securities . . . . . . . . . . . . . . . . . . . . . . . . . . . . . . . . . . 11,068.2 10,445.5
Total . . . . . . . . . . . . . . . . . . . . . . . . . . . . . . . . . . . . . . . . . . . . . . . . . . . . . . . . . . . . . . . $47,700.2 $48,636.3
Actual maturities may differ because borrowers may have the right to call or prepay obligations. Our portfolio isdiversified by industry, issuer and asset class. Credit concentrations are managed to established limits.
105

Principal Financial Group, Inc.
Notes to Consolidated Financial Statements — (continued)
4. Investments — (continued)
Net Investment Income
Major categories of net investment income are summarized as follows:
For the year endedDecember 31,
2010 2009 2008
(in millions)Fixed maturities, available-for-sale . . . . . . . . . . . . . . . . . . . . . . . . . . . . . . . . . . . . . . . . $2,702.1 $2,679.3 $3,054.5Fixed maturities, trading . . . . . . . . . . . . . . . . . . . . . . . . . . . . . . . . . . . . . . . . . . . . . . 92.6 37.9 51.3Equity securities, available-for-sale . . . . . . . . . . . . . . . . . . . . . . . . . . . . . . . . . . . . . . . . 11.4 16.8 16.3Equity securities, trading . . . . . . . . . . . . . . . . . . . . . . . . . . . . . . . . . . . . . . . . . . . . . . 2.8 2.5 2.6Mortgage loans . . . . . . . . . . . . . . . . . . . . . . . . . . . . . . . . . . . . . . . . . . . . . . . . . . . . 673.3 688.9 821.6Real estate . . . . . . . . . . . . . . . . . . . . . . . . . . . . . . . . . . . . . . . . . . . . . . . . . . . . . . . 57.5 35.9 54.6Policy loans . . . . . . . . . . . . . . . . . . . . . . . . . . . . . . . . . . . . . . . . . . . . . . . . . . . . . . 60.9 62.0 58.3Cash and cash equivalents . . . . . . . . . . . . . . . . . . . . . . . . . . . . . . . . . . . . . . . . . . . . . 7.2 13.0 57.0Derivatives . . . . . . . . . . . . . . . . . . . . . . . . . . . . . . . . . . . . . . . . . . . . . . . . . . . . . . . (174.4) (128.3) (49.1)Other . . . . . . . . . . . . . . . . . . . . . . . . . . . . . . . . . . . . . . . . . . . . . . . . . . . . . . . . . . 152.6 104.3 70.9
Total . . . . . . . . . . . . . . . . . . . . . . . . . . . . . . . . . . . . . . . . . . . . . . . . . . . . . . . . . . . 3,586.0 3,512.3 4,138.0Investment expenses . . . . . . . . . . . . . . . . . . . . . . . . . . . . . . . . . . . . . . . . . . . . . . . . . (89.5) (111.5) (143.7)
Net investment income . . . . . . . . . . . . . . . . . . . . . . . . . . . . . . . . . . . . . . . . . . . . . . . $3,496.5 $3,400.8 $3,994.3
Net Realized Capital Gains and Losses
The major components of net realized capital gains (losses) on investments are summarized as follows:
For the year endedDecember 31,
2010 2009 2008
(in millions)Fixed maturities, available-for-sale:
Gross gains . . . . . . . . . . . . . . . . . . . . . . . . . . . . . . . . . . . . . . . . . . . . . . . . . . . . . . $ 63.7 $ 123.3 $ 50.8Gross losses . . . . . . . . . . . . . . . . . . . . . . . . . . . . . . . . . . . . . . . . . . . . . . . . . . . . . . (339.9) (703.9) (438.7)Portion of OTTI losses recognized in OCI . . . . . . . . . . . . . . . . . . . . . . . . . . . . . . . . . . . 56.1 260.9 —Hedging, net . . . . . . . . . . . . . . . . . . . . . . . . . . . . . . . . . . . . . . . . . . . . . . . . . . . . . . 142.2 (229.1) 496.3
Fixed maturities, trading . . . . . . . . . . . . . . . . . . . . . . . . . . . . . . . . . . . . . . . . . . . . . . . . 17.5 49.3 (61.7)Equity securities, available-for-sale:
Gross gains . . . . . . . . . . . . . . . . . . . . . . . . . . . . . . . . . . . . . . . . . . . . . . . . . . . . . . 8.9 27.0 12.0Gross losses . . . . . . . . . . . . . . . . . . . . . . . . . . . . . . . . . . . . . . . . . . . . . . . . . . . . . . (3.2) (46.5) (56.6)
Equity securities, trading . . . . . . . . . . . . . . . . . . . . . . . . . . . . . . . . . . . . . . . . . . . . . . . 27.7 39.4 (65.7)Mortgage loans . . . . . . . . . . . . . . . . . . . . . . . . . . . . . . . . . . . . . . . . . . . . . . . . . . . . . (152.2) (153.6) (44.8)Derivatives . . . . . . . . . . . . . . . . . . . . . . . . . . . . . . . . . . . . . . . . . . . . . . . . . . . . . . . . (143.9) 263.3 (645.1)Other . . . . . . . . . . . . . . . . . . . . . . . . . . . . . . . . . . . . . . . . . . . . . . . . . . . . . . . . . . . . 131.6 (28.4) 59.4
Net realized capital losses . . . . . . . . . . . . . . . . . . . . . . . . . . . . . . . . . . . . . . . . . . . . . . . $(191.5) $(398.3) $(694.1)
Proceeds from sales of investments (excluding call and maturity proceeds) in fixed maturities, available-for-sale were$1.6 billion, $3.3 billion and $1.2 billion in 2010, 2009 and 2008, respectively.
Other-Than-Temporary Impairments
We have a process in place to identify fixed maturity and equity securities that could potentially have a creditimpairment that is other than temporary. This process involves monitoring market events that could impact issuers’ creditratings, business climate, management changes, litigation and government actions and other similar factors. This processalso involves monitoring late payments, pricing levels, downgrades by rating agencies, key financial ratios, financialstatements, revenue forecasts and cash flow projections as indicators of credit issues.
During first quarter 2009, we adopted authoritative guidance that changed the recognition and presentation ofother-than-temporary impairments. See further discussion of the adoption in Note 1, Nature of Operations andSignificant Accounting Policies. The recognition provisions of the guidance apply only to debt securities classified asavailable-for-sale and held-to-maturity, while the presentation and disclosure requirements apply to both debt and equitysecurities.
106
Principal Financial Group, Inc.
Notes to Consolidated Financial Statements — (continued)
4. Investments — (continued)
Each reporting period, all securities are reviewed to determine whether an other-than-temporary decline in valueexists and whether losses should be recognized. We consider relevant facts and circumstances in evaluating whether acredit or interest rate-related impairment of a security is other than temporary. Relevant facts and circumstancesconsidered include: (1) the extent and length of time the fair value has been below cost; (2) the reasons for the decline invalue; (3) the financial position and access to capital of the issuer, including the current and future impact of any specificevents; (4) for structured securities, the adequacy of the expected cash flows; (5) for fixed maturities, our intent to sell asecurity or whether it is more likely than not we will be required to sell the security before the recovery of its amortizedcost which, in some cases, may extend to maturity and (6) for equity securities, our ability and intent to hold the securityfor a period of time that allows for the recovery in value. Prior to 2009, our ability and intent to hold fixed maturities for aperiod of time that allowed for a recovery in value was considered rather than our intent to sell these securities. To theextent we determine that a security is deemed to be other than temporarily impaired, an impairment loss is recognized.
Impairment losses on equity securities are recognized in net income and are measured as the difference betweenamortized cost and fair value. The way in which impairment losses on fixed maturities are now recognized in the financialstatements is dependent on the facts and circumstances related to the specific security. If we intend to sell a security or itis more likely than not that we would be required to sell a security before the recovery of its amortized cost, less anycurrent period credit loss, we recognize an other-than-temporary impairment in net income for the difference betweenamortized cost and fair value. If we do not expect to recover the amortized cost basis, we do not plan to sell the securityand if it is not more likely than not that we would be required to sell a security before the recovery of its amortized cost,less any current period credit loss, the recognition of the other-than-temporary impairment is bifurcated. We recognizethe credit loss portion in net income and the noncredit loss portion in OCI. Prior to 2009, other-than-temporaryimpairments on fixed maturities were recorded in net income in their entirety and the amount recognized was thedifference between amortized cost and fair value.
We estimate the amount of the credit loss component of a fixed maturity security impairment as the differencebetween amortized cost and the present value of the expected cash flows of the security. The present value is determinedusing the best estimate cash flows discounted at the effective interest rate implicit to the security at the date of purchaseor the current yield to accrete an asset-backed or floating rate security. The methodology and assumptions forestablishing the best estimate cash flows vary depending on the type of security. The asset-backed securities cash flowestimates are based on security specific facts and circumstances that may include collateral characteristics, expectations ofdelinquency and default rates, loss severity and prepayment speeds and structural support, including subordination andguarantees. The corporate security cash flow estimates are derived from scenario-based outcomes of expected corporaterestructurings or liquidations using bond specific facts and circumstances including timing, security interests and lossseverity.
Total other-than-temporary impairment losses, net of recoveries from the sale of previously impaired securities, wereas follows:
For the year endedDecember 31,
2010 2009 2008
(in millions)Fixed maturities, available-for-sale . . . . . . . . . . . . . . . . . . . . . . . . . . . . . . . . . . . . . . . . . $(300.0) $(693.6) $(432.0)Equity securities, available-for-sale . . . . . . . . . . . . . . . . . . . . . . . . . . . . . . . . . . . . . . . . . 3.7 (20.5) (47.3)
Total other-than-temporary impairment losses, net of recoveries from the sale of previouslyimpaired securities . . . . . . . . . . . . . . . . . . . . . . . . . . . . . . . . . . . . . . . . . . . . . . . . . . $(296.3) $(714.1) $(479.3)
107
Principal Financial Group, Inc.
Notes to Consolidated Financial Statements — (continued)
4. Investments — (continued)
The change in accumulated credit losses associated with other-than-temporary impairments on fixed maturities forwhich an amount related to credit losses was recognized in net realized capital gains (losses) and an amount related tononcredit losses was recognized in OCI (‘‘bifurcated OTTI’’) is summarized as follows:
For the year ended December 31,
2010 2009
(in millions)Total other-than-temporary impairments on fixed maturities for which an amount related to
noncredit losses was recognized in OCI . . . . . . . . . . . . . . . . . . . . . . . . . . . . . . . . . . . . . $(180.6) $(448.7)Noncredit loss recognized in OCI . . . . . . . . . . . . . . . . . . . . . . . . . . . . . . . . . . . . . . . . . . 56.1 260.9
Credit loss impairment recognized in net realized capital losses (1) . . . . . . . . . . . . . . . . . . . . . $(124.5) $(187.8)
(1) Includes additions to bifurcated credit losses recognized in net realized capital gains (losses) during the period for fixed maturities forwhich an other-than-temporary impairment was not previously recognized and additional credit losses for previously recognizedother-than-temporary impairments of $222.1 million and $221.2 million for the years ended December 31, 2010 and 2009, respectively.These losses were offset by reductions for previously recognized bifurcated credit losses on fixed maturities now sold or intended to be soldand fixed maturities reclassified from available-for-sale to trading due to the adoption of new accounting guidance, which did not impactnet income for the period, of $97.6 million and $33.4 million for the years ended December 31, 2010 and 2009, respectively. See the creditloss rollforward table below for further details on bifurcated credit losses.
Non-bifurcated other-than-temporary impairment losses, net of recoveries from the sale of previously impaired available-for-salesecurities, for fixed maturities recognized in net realized capital gains (losses) during the period were $21.8 million and $211.5 million forthe years ended December 31, 2010 and 2009, respectively.
The following table provides a rollforward of accumulated credit losses for fixed maturities with bifurcated creditlosses. The purpose of the table is to provide detail of (1) additions to the bifurcated credit loss amounts recognized innet realized capital gains (losses) during the period and (2) decrements for previously recognized bifurcated credit losseswhere the loss is no longer bifurcated and/or there has been a positive change in expected cash flows or accretion of thebifurcated credit loss amount.
For the year ended December 31,
2010 2009
(in millions)Beginning balance . . . . . . . . . . . . . . . . . . . . . . . . . . . . . . . . . . . . . . . . . . . . . . . . . . . . $(204.7) $ (18.5)Credit losses for which an other-than-temporary impairment was not previously recognized . . . . . . (112.4) (168.5)Credit losses for which an other-than-temporary impairment was previously recognized . . . . . . . . . (109.7) (52.7)Reduction for credit losses previously recognized on fixed maturities now sold or intended to be
sold . . . . . . . . . . . . . . . . . . . . . . . . . . . . . . . . . . . . . . . . . . . . . . . . . . . . . . . . . . . . 53.2 33.4Reduction for credit losses previously recognized on fixed maturities reclassified to trading (1) . . . . 44.4 —Reduction for positive changes in cash flows expected to be collected and amortization (2) . . . . . . 3.5 1.6
Ending balance . . . . . . . . . . . . . . . . . . . . . . . . . . . . . . . . . . . . . . . . . . . . . . . . . . . . . . $(325.7) $(204.7)
(1) Fixed maturities previously classified as available-for-sale have been reclassified to trading as a result of electing the fair value option uponadoption of accounting guidance related to the evaluation of credit derivatives embedded in beneficial interests in securitized financialassets.
(2) Amounts are recognized in net investment income.
108

Principal Financial Group, Inc.
Notes to Consolidated Financial Statements — (continued)
4. Investments — (continued)
Gross Unrealized Losses for Fixed Maturities and Equity Securities
For fixed maturities and equity securities available-for-sale with unrealized losses, including other-than-temporaryimpairment losses reported in OCI, the gross unrealized losses and fair value, aggregated by investment category andlength of time that individual securities have been in a continuous unrealized loss position are summarized as follows:
December 31, 2010
Less than Greater than ortwelve months equal to twelve months Total
Gross Gross GrossCarrying unrealized Carrying unrealized Carrying unrealized
value losses value losses value losses
(in millions)Fixed maturities, available-for-sale:
U.S. government and agencies . . . . . . . . . . . . . . . . $ 224.5 $ 0.2 $ — $ — $ 224.5 $ 0.2Non-U.S. governments . . . . . . . . . . . . . . . . . . . . . 7.9 — — — 7.9 —States and political subdivisions . . . . . . . . . . . . . . . 771.0 18.4 44.2 4.9 815.2 23.3Corporate . . . . . . . . . . . . . . . . . . . . . . . . . . . . . 2,457.4 69.1 3,948.9 475.9 6,406.3 545.0Residential mortgage-backed securities . . . . . . . . . . . 384.9 5.9 — — 384.9 5.9Commercial mortgage-backed securities . . . . . . . . . . 340.1 4.9 1,186.4 695.8 1,526.5 700.7Collateralized debt obligations . . . . . . . . . . . . . . . . 10.4 0.5 233.0 88.7 243.4 89.2Other debt obligations . . . . . . . . . . . . . . . . . . . . . 401.5 8.4 578.4 116.1 979.9 124.5
Total fixed maturities, available-for-sale . . . . . . . . . . . . $4,597.7 $107.4 $5,990.9 $1,381.4 $10,588.6 $1,488.8
Total equity securities, available-for-sale . . . . . . . . . . . . $ 47.3 $ 7.2 $ 77.0 $ 11.0 $ 124.3 $ 18.2
Of the total amounts, Principal Life’s consolidated portfolio represented $9,914.2 million in available-for-sale fixedmaturities with gross unrealized losses of $1,445.3 million. Principal Life’s consolidated portfolio consists of fixedmaturities where 77% were investment grade (rated AAA through BBB-) with an average price of 87 (carrying value/amortized cost) at December 31, 2010. Gross unrealized losses in our fixed maturities portfolio decreased during the yearended December 31, 2010, due to a decline in interest rates and a tightening of credit spreads primarily in the corporateand commercial mortgage-backed securities sectors.
For those securities that had been in a loss position for less than twelve months, Principal Life’s consolidatedportfolio held 534 securities with a carrying value of $4,112.3 million and unrealized losses of $95.7 million reflecting anaverage price of 98 at December 31, 2010. Of this portfolio, 94% was investment grade (rated AAA through BBB-) atDecember 31, 2010, with associated unrealized losses of $88.7 million. The losses on these securities can primarily beattributed to changes in market interest rates and changes in credit spreads since the securities were acquired.
For those securities that had been in a continuous loss position greater than or equal to twelve months, PrincipalLife’s consolidated portfolio held 773 securities with a carrying value of $5,801.9 million and unrealized losses of$1,349.6 million. The average rating of this portfolio was BBB with an average price of 81 at December 31, 2010. Of the$1,349.6 million in unrealized losses, the commercial mortgage-backed securities sector accounts for $695.8 million inunrealized losses with an average price of 63 and an average credit rating of BBB. The remaining unrealized lossesconsist primarily of $444.1 million within the corporate sector at December 31, 2010. The average price of the corporatesector was 89 and the average credit rating was BBB. The losses on these securities can primarily be attributed to changesin market interest rates and changes in credit spreads since the securities were acquired.
Because it was not our intent to sell the fixed maturity available-for-sale securities with unrealized losses and it wasnot more likely than not that we would be required to sell these securities before recovery of the amortized cost, whichmay be maturity, we did not consider these investments to be other-than-temporarily impaired at December 31, 2010.
109

Principal Financial Group, Inc.
Notes to Consolidated Financial Statements — (continued)
4. Investments — (continued)
December 31, 2009
Greater than orLess than twelve equal to twelve
months months Total
Gross Gross GrossCarrying unrealized Carrying unrealized Carrying unrealized
value losses value losses value losses
(in millions)Fixed maturities, available-for-sale:
U.S. government and agencies . . . . . . . . . . . . . . . . . . $ 32.7 $ 0.4 $ 1.0 $ 0.1 $ 33.7 $ 0.5Non-U.S. governments . . . . . . . . . . . . . . . . . . . . . . . 24.6 0.5 36.6 0.9 61.2 1.4States and political subdivisions . . . . . . . . . . . . . . . . . . 242.8 1.9 247.9 11.6 490.7 13.5Corporate . . . . . . . . . . . . . . . . . . . . . . . . . . . . . . . 2,595.9 69.2 7,958.2 1,063.8 10,554.1 1,133.0Residential mortgage-backed securities . . . . . . . . . . . . . 491.9 3.7 0.6 0.1 492.5 3.8Commercial mortgage-backed securities . . . . . . . . . . . . 468.1 16.7 2,217.3 1,302.5 2,685.4 1,319.2Collateralized debt obligations . . . . . . . . . . . . . . . . . . — — 366.1 239.7 366.1 239.7Other debt obligations . . . . . . . . . . . . . . . . . . . . . . . 335.4 23.4 902.3 280.1 1,237.7 303.5
Total fixed maturities, available-for-sale . . . . . . . . . . . . . . $4,191.4 $115.8 $11,730.0 $2,898.8 $15,921.4 $3,014.6
Total equity securities, available-for-sale . . . . . . . . . . . . . . $ 4.4 $ 0.1 $ 116.1 $ 34.2 $ 120.5 $ 34.3
Of the total amounts, Principal Life’s consolidated portfolio represented $14,979.2 million in available-for-sale fixedmaturities with unrealized losses of $2,928.9 million. Principal Life’s consolidated portfolio consists of fixed maturitieswhere 83% were investment grade (rated AAA through BBB-) with an average price of 84 (carrying value/amortizedcost) at December 31, 2009. Due to the credit disruption that began in the last half of 2007 and continued into firstquarter of 2009, which reduced liquidity and led to wider credit spreads, we saw an increase in unrealized losses in oursecurities portfolio. The unrealized losses were more pronounced in the Corporate sector and in structured products,such as commercial mortgage-backed securities, collateralized debt obligations and asset-backed securities (included inother debt obligations). During the second quarter of 2009 and continuing through the end of the year, a narrowing ofcredit spreads and improvement in liquidity resulted in a decrease in the unrealized losses in our securities portfoliorelative to year-end 2008.
For those securities that had been in a loss position for less than twelve months, Principal Life’s consolidatedportfolio held 406 securities with a carrying value of $3,739.3 million and unrealized losses of $100.5 million reflecting anaverage price of 97 at December 31, 2009. Of this portfolio, 97% was investment grade (rated AAA through BBB-) atDecember 31, 2009, with associated unrealized losses of $82.7 million. The losses on these securities can primarily beattributed to changes in market interest rates and changes in credit spreads since the securities were acquired.
For those securities that had been in a continuous loss position greater than or equal to twelve months, PrincipalLife’s consolidated portfolio held 1,481 securities with a carrying value of $11,239.9 million and unrealized losses of$2,828.4 million. The average rating of this portfolio was BBB+ with an average price of 80 at December 31, 2009. Of the$2,828.4 million in unrealized losses, the commercial mortgage-backed securities sector accounts for $1,302.5 million inunrealized losses with an average price of 63 and an average credit rating of AA-. The remaining unrealized losses consistprimarily of $993.5 million within the Corporate sector at December 31, 2009. The average price of the Corporate sectorwas 88 and the average credit rating was BBB. The losses on these securities can primarily be attributed to changes inmarket interest rates and changes in credit spreads since the securities were acquired.
Because it was not our intent to sell the fixed maturity available-for-sale securities with unrealized losses and it wasnot more likely than not that we would be required to sell these securities before recovery of the amortized cost, whichmay be maturity, we did not consider these investments to be other-than-temporarily impaired at December 31, 2009.
Net Unrealized Gains and Losses on Available-for-Sale Securities and Derivative Instruments
The net unrealized gains and losses on investments in fixed maturities available-for-sale, equity securitiesavailable-for-sale and derivative instruments are reported as a separate component of stockholders’ equity. Thecumulative amount of net unrealized gains and losses on available-for-sale securities and derivative instruments net of
110

Principal Financial Group, Inc.
Notes to Consolidated Financial Statements — (continued)
4. Investments — (continued)
adjustments related to DPAC, sales inducements, unearned revenue reserves, changes in policyholder liabilities andapplicable income taxes was as follows:
December 31,
2010 2009
(in millions)Net unrealized gains (losses) on fixed maturities, available-for-sale (1) . . . . . . . . . . . . . . . . . . . . . . . . $1,197.7 $(1,117.4)Noncredit component of impairment losses on fixed maturities, available-for-sale . . . . . . . . . . . . . . . . . (334.5) (260.9)Net unrealized losses on equity securities, available-for-sale . . . . . . . . . . . . . . . . . . . . . . . . . . . . . . . (10.1) (17.1)Adjustments for assumed changes in amortization patterns . . . . . . . . . . . . . . . . . . . . . . . . . . . . . . . (273.8) 211.9Adjustments for assumed changes in policyholder liabilities . . . . . . . . . . . . . . . . . . . . . . . . . . . . . . . (212.4) (75.7)Net unrealized gains on derivative instruments . . . . . . . . . . . . . . . . . . . . . . . . . . . . . . . . . . . . . . . 53.5 16.8Net unrealized gains on equity method subsidiaries and noncontrolling interest adjustments . . . . . . . . . . 145.2 214.1Provision for deferred income tax benefits (taxes) . . . . . . . . . . . . . . . . . . . . . . . . . . . . . . . . . . . . . (169.0) 397.7Effects of implementation of accounting change related to variable interest entities, net . . . . . . . . . . . . . 10.7 —Effects of electing fair value option for fixed maturities upon implementation of accounting changes
related to embedded credit derivatives, net . . . . . . . . . . . . . . . . . . . . . . . . . . . . . . . . . . . . . . . . 25.4 —Effects of reclassifying noncredit component of previously recognized impairment losses on fixed
maturities, available-for-sale, net . . . . . . . . . . . . . . . . . . . . . . . . . . . . . . . . . . . . . . . . . . . . . . — (9.9)
Net unrealized gains (losses) on available-for-sale securities and derivative instruments . . . . . . . . . . . . . . . $ 432.7 $ (640.5)
(1) Excludes net unrealized gains (losses) on fixed maturities, available-for-sale included in fair value hedging relationships.
Mortgage Loans
Mortgage loans consist of commercial and residential mortgage loans. We evaluate risks inherent in our commercialmortgage loans in two classes: (1) brick and mortar property loans, where we analyze the property’s rent payments assupport for the loan, and (2) credit tenant loans (‘‘CTL’’), where we rely on the credit analysis of the tenant for therepayment of the loan. We evaluate risks inherent in our residential mortgage loan portfolio in two classes: (1) homeequity mortgages and (2) first lien mortgages. The carrying amount of our mortgage loan portfolio was as follows:
December 31,
2010 2009
(in millions)Commercial mortgage loans . . . . . . . . . . . . . . . . . . . . . . . . . . . . . . . . . . . . . . . . . . . . . . . . . . $ 9,689.6 $10,261.8Residential mortgage loans . . . . . . . . . . . . . . . . . . . . . . . . . . . . . . . . . . . . . . . . . . . . . . . . . . 1,556.6 1,746.4
Total amortized cost . . . . . . . . . . . . . . . . . . . . . . . . . . . . . . . . . . . . . . . . . . . . . . . . . . . . . 11,246.2 12,008.2Valuation allowance . . . . . . . . . . . . . . . . . . . . . . . . . . . . . . . . . . . . . . . . . . . . . . . . . . . . . . . (121.1) (162.6)
Total carrying value . . . . . . . . . . . . . . . . . . . . . . . . . . . . . . . . . . . . . . . . . . . . . . . . . . . . . . . $11,125.1 $11,845.6
Our commercial mortgage loan portfolio consists primarily of non-recourse, fixed rate mortgages on fully or nearfully leased properties. Commercial mortgage loans represent a primary area of credit risk exposure.
111
Principal Financial Group, Inc.
Notes to Consolidated Financial Statements — (continued)
4. Investments — (continued)
Our commercial mortgage loan portfolio is diversified by geographic region and specific collateral property type asfollows:
December 31,
2010 2009
Amortized Percent Amortized Percentcost of total cost of total
($ in millions)Geographic distributionNew England . . . . . . . . . . . . . . . . . . . . . . . . . . . . . . . . . . . . . . . . . $ 430.3 4.5% $ 446.3 4.3%Middle Atlantic . . . . . . . . . . . . . . . . . . . . . . . . . . . . . . . . . . . . . . . . 1,648.4 17.0 1,535.4 15.0East North Central . . . . . . . . . . . . . . . . . . . . . . . . . . . . . . . . . . . . . . 841.1 8.7 941.8 9.2West North Central . . . . . . . . . . . . . . . . . . . . . . . . . . . . . . . . . . . . . 466.7 4.8 504.3 4.9South Atlantic . . . . . . . . . . . . . . . . . . . . . . . . . . . . . . . . . . . . . . . . . 2,358.1 24.3 2,641.8 25.8East South Central . . . . . . . . . . . . . . . . . . . . . . . . . . . . . . . . . . . . . . 231.5 2.4 300.0 2.9West South Central . . . . . . . . . . . . . . . . . . . . . . . . . . . . . . . . . . . . . 548.6 5.7 672.1 6.5Mountain . . . . . . . . . . . . . . . . . . . . . . . . . . . . . . . . . . . . . . . . . . . . 691.0 7.1 835.4 8.1Pacific . . . . . . . . . . . . . . . . . . . . . . . . . . . . . . . . . . . . . . . . . . . . . . 2,464.5 25.4 2,377.2 23.2International . . . . . . . . . . . . . . . . . . . . . . . . . . . . . . . . . . . . . . . . . . 9.4 0.1 7.5 0.1
Total . . . . . . . . . . . . . . . . . . . . . . . . . . . . . . . . . . . . . . . . . . . . . . . $9,689.6 100.0% $10,261.8 100.0%
Property type distributionOffice . . . . . . . . . . . . . . . . . . . . . . . . . . . . . . . . . . . . . . . . . . . . . . $2,886.2 29.8% $ 2,782.1 27.1%Retail . . . . . . . . . . . . . . . . . . . . . . . . . . . . . . . . . . . . . . . . . . . . . . 2,503.0 25.8 2,782.0 27.1Industrial . . . . . . . . . . . . . . . . . . . . . . . . . . . . . . . . . . . . . . . . . . . . 2,334.5 24.1 2,394.3 23.4Apartments . . . . . . . . . . . . . . . . . . . . . . . . . . . . . . . . . . . . . . . . . . 1,138.1 11.7 1,415.2 13.8Hotel . . . . . . . . . . . . . . . . . . . . . . . . . . . . . . . . . . . . . . . . . . . . . . 471.8 4.9 497.2 4.8Mixed use/other . . . . . . . . . . . . . . . . . . . . . . . . . . . . . . . . . . . . . . . . 356.0 3.7 391.0 3.8
Total . . . . . . . . . . . . . . . . . . . . . . . . . . . . . . . . . . . . . . . . . . . . . . . $9,689.6 100.0% $10,261.8 100.0%
Our residential mortgage loan portfolio is composed of home equity mortgages with an amortized cost of$719.3 million and $912.2 million and first lien mortgages with an amortized cost of $837.3 million and $834.2 million asof December 31, 2010 and 2009, respectively. Most of our residential home equity mortgages are concentrated in theUnited States and are generally second lien mortgages comprised of closed-end loans and lines of credit. The majority ofour first lien loans are concentrated in the Chilean market.
Mortgage Loan Credit Monitoring
Commercial Credit Risk Profile Based on Internal Rating
We actively monitor and manage our commercial mortgage loan portfolio. All commercial mortgage loans areanalyzed regularly and substantially all are internally rated, based on a proprietary risk rating cash flow model, in order tomonitor the financial quality of these assets. The model stresses expected cash flows at various levels and at differentpoints in time depending on the durability of the income stream, which includes our assessment of factors such aslocation (macro and micro markets), tenant quality and lease expirations. Our internal rating analysis results in expectedcredit losses comparable to equivalent bond ratings. Internal ratings on commercial mortgage loans are updated at leastannually and potentially more often for certain loans with material changes in collateral value or occupancy and for loanson an internal ‘‘watch list’’.
Commercial mortgage loans that require more frequent and detailed attention than other loans in our portfolio areidentified and placed on an internal ‘‘watch list’’. Among the criteria that would indicate a potential problem areimbalances in ratios of loan to value or contract rents to debt service, major tenant vacancies or bankruptcies, borrowersponsorship problems, late payments, delinquent taxes and loan relief/restructuring requests.
112

Principal Financial Group, Inc.
Notes to Consolidated Financial Statements — (continued)
4. Investments — (continued)
Our commercial mortgage loan portfolio by credit risk, as determined by our internal rating system expressed interms of an S&P bond equivalent rating, was as follows:
December 31, 2010
Brick and mortar CTL Total
(in millions)A- and above . . . . . . . . . . . . . . . . . . . . . . . . . . . . . . . . . . . . . . . . . . . . . . . . . . . . . . $4,781.8 $324.7 $5,106.5BBB+ thru BBB- . . . . . . . . . . . . . . . . . . . . . . . . . . . . . . . . . . . . . . . . . . . . . . . . . . . 2,636.1 249.5 2,885.6BB+ thru BB- . . . . . . . . . . . . . . . . . . . . . . . . . . . . . . . . . . . . . . . . . . . . . . . . . . . . . 726.1 38.5 764.6B+ and below . . . . . . . . . . . . . . . . . . . . . . . . . . . . . . . . . . . . . . . . . . . . . . . . . . . . . 929.0 3.9 932.9
Total . . . . . . . . . . . . . . . . . . . . . . . . . . . . . . . . . . . . . . . . . . . . . . . . . . . . . . . . . . . $9,073.0 $616.6 $9,689.6
Residential Credit Risk Profile Based on Performance Status
Our residential mortgage loan portfolio is monitored based on performance of the loans. Monitoring on a residentialmortgage loan increases when the loan is delinquent or earlier if there is an indication of impairment. We definenon-performing residential mortgage loans as loans 90 days or greater delinquent or on non-accrual status.
Our performing and non-performing residential mortgage loans were as follows:
December 31, 2010
Home equity First liens Total
(in millions)Performing . . . . . . . . . . . . . . . . . . . . . . . . . . . . . . . . . . . . . . . . . . . . . . . . . . . . . . . . $705.0 $811.6 $1,516.6Nonperforming . . . . . . . . . . . . . . . . . . . . . . . . . . . . . . . . . . . . . . . . . . . . . . . . . . . . . 14.3 25.7 40.0
Total . . . . . . . . . . . . . . . . . . . . . . . . . . . . . . . . . . . . . . . . . . . . . . . . . . . . . . . . . . . . $719.3 $837.3 $1,556.6
Non-Accrual Mortgage Loans
Commercial and residential mortgage loans are placed on non-accrual status if we have concern regarding thecollectability of future payments. Factors considered may include conversations with the borrower, loss of major tenant,bankruptcy of borrower or major tenant, decreased property cash flow for commercial mortgage loans or number of dayspast due for residential mortgage loans. Based on an assessment as to the collectability of the principal, a determinationis made to apply any payments received either against the principal or according to the contractual terms of the loan.Accrual of interest resumes after factors resulting in doubts about collectability have improved. Residential first lienmortgages in the Chilean market are carried on accrual for longer than domestic loans as assessment of collectability isbased on the nature of the loans and collection practices in that market.
Mortgage loans on non-accrual status were as follows:
December 31, 2010
(in millions)Commercial:
Brick and mortar . . . . . . . . . . . . . . . . . . . . . . . . . . . . . . . . . . . . . . . . . . . . . . . . . . . . . . . . . . . . . . . $67.1Residential:
Home equity . . . . . . . . . . . . . . . . . . . . . . . . . . . . . . . . . . . . . . . . . . . . . . . . . . . . . . . . . . . . . . . . . 14.3First liens . . . . . . . . . . . . . . . . . . . . . . . . . . . . . . . . . . . . . . . . . . . . . . . . . . . . . . . . . . . . . . . . . . . 15.7
Total . . . . . . . . . . . . . . . . . . . . . . . . . . . . . . . . . . . . . . . . . . . . . . . . . . . . . . . . . . . . . . . . . . . . . . . . $97.1
113

Principal Financial Group, Inc.
Notes to Consolidated Financial Statements — (continued)
4. Investments — (continued)
The aging of mortgage loans and mortgage loans that were 90 days or more past due and still accruing interest wereas follows:
December 31, 2010
Recordedinvestment
90 days or 90 days or30-59 days 60-89 days more past Total Total more andpast due past due due past due Current loans accruing
(in millions)Commercial-brick and mortar . . . . . . . . . . . . . . . . . . . $ — $22.5 $ 9.1 $ 31.6 $ 9,041.4 $ 9,073.0 $ —Commercial-CTL . . . . . . . . . . . . . . . . . . . . . . . . . . . — — — — 616.6 616.6 —Residential-home equity . . . . . . . . . . . . . . . . . . . . . . 9.3 4.5 9.2 23.0 696.3 719.3 —Residential-first liens . . . . . . . . . . . . . . . . . . . . . . . . 19.1 8.5 23.0 50.6 786.7 837.3 10.0
Total . . . . . . . . . . . . . . . . . . . . . . . . . . . . . . . . . . . $28.4 $35.5 $41.3 $105.2 $11,141.0 $11,246.2 $10.0
Mortgage Loan Valuation Allowance
We establish a valuation allowance to provide for the risk of credit losses inherent in our portfolio. The valuationallowance includes loan specific reserves for loans that are deemed to be impaired as well as reserves for pools of loanswith similar risk characteristics where a property risk or market specific risk has not been identified but for which weexpect to incur a loss. Mortgage loans on real estate are considered impaired when, based on current information andevents, it is probable that we will be unable to collect all amounts due according to contractual terms of the loanagreement. When we determine that a loan is impaired, a valuation allowance is established equal to the differencebetween the carrying amount of the mortgage loan and the estimated value reduced by the cost to sell. Estimated value isbased on either the present value of the expected future cash flows discounted at the loan’s effective interest rate, theloan’s observable market price or fair value of the collateral. Amounts on loans deemed to be uncollectible are chargedoff and removed from the valuation allowance. When a valuation allowance is established, subsequent recoveries areremoved from the valuation allowance and subsequent losses are added to the valuation allowance. The change in thevaluation allowance is included in net realized capital gains (losses) on our consolidated statements of operations.
The valuation allowance is maintained at a level believed adequate by management to absorb estimated probablecredit losses. Management’s periodic evaluation and assessment of the valuation allowance adequacy is based on knownand inherent risks in the portfolio, adverse situations that may affect a borrower’s ability to repay, the estimated value ofthe underlying collateral, composition of the loan portfolio, portfolio delinquency information, underwriting standards,peer group information, current economic conditions, loss experience and other relevant factors. The evaluation of ourimpaired loan component is subjective, as it requires the estimation of timing and amount of future cash flows expectedto be received on impaired loans.
We review our commercial mortgage loan portfolio and analyze the need for a valuation allowance for any loan thatis delinquent for 60 days or more, in process of foreclosure, restructured, on the internal ‘‘watch list’’ or that currently hasa valuation allowance. In addition to establishing allowance levels for specifically identified impaired commercialmortgage loans, management determines an allowance for all other loans in the portfolio for which historical experienceand current economic conditions indicate certain losses exist. These loans are segregated by major product type and/orrisk level with an estimated loss ratio applied against each product type and/or risk level. The loss ratio is generally basedupon historic loss experience for each loan type as adjusted for certain environmental factors management believes to berelevant.
For our residential mortgage loan portfolio, we separate the loans into several homogeneous pools, each of whichconsist of loans of a similar nature including but not limited to loans similar in collateral, term and structure and loanpurpose or type. We evaluate loan pools based on aggregated risk ratings, estimated specific loss potential in the differentclasses of credits, and historical loss experience by pool type. We adjust these quantitative factors for qualitative factors ofpresent conditions. Qualitative factors include items such as economic and business conditions, changes in the portfolio,value of underlying collateral, and concentrations. Residential mortgage loan pools exclude loans that have beenrestructured or impaired, as those loans are evaluated individually.
114
Principal Financial Group, Inc.
Notes to Consolidated Financial Statements — (continued)
4. Investments — (continued)
A rollforward of our valuation allowance and ending balances of the allowance and loan balance by basis ofimpairment method was as follows:
Commercial Residential Total
(in millions)December 31, 2010Beginning balance . . . . . . . . . . . . . . . . . . . . . . . . . . . . . . . . . . . . . . . . . . . . . . . . . . . $ 132.5 $ 30.1 $ 162.6
Provision . . . . . . . . . . . . . . . . . . . . . . . . . . . . . . . . . . . . . . . . . . . . . . . . . . . . . . . 54.1 98.8 152.9Charge-offs . . . . . . . . . . . . . . . . . . . . . . . . . . . . . . . . . . . . . . . . . . . . . . . . . . . . . (106.0) (89.7) (195.7)Recoveries . . . . . . . . . . . . . . . . . . . . . . . . . . . . . . . . . . . . . . . . . . . . . . . . . . . . . . — 1.1 1.1Effect of exchange rates . . . . . . . . . . . . . . . . . . . . . . . . . . . . . . . . . . . . . . . . . . . . . — 0.2 0.2
Ending balance . . . . . . . . . . . . . . . . . . . . . . . . . . . . . . . . . . . . . . . . . . . . . . . . . . . . $ 80.6 $ 40.5 $ 121.1
Allowance ending balance by basis of impairment method:Individually evaluated for impairment . . . . . . . . . . . . . . . . . . . . . . . . . . . . . . . . . . . . . $ 9.1 $ 5.3 $ 14.4Collectively evaluated for impairment . . . . . . . . . . . . . . . . . . . . . . . . . . . . . . . . . . . . . 71.5 35.2 106.7
Allowance ending balance . . . . . . . . . . . . . . . . . . . . . . . . . . . . . . . . . . . . . . . . . . . . . . $ 80.6 $ 40.5 $ 121.1
Loan balance by basis of impairment method:Individually evaluated for impairment . . . . . . . . . . . . . . . . . . . . . . . . . . . . . . . . . . . . . $ 29.8 $ 21.5 $ 51.3Collectively evaluated for impairment . . . . . . . . . . . . . . . . . . . . . . . . . . . . . . . . . . . . . 9,659.8 1,535.1 11,194.9
Loan ending balance . . . . . . . . . . . . . . . . . . . . . . . . . . . . . . . . . . . . . . . . . . . . . . . . . $9,689.6 $1,556.6 $11,246.2
December 31, 2009Beginning balance . . . . . . . . . . . . . . . . . . . . . . . . . . . . . . . . . . . . . . . . . . . . . . . . . . . $ 57.0 $ 12.9 $ 69.9
Provision . . . . . . . . . . . . . . . . . . . . . . . . . . . . . . . . . . . . . . . . . . . . . . . . . . . . . . . 115.4 33.1 148.5Charge-offs/recoveries . . . . . . . . . . . . . . . . . . . . . . . . . . . . . . . . . . . . . . . . . . . . . . . (39.9) (16.1) (56.0)Effect of exchange rates . . . . . . . . . . . . . . . . . . . . . . . . . . . . . . . . . . . . . . . . . . . . . — 0.2 0.2
Ending balance . . . . . . . . . . . . . . . . . . . . . . . . . . . . . . . . . . . . . . . . . . . . . . . . . . . . $ 132.5 $ 30.1 $ 162.6
December 31, 2008Beginning balance . . . . . . . . . . . . . . . . . . . . . . . . . . . . . . . . . . . . . . . . . . . . . . . . . . . $ 42.8 $ 6.6 $ 49.4
Provision . . . . . . . . . . . . . . . . . . . . . . . . . . . . . . . . . . . . . . . . . . . . . . . . . . . . . . . 42.2 11.7 53.9Charge-offs/recoveries . . . . . . . . . . . . . . . . . . . . . . . . . . . . . . . . . . . . . . . . . . . . . . . (28.0) (5.2) (33.2)Effect of exchange rates . . . . . . . . . . . . . . . . . . . . . . . . . . . . . . . . . . . . . . . . . . . . . — (0.2) (0.2)
Ending balance . . . . . . . . . . . . . . . . . . . . . . . . . . . . . . . . . . . . . . . . . . . . . . . . . . . . $ 57.0 $ 12.9 $ 69.9
We periodically purchase mortgage loans as well as sell mortgage loans we have originated. We purchased$39.8 million of residential mortgage loans during the year ended December 31, 2010. We sold $34.1 million ofcommercial mortgage loans and $17.4 million of residential mortgage loans as of December 31, 2010.
Impaired Mortgage Loans
Impaired mortgage loans include loans with a related specific valuation allowance, loans whose carrying amount hasbeen reduced to the expected collectible amount because the impairment has been considered other than temporary ortroubled debt restructurings. Based on an assessment as to the collectability of the principal, a determination is made toapply any payments received either against the principal or according to the contractual terms of the loan. Our recordedinvestment in and unpaid principal balance of impaired loans along with the related loan specific allowance for losses, if
115
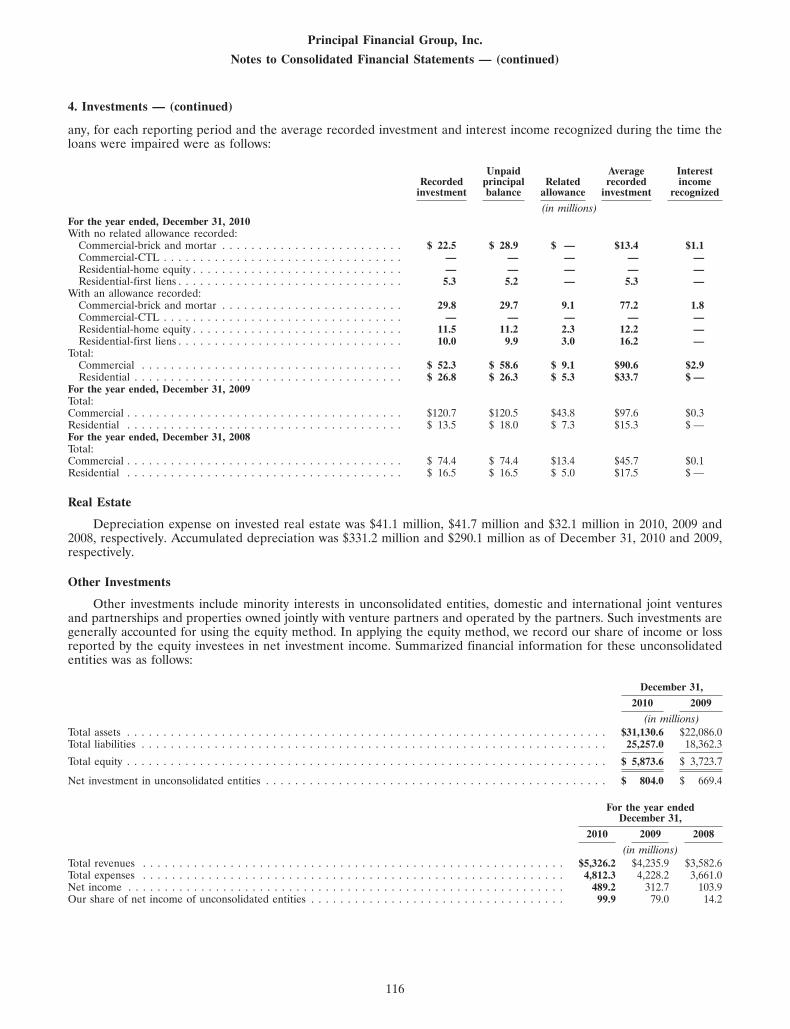
Principal Financial Group, Inc.
Notes to Consolidated Financial Statements — (continued)
4. Investments — (continued)
any, for each reporting period and the average recorded investment and interest income recognized during the time theloans were impaired were as follows:
Unpaid Average InterestRecorded principal Related recorded income
investment balance allowance investment recognized
(in millions)For the year ended, December 31, 2010With no related allowance recorded:
Commercial-brick and mortar . . . . . . . . . . . . . . . . . . . . . . . . . $ 22.5 $ 28.9 $ — $13.4 $1.1Commercial-CTL . . . . . . . . . . . . . . . . . . . . . . . . . . . . . . . . . — — — — —Residential-home equity . . . . . . . . . . . . . . . . . . . . . . . . . . . . . — — — — —Residential-first liens . . . . . . . . . . . . . . . . . . . . . . . . . . . . . . . 5.3 5.2 — 5.3 —
With an allowance recorded:Commercial-brick and mortar . . . . . . . . . . . . . . . . . . . . . . . . . 29.8 29.7 9.1 77.2 1.8Commercial-CTL . . . . . . . . . . . . . . . . . . . . . . . . . . . . . . . . . — — — — —Residential-home equity . . . . . . . . . . . . . . . . . . . . . . . . . . . . . 11.5 11.2 2.3 12.2 —Residential-first liens . . . . . . . . . . . . . . . . . . . . . . . . . . . . . . . 10.0 9.9 3.0 16.2 —
Total:Commercial . . . . . . . . . . . . . . . . . . . . . . . . . . . . . . . . . . . . $ 52.3 $ 58.6 $ 9.1 $90.6 $2.9Residential . . . . . . . . . . . . . . . . . . . . . . . . . . . . . . . . . . . . . $ 26.8 $ 26.3 $ 5.3 $33.7 $ —
For the year ended, December 31, 2009Total:Commercial . . . . . . . . . . . . . . . . . . . . . . . . . . . . . . . . . . . . . . $120.7 $120.5 $43.8 $97.6 $0.3Residential . . . . . . . . . . . . . . . . . . . . . . . . . . . . . . . . . . . . . . $ 13.5 $ 18.0 $ 7.3 $15.3 $ —For the year ended, December 31, 2008Total:Commercial . . . . . . . . . . . . . . . . . . . . . . . . . . . . . . . . . . . . . . $ 74.4 $ 74.4 $13.4 $45.7 $0.1Residential . . . . . . . . . . . . . . . . . . . . . . . . . . . . . . . . . . . . . . $ 16.5 $ 16.5 $ 5.0 $17.5 $ —
Real Estate
Depreciation expense on invested real estate was $41.1 million, $41.7 million and $32.1 million in 2010, 2009 and2008, respectively. Accumulated depreciation was $331.2 million and $290.1 million as of December 31, 2010 and 2009,respectively.
Other Investments
Other investments include minority interests in unconsolidated entities, domestic and international joint venturesand partnerships and properties owned jointly with venture partners and operated by the partners. Such investments aregenerally accounted for using the equity method. In applying the equity method, we record our share of income or lossreported by the equity investees in net investment income. Summarized financial information for these unconsolidatedentities was as follows:
December 31,
2010 2009
(in millions)Total assets . . . . . . . . . . . . . . . . . . . . . . . . . . . . . . . . . . . . . . . . . . . . . . . . . . . . . . . . . . . . . . . . . . $31,130.6 $22,086.0Total liabilities . . . . . . . . . . . . . . . . . . . . . . . . . . . . . . . . . . . . . . . . . . . . . . . . . . . . . . . . . . . . . . . . 25,257.0 18,362.3
Total equity . . . . . . . . . . . . . . . . . . . . . . . . . . . . . . . . . . . . . . . . . . . . . . . . . . . . . . . . . . . . . . . . . . $ 5,873.6 $ 3,723.7
Net investment in unconsolidated entities . . . . . . . . . . . . . . . . . . . . . . . . . . . . . . . . . . . . . . . . . . . . . . . $ 804.0 $ 669.4
For the year endedDecember 31,
2010 2009 2008
(in millions)Total revenues . . . . . . . . . . . . . . . . . . . . . . . . . . . . . . . . . . . . . . . . . . . . . . . . . . . . . . . . . . $5,326.2 $4,235.9 $3,582.6Total expenses . . . . . . . . . . . . . . . . . . . . . . . . . . . . . . . . . . . . . . . . . . . . . . . . . . . . . . . . . . 4,812.3 4,228.2 3,661.0Net income . . . . . . . . . . . . . . . . . . . . . . . . . . . . . . . . . . . . . . . . . . . . . . . . . . . . . . . . . . . . 489.2 312.7 103.9Our share of net income of unconsolidated entities . . . . . . . . . . . . . . . . . . . . . . . . . . . . . . . . . . . 99.9 79.0 14.2
116

Principal Financial Group, Inc.
Notes to Consolidated Financial Statements — (continued)
4. Investments — (continued)
In addition, other investments include $443.1 million and $375.2 million of direct financing leases as ofDecember 31, 2010 and 2009, respectively. Our Chilean operations enter into private placement contracts forcommercial, industrial and office space properties whereby our Chilean operations purchase the real estate and/orbuilding from the seller-lessee but then lease the property back to the seller-lessee. Ownership of the property istransferred to the lessee by the end of the lease term. The direct financing lease receivables are carried at amortized cost.We actively monitor and manage our direct financing leases. All leases within the portfolio are analyzed regularly andinternally rated, based on financial condition, payment history and loan-to-value.
Derivative assets are carried at fair value and reported as a component of other investments. Certain seed moneyinvestments are also carried at fair value and reported as a component of other investments, with changes in fair valueincluded in net realized capital gains (losses) on our consolidated statements of operations.
Securities Posted as Collateral
We posted $1,052.5 million in fixed maturities, available-for-sale securities at December 31, 2010, to satisfy collateralrequirements primarily associated with our derivative credit support annex (collateral) agreements and a reinsurancearrangement. In addition, we posted $1,695.1 million in commercial mortgage loans as of December 31, 2010, to satisfycollateral requirements associated with our obligation under funding agreements with the Federal Home Loan Bank ofDes Moines. Since we did not relinquish ownership rights on these securities, they are reported as fixed maturities,available-for-sale and commercial mortgage loans, respectively, on our consolidated statements of financial position.
5. Derivative Financial Instruments
Derivatives are generally used to hedge or reduce exposure to market risks associated with assets held or expected tobe purchased or sold and liabilities incurred or expected to be incurred. Derivatives are used to change the characteristicsof our asset/liability mix consistent with our risk management activities. Derivatives are also used in asset replicationstrategies.
Types of Derivative Instruments
Interest Rate Contracts
Interest rate risk is the risk that we will incur economic losses due to adverse changes in interest rates. Sources ofinterest rate risk include the difference between the maturity and interest rate changes of assets with the liabilities theysupport, timing differences between the pricing of liabilities and the purchase or procurement of assets and changing cashflow profiles from original projections due to prepayment options embedded within asset and liability contracts. We usevarious derivatives to manage our exposure to fluctuations in interest rates.
Interest rate swaps are contracts in which we agree with other parties to exchange, at specified intervals, thedifference between fixed rate and floating rate interest amounts based upon designated market rates or rate indices andan agreed upon notional principal amount. Generally, no cash is exchanged at the outset of the contract and no principalpayments are made by either party. Cash is paid or received based on the terms of the swap. These transactions areentered into pursuant to master agreements that provide for a single net payment to be made by one counterparty at eachdue date. We use interest rate swaps primarily to more closely match the interest rate characteristics of assets andliabilities and to mitigate the risks arising from timing mismatches between assets and liabilities (including durationmismatches). We also use interest rate swaps to hedge against changes in the value of assets we anticipate acquiring andother anticipated transactions and commitments. Interest rate swaps are used to hedge against changes in the value of theguaranteed minimum withdrawal benefit (‘‘GMWB’’) liability. The GMWB rider on our variable annuity productsprovides for guaranteed minimum withdrawal benefits regardless of the actual performance of various equity and/or fixedincome funds available with the product.
Interest rate caps and interest rate floors, which can be combined to form interest rate collars, are contracts thatentitle the purchaser to pay or receive the amounts, if any, by which a specified market rate exceeds a cap strike interestrate, or falls below a floor strike interest rate, respectively, at specified dates. We have entered into interest rate collarswhereby we receive amounts if a specified market rate falls below a floor strike interest rate, and we pay if a specifiedmarket rate exceeds a cap strike interest rate. We use interest rate collars to manage interest rate risk related toguaranteed minimum interest rate liabilities in our individual annuities contracts.
A swaption is an option to enter into an interest rate swap at a future date. We purchase swaptions to offset existingexposures. We have also written these options and received a premium in order to transform our callable liabilities intofixed term liabilities. Swaptions provide us the benefit of the agreed-upon strike rate if the market rates for liabilities are
117
Principal Financial Group, Inc.
Notes to Consolidated Financial Statements — (continued)
5. Derivative Financial Instruments — (continued)
higher, with the flexibility to enter into the current market rate swap if the market rates for liabilities are lower. Swaptionsnot only hedge against the downside risk, but also allow us to take advantage of any upside benefits.
In exchange-traded futures transactions, we agree to purchase or sell a specified number of contracts, the values ofwhich are determined by the values of designated classes of securities, and to post variation margin on a daily basis in anamount equal to the difference in the daily market values of those contracts. We enter into exchange-traded futures withregulated futures commissions merchants who are members of a trading exchange. We have used exchange-traded futuresto reduce market risks from changes in interest rates and to alter mismatches between the assets in a portfolio and theliabilities supported by those assets.
Foreign Exchange Contracts
Foreign currency risk is the risk that we will incur economic losses due to adverse fluctuations in foreign currencyexchange rates. This risk arises from foreign currency-denominated funding agreements we issue, foreign currency-denominated fixed maturities we invest in and our investment in and net income of our international operations. We mayuse currency swaps and currency forwards to hedge foreign currency risk.
Currency swaps are contracts in which we agree with other parties to exchange, at specified intervals, a series ofprincipal and interest payments in one currency for that of another currency. Generally, the principal amount of eachcurrency is exchanged at the beginning and termination of the currency swap by each party. The interest payments areprimarily fixed-to-fixed rate; however, they may also be fixed-to-floating rate or floating-to-fixed rate. These transactionsare entered into pursuant to master agreements that provide for a single net payment to be made by one counterparty forpayments made in the same currency at each due date. We use currency swaps to reduce market risks from changes incurrency exchange rates with respect to investments or liabilities denominated in foreign currencies that we either hold orintend to acquire or sell.
Currency forwards are contracts in which we agree with other parties to deliver a specified amount of an identifiedcurrency at a specified future date. Typically, the price is agreed upon at the time of the contract and payment for such acontract is made at the specified future date. We use currency forwards to reduce market risks from changes in currencyexchange rates with respect to investments or liabilities denominated in foreign currencies that we either hold or intendto acquire or sell. We have also used currency forwards to hedge the currency risk associated with net investments inforeign operations. We did not use any currency forwards during 2010 or 2009 to hedge our net investment in foreignoperations.
Equity Contracts
Equity risk is the risk that we will incur economic losses due to adverse fluctuations in common stock. We use variousderivatives to manage our exposure to equity risk, which arises from products in which the interest we credit is tied to anexternal equity index as well as products subject to minimum contractual guarantees.
We may sell an investment-type insurance contract with attributes tied to market indices (an embedded derivative asnoted below), in which case we write an equity call option to convert the overall contract into a fixed-rate liability,essentially eliminating the equity component altogether. We purchase equity call spreads to hedge the equityparticipation rates promised to contractholders in conjunction with our fixed deferred annuity products that creditinterest based on changes in an external equity index. We use exchange-traded futures and equity put options to hedgeagainst changes in the value of the GMWB liability related to the GMWB rider on our variable annuity product, aspreviously explained. The premium associated with certain options is paid quarterly over the life of the option contract.
Credit Contracts
Credit risk relates to the uncertainty associated with the continued ability of a given obligor to make timely paymentsof principal and interest. We use credit default swaps to enhance the return on our investment portfolio by providingcomparable exposure to fixed income securities that might not be available in the primary market. They are also used tohedge credit exposures in our investment portfolio. Credit derivatives are used to sell or buy credit protection on anidentified name or names on an unfunded or synthetic basis in return for receiving or paying a quarterly premium. Thepremium generally corresponds to a referenced name’s credit spread at the time the agreement is executed. In caseswhere we sell protection, at the same time we enter into these synthetic transactions, we buy a quality cash bond to matchagainst the credit default swap. When selling protection, if there is an event of default by the referenced name, as definedby the agreement, we are obligated to pay the counterparty the referenced amount of the contract and receive in returnthe referenced security in a principal amount equal to the notional value of the credit default swap.
118

Principal Financial Group, Inc.
Notes to Consolidated Financial Statements — (continued)
5. Derivative Financial Instruments — (continued)
Other Contracts
Commodity Swaps. Commodity swaps are used to sell or buy protection on commodity prices in return for receiving orpaying a quarterly premium. We have purchased secured limited recourse notes from VIEs that were consolidated in ourfinancial results prior to 2010, but for which we are no longer the primary beneficiary. These VIEs used a commodityswap to enhance the return on an investment portfolio by selling protection on a static portfolio of commodity triggerswaps, each referencing a base or precious metal. The portfolio of commodity trigger swaps was a portfolio of deepout-of-the-money European puts on various base or precious metals. The VIEs provided mezzanine protection that theaverage spot rate would not fall below a certain trigger price on each commodity trigger swap in the portfolio andreceived guaranteed quarterly premiums in return until maturity. At the same time the VIEs entered into this synthetictransaction, they bought a quality cash bond to match against the commodity swaps.
Embedded Derivatives. We purchase or issue certain financial instruments or products that contain a derivativeinstrument that is embedded in the financial instrument or product. When it is determined that the embedded derivativepossesses economic characteristics that are not clearly or closely related to the economic characteristics of the hostcontract and a separate instrument with the same terms would qualify as a derivative instrument, the embeddedderivative is bifurcated from the host instrument for measurement purposes. The embedded derivative, which is reportedwith the host instrument in the consolidated statements of financial position, is carried at fair value.
We sell investment-type insurance contracts in which the return is tied to an external equity index, a leveragedinflation index or leveraged reference swap. We economically hedge the risk associated with these investment-typeinsurance contracts.
We offer group benefit plan contracts that have guaranteed separate accounts as an investment option. We also offera guaranteed fund as an investment option in our defined contribution plans in Hong Kong.
We have structured investment relationships with trusts we have determined to be VIEs, which are consolidated inour financial statements. The notes issued by these trusts include obligations to deliver an underlying security to residualinterest holders and the obligations contain an embedded derivative of the forecasted transaction to deliver theunderlying security.
We have fixed deferred annuities that credit interest based on changes in an external equity index. We also havecertain variable annuity products with a GMWB rider, which provides that the contractholder will receive at least theirprincipal deposit back through withdrawals of up to a specified annual amount, even if the account value is reduced tozero. Declines in the equity market may increase our exposure to benefits under contracts with the GMWB. Weeconomically hedge the exposure in these annuity contracts, as previously explained.
Exposure
Our risk of loss is typically limited to the fair value of our derivative instruments and not to the notional orcontractual amounts of these derivatives. Risk arises from changes in the fair value of the underlying instruments. We arealso exposed to credit losses in the event of nonperformance of the counterparties. Our current credit exposure is limitedto the value of derivatives that have become favorable to us. This credit risk is minimized by purchasing such agreementsfrom financial institutions with high credit ratings and by establishing and monitoring exposure limits. We also utilizevarious credit enhancements, including collateral and credit triggers to reduce the credit exposure to our derivativeinstruments.
Our derivative transactions are generally documented under International Swaps and Derivatives Association, Inc.(‘‘ISDA’’) Master Agreements. Management believes that such agreements provide for legally enforceable set-off andclose-out netting of exposures to specific counterparties. Under such agreements, in connection with an early terminationof a transaction, we are permitted to set off our receivable from a counterparty against our payables to the samecounterparty arising out of all included transactions. For reporting purposes, we do not offset fair value amountsrecognized for the right to reclaim cash collateral or the obligation to return cash collateral against fair value amountsrecognized for derivative instruments executed with the same counterparties under master netting agreements.
We posted $376.8 million and $273.7 million in cash and securities under collateral arrangements as of December 31,2010 and 2009, respectively, to satisfy collateral requirements associated with our derivative credit support agreements.
Certain of our derivative instruments contain provisions that require us to maintain an investment grade rating fromeach of the major credit rating agencies on our debt. If the rating on our debt were to fall below investment grade, itwould be in violation of these provisions and the counterparties to the derivative instruments could request immediatepayment or demand immediate and ongoing full overnight collateralization on derivative instruments in net liabilitypositions. The aggregate fair value, inclusive of accrued interest, of all derivative instruments with credit-risk-related
119

Principal Financial Group, Inc.
Notes to Consolidated Financial Statements — (continued)
5. Derivative Financial Instruments — (continued)
contingent features that were in a liability position without regard to netting under derivative credit support annexagreements as of December 31, 2010 and 2009, was $1,262.0 million and $1,139.7 million, respectively. With respect tothese derivatives, we posted collateral of $376.8 million and $273.7 million as of December 31, 2010 and 2009,respectively, in the normal course of business, which reflects netting under derivative credit support annex agreements. Ifthe credit-risk-related contingent features underlying these agreements were triggered on December 31, 2010, we wouldbe required to post an additional $56.6 million of collateral to our counterparties.
As of December 31, 2010 and 2009, we had received $249.2 million and $353.4 million, respectively, of cash collateralassociated with our derivative credit support annex agreements. The cash collateral is included in other assets on theconsolidated statements of financial position, with a corresponding liability reflecting our obligation to return thecollateral recorded in other liabilities.
Notional amounts are used to express the extent of our involvement in derivative transactions and represent astandard measurement of the volume of our derivative activity. Notional amounts represent those amounts used tocalculate contractual flows to be exchanged and are not paid or received, except for contracts such as currency swaps.Credit exposure represents the gross amount owed to us under derivative contracts as of the valuation date. The notionalamounts and credit exposure of our derivative financial instruments by type were as follows:
December 31, 2010 December 31, 2009
(in millions)Notional amounts of derivative instrumentsInterest rate contracts:
Interest rate swaps . . . . . . . . . . . . . . . . . . . . . . . . . . . . . . . . . . . . . . . . . . . . . . . $19,803.0 $19,588.6Interest rate collars . . . . . . . . . . . . . . . . . . . . . . . . . . . . . . . . . . . . . . . . . . . . . . . 500.0 —Swaptions . . . . . . . . . . . . . . . . . . . . . . . . . . . . . . . . . . . . . . . . . . . . . . . . . . . . . 68.5 —Futures . . . . . . . . . . . . . . . . . . . . . . . . . . . . . . . . . . . . . . . . . . . . . . . . . . . . . . . 0.8 43.3
Foreign exchange contracts:Foreign currency swaps . . . . . . . . . . . . . . . . . . . . . . . . . . . . . . . . . . . . . . . . . . . . . 4,615.2 5,284.4Currency forwards . . . . . . . . . . . . . . . . . . . . . . . . . . . . . . . . . . . . . . . . . . . . . . . . 72.3 91.5
Equity contracts:Options . . . . . . . . . . . . . . . . . . . . . . . . . . . . . . . . . . . . . . . . . . . . . . . . . . . . . . 997.5 818.2Futures . . . . . . . . . . . . . . . . . . . . . . . . . . . . . . . . . . . . . . . . . . . . . . . . . . . . . . . — 84.6
Credit contracts:Credit default swaps . . . . . . . . . . . . . . . . . . . . . . . . . . . . . . . . . . . . . . . . . . . . . . 1,482.4 1,586.4
Other contracts:Embedded derivative financial instruments . . . . . . . . . . . . . . . . . . . . . . . . . . . . . . . . 3,991.6 3,344.5Commodity swaps . . . . . . . . . . . . . . . . . . . . . . . . . . . . . . . . . . . . . . . . . . . . . . . . — 40.0
Total notional amounts at end of period . . . . . . . . . . . . . . . . . . . . . . . . . . . . . . . . . . . $31,531.3 $30,881.5
Credit exposure of derivative instrumentsInterest rate contracts:
Interest rate swaps . . . . . . . . . . . . . . . . . . . . . . . . . . . . . . . . . . . . . . . . . . . . . . . $ 607.1 $ 579.1Interest rate collars . . . . . . . . . . . . . . . . . . . . . . . . . . . . . . . . . . . . . . . . . . . . . . . 1.7 —Swaptions . . . . . . . . . . . . . . . . . . . . . . . . . . . . . . . . . . . . . . . . . . . . . . . . . . . . . 0.1 —
Foreign exchange contracts:Foreign currency swaps . . . . . . . . . . . . . . . . . . . . . . . . . . . . . . . . . . . . . . . . . . . . . 493.2 594.4Currency forwards . . . . . . . . . . . . . . . . . . . . . . . . . . . . . . . . . . . . . . . . . . . . . . . . 3.3 3.8
Equity contracts:Options . . . . . . . . . . . . . . . . . . . . . . . . . . . . . . . . . . . . . . . . . . . . . . . . . . . . . . 64.9 149.8
Credit contracts:Credit default swaps . . . . . . . . . . . . . . . . . . . . . . . . . . . . . . . . . . . . . . . . . . . . . . 6.7 15.5
Total gross credit exposure . . . . . . . . . . . . . . . . . . . . . . . . . . . . . . . . . . . . . . . . . . . . 1,177.0 1,342.6Less: collateral received . . . . . . . . . . . . . . . . . . . . . . . . . . . . . . . . . . . . . . . . . . . . . . 249.2 395.6
Net credit exposure . . . . . . . . . . . . . . . . . . . . . . . . . . . . . . . . . . . . . . . . . . . . . . . . $ 927.8 $ 947.0
120

Principal Financial Group, Inc.
Notes to Consolidated Financial Statements — (continued)
5. Derivative Financial Instruments — (continued)
The fair value of our derivative instruments classified as assets and liabilities was as follows:
Derivative assets (1) Derivative liabilities (2)
December 31, 2010 December 31, 2009 December 31, 2010 December 31, 2009
(in millions)Derivatives designated as hedging instrumentsInterest rate contracts . . . . . . . . . . . . . . . . . . . $ 66.6 $ 81.5 $ 405.4 $ 309.1Foreign exchange contracts . . . . . . . . . . . . . . . 390.8 444.4 142.5 240.6
Total derivatives designated as hedging instruments $ 457.4 $ 525.9 $ 547.9 $ 549.7
Derivatives not designated as hedging instrumentsInterest rate contracts . . . . . . . . . . . . . . . . . . . $ 488.4 $ 433.5 $ 459.5 $ 336.8Foreign exchange contracts . . . . . . . . . . . . . . . 65.8 107.5 60.4 75.0Equity contracts . . . . . . . . . . . . . . . . . . . . . . 64.9 149.8 31.7 —Credit contracts . . . . . . . . . . . . . . . . . . . . . . 6.7 15.5 171.7 84.0Other contracts . . . . . . . . . . . . . . . . . . . . . . . — — 145.7 128.1
Total derivatives not designated as hedginginstruments . . . . . . . . . . . . . . . . . . . . . . . . $ 625.8 $ 706.3 $ 869.0 $ 623.9
Total derivative instruments . . . . . . . . . . . . . . . $1,083.2 $1,232.2 $1,416.9 $1,173.6
(1) The fair value of derivative assets is reported with other investments on the consolidated statements of financial position.
(2) The fair value of derivative liabilities is reported with other liabilities on the consolidated statements of financial position, with theexception of certain embedded derivative liabilities. Embedded derivative liabilities with a fair value of $6.6 million and $23.6 million as ofDecember 31, 2010 and 2009, respectively, are reported with contractholder funds on the consolidated statements of financial position.
Credit Derivatives Sold
When we sell credit protection, we are exposed to the underlying credit risk similar to purchasing a fixed maturitysecurity instrument. The majority of our credit derivative contracts sold reference a single name or reference security(referred to as ‘‘single name credit default swaps’’). The remainder of our credit derivatives reference either a basket orindex of securities. These instruments are either referenced in an over-the-counter credit derivative transaction, orembedded within an investment structure that has been fully consolidated into our financial statements.
These credit derivative transactions are subject to events of default defined within the terms of the contract, whichnormally consist of bankruptcy, failure to pay, or modified restructuring of the reference entity and/or issue. If a defaultevent occurs for a reference name or security, we are obligated to pay the counterparty an amount equal to the notionalamount of the credit derivative transaction. As a result, our maximum future payment is equal to the notional amount ofthe credit derivative. In certain cases, we also have purchased credit protection with identical underlyings to certain ofour sold protection transactions. The effect of this purchased protection would reduce our total maximum futurepayments by $10.0 million and $47.0 million as of December 31, 2010 and 2009, respectively. These credit derivativetransactions had a net asset (liability) fair value of $(0.8) million and $2.4 million as of December 31, 2010 and 2009,respectively. Our potential loss could also be reduced by any amount recovered in the default proceedings of theunderlying credit name.
We purchased certain investment structures with embedded credit features that are fully consolidated into ourfinancial statements. This consolidation results in recognition of the underlying credit derivatives and collateral within thestructure, typically high quality fixed maturities that are owned by a special purpose vehicle. These credit derivativesreference a single name or several names in a basket structure. In the event of default, the collateral within the structurewould typically be liquidated to pay the claims of the credit derivative counterparty.
121
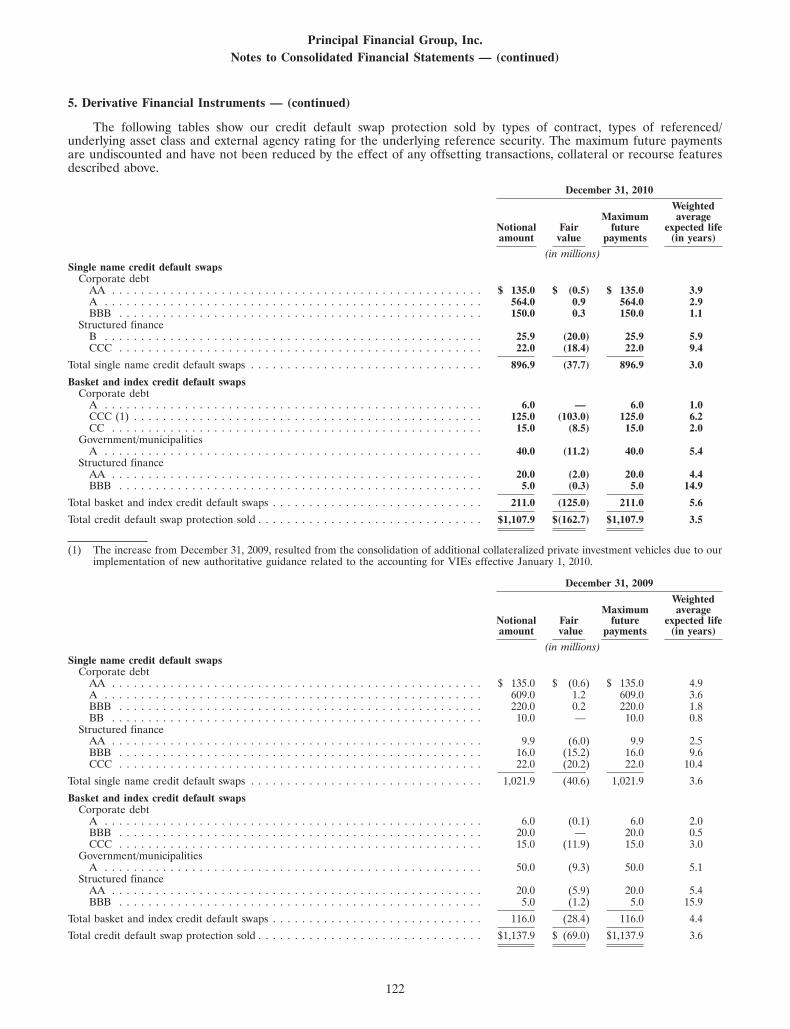
Principal Financial Group, Inc.Notes to Consolidated Financial Statements — (continued)
5. Derivative Financial Instruments — (continued)
The following tables show our credit default swap protection sold by types of contract, types of referenced/underlying asset class and external agency rating for the underlying reference security. The maximum future paymentsare undiscounted and have not been reduced by the effect of any offsetting transactions, collateral or recourse featuresdescribed above.
December 31, 2010
WeightedMaximum average
Notional Fair future expected lifeamount value payments (in years)
(in millions)Single name credit default swaps
Corporate debtAA . . . . . . . . . . . . . . . . . . . . . . . . . . . . . . . . . . . . . . . . . . . . . . . . . . . $ 135.0 $ (0.5) $ 135.0 3.9A . . . . . . . . . . . . . . . . . . . . . . . . . . . . . . . . . . . . . . . . . . . . . . . . . . . . 564.0 0.9 564.0 2.9BBB . . . . . . . . . . . . . . . . . . . . . . . . . . . . . . . . . . . . . . . . . . . . . . . . . . 150.0 0.3 150.0 1.1
Structured financeB . . . . . . . . . . . . . . . . . . . . . . . . . . . . . . . . . . . . . . . . . . . . . . . . . . . . 25.9 (20.0) 25.9 5.9CCC . . . . . . . . . . . . . . . . . . . . . . . . . . . . . . . . . . . . . . . . . . . . . . . . . . 22.0 (18.4) 22.0 9.4
Total single name credit default swaps . . . . . . . . . . . . . . . . . . . . . . . . . . . . . . . . 896.9 (37.7) 896.9 3.0
Basket and index credit default swapsCorporate debt
A . . . . . . . . . . . . . . . . . . . . . . . . . . . . . . . . . . . . . . . . . . . . . . . . . . . . 6.0 — 6.0 1.0CCC (1) . . . . . . . . . . . . . . . . . . . . . . . . . . . . . . . . . . . . . . . . . . . . . . . . 125.0 (103.0) 125.0 6.2CC . . . . . . . . . . . . . . . . . . . . . . . . . . . . . . . . . . . . . . . . . . . . . . . . . . . 15.0 (8.5) 15.0 2.0
Government/municipalitiesA . . . . . . . . . . . . . . . . . . . . . . . . . . . . . . . . . . . . . . . . . . . . . . . . . . . . 40.0 (11.2) 40.0 5.4
Structured financeAA . . . . . . . . . . . . . . . . . . . . . . . . . . . . . . . . . . . . . . . . . . . . . . . . . . . 20.0 (2.0) 20.0 4.4BBB . . . . . . . . . . . . . . . . . . . . . . . . . . . . . . . . . . . . . . . . . . . . . . . . . . 5.0 (0.3) 5.0 14.9
Total basket and index credit default swaps . . . . . . . . . . . . . . . . . . . . . . . . . . . . . 211.0 (125.0) 211.0 5.6
Total credit default swap protection sold . . . . . . . . . . . . . . . . . . . . . . . . . . . . . . . $1,107.9 $(162.7) $1,107.9 3.5
(1) The increase from December 31, 2009, resulted from the consolidation of additional collateralized private investment vehicles due to ourimplementation of new authoritative guidance related to the accounting for VIEs effective January 1, 2010.
December 31, 2009
WeightedMaximum average
Notional Fair future expected lifeamount value payments (in years)
(in millions)Single name credit default swaps
Corporate debtAA . . . . . . . . . . . . . . . . . . . . . . . . . . . . . . . . . . . . . . . . . . . . . . . . . . . $ 135.0 $ (0.6) $ 135.0 4.9A . . . . . . . . . . . . . . . . . . . . . . . . . . . . . . . . . . . . . . . . . . . . . . . . . . . . 609.0 1.2 609.0 3.6BBB . . . . . . . . . . . . . . . . . . . . . . . . . . . . . . . . . . . . . . . . . . . . . . . . . . 220.0 0.2 220.0 1.8BB . . . . . . . . . . . . . . . . . . . . . . . . . . . . . . . . . . . . . . . . . . . . . . . . . . . 10.0 — 10.0 0.8
Structured financeAA . . . . . . . . . . . . . . . . . . . . . . . . . . . . . . . . . . . . . . . . . . . . . . . . . . . 9.9 (6.0) 9.9 2.5BBB . . . . . . . . . . . . . . . . . . . . . . . . . . . . . . . . . . . . . . . . . . . . . . . . . . 16.0 (15.2) 16.0 9.6CCC . . . . . . . . . . . . . . . . . . . . . . . . . . . . . . . . . . . . . . . . . . . . . . . . . . 22.0 (20.2) 22.0 10.4
Total single name credit default swaps . . . . . . . . . . . . . . . . . . . . . . . . . . . . . . . . 1,021.9 (40.6) 1,021.9 3.6
Basket and index credit default swapsCorporate debt
A . . . . . . . . . . . . . . . . . . . . . . . . . . . . . . . . . . . . . . . . . . . . . . . . . . . . 6.0 (0.1) 6.0 2.0BBB . . . . . . . . . . . . . . . . . . . . . . . . . . . . . . . . . . . . . . . . . . . . . . . . . . 20.0 — 20.0 0.5CCC . . . . . . . . . . . . . . . . . . . . . . . . . . . . . . . . . . . . . . . . . . . . . . . . . . 15.0 (11.9) 15.0 3.0
Government/municipalitiesA . . . . . . . . . . . . . . . . . . . . . . . . . . . . . . . . . . . . . . . . . . . . . . . . . . . . 50.0 (9.3) 50.0 5.1
Structured financeAA . . . . . . . . . . . . . . . . . . . . . . . . . . . . . . . . . . . . . . . . . . . . . . . . . . . 20.0 (5.9) 20.0 5.4BBB . . . . . . . . . . . . . . . . . . . . . . . . . . . . . . . . . . . . . . . . . . . . . . . . . . 5.0 (1.2) 5.0 15.9
Total basket and index credit default swaps . . . . . . . . . . . . . . . . . . . . . . . . . . . . . 116.0 (28.4) 116.0 4.4
Total credit default swap protection sold . . . . . . . . . . . . . . . . . . . . . . . . . . . . . . . $1,137.9 $ (69.0) $1,137.9 3.6
122
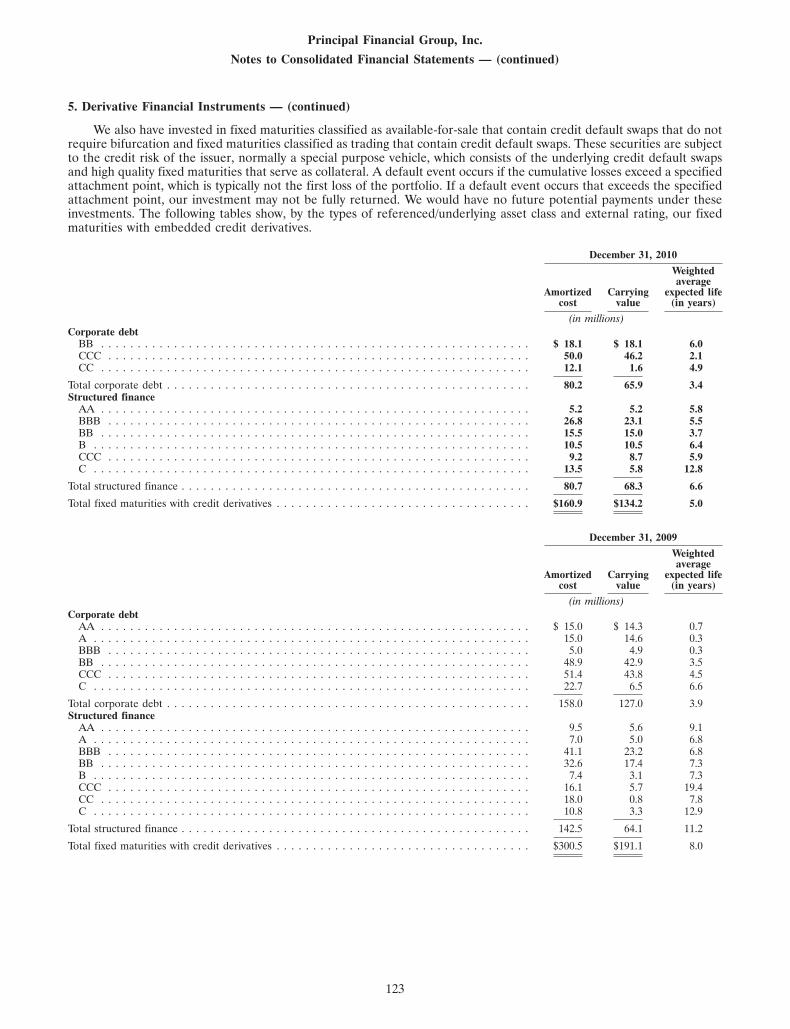
Principal Financial Group, Inc.
Notes to Consolidated Financial Statements — (continued)
5. Derivative Financial Instruments — (continued)
We also have invested in fixed maturities classified as available-for-sale that contain credit default swaps that do notrequire bifurcation and fixed maturities classified as trading that contain credit default swaps. These securities are subjectto the credit risk of the issuer, normally a special purpose vehicle, which consists of the underlying credit default swapsand high quality fixed maturities that serve as collateral. A default event occurs if the cumulative losses exceed a specifiedattachment point, which is typically not the first loss of the portfolio. If a default event occurs that exceeds the specifiedattachment point, our investment may not be fully returned. We would have no future potential payments under theseinvestments. The following tables show, by the types of referenced/underlying asset class and external rating, our fixedmaturities with embedded credit derivatives.
December 31, 2010
Weightedaverage
Amortized Carrying expected lifecost value (in years)
(in millions)Corporate debt
BB . . . . . . . . . . . . . . . . . . . . . . . . . . . . . . . . . . . . . . . . . . . . . . . . . . . . . . . . . . . $ 18.1 $ 18.1 6.0CCC . . . . . . . . . . . . . . . . . . . . . . . . . . . . . . . . . . . . . . . . . . . . . . . . . . . . . . . . . . 50.0 46.2 2.1CC . . . . . . . . . . . . . . . . . . . . . . . . . . . . . . . . . . . . . . . . . . . . . . . . . . . . . . . . . . . 12.1 1.6 4.9
Total corporate debt . . . . . . . . . . . . . . . . . . . . . . . . . . . . . . . . . . . . . . . . . . . . . . . . . . 80.2 65.9 3.4Structured finance
AA . . . . . . . . . . . . . . . . . . . . . . . . . . . . . . . . . . . . . . . . . . . . . . . . . . . . . . . . . . . 5.2 5.2 5.8BBB . . . . . . . . . . . . . . . . . . . . . . . . . . . . . . . . . . . . . . . . . . . . . . . . . . . . . . . . . . 26.8 23.1 5.5BB . . . . . . . . . . . . . . . . . . . . . . . . . . . . . . . . . . . . . . . . . . . . . . . . . . . . . . . . . . . 15.5 15.0 3.7B . . . . . . . . . . . . . . . . . . . . . . . . . . . . . . . . . . . . . . . . . . . . . . . . . . . . . . . . . . . . 10.5 10.5 6.4CCC . . . . . . . . . . . . . . . . . . . . . . . . . . . . . . . . . . . . . . . . . . . . . . . . . . . . . . . . . . 9.2 8.7 5.9C . . . . . . . . . . . . . . . . . . . . . . . . . . . . . . . . . . . . . . . . . . . . . . . . . . . . . . . . . . . . 13.5 5.8 12.8
Total structured finance . . . . . . . . . . . . . . . . . . . . . . . . . . . . . . . . . . . . . . . . . . . . . . . . 80.7 68.3 6.6
Total fixed maturities with credit derivatives . . . . . . . . . . . . . . . . . . . . . . . . . . . . . . . . . . . $160.9 $134.2 5.0
December 31, 2009
Weightedaverage
Amortized Carrying expected lifecost value (in years)
(in millions)Corporate debt
AA . . . . . . . . . . . . . . . . . . . . . . . . . . . . . . . . . . . . . . . . . . . . . . . . . . . . . . . . . . . $ 15.0 $ 14.3 0.7A . . . . . . . . . . . . . . . . . . . . . . . . . . . . . . . . . . . . . . . . . . . . . . . . . . . . . . . . . . . . 15.0 14.6 0.3BBB . . . . . . . . . . . . . . . . . . . . . . . . . . . . . . . . . . . . . . . . . . . . . . . . . . . . . . . . . . 5.0 4.9 0.3BB . . . . . . . . . . . . . . . . . . . . . . . . . . . . . . . . . . . . . . . . . . . . . . . . . . . . . . . . . . . 48.9 42.9 3.5CCC . . . . . . . . . . . . . . . . . . . . . . . . . . . . . . . . . . . . . . . . . . . . . . . . . . . . . . . . . . 51.4 43.8 4.5C . . . . . . . . . . . . . . . . . . . . . . . . . . . . . . . . . . . . . . . . . . . . . . . . . . . . . . . . . . . . 22.7 6.5 6.6
Total corporate debt . . . . . . . . . . . . . . . . . . . . . . . . . . . . . . . . . . . . . . . . . . . . . . . . . . 158.0 127.0 3.9Structured finance
AA . . . . . . . . . . . . . . . . . . . . . . . . . . . . . . . . . . . . . . . . . . . . . . . . . . . . . . . . . . . 9.5 5.6 9.1A . . . . . . . . . . . . . . . . . . . . . . . . . . . . . . . . . . . . . . . . . . . . . . . . . . . . . . . . . . . . 7.0 5.0 6.8BBB . . . . . . . . . . . . . . . . . . . . . . . . . . . . . . . . . . . . . . . . . . . . . . . . . . . . . . . . . . 41.1 23.2 6.8BB . . . . . . . . . . . . . . . . . . . . . . . . . . . . . . . . . . . . . . . . . . . . . . . . . . . . . . . . . . . 32.6 17.4 7.3B . . . . . . . . . . . . . . . . . . . . . . . . . . . . . . . . . . . . . . . . . . . . . . . . . . . . . . . . . . . . 7.4 3.1 7.3CCC . . . . . . . . . . . . . . . . . . . . . . . . . . . . . . . . . . . . . . . . . . . . . . . . . . . . . . . . . . 16.1 5.7 19.4CC . . . . . . . . . . . . . . . . . . . . . . . . . . . . . . . . . . . . . . . . . . . . . . . . . . . . . . . . . . . 18.0 0.8 7.8C . . . . . . . . . . . . . . . . . . . . . . . . . . . . . . . . . . . . . . . . . . . . . . . . . . . . . . . . . . . . 10.8 3.3 12.9
Total structured finance . . . . . . . . . . . . . . . . . . . . . . . . . . . . . . . . . . . . . . . . . . . . . . . . 142.5 64.1 11.2
Total fixed maturities with credit derivatives . . . . . . . . . . . . . . . . . . . . . . . . . . . . . . . . . . . $300.5 $191.1 8.0
123
Principal Financial Group, Inc.
Notes to Consolidated Financial Statements — (continued)
5. Derivative Financial Instruments — (continued)
Fair Value Hedges
We use fixed-to-floating rate interest rate swaps to more closely align the interest rate characteristics of certain assetsand liabilities. In general, these swaps are used in asset and liability management to modify duration, which is a measureof sensitivity to interest rate changes.
We enter into currency exchange swap agreements to convert certain foreign denominated assets and liabilities intoU.S. dollar floating-rate denominated instruments to eliminate the exposure to future currency volatility on those items.
We also sell callable investment-type insurance contracts and use cancellable interest rate swaps and have writteninterest rate swaptions to hedge the changes in fair value of the callable feature.
The net interest effect of interest rate swap and currency swap transactions for derivatives in fair value hedges isrecorded as an adjustment to income or expense of the underlying hedged item in our consolidated statements ofoperations.
Hedge effectiveness testing for fair value relationships is performed utilizing a regression analysis approach for bothprospective and retrospective evaluations. This regression analysis will consider multiple data points for the assessmentthat the hedge continues to be highly effective in achieving offsetting changes in fair value. In certain periods, thecomparison of the change in value of the derivative and the change in the value of the hedged item may not be offsettingat a specific period in time due to small movements in value. However, any amounts recorded as fair value hedges haveshown to be highly effective in achieving offsetting changes in fair value both for present and future periods.
The following table shows the effect of derivatives in fair value hedging relationships and the related hedged itemson the consolidated statements of operations. All gains or losses on derivatives were included in the assessment of hedgeeffectiveness.
Amount of gain (loss) Amount of gain (loss)recognized in net income recognized in net income
on derivatives on related hedged itemfor the year ended for the year endedDecember 31, (1) December 31, (1)Derivatives in fair value Hedged items in fair value
hedging relationships 2010 2009 2008 hedging relationships 2010 2009 2008
(in millions) (in millions)Interest rate contracts . . . . . . . . . . . $(100.2) $308.6 $(532.2) Fixed maturities, available-for-sale . . . $106.4 $(264.0) $510.8Interest rate contracts . . . . . . . . . . . (19.2) (30.8) 47.8 Investment-type insurance contracts . . 20.6 46.9 (68.1)Foreign exchange contracts . . . . . . . . 6.9 4.8 (0.1) Fixed maturities, available-for-sale . . . (5.6) (6.0) 0.6Foreign exchange contracts . . . . . . . . (23.3) 82.4 (199.8) Investment-type insurance contracts . . 18.1 (86.2) 214.4
Total . . . . . . . . . . . . . . . . . . . . . . $(135.8) $365.0 $(684.3) Total . . . . . . . . . . . . . . . . . . . . . . $139.5 $(309.3) $657.7
(1) The gain (loss) on both derivatives and hedged items in fair value relationships is reported in net realized capital gains (losses) on theconsolidated statements of operations. The net amount represents the ineffective portion of our fair value hedges.
The following table shows the periodic settlements on interest rate contracts and foreign exchange contracts in fairvalue hedging relationships.
Amount of gain (loss)for the year ended
December 31,
Hedged Item 2010 2009 2008
(in millions)Fixed maturities, available-for-sale (1) . . . . . . . . . . . . . . . . . . . . . . . . . . . . . . . . . . . . . . . . . . . . . . $(161.9) $(143.5) $(63.4)Investment-type insurance contracts (2) . . . . . . . . . . . . . . . . . . . . . . . . . . . . . . . . . . . . . . . . . . . . . 76.3 106.2 64.8
(1) Reported in net investment income on the consolidated statements of operations.
(2) Reported in benefits, claims and settlement expenses on the consolidated statements of operations.
Cash Flow Hedges
We utilize floating-to-fixed rate interest rate swaps to eliminate the variability in cash flows of recognized financialassets and liabilities and forecasted transactions.
We enter into currency exchange swap agreements to convert both principal and interest payments of certain foreigndenominated assets and liabilities into U.S. dollar denominated fixed-rate instruments to eliminate the exposure to futurecurrency volatility on those items.
124
Principal Financial Group, Inc.
Notes to Consolidated Financial Statements — (continued)
5. Derivative Financial Instruments — (continued)
The net interest effect of interest rate swap and currency swap transactions for derivatives in cash flow hedges isrecorded as an adjustment to income or expense of the underlying hedged item in our consolidated statements ofoperations.
The maximum length of time that we are hedging our exposure to the variability in future cash flows for forecastedtransactions, excluding those related to the payments of variable interest on existing financial assets and liabilities, is9.5 years. At December 31, 2010, we had $65.8 million of gross unrealized gains reported in AOCI on the consolidatedstatements of financial position related to active hedges of forecasted transactions. If a hedged forecasted transaction isno longer probable of occurring, cash flow hedge accounting is discontinued. If it is probable that the hedged forecastedtransaction will not occur, the deferred gain or loss is immediately reclassified from OCI into net income. No amountswere reclassified from AOCI into net realized capital gains (losses) as a result of the determination that hedged cashflows were probable of not occurring during the years ended December 31, 2010 and 2008. During the year endedDecember 31, 2009, $40.4 million of gross unrealized losses were reclassified from AOCI into net realized capital gains(losses) as a result of the determination that hedged cash flows of a forecasted liability issuance were probable of notoccurring.
The following table shows the effect of derivatives in cash flow hedging relationships on the consolidated statementsof operations and consolidated statements of financial position. All gains or losses on derivatives were included in theassessment of hedge effectiveness.
Amount of gain Amount of gain(loss) recognized (loss) reclassified
in AOCI on from AOCI onderivatives (effective derivatives (effectiveLocation of gain (loss)portion) for the year portion) for the yearreclassified from AOCIended December 31, ended December 31,Derivatives in cash flow into net income
hedging relationships Related hedged item 2010 2009 2008 (effective portion) 2010 2009 2008
(in millions) (in millions)Interest rate contracts . . . . . . Fixed maturities,
available-for-sale $ (18.0) $(124.4) $206.7 Net investment income . . $ 7.1 $ 4.8 $ 3.6Interest rate contracts . . . . . . Investment-type insurance Benefits, claims and
contracts 18.4 112.3 (38.1) settlement expenses . . . (1.0) (1.0) (0.3)Interest rate contracts . . . . . . Debt — 30.6 (96.6) Operating expense . . . . . (4.7) (2.5) 0.3Foreign exchange contracts . . . Fixed maturities,
available-for-sale 136.7 (216.8) 234.6 Net investment income . . — — —Foreign exchange contracts . . . Investment-type insurance Benefits, claims and
contracts (76.5) 167.4 (316.0) settlement expenses . . . (6.1) (5.6) 1.0Net realized capital gains
(losses) . . . . . . . . . . . (0.1) 22.8 (4.0)
Total . . . . . . . . . . . . . . . . . $ 60.6 $ (30.9) $ (9.4) Total . . . . . . . . . . . . . . $(4.8) $18.5 $ 0.6
The following table shows the periodic settlements on interest rate contracts and foreign exchange contracts in cashflow hedging relationships.
Amount of gain (loss)for the year ended
December 31,
Hedged Item 2010 2009 2008
(in millions)Fixed maturities, available-for-sale (1) . . . . . . . . . . . . . . . . . . . . . . . . . . . . . . . . . . . . . . . . . . . . . . . $ 11.1 $ 16.9 $ 8.0Investment-type insurance contracts (2) . . . . . . . . . . . . . . . . . . . . . . . . . . . . . . . . . . . . . . . . . . . . . . (12.5) (20.0) (2.7)
(1) Reported in net investment income on the consolidated statements of operations.
(2) Reported in benefits, claims and settlement expenses on the consolidated statements of operations.
The ineffective portion of our cash flow hedges is reported in net realized capital gains (losses) on the consolidatedstatements of operations. The net loss resulting from the ineffective portion of interest rate contracts in cash flow hedgingrelationships was zero for the years ended December 31, 2010 and 2009, and $1.8 million for the year endedDecember 31, 2008. The net gain resulting from the ineffective portion of foreign currency contracts in cash flow hedgingrelationships was $0.9 million, $2.2 million and $0.4 million for the years ended December 31, 2010, 2009 and 2008,respectively.
We expect to reclassify net gains of $25.8 million from AOCI into net income in the next 12 months, which includesboth net deferred gains on discontinued hedges and net deferred losses on periodic settlements of active hedges. Actualamounts may vary from this amount as a result of market conditions.
125

Principal Financial Group, Inc.
Notes to Consolidated Financial Statements — (continued)
5. Derivative Financial Instruments — (continued)
Derivatives Not Designated as Hedging Instruments
Our use of futures, certain swaptions and swaps, collars, options and forwards are effective from an economicstandpoint, but they have not been designated as hedges for financial reporting purposes. As such, periodic changes inthe market value of these instruments, which includes mark-to-market gains and losses as well as periodic and finalsettlements, primarily flow directly into net realized capital gains (losses) on the consolidated statements of operations.Gains and losses on certain derivatives used in relation to certain trading portfolios are reported in net investmentincome on the consolidated statements of operations.
The following tables show the effect of derivatives not designated as hedging instruments, including market valuechanges of embedded derivatives that have been bifurcated from the host contract, on the consolidated statements ofoperations.
Amount of gain (loss)recognized in net income
on derivatives for the yearended December 31,
Derivatives not designated as hedging instruments 2010 2009 2008
(in millions)Interest rate contracts . . . . . . . . . . . . . . . . . . . . . . . . . . . . . . . . . . . . . . . . . . . . . . . . . . . . . . . . $ 24.8 $ (58.7) $ 90.4Foreign exchange contracts . . . . . . . . . . . . . . . . . . . . . . . . . . . . . . . . . . . . . . . . . . . . . . . . . . . . . (73.5) 87.9 (167.9)Equity contracts . . . . . . . . . . . . . . . . . . . . . . . . . . . . . . . . . . . . . . . . . . . . . . . . . . . . . . . . . . . . (24.0) (107.7) 86.3Credit contracts . . . . . . . . . . . . . . . . . . . . . . . . . . . . . . . . . . . . . . . . . . . . . . . . . . . . . . . . . . . . 5.1 61.7 (102.0)Other contracts (1) . . . . . . . . . . . . . . . . . . . . . . . . . . . . . . . . . . . . . . . . . . . . . . . . . . . . . . . . . . (8.8) 21.6 (43.2)
Total . . . . . . . . . . . . . . . . . . . . . . . . . . . . . . . . . . . . . . . . . . . . . . . . . . . . . . . . . . . . . . . . . . . $(76.4) $ 4.8 $(136.4)
(1) Primarily includes the change in fair value of embedded derivatives.
6. Closed Block
In connection with the 1998 MIHC formation, Principal Life formed a Closed Block to provide reasonable assuranceto policyholders included therein that, after the formation of the MIHC, assets would be available to maintain dividendsin aggregate in accordance with the 1997 policy dividend scales, if the experience underlying such scales continued. Assetsof Principal Life were allocated to the Closed Block in an amount that produces cash flows which, together withanticipated revenue from policies and contracts included in the Closed Block, were expected to be sufficient to supportthe Closed Block policies, including, but not limited to, provisions for payment of claims, certain expenses, charges andtaxes, and to provide for continuation of policy and contract dividends in aggregate in accordance with the 1997 dividendscales, if the experience underlying such scales continues, and to allow for appropriate adjustments in such scales, if suchexperience changes. Due to adjustable life policies being included in the Closed Block, the Closed Block is charged withamounts necessary to properly fund for certain adjustments, such as face amount and premium increases, that are madeto these policies after the Closed Block inception date. These amounts are referred to as Funding Adjustment Chargesand are treated as capital transfers from the Closed Block.
Assets allocated to the Closed Block inure solely to the benefit of the holders of policies included in the ClosedBlock. Closed Block assets and liabilities are carried on the same basis as other similar assets and liabilities. Principal Lifewill continue to pay guaranteed benefits under all policies, including the policies within the Closed Block, in accordancewith their terms. If the assets allocated to the Closed Block, the investment cash flows from those assets and the revenuesfrom the policies included in the Closed Block, including investment income thereon, prove to be insufficient to pay thebenefits guaranteed under the policies included in the Closed Block, Principal Life will be required to make suchpayments from their general funds. No additional policies were added to the Closed Block, nor was the Closed Blockaffected in any other way, as a result of the demutualization.
A policyholder dividend obligation (‘‘PDO’’) is required to be established for earnings in the Closed Block that arenot available to stockholders. A model of the Closed Block was established to produce the pattern of expected earnings inthe Closed Block, adjusted to eliminate the impact of related amounts in AOCI.
If actual cumulative earnings of the Closed Block are greater than the expected cumulative earnings of the ClosedBlock, only the expected cumulative earnings will be recognized in income with the excess recorded as a PDO. This PDOrepresents undistributed accumulated earnings that will be paid to Closed Block policyholders as additional policyholderdividends unless offset by future performance of the Closed Block that is less favorable than originally expected. If actualcumulative performance is less favorable than expected, only actual earnings will be recognized in income. AtDecember 31, 2010 and 2009, cumulative actual earnings have been less than cumulative expected earnings. Additionally,
126
Principal Financial Group, Inc.
Notes to Consolidated Financial Statements — (continued)
6. Closed Block — (continued)
cumulative net unrealized gains were not greater than expected. Therefore, we had no PDO liability as of December 31,2010 and 2009.
Closed Block liabilities and assets designated to the Closed Block were as follows:December 31,
2010 2009
(in millions)Closed Block liabilitiesFuture policy benefits and claims . . . . . . . . . . . . . . . . . . . . . . . . . . . . . . . . . . . . . . . . . . . . . . . . $5,003.1 $5,172.9Other policyholder funds . . . . . . . . . . . . . . . . . . . . . . . . . . . . . . . . . . . . . . . . . . . . . . . . . . . . . 21.7 23.9Policyholder dividends payable . . . . . . . . . . . . . . . . . . . . . . . . . . . . . . . . . . . . . . . . . . . . . . . . . 294.2 308.9Other liabilities . . . . . . . . . . . . . . . . . . . . . . . . . . . . . . . . . . . . . . . . . . . . . . . . . . . . . . . . . . . 79.2 14.7
Total Closed Block liabilities . . . . . . . . . . . . . . . . . . . . . . . . . . . . . . . . . . . . . . . . . . . . . . . . . 5,398.2 5,520.4Assets designated to the Closed BlockFixed maturities, available-for-sale . . . . . . . . . . . . . . . . . . . . . . . . . . . . . . . . . . . . . . . . . . . . . . . 2,833.7 2,748.6Fixed maturities, trading . . . . . . . . . . . . . . . . . . . . . . . . . . . . . . . . . . . . . . . . . . . . . . . . . . . . . 29.5 31.0Equity securities, available-for-sale . . . . . . . . . . . . . . . . . . . . . . . . . . . . . . . . . . . . . . . . . . . . . . . 11.2 14.4Mortgage loans . . . . . . . . . . . . . . . . . . . . . . . . . . . . . . . . . . . . . . . . . . . . . . . . . . . . . . . . . . . 677.9 591.8Policy loans . . . . . . . . . . . . . . . . . . . . . . . . . . . . . . . . . . . . . . . . . . . . . . . . . . . . . . . . . . . . . 725.4 747.2Other investments . . . . . . . . . . . . . . . . . . . . . . . . . . . . . . . . . . . . . . . . . . . . . . . . . . . . . . . . . 163.5 157.5
Total investments . . . . . . . . . . . . . . . . . . . . . . . . . . . . . . . . . . . . . . . . . . . . . . . . . . . . . . . . 4,441.2 4,290.5Cash and cash equivalents . . . . . . . . . . . . . . . . . . . . . . . . . . . . . . . . . . . . . . . . . . . . . . . . . . . . — 33.6Accrued investment income . . . . . . . . . . . . . . . . . . . . . . . . . . . . . . . . . . . . . . . . . . . . . . . . . . . 64.3 69.2Premiums due and other receivables . . . . . . . . . . . . . . . . . . . . . . . . . . . . . . . . . . . . . . . . . . . . . . 17.9 18.7Deferred income tax asset . . . . . . . . . . . . . . . . . . . . . . . . . . . . . . . . . . . . . . . . . . . . . . . . . . . . 60.2 133.3
Total assets designated to the Closed Block . . . . . . . . . . . . . . . . . . . . . . . . . . . . . . . . . . . . . . . . 4,583.6 4,545.3
Excess of Closed Block liabilities over assets designated to the Closed Block . . . . . . . . . . . . . . . . . . . . 814.6 975.1Amounts included in accumulated other comprehensive income (loss) . . . . . . . . . . . . . . . . . . . . . . . . . 33.0 (61.6)
Maximum future earnings to be recognized from Closed Block assets and liabilities . . . . . . . . . . . . . . . . $ 847.6 $ 913.5
Closed Block revenues and expenses were as follows:For the year ended
December 31,
2010 2009 2008
(in millions)RevenuesPremiums and other considerations . . . . . . . . . . . . . . . . . . . . . . . . . . . . . . . . . . . . . . . . . . $459.3 $508.6 $550.4Net investment income . . . . . . . . . . . . . . . . . . . . . . . . . . . . . . . . . . . . . . . . . . . . . . . . . . 257.6 268.6 280.9Net realized capital gains (losses) . . . . . . . . . . . . . . . . . . . . . . . . . . . . . . . . . . . . . . . . . . . . 1.8 (23.5) (12.7)
Total revenues . . . . . . . . . . . . . . . . . . . . . . . . . . . . . . . . . . . . . . . . . . . . . . . . . . . . . . 718.7 753.7 818.6ExpensesBenefits, claims and settlement expenses . . . . . . . . . . . . . . . . . . . . . . . . . . . . . . . . . . . . . . . 385.5 422.1 467.6Dividends to policyholders . . . . . . . . . . . . . . . . . . . . . . . . . . . . . . . . . . . . . . . . . . . . . . . . 215.1 235.9 261.8Operating expenses . . . . . . . . . . . . . . . . . . . . . . . . . . . . . . . . . . . . . . . . . . . . . . . . . . . . . 6.4 6.8 7.4
Total expenses . . . . . . . . . . . . . . . . . . . . . . . . . . . . . . . . . . . . . . . . . . . . . . . . . . . . . . 607.0 664.8 736.8
Closed Block revenues, net of Closed Block expenses, before income taxes . . . . . . . . . . . . . . . . . 111.7 88.9 81.8Income taxes . . . . . . . . . . . . . . . . . . . . . . . . . . . . . . . . . . . . . . . . . . . . . . . . . . . . . . . . . 36.2 28.1 25.6
Closed Block revenues, net of Closed Block expenses and income taxes . . . . . . . . . . . . . . . . . . . 75.5 60.8 56.2Funding adjustment charges . . . . . . . . . . . . . . . . . . . . . . . . . . . . . . . . . . . . . . . . . . . . . . . (9.6) (6.6) (8.5)
Closed Block revenues, net of Closed Block expenses, income taxes and funding adjustment charges . $ 65.9 $ 54.2 $ 47.7
127

Principal Financial Group, Inc.
Notes to Consolidated Financial Statements — (continued)
6. Closed Block — (continued)
The change in maximum future earnings of the Closed Block was as follows:For the year ended
December 31,
2010 2009 2008
(in millions)Beginning of year . . . . . . . . . . . . . . . . . . . . . . . . . . . . . . . . . . . . . . . . . . . . . . . . . . . $913.5 $ 967.7 $1,015.4End of year . . . . . . . . . . . . . . . . . . . . . . . . . . . . . . . . . . . . . . . . . . . . . . . . . . . . . . . 847.6 913.5 967.7
Change in maximum future earnings . . . . . . . . . . . . . . . . . . . . . . . . . . . . . . . . . . . . . . . . $(65.9) $ (54.2) $ (47.7)
Principal Life charges the Closed Block with federal income taxes, payroll taxes, state and local premium taxes andother state or local taxes, licenses and fees as provided in the plan of reorganization.
7. Deferred Policy Acquisition Costs
Policy acquisition costs deferred and amortized were as follows:For the year ended
December 31,
2010 2009 2008
(in millions)Balance at beginning of year . . . . . . . . . . . . . . . . . . . . . . . . . . . . . . . . . . . . . . . . . . . $3,681.4 $4,153.0 $2,810.1Cost deferred during the year . . . . . . . . . . . . . . . . . . . . . . . . . . . . . . . . . . . . . . . . . . . 496.3 482.4 680.3Amortized to expense during the year (1) . . . . . . . . . . . . . . . . . . . . . . . . . . . . . . . . . . . (205.9) (92.2) (373.7)Adjustment related to unrealized (gains) losses on available-for-sale securities and derivative
instruments . . . . . . . . . . . . . . . . . . . . . . . . . . . . . . . . . . . . . . . . . . . . . . . . . . . . . (442.0) (861.8) 1,036.3
Balance at end of year . . . . . . . . . . . . . . . . . . . . . . . . . . . . . . . . . . . . . . . . . . . . . . . $3,529.8 $3,681.4 $4,153.0
(1) Includes adjustments for revisions to estimated gross profits.
8. Insurance Liabilities
Contractholder Funds
Major components of contractholder funds in the consolidated statements of financial position are summarized asfollows:
December 31,
2010 2009
(in millions)Liabilities for investment-type insurance contracts:
GICs . . . . . . . . . . . . . . . . . . . . . . . . . . . . . . . . . . . . . . . . . . . . . . . . . . . . . . . . . . . . . . . $10,013.6 $10,839.2Funding agreements . . . . . . . . . . . . . . . . . . . . . . . . . . . . . . . . . . . . . . . . . . . . . . . . . . . . . 10,226.9 12,511.2Other investment-type insurance contracts . . . . . . . . . . . . . . . . . . . . . . . . . . . . . . . . . . . . . . . 758.6 891.4
Total liabilities for investment-type insurance contracts . . . . . . . . . . . . . . . . . . . . . . . . . . . . . . . . . 20,999.1 24,241.8Liabilities for individual annuities . . . . . . . . . . . . . . . . . . . . . . . . . . . . . . . . . . . . . . . . . . . . . . 11,721.0 11,431.0Universal life and other reserves . . . . . . . . . . . . . . . . . . . . . . . . . . . . . . . . . . . . . . . . . . . . . . . 4,581.0 4,129.1
Total contractholder funds . . . . . . . . . . . . . . . . . . . . . . . . . . . . . . . . . . . . . . . . . . . . . . . . . . . $37,301.1 $39,801.9
Our GICs and funding agreements contain provisions limiting or prohibiting early surrenders, which typically includepenalties for early surrenders, minimum notice requirements or, in the case of funding agreements with survivor options,minimum pre-death holding periods and specific maximum amounts.
Funding agreements include those issued directly to nonqualified institutional investors, as well as to four separateprograms where the funding agreements have been issued directly or indirectly to unconsolidated special purposeentities. Claims for principal and interest under funding agreements are afforded equal priority to claims of life insuranceand annuity policyholders under insolvency provisions of Iowa Insurance Laws.
We are authorized to issue up to $4.0 billion of funding agreements under a program established in 1998 to supportthe prospective issuance of medium term notes by an unaffiliated entity in non-U.S. markets. As of December 31, 2010and 2009, $2,055.4 million and $2,502.2 million, respectively, of liabilities are outstanding with respect to the issuanceoutstanding under this program. We do not anticipate any new issuance activity under this program as we are authorizedto issue up to Euro 4.0 billion (approximately USD$5.3 billion) of funding agreements under a program established in
128

Principal Financial Group, Inc.
Notes to Consolidated Financial Statements — (continued)
8. Insurance Liabilities — (continued)
2006 to support the prospective issuance of medium term notes by an unaffiliated entity in non-U.S. markets. Theunaffiliated entity is an unconsolidated special purpose vehicle. As of December 31, 2010 and 2009, $1,340.0 million and$1,404.2 million, respectively, of liabilities are outstanding with respect to the issuances outstanding under this program.
In addition, we were authorized to issue up to $7.0 billion of funding agreements under a program established in2001 to support the prospective issuance of medium term notes by an unaffiliated entity in both domestic andinternational markets. The unaffiliated entity is an unconsolidated qualifying special purpose entity. As of December 31,2010 and 2009, $2,224.7 million and $2,474.0 million, respectively, of liabilities are being held with respect to the issuanceoutstanding under this program. We do not anticipate any new issuance activity under this program, given our December2005 termination of the dealership agreement for this program and the availability of the SEC-registered programdescribed in the following paragraph.
We were authorized to issue up to $4.0 billion of funding agreements under a program established in March 2004 tosupport the prospective issuance of medium term notes by unaffiliated entities in both domestic and internationalmarkets. In February 2006, this program was amended to authorize issuance of up to an additional $5.0 billion inrecognition of the use of nearly all $4.0 billion of initial issuance authorization. In recognition of the use of nearly all$9.0 billion, this program was amended in November 2007 to authorize issuance of up to an additional $5.0 billion. Underthis program, both the notes and the supporting funding agreements are registered with the SEC. As of December 31,2010 and 2009, $3,597.8 million and $5,122.4 million, respectively, of liabilities are being held with respect to the issuanceoutstanding under this program. In contrast with direct funding agreements, GIC issuances and the other three fundingagreement-backed medium term note programs described above, Principal Life’s payment obligations on each fundingagreement issued under this SEC-registered program are guaranteed by PFG.
Due to a downturn in the credit market, we reduced the amount of medium term note issuances in 2008 and had noissuances in 2009 and 2010. As economic conditions change, we will reassess the issuance of funding agreements to thesemedium term note programs.
Future Policy Benefits and Claims
Activity associated with unpaid disability and health claims is summarized as follows:For the year ended
December 31,
2010 2009 2008
(in millions)Balance at beginning of year . . . . . . . . . . . . . . . . . . . . . . . . . . . . . . . . . . . . . . . . . . . $1,025.6 $ 991.8 $ 964.3Incurred:
Current year . . . . . . . . . . . . . . . . . . . . . . . . . . . . . . . . . . . . . . . . . . . . . . . . . . . . 1,611.9 1,888.3 1,994.5Prior years . . . . . . . . . . . . . . . . . . . . . . . . . . . . . . . . . . . . . . . . . . . . . . . . . . . . . 11.1 (33.4) (56.7)
Total incurred . . . . . . . . . . . . . . . . . . . . . . . . . . . . . . . . . . . . . . . . . . . . . . . . . . . . . 1,623.0 1,854.9 1,937.8Payments:
Current year . . . . . . . . . . . . . . . . . . . . . . . . . . . . . . . . . . . . . . . . . . . . . . . . . . . . 1,269.4 1,507.1 1,588.6Prior years . . . . . . . . . . . . . . . . . . . . . . . . . . . . . . . . . . . . . . . . . . . . . . . . . . . . . 317.4 314.0 321.7
Total payments . . . . . . . . . . . . . . . . . . . . . . . . . . . . . . . . . . . . . . . . . . . . . . . . . . . . 1,586.8 1,821.1 1,910.3Balance at end of year:
Current year . . . . . . . . . . . . . . . . . . . . . . . . . . . . . . . . . . . . . . . . . . . . . . . . . . . . 342.5 381.2 405.9Prior years . . . . . . . . . . . . . . . . . . . . . . . . . . . . . . . . . . . . . . . . . . . . . . . . . . . . . 719.3 644.4 585.9
Total balance at end of year . . . . . . . . . . . . . . . . . . . . . . . . . . . . . . . . . . . . . . . . . . . . $1,061.8 $1,025.6 $ 991.8
Supplemental information:Claim adjustment expense liabilities . . . . . . . . . . . . . . . . . . . . . . . . . . . . . . . . . . . . . $ 42.7 $ 40.7 $ 39.1Reinsurance recoverables . . . . . . . . . . . . . . . . . . . . . . . . . . . . . . . . . . . . . . . . . . . . 1.6 3.7 4.3
Incurred liability adjustments relating to prior years, which affected current operations during 2010, 2009 and 2008,resulted in part from developed claims for prior years being different than were anticipated when the liabilities for unpaiddisability and health claims were originally estimated. These trends have been considered in establishing the current yearliability for unpaid disability and health claims.
129
Principal Financial Group, Inc.
Notes to Consolidated Financial Statements — (continued)
9. Debt
Short-Term Debt
The components of short-term debt were as follows:December 31,
2010 2009
(in millions)Commercial paper . . . . . . . . . . . . . . . . . . . . . . . . . . . . . . . . . . . . . . . . . . . . . . . . . . . . . . . . . . . $ 50.0 $ 75.0Other recourse short-term debt . . . . . . . . . . . . . . . . . . . . . . . . . . . . . . . . . . . . . . . . . . . . . . . . . . . 57.9 26.6
Total short-term debt . . . . . . . . . . . . . . . . . . . . . . . . . . . . . . . . . . . . . . . . . . . . . . . . . . . . . . . . . . $107.9 $101.6
As of December 31, 2010 and 2009, we had credit facilities with various financial institutions in an aggregate amountof $719.8 million and $681.9 million, respectively. As of December 31, 2010 and 2009, we had $107.9 million and$101.6 million, respectively, of outstanding borrowings related to our credit facilities, with $28.4 million of assets pledgedas support as of December 31, 2010. As of both December 31, 2010 and 2009, our credit facilities included a$579.0 million commercial paper program, of which $50.0 million and $75.0 million was outstanding as of December 31,2010 and 2009, respectively. Our commercial paper program has a back-stop facility to provide 100% support for ourcommercial paper program, of which there were no outstanding balances as of December 31, 2010 and 2009.
The weighted-average interest rates on short-term borrowings as of December 31, 2010 and 2009, were 1.5% and0.7%, respectively.
Long-Term Debt
The components of long-term debt were as follows:December 31,
2010 2009
(in millions)3.31% notes payable, due 2011 . . . . . . . . . . . . . . . . . . . . . . . . . . . . . . . . . . . . . . . . . . . . . . . . . $ — $ 61.23.63% notes payable, due 2011 . . . . . . . . . . . . . . . . . . . . . . . . . . . . . . . . . . . . . . . . . . . . . . . . . — 31.47.875% notes payable, due 2014 . . . . . . . . . . . . . . . . . . . . . . . . . . . . . . . . . . . . . . . . . . . . . . . . . 400.0 400.03.76% notes payable, due 2015 . . . . . . . . . . . . . . . . . . . . . . . . . . . . . . . . . . . . . . . . . . . . . . . . . 102.8 —8.875% notes payable, due 2019 . . . . . . . . . . . . . . . . . . . . . . . . . . . . . . . . . . . . . . . . . . . . . . . . . 350.0 350.06.05% notes payable, due 2036 . . . . . . . . . . . . . . . . . . . . . . . . . . . . . . . . . . . . . . . . . . . . . . . . . 601.7 601.88% surplus notes payable, due 2044 . . . . . . . . . . . . . . . . . . . . . . . . . . . . . . . . . . . . . . . . . . . . . . 99.3 99.2Non-recourse mortgages and notes payable . . . . . . . . . . . . . . . . . . . . . . . . . . . . . . . . . . . . . . . . . . 29.5 40.6Other mortgages and notes payable . . . . . . . . . . . . . . . . . . . . . . . . . . . . . . . . . . . . . . . . . . . . . . 0.4 0.4
Total long-term debt . . . . . . . . . . . . . . . . . . . . . . . . . . . . . . . . . . . . . . . . . . . . . . . . . . . . . . . . $1,583.7 $1,584.6
The amounts included above are net of the discount and premium associated with issuing these notes, which arebeing amortized to expense over their respective terms using the interest method.
On November 3, 2010, Principal International de Chile S.A., a wholly owned indirect subsidiary, entered into along-term borrowing agreement with Banco de Chile in the amount of US $98.9 million. This debt is denominated inUnidades de Formento (‘‘UF’’), a Chilean inflation-indexed, peso-denominated monetary unit. The note bears interest atUF +3.76% and will mature on November 3, 2015. Interest on the note is payable semi-annually on May 3 andNovember 3 each year. This borrowing agreement consolidated and modified the terms of US $93.9 million of notes withtwo Chilean banks that were scheduled to mature on November 3, 2011. The debt outstanding and interest expense willvary due to fluctuations in the Chilean peso to US dollar exchange rates and Chilean inflation.
On May 18, 2009, we issued $750.0 million of senior notes. We issued a $400.0 million series of notes that bearinterest at 7.875% and will mature on May 15, 2014, and a $350.0 million series of notes that bear interest at 8.875% andwill mature on May 15, 2019. Interest on the notes is payable semi-annually on May 15 and November 15 each year,beginning on November 15, 2009. The proceeds were primarily used to refinance $440.9 million of notes that matured onAugust 15, 2009, with the remaining proceeds being used for general corporate purposes.
On October 16 and December 5, 2006, we issued $500.0 million and $100.0 million, respectively, of senior notes. Thenotes bear interest at a rate of 6.05% per year. Interest on the notes is payable semi-annually on April 15 and October 15each year and began on April 15, 2007. The notes will mature on October 15, 2036. A portion of the proceeds were usedto fund the 2006 acquisition of WM Advisors, Inc., with the remaining proceeds being used for general corporatepurposes.
On March 10, 1994, Principal Life issued $100.0 million of surplus notes due March 1, 2044, at an 8% annual interestrate. None of our affiliates hold any portion of the notes. Each payment of interest and principal on the notes, however,
130

Principal Financial Group, Inc.
Notes to Consolidated Financial Statements — (continued)
9. Debt — (continued)
may be made only with the prior approval of the Commissioner of Insurance of the State of Iowa (the ‘‘Commissioner’’)and only to the extent that Principal Life has sufficient surplus earnings to make such payments. Interest of $8.0 millionfor each of the years ended December 31, 2010, 2009 and 2008 was approved by the Commissioner, and charged toexpense.
Subject to Commissioner approval, the notes due March 1, 2044, may be redeemed at Principal Life’s election on orafter March 1, 2014, in whole or in part at a redemption price of approximately 102.3% of par. The approximate 2.3%premium is scheduled to gradually diminish over the following ten years. These notes may be redeemed on or afterMarch 1, 2024, at a redemption price of 100% of the principal amount plus interest accrued to the date of redemption.
The non-recourse mortgages, other mortgages and notes payable are primarily financings for real estatedevelopments. Outstanding principal balances as of December 31, 2010, ranged from $5.8 million to $8.9 million perdevelopment with interest rates generally ranging from 5.5% to 5.8%. Outstanding principal balances as of December 31,2009, ranged from $5.9 million to $9.1 million per development with interest rates generally ranging from 5.5% to 5.8%.Outstanding debt is secured by the underlying real estate properties, which were reported as real estate on ourconsolidated statements of financial position with a carrying value of $29.6 million and $30.1 million as of December 31,2010 and 2009, respectively.
Also included in non-recourse mortgages and notes payable is a long-term debt obligation we assumed with thepurchase of WM Advisors, Inc. As part of the purchase, we are bound by a class B share financing agreement previouslyentered into by WM Advisors, Inc. and a third party. Load mutual fund shares sold without a front end load are referredto as ‘‘B shares’’. In exchange for paying the selling commission, we receive fees in the future to recover the up-frontcommission cost incurred. Prior to our purchase, WM Advisors, Inc. had entered into a purchase and sale agreementwhereby the third party would purchase the rights to future cash flow streams in exchange for funding the salescommissions. The fair value of these relinquished fees is reported as a long-term debt liability. There will be no additionalsales under this agreement following the effective date of the purchase. Therefore, this liability will be extinguished in2012, which equates to the remaining contractual term in which the fund can recover fees to cover the upfrontcommission costs. The value of this obligation as of December 31, 2010 and 2009, was $8.4 million and $19.1 million,respectively.
At December 31, 2010, future annual maturities of the long-term debt were as follows (in millions):Year ending December 31:
2011 . . . . . . . . . . . . . . . . . . . . . . . . . . . . . . . . . . . . . . . . . . . . . . . . . . . . . . . . . . . . . . . . . . . . . . $ 5.42012 . . . . . . . . . . . . . . . . . . . . . . . . . . . . . . . . . . . . . . . . . . . . . . . . . . . . . . . . . . . . . . . . . . . . . . 2.72013 . . . . . . . . . . . . . . . . . . . . . . . . . . . . . . . . . . . . . . . . . . . . . . . . . . . . . . . . . . . . . . . . . . . . . . 9.82014 . . . . . . . . . . . . . . . . . . . . . . . . . . . . . . . . . . . . . . . . . . . . . . . . . . . . . . . . . . . . . . . . . . . . . . 406.12015 . . . . . . . . . . . . . . . . . . . . . . . . . . . . . . . . . . . . . . . . . . . . . . . . . . . . . . . . . . . . . . . . . . . . . . 102.8Thereafter . . . . . . . . . . . . . . . . . . . . . . . . . . . . . . . . . . . . . . . . . . . . . . . . . . . . . . . . . . . . . . . . . . . 1,056.9
Total future maturities of the long-term debt . . . . . . . . . . . . . . . . . . . . . . . . . . . . . . . . . . . . . . . . . . . . . $1,583.7
10. Income Taxes
Income Tax Expense
Our income tax expense (benefit) was as follows:For the year ended
December 31,
2010 2009 2008
(in millions)Current income taxes:
U.S. federal . . . . . . . . . . . . . . . . . . . . . . . . . . . . . . . . . . . . . . . . . . . . . . . . . . . . . . . $ 74.1 $ 97.7 $118.9State and foreign . . . . . . . . . . . . . . . . . . . . . . . . . . . . . . . . . . . . . . . . . . . . . . . . . . . . 34.2 19.4 (4.0)
Total current income taxes . . . . . . . . . . . . . . . . . . . . . . . . . . . . . . . . . . . . . . . . . . . . . . . . 108.3 117.1 114.9Deferred income taxes . . . . . . . . . . . . . . . . . . . . . . . . . . . . . . . . . . . . . . . . . . . . . . . . . . 15.8 (17.0) (119.4)
Total income taxes (benefits) . . . . . . . . . . . . . . . . . . . . . . . . . . . . . . . . . . . . . . . . . . . . . . $124.1 $ 100.1 $ (4.5)
131

Principal Financial Group, Inc.
Notes to Consolidated Financial Statements — (continued)
10. Income Taxes — (continued)
Effective Income Tax Rate
Our provision for income taxes may not have the customary relationship of taxes to income. A reconciliationbetween the U.S. corporate income tax rate and the effective income tax rate is as follows:
For the year endedDecember 31,
2010 2009 2008
U.S. corporate income tax rate . . . . . . . . . . . . . . . . . . . . . . . . . . . . . . . . . . . . . . . . . . . . . . . . . 35% 35% 35%Dividends received deduction . . . . . . . . . . . . . . . . . . . . . . . . . . . . . . . . . . . . . . . . . . . . . . . . . (10) (10) (18)Impact of equity method presentation . . . . . . . . . . . . . . . . . . . . . . . . . . . . . . . . . . . . . . . . . . . . (6) (5) (7)Interest exclusion from taxable income . . . . . . . . . . . . . . . . . . . . . . . . . . . . . . . . . . . . . . . . . . . . (3) (3) (6)Other . . . . . . . . . . . . . . . . . . . . . . . . . . . . . . . . . . . . . . . . . . . . . . . . . . . . . . . . . . . . . . . . (1) (4) (5)
Effective income tax rate . . . . . . . . . . . . . . . . . . . . . . . . . . . . . . . . . . . . . . . . . . . . . . . . . . . . 15% 13% (1)%
Unrecognized Tax Benefits
A summary of the changes in unrecognized tax benefits follows.For the year
endedDecember 31,
2010 2009
(in millions)Balance at beginning of year . . . . . . . . . . . . . . . . . . . . . . . . . . . . . . . . . . . . . . . . . . . . . . . . . . . $54.5 $62.9
Additions based on tax positions related to the current year . . . . . . . . . . . . . . . . . . . . . . . . . . . . . . 1.5 1.6Additions for tax positions of prior years . . . . . . . . . . . . . . . . . . . . . . . . . . . . . . . . . . . . . . . . . . 1.2 3.3Reductions for tax positions related to the current year . . . . . . . . . . . . . . . . . . . . . . . . . . . . . . . . . (2.4) (8.2)Reductions for tax positions of prior years . . . . . . . . . . . . . . . . . . . . . . . . . . . . . . . . . . . . . . . . . — (1.6)Settlements . . . . . . . . . . . . . . . . . . . . . . . . . . . . . . . . . . . . . . . . . . . . . . . . . . . . . . . . . . . . . — (3.5)
Balance at end of year (1) . . . . . . . . . . . . . . . . . . . . . . . . . . . . . . . . . . . . . . . . . . . . . . . . . . . . . $54.8 $54.5
(1) Of this amount, $22.3 million, if recognized, would reduce the 2010 effective income tax rate. We recognize interest and penaltiesrelated to uncertain tax positions in operating expenses.
As of December 31, 2010 and 2009, we had recognized $23.4 million and $22.5 million of accumulated pre-taxinterest and penalties related to unrecognized tax benefits, respectively.
Net Deferred Income Taxes
Significant components of our net deferred income taxes were as follows:December 31,
2010 2009
(in millions)Deferred income tax assets:
Net unrealized losses on available-for-sale securities . . . . . . . . . . . . . . . . . . . . . . . . . . . . . . . . . $ — $ 403.0Insurance liabilities . . . . . . . . . . . . . . . . . . . . . . . . . . . . . . . . . . . . . . . . . . . . . . . . . . . . . . 328.5 318.0Net operating and capital loss carryforwards . . . . . . . . . . . . . . . . . . . . . . . . . . . . . . . . . . . . . . 326.4 355.7Postretirement benefits . . . . . . . . . . . . . . . . . . . . . . . . . . . . . . . . . . . . . . . . . . . . . . . . . . . . 327.8 331.8Stock-based compensation . . . . . . . . . . . . . . . . . . . . . . . . . . . . . . . . . . . . . . . . . . . . . . . . . . 71.0 60.4Other deferred income tax assets . . . . . . . . . . . . . . . . . . . . . . . . . . . . . . . . . . . . . . . . . . . . . 82.6 62.6
Gross deferred income tax assets . . . . . . . . . . . . . . . . . . . . . . . . . . . . . . . . . . . . . . . . . . . . 1,136.3 1,531.5Valuation allowance . . . . . . . . . . . . . . . . . . . . . . . . . . . . . . . . . . . . . . . . . . . . . . . . . . . . (1.0) (1.0)
Total deferred income tax assets . . . . . . . . . . . . . . . . . . . . . . . . . . . . . . . . . . . . . . . . . . . . 1,135.3 1,530.5Deferred income tax liabilities:
Deferred policy acquisition costs . . . . . . . . . . . . . . . . . . . . . . . . . . . . . . . . . . . . . . . . . . . . . . (1,084.6) (983.9)Net unrealized gains on available-for-sale securities . . . . . . . . . . . . . . . . . . . . . . . . . . . . . . . . . . (188.6) —Real estate . . . . . . . . . . . . . . . . . . . . . . . . . . . . . . . . . . . . . . . . . . . . . . . . . . . . . . . . . . . (115.6) (105.6)Intangible assets . . . . . . . . . . . . . . . . . . . . . . . . . . . . . . . . . . . . . . . . . . . . . . . . . . . . . . . . (108.1) (102.0)Other deferred income tax liabilities . . . . . . . . . . . . . . . . . . . . . . . . . . . . . . . . . . . . . . . . . . . (35.3) (40.3)
Total deferred income tax liabilities . . . . . . . . . . . . . . . . . . . . . . . . . . . . . . . . . . . . . . . . . . (1,532.2) (1,231.8)
Total net deferred income tax assets (liabilities) . . . . . . . . . . . . . . . . . . . . . . . . . . . . . . . . . . . . . . $ (396.9) $ 298.7
132
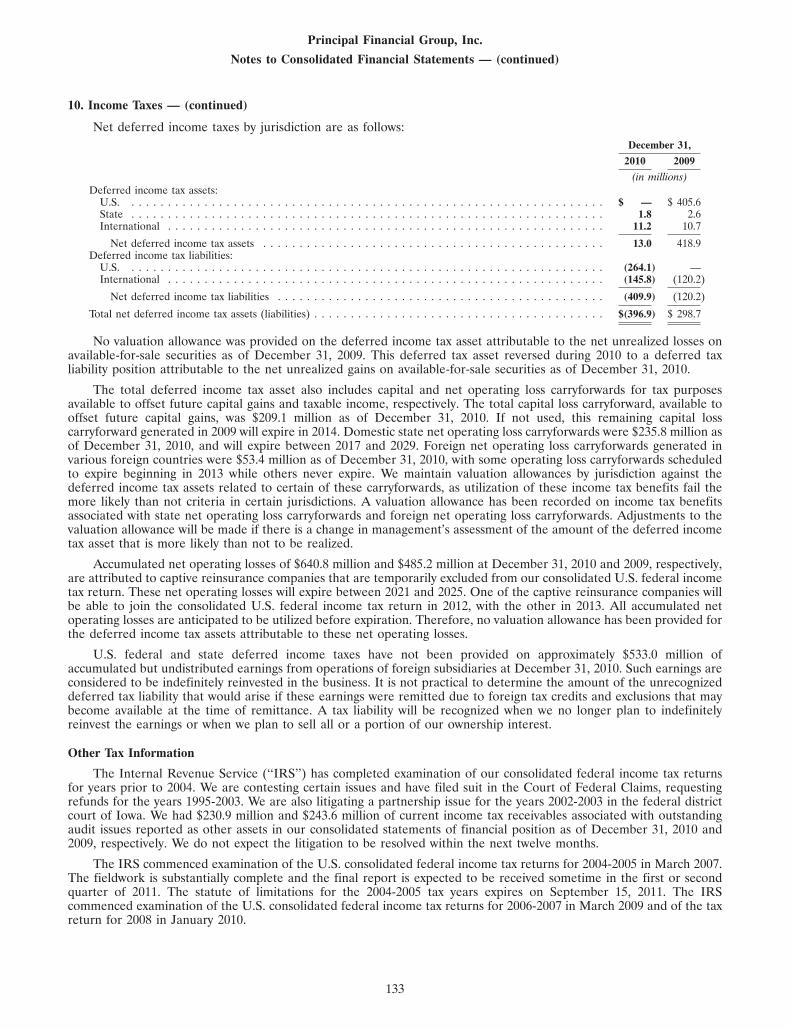
Principal Financial Group, Inc.
Notes to Consolidated Financial Statements — (continued)
10. Income Taxes — (continued)
Net deferred income taxes by jurisdiction are as follows:December 31,
2010 2009
(in millions)Deferred income tax assets:
U.S. . . . . . . . . . . . . . . . . . . . . . . . . . . . . . . . . . . . . . . . . . . . . . . . . . . . . . . . . . . . . . . . . . $ — $ 405.6State . . . . . . . . . . . . . . . . . . . . . . . . . . . . . . . . . . . . . . . . . . . . . . . . . . . . . . . . . . . . . . . . . 1.8 2.6International . . . . . . . . . . . . . . . . . . . . . . . . . . . . . . . . . . . . . . . . . . . . . . . . . . . . . . . . . . . . 11.2 10.7
Net deferred income tax assets . . . . . . . . . . . . . . . . . . . . . . . . . . . . . . . . . . . . . . . . . . . . . . . 13.0 418.9Deferred income tax liabilities:
U.S. . . . . . . . . . . . . . . . . . . . . . . . . . . . . . . . . . . . . . . . . . . . . . . . . . . . . . . . . . . . . . . . . . (264.1) —International . . . . . . . . . . . . . . . . . . . . . . . . . . . . . . . . . . . . . . . . . . . . . . . . . . . . . . . . . . . . (145.8) (120.2)
Net deferred income tax liabilities . . . . . . . . . . . . . . . . . . . . . . . . . . . . . . . . . . . . . . . . . . . . . (409.9) (120.2)
Total net deferred income tax assets (liabilities) . . . . . . . . . . . . . . . . . . . . . . . . . . . . . . . . . . . . . . . . $(396.9) $ 298.7
No valuation allowance was provided on the deferred income tax asset attributable to the net unrealized losses onavailable-for-sale securities as of December 31, 2009. This deferred tax asset reversed during 2010 to a deferred taxliability position attributable to the net unrealized gains on available-for-sale securities as of December 31, 2010.
The total deferred income tax asset also includes capital and net operating loss carryforwards for tax purposesavailable to offset future capital gains and taxable income, respectively. The total capital loss carryforward, available tooffset future capital gains, was $209.1 million as of December 31, 2010. If not used, this remaining capital losscarryforward generated in 2009 will expire in 2014. Domestic state net operating loss carryforwards were $235.8 million asof December 31, 2010, and will expire between 2017 and 2029. Foreign net operating loss carryforwards generated invarious foreign countries were $53.4 million as of December 31, 2010, with some operating loss carryforwards scheduledto expire beginning in 2013 while others never expire. We maintain valuation allowances by jurisdiction against thedeferred income tax assets related to certain of these carryforwards, as utilization of these income tax benefits fail themore likely than not criteria in certain jurisdictions. A valuation allowance has been recorded on income tax benefitsassociated with state net operating loss carryforwards and foreign net operating loss carryforwards. Adjustments to thevaluation allowance will be made if there is a change in management’s assessment of the amount of the deferred incometax asset that is more likely than not to be realized.
Accumulated net operating losses of $640.8 million and $485.2 million at December 31, 2010 and 2009, respectively,are attributed to captive reinsurance companies that are temporarily excluded from our consolidated U.S. federal incometax return. These net operating losses will expire between 2021 and 2025. One of the captive reinsurance companies willbe able to join the consolidated U.S. federal income tax return in 2012, with the other in 2013. All accumulated netoperating losses are anticipated to be utilized before expiration. Therefore, no valuation allowance has been provided forthe deferred income tax assets attributable to these net operating losses.
U.S. federal and state deferred income taxes have not been provided on approximately $533.0 million ofaccumulated but undistributed earnings from operations of foreign subsidiaries at December 31, 2010. Such earnings areconsidered to be indefinitely reinvested in the business. It is not practical to determine the amount of the unrecognizeddeferred tax liability that would arise if these earnings were remitted due to foreign tax credits and exclusions that maybecome available at the time of remittance. A tax liability will be recognized when we no longer plan to indefinitelyreinvest the earnings or when we plan to sell all or a portion of our ownership interest.
Other Tax Information
The Internal Revenue Service (‘‘IRS’’) has completed examination of our consolidated federal income tax returnsfor years prior to 2004. We are contesting certain issues and have filed suit in the Court of Federal Claims, requestingrefunds for the years 1995-2003. We are also litigating a partnership issue for the years 2002-2003 in the federal districtcourt of Iowa. We had $230.9 million and $243.6 million of current income tax receivables associated with outstandingaudit issues reported as other assets in our consolidated statements of financial position as of December 31, 2010 and2009, respectively. We do not expect the litigation to be resolved within the next twelve months.
The IRS commenced examination of the U.S. consolidated federal income tax returns for 2004-2005 in March 2007.The fieldwork is substantially complete and the final report is expected to be received sometime in the first or secondquarter of 2011. The statute of limitations for the 2004-2005 tax years expires on September 15, 2011. The IRScommenced examination of the U.S. consolidated federal income tax returns for 2006-2007 in March 2009 and of the taxreturn for 2008 in January 2010.
133
Principal Financial Group, Inc.
Notes to Consolidated Financial Statements — (continued)
10. Income Taxes — (continued)
We do not believe there is a reasonable possibility that the total amount of unrecognized tax benefits willsignificantly increase or decrease in the next twelve months. We believe that we have adequate defenses against, orsufficient provisions for, the contested issues, but final resolution of the contested issues could take several years whilelegal remedies are pursued. Consequently, we do not expect the ultimate resolution of issues from tax years 1995 — 2003to have a material impact on our net income. Similarly, we believe there are adequate defenses against, or sufficientprovisions for, any challenges that might arise in tax years subsequent to 2003.
11. Employee and Agent Benefits
We have defined benefit pension plans covering substantially all of our U.S. employees and certain agents. Some ofthese plans provide supplemental pension benefits to employees and agents with salaries and/or pension benefits inexcess of the qualified plan limits imposed by federal tax law. The employees and agents are generally first eligible for thepension plans when they reach age 21. For plan participants employed prior to January 1, 2002, the pension benefits arebased on the greater of a final average pay benefit or a cash balance benefit. The final average pay benefit is based on theyears of service and generally the employee’s or agent’s average annual compensation during the last five years ofemployment. Partial benefit accrual of final average pay benefits is recognized from first eligibility until retirement basedon attained service divided by potential service to age 65 with a minimum of 35 years of potential service. The cashbalance portion of the plan started on January 1, 2002. An employee’s account is credited with an amount based on theemployee’s salary, age and service. These credits accrue with interest. For plan participants hired on and after January 1,2002, only the cash balance plan applies. Our policy is to fund the cost of providing pension benefits in the years that theemployees and agents are providing service to us. Our funding policy for the qualified defined benefit plan is tocontribute an amount annually at least equal to the minimum annual contribution required under the EmployeeRetirement Income Security Act (‘‘ERISA’’), and, generally, not greater than the maximum amount that can be deductedfor federal income tax purposes. Our funding policy for the nonqualified benefit plan is to fund the plan in the years thatthe employees are providing service, taking into account the funded status of the trust. While we designate assets to coverthe computed liability of the nonqualified plan, the assets are not included as part of the asset balances presented in thisfootnote as they do not qualify as plan assets in accordance with U.S. GAAP.
We also provide certain health care, life insurance and long-term care benefits for retired employees. Subsidizedretiree health benefits are provided for employees hired prior to January 1, 2002. Employees hired after December 31,2001, have access to retiree health benefits but it is intended that they pay for the full cost of the coverage. The healthcare plans are contributory with participants’ contributions adjusted annually. The contributions are based on the numberof years of service and age at retirement for those hired prior to January 1, 2002, who retired prior to January 1, 2011. Foremployees hired prior to January 1, 2002, who retire on or after January 1, 2011, the contributions are 60% of theexpected cost. As part of the substantive plan, the retiree health contributions are assumed to be adjusted in the future asclaim levels change. The life insurance plans are contributory for a small group of previously grandfathered participantsthat have elected supplemental coverage and dependent coverage.
Covered employees are first eligible for the health and life postretirement benefits when they reach age 57 and havecompleted ten years of service with us. Retiree long-term care benefits are provided for employees whose retirement waseffective prior to July 1, 2000. Our policy is to fund the cost of providing retiree benefits in the years that the employeesare providing service, taking into account the funded status of the trust.
134

Principal Financial Group, Inc.
Notes to Consolidated Financial Statements — (continued)
11. Employee and Agent Benefits — (continued)
Obligations and Funded Status
The plans’ combined funded status, reconciled to amounts recognized in the consolidated statements of financialposition and consolidated statements of operations, was as follows:
Otherpostretirement
Pension benefits benefits
December 31, December 31,
2010 2009 2010 2009
(in millions)Change in benefit obligationBenefit obligation at beginning of year . . . . . . . . . . . . . . . . . . . . . . . . . . . . . . . . . . . . $(1,797.4) $(1,712.1) $(360.1) $(335.0)Service cost . . . . . . . . . . . . . . . . . . . . . . . . . . . . . . . . . . . . . . . . . . . . . . . . . . . . . (45.6) (51.4) (8.8) (11.3)Interest cost . . . . . . . . . . . . . . . . . . . . . . . . . . . . . . . . . . . . . . . . . . . . . . . . . . . . (105.7) (100.8) (18.1) (19.7)Actuarial gain (loss) . . . . . . . . . . . . . . . . . . . . . . . . . . . . . . . . . . . . . . . . . . . . . . . (59.6) (26.8) 62.5 (2.8)Participant contributions . . . . . . . . . . . . . . . . . . . . . . . . . . . . . . . . . . . . . . . . . . . . . — — (6.0) (5.5)Benefits paid . . . . . . . . . . . . . . . . . . . . . . . . . . . . . . . . . . . . . . . . . . . . . . . . . . . . 70.2 72.8 15.3 15.0Amount recognized due to special events . . . . . . . . . . . . . . . . . . . . . . . . . . . . . . . . . . — — (0.2) —Plan amendment . . . . . . . . . . . . . . . . . . . . . . . . . . . . . . . . . . . . . . . . . . . . . . . . . — — 153.6 —Other . . . . . . . . . . . . . . . . . . . . . . . . . . . . . . . . . . . . . . . . . . . . . . . . . . . . . . . . 4.3 20.9 (0.8) (0.8)
Benefit obligation at end of year . . . . . . . . . . . . . . . . . . . . . . . . . . . . . . . . . . . . . . . $(1,933.8) $(1,797.4) $(162.6) $(360.1)
Change in plan assetsFair value of plan assets at beginning of year . . . . . . . . . . . . . . . . . . . . . . . . . . . . . . . . $ 1,250.3 $ 1,010.5 $ 421.5 $ 362.0Actual return on plan assets . . . . . . . . . . . . . . . . . . . . . . . . . . . . . . . . . . . . . . . . . . 181.1 217.0 58.1 68.3Employer contribution . . . . . . . . . . . . . . . . . . . . . . . . . . . . . . . . . . . . . . . . . . . . . . 56.5 95.6 1.4 0.7Participant contributions . . . . . . . . . . . . . . . . . . . . . . . . . . . . . . . . . . . . . . . . . . . . . — — 6.0 5.5Benefits paid . . . . . . . . . . . . . . . . . . . . . . . . . . . . . . . . . . . . . . . . . . . . . . . . . . . . (70.2) (72.8) (15.3) (15.0)
Fair value of plan assets at end of year . . . . . . . . . . . . . . . . . . . . . . . . . . . . . . . . . . . $ 1,417.7 $ 1,250.3 $ 471.7 $ 421.5
Amount recognized in statement of financial positionOther assets . . . . . . . . . . . . . . . . . . . . . . . . . . . . . . . . . . . . . . . . . . . . . . . . . . . . $ — $ — $ 309.4 $ 78.4Other liabilities . . . . . . . . . . . . . . . . . . . . . . . . . . . . . . . . . . . . . . . . . . . . . . . . . . (516.1) (547.1) (0.3) (17.0)
Total . . . . . . . . . . . . . . . . . . . . . . . . . . . . . . . . . . . . . . . . . . . . . . . . . . . . . . . . . $ (516.1) $ (547.1) $ 309.1 $ 61.4
Amount recognized in accumulated other comprehensive (income) lossTotal net actuarial loss . . . . . . . . . . . . . . . . . . . . . . . . . . . . . . . . . . . . . . . . . . . . . . $ 469.7 $ 564.9 $ 10.2 $ 104.1Prior service benefit . . . . . . . . . . . . . . . . . . . . . . . . . . . . . . . . . . . . . . . . . . . . . . . (41.6) (52.7) (148.8) (6.8)
Pre-tax accumulated other comprehensive (income) loss . . . . . . . . . . . . . . . . . . . . . . . . . $ 428.1 $ 512.2 $(138.6) $ 97.3
The accumulated benefit obligation for all defined benefit pension plans was $1,811.7 million and $1,640.5 million atDecember 31, 2010 and 2009, respectively.
Employer contributions to the pension plans include contributions made directly to the qualified pension plan assetsand contributions from corporate assets to pay nonqualified pension benefits. Benefits paid from the pension plansinclude both qualified and nonqualified plan benefits. Nonqualified pension plan assets are not included as part of theasset balances presented in this footnote. The nonqualified pension plan assets are held in Rabbi trusts for the benefit ofall nonqualified plan participants. The assets held in a Rabbi trust are available to satisfy the claims of general creditorsonly in the event of bankruptcy. Therefore, these assets are fully consolidated in our consolidated statements of financialposition and are not reflected in our funded status as they do not qualify as plan assets under U.S. GAAP. The marketvalue of assets held in these trusts was $265.3 million and $245.1 million as of December 31, 2010 and 2009, respectively.
Pension Plan Changes and Plan Gains/Losses
On January 1, 2010, benefits under the Principal Pension Plan are frozen for certain participants. This change wasrecognized as a prior service cost and resulted in a decrease in liabilities as of December 31, 2009.
For the year ended December 31, 2010, the pension plans had a loss primarily due to a decrease in the discount rateand a change in the mortality assumption. The plans also had a gain resulting from asset returns greater than expected.The net result was an actuarial gain for the year ended December 31, 2010. For the year ended December 31, 2009, thepension plans had an actuarial loss primarily due to a greater than expected cost of living adjustment and greater numberof early retirements.
135
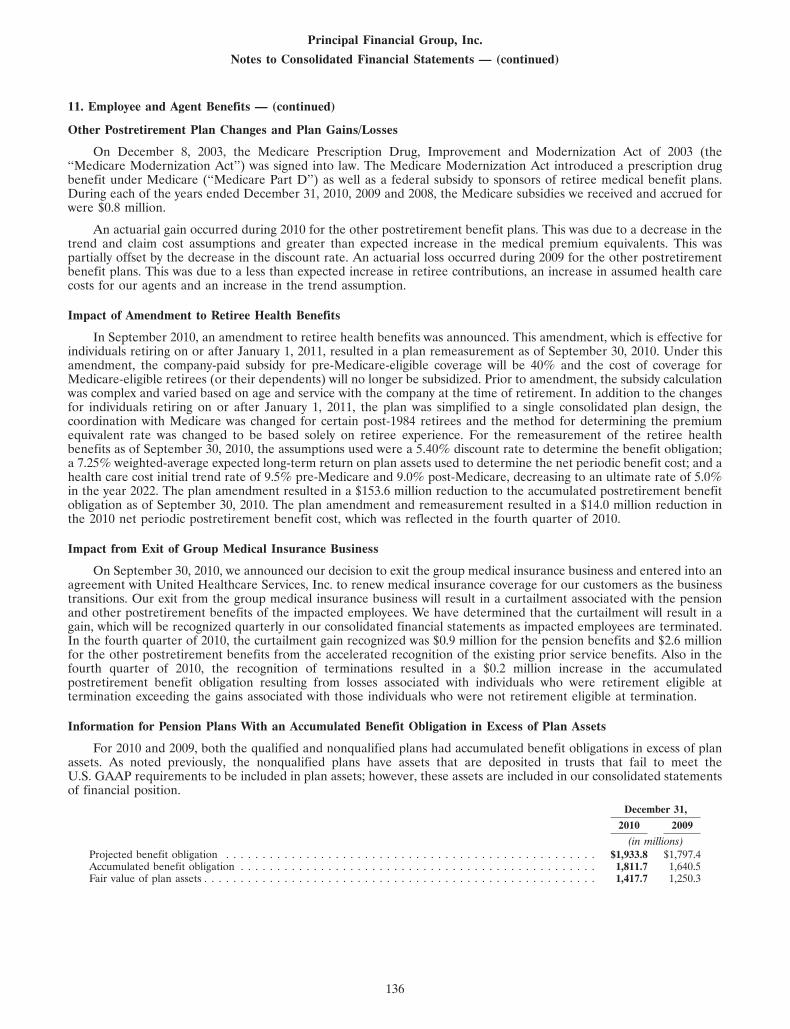
Principal Financial Group, Inc.
Notes to Consolidated Financial Statements — (continued)
11. Employee and Agent Benefits — (continued)
Other Postretirement Plan Changes and Plan Gains/Losses
On December 8, 2003, the Medicare Prescription Drug, Improvement and Modernization Act of 2003 (the‘‘Medicare Modernization Act’’) was signed into law. The Medicare Modernization Act introduced a prescription drugbenefit under Medicare (‘‘Medicare Part D’’) as well as a federal subsidy to sponsors of retiree medical benefit plans.During each of the years ended December 31, 2010, 2009 and 2008, the Medicare subsidies we received and accrued forwere $0.8 million.
An actuarial gain occurred during 2010 for the other postretirement benefit plans. This was due to a decrease in thetrend and claim cost assumptions and greater than expected increase in the medical premium equivalents. This waspartially offset by the decrease in the discount rate. An actuarial loss occurred during 2009 for the other postretirementbenefit plans. This was due to a less than expected increase in retiree contributions, an increase in assumed health carecosts for our agents and an increase in the trend assumption.
Impact of Amendment to Retiree Health Benefits
In September 2010, an amendment to retiree health benefits was announced. This amendment, which is effective forindividuals retiring on or after January 1, 2011, resulted in a plan remeasurement as of September 30, 2010. Under thisamendment, the company-paid subsidy for pre-Medicare-eligible coverage will be 40% and the cost of coverage forMedicare-eligible retirees (or their dependents) will no longer be subsidized. Prior to amendment, the subsidy calculationwas complex and varied based on age and service with the company at the time of retirement. In addition to the changesfor individuals retiring on or after January 1, 2011, the plan was simplified to a single consolidated plan design, thecoordination with Medicare was changed for certain post-1984 retirees and the method for determining the premiumequivalent rate was changed to be based solely on retiree experience. For the remeasurement of the retiree healthbenefits as of September 30, 2010, the assumptions used were a 5.40% discount rate to determine the benefit obligation;a 7.25% weighted-average expected long-term return on plan assets used to determine the net periodic benefit cost; and ahealth care cost initial trend rate of 9.5% pre-Medicare and 9.0% post-Medicare, decreasing to an ultimate rate of 5.0%in the year 2022. The plan amendment resulted in a $153.6 million reduction to the accumulated postretirement benefitobligation as of September 30, 2010. The plan amendment and remeasurement resulted in a $14.0 million reduction inthe 2010 net periodic postretirement benefit cost, which was reflected in the fourth quarter of 2010.
Impact from Exit of Group Medical Insurance Business
On September 30, 2010, we announced our decision to exit the group medical insurance business and entered into anagreement with United Healthcare Services, Inc. to renew medical insurance coverage for our customers as the businesstransitions. Our exit from the group medical insurance business will result in a curtailment associated with the pensionand other postretirement benefits of the impacted employees. We have determined that the curtailment will result in again, which will be recognized quarterly in our consolidated financial statements as impacted employees are terminated.In the fourth quarter of 2010, the curtailment gain recognized was $0.9 million for the pension benefits and $2.6 millionfor the other postretirement benefits from the accelerated recognition of the existing prior service benefits. Also in thefourth quarter of 2010, the recognition of terminations resulted in a $0.2 million increase in the accumulatedpostretirement benefit obligation resulting from losses associated with individuals who were retirement eligible attermination exceeding the gains associated with those individuals who were not retirement eligible at termination.
Information for Pension Plans With an Accumulated Benefit Obligation in Excess of Plan Assets
For 2010 and 2009, both the qualified and nonqualified plans had accumulated benefit obligations in excess of planassets. As noted previously, the nonqualified plans have assets that are deposited in trusts that fail to meet theU.S. GAAP requirements to be included in plan assets; however, these assets are included in our consolidated statementsof financial position.
December 31,
2010 2009
(in millions)Projected benefit obligation . . . . . . . . . . . . . . . . . . . . . . . . . . . . . . . . . . . . . . . . . . . . . . . . . . . $1,933.8 $1,797.4Accumulated benefit obligation . . . . . . . . . . . . . . . . . . . . . . . . . . . . . . . . . . . . . . . . . . . . . . . . . 1,811.7 1,640.5Fair value of plan assets . . . . . . . . . . . . . . . . . . . . . . . . . . . . . . . . . . . . . . . . . . . . . . . . . . . . . . 1,417.7 1,250.3
136

Principal Financial Group, Inc.
Notes to Consolidated Financial Statements — (continued)
11. Employee and Agent Benefits — (continued)
Information for Other Postretirement Benefit Plans With an Accumulated Postretirement Benefit Obligation inExcess of Plan Assets
December 31,
2010 2009
(in millions)Accumulated postretirement benefit obligation . . . . . . . . . . . . . . . . . . . . . . . . . . . . . . . . . . . . . . . . . . $1.5 $98.7Fair value of plan assets . . . . . . . . . . . . . . . . . . . . . . . . . . . . . . . . . . . . . . . . . . . . . . . . . . . . . . . . 1.4 81.7
Components of Net Periodic Benefit Cost
Other postretirementPension benefits benefits
For the year ended December 31,
2010 2009 2008 2010 2009 2008
(in millions)Service cost . . . . . . . . . . . . . . . . . . . . . . . . . . . . . . . . . . . . . . . $ 45.6 $ 51.4 $ 62.0 $ 8.8 $ 11.3 $ 10.5Interest cost . . . . . . . . . . . . . . . . . . . . . . . . . . . . . . . . . . . . . . . 105.7 100.8 124.3 18.1 19.7 20.9Expected return on plan assets . . . . . . . . . . . . . . . . . . . . . . . . . . . (98.4) (79.5) (162.8) (30.6) (25.9) (46.9)Amortization of prior service benefit . . . . . . . . . . . . . . . . . . . . . . . (10.1) (7.7) (9.6) (9.1) (2.1) (3.1)Recognized net actuarial (gain) loss . . . . . . . . . . . . . . . . . . . . . . . . 67.6 92.6 1.5 4.1 9.3 (4.0)Amount recognized due to special events . . . . . . . . . . . . . . . . . . . . (0.9) — — (2.6) — —
Net periodic benefit cost (income) . . . . . . . . . . . . . . . . . . . . . . . . $109.5 $157.6 $ 15.4 $(11.3) $ 12.3 $(22.6)
For 2008, 2009 and 2010, we used a December 31 measurement date in connection with our adoption of requiredmeasurement date guidance. Net periodic benefit cost shown above for 2008 covers the period of 15 months fromOctober 1, 2007, through December 31, 2008. Net periodic benefit cost for the period from October 1, 2007, toDecember 31, 2007, was recognized as a direct adjustment to retained earnings during 2008 as required by themeasurement date guidance. The breakdown of 2008 net periodic benefit cost between the two periods was as follows:
Otherpostretirement
Pension benefits benefits
10/1/07- 1/1/08- 10/1/07- 1/1/08-12/31/07 12/31/08 Total 12/31/07 12/31/08 Total
(in millions)Net periodic benefit cost (income) . . . . . . . . . . . . . . . . . . . $3.1 $12.3 $15.4 $(4.5) $(18.1) $(22.6)
The pension plans’ actuarial gains and losses are amortized using a straight-line amortization method over theaverage remaining service period of plan participants. For the qualified pension plan, gains and losses are amortizedwithout use of the 10% allowable corridor. For the nonqualified pension plans and other postretirement benefit plans,the corridors allowed are used.
OtherPension postretirementbenefits benefits
For the year ended December 31,
2010 2009 2010 2009
(in millions)Other changes recognized in accumulated other comprehensive (income) lossNet actuarial gain . . . . . . . . . . . . . . . . . . . . . . . . . . . . . . . . . . . . . . . . . . . . . . . $(27.5) $(110.7) $ (89.8) $(39.6)Prior service benefit . . . . . . . . . . . . . . . . . . . . . . . . . . . . . . . . . . . . . . . . . . . . . — (20.9) (153.7) —Amortization of net loss . . . . . . . . . . . . . . . . . . . . . . . . . . . . . . . . . . . . . . . . . . . (67.6) (92.6) (4.1) (9.3)Amortization of prior service benefit . . . . . . . . . . . . . . . . . . . . . . . . . . . . . . . . . . . 11.0 7.7 11.7 2.1
Total recognized in pre-tax accumulated other comprehensive income . . . . . . . . . . . . . . $(84.1) $(216.5) $(235.9) $(46.8)
Total recognized in net periodic benefit cost and pre-tax accumulated other comprehensive(income) loss . . . . . . . . . . . . . . . . . . . . . . . . . . . . . . . . . . . . . . . . . . . . . . . . $ 25.4 $ (58.9) $(247.2) $(34.5)
Net actuarial (gain) loss and net prior service cost benefit have been recognized in AOCI.
137

Principal Financial Group, Inc.
Notes to Consolidated Financial Statements — (continued)
11. Employee and Agent Benefits — (continued)
The estimated net actuarial (gain) loss and prior service cost (benefit) that will be amortized from AOCI into netperiodic benefit cost for the pension benefits during the 2011 fiscal year are $62.8 million and $(9.8) million, respectively.The estimated net actuarial (gain) loss and prior service cost (benefit) for the postretirement benefits that will beamortized from AOCI into net periodic benefit cost during the 2011 fiscal year are $0.4 million and $(29.7) million,respectively. The estimated amortization of net actuarial (gain) loss does not reflect future curtailment recognition.
Assumptions
Weighted-average assumptions used to determine benefit obligations as disclosed under the Obligations and Funded Statussection
OtherPension postretirementbenefits benefits
For the year endedDecember 31,
2010 2009 2010 2009
Discount rate . . . . . . . . . . . . . . . . . . . . . . . . . . . . . . . . . . . . . . . . . . . . . . . . . . . . 5.65% 6.00% 5.65% 6.00%Rate of compensation increase . . . . . . . . . . . . . . . . . . . . . . . . . . . . . . . . . . . . . . . . . 5.00% 5.00% 5.00% 5.00%
Weighted-average assumptions used to determine net periodic benefit cost
Otherpostretirement
Pension benefits benefits
For the year ended December 31,
2010 2009 2008 2010 2009 2008
Discount rate . . . . . . . . . . . . . . . . . . . . . . . . . . . . . . . . . . . . . . . . . . . . 6.00% 6.00% 6.30% 6.00% 6.00% 6.30%Expected long-term return on plan assets . . . . . . . . . . . . . . . . . . . . . . . . . . . 8.00% 8.00% 8.25% 7.30% 7.30% 7.30%Rate of compensation increase . . . . . . . . . . . . . . . . . . . . . . . . . . . . . . . . . 5.00% 5.00% 5.00% 5.00% 5.00% 5.00%
For the pension benefits, the expected return on plan assets is the long-term rate we expect to be earned based onthe plans’ investment strategy. Historical and expected future returns of multiple asset classes were analyzed to develop arisk free rate of return and risk premiums for each asset class. The overall rate for each asset class was developed bycombining a long-term inflation component, the risk free real rate of return and the associated risk premium. A weightedaverage rate was developed based on those overall rates and the target asset allocation of the plans.
For other postretirement benefits, the 7.3% expected long-term return on plan assets for 2010 is based on theweighted average expected long-term asset returns for the medical, life and long-term care plans. The expected long-termrates for the medical, life and long-term care plans are 7.25%, 7.75% and 5.85%, respectively.
Assumed Health Care Cost Trend Rates
December 31,
2010 2009
Health care cost trend rate assumed for next year under age 65 . . . . . . . . . . . . . . . . . . . . . . . . . . . . . . 9.5% 11.0%Health care cost trend rate assumed for next year age 65 and over . . . . . . . . . . . . . . . . . . . . . . . . . . . . . 9.0% 10.5%Rate to which the cost trend rate is assumed to decline (the ultimate trend rate) . . . . . . . . . . . . . . . . . . . . 5.0% 5.0%Year that the rate reaches the ultimate trend rate . . . . . . . . . . . . . . . . . . . . . . . . . . . . . . . . . . . . . . . 2022 2021
Assumed health care cost trend rates have a significant effect on the amounts reported for the health care plans. Aone-percentage-point change in assumed health care cost trend rates would have the following effects:
1-percentage- 1-percentage-point increase point decrease
(in millions)Effect on total of service cost and interest cost components . . . . . . . . . . . . . . . . . . . . . . . $ 4.2 $(3.4)Effect on accumulated postretirement benefit obligation . . . . . . . . . . . . . . . . . . . . . . . . . (9.4) 8.2
138

Principal Financial Group, Inc.
Notes to Consolidated Financial Statements — (continued)
11. Employee and Agent Benefits — (continued)
Pension Plan and Other Postretirement Benefit Plan Assets
Fair value is defined as the price that would be received to sell an asset in an orderly transaction between marketparticipants at the measurement date (an exit price). The fair value hierarchy prioritizes the inputs to valuationtechniques used to measure fair value into three levels.
• Level 1 — Fair values are based on unadjusted quoted prices in active markets for identical assets. Our Level 1assets include cash, fixed income investment funds and exchange traded equity securities.
• Level 2 — Fair values are based on inputs other than quoted prices within Level 1 that are observable for theasset, either directly or indirectly. Our Level 2 assets primarily include fixed income and equity investment funds.
• Level 3 — Fair values are based on significant unobservable inputs for the asset. Our Level 3 assets include a realestate investment fund and a Principal Life general account investment.
Our pension plan assets consist of investments in separate accounts. Net asset value (‘‘NAV’’) of the separateaccounts is calculated in a manner consistent with U.S. GAAP for investment companies and is determinative of their fairvalue. Several of the separate accounts invest in publicly quoted mutual funds or actively managed stocks. The fair valueof the underlying mutual funds or stock is used to determine the NAV of the separate account, which is not publiclyquoted. Some of the separate accounts also invest in fixed income securities. The fair value of the underlying securities isbased on quoted prices of similar assets and used to determine the NAV of the separate account. One separate accountinvests in real estate, for which the fair value of the underlying real estate is based on unobservable inputs and used todetermine the NAV of the separate account. The fair value of the underlying real estate is estimated using discountedcash flow valuation models that utilize public real estate market data inputs such as transaction prices, market rents,vacancy levels, leasing absorption, market cap rates and discount rates. In addition, each property is appraised annuallyby an independent appraiser.
Our other postretirement benefit plan assets consist of cash, investments in fixed income security portfolios andinvestments in equity security portfolios. Because of the nature of cash, its carrying amount approximates fair value. Thefair value of fixed income investment funds, U.S. equity portfolios and international equity portfolios is based on quotedprices in active markets for identical assets. The fair value of the Principal Life general account investment is the amountthe plan would receive if withdrawing funds from this participating contract. The amount that would be received iscalculated using a cash-out factor based on an associated pool of general account fixed income securities. The cash-outfactor is a ratio of the asset investment value of these securities to asset book value. As the investment values change, thecash-out factor is adjusted, impacting the amount the plan receives at measurement date. To determine investment valuefor each category of assets, we project cash flows. This is done using contractual provisions for the assets, with adjustmentfor expected prepayments and call provisions. Projected cash flows are discounted to present value for each assetcategory. Interest rates for discounting are based on current rates on similar new assets in the general account based onasset strategy.
139

Principal Financial Group, Inc.
Notes to Consolidated Financial Statements — (continued)
11. Employee and Agent Benefits — (continued)
Pension Plan Assets
The fair value of the qualified pension plan’s assets by asset category as of the most recent measurement date is asfollows:
As of December 31, 2010
Assets /(liabilities) Fair value hierarchy levelmeasured at fair
value Level 1 Level 2 Level 3
(in millions)Asset categoryU.S. large cap equity portfolios (1) . . . . . . . . . . . . . . . . . . . . . . . . . . . . $ 580.9 $ — $ 580.9 $ —U.S. small/mid cap equity portfolios (2) . . . . . . . . . . . . . . . . . . . . . . . . . 143.5 — 143.5 —International equity portfolios (3) . . . . . . . . . . . . . . . . . . . . . . . . . . . . 241.7 — 241.7 —Fixed income security portfolios (4) . . . . . . . . . . . . . . . . . . . . . . . . . . . 331.5 — 331.5 —Real estate investment portfolios:
Real estate investment trusts (5) . . . . . . . . . . . . . . . . . . . . . . . . . . . . 35.4 — 35.4 —Direct real estate investments (6) . . . . . . . . . . . . . . . . . . . . . . . . . . . 84.7 — — 84.7
Total . . . . . . . . . . . . . . . . . . . . . . . . . . . . . . . . . . . . . . . . . . . . . . . $1,417.7 $ — $1,333.0 $84.7
As of December 31, 2009
Assets /(liabilities) Fair value hierarchy levelmeasured at fair
value Level 1 Level 2 Level 3
(in millions)Asset categoryU.S. large cap equity portfolios (1) . . . . . . . . . . . . . . . . . . . . . . . . . . . . $ 555.5 $ — $ 555.5 $ —U.S. small/mid cap equity portfolios (2) . . . . . . . . . . . . . . . . . . . . . . . . . 103.6 — 103.6 —International equity portfolios (3) . . . . . . . . . . . . . . . . . . . . . . . . . . . . 215.5 — 215.5 —Fixed income security portfolios (4) . . . . . . . . . . . . . . . . . . . . . . . . . . . 288.3 — 288.3 —Real estate investment portfolios:
Real estate investment trusts (5) . . . . . . . . . . . . . . . . . . . . . . . . . . . . 33.4 — 33.4 —Direct real estate investments (6) . . . . . . . . . . . . . . . . . . . . . . . . . . . 54.0 — — 54.0
Total . . . . . . . . . . . . . . . . . . . . . . . . . . . . . . . . . . . . . . . . . . . . . . . $1,250.3 $ — $1,196.3 $54.0
(1) The portfolios invest primarily in publicly traded equity securities of large U.S. companies.
(2) The portfolios invest primarily in publicly traded equity securities of mid-sized and small U.S. companies.
(3) The portfolios invest primarily in publicly traded equity securities of non-U.S. companies.
(4) The portfolios invest in various fixed income securities, primarily of U.S. origin. These include, but are not limited to, corporatebonds, mortgage-backed securities, commercial mortgage-backed securities, U.S. Treasury securities, agency securities, asset-backedsecurities and collateralized mortgage obligations.
(5) The portfolio invests primarily in publicly traded securities of U.S. equity real estate investment trusts.
(6) The portfolio invests primarily in U.S. commercial real estate properties.
140
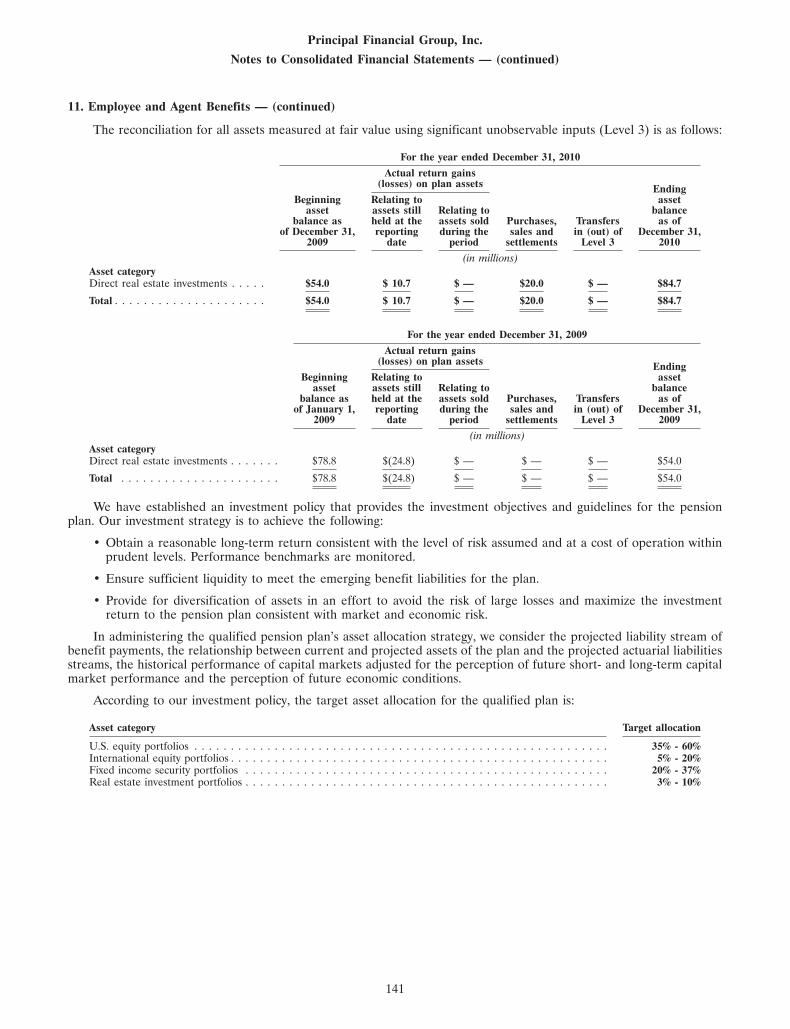
Principal Financial Group, Inc.
Notes to Consolidated Financial Statements — (continued)
11. Employee and Agent Benefits — (continued)
The reconciliation for all assets measured at fair value using significant unobservable inputs (Level 3) is as follows:
For the year ended December 31, 2010
Actual return gains(losses) on plan assets Ending
Beginning Relating to assetasset assets still Relating to balance
balance as held at the assets sold Purchases, Transfers as ofof December 31, reporting during the sales and in (out) of December 31,
2009 date period settlements Level 3 2010
(in millions)Asset categoryDirect real estate investments . . . . . $54.0 $ 10.7 $ — $20.0 $ — $84.7
Total . . . . . . . . . . . . . . . . . . . . . $54.0 $ 10.7 $ — $20.0 $ — $84.7
For the year ended December 31, 2009
Actual return gains(losses) on plan assets Ending
Beginning Relating to assetasset assets still Relating to balance
balance as held at the assets sold Purchases, Transfers as ofof January 1, reporting during the sales and in (out) of December 31,
2009 date period settlements Level 3 2009
(in millions)Asset categoryDirect real estate investments . . . . . . . $78.8 $(24.8) $ — $ — $ — $54.0
Total . . . . . . . . . . . . . . . . . . . . . . $78.8 $(24.8) $ — $ — $ — $54.0
We have established an investment policy that provides the investment objectives and guidelines for the pensionplan. Our investment strategy is to achieve the following:
• Obtain a reasonable long-term return consistent with the level of risk assumed and at a cost of operation withinprudent levels. Performance benchmarks are monitored.
• Ensure sufficient liquidity to meet the emerging benefit liabilities for the plan.
• Provide for diversification of assets in an effort to avoid the risk of large losses and maximize the investmentreturn to the pension plan consistent with market and economic risk.
In administering the qualified pension plan’s asset allocation strategy, we consider the projected liability stream ofbenefit payments, the relationship between current and projected assets of the plan and the projected actuarial liabilitiesstreams, the historical performance of capital markets adjusted for the perception of future short- and long-term capitalmarket performance and the perception of future economic conditions.
According to our investment policy, the target asset allocation for the qualified plan is:
Asset category Target allocation
U.S. equity portfolios . . . . . . . . . . . . . . . . . . . . . . . . . . . . . . . . . . . . . . . . . . . . . . . . . . . . . . . . . 35% - 60%International equity portfolios . . . . . . . . . . . . . . . . . . . . . . . . . . . . . . . . . . . . . . . . . . . . . . . . . . . . 5% - 20%Fixed income security portfolios . . . . . . . . . . . . . . . . . . . . . . . . . . . . . . . . . . . . . . . . . . . . . . . . . . 20% - 37%Real estate investment portfolios . . . . . . . . . . . . . . . . . . . . . . . . . . . . . . . . . . . . . . . . . . . . . . . . . . 3% - 10%
141
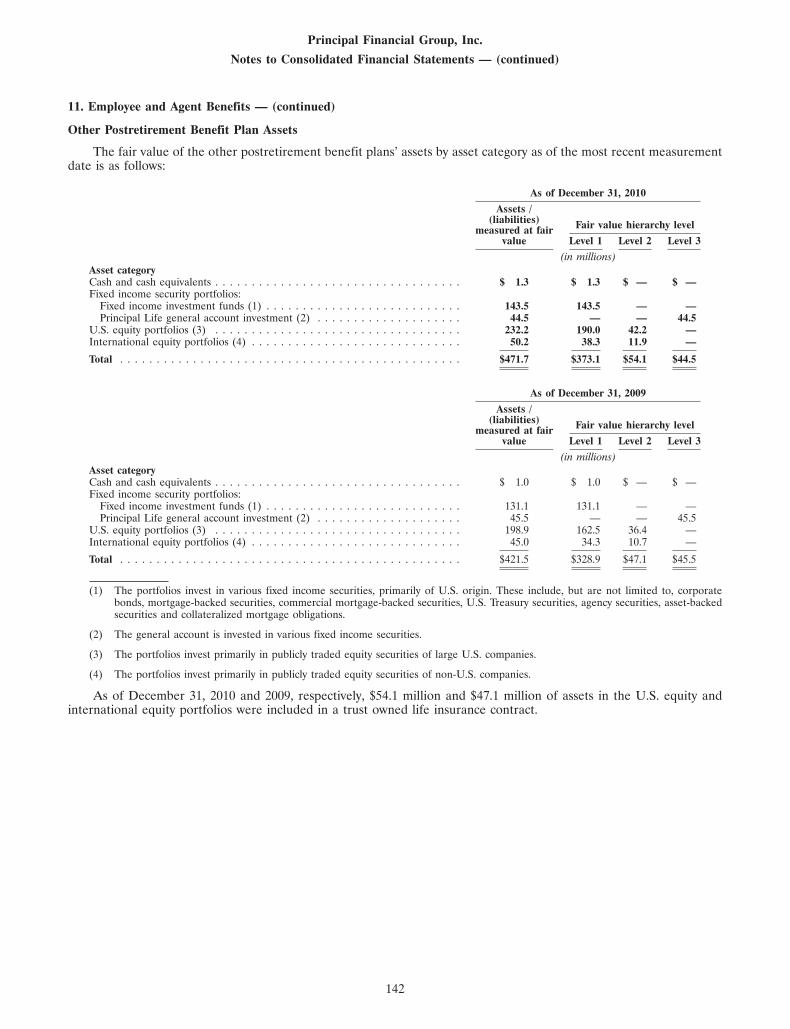
Principal Financial Group, Inc.
Notes to Consolidated Financial Statements — (continued)
11. Employee and Agent Benefits — (continued)
Other Postretirement Benefit Plan Assets
The fair value of the other postretirement benefit plans’ assets by asset category as of the most recent measurementdate is as follows:
As of December 31, 2010
Assets /(liabilities) Fair value hierarchy levelmeasured at fair
value Level 1 Level 2 Level 3
(in millions)Asset categoryCash and cash equivalents . . . . . . . . . . . . . . . . . . . . . . . . . . . . . . . . . . $ 1.3 $ 1.3 $ — $ —Fixed income security portfolios:
Fixed income investment funds (1) . . . . . . . . . . . . . . . . . . . . . . . . . . . 143.5 143.5 — —Principal Life general account investment (2) . . . . . . . . . . . . . . . . . . . . 44.5 — — 44.5
U.S. equity portfolios (3) . . . . . . . . . . . . . . . . . . . . . . . . . . . . . . . . . . 232.2 190.0 42.2 —International equity portfolios (4) . . . . . . . . . . . . . . . . . . . . . . . . . . . . . 50.2 38.3 11.9 —
Total . . . . . . . . . . . . . . . . . . . . . . . . . . . . . . . . . . . . . . . . . . . . . . . $471.7 $373.1 $54.1 $44.5
As of December 31, 2009
Assets /(liabilities) Fair value hierarchy levelmeasured at fair
value Level 1 Level 2 Level 3
(in millions)Asset categoryCash and cash equivalents . . . . . . . . . . . . . . . . . . . . . . . . . . . . . . . . . . $ 1.0 $ 1.0 $ — $ —Fixed income security portfolios:
Fixed income investment funds (1) . . . . . . . . . . . . . . . . . . . . . . . . . . . 131.1 131.1 — —Principal Life general account investment (2) . . . . . . . . . . . . . . . . . . . . 45.5 — — 45.5
U.S. equity portfolios (3) . . . . . . . . . . . . . . . . . . . . . . . . . . . . . . . . . . 198.9 162.5 36.4 —International equity portfolios (4) . . . . . . . . . . . . . . . . . . . . . . . . . . . . . 45.0 34.3 10.7 —
Total . . . . . . . . . . . . . . . . . . . . . . . . . . . . . . . . . . . . . . . . . . . . . . . $421.5 $328.9 $47.1 $45.5
(1) The portfolios invest in various fixed income securities, primarily of U.S. origin. These include, but are not limited to, corporatebonds, mortgage-backed securities, commercial mortgage-backed securities, U.S. Treasury securities, agency securities, asset-backedsecurities and collateralized mortgage obligations.
(2) The general account is invested in various fixed income securities.
(3) The portfolios invest primarily in publicly traded equity securities of large U.S. companies.
(4) The portfolios invest primarily in publicly traded equity securities of non-U.S. companies.
As of December 31, 2010 and 2009, respectively, $54.1 million and $47.1 million of assets in the U.S. equity andinternational equity portfolios were included in a trust owned life insurance contract.
142

Principal Financial Group, Inc.
Notes to Consolidated Financial Statements — (continued)
11. Employee and Agent Benefits — (continued)
The reconciliation for all assets measured at fair value using significant unobservable inputs (Level 3) is as follows:
For the year ended December 31, 2010
Actual return gains(losses) on plan assets Ending
Beginning Relating to assetasset assets still Relating to balance
balance as held at the assets sold Purchases, Transfers as ofof December 31, reporting during the sales and in (out) of December 31,
2009 date period settlements Level 3 2010
(in millions)Asset categoryPrincipal Life general account investment . . . $45.5 $ 4.3 $ — $(5.3) $ — $44.5
Total . . . . . . . . . . . . . . . . . . . . . . . . . . $45.5 $ 4.3 $ — $(5.3) $ — $44.5
For the year ended December 31, 2009
Actual return gains(losses) on plan assets Ending
Beginning Relating to assetasset assets still Relating to balance
balance as held at the assets sold Purchases, Transfers as ofof January 1, reporting during the sales and in (out) of December 31,
2009 date period settlements Level 3 2009
(in millions)Asset categoryPrincipal Life general account investment . . . . . $54.9 $(1.3) $ — $(8.1) $ — $45.5
Total . . . . . . . . . . . . . . . . . . . . . . . . . . . . $54.9 $(1.3) $ — $(8.1) $ — $45.5
According to our investment policy, the target asset allocation for the other postretirement benefit plans is:
Asset category Target allocation
U.S. equity portfolios . . . . . . . . . . . . . . . . . . . . . . . . . . . . . . . . . . . . . . . . . . . . . . . . . . . . . . . . . . . . . . . 45% - 65%International equity portfolios . . . . . . . . . . . . . . . . . . . . . . . . . . . . . . . . . . . . . . . . . . . . . . . . . . . . . . . . . 5% - 15%Fixed income security portfolios . . . . . . . . . . . . . . . . . . . . . . . . . . . . . . . . . . . . . . . . . . . . . . . . . . . . . . . . 30% - 50%
The investment strategies and policies for the other postretirement benefit plans are similar to those employed bythe qualified pension plan.
Contributions
Our funding policy for the qualified pension plan is to fund the plan annually in an amount at least equal to theminimum annual contribution required under ERISA and, generally, not greater than the maximum amount that can bededucted for federal income tax purposes. We do not anticipate contributions will be needed to satisfy the minimumfunding requirements of ERISA for our qualified plan. At this time, it is too early to estimate the amount that may becontributed, but it is possible that we may fund the plans in 2011 in the range of $60-$90 million. This includes funding forboth our qualified and nonqualified pension plans. While we designate assets to cover the computed liability of thenonqualified plan, the assets are not included as part of the asset balances presented in this footnote as they do notqualify as plan assets in accordance with U.S. GAAP. We may contribute to our other postretirement benefit plans in 2011pending future analysis.
143

Principal Financial Group, Inc.
Notes to Consolidated Financial Statements — (continued)
11. Employee and Agent Benefits — (continued)
Estimated Future Benefit Payments
The estimated future benefit payments, which reflect expected future service, and the expected amount of subsidyreceipts under Medicare Part D are:
Other postretirement benefits(gross benefit payments,
including prescription drug Amount of Medicare Part DPension benefits benefits) subsidy receipts
(in millions)Year ending December 31:
2011 . . . . . . . . . . . . . . . . . . . . . . . . . . . . . . . $ 76.9 $ 19.3 $0.92012 . . . . . . . . . . . . . . . . . . . . . . . . . . . . . . . 81.6 20.2 1.02013 . . . . . . . . . . . . . . . . . . . . . . . . . . . . . . . 86.5 21.3 1.12014 . . . . . . . . . . . . . . . . . . . . . . . . . . . . . . . 91.0 22.4 1.22015 . . . . . . . . . . . . . . . . . . . . . . . . . . . . . . . 95.2 23.4 1.32016-2020 . . . . . . . . . . . . . . . . . . . . . . . . . . . . 567.0 126.8 6.9
The above table reflects the total estimated future benefits to be paid from the plan, including both our share of thebenefit cost and the participants’ share of the cost, which is funded by their contributions to the plan.
The assumptions used in calculating the estimated future benefit payments are the same as those used to measurethe benefit obligation for the year ended December 31, 2010.
The information that follows shows supplemental information for our defined benefit pension plans. Certain keysummary data is shown separately for qualified and nonqualified plans.
For the year ended December 31,
2010 2009
Qualified Nonqualified Qualified Nonqualifiedplan plans Total plan plans Total
(in millions)Amount recognized in statement of financial positionOther assets . . . . . . . . . . . . . . . . . . . . . . . . . . . . . . . $ — $ — $ — $ — $ — $ —Other liabilities . . . . . . . . . . . . . . . . . . . . . . . . . . . . . (210.8) (305.3) (516.1) (249.9) (297.2) (547.1)
Total . . . . . . . . . . . . . . . . . . . . . . . . . . . . . . . . . . . . $(210.8) $(305.3) $(516.1) $(249.9) $(297.2) $(547.1)
Amount recognized in accumulated other comprehensive lossTotal net actuarial loss . . . . . . . . . . . . . . . . . . . . . . . . . $ 404.1 $ 65.6 $ 469.7 $ 495.0 $ 69.9 $ 564.9Prior service cost benefit . . . . . . . . . . . . . . . . . . . . . . . (26.6) (15.0) (41.6) (33.9) (18.8) (52.7)
Total pre-tax accumulated other comprehensive loss . . . . . . $ 377.5 $ 50.6 $ 428.1 $ 461.1 $ 51.1 $ 512.2
Components of net periodic benefit costService cost . . . . . . . . . . . . . . . . . . . . . . . . . . . . . . . $ 39.3 $ 6.3 $ 45.6 $ 41.8 $ 9.6 $ 51.4Interest cost . . . . . . . . . . . . . . . . . . . . . . . . . . . . . . . 88.2 17.5 105.7 83.0 17.8 100.8Expected return on plan assets . . . . . . . . . . . . . . . . . . . (98.4) — (98.4) (79.5) — (79.5)Amortization of prior service cost benefit . . . . . . . . . . . . . (6.6) (3.5) (10.1) (5.4) (2.3) (7.7)Recognized net actuarial loss . . . . . . . . . . . . . . . . . . . . 62.5 5.1 67.6 86.5 6.1 92.6Amount recognized due to special events . . . . . . . . . . . . . (0.6) (0.3) (0.9) — — —
Net periodic benefit cost . . . . . . . . . . . . . . . . . . . . . . . $ 84.4 $ 25.1 $ 109.5 $ 126.4 $ 31.2 $ 157.6
Other changes recognized in accumulated othercomprehensive (income) loss
Net actuarial (gain) loss . . . . . . . . . . . . . . . . . . . . . . . . $ (28.4) $ 0.9 $ (27.5) $(108.8) $ (1.9) $(110.7)Prior service benefit . . . . . . . . . . . . . . . . . . . . . . . . . . — — — (10.7) (10.2) (20.9)Amortization of net loss . . . . . . . . . . . . . . . . . . . . . . . (62.5) (5.1) (67.6) (86.5) (6.1) (92.6)Amortization of prior service cost benefit . . . . . . . . . . . . . 7.3 3.7 11.0 5.4 2.3 7.7
Total recognized in pre-tax accumulated other comprehensiveincome . . . . . . . . . . . . . . . . . . . . . . . . . . . . . . . . . $ (83.6) $ (0.5) $ (84.1) $(200.6) $ (15.9) $(216.5)
Total recognized in net periodic benefit cost and pre-taxaccumulated other comprehensive (income) loss . . . . . . . $ 0.8 $ 24.6 $ 25.4 $ (74.2) $ 15.3 $ (58.9)
In addition, we have defined contribution plans that are generally available to all U.S. employees and agents. Eligibleparticipants could not contribute more than $16,500 of their compensation to the plans in 2010. Effective January 1, 2006,we made several changes to the retirement programs. In general, the pension and supplemental executive retirement plan
144

Principal Financial Group, Inc.
Notes to Consolidated Financial Statements — (continued)
11. Employee and Agent Benefits — (continued)
benefit formulas were reduced, and the 401(k) matching contribution was increased. Employees who were ages 47 orolder with at least ten years of service on December 31, 2005, could elect to retain the prior benefit provisions and forgoreceipt of the additional matching contributions. The employees who elected to retain the prior benefit provisions arereferred to as ‘‘Grandfathered Choice Participants.’’ We match the Grandfathered Choice Participant’s contribution at a50% contribution rate up to a maximum contribution of 3% of the participant’s compensation. For all other participants,we match the participant’s contributions at a 75% contribution rate up to a maximum of 6% of the participant’scompensation. The defined contribution plans allow employees to choose among various investment options, includingour common stock. We contributed $35.7 million, $33.9 million and $41.2 million in 2010, 2009 and 2008, respectively, toour qualified defined contribution plans.
We also have nonqualified deferred compensation plans available to select employees and agents that allow them todefer compensation amounts in excess of limits imposed by federal tax law with respect to the qualified plans. In 2010, wematched the Grandfathered Choice Participant’s deferral at a 50% match deferral rate up to a maximum matchingdeferral of 3% of the participant’s compensation. For all other participants, we matched the participant’s deferral at a75% match deferral rate up to a maximum matching deferral of 6% of the participant’s compensation. We contributed$2.8 million, $4.6 million and $7.3 million in 2010, 2009 and 2008, respectively, to our nonqualified deferredcompensation plans.
12. Contingencies, Guarantees and Indemnifications
Litigation and Regulatory Contingencies
We are regularly involved in litigation, both as a defendant and as a plaintiff, but primarily as a defendant. Litigationnaming us as a defendant ordinarily arises out of our business operations as a provider of asset management andaccumulation products and services, life, health and disability insurance. Some of the lawsuits are class actions, or purportto be, and some include claims for unspecified or substantial punitive and treble damages. In addition, regulatory bodiessuch as state insurance departments, the SEC, the Financial Industry Regulatory Authority, the Department of Labor andother regulatory agencies regularly make inquiries and conduct examinations or investigations concerning our compliancewith, among other things, insurance laws, securities laws, ERISA and laws governing the activities of broker-dealers. Wereceive requests from regulators and other governmental authorities relating to industry issues and may receiveadditional requests, including subpoenas and interrogatories, in the future.
On November 8, 2006, a trustee of Fairmount Park Inc. Retirement Savings Plan filed a putative class action lawsuitin the United States District Court for the Southern District of Illinois against Principal Life. Principal Life’s motion totransfer venue was granted and the case is now pending in the Southern District of Iowa. The complaint alleged, amongother things, that Principal Life breached its alleged fiduciary duties while performing services to 401(k) plans by failingto disclose, or adequately disclose, to employers or plan participants the fact that Principal Life receives ‘‘revenue sharingfees from mutual funds that are included in its pre-packaged 401(k) plans’’ and allegedly failed to use the revenue todefray the expenses of the services provided to the plans. Plaintiff further alleged that these acts constitute prohibitedtransactions under ERISA. Plaintiff sought to certify a class of all retirement plans to which Principal Life was a serviceprovider and for which Principal Life received and retained ‘‘revenue sharing’’ fees from mutual funds. On August 27,2008, the plaintiff’s motion for class certification was denied. The plaintiff’s new motion for class certification, filedMay 11, 2009, was stricken by the court on March 31, 2010. Principal Life continues to aggressively defend the lawsuit.
On October 28, 2009, Judith Curran filed a derivative action lawsuit on behalf of Principal Funds, Inc. StrategicAsset Management Portfolios in the United States District Court for the Southern District of Iowa against PrincipalManagement Corporation, Principal Global Investors, LLC, and Principal Funds Distributor, Inc. (the ‘‘CurranDefendants’’). The lawsuit alleges the Curran Defendants breached their fiduciary duty under Section 36(b) of theInvestment Company Act by charging advisory fees and distribution fees that were excessive. The Curran Defendantsfiled a motion to dismiss the case on January 29, 2010. That motion was granted in part and overruled in part. PrincipalGlobal Investors, LLC was dismissed from the suit. The remaining Curran Defendants are aggressively defending thelawsuit.
On December 2, 2009 and December 4, 2009, two plaintiffs, Cruise and Mullaney, each filed putative class actionlawsuits in the United States District Court for the Southern District of New York against us, Principal Life, PrincipalGlobal Investors, LLC, and Principal Real Estate Investors, LLC (the ‘‘Cruise/Mullaney Defendants’’). The lawsuitsalleged the Cruise/Mullaney Defendants failed to manage the Principal U.S. Property Separate Account (‘‘PUSPSA’’) inthe best interests of investors, improperly imposed a ‘‘withdrawal freeze’’ on September 26, 2008, and instituted a‘‘withdrawal queue’’ to honor withdrawal requests as sufficient liquidity became available. Plaintiffs allege these actionsconstitute a breach of fiduciary duties under ERISA. Plaintiffs seek to certify a class including all qualified ERISA plansand the participants of those plans that invested in PUSPSA between September 26, 2008, and the present that have
145

Principal Financial Group, Inc.
Notes to Consolidated Financial Statements — (continued)
12. Contingencies, Guarantees and Indemnifications — (continued)
suffered losses caused by the queue. The two lawsuits, as well as two subsequently filed complaints asserting similarclaims, have been consolidated and are now known as In re Principal U.S. Property Account Litigation. On April 22, 2010,an order was entered granting the motion made by the Cruise/Mullaney Defendants for change of venue to the UnitedStates District Court for the Southern District of Iowa. The plaintiffs have filed a Consolidated Complaint adding fivenew plaintiffs. The Cruise/Mullaney Defendants are aggressively defending the lawsuit.
On July 1, 2010, Debra and Russell Hurd filed a putative class action lawsuit in the United States District Court forthe Southern District of Iowa against us and Principal Life (the ‘‘Hurd Defendants’’). The complaint alleges the HurdDefendants underpay out-of-network health claims by using an allegedly flawed database to calculate usual andcustomary charges. Plaintiffs are suing on behalf of ‘‘all participants and/or beneficiaries in group health plans in theUnited States issued, insured or administered by [us] as to which [we] have administered claims and/or paid or deniedbenefits for out-of-network benefit claims.’’ The complaint alleged four causes of action, all based on violations ofERISA. The Hurd Defendants filed a stipulated dismissal with prejudice on December 8, 2010.
While the outcome of any pending or future litigation or regulatory matter cannot be predicted, management doesnot believe that any pending litigation or regulatory matter will have a material adverse effect on our business or financialposition. The outcome of such matters is always uncertain, and unforeseen results can occur. It is possible that suchoutcomes could materially affect net income in a particular quarter or annual period.
Guarantees and Indemnifications
In the normal course of business, we have provided guarantees to third parties primarily related to a formersubsidiary, joint ventures and industrial revenue bonds. These agreements generally expire through 2019. The maximumexposure under these agreements as of December 31, 2010, was approximately $218.0 million. At inception, the fair valueof such guarantees was insignificant. In addition, we believe the likelihood is remote that material payments will berequired. Therefore, any liability accrued within our consolidated statements of financial position is insignificant. Shouldwe be required to perform under these guarantees, we generally could recover a portion of the loss from third partiesthrough recourse provisions included in agreements with such parties, the sale of assets held as collateral that can beliquidated in the event that performance is required under the guarantees or other recourse generally available to us;therefore, such guarantees would not result in a material adverse effect on our business or financial position. While thelikelihood is remote, such outcomes could materially affect net income in a particular quarter or annual period.
We are also subject to various other indemnification obligations issued in conjunction with divestitures, acquisitionsand financing transactions whose terms range in duration and often are not explicitly defined. Certain portions of theseindemnifications may be capped, while other portions are not subject to such limitations; therefore, the overall maximumamount of the obligation under the indemnifications cannot be reasonably estimated. At inception, the fair value of suchindemnifications was insignificant. In addition, we believe the likelihood is remote that material payments will berequired. Therefore, any liability accrued within our consolidated statements of financial position is insignificant. Whilewe are unable to estimate with certainty the ultimate legal and financial liability with respect to these indemnifications,we believe that performance under these indemnifications would not result in a material adverse effect on our business orfinancial position. While the likelihood is remote, performance under these indemnifications could materially affect netincome in a particular quarter or annual period.
Guaranty Funds
Under state insurance guaranty fund laws, insurers doing business in a state can be assessed, up to prescribed limits,for certain obligations of insolvent insurance companies to policyholders and claimants. A state’s fund assesses itsmembers based on their pro rata market share of written premiums in the state for the classes of insurance for which theinsolvent insurer was engaged. Some states permit member insurers to recover assessments paid through full or partialpremium tax offsets. We accrue liabilities for guaranty fund assessments when an assessment is probable, can bereasonably estimated and when the event obligating us to pay has occurred. While we cannot predict the amount andtiming of any future assessments, we have established reserves we believe are adequate for assessments relating toinsurance companies that are currently subject to insolvency proceedings. As of December 31, 2010 and 2009, the liabilitybalance for guaranty fund assessments, which is not discounted, was $14.5 million and $15.1 million, respectively, and wasreported within other liabilities in the consolidated statements of financial position. As of December 31, 2010 and 2009,$6.9 million and $7.4 million, respectively, related to premium tax offsets were included in premiums due and otherreceivables in the consolidated statements of financial position.
146

Principal Financial Group, Inc.
Notes to Consolidated Financial Statements — (continued)
12. Contingencies, Guarantees and Indemnifications — (continued)
Operating Leases
As a lessee, we lease office space, data processing equipment, office furniture and office equipment under variousoperating leases. Rental expense for the years ended December 31, 2010, 2009 and 2008, respectively, was $53.1 million,$54.4 million and $54.4 million.
The following represents payments due by period for operating lease obligations (in millions):
Year ending December 31:2011 . . . . . . . . . . . . . . . . . . . . . . . . . . . . . . . . . . . . . . . . . . . . . . . . . . . . . . . . . . . . . . . . . . . . . . . . . $ 48.12012 . . . . . . . . . . . . . . . . . . . . . . . . . . . . . . . . . . . . . . . . . . . . . . . . . . . . . . . . . . . . . . . . . . . . . . . . . 37.22013 . . . . . . . . . . . . . . . . . . . . . . . . . . . . . . . . . . . . . . . . . . . . . . . . . . . . . . . . . . . . . . . . . . . . . . . . . 28.62014 . . . . . . . . . . . . . . . . . . . . . . . . . . . . . . . . . . . . . . . . . . . . . . . . . . . . . . . . . . . . . . . . . . . . . . . . . 21.72015 . . . . . . . . . . . . . . . . . . . . . . . . . . . . . . . . . . . . . . . . . . . . . . . . . . . . . . . . . . . . . . . . . . . . . . . . . 16.12016 and thereafter . . . . . . . . . . . . . . . . . . . . . . . . . . . . . . . . . . . . . . . . . . . . . . . . . . . . . . . . . . . . . . . 68.1
Total operating lease obligations . . . . . . . . . . . . . . . . . . . . . . . . . . . . . . . . . . . . . . . . . . . . . . . . . . . . . . . 219.8Less: Future sublease rental income on noncancelable leases . . . . . . . . . . . . . . . . . . . . . . . . . . . . . . . . . . . . . 5.8
Total future minimum lease payments . . . . . . . . . . . . . . . . . . . . . . . . . . . . . . . . . . . . . . . . . . . . . . . . . . . . $214.0
Capital Leases
We lease hardware storage equipment under capital leases. As of December 31, 2010 and 2009, these leases had agross asset balance of $17.4 million and $16.1 million and accumulated depreciation of $13.4 million and $9.2 million,respectively. Depreciation expense for the years ended December 31, 2010, 2009 and 2008 was $4.2 million, $5.2 millionand $6.2 million, respectively.
The following represents future minimum lease payments due by period for capital lease obligations (in millions).
Year ending December 31:2011 . . . . . . . . . . . . . . . . . . . . . . . . . . . . . . . . . . . . . . . . . . . . . . . . . . . . . . . . . . . . . . . . . . . . . . . . . . $3.02012 . . . . . . . . . . . . . . . . . . . . . . . . . . . . . . . . . . . . . . . . . . . . . . . . . . . . . . . . . . . . . . . . . . . . . . . . . . 1.12013 . . . . . . . . . . . . . . . . . . . . . . . . . . . . . . . . . . . . . . . . . . . . . . . . . . . . . . . . . . . . . . . . . . . . . . . . . . 0.3
Total . . . . . . . . . . . . . . . . . . . . . . . . . . . . . . . . . . . . . . . . . . . . . . . . . . . . . . . . . . . . . . . . . . . . . . . . . 4.4Less: Amounts representing interest . . . . . . . . . . . . . . . . . . . . . . . . . . . . . . . . . . . . . . . . . . . . . . . . . . . . . 0.2
Net present value of minimum lease payments . . . . . . . . . . . . . . . . . . . . . . . . . . . . . . . . . . . . . . . . . . . . . . $4.2
13. Stockholders’ Equity
Preferred Stock
As of December 31, 2010, we had 13.0 million shares of preferred stock authorized, issued and outstanding underthe two series described below. Preferred stockholders have dividend and liquidation priority over common stockholders.
Series A. Dividends on the Series A Preferred Stock are non-cumulative and are payable quarterly when, and if,declared by our Board of Directors at a rate of 5.563% per annum of the liquidation preference. On or after the dividendpayment date in June 2015, the Series A initial distribution rate will become a floating rate, subject to reset, at our option,subject to certain conditions and parameters. If reset, the rate may be at fixed or floating rates. On or after the dividendpayment date in June 2015, we may, at our option, redeem the shares at a price of $100 per share, or $300.0 million in theaggregate, plus accrued and unpaid dividends for the then current dividend period to the date of redemption, if any.
The Series A Preferred Stock has no stated maturity and is not convertible into any other of our securities. Series APreferred Stock will have no voting rights, except with respect to certain fundamental changes in the terms of the sharesand in the case of certain dividend non-payments.
Series B. Dividends on the Series B Preferred Stock are non-cumulative and are payable quarterly when, and if,declared by the Board of Directors at a rate of 6.518% per annum of the liquidation preference. On or after the dividendpayment date in June 2035, the Series B initial distribution rate will become a floating rate, subject to reset, at our option,subject to certain conditions and parameters. If reset, the rate may be at fixed or floating rates. On or after the dividendpayment date in June 2015, we may, at our option, redeem the shares at a price of $25 per share, or $250.0 million in theaggregate, plus accrued and unpaid dividends for the then current dividend period to the date of redemption, if any.
The Series B Preferred Stock has no stated maturity and is not convertible into any other of our securities. Series BPreferred Stock will have no voting rights, except with respect to certain fundamental changes in the terms of the sharesand in the case of certain dividend non-payments.
147

Principal Financial Group, Inc.
Notes to Consolidated Financial Statements — (continued)
13. Stockholders’ Equity — (continued)
Dividend Restrictions and Payments
The certificates of designation for the Series A and B Preferred Stock restrict the declaration of preferred dividendsif we fail to meet specified capital adequacy, net income or stockholders’ equity levels. As of December 31, 2010, we haveno preferred dividend restrictions.
On March 30, 2010, June 30, 2010, September 30, 2010 and December 30, 2010, we paid a dividend of $8.2 million,$8.3 million, $8.2 million and $8.3 million, respectively, equal to $1.39 per share on Series A non-cumulative perpetualpreferred stock and equal to $0.41 per share on Series B non-cumulative perpetual preferred stock. Dividends were paidto stockholders of record as of March 11, 2010, June 10, 2010, September 9, 2010 and December 9, 2010, respectively.
On March 30, 2009, June 30, 2009, September 30, 2009 and December 30, 2009, we paid a dividend of $8.2 million,$8.3 million, $8.2 million and $8.3 million, respectively, equal to $1.39 per share on Series A non-cumulative perpetualpreferred stock and equal to $0.41 per share on Series B non-cumulative perpetual preferred stock. Dividends were paidto stockholders of record as of March 12, 2009, June 11, 2009, September 10, 2009 and December 14, 2009, respectively.
On March 31, 2008, June 30, 2008, September 30, 2008 and December 30, 2008, we paid a dividend of $8.2 million,$8.3 million, $8.2 million and $8.3 million, respectively, equal to $1.39 per share on Series A non-cumulative perpetualpreferred stock and equal to $0.41 per share on Series B non-cumulative perpetual preferred stock. Dividends were paidto stockholders of record as of March 13, 2008, June 12, 2008, September 11, 2008 and December 11, 2008, respectively.
Common Stock
On December 3, 2010, we paid an annual dividend of $176.2 million, equal to $0.55 per share, to stockholders ofrecord as of November 19, 2010. On December 4, 2009, we paid an annual dividend of $159.5 million, equal to $0.50 pershare, to stockholders of record as of November 13, 2009. On December 5, 2008, we paid an annual dividend of$116.7 million, equal to $0.45 per share, to stockholders of record as of November 14, 2008.
Reconciliation of Outstanding Shares
Series A Series Bpreferred preferred Common
stock stock stock
(in millions)Outstanding shares at January 1, 2008 . . . . . . . . . . . . . . . . . . . . . . . . . . . . . . . . . . . . . . . . . 3.0 10.0 259.1Shares issued . . . . . . . . . . . . . . . . . . . . . . . . . . . . . . . . . . . . . . . . . . . . . . . . . . . . . . . . . — — 1.2Treasury stock acquired . . . . . . . . . . . . . . . . . . . . . . . . . . . . . . . . . . . . . . . . . . . . . . . . . . — — (1.0)
Outstanding shares at December 31, 2008 . . . . . . . . . . . . . . . . . . . . . . . . . . . . . . . . . . . . . . . 3.0 10.0 259.3Shares issued . . . . . . . . . . . . . . . . . . . . . . . . . . . . . . . . . . . . . . . . . . . . . . . . . . . . . . . . . — — 60.0Treasury stock acquired . . . . . . . . . . . . . . . . . . . . . . . . . . . . . . . . . . . . . . . . . . . . . . . . . . — — (0.3)
Outstanding shares at December 31, 2009 . . . . . . . . . . . . . . . . . . . . . . . . . . . . . . . . . . . . . . . 3.0 10.0 319.0Shares issued . . . . . . . . . . . . . . . . . . . . . . . . . . . . . . . . . . . . . . . . . . . . . . . . . . . . . . . . . — — 1.5Treasury stock acquired . . . . . . . . . . . . . . . . . . . . . . . . . . . . . . . . . . . . . . . . . . . . . . . . . . — — (0.1)
Outstanding shares at December 31, 2010 . . . . . . . . . . . . . . . . . . . . . . . . . . . . . . . . . . . . . . . 3.0 10.0 320.4
On May 11, 2009, we issued 58.2 million shares of common stock at a price of $19.75 per share. Net proceeds fromthe issuance were $1,109.1 million. The proceeds from this offering will be used for general corporate purposes.
During November 2007, our Board of Directors authorized a share repurchase program of up to $500.0 million ofour outstanding common stock. On November 30, 2007, we entered into an accelerated common stock repurchaseagreement with a third party investment bank for an aggregate purchase price of $250.0 million. On this date, we paid$250.0 million and received the initial delivery of 2.9 million common shares, while retaining the right to receiveadditional common shares over the program’s execution period. The accelerated common stock repurchase agreementwas completed in January 2008, at which time we received 0.9 million additional common shares under this agreement. Inthe fourth quarter of 2008, we suspended purchases of the remaining $250.0 million available under the November 2007authorization.
Our Board of Directors has authorized various repurchase programs under which we are allowed to purchase sharesof our outstanding common stock. Shares repurchased under these programs are accounted for as treasury stock, carriedat cost and reflected as a reduction to stockholders’ equity.
148
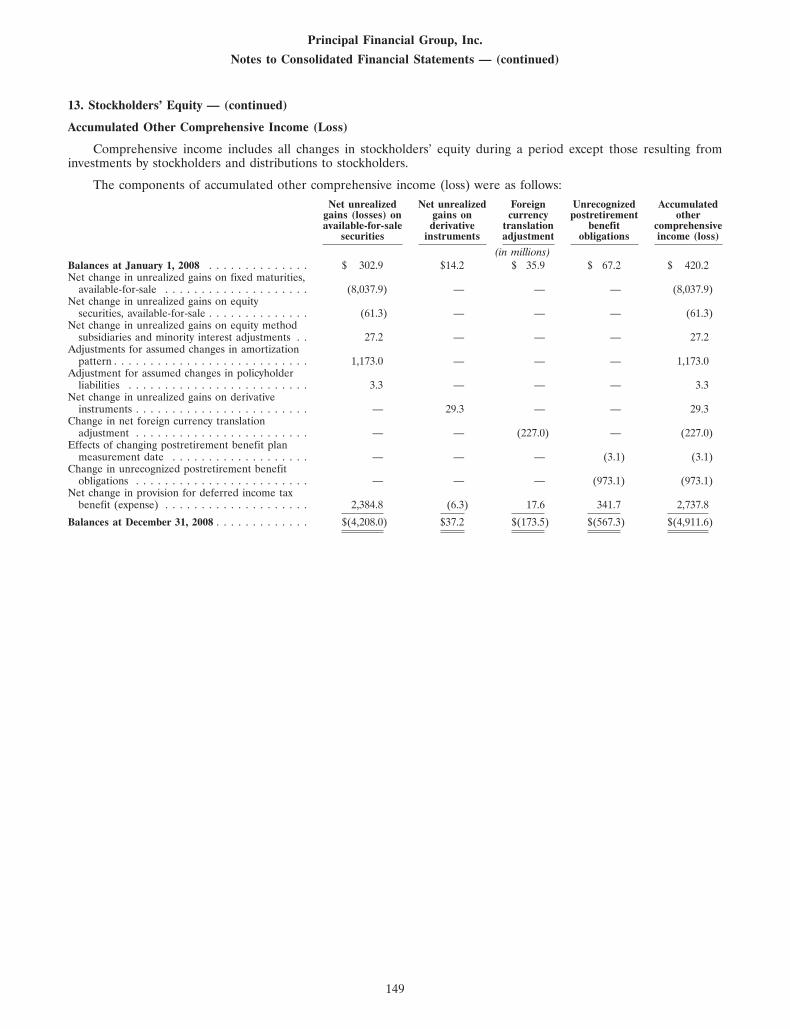
Principal Financial Group, Inc.
Notes to Consolidated Financial Statements — (continued)
13. Stockholders’ Equity — (continued)
Accumulated Other Comprehensive Income (Loss)
Comprehensive income includes all changes in stockholders’ equity during a period except those resulting frominvestments by stockholders and distributions to stockholders.
The components of accumulated other comprehensive income (loss) were as follows:Net unrealized Net unrealized Foreign Unrecognized Accumulated
gains (losses) on gains on currency postretirement otheravailable-for-sale derivative translation benefit comprehensive
securities instruments adjustment obligations income (loss)
(in millions)Balances at January 1, 2008 . . . . . . . . . . . . . . $ 302.9 $14.2 $ 35.9 $ 67.2 $ 420.2Net change in unrealized gains on fixed maturities,
available-for-sale . . . . . . . . . . . . . . . . . . . . (8,037.9) — — — (8,037.9)Net change in unrealized gains on equity
securities, available-for-sale . . . . . . . . . . . . . . (61.3) — — — (61.3)Net change in unrealized gains on equity method
subsidiaries and minority interest adjustments . . 27.2 — — — 27.2Adjustments for assumed changes in amortization
pattern . . . . . . . . . . . . . . . . . . . . . . . . . . . 1,173.0 — — — 1,173.0Adjustment for assumed changes in policyholder
liabilities . . . . . . . . . . . . . . . . . . . . . . . . . 3.3 — — — 3.3Net change in unrealized gains on derivative
instruments . . . . . . . . . . . . . . . . . . . . . . . . — 29.3 — — 29.3Change in net foreign currency translation
adjustment . . . . . . . . . . . . . . . . . . . . . . . . — — (227.0) — (227.0)Effects of changing postretirement benefit plan
measurement date . . . . . . . . . . . . . . . . . . . — — — (3.1) (3.1)Change in unrecognized postretirement benefit
obligations . . . . . . . . . . . . . . . . . . . . . . . . — — — (973.1) (973.1)Net change in provision for deferred income tax
benefit (expense) . . . . . . . . . . . . . . . . . . . . 2,384.8 (6.3) 17.6 341.7 2,737.8
Balances at December 31, 2008 . . . . . . . . . . . . . $(4,208.0) $37.2 $(173.5) $(567.3) $(4,911.6)
149

Principal Financial Group, Inc.
Notes to Consolidated Financial Statements — (continued)
13. Stockholders’ Equity — (continued)
Net unrealized Net unrealized Foreign Unrecognized Accumulatedlosses on gains on currency postretirement other
available-for-sale derivative translation benefit comprehensivesecurities instruments adjustment obligations loss
(in millions)Balances at January 1, 2009 . . . . . . . . . . . . . . $(4,208.0) $ 37.2 $(173.5) $(567.3) $(4,911.6)Net change in unrealized losses on fixed
maturities, available-for-sale . . . . . . . . . . . . . 6,590.8 — — — 6,590.8Net change in noncredit component of impairment
losses on fixed maturities, available-for-sale . . . (260.9) — — — (260.9)Net change in unrealized losses on equity
securities, available-for-sale . . . . . . . . . . . . . . 48.1 — — — 48.1Net change in unrealized losses on equity method
subsidiaries and noncontrolling interestadjustments . . . . . . . . . . . . . . . . . . . . . . . . 111.7 — — — 111.7
Adjustments for assumed changes in amortizationpattern . . . . . . . . . . . . . . . . . . . . . . . . . . . (963.3) — — — (963.3)
Adjustment for assumed changes in policyholderliabilities . . . . . . . . . . . . . . . . . . . . . . . . . (79.0) — — — (79.0)
Net change in unrealized gains on derivativeinstruments . . . . . . . . . . . . . . . . . . . . . . . . — (33.2) — — (33.2)
Change in net foreign currency translationadjustment . . . . . . . . . . . . . . . . . . . . . . . . — — 191.8 — 191.8
Change in unrecognized postretirement benefitobligations . . . . . . . . . . . . . . . . . . . . . . . . — — — 263.3 263.3
Cumulative effect of reclassifying noncreditcomponent of previously recognized impairmentlosses on fixed maturities, available-for-sale, net . (9.9) — — — (9.9)
Net change in provision for deferred income taxbenefit (expense) . . . . . . . . . . . . . . . . . . . . (1,884.3) 10.3 (23.6) (92.2) (1,989.8)
Balances at December 31, 2009 . . . . . . . . . . . . . $ (654.8) $ 14.3 $ (5.3) $(396.2) $(1,042.0)
150
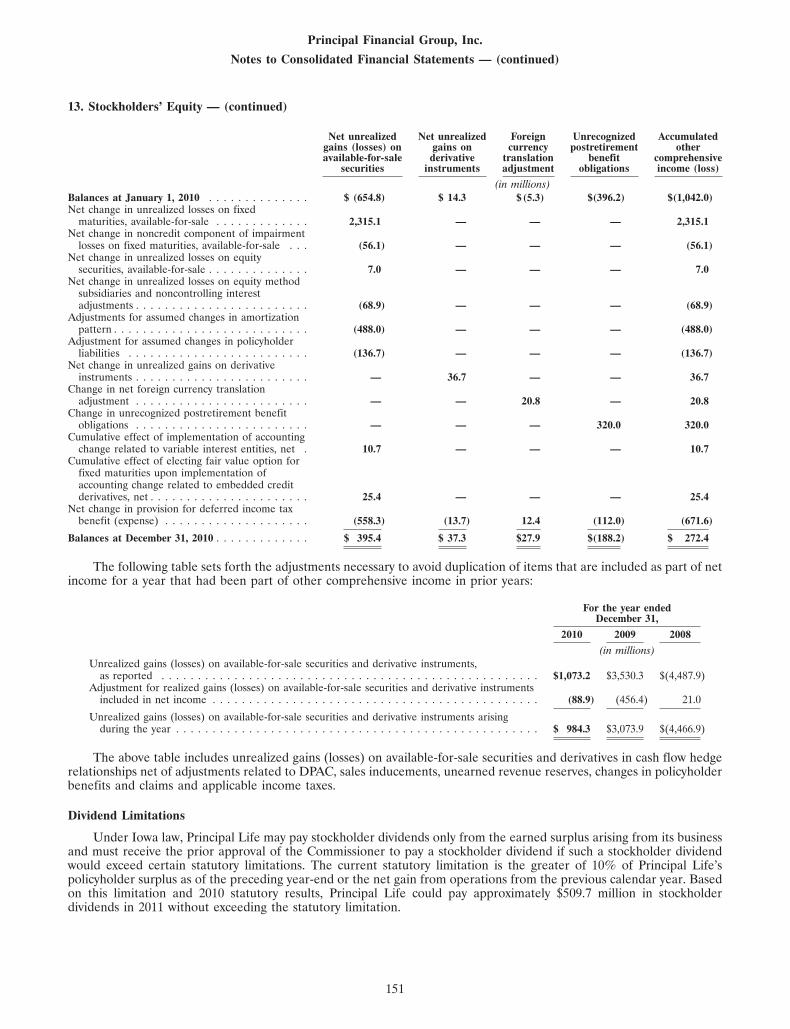
Principal Financial Group, Inc.
Notes to Consolidated Financial Statements — (continued)
13. Stockholders’ Equity — (continued)
Net unrealized Net unrealized Foreign Unrecognized Accumulatedgains (losses) on gains on currency postretirement otheravailable-for-sale derivative translation benefit comprehensive
securities instruments adjustment obligations income (loss)
(in millions)Balances at January 1, 2010 . . . . . . . . . . . . . . $ (654.8) $ 14.3 $(5.3) $(396.2) $(1,042.0)Net change in unrealized losses on fixed
maturities, available-for-sale . . . . . . . . . . . . . 2,315.1 — — — 2,315.1Net change in noncredit component of impairment
losses on fixed maturities, available-for-sale . . . (56.1) — — — (56.1)Net change in unrealized losses on equity
securities, available-for-sale . . . . . . . . . . . . . . 7.0 — — — 7.0Net change in unrealized losses on equity method
subsidiaries and noncontrolling interestadjustments . . . . . . . . . . . . . . . . . . . . . . . . (68.9) — — — (68.9)
Adjustments for assumed changes in amortizationpattern . . . . . . . . . . . . . . . . . . . . . . . . . . . (488.0) — — — (488.0)
Adjustment for assumed changes in policyholderliabilities . . . . . . . . . . . . . . . . . . . . . . . . . (136.7) — — — (136.7)
Net change in unrealized gains on derivativeinstruments . . . . . . . . . . . . . . . . . . . . . . . . — 36.7 — — 36.7
Change in net foreign currency translationadjustment . . . . . . . . . . . . . . . . . . . . . . . . — — 20.8 — 20.8
Change in unrecognized postretirement benefitobligations . . . . . . . . . . . . . . . . . . . . . . . . — — — 320.0 320.0
Cumulative effect of implementation of accountingchange related to variable interest entities, net . 10.7 — — — 10.7
Cumulative effect of electing fair value option forfixed maturities upon implementation ofaccounting change related to embedded creditderivatives, net . . . . . . . . . . . . . . . . . . . . . . 25.4 — — — 25.4
Net change in provision for deferred income taxbenefit (expense) . . . . . . . . . . . . . . . . . . . . (558.3) (13.7) 12.4 (112.0) (671.6)
Balances at December 31, 2010 . . . . . . . . . . . . . $ 395.4 $ 37.3 $27.9 $(188.2) $ 272.4
The following table sets forth the adjustments necessary to avoid duplication of items that are included as part of netincome for a year that had been part of other comprehensive income in prior years:
For the year endedDecember 31,
2010 2009 2008
(in millions)Unrealized gains (losses) on available-for-sale securities and derivative instruments,
as reported . . . . . . . . . . . . . . . . . . . . . . . . . . . . . . . . . . . . . . . . . . . . . . . . . . . . $1,073.2 $3,530.3 $(4,487.9)Adjustment for realized gains (losses) on available-for-sale securities and derivative instruments
included in net income . . . . . . . . . . . . . . . . . . . . . . . . . . . . . . . . . . . . . . . . . . . . . (88.9) (456.4) 21.0
Unrealized gains (losses) on available-for-sale securities and derivative instruments arisingduring the year . . . . . . . . . . . . . . . . . . . . . . . . . . . . . . . . . . . . . . . . . . . . . . . . . . $ 984.3 $3,073.9 $(4,466.9)
The above table includes unrealized gains (losses) on available-for-sale securities and derivatives in cash flow hedgerelationships net of adjustments related to DPAC, sales inducements, unearned revenue reserves, changes in policyholderbenefits and claims and applicable income taxes.
Dividend Limitations
Under Iowa law, Principal Life may pay stockholder dividends only from the earned surplus arising from its businessand must receive the prior approval of the Commissioner to pay a stockholder dividend if such a stockholder dividendwould exceed certain statutory limitations. The current statutory limitation is the greater of 10% of Principal Life’spolicyholder surplus as of the preceding year-end or the net gain from operations from the previous calendar year. Basedon this limitation and 2010 statutory results, Principal Life could pay approximately $509.7 million in stockholderdividends in 2011 without exceeding the statutory limitation.
151

Principal Financial Group, Inc.
Notes to Consolidated Financial Statements — (continued)
14. Fair Value Measurements
We use fair value measurements to record fair value of certain assets and liabilities and to estimate fair value offinancial instruments not recorded at fair value but required to be disclosed at fair value. Certain financial instruments,particularly policyholder liabilities other than investment-type insurance contracts, are excluded from these fair valuedisclosure requirements.
Fair Value of Financial Instruments
The carrying value and estimated fair value of financial instruments were as follows:
December 31, 2010 December 31, 2009
Carrying amount Fair value Carrying amount Fair value
(in millions)Assets (liabilities)Fixed maturities, available-for-sale . . . . . . . . . . . . . . . . . . $ 48,636.3 $ 48,636.3 $ 46,220.6 $ 46,220.6Fixed maturities, trading . . . . . . . . . . . . . . . . . . . . . . . . . 1,120.3 1,120.3 1,032.4 1,032.4Equity securities, available-for-sale . . . . . . . . . . . . . . . . . . 169.9 169.9 214.0 214.0Equity securities, trading . . . . . . . . . . . . . . . . . . . . . . . . 316.9 316.9 221.5 221.5Mortgage loans . . . . . . . . . . . . . . . . . . . . . . . . . . . . . . 11,125.1 11,197.8 11,845.6 11,407.8Policy loans . . . . . . . . . . . . . . . . . . . . . . . . . . . . . . . . . 903.9 1,012.1 902.5 1,022.6Other investments . . . . . . . . . . . . . . . . . . . . . . . . . . . . . 311.3 311.3 188.5 188.5Cash and cash equivalents . . . . . . . . . . . . . . . . . . . . . . . 1,877.4 1,877.4 2,240.4 2,240.4Derivative assets . . . . . . . . . . . . . . . . . . . . . . . . . . . . . . 1,083.2 1,083.2 1,232.2 1,232.2Separate account assets . . . . . . . . . . . . . . . . . . . . . . . . . 69,555.3 69,555.3 62,738.5 62,738.5Cash collateral . . . . . . . . . . . . . . . . . . . . . . . . . . . . . . . 236.0 236.0 386.4 386.4Investment-type insurance contracts . . . . . . . . . . . . . . . . . (32,720.1) (32,828.6) (35,672.8) (34,876.3)Short-term debt . . . . . . . . . . . . . . . . . . . . . . . . . . . . . . (107.9) (107.9) (101.6) (101.6)Long-term debt . . . . . . . . . . . . . . . . . . . . . . . . . . . . . . (1,583.7) (1,756.3) (1,584.6) (1,608.4)Separate account liabilities . . . . . . . . . . . . . . . . . . . . . . . (62,681.4) (61,594.1) (56,897.4) (55,867.5)Derivative liabilities . . . . . . . . . . . . . . . . . . . . . . . . . . . (1,274.5) (1,274.5) (1,050.8) (1,050.8)Bank deposits . . . . . . . . . . . . . . . . . . . . . . . . . . . . . . . (2,219.2) (2,230.9) (2,185.8) (2,188.5)Cash collateral payable . . . . . . . . . . . . . . . . . . . . . . . . . (236.0) (236.0) (367.8) (367.8)Other liabilities . . . . . . . . . . . . . . . . . . . . . . . . . . . . . . (250.3) (250.3) (99.2) (99.2)
Valuation Hierarchy
Fair value is defined as the price that would be received to sell an asset or paid to transfer a liability in an orderlytransaction between market participants at the measurement date (an exit price). The fair value hierarchy prioritizes theinputs to valuation techniques used to measure fair value into three levels.
• Level 1 — Fair values are based on unadjusted quoted prices in active markets for identical assets or liabilities. OurLevel 1 assets and liabilities primarily include exchange traded equity securities, mutual funds and U.S. Treasurybonds.
• Level 2 — Fair values are based on inputs other than quoted prices within Level 1 that are observable for the asset orliability, either directly or indirectly. Our Level 2 assets and liabilities primarily include fixed maturities (includingpublic and private bonds), equity securities, over-the-counter derivatives and other investments for which publicquotations are not available but that are priced by third-party pricing services or internal models usingsubstantially all observable inputs.
• Level 3 — Fair values are based on significant unobservable inputs for the asset or liability. Our Level 3 assets andliabilities include certain fixed maturities, private equity securities, real estate and commercial mortgage loaninvestments of our separate accounts, commercial mortgage loan investments and obligations of consolidatedVIEs for which the fair value option was elected, complex derivatives and embedded derivatives that must bepriced using broker quotes or other valuation methods that utilize at least one significant unobservable input.
Determination of Fair Value
The following discussion describes the valuation methodologies and inputs used for assets and liabilities measured atfair value on a recurring basis or disclosed at fair value. The techniques utilized in estimating the fair values of financialinstruments are reliant on the assumptions used. Care should be exercised in deriving conclusions about our business, itsvalue or financial position based on the fair value information of financial instruments presented below.
Fair value estimates are made at a specific point in time, based on available market information and judgments aboutthe financial instrument. Such estimates do not consider the tax impact of the realization of unrealized gains or losses. In
152

Principal Financial Group, Inc.
Notes to Consolidated Financial Statements — (continued)
14. Fair Value Measurements — (continued)
addition, the disclosed fair value may not be realized in the immediate settlement of the financial instrument. We validateprices through an investment analyst review process, which includes validation through direct interaction with externalsources, review of recent trade activity or use of internal models. In circumstances where broker quotes are used to valuean instrument, we generally receive one non-binding quote. Broker quotes are validated through an investment analystreview process, which includes validation through direct interaction with external sources and use of internal models orother relevant information. We did not make any significant changes to our valuation processes during 2010.
Fixed Maturities
Fixed maturities include bonds, asset-backed securities, redeemable preferred stock and certain nonredeemablepreferred stock. When available, the fair value of fixed maturities is based on quoted prices of identical assets in activemarkets. These are reflected in Level 1 and primarily include U.S. Treasury bonds and actively traded redeemablecorporate preferred securities.
When quoted prices are not available, our first priority is to obtain prices from third party pricing vendors. We haveregular interaction with these vendors to ensure we understand their pricing methodologies and to confirm they areutilizing observable market information. Their methodologies vary by asset class and include inputs such as estimatedcash flows, benchmark yields, reported trades, broker quotes, credit quality, industry events and economic events. Fixedmaturities with validated prices from pricing services, which includes the majority of our public fixed maturities in allasset classes, are generally reflected in Level 2. Also included in Level 2 are corporate bonds where quoted market pricesare not available, for which a matrix pricing valuation approach is used. In this approach, securities are grouped intopricing categories that vary by sector, rating and average life. Each pricing category is assigned a risk spread based onstudies of observable public market data from the investment professionals assigned to specific security classes. Theexpected cash flows of the security are then discounted back at the current Treasury curve plus the appropriate riskspread. Although the matrix valuation approach provides a fair valuation of each pricing category, the valuation of anindividual security within each pricing category may actually be impacted by company specific factors.
If we are unable to price a fixed maturity security using prices from third party pricing vendors or other sourcesspecific to the asset class, we may obtain a broker quote or utilize an internal pricing model specific to the asset utilizingrelevant market information, to the extent available, which are reflected in Level 3 and can include fixed maturities acrossall asset classes. These models primarily use projected cash flows discounted using a rate derived from market interestrate curves and relevant risk spreads. As of December 31, 2010, less than 1% of our fixed maturities were valued usinginternal pricing models, which were classified as Level 3 assets accordingly.
The primary inputs, by asset class, for valuations of the majority of our Level 2 investments from third party pricingvendors or our internal pricing valuation approach are described below.
U.S. government and agencies/Non-U.S. governments — Inputs include recently executed market transactions, interestrate yield curves, maturity dates, market price quotations and credit spreads relating to similar instruments.
State and political subdivisions — Inputs include Municipal Securities Rulemaking Board reported trades, U.S.Treasury and other benchmark curves, material event notices, new issue data, and issuer financial statements.
Corporates — Inputs include recently executed transactions, market price quotations, benchmark yields, issuer spreadsand observations of equity and credit default swap curves related to the issuer. For private placement corporate securitiesvalued through the matrix valuation approach inputs include the current U.S. Treasury curve and risk spreads based onsector, rating and average life of the issuance.
RMBS, CMBS, CDOs and Other debt obligations — Inputs include cash flows, priority of the tranche in the capitalstructure, expected time to maturity for the specific tranche, reinvestment period remaining and performance of theunderlying collateral including prepayments, defaults, deferrals, loss severity of defaulted collateral and, for RMBS,prepayment speed assumptions. Other inputs include market indices and recently executed market transactions.
Equity Securities
Equity securities include mutual funds, common stock and nonredeemable preferred stock. Fair values of equitysecurities are determined using quoted prices in active markets for identical assets when available, which are reflected inLevel 1. When quoted prices are not available, we may utilize internal valuation methodologies appropriate for thespecific asset that use observable inputs such as underlying share prices, which are reflected in Level 2. Fair values mightalso be determined using broker quotes or through the use of internal models or analysis that incorporate significantassumptions deemed appropriate given the circumstances and consistent with what other market participants would usewhen pricing such securities, which are reflected in Level 3.
153

Principal Financial Group, Inc.
Notes to Consolidated Financial Statements — (continued)
14. Fair Value Measurements — (continued)
Mortgage Loans
Mortgage loans are not measured at fair value on a recurring basis. Fair values of commercial and residentialmortgage loans are primarily determined by discounting the expected cash flows at current treasury rates plus anapplicable risk spread, which reflects credit quality and maturity of the loans. The risk spread is based on market clearinglevels for loans with comparable credit quality, maturities and risk. The fair value of mortgage loans may also be based onthe fair value of the underlying real estate collateral less cost to sell, which is estimated using appraised values.
Policy Loans
Policy loans are not measured at fair value on a recurring basis. Fair values of policy loans are estimated bydiscounting expected cash flows using a risk-free rate based on the U.S. Treasury curve.
Derivatives
The fair values of exchange-traded derivatives are determined through quoted market prices, which are reflected inLevel 1. Exchange-traded derivatives include interest rate and equity futures that are settled daily such that their fairvalue is not reflected in the consolidated statements of financial position. The fair values of over-the-counter derivativeinstruments are determined using either pricing valuation models that utilize market observable inputs or broker quotes.The majority of our over-the-counter derivatives are valued with models that use market observable inputs, which arereflected in Level 2. Significant inputs include contractual terms, interest rates, currency exchange rates, credit spreadcurves, equity prices, and volatilities. These valuation models consider projected discounted cash flows, relevant swapcurves, and appropriate implied volatilities. Certain over-the-counter derivatives utilize unobservable market data,primarily independent broker quotes that are nonbinding quotes based on models that do not reflect the result of markettransactions, which are reflected in Level 3.
Our derivative contracts are generally documented under ISDA Master Agreements, which provide for legallyenforceable set-off and close-out netting of exposures to specific counterparties. Collateral arrangements are bilateraland based on current ratings of each entity. We utilize the LIBOR interest rate curve to value our positions, whichincludes a credit spread. This credit spread incorporates an appropriate level of nonperformance risk into our valuationsgiven the current ratings of our counterparties, as well as the collateral agreements in place. Counterparty credit risk isroutinely monitored to ensure our adjustment for non-performance risk is appropriate.
Interest Rate Contracts. We use discounted cash flow valuation techniques to determine the fair value of interest rateswaps using observable swap curves as the inputs. These are reflected in Level 2. In addition, we have a limited number ofcomplex inflation-linked interest rate swaps and interest rate collars that are valued using broker quotes. These arereflected in Level 3. We use option pricing models to determine the fair value of swaptions using observable swap interestrate curves and observable implied volatilities as inputs. These are reflected in Level 2.
Foreign Exchange Contracts. We use discounted cash flow valuation techniques that utilize observable swap curvesand exchange rates as the inputs to determine the fair value of foreign currency swaps. These are reflected in Level 2. Inaddition, we have a limited number of non-standard currency swaps that are valued using broker quotes. These arereflected within Level 3. Currency forwards are valued using observable market inputs, including forward currencyexchange rates. These are reflected in Level 2.
Equity Contracts. We use an option pricing model using observable implied volatilities, dividend yields, index pricesand swap curves as the inputs to determine the fair value of equity options. These are reflected in Level 2.
Credit Contracts. We use either the ISDA Credit Default Swap Standard discounted cash flow model that utilizesobservable default probabilities and recovery rates as inputs or broker prices to determine the fair value of credit defaultswaps. These are reflected in Level 3.
Other Contracts. We use broker prices to determine the fair value of commodity swaps. These are reflected in Level 3.
Other Investments
Other investments reported at fair value primarily include seed money investments, for which the fair value isdetermined using the net asset value of the fund. The net asset value of the fund represents the price at which we feel wewould be able to initiate a transaction. Seed money investments in mutual funds for which the net asset value is publishedare reflected in Level 1. Seed money investments in mutual funds or other investment funds in markets that do not have apublished net asset value are reflected in Level 2.
154

Principal Financial Group, Inc.
Notes to Consolidated Financial Statements — (continued)
14. Fair Value Measurements — (continued)
Other investments reported at fair value also include commercial mortgage loans of consolidated VIEs for which thefair value option was elected, which are reflected in Level 3. Fair value of these commercial mortgage loans is computedutilizing a discount rate based on the current market. The market discount rate is then adjusted based on various factorsthat differentiate it from our pool of loans.
The carrying amounts of other assets classified as other investments in the accompanying consolidated statements offinancial position, which are not measured at fair value on a recurring basis, approximate their fair values.
Cash and Cash Equivalents
Certain cash equivalents are reported at fair value on a recurring basis and include money market instruments andother short-term investments with maturities of less than three months. Fair values of these cash equivalents may bedetermined using public quotations, when available, which are reflected in Level 1. When public quotations are notavailable, because of the highly liquid nature of these assets, carrying amounts may be used to approximate fair values,which are reflected in Level 2.
The carrying amounts of cash and cash equivalents that are not reported at fair value on a recurring basisapproximate their fair value.
Separate Account Assets
Separate account assets include equity securities, debt securities and derivative instruments, for which fair values aredetermined as previously described, and are reflected in Level 1, Level 2 and Level 3. Separate account assets alsoinclude commercial mortgage loans, for which the fair value is estimated by discounting the expected total cash flowsusing market rates that are applicable to the yield, credit quality and maturity of the loans. The market clearing spreadsvary based on mortgage type, weighted average life, rating and liquidity. These are reflected in Level 3. Finally, separateaccount assets include real estate, for which the fair value is estimated using discounted cash flow valuation models thatutilize public real estate market data inputs such as transaction prices, market rents, vacancy levels, leasing absorption,market cap rates and discount rates. In addition, each property is appraised annually by an independent appraiser. Thereal estate within the separate accounts is reflected in Level 3.
Cash Collateral and Cash Collateral Payable
Cash collateral is not measured at fair value on a recurring basis. The carrying amounts of cash collateral receivedand posted under derivative credit support annex (collateral) agreements and the carrying amount of the payableassociated with our obligation to return the cash collateral received approximate their fair value.
Investment-Type Insurance Contracts
Investment-type insurance contracts are not measured at fair value on a recurring basis. The fair values of ourreserves and liabilities for investment-type insurance contracts are estimated using discounted cash flow analyses basedon current interest rates, including non-performance risk, being offered for similar contracts with maturities consistentwith those remaining for the investment-type contracts being valued. Investment-type insurance contracts includeinsurance, annuity and other policy contracts that do not involve significant mortality or morbidity risk and are only aportion of the policyholder liabilities appearing in the consolidated statements of financial position. Insurance contractsinclude insurance, annuity and other policy contracts that do involve significant mortality or morbidity risk. The fairvalues for our insurance contracts, other than investment-type contracts, are not required to be disclosed.
Certain annuity contracts and other investment-type insurance contracts include embedded derivatives that havebeen bifurcated from the host contract and that are measured at fair value on a recurring basis, which are reflected inLevel 3. The key assumptions for calculating the fair value of the embedded derivative liabilities are market assumptions(such as equity market returns, interest rate levels, market volatility and correlations) and policyholder behaviorassumptions (such as lapse, mortality, utilization and withdrawal patterns). They are valued using a combination ofhistorical data and actuarial judgment. Stochastic models are used to value the embedded derivatives that incorporate aspread reflecting our own creditworthiness and risk margins.
The assumption for our own non-performance risk for investment-type insurance contracts and any embeddedderivatives bifurcated from certain annuity and investment-type insurance contracts is based on the current market creditspreads for debt-like instruments that we have issued and are available in the market.
155

Principal Financial Group, Inc.
Notes to Consolidated Financial Statements — (continued)
14. Fair Value Measurements — (continued)
Short-Term Debt
Short-term debt is not measured at fair value on a recurring basis. The carrying amount of short-term debtapproximates its fair value because of the relatively short time between origination of the debt instrument and itsmaturity.
Long-Term Debt
Long-term debt is not measured at fair value on a recurring basis. Fair values for debt issues are estimated usingdiscounted cash flow analysis based on our incremental borrowing rate for similar borrowing arrangements.
Separate Account Liabilities
Separate account liabilities are not measured at fair value on a recurring basis. Fair values of separate accountliabilities, excluding insurance-related elements, are estimated based on market assumptions around what a potentialacquirer would pay for the associated block of business, including both the separate account assets and liabilities. As theapplicable separate account assets are already reflected at fair value, any adjustment to the fair value of the block is anassumed adjustment to the separate account liabilities. To compute fair value, the separate account liabilities areoriginally set to equal separate account assets because these are pass-through contracts. The separate account liabilitiesare reduced by the amount of future fees expected to be collected that are intended to offset upfront acquisition costsalready incurred that a potential acquirer would not have to pay. The estimated future fees are adjusted by an adversedeviation discount and the amount is then discounted at a risk-free rate as measured by the yield on U.S. Treasurysecurities at maturities aligned with the estimated timing of fee collection.
Bank Deposits
Bank deposits are not measured at fair value on a recurring basis. The fair value of deposits of our Principal Banksubsidiary with no stated maturity, such as demand deposits, savings, and interest-bearing demand accounts, is equal tothe amount payable on demand (i.e., their carrying amounts). The fair value of certificates of deposit is based on thediscounted value of contractual cash flows. The discount is estimated using the rates currently offered for deposits ofsimilar remaining maturities.
156

Principal Financial Group, Inc.
Notes to Consolidated Financial Statements — (continued)
14. Fair Value Measurements — (continued)
Other Liabilities
Certain obligations reported in other liabilities include embedded derivatives to deliver underlying securities ofstructured investments to third parties. The fair value of the embedded derivatives is calculated based on the value of theunderlying securities. We have had an embedded derivative in which the fair value of the underlying securities wasobtained from a third party pricing vendor and was reflected in Level 2. We also have an embedded derivative in whichthe fair value of the underlying securities is calculated utilizing the yield, credit quality and average maturity of eachsecurity, which is reflected in Level 3.
Additionally, obligations of consolidated VIEs for which the fair value option was elected are included in otherliabilities. These obligations are valued either based on prices obtained from third party pricing vendors as utilized anddescribed in our discussion of how fair value is determined for fixed maturities, which are reflected in Level 2, or brokerquotes, which are reflected in Level 3.
Assets and liabilities measured at fair value on a recurring basis
Assets and liabilities measured at fair value on a recurring basis are summarized below.
As of December 31, 2010
Assets /(liabilities) Fair value hierarchy levelmeasured atfair value Level 1 Level 2 Level 3
(in millions)AssetsFixed maturities, available-for-sale:
U.S. government and agencies . . . . . . . . . . . . . . . . . . . . . . . . . . . . . . . . . . . $ 769.3 $ 229.6 $ 539.7 $ —Non-U.S. governments . . . . . . . . . . . . . . . . . . . . . . . . . . . . . . . . . . . . . . . . 872.6 — 848.1 24.5States and political subdivisions . . . . . . . . . . . . . . . . . . . . . . . . . . . . . . . . . . 2,656.4 — 2,656.4 —Corporate . . . . . . . . . . . . . . . . . . . . . . . . . . . . . . . . . . . . . . . . . . . . . . . . 33,892.5 95.4 33,245.0 552.1Residential mortgage-backed securities . . . . . . . . . . . . . . . . . . . . . . . . . . . . . . 3,196.2 — 3,196.2 —Commercial mortgage-backed securities . . . . . . . . . . . . . . . . . . . . . . . . . . . . . 3,842.2 — 3,826.0 16.2Collateralized debt obligations . . . . . . . . . . . . . . . . . . . . . . . . . . . . . . . . . . . 293.0 — 183.7 109.3Other debt obligations . . . . . . . . . . . . . . . . . . . . . . . . . . . . . . . . . . . . . . . . 3,114.1 — 3,025.3 88.8
Total fixed maturities, available-for-sale . . . . . . . . . . . . . . . . . . . . . . . . . . . . . . . 48,636.3 325.0 47,520.4 790.9Fixed maturities, trading . . . . . . . . . . . . . . . . . . . . . . . . . . . . . . . . . . . . . . . . 1,120.3 159.8 691.4 269.1Equity securities, available-for-sale . . . . . . . . . . . . . . . . . . . . . . . . . . . . . . . . . . 169.9 124.1 2.6 43.2Equity securities, trading . . . . . . . . . . . . . . . . . . . . . . . . . . . . . . . . . . . . . . . . 316.9 212.9 104.0 —Derivative assets (1) . . . . . . . . . . . . . . . . . . . . . . . . . . . . . . . . . . . . . . . . . . . 1,083.2 — 1,049.9 33.3Other investments (2) . . . . . . . . . . . . . . . . . . . . . . . . . . . . . . . . . . . . . . . . . . 210.7 14.1 68.3 128.3Cash equivalents (3) . . . . . . . . . . . . . . . . . . . . . . . . . . . . . . . . . . . . . . . . . . . 1,247.2 217.3 1,029.9 —
Sub-total excluding separate account assets . . . . . . . . . . . . . . . . . . . . . . . . . . . 52,784.5 1,053.2 50,466.5 1,264.8
Separate account assets . . . . . . . . . . . . . . . . . . . . . . . . . . . . . . . . . . . . . . . . . 69,555.3 51,012.9 14,770.9 3,771.5
Total assets . . . . . . . . . . . . . . . . . . . . . . . . . . . . . . . . . . . . . . . . . . . . . . . $122,339.8 $52,066.1 $65,237.4 $5,036.3
LiabilitiesInvestment-type insurance contracts (4) . . . . . . . . . . . . . . . . . . . . . . . . . . . . . . . $ (6.6) $ — $ — $ (6.6)Derivative liabilities (1) . . . . . . . . . . . . . . . . . . . . . . . . . . . . . . . . . . . . . . . . . (1,274.5) — (1,093.0) (181.5)Other liabilities (4) . . . . . . . . . . . . . . . . . . . . . . . . . . . . . . . . . . . . . . . . . . . . (250.3) — (93.5) (156.8)
Total liabilities . . . . . . . . . . . . . . . . . . . . . . . . . . . . . . . . . . . . . . . . . . . . . $ (1,531.4) $ — $(1,186.5) $ (344.9)
Net assets (liabilities) . . . . . . . . . . . . . . . . . . . . . . . . . . . . . . . . . . . . . . . . . . $120,808.4 $52,066.1 $64,050.9 $4,691.4
157

Principal Financial Group, Inc.
Notes to Consolidated Financial Statements — (continued)
14. Fair Value Measurements — (continued)
As of December 31, 2009
Assets /(liabilities) Fair value hierarchy levelmeasured atfair value Level 1 Level 2 Level 3
(in millions)AssetsFixed maturities, available-for-sale:
U.S. government and agencies . . . . . . . . . . . . . . . . . . . . . . . . . . . . . . . . . . . $ 558.7 $ 25.1 $ 533.6 $ —Non-U.S. governments . . . . . . . . . . . . . . . . . . . . . . . . . . . . . . . . . . . . . . . . 854.9 — 838.8 16.1States and political subdivisions . . . . . . . . . . . . . . . . . . . . . . . . . . . . . . . . . . 2,048.6 — 2,037.1 11.5Corporate . . . . . . . . . . . . . . . . . . . . . . . . . . . . . . . . . . . . . . . . . . . . . . . . 32,930.8 100.8 32,092.7 737.3Residential mortgage-backed securities . . . . . . . . . . . . . . . . . . . . . . . . . . . . . . 3,133.1 — 3,133.1 —Commercial mortgage-backed securities . . . . . . . . . . . . . . . . . . . . . . . . . . . . . 3,599.7 — 3,565.4 34.3Collateralized debt obligations . . . . . . . . . . . . . . . . . . . . . . . . . . . . . . . . . . . 369.6 — 72.8 296.8Other debt obligations . . . . . . . . . . . . . . . . . . . . . . . . . . . . . . . . . . . . . . . . 2,725.2 — 2,648.6 76.6
Total fixed maturities, available-for-sale . . . . . . . . . . . . . . . . . . . . . . . . . . . . . . . 46,220.6 125.9 44,922.1 1,172.6Fixed maturities, trading . . . . . . . . . . . . . . . . . . . . . . . . . . . . . . . . . . . . . . . . 1,032.4 189.4 779.5 63.5Equity securities, available-for-sale . . . . . . . . . . . . . . . . . . . . . . . . . . . . . . . . . . 214.0 139.9 2.4 71.7Equity securities, trading . . . . . . . . . . . . . . . . . . . . . . . . . . . . . . . . . . . . . . . . 221.5 130.9 90.6 —Derivative assets (1) . . . . . . . . . . . . . . . . . . . . . . . . . . . . . . . . . . . . . . . . . . . 1,232.2 — 1,177.8 54.4Other investments (2) . . . . . . . . . . . . . . . . . . . . . . . . . . . . . . . . . . . . . . . . . . 74.7 15.7 59.0 —Cash equivalents (3) . . . . . . . . . . . . . . . . . . . . . . . . . . . . . . . . . . . . . . . . . . . 1,565.3 815.1 750.2 —
Sub-total excluding separate account assets . . . . . . . . . . . . . . . . . . . . . . . . . . . 50,560.7 1,416.9 47,781.6 1,362.2
Separate account assets . . . . . . . . . . . . . . . . . . . . . . . . . . . . . . . . . . . . . . . . . 62,738.5 40,503.0 18,114.8 4,120.7
Total assets . . . . . . . . . . . . . . . . . . . . . . . . . . . . . . . . . . . . . . . . . . . . . . . $113,299.2 $41,919.9 $65,896.4 $5,482.9
LiabilitiesInvestment-type insurance contracts (4) . . . . . . . . . . . . . . . . . . . . . . . . . . . . . . . $ (23.6) $ — $ — $ (23.6)Derivative liabilities (1) . . . . . . . . . . . . . . . . . . . . . . . . . . . . . . . . . . . . . . . . . (1,050.8) — (957.1) (93.7)Other liabilities (4) . . . . . . . . . . . . . . . . . . . . . . . . . . . . . . . . . . . . . . . . . . . . (99.2) — (10.1) (89.1)
Total liabilities . . . . . . . . . . . . . . . . . . . . . . . . . . . . . . . . . . . . . . . . . . . . . $ (1,173.6) $ — $ (967.2) $ (206.4)
Net assets (liabilities) . . . . . . . . . . . . . . . . . . . . . . . . . . . . . . . . . . . . . . . . . . $112,125.6 $41,919.9 $64,929.2 $5,276.5
(1) Within the consolidated statements of financial position, derivative assets are reported with other investments and derivative liabilities arereported with other liabilities. Refer to Note 5, Derivative Financial Instruments, for further information on fair value by class ofderivative instruments. Our derivatives are primarily Level 2, with the exception of some credit default swaps and other swaps that areLevel 3.
(2) Primarily includes seed money investments and, beginning in 2010, commercial mortgage loans of consolidated VIEs reported at fairvalue.
(3) Includes money market instruments and short-term investments with a maturity date of three months or less when purchased.
(4) Includes bifurcated embedded derivatives that are reported at fair value within the same line item in the consolidated statements offinancial position in which the host contract is reported and, beginning in 2010, other liabilities include obligations of consolidated VIEsreported at fair value.
158

Principal Financial Group, Inc.
Notes to Consolidated Financial Statements — (continued)
14. Fair Value Measurements — (continued)
Changes in Level 3 fair value measurements
The reconciliation for all assets and liabilities measured at fair value on a recurring basis using significantunobservable inputs (Level 3) are summarized as follows:
For the year ended December 31, 2010 Changes inEnding unrealizedTotal realized/unrealizedBeginning Purchases, asset / gains (losses)gains (losses)asset / sales, (liability) included in
(liability) Included issuances balance net incomebalance as of Included in other and Transfers Transfers as of relating toDecember 31, in net comprehensive settlements into out of December 31, positions
2009 income (1) income (4) Level 3 Level 3 2010 still held (1)
(in millions)AssetsFixed maturities, available-for-sale:
Non-U.S. governments . . . . . . . . . . . $ 16.1 $ (0.1) $ 0.1 $ 8.4 $ — $ — $ 24.5 $ (0.1)State and political subdivisions . . . . . . 11.5 — 1.0 — 11.5 (24.0) — —Corporate . . . . . . . . . . . . . . . . . . . 737.3 0.7 26.9 (193.2) 152.2 (171.8) 552.1 (2.2)Commercial mortgage-backed securities . 34.3 (0.1) 1.0 11.2 — (30.2) 16.2 (0.1)Collateralized debt obligations . . . . . . 296.8 (14.9) 40.0 (125.2) 0.9 (88.3) 109.3 (1.9)Other debt obligations . . . . . . . . . . . 76.6 — 4.5 36.9 32.9 (62.1) 88.8 —
Total fixed maturities, available-for-sale . . 1,172.6 (14.4) 73.5 (261.9) 197.5 (376.4) 790.9 (4.3)Fixed maturities, trading . . . . . . . . . . . . 63.5 13.5 — 194.1 — (2.0) 269.1 13.2Equity securities, available-for-sale . . . . . 71.7 2.6 (8.2) (21.4) 0.1 (1.6) 43.2 3.3Derivative assets . . . . . . . . . . . . . . . . . 54.4 (18.3) (0.1) (2.7) — — 33.3 (17.1)Other investments . . . . . . . . . . . . . . . . — 25.9 — 102.4 — — 128.3 25.9Separate account assets (2) . . . . . . . . . . 4,120.7 304.0 (0.4) (564.2) 28.5 (117.1) 3,771.5 249.0
LiabilitiesInvestment-type insurance contracts . . . . (23.6) (8.2) — 25.2 — — (6.6) (8.6)Derivative liabilities . . . . . . . . . . . . . . . (93.7) 9.9 (1.4) (96.3) — — (181.5) 8.0Other liabilities (3) . . . . . . . . . . . . . . . (89.1) 9.3 (28.3) (48.7) — — (156.8) 2.3
159

Principal Financial Group, Inc.
Notes to Consolidated Financial Statements — (continued)
14. Fair Value Measurements — (continued)
For the year ended December 31, 2009 Changes inunrealizedTotal realized/unrealizedBeginning Ending gains (losses)gains (losses)asset / Purchases, asset / included in
(liability) Included sales, Transfers (liability) net incomebalance as of Included in other issuances in (out) balance as of relating toDecember 31, in net comprehensive and of December 31, positions
2008 income (1) income settlements Level 3 2009 still held (1)
(in millions)AssetsFixed maturities, available-for-sale:
Non-U.S. governments . . . . . . . . . . . . . . . . . . $ 45.3 $ (10.3) $ 2.4 $ (21.3) $ — $ 16.1 $ (0.1)State and political subdivisions . . . . . . . . . . . . . — — 1.3 — 10.2 11.5 —Corporate . . . . . . . . . . . . . . . . . . . . . . . . . . 750.9 (26.7) 160.6 (348.3) 200.8 737.3 (32.2)Commercial mortgage-backed securities . . . . . . . 58.0 (0.3) 9.8 (12.1) (21.1) 34.3 —Collateralized debt obligations . . . . . . . . . . . . . 236.8 (63.9) 150.4 (10.6) (15.9) 296.8 (63.5)Other debt obligations . . . . . . . . . . . . . . . . . . 82.0 (2.1) 17.4 25.9 (46.6) 76.6 —
Total fixed maturities, available-for-sale . . . . . . . . 1,173.0 (103.3) 341.9 (366.4) 127.4 1,172.6 (95.8)Fixed maturities, trading . . . . . . . . . . . . . . . . . . 60.7 13.0 — — (10.2) 63.5 13.1Equity securities, available-for-sale . . . . . . . . . . . 56.2 (0.2) 30.3 (43.7) 29.1 71.7 (2.0)Derivative assets . . . . . . . . . . . . . . . . . . . . . . . 100.7 (43.6) (0.2) (2.5) — 54.4 (30.5)Separate account assets (2) . . . . . . . . . . . . . . . . 6,042.3 (1,601.5) — (291.6) (28.5) 4,120.7 (1,488.3)
LiabilitiesInvestment-type insurance contracts . . . . . . . . . . . (60.2) 10.8 — 25.8 — (23.6) 10.8Derivative liabilities . . . . . . . . . . . . . . . . . . . . . (266.9) 141.4 7.2 24.6 — (93.7) 88.8Other liabilities (3) . . . . . . . . . . . . . . . . . . . . . (103.8) — 33.2 (18.5) — (89.1) —
Changes inFor the year ended December 31, 2008 unrealized
gains (losses)Total realized/unrealizedBeginning Ending includedgains (losses)asset / Purchases, asset / in net(liability) Included sales, Transfers (liability) income
balance as of Included in other issuances in (out) balance as of relating toJanuary 1, in net comprehensive and of December 31, positions
2008 income (1) income settlements Level 3 2008 still held (1)
(in millions)AssetsFixed maturities, available-for-sale . . . . . . . . . . . . $2,201.3 $(148.5) $(507.8) $(567.2) $ 195.2 $1,173.0 $(116.7)Fixed maturities, trading . . . . . . . . . . . . . . . . . . 92.3 (19.1) — (11.4) (1.1) 60.7 (19.1)Equity securities, available-for-sale . . . . . . . . . . . . 51.1 (41.5) (12.1) 20.7 38.0 56.2 (35.3)Derivative assets . . . . . . . . . . . . . . . . . . . . . . . 54.3 74.7 (15.8) (12.5) — 100.7 62.4Separate account assets (2) . . . . . . . . . . . . . . . . 7,313.2 (958.9) 1.0 (209.5) (103.5) 6,042.3 (944.1)
LiabilitiesInvestment-type insurance contracts . . . . . . . . . . . (49.3) (58.4) (0.1) 47.6 — (60.2) (70.4)Derivative liabilities . . . . . . . . . . . . . . . . . . . . . (62.3) (200.0) (8.1) 3.5 — (266.9) (192.9)Other liabilities (3) . . . . . . . . . . . . . . . . . . . . . (155.6) — 70.0 (18.2) — (103.8) —
(1) Both realized gains (losses) and mark-to-market unrealized gains (losses) are generally reported in net realized capital gains (losses)within the consolidated statements of operations. Realized and unrealized gains (losses) on certain fixed maturities, trading and certainderivatives used in relation to certain trading portfolios are reported in net investment income within the consolidated statements ofoperations.
(2) Gains and losses for separate account assets do not impact net income as the change in value of separate account assets is offset by achange in value of separate account liabilities. Foreign currency translation adjustments related to the Principal International segmentseparate account assets are recorded in AOCI and are offset by foreign currency translation adjustments of the corresponding separateaccount liabilities.
(3) Certain embedded derivatives reported in other liabilities are part of a cash flow hedge, with the effective portion of the unrealized gains(losses) recorded in AOCI.
(4) As a result of our implementation of new authoritative guidance related to the accounting for VIEs effective January 1, 2010, certainpreviously unconsolidated VIEs were consolidated and certain previously consolidated VIEs were deconsolidated. The fair value of theLevel 3 assets and liabilities of the newly consolidated and deconsolidated VIEs is primarily included in fixed maturities, trading; otherinvestments; derivative liabilities and other liabilities. As a result of our implementation of new authoritative guidance related to theaccounting for embedded credit derivatives effective July 1, 2010, we elected the fair value option for certain securities previously includedin fixed maturities, available-for-sale, effectively reclassifying them to fixed maturities, trading.
160

Principal Financial Group, Inc.
Notes to Consolidated Financial Statements — (continued)
14. Fair Value Measurements — (continued)
Transfers
Transfers between fair value hierarchy levels are recognized at the beginning of the reporting period.
Assets transferred into Level 3 during 2010, 2009 and 2008 were $226.1 million, $531.9 million and $1,410.8 million,respectively. The majority of assets transferred into Level 3 primarily include those assets for which we are now unable toobtain pricing from a recognized third party pricing vendor and, to a lesser extent, assets added to our ‘‘watch list’’ thatwere previously priced using a matrix pricing valuation approach that may no longer be relevant when applied to asset-specific situations.
Assets transferred out of Level 3 during 2010, 2009 and 2008 were $497.1 million, $414.1 million and$1,282.2 million, respectively. The majority of assets that transferred out of Level 3 include those for which we are nowable to obtain pricing from a recognized third party pricing vendor.
We had significant transfers of separate account assets between Level 1 and Level 2, primarily related to foreignequity securities. When these securities are valued at the local close price of the exchange where the assets traded, theyare reflected in Level 1. When events materially affecting the value occur between the close of the local exchange and theNew York Stock Exchange, we use adjusted prices determined by a third party pricing vendor to update the foreignmarket closing prices and the fair value is reflected in Level 2. During 2010, $6,600.6 million of separate account assetstransferred out of Level 2 into Level 1. During 2010, $3,128.3 million of separate account assets transferred out of Level 1into Level 2.
Other transfers into and out of Level 2 during 2010 primarily included those that transferred out of and into Level 3,respectively.
Assets and Liabilities Measured at Fair Value on a Nonrecurring Basis
Certain assets are measured at fair value on a nonrecurring basis. During 2010, certain mortgage loans had beenimpaired or written down to fair value of $250.7 million. The impairments resulted in a loss of $79.6 million that wasrecorded in net realized capital gains (losses) as part of the mortgage loan valuation allowance. These collateral-dependent mortgage loans are a Level 3 fair value measurement, as fair value is based on the fair value of the underlyingreal estate collateral, which is estimated using appraised values that involve significant unobservable inputs.
During 2010, real estate had been written down to fair value of $1.4 million. This write down resulted in a loss of$0.3 million that was recorded in net realized capital gains (losses). This is a Level 3 fair value measurement, as the fairvalue of real estate is estimated using appraised values that involve significant unobservable inputs.
During 2010, mortgage servicing rights had been written down to fair value of $1.0 million, resulting in a charge of$0.6 million that was recorded in operating expenses. These mortgage servicing rights are a Level 3 fair valuemeasurement, as fair value is determined by calculating the present value of the future servicing cash flows from theunderlying mortgage loans.
During 2010, we impaired goodwill and finite lived intangible assets. See Note 2, Goodwill and Other IntangibleAssets, for further details.
During 2009, mortgage loans had been written down to fair value of $3.9 million. This write down resulted in a lossof $8.0 million that was recorded in net realized capital gains (losses). These collateral-dependent mortgage loans are aLevel 3 fair value measurement, as fair value is based on the fair value of the underlying real estate collateral, which isestimated using appraised values that involve significant unobservable inputs.
During 2009, real estate had been written down to fair value of $0.9 million. This write down resulted in a loss of$0.8 million that was recorded in net realized capital gains (losses). This is a Level 3 fair value measurement, as the fairvalue of the real estate is estimated using appraised values that involve significant unobservable inputs.
During 2009, a customer-based intangible asset that resulted from our acquisition of WM Advisors, Inc. had beenwritten down to fair value of $19.1 million. The cash flows associated with this intangible are credited to an outside party.As a result, a long-term debt obligation that we assumed with the purchase of WM Advisors, Inc. was also written downto a fair value of $19.1 million. There was no impact to our consolidated statement of operations, as both of these write-downs are reported in operating expenses. This is a Level 3 fair value measurement, as the fair value is determined bycalculating the present value of future cash flows that are expected to emerge from the customer-based intangible asset.
During 2008, mortgage servicing rights had been written down to fair value of $13.4 million, resulting in a charge of$1.5 million that was recorded in operating expenses. These mortgage servicing rights are a Level 3 fair value
161
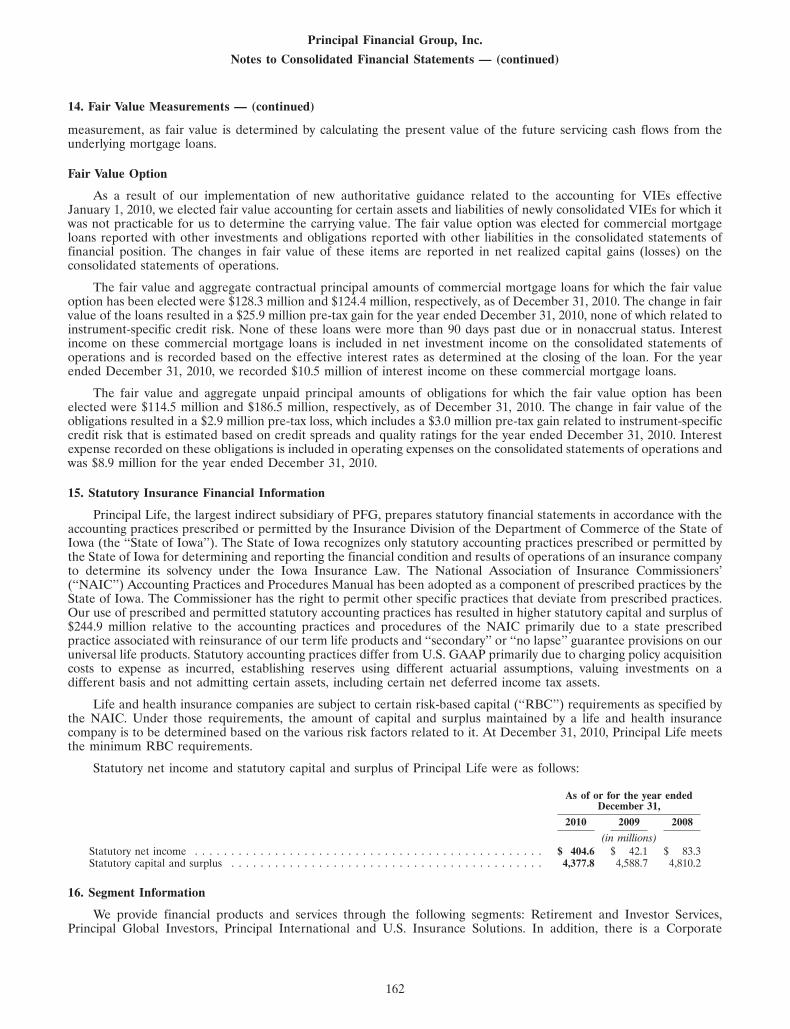
Principal Financial Group, Inc.
Notes to Consolidated Financial Statements — (continued)
14. Fair Value Measurements — (continued)
measurement, as fair value is determined by calculating the present value of the future servicing cash flows from theunderlying mortgage loans.
Fair Value Option
As a result of our implementation of new authoritative guidance related to the accounting for VIEs effectiveJanuary 1, 2010, we elected fair value accounting for certain assets and liabilities of newly consolidated VIEs for which itwas not practicable for us to determine the carrying value. The fair value option was elected for commercial mortgageloans reported with other investments and obligations reported with other liabilities in the consolidated statements offinancial position. The changes in fair value of these items are reported in net realized capital gains (losses) on theconsolidated statements of operations.
The fair value and aggregate contractual principal amounts of commercial mortgage loans for which the fair valueoption has been elected were $128.3 million and $124.4 million, respectively, as of December 31, 2010. The change in fairvalue of the loans resulted in a $25.9 million pre-tax gain for the year ended December 31, 2010, none of which related toinstrument-specific credit risk. None of these loans were more than 90 days past due or in nonaccrual status. Interestincome on these commercial mortgage loans is included in net investment income on the consolidated statements ofoperations and is recorded based on the effective interest rates as determined at the closing of the loan. For the yearended December 31, 2010, we recorded $10.5 million of interest income on these commercial mortgage loans.
The fair value and aggregate unpaid principal amounts of obligations for which the fair value option has beenelected were $114.5 million and $186.5 million, respectively, as of December 31, 2010. The change in fair value of theobligations resulted in a $2.9 million pre-tax loss, which includes a $3.0 million pre-tax gain related to instrument-specificcredit risk that is estimated based on credit spreads and quality ratings for the year ended December 31, 2010. Interestexpense recorded on these obligations is included in operating expenses on the consolidated statements of operations andwas $8.9 million for the year ended December 31, 2010.
15. Statutory Insurance Financial Information
Principal Life, the largest indirect subsidiary of PFG, prepares statutory financial statements in accordance with theaccounting practices prescribed or permitted by the Insurance Division of the Department of Commerce of the State ofIowa (the ‘‘State of Iowa’’). The State of Iowa recognizes only statutory accounting practices prescribed or permitted bythe State of Iowa for determining and reporting the financial condition and results of operations of an insurance companyto determine its solvency under the Iowa Insurance Law. The National Association of Insurance Commissioners’(‘‘NAIC’’) Accounting Practices and Procedures Manual has been adopted as a component of prescribed practices by theState of Iowa. The Commissioner has the right to permit other specific practices that deviate from prescribed practices.Our use of prescribed and permitted statutory accounting practices has resulted in higher statutory capital and surplus of$244.9 million relative to the accounting practices and procedures of the NAIC primarily due to a state prescribedpractice associated with reinsurance of our term life products and ‘‘secondary’’ or ‘‘no lapse’’ guarantee provisions on ouruniversal life products. Statutory accounting practices differ from U.S. GAAP primarily due to charging policy acquisitioncosts to expense as incurred, establishing reserves using different actuarial assumptions, valuing investments on adifferent basis and not admitting certain assets, including certain net deferred income tax assets.
Life and health insurance companies are subject to certain risk-based capital (‘‘RBC’’) requirements as specified bythe NAIC. Under those requirements, the amount of capital and surplus maintained by a life and health insurancecompany is to be determined based on the various risk factors related to it. At December 31, 2010, Principal Life meetsthe minimum RBC requirements.
Statutory net income and statutory capital and surplus of Principal Life were as follows:
As of or for the year endedDecember 31,
2010 2009 2008
(in millions)Statutory net income . . . . . . . . . . . . . . . . . . . . . . . . . . . . . . . . . . . . . . . . . . . . . . . . $ 404.6 $ 42.1 $ 83.3Statutory capital and surplus . . . . . . . . . . . . . . . . . . . . . . . . . . . . . . . . . . . . . . . . . . . 4,377.8 4,588.7 4,810.2
16. Segment Information
We provide financial products and services through the following segments: Retirement and Investor Services,Principal Global Investors, Principal International and U.S. Insurance Solutions. In addition, there is a Corporate
162

Principal Financial Group, Inc.
Notes to Consolidated Financial Statements — (continued)
16. Segment Information — (continued)
segment. The segments are managed and reported separately because they provide different products and services, havedifferent strategies or have different markets and distribution channels.
Prior to third quarter 2010, amounts now reported in the U.S. Insurance Solutions segment and amounts for ourgroup medical insurance business now reported in the Corporate segment were reported together in the Life and HealthInsurance segment. This change was made due to our decision to exit the group medical insurance business (insured andadministrative services only) and has no impact on our consolidated financial statements for any period presented. Oursegment results for 2009 and 2008 have been restated to conform to the current segment presentation. With the exceptionof corporate overhead, amounts related to our group medical insurance business previously included in segmentoperating earnings have been removed from operating earnings for all periods presented and are reported as otherafter-tax adjustments.
The Retirement and Investor Services segment provides retirement and related financial products and servicesprimarily to businesses, their employees and other individuals.
The Principal Global Investors segment provides asset management services to our asset accumulation business, ourinsurance operations, the Corporate segment and third-party clients.
The Principal International segment has operations in Brazil, Chile, China, Hong Kong Special AdministrativeRegion, India, Indonesia, Malaysia, Mexico, Singapore and Thailand. We focus on countries with large middle classes,favorable demographics and growing long-term savings, ideally with defined contribution markets. We entered thesecountries through acquisitions, start-up operations and joint ventures.
The U.S. Insurance Solutions segment provides individual life insurance and specialty benefits, which consists ofgroup dental and vision insurance, individual and group disability insurance and group life insurance, throughout theUnited States.
The Corporate segment manages the assets representing capital that has not been allocated to any other segment.Financial results of the Corporate segment primarily reflect our financing activities (including interest expense andpreferred stock dividends), income on capital not allocated to other segments, inter-segment eliminations, income taxrisks and certain income, expenses and other after-tax adjustments not allocated to the segments based on the nature ofsuch items.
Management uses segment operating earnings in goal setting, as a basis for determining employee compensation andin evaluating performance on a basis comparable to that used by securities analysts. We determine segment operatingearnings by adjusting U.S. GAAP net income for net realized capital gains (losses), as adjusted, and other after-taxadjustments which management believes are not indicative of overall operating trends. Net realized capital gains (losses),as adjusted, are net of income taxes, related changes in the amortization pattern of DPAC and sales inducements,recognition of deferred front-end fee revenues for sales charges on retirement products and services, net realized capitalgains and losses distributed, noncontrolling interest capital gains and losses and certain market value adjustments to feerevenues. Net realized capital gains (losses), as adjusted, exclude periodic settlements and accruals on derivativeinstruments not designated as hedging instruments and exclude certain market value adjustments of embeddedderivatives and realized capital gains (losses) associated with our exited group medical insurance business. Segmentoperating revenues exclude net realized capital gains (losses) (except periodic settlements and accruals on derivatives notdesignated as hedging instruments), including their impact on recognition of front-end fee revenues and certain marketvalue adjustments to fee revenues, revenue from our exited group medical insurance business and revenue from ourterminated commercial mortgage securities issuance operation. Segment operating revenues include operating revenuesfrom real estate properties that qualify for discontinued operations. While these items may be significant components inunderstanding and assessing the consolidated financial performance, management believes the presentation of segmentoperating earnings enhances the understanding of our results of operations by highlighting earnings attributable to thenormal, ongoing operations of the business.
The accounting policies of the segments are consistent with the accounting policies for the consolidated financialstatements, with the exception of income tax allocation. The Corporate segment functions to absorb the risk inherent ininterpreting and applying tax law. The segments are allocated tax adjustments consistent with the positions we took on taxreturns. The Corporate segment results reflect any differences between the tax returns and the estimated resolution ofany disputes.
163

Principal Financial Group, Inc.
Notes to Consolidated Financial Statements — (continued)
16. Segment Information — (continued)
The following tables summarize selected financial information by segment and reconcile segment totals to thosereported in the consolidated financial statements:
December 31,
2010 2009
(in millions)Assets:Retirement and Investor Services . . . . . . . . . . . . . . . . . . . . . . . . . . . . . . . . . . . . . . . . . . . . . $110,043.0 $106,881.9Principal Global Investors . . . . . . . . . . . . . . . . . . . . . . . . . . . . . . . . . . . . . . . . . . . . . . . . . . 1,308.1 1,276.7Principal International . . . . . . . . . . . . . . . . . . . . . . . . . . . . . . . . . . . . . . . . . . . . . . . . . . . . 12,774.5 10,301.7U.S. Insurance Solutions . . . . . . . . . . . . . . . . . . . . . . . . . . . . . . . . . . . . . . . . . . . . . . . . . . 16,558.2 15,097.7Corporate . . . . . . . . . . . . . . . . . . . . . . . . . . . . . . . . . . . . . . . . . . . . . . . . . . . . . . . . . . . . 4,947.3 4,201.4
Total consolidated assets . . . . . . . . . . . . . . . . . . . . . . . . . . . . . . . . . . . . . . . . . . . . . . . . . $145,631.1 $137,759.4
For the year endedDecember 31,
2010 2009 2008
(in millions)Operating revenues by segment:Retirement and Investor Services . . . . . . . . . . . . . . . . . . . . . . . . . . . . . . . . . . . . . . . $4,124.4 $ 4,041.5 $ 4,798.4Principal Global Investors . . . . . . . . . . . . . . . . . . . . . . . . . . . . . . . . . . . . . . . . . . . . 481.4 439.4 598.5Principal International . . . . . . . . . . . . . . . . . . . . . . . . . . . . . . . . . . . . . . . . . . . . . . 779.9 562.1 849.0U.S. Insurance Solutions . . . . . . . . . . . . . . . . . . . . . . . . . . . . . . . . . . . . . . . . . . . . . 2,775.1 2,812.6 2,893.6Corporate . . . . . . . . . . . . . . . . . . . . . . . . . . . . . . . . . . . . . . . . . . . . . . . . . . . . . . (118.9) (143.4) (176.8)
Total segment operating revenues . . . . . . . . . . . . . . . . . . . . . . . . . . . . . . . . . . . . . 8,041.9 7,712.2 8,962.7Net realized capital losses (except periodic settlements and accruals on non-hedge
derivatives), including recognition of front-end fee revenues and certain market valueadjustments to fee revenues . . . . . . . . . . . . . . . . . . . . . . . . . . . . . . . . . . . . . . . . (286.4) (473.2) (757.1)
Exited group medical insurance business . . . . . . . . . . . . . . . . . . . . . . . . . . . . . . . . . 1,403.9 1,610.6 1,762.5Terminated commercial mortgage securities issuance operation . . . . . . . . . . . . . . . . . . . (0.8) (0.5) (32.2)
Total revenues per consolidated statements of operations . . . . . . . . . . . . . . . . . . . . . . . $9,158.6 $ 8,849.1 $ 9,935.9
Operating earnings (loss) by segment, net of related income taxes:Retirement and Investor Services . . . . . . . . . . . . . . . . . . . . . . . . . . . . . . . . . . . . . . . $ 584.4 $ 510.4 $ 531.3Principal Global Investors . . . . . . . . . . . . . . . . . . . . . . . . . . . . . . . . . . . . . . . . . . . . 58.5 38.2 94.4Principal International . . . . . . . . . . . . . . . . . . . . . . . . . . . . . . . . . . . . . . . . . . . . . . 136.9 118.9 126.3U.S. Insurance Solutions . . . . . . . . . . . . . . . . . . . . . . . . . . . . . . . . . . . . . . . . . . . . . 193.7 204.1 208.0Corporate . . . . . . . . . . . . . . . . . . . . . . . . . . . . . . . . . . . . . . . . . . . . . . . . . . . . . . (128.7) (138.3) (115.4)
Total segment operating earnings, net of related income taxes . . . . . . . . . . . . . . . . . . . . 844.8 733.3 844.6Net realized capital losses, as adjusted (1) . . . . . . . . . . . . . . . . . . . . . . . . . . . . . . . . . (194.2) (213.4) (503.5)Other after-tax adjustments (2) . . . . . . . . . . . . . . . . . . . . . . . . . . . . . . . . . . . . . . . . 15.7 69.8 84.0
Net income available to common stockholders per consolidated statements of operations . . $ 666.3 $ 589.7 $ 425.1
(1) Net realized capital losses, as adjusted, is derived as follows:For the year ended
December 31,
2010 2009 2008
(in millions)Net realized capital losses:Net realized capital losses . . . . . . . . . . . . . . . . . . . . . . . . . . . . . . . . . . . . . . . . . . . . . . . $(191.5) $(398.3) $(694.1)Periodic settlements and accruals on non-hedge derivatives . . . . . . . . . . . . . . . . . . . . . . . . . . (90.0) (69.0) (59.1)Certain market value adjustments to fee revenues . . . . . . . . . . . . . . . . . . . . . . . . . . . . . . . . (3.4) (1.5) (3.9)Recognition of front-end fee revenues . . . . . . . . . . . . . . . . . . . . . . . . . . . . . . . . . . . . . . . (1.5) (4.4) —
Net realized capital losses, net of related revenue adjustments . . . . . . . . . . . . . . . . . . . . . . (286.4) (473.2) (757.1)Amortization of deferred policy acquisition and sales inducement costs . . . . . . . . . . . . . . . . . . (25.2) 156.4 (47.2)Capital (gains) losses distributed . . . . . . . . . . . . . . . . . . . . . . . . . . . . . . . . . . . . . . . . . . . (12.0) (19.8) 50.2Certain market value adjustments of embedded derivatives . . . . . . . . . . . . . . . . . . . . . . . . . . 7.2 11.8 (9.5)Net realized capital losses associated with exited group medical insurance business . . . . . . . . . . . 3.0 0.5 2.8Noncontrolling interest capital (gains) losses . . . . . . . . . . . . . . . . . . . . . . . . . . . . . . . . . . . (11.6) (18.6) 0.9Income tax effect . . . . . . . . . . . . . . . . . . . . . . . . . . . . . . . . . . . . . . . . . . . . . . . . . . . . 130.8 129.5 256.4
Net realized capital losses, as adjusted . . . . . . . . . . . . . . . . . . . . . . . . . . . . . . . . . . . . . $(194.2) $(213.4) $(503.5)
164

Principal Financial Group, Inc.
Notes to Consolidated Financial Statements — (continued)
16. Segment Information — (continued)
(2) In 2010, other after-tax adjustments included (1) the positive effect of gains associated with our exited group medical insurance businessthat does not yet qualify for discontinued operations accounting treatment under U.S. GAAP ($24.0 million) and (2) the negative effectresulting from: (a) the tax impact of healthcare reform, which eliminates the tax deductibility of retiree prescription drug expenses relatedto our employees incurred after 2012 ($7.8 million) and (b) losses associated with our terminated commercial mortgage securities issuanceoperation that has been exited but does not qualify for discontinued operations accounting treatment under U.S. GAAP ($0.5 million).
In 2009, other after-tax adjustments included the positive effect of gains associated with our exited group medical insurance business thatdoes not yet qualify for discontinued operations accounting treatment under U.S. GAAP ($70.5 million) and the negative effect of lossesassociated with our terminated commercial mortgage securities issuance operation that has been exited but does not qualify fordiscontinued operations accounting treatment under U.S. GAAP ($0.7 million).
In 2008, other after-tax adjustments included (1) the positive effect of: (a) gains associated with our exited group medical insurancebusiness that does not yet qualify for discontinued operations accounting treatment under U.S. GAAP ($96.3 million) (b) tax refinementsrelated to prior years ($8.2 million) and (c) a change in an estimated loss related to a prior year legal contingency ($7.6 million) and (2) thenegative effect of losses associated with our terminated commercial mortgage securities issuance operation that has been exited but doesnot qualify for discontinued operations accounting treatment under U.S. GAAP ($28.1 million).
The following is a summary of income tax expense (benefit) allocated to our segments for purposes of determiningoperating earnings. Segment income taxes are reconciled to income taxes reported on our consolidated statements ofoperations.
For the year endedDecember 31,
2010 2009 2008
(in millions)Income tax expense (benefit) by segment:Retirement and Investor Services . . . . . . . . . . . . . . . . . . . . . . . . . . . . . . . . . . . . . . . . . . $ 170.5 $ 144.2 $ 138.2Principal Global Investors . . . . . . . . . . . . . . . . . . . . . . . . . . . . . . . . . . . . . . . . . . . . . . . 33.7 21.0 50.9Principal International . . . . . . . . . . . . . . . . . . . . . . . . . . . . . . . . . . . . . . . . . . . . . . . . . (0.4) 0.5 (14.5)U.S. Insurance Solutions . . . . . . . . . . . . . . . . . . . . . . . . . . . . . . . . . . . . . . . . . . . . . . . . 91.5 97.8 99.6Corporate . . . . . . . . . . . . . . . . . . . . . . . . . . . . . . . . . . . . . . . . . . . . . . . . . . . . . . . . . (61.4) (71.4) (62.3)
Total segment income taxes from operating earnings . . . . . . . . . . . . . . . . . . . . . . . . . . . . . . 233.9 192.1 211.9Tax benefit related to net realized capital losses, as adjusted . . . . . . . . . . . . . . . . . . . . . . . . (130.8) (129.5) (256.4)Tax expense related to other after-tax adjustments . . . . . . . . . . . . . . . . . . . . . . . . . . . . . . 21.0 37.5 40.0
Total income tax expense (benefit) per consolidated statements of operations . . . . . . . . . . . . . . $ 124.1 $ 100.1 $ (4.5)
165

Principal Financial Group, Inc.
Notes to Consolidated Financial Statements — (continued)
16. Segment Information — (continued)
The following table summarizes operating revenues for our products and services:
For the year endedDecember 31,
2010 2009 2008
(in millions)Retirement and Investor Services:
Full-service accumulation . . . . . . . . . . . . . . . . . . . . . . . . . . . . . . . . . . . . . . . . . . . . $1,336.4 $1,283.9 $1,400.8Principal Funds . . . . . . . . . . . . . . . . . . . . . . . . . . . . . . . . . . . . . . . . . . . . . . . . . . 507.3 445.3 633.3Individual annuities . . . . . . . . . . . . . . . . . . . . . . . . . . . . . . . . . . . . . . . . . . . . . . . . 1,018.6 945.6 1,017.1Bank and trust services . . . . . . . . . . . . . . . . . . . . . . . . . . . . . . . . . . . . . . . . . . . . . 91.8 83.9 74.4Eliminations . . . . . . . . . . . . . . . . . . . . . . . . . . . . . . . . . . . . . . . . . . . . . . . . . . . . (100.3) (89.1) (177.1)
Total Accumulation . . . . . . . . . . . . . . . . . . . . . . . . . . . . . . . . . . . . . . . . . . . . . . 2,853.8 2,669.6 2,948.5Investment only . . . . . . . . . . . . . . . . . . . . . . . . . . . . . . . . . . . . . . . . . . . . . . . . . . 643.4 796.0 1,138.0Full-service payout . . . . . . . . . . . . . . . . . . . . . . . . . . . . . . . . . . . . . . . . . . . . . . . . 627.2 575.9 711.9
Total Guaranteed . . . . . . . . . . . . . . . . . . . . . . . . . . . . . . . . . . . . . . . . . . . . . . . . 1,270.6 1,371.9 1,849.9
Total Retirement and Investor Services . . . . . . . . . . . . . . . . . . . . . . . . . . . . . . . . . 4,124.4 4,041.5 4,798.4Principal Global Investors (1) . . . . . . . . . . . . . . . . . . . . . . . . . . . . . . . . . . . . . . . . . . . 481.4 439.4 598.5Principal International . . . . . . . . . . . . . . . . . . . . . . . . . . . . . . . . . . . . . . . . . . . . . . . 779.9 562.1 849.0U.S. Insurance Solutions:
Individual life insurance . . . . . . . . . . . . . . . . . . . . . . . . . . . . . . . . . . . . . . . . . . . . . 1,361.5 1,358.0 1,393.4Specialty benefits insurance . . . . . . . . . . . . . . . . . . . . . . . . . . . . . . . . . . . . . . . . . . . 1,413.6 1,454.6 1,500.2
Total U.S. Insurance Solutions . . . . . . . . . . . . . . . . . . . . . . . . . . . . . . . . . . . . . . . 2,775.1 2,812.6 2,893.6Corporate . . . . . . . . . . . . . . . . . . . . . . . . . . . . . . . . . . . . . . . . . . . . . . . . . . . . . . . (118.9) (143.4) (176.8)
Total operating revenues . . . . . . . . . . . . . . . . . . . . . . . . . . . . . . . . . . . . . . . . . . . . . . $8,041.9 $7,712.2 $8,962.7
Total operating revenues . . . . . . . . . . . . . . . . . . . . . . . . . . . . . . . . . . . . . . . . . . . . . . $8,041.9 $7,712.2 $8,962.7Net realized capital losses (except periodic settlements and accruals on non-hedge
derivatives), including recognition of front-end fee revenues and certain market valueadjustments to fee revenues . . . . . . . . . . . . . . . . . . . . . . . . . . . . . . . . . . . . . . . . . (286.4) (473.2) (757.1)
Exited group medical insurance business . . . . . . . . . . . . . . . . . . . . . . . . . . . . . . . . . . 1,403.9 1,610.6 1,762.5Terminated commercial mortgage securities issuance operation . . . . . . . . . . . . . . . . . . . . (0.8) (0.5) (32.2)
Total revenues per consolidated statements of operations . . . . . . . . . . . . . . . . . . . . . . . . . $9,158.6 $8,849.1 $9,935.9
(1) Reflects inter-segment revenues of $203.1 million, $195.4 million and $239.9 million in 2010, 2009 and 2008, respectively. These revenuesare eliminated within the Corporate segment.
166
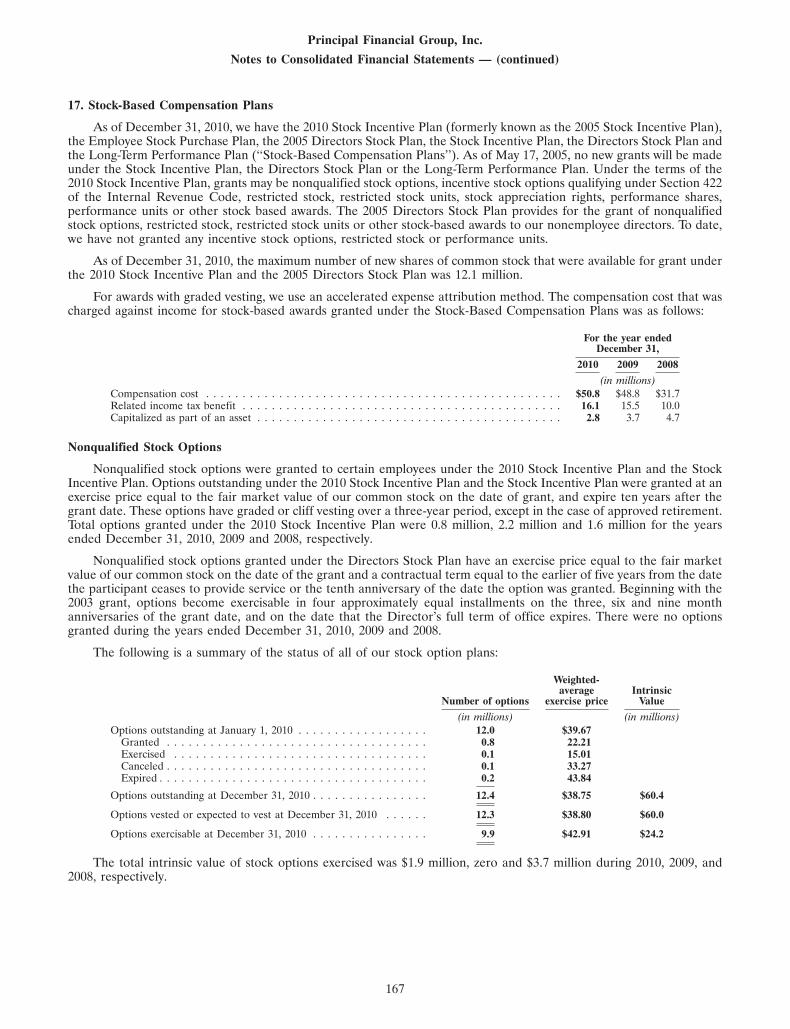
Principal Financial Group, Inc.
Notes to Consolidated Financial Statements — (continued)
17. Stock-Based Compensation Plans
As of December 31, 2010, we have the 2010 Stock Incentive Plan (formerly known as the 2005 Stock Incentive Plan),the Employee Stock Purchase Plan, the 2005 Directors Stock Plan, the Stock Incentive Plan, the Directors Stock Plan andthe Long-Term Performance Plan (‘‘Stock-Based Compensation Plans’’). As of May 17, 2005, no new grants will be madeunder the Stock Incentive Plan, the Directors Stock Plan or the Long-Term Performance Plan. Under the terms of the2010 Stock Incentive Plan, grants may be nonqualified stock options, incentive stock options qualifying under Section 422of the Internal Revenue Code, restricted stock, restricted stock units, stock appreciation rights, performance shares,performance units or other stock based awards. The 2005 Directors Stock Plan provides for the grant of nonqualifiedstock options, restricted stock, restricted stock units or other stock-based awards to our nonemployee directors. To date,we have not granted any incentive stock options, restricted stock or performance units.
As of December 31, 2010, the maximum number of new shares of common stock that were available for grant underthe 2010 Stock Incentive Plan and the 2005 Directors Stock Plan was 12.1 million.
For awards with graded vesting, we use an accelerated expense attribution method. The compensation cost that wascharged against income for stock-based awards granted under the Stock-Based Compensation Plans was as follows:
For the year endedDecember 31,
2010 2009 2008
(in millions)Compensation cost . . . . . . . . . . . . . . . . . . . . . . . . . . . . . . . . . . . . . . . . . . . . . . . . . $50.8 $48.8 $31.7Related income tax benefit . . . . . . . . . . . . . . . . . . . . . . . . . . . . . . . . . . . . . . . . . . . . 16.1 15.5 10.0Capitalized as part of an asset . . . . . . . . . . . . . . . . . . . . . . . . . . . . . . . . . . . . . . . . . . 2.8 3.7 4.7
Nonqualified Stock Options
Nonqualified stock options were granted to certain employees under the 2010 Stock Incentive Plan and the StockIncentive Plan. Options outstanding under the 2010 Stock Incentive Plan and the Stock Incentive Plan were granted at anexercise price equal to the fair market value of our common stock on the date of grant, and expire ten years after thegrant date. These options have graded or cliff vesting over a three-year period, except in the case of approved retirement.Total options granted under the 2010 Stock Incentive Plan were 0.8 million, 2.2 million and 1.6 million for the yearsended December 31, 2010, 2009 and 2008, respectively.
Nonqualified stock options granted under the Directors Stock Plan have an exercise price equal to the fair marketvalue of our common stock on the date of the grant and a contractual term equal to the earlier of five years from the datethe participant ceases to provide service or the tenth anniversary of the date the option was granted. Beginning with the2003 grant, options become exercisable in four approximately equal installments on the three, six and nine monthanniversaries of the grant date, and on the date that the Director’s full term of office expires. There were no optionsgranted during the years ended December 31, 2010, 2009 and 2008.
The following is a summary of the status of all of our stock option plans:
Weighted-average Intrinsic
Number of options exercise price Value
(in millions) (in millions)Options outstanding at January 1, 2010 . . . . . . . . . . . . . . . . . . 12.0 $39.67
Granted . . . . . . . . . . . . . . . . . . . . . . . . . . . . . . . . . . . . 0.8 22.21Exercised . . . . . . . . . . . . . . . . . . . . . . . . . . . . . . . . . . . 0.1 15.01Canceled . . . . . . . . . . . . . . . . . . . . . . . . . . . . . . . . . . . . 0.1 33.27Expired . . . . . . . . . . . . . . . . . . . . . . . . . . . . . . . . . . . . . 0.2 43.84
Options outstanding at December 31, 2010 . . . . . . . . . . . . . . . . 12.4 $38.75 $60.4
Options vested or expected to vest at December 31, 2010 . . . . . . 12.3 $38.80 $60.0
Options exercisable at December 31, 2010 . . . . . . . . . . . . . . . . 9.9 $42.91 $24.2
The total intrinsic value of stock options exercised was $1.9 million, zero and $3.7 million during 2010, 2009, and2008, respectively.
167

Principal Financial Group, Inc.
Notes to Consolidated Financial Statements — (continued)
17. Stock-Based Compensation Plans — (continued)
The following is a summary of weighted-average remaining contractual lives for stock options outstanding and therange of exercise prices on the stock options:
Number of Weighted-averageoptions remaining
Range of exercise prices outstanding contractual life
(in millions)$11.07 – $21.69 . . . . . . . . . . . . . . . . . . . . . . . . . . . . . . . . . . . . . . . . . . . . . 2.1 8$21.70 – $32.32 . . . . . . . . . . . . . . . . . . . . . . . . . . . . . . . . . . . . . . . . . . . . . 2.0 5$32.33 – $42.95 . . . . . . . . . . . . . . . . . . . . . . . . . . . . . . . . . . . . . . . . . . . . . 3.4 4$42.96 – $53.58 . . . . . . . . . . . . . . . . . . . . . . . . . . . . . . . . . . . . . . . . . . . . . 1.8 5$53.59 – $64.22 . . . . . . . . . . . . . . . . . . . . . . . . . . . . . . . . . . . . . . . . . . . . . 3.1 7
$11.07 – $64.22 . . . . . . . . . . . . . . . . . . . . . . . . . . . . . . . . . . . . . . . . . . . . . 12.4 6
The weighted-average remaining contractual lives for stock options exercisable is approximately 5 years as ofDecember 31, 2010.
The fair value of stock options is estimated using the Black-Scholes option pricing model. The following is asummary of the assumptions used in this model for the stock options granted during the period:
For the year endedDecember 31,
Options 2010 2009 2008
Expected volatility . . . . . . . . . . . . . . . . . . . . . . . . . . . . . . . . . . . . . . . . . . . . . . . . 66.6% 55.0% 25.4%
Expected term (in years) . . . . . . . . . . . . . . . . . . . . . . . . . . . . . . . . . . . . . . . . . . . . 6 6 6
Risk-free interest rate . . . . . . . . . . . . . . . . . . . . . . . . . . . . . . . . . . . . . . . . . . . . . . 2.8% 2.1% 3.1%
Expected dividend yield . . . . . . . . . . . . . . . . . . . . . . . . . . . . . . . . . . . . . . . . . . . . . 2.25% 4.07% 1.51%
Weighted average estimated fair value . . . . . . . . . . . . . . . . . . . . . . . . . . . . . . . . . . . . $11.48 $4.07 $15.41
We determine expected volatility based on, among other factors, historical volatility using daily price observations.The expected term represents the period of time that options granted are expected to be outstanding. We previouslydetermined expected term based on the simplified method as described by the SEC. Beginning with stock options grantedin 2008, we determine expected term using historical exercise and employee termination data. The risk-free rate forperiods within the expected term of the option is based on the U.S. Treasury risk-free interest rate in effect at the time ofgrant. The dividend yield is based on historical dividend distributions compared to the closing price of our commonshares on the grant date.
As of December 31, 2010, there was $3.7 million of total unrecognized compensation costs related to nonvestedstock options. The cost is expected to be recognized over a weighted-average service period of approximately 1.6 years.
Cash received from stock options exercised under these share-based payment arrangements during 2010, 2009 and2008 was $2.2 million, $0.2 million and $7.8 million, respectively. The actual tax benefits realized for the tax deductionsfor options exercised under these share-based payment arrangements during 2010, 2009 and 2008 was $0.5 million, zeroand $3.0 million, respectively.
Performance Share Awards
We granted performance share awards to certain employees under the 2010 Stock Incentive Plan. The performanceshare awards are treated as an equity award and are paid in shares. Whether the performance shares are earned dependsupon the participant’s continued employment through the performance period (except in the case of an approvedretirement) and our performance against three-year goals set at the beginning of the performance period. Performancegoals based on various factors, including return on equity, earnings per share, operating income and book value pershare, must be achieved for any of the performance shares to be earned. If the performance requirements are not met,the performance shares will be forfeited, no compensation cost is recognized and any previously recognizedcompensation cost is reversed. There is no maximum contractual term on these awards. Dividend equivalents are creditedon performance shares outstanding as of the record date. These dividend equivalents are only paid on the sharesreleased. Total performance share awards granted were 0.4 million, 0.5 million and 0.3 million in 2010, 2009 and 2008,respectively.
168

Principal Financial Group, Inc.
Notes to Consolidated Financial Statements — (continued)
17. Stock-Based Compensation Plans — (continued)
The following is a summary of activity for the nonvested performance share awards:
Number of Weighted-averageperformance share grant-date
awards fair value
(in millions)Nonvested performance share awards at January 1, 2010 . . . . . . . . . . . . . . 1.0 $37.14
Granted . . . . . . . . . . . . . . . . . . . . . . . . . . . . . . . . . . . . . . . . . . . . 0.4 22.21Canceled . . . . . . . . . . . . . . . . . . . . . . . . . . . . . . . . . . . . . . . . . . . 0.3 57.56
Nonvested performance share awards at December 31, 2010 . . . . . . . . . . . . 1.1 $26.01
Performance share awards above represent initial target awards and do not reflect potential increases or decreasesresulting from the final performance objectives to be determined at the end of the respective performance period. Theactual number of shares to be awarded at the end of each performance period will range between 0% and 200% of theinitial target awards.
The total intrinsic value of performance share awards vested was zero, $6.4 million and zero during 2010, 2009 and2008, respectively.
The fair value of performance share awards is determined based on the closing stock price of our common shares onthe grant date. The weighted-average grant-date fair value of performance share awards granted during 2010, 2009 and2008 were $22.21, $11.64 and $56.79, respectively.
As of December 31, 2010, there was $4.7 million of total unrecognized compensation cost related to nonvestedperformance share awards granted. The cost is expected to be recognized over a weighted-average service period ofapproximately 1.6 years.
The actual tax benefits realized for the tax deductions for performance share award payouts under these share-basedpayment arrangements for 2010, 2009 and 2008 was zero, $2.4 million and zero, respectively
Restricted Stock Units
We issue restricted stock units under the 2010 Stock Incentive Plan, 2005 Directors Stock Plan, Stock Incentive Plan,and Directors Stock Plan. Restricted stock units are treated as an equity award. There is no maximum contractual termon these awards. Dividend equivalents are credited on restricted stock units outstanding as of the record date. Thesedividend equivalents are only paid on the shares released. In 2010, 2009, and 2008, 1.2 million, 1.9 million and 0.8 millionrestricted stock units were granted, respectively.
Restricted stock units were issued to certain employees and agents pursuant to the 2010 Stock Incentive Plan andStock Incentive Plan. Under these plans, awards have graded or cliff vesting over a three-year service period. Whenservice for PFG ceases (except in the case of an approved retirement), all vesting stops and unvested units are forfeited.
Pursuant to the 2005 Directors Stock Plan, restricted stock units are granted to each non-employee director in officeimmediately following each annual meeting of stockholders and, at the discretion of the Nominating and GovernanceCommittee, to each person who becomes a member of the Board other than on the date of the annual meeting ofstockholders. Under the 2005 Directors Stock Plan, awards are granted on an annual basis and cliff vest after a one-yearservice period. When service to PFG ceases, all vesting stops and unvested units are forfeited.
The following is a summary of activity for the nonvested restricted stock units:
Number of Weighted-averagerestricted stock grant-date fair
units value
(in millions)Nonvested restricted stock units at January 1, 2010 . . . . . . . . . . . . . . . . . . . . 2.6 $26.25
Granted . . . . . . . . . . . . . . . . . . . . . . . . . . . . . . . . . . . . . . . . . . . . . . 1.2 22.78Vested . . . . . . . . . . . . . . . . . . . . . . . . . . . . . . . . . . . . . . . . . . . . . . . 0.4 38.22Canceled . . . . . . . . . . . . . . . . . . . . . . . . . . . . . . . . . . . . . . . . . . . . . 0.5 21.15
Nonvested restricted stock units at December 31, 2010 . . . . . . . . . . . . . . . . . . 2.9 $23.75
The total intrinsic value of restricted stock units vested was $11.6 million, $3.9 million and $26.3 million during 2010,2009 and 2008, respectively.
169

Principal Financial Group, Inc.
Notes to Consolidated Financial Statements — (continued)
17. Stock-Based Compensation Plans — (continued)
The fair value of restricted stock units is determined based on the closing stock price of our common shares on thegrant date. The weighted-average grant-date fair value of restricted stock units granted during 2010, 2009 and 2008 was$22.78, $11.94 and $57.76, respectively.
As of December 31, 2010, there was $25.0 million of total unrecognized compensation cost related to nonvestedrestricted stock unit awards granted under these plans. The cost is expected to be recognized over a weighted-averageperiod of approximately 1.8 years.
The actual tax benefits realized for the tax deductions for restricted stock unit payouts under these share-basedpayment arrangements for 2010, 2009 and 2008 was $3.2 million, $1.6 million and $6.2 million, respectively.
Employee Stock Purchase Plan
Under our Employee Stock Purchase Plan, participating employees had the opportunity to purchase shares of ourcommon stock on a quarterly basis through 2008. Beginning in 2009, participating employees have the opportunity topurchase shares of our common stock on a semi-annual basis. Employees may purchase up to $25,000 worth of companystock each year. Employees may purchase shares of our common stock at a price equal to 85% of the shares’ fair marketvalue as of the beginning or end of the purchase period, whichever is lower. Under the Employee Stock Purchase Plan,employees purchased 0.9 million, 1.1 million and 0.8 million shares during 2010, 2009 and 2008, respectively.
We recognize compensation expense for the fair value of the discount granted to employees participating in theemployee stock purchase plan in the period of grant. Shares of the Employee Stock Purchase Plan are treated as anequity award. The weighted-average fair value of the discount on the stock purchased was $7.43, $5.08 and $6.56 during2010, 2009 and 2008, respectively. The total intrinsic value of the Employee Stock Purchase Plan shares settled was$6.8 million, $5.6 million and $5.1 million during 2010, 2009 and 2008, respectively.
Cash received from shares issued under these share-based payment arrangements for 2010, 2009 and 2008 was$18.5 million, $13.8 million and $28.8 million, respectively. The actual tax benefits realized for the tax deductions for thesettlement of the share-based payment arrangements for 2010, 2009 and 2008 was $0.7 million, $0.4 million and$0.7 million, respectively.
As of December 31, 2010, a total of 7.6 million of new shares are available to be made issuable by us for this plan.
18. Earnings Per Common Share
The computations of the basic and diluted per share amounts were as follows:
For the year endedDecember 31,
2010 2009 2008
(in millions,except per share data)
Net income . . . . . . . . . . . . . . . . . . . . . . . . . . . . . . . . . . . . . . . . . . . . . . . . . . . . $717.2 $645.7 $465.8Subtract:
Net income attributable to noncontrolling interest . . . . . . . . . . . . . . . . . . . . . . . . . . 17.9 23.0 7.7Preferred stock dividends . . . . . . . . . . . . . . . . . . . . . . . . . . . . . . . . . . . . . . . . . . 33.0 33.0 33.0
Net income available to common stockholders . . . . . . . . . . . . . . . . . . . . . . . . . . . . . . $666.3 $589.7 $425.1
Weighted-average shares outstanding:Basic . . . . . . . . . . . . . . . . . . . . . . . . . . . . . . . . . . . . . . . . . . . . . . . . . . . . . . 320.3 297.3 259.3Dilutive effects:
Stock options . . . . . . . . . . . . . . . . . . . . . . . . . . . . . . . . . . . . . . . . . . . . . . . . 0.9 0.4 1.1Performance share awards . . . . . . . . . . . . . . . . . . . . . . . . . . . . . . . . . . . . . . . . 0.3 — 0.4Restricted stock units . . . . . . . . . . . . . . . . . . . . . . . . . . . . . . . . . . . . . . . . . . . 1.5 1.2 0.3
Diluted . . . . . . . . . . . . . . . . . . . . . . . . . . . . . . . . . . . . . . . . . . . . . . . . . . . . . 323.0 298.9 261.1
Net income per common share:Basic . . . . . . . . . . . . . . . . . . . . . . . . . . . . . . . . . . . . . . . . . . . . . . . . . . . . . . $ 2.08 $ 1.98 $ 1.64
Diluted . . . . . . . . . . . . . . . . . . . . . . . . . . . . . . . . . . . . . . . . . . . . . . . . . . . . . $ 2.06 $ 1.97 $ 1.63
The calculation of diluted earnings per share for the years ended December 31, 2010, 2009 and 2008, excludes theincremental effect related to certain outstanding stock-based compensation grants due to their anti-dilutive effect.
170

Principal Financial Group, Inc.
Notes to Consolidated Financial Statements — (continued)
19. Quarterly Results of Operations (Unaudited)
The following is a summary of unaudited quarterly results of operations.For the three months ended
December 31 September 30 (1) June 30 (2) March 31
(in millions, except per share data)2010
Total revenues . . . . . . . . . . . . . . . . . . . . . . . . . . . . . . . . . . . . . $2,372.5 $2,288.5 $2,233.6 $2,264.0Total expenses . . . . . . . . . . . . . . . . . . . . . . . . . . . . . . . . . . . . . 2,108.8 2,125.0 2,075.8 2,007.7Net income . . . . . . . . . . . . . . . . . . . . . . . . . . . . . . . . . . . . . . . 218.1 151.3 144.2 203.6Net income available to common stockholders . . . . . . . . . . . . . . . . . 199.3 142.2 134.0 190.8Basic earnings per common share for net income available to common
stockholders . . . . . . . . . . . . . . . . . . . . . . . . . . . . . . . . . . . . . 0.62 0.44 0.42 0.60Diluted earnings per common share for net income available to common
stockholders . . . . . . . . . . . . . . . . . . . . . . . . . . . . . . . . . . . . . 0.62 0.44 0.42 0.592009
Total revenues . . . . . . . . . . . . . . . . . . . . . . . . . . . . . . . . . . . . . $2,232.4 $2,270.3 $2,157.8 $2,188.6Total expenses . . . . . . . . . . . . . . . . . . . . . . . . . . . . . . . . . . . . . 2,062.9 2,022.0 1,959.9 2,058.5Net income . . . . . . . . . . . . . . . . . . . . . . . . . . . . . . . . . . . . . . . 154.9 204.2 164.0 122.6Net income available to common stockholders . . . . . . . . . . . . . . . . . 141.9 184.7 150.3 112.8Basic earnings per common share for net income available to common
stockholders . . . . . . . . . . . . . . . . . . . . . . . . . . . . . . . . . . . . . 0.44 0.58 0.52 0.43Diluted earnings per common share for net income available to common
stockholders . . . . . . . . . . . . . . . . . . . . . . . . . . . . . . . . . . . . . 0.44 0.57 0.52 0.43
(1) During the third quarter of 2009, we discovered a prior period error related to DPAC amortization of certain contracts in our full serviceaccumulation business. We evaluated the materiality of the error from qualitative and quantitative perspectives and concluded it was notmaterial to any prior periods. The correction of the error in the third quarter of 2009 could be considered material to the results ofoperations for the three months ended September 30, 2009, but is not material to the results of operations for any annual periodpresented. Accordingly, we made an adjustment in the third quarter of 2009 that resulted in a decrease in DPAC amortization expense. Onan after-tax basis, the adjustment for prior periods resulted in an $18.9 million increase in net income for the three months endedSeptember 30, 2009.
(2) During the second quarter of 2010, we determined our residential mortgage loan portfolio, and in particular our home equity loanportfolio, had experienced an increase in severe delinquencies and loss severity from sustained elevated levels of unemployment along withcontinued depressed collateral values. The deterioration resulted in an increase in delinquencies and default costs. During the secondquarter of 2010, we recorded a $41.9 million after-tax residential mortgage loan loss provision for our Bank and Trust Services business. Ofthis residential mortgage loan loss provision, $21.4 million after-tax could be attributed to 2009. We evaluated the qualitative andquantitative factors for materiality. The adjustment related to prior periods could be considered material to the results of operations forthe three months ended June 30, 2010, but was not material to the results of operations for any annual period presented. The provision forloan loss is reported in net realized capital gains (losses) on our consolidated statements of operations and the adjustment for priorperiods resulted in a decrease in net income for the three months ended June 30, 2010.
20. Condensed Consolidating Financial Information
Principal Life has established special purpose entities to issue secured medium-term notes. Under the program, thepayment obligations of principal and interest on the notes are secured by funding agreements issued by Principal Life.Principal Life’s payment obligations on the funding agreements are fully and unconditionally guaranteed by PFG. All ofthe outstanding stock of Principal Life is indirectly owned by PFG and PFG is the only guarantor of the paymentobligations of the funding agreements.
The following tables set forth condensed consolidating financial information of (i) PFG, (ii) Principal Life,(iii) Principal Financial Services, Inc. (‘‘PFS’’) and all other direct and indirect subsidiaries of PFG on a combined basisand (iv) the eliminations necessary to arrive at the information for PFG on a consolidated basis as of December 31, 2010and 2009, and for the years ended December 31, 2010, 2009 and 2008.
In presenting the condensed consolidating financial statements, the equity method of accounting has been applied to(i) PFG’s interest in PFS, (ii) Principal Life’s interest in all direct subsidiaries of Principal Life and (iii) PFS’s interest inPrincipal Life even though all such subsidiaries meet the requirements to be consolidated under U.S. GAAP. Earnings ofsubsidiaries are, therefore, reflected in the parent’s investment and earnings. All intercompany balances and transactions,including elimination of the parent’s investment in subsidiaries, between PFG, Principal Life and PFS and all othersubsidiaries have been eliminated, as shown in the column ‘‘Eliminations and Other.’’ These condensed consolidatingfinancial statements should be read in conjunction with the consolidated financial statements. The financial information
171
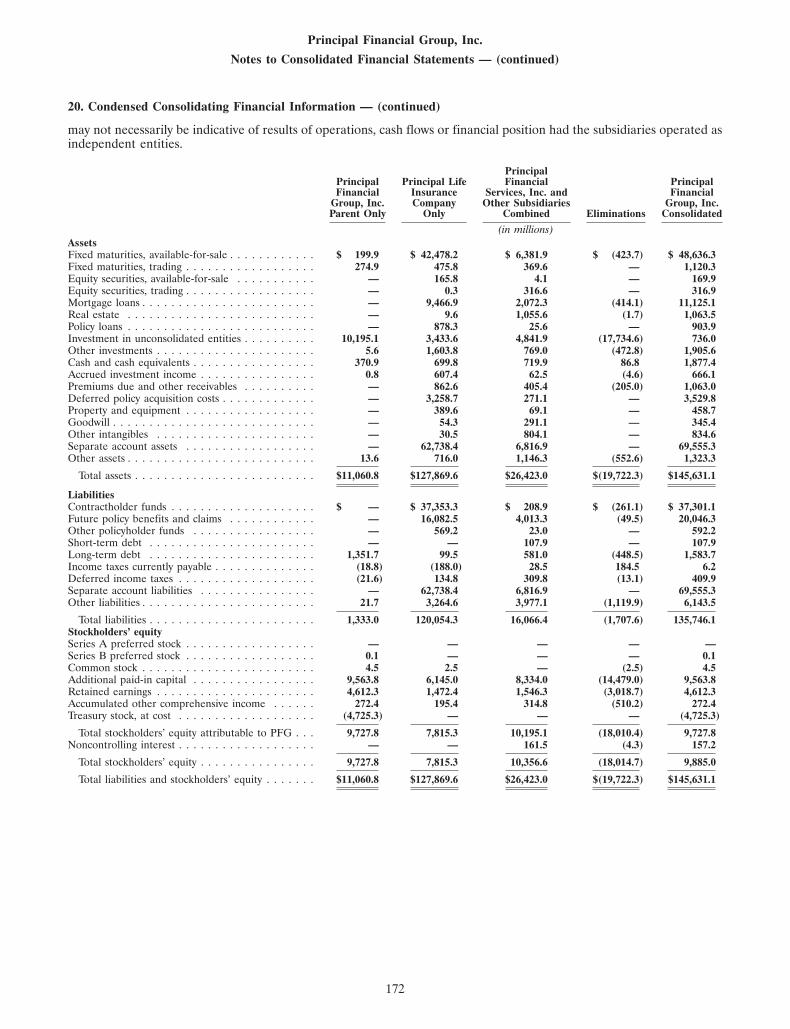
Principal Financial Group, Inc.
Notes to Consolidated Financial Statements — (continued)
20. Condensed Consolidating Financial Information — (continued)
may not necessarily be indicative of results of operations, cash flows or financial position had the subsidiaries operated asindependent entities.
PrincipalPrincipal Principal Life Financial PrincipalFinancial Insurance Services, Inc. and Financial
Group, Inc. Company Other Subsidiaries Group, Inc.Parent Only Only Combined Eliminations Consolidated
(in millions)AssetsFixed maturities, available-for-sale . . . . . . . . . . . . $ 199.9 $ 42,478.2 $ 6,381.9 $ (423.7) $ 48,636.3Fixed maturities, trading . . . . . . . . . . . . . . . . . . 274.9 475.8 369.6 — 1,120.3Equity securities, available-for-sale . . . . . . . . . . . — 165.8 4.1 — 169.9Equity securities, trading . . . . . . . . . . . . . . . . . . — 0.3 316.6 — 316.9Mortgage loans . . . . . . . . . . . . . . . . . . . . . . . . — 9,466.9 2,072.3 (414.1) 11,125.1Real estate . . . . . . . . . . . . . . . . . . . . . . . . . . — 9.6 1,055.6 (1.7) 1,063.5Policy loans . . . . . . . . . . . . . . . . . . . . . . . . . . — 878.3 25.6 — 903.9Investment in unconsolidated entities . . . . . . . . . . 10,195.1 3,433.6 4,841.9 (17,734.6) 736.0Other investments . . . . . . . . . . . . . . . . . . . . . . 5.6 1,603.8 769.0 (472.8) 1,905.6Cash and cash equivalents . . . . . . . . . . . . . . . . . 370.9 699.8 719.9 86.8 1,877.4Accrued investment income . . . . . . . . . . . . . . . . 0.8 607.4 62.5 (4.6) 666.1Premiums due and other receivables . . . . . . . . . . — 862.6 405.4 (205.0) 1,063.0Deferred policy acquisition costs . . . . . . . . . . . . . — 3,258.7 271.1 — 3,529.8Property and equipment . . . . . . . . . . . . . . . . . . — 389.6 69.1 — 458.7Goodwill . . . . . . . . . . . . . . . . . . . . . . . . . . . . — 54.3 291.1 — 345.4Other intangibles . . . . . . . . . . . . . . . . . . . . . . — 30.5 804.1 — 834.6Separate account assets . . . . . . . . . . . . . . . . . . — 62,738.4 6,816.9 — 69,555.3Other assets . . . . . . . . . . . . . . . . . . . . . . . . . . 13.6 716.0 1,146.3 (552.6) 1,323.3
Total assets . . . . . . . . . . . . . . . . . . . . . . . . . $11,060.8 $127,869.6 $26,423.0 $(19,722.3) $145,631.1
LiabilitiesContractholder funds . . . . . . . . . . . . . . . . . . . . $ — $ 37,353.3 $ 208.9 $ (261.1) $ 37,301.1Future policy benefits and claims . . . . . . . . . . . . — 16,082.5 4,013.3 (49.5) 20,046.3Other policyholder funds . . . . . . . . . . . . . . . . . — 569.2 23.0 — 592.2Short-term debt . . . . . . . . . . . . . . . . . . . . . . . — — 107.9 — 107.9Long-term debt . . . . . . . . . . . . . . . . . . . . . . . 1,351.7 99.5 581.0 (448.5) 1,583.7Income taxes currently payable . . . . . . . . . . . . . . (18.8) (188.0) 28.5 184.5 6.2Deferred income taxes . . . . . . . . . . . . . . . . . . . (21.6) 134.8 309.8 (13.1) 409.9Separate account liabilities . . . . . . . . . . . . . . . . — 62,738.4 6,816.9 — 69,555.3Other liabilities . . . . . . . . . . . . . . . . . . . . . . . . 21.7 3,264.6 3,977.1 (1,119.9) 6,143.5
Total liabilities . . . . . . . . . . . . . . . . . . . . . . . 1,333.0 120,054.3 16,066.4 (1,707.6) 135,746.1Stockholders’ equitySeries A preferred stock . . . . . . . . . . . . . . . . . . — — — — —Series B preferred stock . . . . . . . . . . . . . . . . . . 0.1 — — — 0.1Common stock . . . . . . . . . . . . . . . . . . . . . . . . 4.5 2.5 — (2.5) 4.5Additional paid-in capital . . . . . . . . . . . . . . . . . 9,563.8 6,145.0 8,334.0 (14,479.0) 9,563.8Retained earnings . . . . . . . . . . . . . . . . . . . . . . 4,612.3 1,472.4 1,546.3 (3,018.7) 4,612.3Accumulated other comprehensive income . . . . . . 272.4 195.4 314.8 (510.2) 272.4Treasury stock, at cost . . . . . . . . . . . . . . . . . . . (4,725.3) — — — (4,725.3)
Total stockholders’ equity attributable to PFG . . . 9,727.8 7,815.3 10,195.1 (18,010.4) 9,727.8Noncontrolling interest . . . . . . . . . . . . . . . . . . . — — 161.5 (4.3) 157.2
Total stockholders’ equity . . . . . . . . . . . . . . . . 9,727.8 7,815.3 10,356.6 (18,014.7) 9,885.0
Total liabilities and stockholders’ equity . . . . . . . $11,060.8 $127,869.6 $26,423.0 $(19,722.3) $145,631.1
172

Principal Financial Group, Inc.
Notes to Consolidated Financial Statements — (continued)
20. Condensed Consolidating Financial Information — (continued)
Condensed Consolidating Statements of Financial PositionDecember 31, 2009
PrincipalPrincipal Principal Life Financial PrincipalFinancial Insurance Services, Inc. and Financial
Group, Inc. Company Other Subsidiaries Group, Inc.Parent Only Only Combined Eliminations Consolidated
(in millions)AssetsFixed maturities, available-for-sale . . . . . . . . . . . . $ 124.5 $ 40,928.8 $ 5,635.5 $ (468.2) $ 46,220.6Fixed maturities, trading . . . . . . . . . . . . . . . . . . 348.1 461.8 222.5 — 1,032.4Equity securities, available-for-sale . . . . . . . . . . . — 211.6 2.4 — 214.0Equity securities, trading . . . . . . . . . . . . . . . . . . — 0.3 221.2 — 221.5Mortgage loans . . . . . . . . . . . . . . . . . . . . . . . . — 9,930.7 2,344.5 (429.6) 11,845.6Real estate . . . . . . . . . . . . . . . . . . . . . . . . . . — 19.4 1,017.4 (2.2) 1,034.6Policy loans . . . . . . . . . . . . . . . . . . . . . . . . . . — 881.3 21.2 — 902.5Investment in unconsolidated entities . . . . . . . . . . 8,423.1 3,337.7 3,198.5 (14,331.0) 628.3Other investments . . . . . . . . . . . . . . . . . . . . . . 5.3 1,692.3 621.9 (482.5) 1,837.0Cash and cash equivalents . . . . . . . . . . . . . . . . . 304.6 1,249.2 713.0 (26.4) 2,240.4Accrued investment income . . . . . . . . . . . . . . . . 2.0 634.6 61.2 (5.9) 691.9Premiums due and other receivables . . . . . . . . . . 2.0 843.3 220.1 — 1,065.4Deferred policy acquisition costs . . . . . . . . . . . . . — 3,454.8 226.6 — 3,681.4Property and equipment . . . . . . . . . . . . . . . . . . — 420.9 68.4 — 489.3Goodwill . . . . . . . . . . . . . . . . . . . . . . . . . . . . — 96.8 289.6 — 386.4Other intangibles . . . . . . . . . . . . . . . . . . . . . . — 33.7 818.0 — 851.7Separate account assets . . . . . . . . . . . . . . . . . . — 57,380.8 5,357.7 — 62,738.5Other assets . . . . . . . . . . . . . . . . . . . . . . . . . . 13.0 632.3 823.3 209.3 1,677.9
Total assets . . . . . . . . . . . . . . . . . . . . . . . . . $ 9,222.6 $122,210.3 $21,863.0 $(15,536.5) $137,759.4
LiabilitiesContractholder funds . . . . . . . . . . . . . . . . . . . . $ — $ 40,021.7 $ 37.2 $ (257.0) $ 39,801.9Future policy benefits and claims . . . . . . . . . . . . — 15,954.7 3,317.1 (23.5) 19,248.3Other policyholder funds . . . . . . . . . . . . . . . . . — 539.1 20.1 — 559.2Short-term debt . . . . . . . . . . . . . . . . . . . . . . . — — 101.6 — 101.6Long-term debt . . . . . . . . . . . . . . . . . . . . . . . 1,351.8 99.5 644.1 (510.8) 1,584.6Income taxes currently payable . . . . . . . . . . . . . . (14.7) (260.5) 15.8 262.2 2.8Deferred income taxes . . . . . . . . . . . . . . . . . . . (27.0) (544.8) 295.3 396.7 120.2Separate account liabilities . . . . . . . . . . . . . . . . — 57,380.8 5,357.7 — 62,738.5Other liabilities . . . . . . . . . . . . . . . . . . . . . . . . 19.0 2,670.9 3,524.0 (628.0) 5,585.9
Total liabilities . . . . . . . . . . . . . . . . . . . . . . . 1,329.1 115,861.4 13,312.9 (760.4) 129,743.0Stockholders’ equitySeries A preferred stock . . . . . . . . . . . . . . . . . . — — — — —Series B preferred stock . . . . . . . . . . . . . . . . . . 0.1 — — — 0.1Common stock . . . . . . . . . . . . . . . . . . . . . . . . 4.5 2.5 — (2.5) 4.5Additional paid-in capital . . . . . . . . . . . . . . . . . 9,492.9 6,408.9 8,586.5 (14,995.4) 9,492.9Retained earnings . . . . . . . . . . . . . . . . . . . . . . 4,160.7 1,024.3 834.0 (1,858.3) 4,160.7Accumulated other comprehensive loss . . . . . . . . . (1,042.0) (1,086.8) (997.4) 2,084.2 (1,042.0)Treasury stock, at cost . . . . . . . . . . . . . . . . . . . (4,722.7) — — — (4,722.7)
Total stockholders’ equity attributable to PFG . . . 7,893.5 6,348.9 8,423.1 (14,772.0) 7,893.5Noncontrolling interest . . . . . . . . . . . . . . . . . . . — — 127.0 (4.1) 122.9
Total stockholders’ equity . . . . . . . . . . . . . . . . 7,893.5 6,348.9 8,550.1 (14,776.1) 8,016.4
Total liabilities and stockholders’ equity . . . . . . . $ 9,222.6 $122,210.3 $21,863.0 $(15,536.5) $137,759.4
173
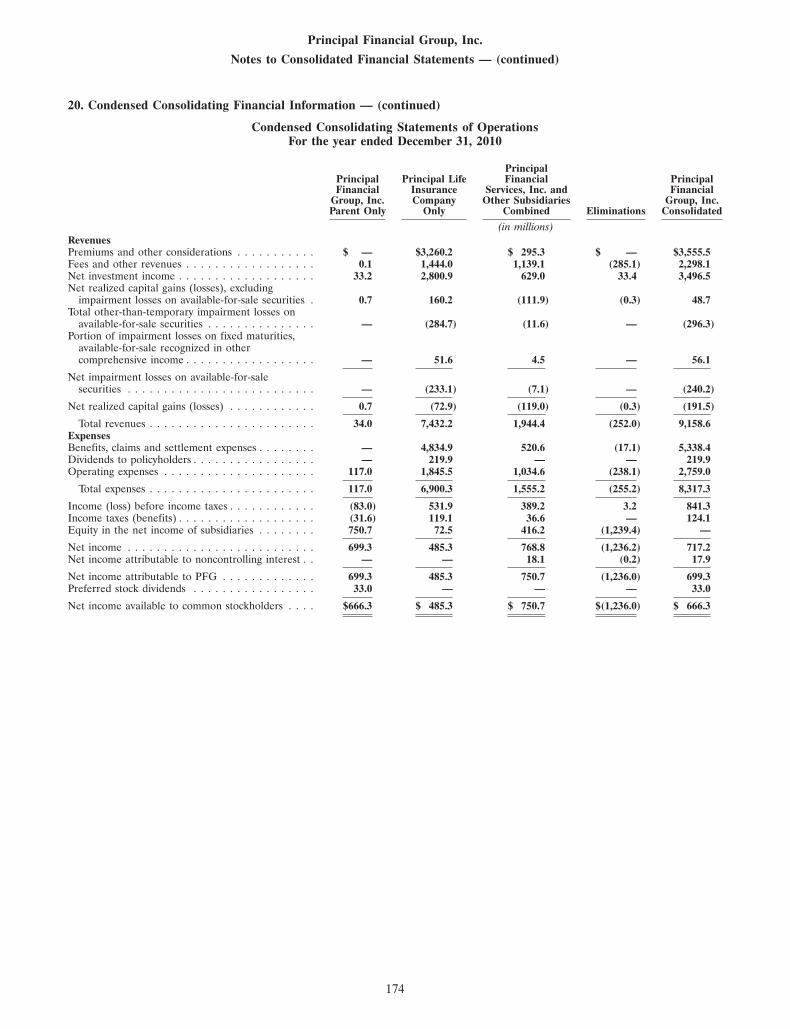
Principal Financial Group, Inc.
Notes to Consolidated Financial Statements — (continued)
20. Condensed Consolidating Financial Information — (continued)
Condensed Consolidating Statements of OperationsFor the year ended December 31, 2010
PrincipalPrincipal Principal Life Financial PrincipalFinancial Insurance Services, Inc. and Financial
Group, Inc. Company Other Subsidiaries Group, Inc.Parent Only Only Combined Eliminations Consolidated
(in millions)RevenuesPremiums and other considerations . . . . . . . . . . . $ — $3,260.2 $ 295.3 $ — $3,555.5Fees and other revenues . . . . . . . . . . . . . . . . . . 0.1 1,444.0 1,139.1 (285.1) 2,298.1Net investment income . . . . . . . . . . . . . . . . . . . 33.2 2,800.9 629.0 33.4 3,496.5Net realized capital gains (losses), excluding
impairment losses on available-for-sale securities . 0.7 160.2 (111.9) (0.3) 48.7Total other-than-temporary impairment losses on
available-for-sale securities . . . . . . . . . . . . . . . — (284.7) (11.6) — (296.3)Portion of impairment losses on fixed maturities,
available-for-sale recognized in othercomprehensive income . . . . . . . . . . . . . . . . . . — 51.6 4.5 — 56.1
Net impairment losses on available-for-salesecurities . . . . . . . . . . . . . . . . . . . . . . . . . . — (233.1) (7.1) — (240.2)
Net realized capital gains (losses) . . . . . . . . . . . . 0.7 (72.9) (119.0) (0.3) (191.5)
Total revenues . . . . . . . . . . . . . . . . . . . . . . . 34.0 7,432.2 1,944.4 (252.0) 9,158.6ExpensesBenefits, claims and settlement expenses . . . . . . . . — 4,834.9 520.6 (17.1) 5,338.4Dividends to policyholders . . . . . . . . . . . . . . . . . — 219.9 — — 219.9Operating expenses . . . . . . . . . . . . . . . . . . . . . 117.0 1,845.5 1,034.6 (238.1) 2,759.0
Total expenses . . . . . . . . . . . . . . . . . . . . . . . 117.0 6,900.3 1,555.2 (255.2) 8,317.3
Income (loss) before income taxes . . . . . . . . . . . . (83.0) 531.9 389.2 3.2 841.3Income taxes (benefits) . . . . . . . . . . . . . . . . . . . (31.6) 119.1 36.6 — 124.1Equity in the net income of subsidiaries . . . . . . . . 750.7 72.5 416.2 (1,239.4) —
Net income . . . . . . . . . . . . . . . . . . . . . . . . . . 699.3 485.3 768.8 (1,236.2) 717.2Net income attributable to noncontrolling interest . . — — 18.1 (0.2) 17.9
Net income attributable to PFG . . . . . . . . . . . . . 699.3 485.3 750.7 (1,236.0) 699.3Preferred stock dividends . . . . . . . . . . . . . . . . . 33.0 — — — 33.0
Net income available to common stockholders . . . . $666.3 $ 485.3 $ 750.7 $(1,236.0) $ 666.3
174
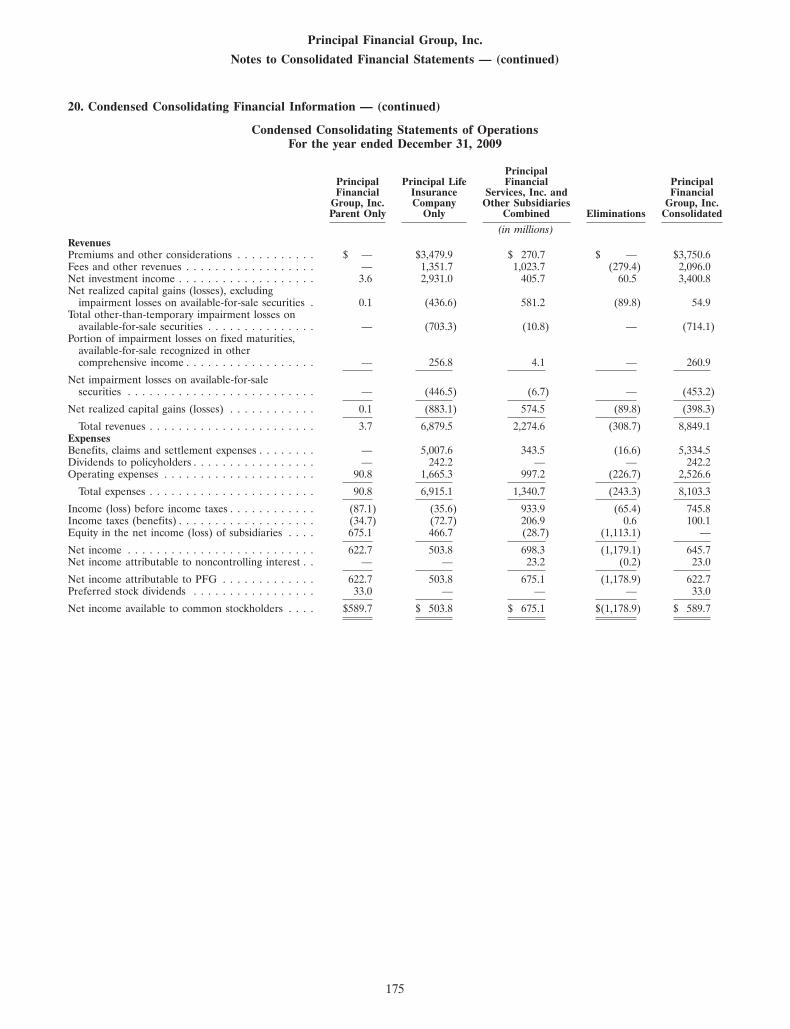
Principal Financial Group, Inc.
Notes to Consolidated Financial Statements — (continued)
20. Condensed Consolidating Financial Information — (continued)
Condensed Consolidating Statements of OperationsFor the year ended December 31, 2009
PrincipalPrincipal Principal Life Financial PrincipalFinancial Insurance Services, Inc. and Financial
Group, Inc. Company Other Subsidiaries Group, Inc.Parent Only Only Combined Eliminations Consolidated
(in millions)RevenuesPremiums and other considerations . . . . . . . . . . . $ — $3,479.9 $ 270.7 $ — $3,750.6Fees and other revenues . . . . . . . . . . . . . . . . . . — 1,351.7 1,023.7 (279.4) 2,096.0Net investment income . . . . . . . . . . . . . . . . . . . 3.6 2,931.0 405.7 60.5 3,400.8Net realized capital gains (losses), excluding
impairment losses on available-for-sale securities . 0.1 (436.6) 581.2 (89.8) 54.9Total other-than-temporary impairment losses on
available-for-sale securities . . . . . . . . . . . . . . . — (703.3) (10.8) — (714.1)Portion of impairment losses on fixed maturities,
available-for-sale recognized in othercomprehensive income . . . . . . . . . . . . . . . . . . — 256.8 4.1 — 260.9
Net impairment losses on available-for-salesecurities . . . . . . . . . . . . . . . . . . . . . . . . . . — (446.5) (6.7) — (453.2)
Net realized capital gains (losses) . . . . . . . . . . . . 0.1 (883.1) 574.5 (89.8) (398.3)
Total revenues . . . . . . . . . . . . . . . . . . . . . . . 3.7 6,879.5 2,274.6 (308.7) 8,849.1ExpensesBenefits, claims and settlement expenses . . . . . . . . — 5,007.6 343.5 (16.6) 5,334.5Dividends to policyholders . . . . . . . . . . . . . . . . . — 242.2 — — 242.2Operating expenses . . . . . . . . . . . . . . . . . . . . . 90.8 1,665.3 997.2 (226.7) 2,526.6
Total expenses . . . . . . . . . . . . . . . . . . . . . . . 90.8 6,915.1 1,340.7 (243.3) 8,103.3
Income (loss) before income taxes . . . . . . . . . . . . (87.1) (35.6) 933.9 (65.4) 745.8Income taxes (benefits) . . . . . . . . . . . . . . . . . . . (34.7) (72.7) 206.9 0.6 100.1Equity in the net income (loss) of subsidiaries . . . . 675.1 466.7 (28.7) (1,113.1) —
Net income . . . . . . . . . . . . . . . . . . . . . . . . . . 622.7 503.8 698.3 (1,179.1) 645.7Net income attributable to noncontrolling interest . . — — 23.2 (0.2) 23.0
Net income attributable to PFG . . . . . . . . . . . . . 622.7 503.8 675.1 (1,178.9) 622.7Preferred stock dividends . . . . . . . . . . . . . . . . . 33.0 — — — 33.0
Net income available to common stockholders . . . . $589.7 $ 503.8 $ 675.1 $(1,178.9) $ 589.7
175
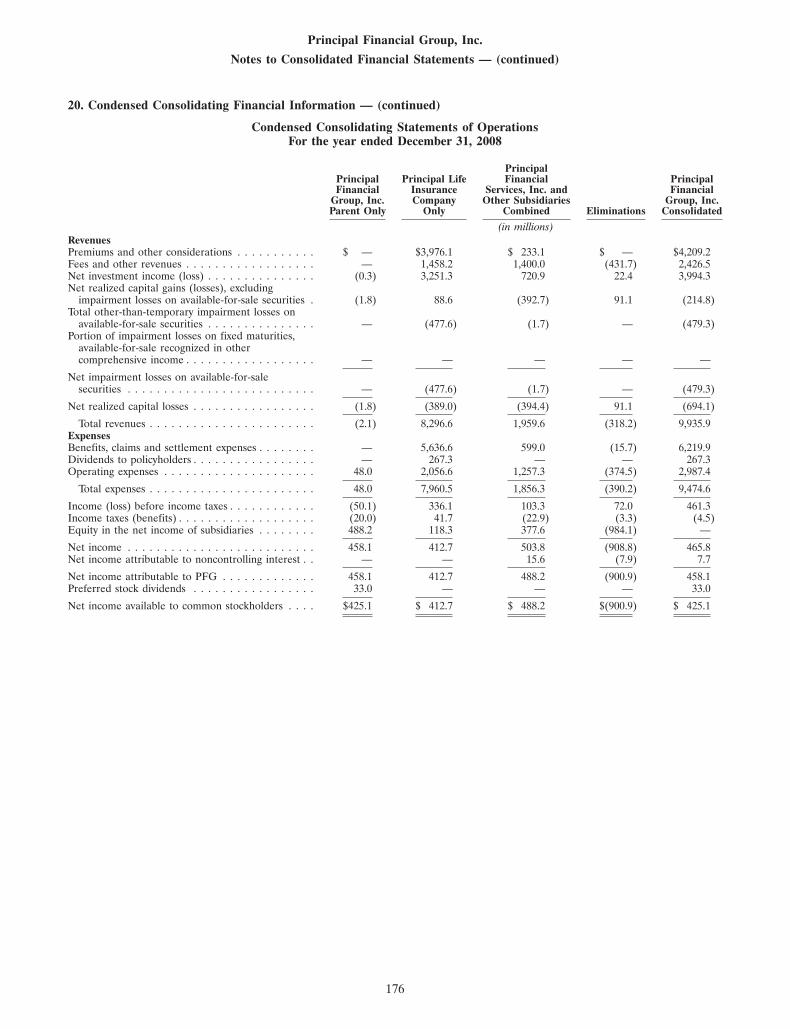
Principal Financial Group, Inc.
Notes to Consolidated Financial Statements — (continued)
20. Condensed Consolidating Financial Information — (continued)
Condensed Consolidating Statements of OperationsFor the year ended December 31, 2008
PrincipalPrincipal Principal Life Financial PrincipalFinancial Insurance Services, Inc. and Financial
Group, Inc. Company Other Subsidiaries Group, Inc.Parent Only Only Combined Eliminations Consolidated
(in millions)RevenuesPremiums and other considerations . . . . . . . . . . . $ — $3,976.1 $ 233.1 $ — $4,209.2Fees and other revenues . . . . . . . . . . . . . . . . . . — 1,458.2 1,400.0 (431.7) 2,426.5Net investment income (loss) . . . . . . . . . . . . . . . (0.3) 3,251.3 720.9 22.4 3,994.3Net realized capital gains (losses), excluding
impairment losses on available-for-sale securities . (1.8) 88.6 (392.7) 91.1 (214.8)Total other-than-temporary impairment losses on
available-for-sale securities . . . . . . . . . . . . . . . — (477.6) (1.7) — (479.3)Portion of impairment losses on fixed maturities,
available-for-sale recognized in othercomprehensive income . . . . . . . . . . . . . . . . . . — — — — —
Net impairment losses on available-for-salesecurities . . . . . . . . . . . . . . . . . . . . . . . . . . — (477.6) (1.7) — (479.3)
Net realized capital losses . . . . . . . . . . . . . . . . . (1.8) (389.0) (394.4) 91.1 (694.1)
Total revenues . . . . . . . . . . . . . . . . . . . . . . . (2.1) 8,296.6 1,959.6 (318.2) 9,935.9ExpensesBenefits, claims and settlement expenses . . . . . . . . — 5,636.6 599.0 (15.7) 6,219.9Dividends to policyholders . . . . . . . . . . . . . . . . . — 267.3 — — 267.3Operating expenses . . . . . . . . . . . . . . . . . . . . . 48.0 2,056.6 1,257.3 (374.5) 2,987.4
Total expenses . . . . . . . . . . . . . . . . . . . . . . . 48.0 7,960.5 1,856.3 (390.2) 9,474.6
Income (loss) before income taxes . . . . . . . . . . . . (50.1) 336.1 103.3 72.0 461.3Income taxes (benefits) . . . . . . . . . . . . . . . . . . . (20.0) 41.7 (22.9) (3.3) (4.5)Equity in the net income of subsidiaries . . . . . . . . 488.2 118.3 377.6 (984.1) —
Net income . . . . . . . . . . . . . . . . . . . . . . . . . . 458.1 412.7 503.8 (908.8) 465.8Net income attributable to noncontrolling interest . . — — 15.6 (7.9) 7.7
Net income attributable to PFG . . . . . . . . . . . . . 458.1 412.7 488.2 (900.9) 458.1Preferred stock dividends . . . . . . . . . . . . . . . . . 33.0 — — — 33.0
Net income available to common stockholders . . . . $425.1 $ 412.7 $ 488.2 $(900.9) $ 425.1
176

Principal Financial Group, Inc.
Notes to Consolidated Financial Statements — (continued)
20. Condensed Consolidating Financial Information — (continued)
Condensed Consolidating Statements of Cash FlowsFor the year ended December 31, 2010
PrincipalPrincipal Principal Life Financial PrincipalFinancial Insurance Services, Inc. and Financial
Group, Inc. Company Other Subsidiaries Group, Inc.Parent Only Only Combined Eliminations Consolidated
(in millions)Operating activitiesNet cash provided by operating activities . . . . . . . $ 29.3 $ 2,374.5 $ 414.8 $ (26.9) $ 2,791.7Investing activitiesAvailable-for-sale securities:
Purchases . . . . . . . . . . . . . . . . . . . . . . . . . . (286.8) (5,599.7) (1,273.5) (27.9) (7,187.9)Sales . . . . . . . . . . . . . . . . . . . . . . . . . . . . . 95.5 1,208.8 380.3 — 1,684.6Maturities . . . . . . . . . . . . . . . . . . . . . . . . . 117.9 4,390.7 652.7 — 5,161.3
Mortgage loans acquired or originated . . . . . . . . . — (1,209.4) (295.8) 233.2 (1,272.0)Mortgage loans sold or repaid . . . . . . . . . . . . . . — 1,624.1 422.6 (248.7) 1,798.0Real estate acquired . . . . . . . . . . . . . . . . . . . . — (0.2) (53.6) — (53.8)Net purchases of property and equipment . . . . . . . — (4.3) (17.2) — (21.5)Dividends and returns of capital received from
unconsolidated entities . . . . . . . . . . . . . . . . . 301.8 229.1 301.8 (832.7) —Net change in other investments . . . . . . . . . . . . . (0.2) (46.8) (163.3) 129.1 (81.2)
Net cash provided by (used in) investing activities . . 228.2 592.3 (46.0) (747.0) 27.5Financing activitiesIssuance of common stock . . . . . . . . . . . . . . . . . 20.6 — — — 20.6Acquisition of treasury stock . . . . . . . . . . . . . . . (2.6) — — — (2.6)Proceeds from financing element derivatives . . . . . — 79.3 — — 79.3Payments for financing element derivatives . . . . . . — (46.5) — — (46.5)Excess tax benefits from share-based payment
arrangements . . . . . . . . . . . . . . . . . . . . . . . — 0.4 0.6 — 1.0Dividends to common stockholders . . . . . . . . . . . (176.2) — — — (176.2)Dividends to preferred stockholders . . . . . . . . . . . (33.0) — — — (33.0)Dividends and capital paid to parent . . . . . . . . . . — (301.8) (530.9) 832.7 —Issuance of long-term debt . . . . . . . . . . . . . . . . — — 27.6 (25.3) 2.3Principal repayments of long-term debt . . . . . . . . — — (58.7) 47.6 (11.1)Net proceeds from (repayments of) short-term
borrowings . . . . . . . . . . . . . . . . . . . . . . . . . — — (30.4) 32.1 1.7Investment contract deposits . . . . . . . . . . . . . . . — 4,100.0 183.8 — 4,283.8Investment contract withdrawals . . . . . . . . . . . . . — (7,343.3) (0.1) — (7,343.4)Net increase in banking operation deposits . . . . . . — — 46.2 — 46.2Other . . . . . . . . . . . . . . . . . . . . . . . . . . . . . . — (4.3) — — (4.3)
Net cash used in financing activities . . . . . . . . . . . (191.2) (3,516.2) (361.9) 887.1 (3,182.2)
Net increase (decrease) in cash and cashequivalents . . . . . . . . . . . . . . . . . . . . . . . . . 66.3 (549.4) 6.9 113.2 (363.0)
Cash and cash equivalents at beginning of year . . . 304.6 1,249.2 713.0 (26.4) 2,240.4
Cash and cash equivalents at end of year . . . . . . . $ 370.9 $ 699.8 $ 719.9 $ 86.8 $ 1,877.4
177

Principal Financial Group, Inc.
Notes to Consolidated Financial Statements — (continued)
20. Condensed Consolidating Financial Information — (continued)
Condensed Consolidating Statements of Cash FlowsFor the year ended December 31, 2009
PrincipalPrincipal Principal Life Financial PrincipalFinancial Insurance Services, Inc. and Financial
Group, Inc. Company Other Subsidiaries Group, Inc.Parent Only Only Combined Eliminations Consolidated
(in millions)Operating activitiesNet cash provided by (used in) operating activities . $ (442.6) $ 2,617.9 $ (132.7) $ 200.4 $ 2,243.0Investing activitiesAvailable-for-sale securities:
Purchases . . . . . . . . . . . . . . . . . . . . . . . . . . (187.6) (6,537.4) (1,288.3) 80.0 (7,933.3)Sales . . . . . . . . . . . . . . . . . . . . . . . . . . . . . 4.0 3,002.0 602.9 (169.1) 3,439.8Maturities . . . . . . . . . . . . . . . . . . . . . . . . . 57.1 3,944.6 566.4 — 4,568.1
Mortgage loans acquired or originated . . . . . . . . . — (507.3) (151.3) 72.1 (586.5)Mortgage loans sold or repaid . . . . . . . . . . . . . . — 1,449.3 366.2 (111.1) 1,704.4Real estate acquired . . . . . . . . . . . . . . . . . . . . — — (62.2) — (62.2)Real estate sold . . . . . . . . . . . . . . . . . . . . . . . — — 30.3 — 30.3Net purchases of property and equipment . . . . . . . (0.1) (11.1) (15.0) — (26.2)Purchases of interest in subsidiaries, net of cash
acquired . . . . . . . . . . . . . . . . . . . . . . . . . . . — — (45.7) — (45.7)Contributions to unconsolidated entities . . . . . . . . (795.9) (29.6) (150.9) 976.4 —Net change in other investments . . . . . . . . . . . . . 0.2 54.8 (2.1) (114.8) (61.9)
Net cash provided by (used in) investing activities . . (922.3) 1,365.3 (149.7) 733.5 1,026.8Financing activitiesIssuance of common stock . . . . . . . . . . . . . . . . . 1,123.0 — — — 1,123.0Acquisition of treasury stock . . . . . . . . . . . . . . . (4.1) — — — (4.1)Proceeds from financing element derivatives . . . . . — 122.0 — — 122.0Payments for financing element derivatives . . . . . . — (67.4) — — (67.4)Excess tax benefits from share-based payment
arrangements . . . . . . . . . . . . . . . . . . . . . . . — 0.1 0.1 — 0.2Dividends to common stockholders . . . . . . . . . . . (159.5) — — — (159.5)Dividends to preferred stockholders . . . . . . . . . . . (33.0) — — — (33.0)Issuance of long-term debt . . . . . . . . . . . . . . . . 745.1 — — — 745.1Principal repayments of long-term debt . . . . . . . . — — (665.1) 196.9 (468.2)Net repayments of short-term borrowings . . . . . . . — — (405.2) 0.1 (405.1)Capital received from parent . . . . . . . . . . . . . . . — 150.9 825.5 (976.4) —Investment contract deposits . . . . . . . . . . . . . . . — 4,220.2 3.9 — 4,224.1Investment contract withdrawals . . . . . . . . . . . . . — (8,752.7) — — (8,752.7)Net increase in banking operation deposits . . . . . . — — 43.9 — 43.9Other . . . . . . . . . . . . . . . . . . . . . . . . . . . . . . — (5.7) — — (5.7)
Net cash provided by (used in) financing activities . . 1,671.5 (4,332.6) (196.9) (779.4) (3,637.4)
Net increase (decrease) in cash and cashequivalents . . . . . . . . . . . . . . . . . . . . . . . . . 306.6 (349.4) (479.3) 154.5 (367.6)
Cash and cash equivalents at beginning of year . . . (2.0) 1,598.6 1,192.3 (180.9) 2,608.0
Cash and cash equivalents at end of year . . . . . . . $ 304.6 $ 1,249.2 $ 713.0 $ (26.4) $ 2,240.4
178
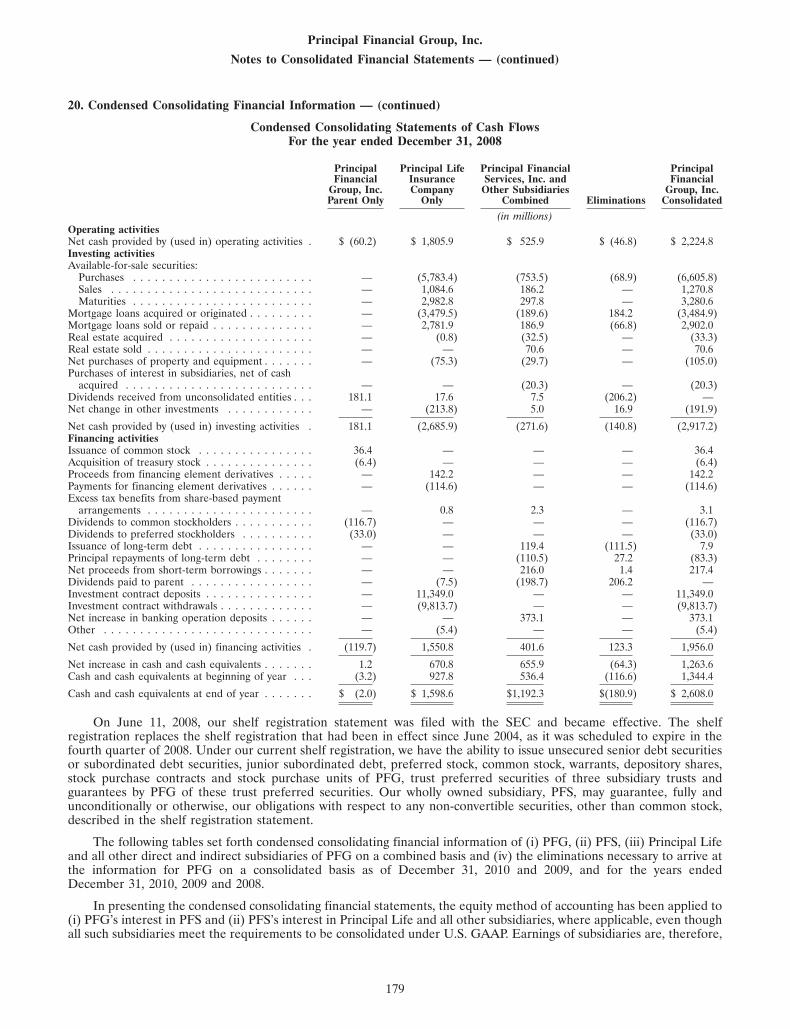
Principal Financial Group, Inc.
Notes to Consolidated Financial Statements — (continued)
20. Condensed Consolidating Financial Information — (continued)
Condensed Consolidating Statements of Cash FlowsFor the year ended December 31, 2008
Principal Principal Life Principal Financial PrincipalFinancial Insurance Services, Inc. and Financial
Group, Inc. Company Other Subsidiaries Group, Inc.Parent Only Only Combined Eliminations Consolidated
(in millions)Operating activitiesNet cash provided by (used in) operating activities . $ (60.2) $ 1,805.9 $ 525.9 $ (46.8) $ 2,224.8Investing activitiesAvailable-for-sale securities:
Purchases . . . . . . . . . . . . . . . . . . . . . . . . . — (5,783.4) (753.5) (68.9) (6,605.8)Sales . . . . . . . . . . . . . . . . . . . . . . . . . . . . — 1,084.6 186.2 — 1,270.8Maturities . . . . . . . . . . . . . . . . . . . . . . . . . — 2,982.8 297.8 — 3,280.6
Mortgage loans acquired or originated . . . . . . . . . — (3,479.5) (189.6) 184.2 (3,484.9)Mortgage loans sold or repaid . . . . . . . . . . . . . . — 2,781.9 186.9 (66.8) 2,902.0Real estate acquired . . . . . . . . . . . . . . . . . . . . — (0.8) (32.5) — (33.3)Real estate sold . . . . . . . . . . . . . . . . . . . . . . . — — 70.6 — 70.6Net purchases of property and equipment . . . . . . . — (75.3) (29.7) — (105.0)Purchases of interest in subsidiaries, net of cash
acquired . . . . . . . . . . . . . . . . . . . . . . . . . . — — (20.3) — (20.3)Dividends received from unconsolidated entities . . . 181.1 17.6 7.5 (206.2) —Net change in other investments . . . . . . . . . . . . — (213.8) 5.0 16.9 (191.9)
Net cash provided by (used in) investing activities . 181.1 (2,685.9) (271.6) (140.8) (2,917.2)Financing activitiesIssuance of common stock . . . . . . . . . . . . . . . . 36.4 — — — 36.4Acquisition of treasury stock . . . . . . . . . . . . . . . (6.4) — — — (6.4)Proceeds from financing element derivatives . . . . . — 142.2 — — 142.2Payments for financing element derivatives . . . . . . — (114.6) — — (114.6)Excess tax benefits from share-based payment
arrangements . . . . . . . . . . . . . . . . . . . . . . . — 0.8 2.3 — 3.1Dividends to common stockholders . . . . . . . . . . . (116.7) — — — (116.7)Dividends to preferred stockholders . . . . . . . . . . (33.0) — — — (33.0)Issuance of long-term debt . . . . . . . . . . . . . . . . — — 119.4 (111.5) 7.9Principal repayments of long-term debt . . . . . . . . — — (110.5) 27.2 (83.3)Net proceeds from short-term borrowings . . . . . . . — — 216.0 1.4 217.4Dividends paid to parent . . . . . . . . . . . . . . . . . — (7.5) (198.7) 206.2 —Investment contract deposits . . . . . . . . . . . . . . . — 11,349.0 — — 11,349.0Investment contract withdrawals . . . . . . . . . . . . . — (9,813.7) — — (9,813.7)Net increase in banking operation deposits . . . . . . — — 373.1 — 373.1Other . . . . . . . . . . . . . . . . . . . . . . . . . . . . . — (5.4) — — (5.4)
Net cash provided by (used in) financing activities . (119.7) 1,550.8 401.6 123.3 1,956.0
Net increase in cash and cash equivalents . . . . . . . 1.2 670.8 655.9 (64.3) 1,263.6Cash and cash equivalents at beginning of year . . . (3.2) 927.8 536.4 (116.6) 1,344.4
Cash and cash equivalents at end of year . . . . . . . $ (2.0) $ 1,598.6 $1,192.3 $(180.9) $ 2,608.0
On June 11, 2008, our shelf registration statement was filed with the SEC and became effective. The shelfregistration replaces the shelf registration that had been in effect since June 2004, as it was scheduled to expire in thefourth quarter of 2008. Under our current shelf registration, we have the ability to issue unsecured senior debt securitiesor subordinated debt securities, junior subordinated debt, preferred stock, common stock, warrants, depository shares,stock purchase contracts and stock purchase units of PFG, trust preferred securities of three subsidiary trusts andguarantees by PFG of these trust preferred securities. Our wholly owned subsidiary, PFS, may guarantee, fully andunconditionally or otherwise, our obligations with respect to any non-convertible securities, other than common stock,described in the shelf registration statement.
The following tables set forth condensed consolidating financial information of (i) PFG, (ii) PFS, (iii) Principal Lifeand all other direct and indirect subsidiaries of PFG on a combined basis and (iv) the eliminations necessary to arrive atthe information for PFG on a consolidated basis as of December 31, 2010 and 2009, and for the years endedDecember 31, 2010, 2009 and 2008.
In presenting the condensed consolidating financial statements, the equity method of accounting has been applied to(i) PFG’s interest in PFS and (ii) PFS’s interest in Principal Life and all other subsidiaries, where applicable, even thoughall such subsidiaries meet the requirements to be consolidated under U.S. GAAP. Earnings of subsidiaries are, therefore,
179

Principal Financial Group, Inc.
Notes to Consolidated Financial Statements — (continued)
20. Condensed Consolidating Financial Information — (continued)
reflected in the parent’s investment and earnings. All intercompany balances and transactions, including elimination ofthe parent’s investment in subsidiaries, between PFG, PFS and Principal Life and all other subsidiaries have beeneliminated, as shown in the column ‘‘Eliminations and Other.’’ These condensed consolidating financial statementsshould be read in conjunction with the consolidated financial statements. The financial information may not necessarilybe indicative of results of operations, cash flows or financial position had the subsidiaries operated as independententities.
Condensed Consolidating Statements of Financial PositionDecember 31, 2010
Principal LifePrincipal Insurance Company PrincipalFinancial and Other Financial
Group, Inc. Principal Financial Subsidiaries Group, Inc.Parent Only Services, Inc. Only Combined Eliminations Consolidated
(in millions)AssetsFixed maturities, available-for-sale . . . . . . . $ 199.9 $ — $ 48,436.4 $ — $ 48,636.3Fixed maturities, trading . . . . . . . . . . . . . . 274.9 — 845.4 — 1,120.3Equity securities, available-for-sale . . . . . . . — — 169.9 — 169.9Equity securities, trading . . . . . . . . . . . . . — — 316.9 — 316.9Mortgage loans . . . . . . . . . . . . . . . . . . . — — 11,125.1 — 11,125.1Real estate . . . . . . . . . . . . . . . . . . . . . . — — 1,063.5 — 1,063.5Policy loans . . . . . . . . . . . . . . . . . . . . . . — — 903.9 — 903.9Investment in unconsolidated entities . . . . . 10,195.1 10,209.0 735.8 (20,403.9) 736.0Other investments . . . . . . . . . . . . . . . . . . 5.6 45.5 1,854.5 — 1,905.6Cash and cash equivalents . . . . . . . . . . . . 370.9 519.7 1,821.7 (834.9) 1,877.4Accrued investment income . . . . . . . . . . . . 0.8 — 665.3 — 666.1Premiums due and other receivables . . . . . . — — 1,066.1 (3.1) 1,063.0Deferred policy acquisition costs . . . . . . . . — — 3,529.8 — 3,529.8Property and equipment . . . . . . . . . . . . . . — — 458.7 — 458.7Goodwill . . . . . . . . . . . . . . . . . . . . . . . — — 345.4 — 345.4Other intangibles . . . . . . . . . . . . . . . . . . — — 834.6 — 834.6Separate account assets . . . . . . . . . . . . . . — — 69,555.3 — 69,555.3Other assets . . . . . . . . . . . . . . . . . . . . . 13.6 9.8 1,302.4 (2.5) 1,323.3
Total assets . . . . . . . . . . . . . . . . . . . . $11,060.8 $10,784.0 $145,030.7 $(21,244.4) $145,631.1
LiabilitiesContractholder funds . . . . . . . . . . . . . . . . $ — $ — $ 37,301.1 $ — $ 37,301.1Future policy benefits and claims . . . . . . . . — — 20,046.3 — 20,046.3Other policyholder funds . . . . . . . . . . . . . — — 592.2 — 592.2Short-term debt . . . . . . . . . . . . . . . . . . . — 50.0 352.3 (294.4) 107.9Long-term debt . . . . . . . . . . . . . . . . . . . 1,351.7 — 232.0 — 1,583.7Income taxes currently payable . . . . . . . . . (18.8) (2.3) 11.6 15.7 6.2Deferred income taxes . . . . . . . . . . . . . . . (21.6) (8.7) 455.7 (15.5) 409.9Separate account liabilities . . . . . . . . . . . . — — 69,555.3 — 69,555.3Other liabilities . . . . . . . . . . . . . . . . . . . 21.7 549.9 6,118.0 (546.1) 6,143.5
Total liabilities . . . . . . . . . . . . . . . . . . 1,333.0 588.9 134,664.5 (840.3) 135,746.1Stockholders’ equitySeries A preferred stock . . . . . . . . . . . . . . — — — — —Series B preferred stock . . . . . . . . . . . . . . 0.1 — — — 0.1Common stock . . . . . . . . . . . . . . . . . . . . 4.5 — 17.8 (17.8) 4.5Additional paid-in capital . . . . . . . . . . . . . 9,563.8 8,334.0 7,730.0 (16,064.0) 9,563.8Retained earnings . . . . . . . . . . . . . . . . . . 4,612.3 1,546.3 2,142.4 (3,688.7) 4,612.3Accumulated other comprehensive income . . 272.4 314.8 320.8 (635.6) 272.4Treasury stock, at cost . . . . . . . . . . . . . . . (4,725.3) — (2.0) 2.0 (4,725.3)
Total stockholders’ equity attributable toPFG . . . . . . . . . . . . . . . . . . . . . . . 9,727.8 10,195.1 10,209.0 (20,404.1) 9,727.8
Noncontrolling interest . . . . . . . . . . . . . . — — 157.2 — 157.2
Total stockholders’ equity . . . . . . . . . . . . 9,727.8 10,195.1 10,366.2 (20,404.1) 9,885.0
Total liabilities and stockholders’ equity . . . $11,060.8 $10,784.0 $145,030.7 $(21,244.4) $145,631.1
180

Principal Financial Group, Inc.
Notes to Consolidated Financial Statements — (continued)
20. Condensed Consolidating Financial Information — (continued)
Condensed Consolidating Statements of Financial PositionDecember 31, 2009
Principal LifePrincipal Principal Insurance PrincipalFinancial Financial Company and Financial
Group, Inc. Services, Inc. Other Subsidiaries Group, Inc.Parent Only Only Combined Eliminations Consolidated
(in millions)AssetsFixed maturities, available-for-sale . . . . . . . . . . . . $ 124.5 $ — $ 46,096.1 $ — $ 46,220.6Fixed maturities, trading . . . . . . . . . . . . . . . . . . 348.1 — 684.3 — 1,032.4Equity securities, available-for-sale . . . . . . . . . . . . — — 214.0 — 214.0Equity securities, trading . . . . . . . . . . . . . . . . . . — — 221.5 — 221.5Mortgage loans . . . . . . . . . . . . . . . . . . . . . . . . — — 11,845.6 — 11,845.6Real estate . . . . . . . . . . . . . . . . . . . . . . . . . . . — — 1,034.6 — 1,034.6Policy loans . . . . . . . . . . . . . . . . . . . . . . . . . . — — 902.5 — 902.5Investment in unconsolidated entities . . . . . . . . . . 8,423.1 8,468.4 628.1 (16,891.3) 628.3Other investments . . . . . . . . . . . . . . . . . . . . . . 5.3 49.4 1,782.4 (0.1) 1,837.0Cash and cash equivalents . . . . . . . . . . . . . . . . . 304.6 534.4 2,256.8 (855.4) 2,240.4Accrued investment income . . . . . . . . . . . . . . . . 2.0 — 689.9 — 691.9Premiums due and other receivables . . . . . . . . . . . 2.0 — 1,062.5 0.9 1,065.4Deferred policy acquisition costs . . . . . . . . . . . . . — — 3,681.4 — 3,681.4Property and equipment . . . . . . . . . . . . . . . . . . — — 489.3 — 489.3Goodwill . . . . . . . . . . . . . . . . . . . . . . . . . . . . — — 386.4 — 386.4Other intangibles . . . . . . . . . . . . . . . . . . . . . . . — — 851.7 — 851.7Separate account assets . . . . . . . . . . . . . . . . . . . — — 62,738.5 — 62,738.5Other assets . . . . . . . . . . . . . . . . . . . . . . . . . . 13.0 9.4 1,644.0 11.5 1,677.9
Total assets . . . . . . . . . . . . . . . . . . . . . . . . . $ 9,222.6 $9,061.6 $137,209.6 $(17,734.4) $137,759.4
LiabilitiesContractholder funds . . . . . . . . . . . . . . . . . . . . $ — $ — $ 39,801.9 $ — $ 39,801.9Future policy benefits and claims . . . . . . . . . . . . . — — 19,248.3 — 19,248.3Other policyholder funds . . . . . . . . . . . . . . . . . . — — 559.2 — 559.2Short-term debt . . . . . . . . . . . . . . . . . . . . . . . . — 75.0 338.7 (312.1) 101.6Long-term debt . . . . . . . . . . . . . . . . . . . . . . . . 1,351.8 — 232.8 — 1,584.6Income taxes currently payable . . . . . . . . . . . . . . (14.7) (5.4) 9.1 13.8 2.8Deferred income taxes . . . . . . . . . . . . . . . . . . . (27.0) (4.2) 149.6 1.8 120.2Separate account liabilities . . . . . . . . . . . . . . . . . — — 62,738.5 — 62,738.5Other liabilities . . . . . . . . . . . . . . . . . . . . . . . . 19.0 573.1 5,540.2 (546.4) 5,585.9
Total liabilities . . . . . . . . . . . . . . . . . . . . . . . 1,329.1 638.5 128,618.3 (842.9) 129,743.0Stockholders’ equitySeries A preferred stock . . . . . . . . . . . . . . . . . . — — — — —Series B preferred stock . . . . . . . . . . . . . . . . . . 0.1 — — — 0.1Common stock . . . . . . . . . . . . . . . . . . . . . . . . 4.5 — 17.8 (17.8) 4.5Additional paid-in capital . . . . . . . . . . . . . . . . . . 9,492.9 8,586.5 7,965.8 (16,552.3) 9,492.9Retained earnings . . . . . . . . . . . . . . . . . . . . . . 4,160.7 834.0 1,468.3 (2,302.3) 4,160.7Accumulated other comprehensive loss . . . . . . . . . (1,042.0) (997.4) (981.5) 1,978.9 (1,042.0)Treasury stock, at cost . . . . . . . . . . . . . . . . . . . . (4,722.7) — (2.0) 2.0 (4,722.7)
Total stockholders’ equity attributable to PFG . . . 7,893.5 8,423.1 8,468.4 (16,891.5) 7,893.5Noncontrolling interest . . . . . . . . . . . . . . . . . . . — — 122.9 — 122.9
Total stockholders’ equity . . . . . . . . . . . . . . . . 7,893.5 8,423.1 8,591.3 (16,891.5) 8,016.4
Total liabilities and stockholders’ equity . . . . . . . $ 9,222.6 $9,061.6 $137,209.6 $(17,734.4) $137,759.4
181

Principal Financial Group, Inc.
Notes to Consolidated Financial Statements — (continued)
20. Condensed Consolidating Financial Information — (continued)
Condensed Consolidating Statements of OperationsFor the year ended December 31, 2010
Principal LifePrincipal Principal Insurance PrincipalFinancial Financial Company and Financial
Group, Inc. Services, Inc. Other Subsidiaries Group, Inc.Parent Only Only Combined Eliminations Consolidated
(in millions)RevenuesPremiums and other considerations . . . . . . . . . . . $ — $ — $3,555.5 $ — $3,555.5Fees and other revenues . . . . . . . . . . . . . . . . . . 0.1 — 2,302.8 (4.8) 2,298.1Net investment income (loss) . . . . . . . . . . . . . . . 33.2 (3.1) 3,461.7 4.7 3,496.5Net realized capital gains (losses), excluding
impairment losses on available-for-sale securities . 0.7 (0.2) 48.2 — 48.7Total other-than-temporary impairment losses on
available-for-sale securities . . . . . . . . . . . . . . . — — (296.3) — (296.3)Portion of impairment losses on fixed maturities,
available-for-sale recognized in othercomprehensive income . . . . . . . . . . . . . . . . . . — — 56.1 — 56.1
Net impairment losses on available-for-salesecurities . . . . . . . . . . . . . . . . . . . . . . . . . . . — — (240.2) — (240.2)
Net realized capital gains (losses) . . . . . . . . . . . . . 0.7 (0.2) (192.0) — (191.5)
Total revenues . . . . . . . . . . . . . . . . . . . . . . . 34.0 (3.3) 9,128.0 (0.1) 9,158.6ExpensesBenefits, claims and settlement expenses . . . . . . . . — — 5,338.4 — 5,338.4Dividends to policyholders . . . . . . . . . . . . . . . . . — — 219.9 — 219.9Operating expenses . . . . . . . . . . . . . . . . . . . . . 117.0 1.2 2,640.9 (0.1) 2,759.0
Total expenses . . . . . . . . . . . . . . . . . . . . . . . 117.0 1.2 8,199.2 (0.1) 8,317.3
Income (loss) before income taxes . . . . . . . . . . . . (83.0) (4.5) 928.8 — 841.3Income taxes (benefits) . . . . . . . . . . . . . . . . . . . (31.6) (1.7) 157.4 — 124.1Equity in the net income of subsidiaries . . . . . . . . 750.7 753.5 — (1,504.2) —
Net income . . . . . . . . . . . . . . . . . . . . . . . . . . 699.3 750.7 771.4 (1,504.2) 717.2Net income attributable to noncontrolling interest . . — — 17.9 — 17.9
Net income attributable to PFG . . . . . . . . . . . . . 699.3 750.7 753.5 (1,504.2) 699.3Preferred stock dividends . . . . . . . . . . . . . . . . . . 33.0 — — — 33.0
Net income available to common stockholders . . . . $666.3 $750.7 $ 753.5 $(1,504.2) $ 666.3
182

Principal Financial Group, Inc.
Notes to Consolidated Financial Statements — (continued)
20. Condensed Consolidating Financial Information — (continued)
Condensed Consolidating Statements of OperationsFor the year ended December 31, 2009
Principal LifePrincipal Principal Insurance PrincipalFinancial Financial Company and Financial
Group, Inc. Services, Inc. Other Subsidiaries Group, Inc.Parent Only Only Combined Eliminations Consolidated
(in millions)RevenuesPremiums and other considerations . . . . . . . . . . . $ — $ — $3,750.6 $ — $3,750.6Fees and other revenues . . . . . . . . . . . . . . . . . . — 0.1 2,109.0 (13.1) 2,096.0Net investment income (loss) . . . . . . . . . . . . . . . 3.6 (0.5) 3,397.1 0.6 3,400.8Net realized capital gains (losses), excluding
impairment losses on available-for-sale securities . 0.1 (0.4) 55.1 0.1 54.9Total other-than-temporary impairment losses on
available-for-sale securities . . . . . . . . . . . . . . . — — (714.1) — (714.1)Portion of impairment losses on fixed maturities,
available-for-sale recognized in othercomprehensive income . . . . . . . . . . . . . . . . . . — — 260.9 — 260.9
Net impairment losses on available-for-salesecurities . . . . . . . . . . . . . . . . . . . . . . . . . . . — — (453.2) — (453.2)
Net realized capital gains (losses) . . . . . . . . . . . . . 0.1 (0.4) (398.1) 0.1 (398.3)
Total revenues . . . . . . . . . . . . . . . . . . . . . . . 3.7 (0.8) 8,858.6 (12.4) 8,849.1ExpensesBenefits, claims and settlement expenses . . . . . . . . — — 5,334.5 — 5,334.5Dividends to policyholders . . . . . . . . . . . . . . . . . — — 242.2 — 242.2Operating expenses . . . . . . . . . . . . . . . . . . . . . 90.8 27.9 2,420.3 (12.4) 2,526.6
Total expenses . . . . . . . . . . . . . . . . . . . . . . . 90.8 27.9 7,997.0 (12.4) 8,103.3
Income (loss) before income taxes . . . . . . . . . . . . (87.1) (28.7) 861.6 — 745.8Income taxes (benefits) . . . . . . . . . . . . . . . . . . . (34.7) (21.0) 155.8 — 100.1Equity in the net income of subsidiaries . . . . . . . . 675.1 682.8 — (1,357.9) —
Net income . . . . . . . . . . . . . . . . . . . . . . . . . . 622.7 675.1 705.8 (1,357.9) 645.7Net income attributable to noncontrolling interest . . — — 23.0 — 23.0
Net income attributable to PFG . . . . . . . . . . . . . 622.7 675.1 682.8 (1,357.9) 622.7Preferred stock dividends . . . . . . . . . . . . . . . . . . 33.0 — — — 33.0
Net income available to common stockholders . . . . $589.7 $675.1 $ 682.8 $(1,357.9) $ 589.7
183

Principal Financial Group, Inc.
Notes to Consolidated Financial Statements — (continued)
20. Condensed Consolidating Financial Information — (continued)
Condensed Consolidating Statements of OperationsFor the year ended December 31, 2008
Principal LifePrincipal Principal Insurance PrincipalFinancial Financial Company and Financial
Group, Inc. Services, Inc. Other Subsidiaries Group, Inc.Parent Only Only Combined Eliminations Consolidated
(in millions)RevenuesPremiums and other considerations . . . . . . . . . . . $ — $ — $4,209.2 $ — $4,209.2Fees and other revenues . . . . . . . . . . . . . . . . . . — 0.1 2,441.1 (14.7) 2,426.5Net investment income (loss) . . . . . . . . . . . . . . . (0.3) (2.3) 3,996.9 — 3,994.3Net realized capital losses, excluding impairment
losses on available-for-sale securities . . . . . . . . . (1.8) (0.5) (212.4) (0.1) (214.8)Total other-than-temporary impairment losses on
available-for-sale securities . . . . . . . . . . . . . . . — — (479.3) — (479.3)Portion of impairment losses on fixed maturities,
available-for-sale recognized in othercomprehensive income . . . . . . . . . . . . . . . . . . — — — — —
Net impairment losses on available-for-sale securities . . — — (479.3) — (479.3)
Net realized capital losses . . . . . . . . . . . . . . . . . (1.8) (0.5) (691.7) (0.1) (694.1)
Total revenues . . . . . . . . . . . . . . . . . . . . . . . (2.1) (2.7) 9,955.5 (14.8) 9,935.9ExpensesBenefits, claims and settlement expenses . . . . . . . . — — 6,219.9 — 6,219.9Dividends to policyholders . . . . . . . . . . . . . . . . . — — 267.3 — 267.3Operating expenses . . . . . . . . . . . . . . . . . . . . . 48.0 44.6 2,909.6 (14.8) 2,987.4
Total expenses . . . . . . . . . . . . . . . . . . . . . . . 48.0 44.6 9,396.8 (14.8) 9,474.6
Income (loss) before income taxes . . . . . . . . . . . . (50.1) (47.3) 558.7 — 461.3Income taxes (benefits) . . . . . . . . . . . . . . . . . . . (20.0) (33.5) 49.0 — (4.5)Equity in the net income of subsidiaries . . . . . . . . 488.2 502.0 — (990.2) —
Net income . . . . . . . . . . . . . . . . . . . . . . . . . . 458.1 488.2 509.7 (990.2) 465.8Net income attributable to noncontrolling interest . . — — 7.7 — 7.7
Net income attributable to PFG . . . . . . . . . . . . . 458.1 488.2 502.0 (990.2) 458.1Preferred stock dividends . . . . . . . . . . . . . . . . . . 33.0 — — — 33.0
Net income available to common stockholders . . . . $425.1 $488.2 $ 502.0 $(990.2) $ 425.1
184
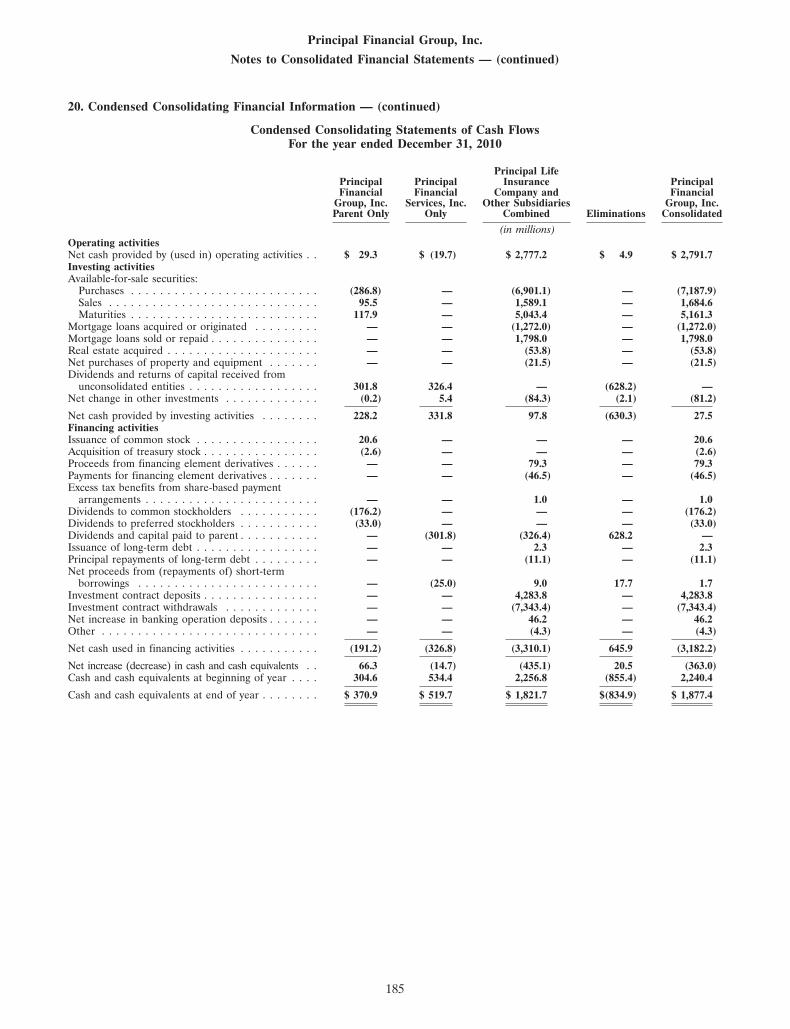
Principal Financial Group, Inc.
Notes to Consolidated Financial Statements — (continued)
20. Condensed Consolidating Financial Information — (continued)
Condensed Consolidating Statements of Cash FlowsFor the year ended December 31, 2010
Principal LifePrincipal Principal Insurance PrincipalFinancial Financial Company and Financial
Group, Inc. Services, Inc. Other Subsidiaries Group, Inc.Parent Only Only Combined Eliminations Consolidated
(in millions)Operating activitiesNet cash provided by (used in) operating activities . . $ 29.3 $ (19.7) $ 2,777.2 $ 4.9 $ 2,791.7Investing activitiesAvailable-for-sale securities:
Purchases . . . . . . . . . . . . . . . . . . . . . . . . . . (286.8) — (6,901.1) — (7,187.9)Sales . . . . . . . . . . . . . . . . . . . . . . . . . . . . . 95.5 — 1,589.1 — 1,684.6Maturities . . . . . . . . . . . . . . . . . . . . . . . . . . 117.9 — 5,043.4 — 5,161.3
Mortgage loans acquired or originated . . . . . . . . . — — (1,272.0) — (1,272.0)Mortgage loans sold or repaid . . . . . . . . . . . . . . . — — 1,798.0 — 1,798.0Real estate acquired . . . . . . . . . . . . . . . . . . . . . — — (53.8) — (53.8)Net purchases of property and equipment . . . . . . . — — (21.5) — (21.5)Dividends and returns of capital received from
unconsolidated entities . . . . . . . . . . . . . . . . . . 301.8 326.4 — (628.2) —Net change in other investments . . . . . . . . . . . . . (0.2) 5.4 (84.3) (2.1) (81.2)
Net cash provided by investing activities . . . . . . . . 228.2 331.8 97.8 (630.3) 27.5Financing activitiesIssuance of common stock . . . . . . . . . . . . . . . . . 20.6 — — — 20.6Acquisition of treasury stock . . . . . . . . . . . . . . . . (2.6) — — — (2.6)Proceeds from financing element derivatives . . . . . . — — 79.3 — 79.3Payments for financing element derivatives . . . . . . . — — (46.5) — (46.5)Excess tax benefits from share-based payment
arrangements . . . . . . . . . . . . . . . . . . . . . . . . — — 1.0 — 1.0Dividends to common stockholders . . . . . . . . . . . (176.2) — — — (176.2)Dividends to preferred stockholders . . . . . . . . . . . (33.0) — — — (33.0)Dividends and capital paid to parent . . . . . . . . . . . — (301.8) (326.4) 628.2 —Issuance of long-term debt . . . . . . . . . . . . . . . . . — — 2.3 — 2.3Principal repayments of long-term debt . . . . . . . . . — — (11.1) — (11.1)Net proceeds from (repayments of) short-term
borrowings . . . . . . . . . . . . . . . . . . . . . . . . . — (25.0) 9.0 17.7 1.7Investment contract deposits . . . . . . . . . . . . . . . . — — 4,283.8 — 4,283.8Investment contract withdrawals . . . . . . . . . . . . . — — (7,343.4) — (7,343.4)Net increase in banking operation deposits . . . . . . . — — 46.2 — 46.2Other . . . . . . . . . . . . . . . . . . . . . . . . . . . . . . — — (4.3) — (4.3)
Net cash used in financing activities . . . . . . . . . . . (191.2) (326.8) (3,310.1) 645.9 (3,182.2)
Net increase (decrease) in cash and cash equivalents . . 66.3 (14.7) (435.1) 20.5 (363.0)Cash and cash equivalents at beginning of year . . . . 304.6 534.4 2,256.8 (855.4) 2,240.4
Cash and cash equivalents at end of year . . . . . . . . $ 370.9 $ 519.7 $ 1,821.7 $(834.9) $ 1,877.4
185

Principal Financial Group, Inc.
Notes to Consolidated Financial Statements — (continued)
20. Condensed Consolidating Financial Information — (continued)
Condensed Consolidating Statements of Cash FlowsFor the year ended December 31, 2009
Principal LifeInsurance
Principal Principal Company PrincipalFinancial Financial and Other Financial
Group, Inc. Services, Inc. Subsidiaries Group, Inc.Parent Only Only Combined Eliminations Consolidated
(in millions)Operating activitiesNet cash provided by (used in) operating activities . . . . . . . . $ (442.6) $ 179.1 $ 2,640.7 $(134.2) $ 2,243.0Investing activitiesAvailable-for-sale securities:
Purchases . . . . . . . . . . . . . . . . . . . . . . . . . . . . . . . . (187.6) (50.0) (7,695.7) — (7,933.3)Sales . . . . . . . . . . . . . . . . . . . . . . . . . . . . . . . . . . . 4.0 — 3,435.8 — 3,439.8Maturities . . . . . . . . . . . . . . . . . . . . . . . . . . . . . . . . 57.1 — 4,511.0 — 4,568.1
Mortgage loans acquired or originated . . . . . . . . . . . . . . . — — (586.5) — (586.5)Mortgage loans sold or repaid . . . . . . . . . . . . . . . . . . . . . — — 1,704.4 — 1,704.4Real estate acquired . . . . . . . . . . . . . . . . . . . . . . . . . . . — — (62.2) — (62.2)Real estate sold . . . . . . . . . . . . . . . . . . . . . . . . . . . . . . — — 30.3 — 30.3Net purchases of property and equipment . . . . . . . . . . . . . (0.1) — (26.1) — (26.2)Purchases of interest in subsidiaries, net of cash acquired . . . — — (45.7) — (45.7)Contributions to unconsolidated entities . . . . . . . . . . . . . . (795.9) (111.8) — 907.7 —Net change in other investments . . . . . . . . . . . . . . . . . . . 0.2 37.8 (64.1) (35.8) (61.9)
Net cash provided by (used in) investing activities . . . . . . . . (922.3) (124.0) 1,201.2 871.9 1,026.8Financing activitiesIssuance of common stock . . . . . . . . . . . . . . . . . . . . . . . 1,123.0 — — — 1,123.0Acquisition of treasury stock . . . . . . . . . . . . . . . . . . . . . . (4.1) — — — (4.1)Proceeds from financing element derivatives . . . . . . . . . . . . — — 122.0 — 122.0Payments for financing element derivatives . . . . . . . . . . . . . — — (67.4) — (67.4)Excess tax benefits from share-based payment arrangements . . — — 0.2 — 0.2Dividends to common stockholders . . . . . . . . . . . . . . . . . (159.5) — — — (159.5)Dividends to preferred stockholders . . . . . . . . . . . . . . . . . (33.0) — — — (33.0)Issuance of long-term debt . . . . . . . . . . . . . . . . . . . . . . . 745.1 — — — 745.1Principal repayments of long-term debt . . . . . . . . . . . . . . . — (454.6) (13.6) — (468.2)Net proceeds from (repayments of) short-term borrowings . . . — (408.0) 23.8 (20.9) (405.1)Capital received from parent . . . . . . . . . . . . . . . . . . . . . — 795.9 111.8 (907.7) —Investment contract deposits . . . . . . . . . . . . . . . . . . . . . . — — 4,224.1 — 4,224.1Investment contract withdrawals . . . . . . . . . . . . . . . . . . . — — (8,752.7) — (8,752.7)Net increase in banking operation deposits . . . . . . . . . . . . . — — 43.9 — 43.9Other . . . . . . . . . . . . . . . . . . . . . . . . . . . . . . . . . . . . — — (5.7) — (5.7)
Net cash provided by (used in) financing activities . . . . . . . . 1,671.5 (66.7) (4,313.6) (928.6) (3,637.4)
Net increase (decrease) in cash and cash equivalents . . . . . . 306.6 (11.6) (471.7) (190.9) (367.6)Cash and cash equivalents at beginning of year . . . . . . . . . . (2.0) 546.0 2,728.5 (664.5) 2,608.0
Cash and cash equivalents at end of year . . . . . . . . . . . . . . $ 304.6 $ 534.4 $ 2,256.8 $(855.4) $ 2,240.4
186

Principal Financial Group, Inc.
Notes to Consolidated Financial Statements — (continued)
20. Condensed Consolidating Financial Information — (continued)
Condensed Consolidating Statements of Cash FlowsFor the year ended December 31, 2008
Principal LifeInsurance
Principal Principal Company PrincipalFinancial Financial and Other Financial
Group, Inc. Services, Inc. Subsidiaries Group, Inc.Parent Only Only Combined Eliminations Consolidated
(in millions)Operating activitiesNet cash provided by (used in) operating activities . . . . . . . . $ (60.2) $ (47.6) $ 2,342.5 $ (9.9) $ 2,224.8Investing activitiesAvailable-for-sale securities:
Purchases . . . . . . . . . . . . . . . . . . . . . . . . . . . . . . . . — 50.0 (6,655.8) — (6,605.8)Sales . . . . . . . . . . . . . . . . . . . . . . . . . . . . . . . . . . . — — 1,270.8 — 1,270.8Maturities . . . . . . . . . . . . . . . . . . . . . . . . . . . . . . . . — — 3,280.6 — 3,280.6
Mortgage loans acquired or originated . . . . . . . . . . . . . . . — — (3,484.9) — (3,484.9)Mortgage loans sold or repaid . . . . . . . . . . . . . . . . . . . . . — — 2,902.0 — 2,902.0Real estate acquired . . . . . . . . . . . . . . . . . . . . . . . . . . . — — (33.3) — (33.3)Real estate sold . . . . . . . . . . . . . . . . . . . . . . . . . . . . . . — — 70.6 — 70.6Net purchases of property and equipment . . . . . . . . . . . . . — — (105.0) — (105.0)Purchases of interest in subsidiaries, net of cash acquired . . . — (2.3) (18.0) — (20.3)Dividends received from unconsolidated entities . . . . . . . . . 181.1 92.1 — (273.2) —Net change in other investments . . . . . . . . . . . . . . . . . . . — 36.4 (187.0) (41.3) (191.9)
Net cash provided by (used in) investing activities . . . . . . . . 181.1 176.2 (2,960.0) (314.5) (2,917.2)Financing activitiesIssuance of common stock . . . . . . . . . . . . . . . . . . . . . . . 36.4 — — — 36.4Acquisition of treasury stock . . . . . . . . . . . . . . . . . . . . . . (6.4) — — — (6.4)Proceeds from financing element derivatives . . . . . . . . . . . . — — 142.2 — 142.2Payments for financing element derivatives . . . . . . . . . . . . . — — (114.6) — (114.6)Excess tax benefits from share-based payment arrangements . . — — 3.1 — 3.1Dividends to common stockholders . . . . . . . . . . . . . . . . . (116.7) — — — (116.7)Dividends to preferred stockholders . . . . . . . . . . . . . . . . . (33.0) — — — (33.0)Issuance of long-term debt . . . . . . . . . . . . . . . . . . . . . . . — — 7.9 — 7.9Principal repayments of long-term debt . . . . . . . . . . . . . . . — — (83.3) — (83.3)Net proceeds from (repayments of) short-term borrowings . . . — 249.4 (85.3) 53.3 217.4Dividends paid to parent . . . . . . . . . . . . . . . . . . . . . . . . — (181.1) (92.1) 273.2 —Investment contract deposits . . . . . . . . . . . . . . . . . . . . . . — — 11,349.0 — 11,349.0Investment contract withdrawals . . . . . . . . . . . . . . . . . . . — — (9,813.7) — (9,813.7)Net increase in banking operation deposits . . . . . . . . . . . . . — — 373.1 — 373.1Other . . . . . . . . . . . . . . . . . . . . . . . . . . . . . . . . . . . . — — (5.4) — (5.4)
Net cash provided by (used in) financing activities . . . . . . . . (119.7) 68.3 1,680.9 326.5 1,956.0
Net increase in cash and cash equivalents . . . . . . . . . . . . . 1.2 196.9 1,063.4 2.1 1,263.6Cash and cash equivalents at beginning of year . . . . . . . . . . (3.2) 349.1 1,665.1 (666.6) 1,344.4
Cash and cash equivalents at end of year . . . . . . . . . . . . . . $ (2.0) $ 546.0 $ 2,728.5 $(664.5) $ 2,608.0
187

Item 9. Changes in and Disagreements with Accountants on Accounting and Financial Disclosure
None.
Item 9A. Controls and Procedures
Management’s Report on Internal Control Over Financial Reporting
Management of Principal Financial Group, Inc. is responsible for establishing and maintaining adequate internalcontrol over financial reporting. A company’s internal control over financial reporting is a process designed to providereasonable assurance regarding the reliability of financial reporting and the preparation of financial statements forexternal purposes in accordance with U.S. generally accepted accounting principles. A company’s internal control overfinancial reporting includes those policies and procedures that (1) pertain to the maintenance of records that, inreasonable detail, accurately and fairly reflect the transactions and dispositions of the assets of the company; (2) providereasonable assurance that transactions are recorded as necessary to permit preparation of financial statements inaccordance with U.S. generally accepted accounting principles, and that receipts and expenditures of the company arebeing made only in accordance with authorizations of management and directors of the company and (3) providereasonable assurance regarding prevention or timely detection of unauthorized acquisition, use, or disposition of thecompany’s assets that could have a material effect on the financial statements.
Because of its inherent limitations, internal control over financial reporting may not prevent or detect misstatements.Also, projections of any evaluation of effectiveness to future periods are subject to the risk that controls may becomeinadequate because of changes in conditions, or that the degree of compliance with the policies or procedures maydeteriorate.
Under the supervision and with the participation of management, including our Chief Executive Officer, Larry D.Zimpleman, and our Chief Financial Officer, Terrance J. Lillis, we conducted an evaluation of the effectiveness of ourinternal control over financial reporting based on criteria established in Internal Controls — Integrated Framework issuedby the Committee of Sponsoring Organizations of the Treadway Commission. Based on our evaluation, management hasconcluded that Principal Financial Group, Inc.’s internal control over financial reporting was effective as of December 31,2010.
Ernst & Young LLP, the independent registered public accounting firm that audited our financial statementsincluded in this annual report on Form 10-K, has issued their report on the effectiveness of our internal control overfinancial reporting. The report is included in Item 8. ‘‘Financial Statements and Supplementary Data.’’
Changes in Internal Control Over Financial Reporting
There was no change in our internal control over financial reporting during our last fiscal quarter that has materiallyaffected, or is reasonably likely to materially affect, our internal control over financial reporting.
Disclosure Controls and Procedures
In order to ensure that the information that we must disclose in our filings with the SEC is recorded, processed,summarized and reported on a timely basis, we have adopted disclosure controls and procedures. Disclosure controls andprocedures include, without limitation, controls and procedures designed to ensure that information required to bedisclosed by us in the reports that we file with or submit to the SEC is accumulated and communicated to ourmanagement, including our Chief Executive Officer and our Chief Financial Officer, as appropriate to allow timelydecisions regarding required disclosure.
Our Chief Executive Officer, Larry D. Zimpleman, and our Chief Financial Officer, Terrance J. Lillis, have reviewedand evaluated our disclosure controls and procedures as of December 31, 2010, and have concluded that our disclosurecontrols and procedures are effective.
Item 9B. Other Information
None
188
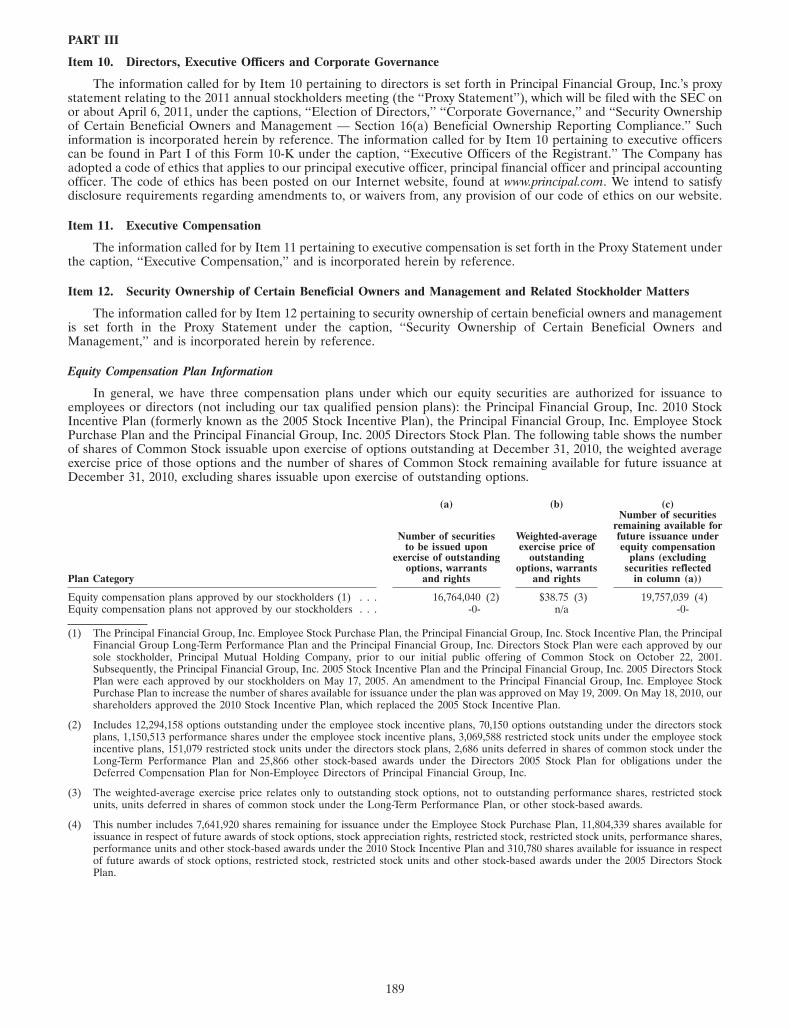
PART III
Item 10. Directors, Executive Officers and Corporate Governance
The information called for by Item 10 pertaining to directors is set forth in Principal Financial Group, Inc.’s proxystatement relating to the 2011 annual stockholders meeting (the ‘‘Proxy Statement’’), which will be filed with the SEC onor about April 6, 2011, under the captions, ‘‘Election of Directors,’’ ‘‘Corporate Governance,’’ and ‘‘Security Ownershipof Certain Beneficial Owners and Management — Section 16(a) Beneficial Ownership Reporting Compliance.’’ Suchinformation is incorporated herein by reference. The information called for by Item 10 pertaining to executive officerscan be found in Part I of this Form 10-K under the caption, ‘‘Executive Officers of the Registrant.’’ The Company hasadopted a code of ethics that applies to our principal executive officer, principal financial officer and principal accountingofficer. The code of ethics has been posted on our Internet website, found at www.principal.com. We intend to satisfydisclosure requirements regarding amendments to, or waivers from, any provision of our code of ethics on our website.
Item 11. Executive Compensation
The information called for by Item 11 pertaining to executive compensation is set forth in the Proxy Statement underthe caption, ‘‘Executive Compensation,’’ and is incorporated herein by reference.
Item 12. Security Ownership of Certain Beneficial Owners and Management and Related Stockholder Matters
The information called for by Item 12 pertaining to security ownership of certain beneficial owners and managementis set forth in the Proxy Statement under the caption, ‘‘Security Ownership of Certain Beneficial Owners andManagement,’’ and is incorporated herein by reference.
Equity Compensation Plan Information
In general, we have three compensation plans under which our equity securities are authorized for issuance toemployees or directors (not including our tax qualified pension plans): the Principal Financial Group, Inc. 2010 StockIncentive Plan (formerly known as the 2005 Stock Incentive Plan), the Principal Financial Group, Inc. Employee StockPurchase Plan and the Principal Financial Group, Inc. 2005 Directors Stock Plan. The following table shows the numberof shares of Common Stock issuable upon exercise of options outstanding at December 31, 2010, the weighted averageexercise price of those options and the number of shares of Common Stock remaining available for future issuance atDecember 31, 2010, excluding shares issuable upon exercise of outstanding options.
(a) (b) (c)Number of securities
remaining available forNumber of securities Weighted-average future issuance under
to be issued upon exercise price of equity compensationexercise of outstanding outstanding plans (excluding
options, warrants options, warrants securities reflectedPlan Category and rights and rights in column (a))
Equity compensation plans approved by our stockholders (1) . . . 16,764,040 (2) $38.75 (3) 19,757,039 (4)Equity compensation plans not approved by our stockholders . . . -0- n/a -0-
(1) The Principal Financial Group, Inc. Employee Stock Purchase Plan, the Principal Financial Group, Inc. Stock Incentive Plan, the PrincipalFinancial Group Long-Term Performance Plan and the Principal Financial Group, Inc. Directors Stock Plan were each approved by oursole stockholder, Principal Mutual Holding Company, prior to our initial public offering of Common Stock on October 22, 2001.Subsequently, the Principal Financial Group, Inc. 2005 Stock Incentive Plan and the Principal Financial Group, Inc. 2005 Directors StockPlan were each approved by our stockholders on May 17, 2005. An amendment to the Principal Financial Group, Inc. Employee StockPurchase Plan to increase the number of shares available for issuance under the plan was approved on May 19, 2009. On May 18, 2010, ourshareholders approved the 2010 Stock Incentive Plan, which replaced the 2005 Stock Incentive Plan.
(2) Includes 12,294,158 options outstanding under the employee stock incentive plans, 70,150 options outstanding under the directors stockplans, 1,150,513 performance shares under the employee stock incentive plans, 3,069,588 restricted stock units under the employee stockincentive plans, 151,079 restricted stock units under the directors stock plans, 2,686 units deferred in shares of common stock under theLong-Term Performance Plan and 25,866 other stock-based awards under the Directors 2005 Stock Plan for obligations under theDeferred Compensation Plan for Non-Employee Directors of Principal Financial Group, Inc.
(3) The weighted-average exercise price relates only to outstanding stock options, not to outstanding performance shares, restricted stockunits, units deferred in shares of common stock under the Long-Term Performance Plan, or other stock-based awards.
(4) This number includes 7,641,920 shares remaining for issuance under the Employee Stock Purchase Plan, 11,804,339 shares available forissuance in respect of future awards of stock options, stock appreciation rights, restricted stock, restricted stock units, performance shares,performance units and other stock-based awards under the 2010 Stock Incentive Plan and 310,780 shares available for issuance in respectof future awards of stock options, restricted stock, restricted stock units and other stock-based awards under the 2005 Directors StockPlan.
189

Item 13. Certain Relationships and Related Transactions, and Director Independence
The information called for by Item 13 pertaining to certain relationships and related transactions is set forth in theProxy Statement under the captions, ‘‘Corporate Governance — Director Independence,’’ and ‘‘CorporateGovernance — Certain Relationships and Related Transactions,’’ and is incorporated herein by reference.
Item 14. Principal Accounting Fees and Services
The information called for by Item 14 pertaining to principal accounting fees and services is set forth in the ProxyStatement under the caption, ‘‘Ratification of Appointment of Independent Registered Public Accountants,’’ and isincorporated herein by reference.
190

PART IV
Item 15. Exhibits and Financial Statement Schedules
a. Documents filed as part of this report.
1. Financial Statements (see Item 8. Financial Statements and Supplementary Data)Report of Independent Registered Public Accounting Firm on Internal Control over Financial ReportingReport of Independent Registered Public Accounting FirmAudited Consolidated Financial StatementsConsolidated Statements of Financial PositionConsolidated Statements of OperationsConsolidated Statements of Stockholders’ EquityConsolidated Statements of Cash FlowsNotes to Consolidated Financial Statements
2. Report of Independent Registered Public Accounting Firm on SchedulesSchedule I — Summary of Investments — Other Than Investments in Related PartiesSchedule II — Condensed Financial Information of Registrant (Parent Only)Schedule III — Supplementary Insurance InformationSchedule IV — Reinsurance
All other schedules for which provision is made in the applicable accounting regulation of the Securitiesand Exchange Commission are not required under the related instructions or are inapplicable andtherefore have been omitted.
3. Exhibits — Please refer to the Exhibit Index on page 204.
191

Signatures
Pursuant to the requirements of Section 13 or 15(d) of the Securities Exchange Act of 1934, the registrant has dulycaused this report to be signed on its behalf by the undersigned, thereunto duly authorized.
PRINCIPAL FINANCIAL GROUP, INC.
Dated: February 16, 2011 By /s/ TERRANCE J. LILLIS
Terrance J. LillisSenior Vice President and Chief Financial Officer
Pursuant to the requirements of the Securities Exchange Act of 1934, this report has been signed below by thefollowing persons on behalf of the registrant and in the capacities and on the date indicated.
Dated: February 16, 2011
By /s/ LARRY D. ZIMPLEMAN By
Larry D. Zimpleman C. Daniel Gelatt, Jr.Chairman, President, Chief Executive Officer and DirectorDirector
By /s/ TERRANCE J. LILLIS By /s/ SANDRA L. HELTON
Terrance J. Lillis Sandra L. HeltonSenior Vice President and Chief Financial Officer Director(Principal Financial Officer andChief Accounting Officer)
By /s/ BETSY J. BERNARD By /s/ RICHARD L. KEYSER
Betsy J. Bernard Richard L. KeyserDirector Director
By /s/ JOCELYN CARTER-MILLER By /s/ ARJUN K. MATHRANI
Jocelyn Carter-Miller Arjun K. MathraniDirector Director
By /s/ GARY E. COSTLEY By /s/ ELIZABETH E. TALLETT
Gary E. Costley Elizabeth E. TallettDirector Director
By /s/ MICHAEL T. DAN
Michael T. DanDirector
By
Dennis H. FerroDirector
192

Report of Independent Registered Public Accounting Firm on Schedules
The Board of Directors and StockholdersPrincipal Financial Group, Inc.
We have audited the consolidated financial statements of Principal Financial Group, Inc. (‘‘the Company’’) as ofDecember 31, 2010 and 2009, and for each of the three years in the period ended December 31, 2010, and have issuedour report thereon dated February 16, 2011 (included elsewhere in this Form 10-K). Our audits also included thefinancial statement schedules listed in the Index at Item 15.a.2. of this Form 10-K. These schedules are the responsibilityof the Company’s management. Our responsibility is to express an opinion based on our audits.
In our opinion, the financial statement schedules referred to above, when considered in relation to the basic financialstatements taken as a whole, present fairly in all material respects the information set forth therein. As discussed inNote 1 to the consolidated financial statements, in response to new accounting standards, the Company changed itsmethods of accounting for credit derivatives embedded in beneficial interests in securitized financial assets effectiveJuly 1, 2010; for variable interest entities effective January 1, 2010; for other-than-temporary impairments on debtsecurities and for the treatment of noncontrolling interests effective January 1, 2009; and for its pension and otherpostretirement benefits effective January 1, 2008.
/s/ ERNST & YOUNG LLP
Des Moines, IowaFebruary 16, 2011
193
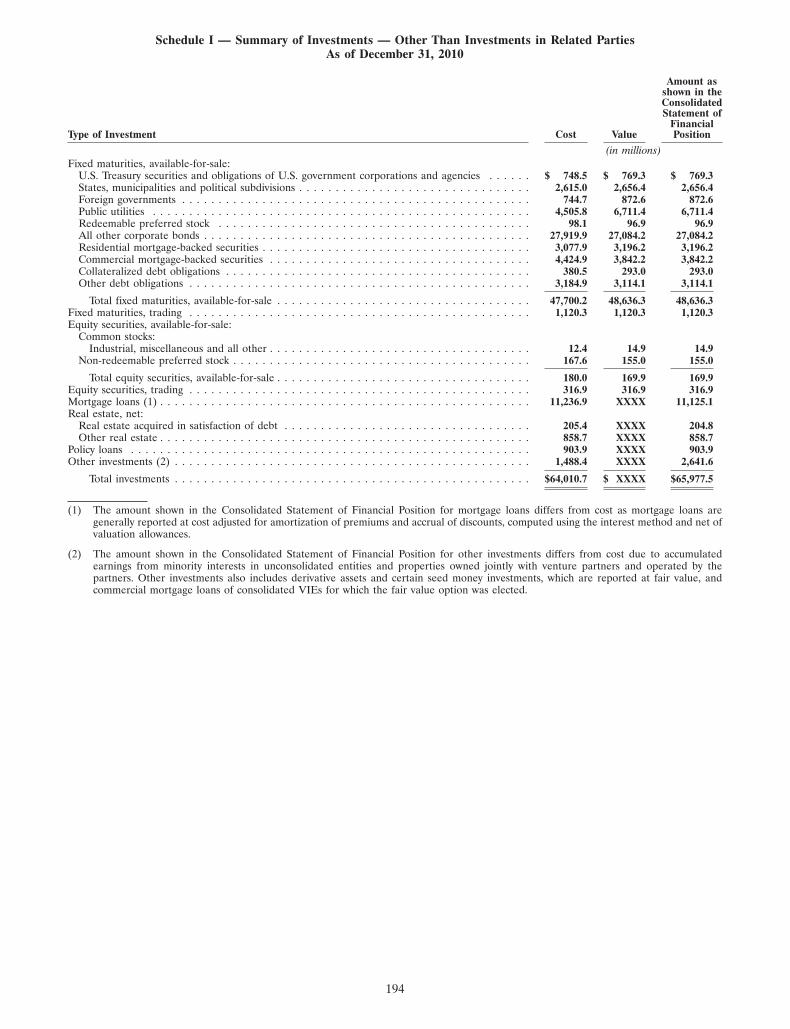
Schedule I — Summary of Investments — Other Than Investments in Related PartiesAs of December 31, 2010
Amount asshown in theConsolidatedStatement of
FinancialType of Investment Cost Value Position
(in millions)Fixed maturities, available-for-sale:
U.S. Treasury securities and obligations of U.S. government corporations and agencies . . . . . . $ 748.5 $ 769.3 $ 769.3States, municipalities and political subdivisions . . . . . . . . . . . . . . . . . . . . . . . . . . . . . . . . 2,615.0 2,656.4 2,656.4Foreign governments . . . . . . . . . . . . . . . . . . . . . . . . . . . . . . . . . . . . . . . . . . . . . . . . 744.7 872.6 872.6Public utilities . . . . . . . . . . . . . . . . . . . . . . . . . . . . . . . . . . . . . . . . . . . . . . . . . . . . 4,505.8 6,711.4 6,711.4Redeemable preferred stock . . . . . . . . . . . . . . . . . . . . . . . . . . . . . . . . . . . . . . . . . . . 98.1 96.9 96.9All other corporate bonds . . . . . . . . . . . . . . . . . . . . . . . . . . . . . . . . . . . . . . . . . . . . . 27,919.9 27,084.2 27,084.2Residential mortgage-backed securities . . . . . . . . . . . . . . . . . . . . . . . . . . . . . . . . . . . . . 3,077.9 3,196.2 3,196.2Commercial mortgage-backed securities . . . . . . . . . . . . . . . . . . . . . . . . . . . . . . . . . . . . 4,424.9 3,842.2 3,842.2Collateralized debt obligations . . . . . . . . . . . . . . . . . . . . . . . . . . . . . . . . . . . . . . . . . . 380.5 293.0 293.0Other debt obligations . . . . . . . . . . . . . . . . . . . . . . . . . . . . . . . . . . . . . . . . . . . . . . . 3,184.9 3,114.1 3,114.1
Total fixed maturities, available-for-sale . . . . . . . . . . . . . . . . . . . . . . . . . . . . . . . . . . . 47,700.2 48,636.3 48,636.3Fixed maturities, trading . . . . . . . . . . . . . . . . . . . . . . . . . . . . . . . . . . . . . . . . . . . . . . . 1,120.3 1,120.3 1,120.3Equity securities, available-for-sale:
Common stocks:Industrial, miscellaneous and all other . . . . . . . . . . . . . . . . . . . . . . . . . . . . . . . . . . . . 12.4 14.9 14.9
Non-redeemable preferred stock . . . . . . . . . . . . . . . . . . . . . . . . . . . . . . . . . . . . . . . . . 167.6 155.0 155.0
Total equity securities, available-for-sale . . . . . . . . . . . . . . . . . . . . . . . . . . . . . . . . . . . 180.0 169.9 169.9Equity securities, trading . . . . . . . . . . . . . . . . . . . . . . . . . . . . . . . . . . . . . . . . . . . . . . . 316.9 316.9 316.9Mortgage loans (1) . . . . . . . . . . . . . . . . . . . . . . . . . . . . . . . . . . . . . . . . . . . . . . . . . . . 11,236.9 XXXX 11,125.1Real estate, net:
Real estate acquired in satisfaction of debt . . . . . . . . . . . . . . . . . . . . . . . . . . . . . . . . . . 205.4 XXXX 204.8Other real estate . . . . . . . . . . . . . . . . . . . . . . . . . . . . . . . . . . . . . . . . . . . . . . . . . . . 858.7 XXXX 858.7
Policy loans . . . . . . . . . . . . . . . . . . . . . . . . . . . . . . . . . . . . . . . . . . . . . . . . . . . . . . . 903.9 XXXX 903.9Other investments (2) . . . . . . . . . . . . . . . . . . . . . . . . . . . . . . . . . . . . . . . . . . . . . . . . . 1,488.4 XXXX 2,641.6
Total investments . . . . . . . . . . . . . . . . . . . . . . . . . . . . . . . . . . . . . . . . . . . . . . . . . $64,010.7 $ XXXX $65,977.5
(1) The amount shown in the Consolidated Statement of Financial Position for mortgage loans differs from cost as mortgage loans aregenerally reported at cost adjusted for amortization of premiums and accrual of discounts, computed using the interest method and net ofvaluation allowances.
(2) The amount shown in the Consolidated Statement of Financial Position for other investments differs from cost due to accumulatedearnings from minority interests in unconsolidated entities and properties owned jointly with venture partners and operated by thepartners. Other investments also includes derivative assets and certain seed money investments, which are reported at fair value, andcommercial mortgage loans of consolidated VIEs for which the fair value option was elected.
194

Schedule II — Condensed Financial Information of Registrant (Parent Only)
Statements of Financial Position
December 31,
2010 2009
(in millions)AssetsFixed maturities, available-for-sale . . . . . . . . . . . . . . . . . . . . . . . . . . . . . . . . . . . . . . . . . . . . . . . . . . . . $ 199.9 $ 124.5Fixed maturities, trading . . . . . . . . . . . . . . . . . . . . . . . . . . . . . . . . . . . . . . . . . . . . . . . . . . . . . . . . . . 274.9 348.1Cash and cash equivalents . . . . . . . . . . . . . . . . . . . . . . . . . . . . . . . . . . . . . . . . . . . . . . . . . . . . . . . . . 370.9 304.6Other investments . . . . . . . . . . . . . . . . . . . . . . . . . . . . . . . . . . . . . . . . . . . . . . . . . . . . . . . . . . . . . . 5.6 5.3Income taxes receivable . . . . . . . . . . . . . . . . . . . . . . . . . . . . . . . . . . . . . . . . . . . . . . . . . . . . . . . . . . 18.8 14.7Deferred income taxes . . . . . . . . . . . . . . . . . . . . . . . . . . . . . . . . . . . . . . . . . . . . . . . . . . . . . . . . . . . 21.6 27.0Amounts receivable from subsidiary . . . . . . . . . . . . . . . . . . . . . . . . . . . . . . . . . . . . . . . . . . . . . . . . . . . 0.8 0.8Other assets . . . . . . . . . . . . . . . . . . . . . . . . . . . . . . . . . . . . . . . . . . . . . . . . . . . . . . . . . . . . . . . . . . 13.6 16.2Investment in subsidiary . . . . . . . . . . . . . . . . . . . . . . . . . . . . . . . . . . . . . . . . . . . . . . . . . . . . . . . . . . 10,195.1 8,423.1
Total assets . . . . . . . . . . . . . . . . . . . . . . . . . . . . . . . . . . . . . . . . . . . . . . . . . . . . . . . . . . . . . . . . . $11,101.2 $ 9,264.3
LiabilitiesAmounts payable to subsidiary . . . . . . . . . . . . . . . . . . . . . . . . . . . . . . . . . . . . . . . . . . . . . . . . . . . . . . $ 5.5 $ 2.8Long-term debt . . . . . . . . . . . . . . . . . . . . . . . . . . . . . . . . . . . . . . . . . . . . . . . . . . . . . . . . . . . . . . . 1,351.7 1,351.8Accrued interest payable . . . . . . . . . . . . . . . . . . . . . . . . . . . . . . . . . . . . . . . . . . . . . . . . . . . . . . . . . . 16.1 16.1Other liabilities . . . . . . . . . . . . . . . . . . . . . . . . . . . . . . . . . . . . . . . . . . . . . . . . . . . . . . . . . . . . . . . . 0.1 0.1
Total liabilities . . . . . . . . . . . . . . . . . . . . . . . . . . . . . . . . . . . . . . . . . . . . . . . . . . . . . . . . . . . . . . . 1,373.4 1,370.8Stockholders’ equitySeries A preferred stock, par value $.01 per share with liquidation preference of $100 per share — 3.0 million
shares authorized, issued and outstanding in 2010 and 2009 . . . . . . . . . . . . . . . . . . . . . . . . . . . . . . . . . . — —Series B preferred stock, par value $.01 per share with liquidation preference of $25 per share — 10.0 million
shares authorized, issued and outstanding in 2010 and 2009 . . . . . . . . . . . . . . . . . . . . . . . . . . . . . . . . . . 0.1 0.1Common stock, par value $.01 per share — 2,500.0 million shares authorized, 448.5 million and 447.0 million
shares issued, and 320.4 million and 319.0 million shares outstanding in 2010 and 2009 . . . . . . . . . . . . . . . . . 4.5 4.5Additional paid-in capital . . . . . . . . . . . . . . . . . . . . . . . . . . . . . . . . . . . . . . . . . . . . . . . . . . . . . . . . . 9,563.8 9,492.9Retained earnings . . . . . . . . . . . . . . . . . . . . . . . . . . . . . . . . . . . . . . . . . . . . . . . . . . . . . . . . . . . . . . 4,612.3 4,160.7Accumulated other comprehensive income (loss) . . . . . . . . . . . . . . . . . . . . . . . . . . . . . . . . . . . . . . . . . . . 272.4 (1,042.0)Treasury stock, at cost (128.1 million and 128.0 million shares in 2010 and 2009, respectively) . . . . . . . . . . . . . . (4,725.3) (4,722.7)
Total stockholders’ equity attributable to Principal Financial Group, Inc. . . . . . . . . . . . . . . . . . . . . . . . . . . 9,727.8 7,893.5
Total liabilities and stockholders’ equity . . . . . . . . . . . . . . . . . . . . . . . . . . . . . . . . . . . . . . . . . . . . . $11,101.2 $ 9,264.3
See accompanying notes.
195

Statements of Operations
For the year endedDecember 31,
2010 2009 2008
(in millions)RevenuesFees and other revenues . . . . . . . . . . . . . . . . . . . . . . . . . . . . . . . . . . . . . . . . . . . . . . . . . . . . . . . $ 0.1 $ — $ —Net investment income (loss) . . . . . . . . . . . . . . . . . . . . . . . . . . . . . . . . . . . . . . . . . . . . . . . . . . . . 33.2 3.6 (0.3)Net realized capital gains (losses) . . . . . . . . . . . . . . . . . . . . . . . . . . . . . . . . . . . . . . . . . . . . . . . . . 0.7 0.1 (1.8)
Total revenues . . . . . . . . . . . . . . . . . . . . . . . . . . . . . . . . . . . . . . . . . . . . . . . . . . . . . . . . . . . . 34.0 3.7 (2.1)ExpensesOther operating costs and expenses . . . . . . . . . . . . . . . . . . . . . . . . . . . . . . . . . . . . . . . . . . . . . . . . 117.0 90.8 48.0
Total expenses . . . . . . . . . . . . . . . . . . . . . . . . . . . . . . . . . . . . . . . . . . . . . . . . . . . . . . . . . . . . 117.0 90.8 48.0
Losses before income taxes . . . . . . . . . . . . . . . . . . . . . . . . . . . . . . . . . . . . . . . . . . . . . . . . . . . . . (83.0) (87.1) (50.1)Income tax benefits . . . . . . . . . . . . . . . . . . . . . . . . . . . . . . . . . . . . . . . . . . . . . . . . . . . . . . . . . . (31.6) (34.7) (20.0)Equity in the net income of subsidiaries . . . . . . . . . . . . . . . . . . . . . . . . . . . . . . . . . . . . . . . . . . . . . 750.7 675.1 488.2
Net income attributable to Principal Financial Group, Inc. . . . . . . . . . . . . . . . . . . . . . . . . . . . . . . . . . 699.3 622.7 458.1Preferred stock dividends . . . . . . . . . . . . . . . . . . . . . . . . . . . . . . . . . . . . . . . . . . . . . . . . . . . . . . . 33.0 33.0 33.0
Net income available to common stockholders . . . . . . . . . . . . . . . . . . . . . . . . . . . . . . . . . . . . . . . . . $666.3 $589.7 $425.1
See accompanying notes.
196
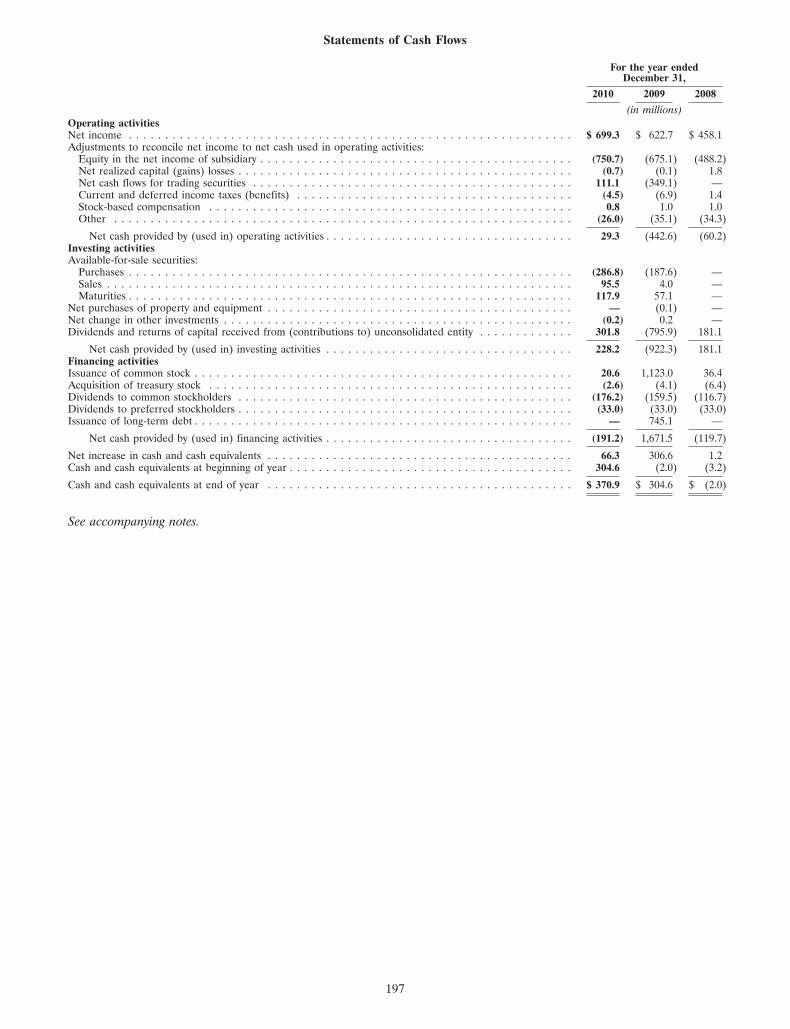
Statements of Cash Flows
For the year endedDecember 31,
2010 2009 2008
(in millions)Operating activitiesNet income . . . . . . . . . . . . . . . . . . . . . . . . . . . . . . . . . . . . . . . . . . . . . . . . . . . . . . . . . . . . . $ 699.3 $ 622.7 $ 458.1Adjustments to reconcile net income to net cash used in operating activities:
Equity in the net income of subsidiary . . . . . . . . . . . . . . . . . . . . . . . . . . . . . . . . . . . . . . . . . . . (750.7) (675.1) (488.2)Net realized capital (gains) losses . . . . . . . . . . . . . . . . . . . . . . . . . . . . . . . . . . . . . . . . . . . . . . (0.7) (0.1) 1.8Net cash flows for trading securities . . . . . . . . . . . . . . . . . . . . . . . . . . . . . . . . . . . . . . . . . . . . 111.1 (349.1) —Current and deferred income taxes (benefits) . . . . . . . . . . . . . . . . . . . . . . . . . . . . . . . . . . . . . . (4.5) (6.9) 1.4Stock-based compensation . . . . . . . . . . . . . . . . . . . . . . . . . . . . . . . . . . . . . . . . . . . . . . . . . . 0.8 1.0 1.0Other . . . . . . . . . . . . . . . . . . . . . . . . . . . . . . . . . . . . . . . . . . . . . . . . . . . . . . . . . . . . . . . (26.0) (35.1) (34.3)
Net cash provided by (used in) operating activities . . . . . . . . . . . . . . . . . . . . . . . . . . . . . . . . . . 29.3 (442.6) (60.2)Investing activitiesAvailable-for-sale securities:
Purchases . . . . . . . . . . . . . . . . . . . . . . . . . . . . . . . . . . . . . . . . . . . . . . . . . . . . . . . . . . . . . (286.8) (187.6) —Sales . . . . . . . . . . . . . . . . . . . . . . . . . . . . . . . . . . . . . . . . . . . . . . . . . . . . . . . . . . . . . . . . 95.5 4.0 —Maturities . . . . . . . . . . . . . . . . . . . . . . . . . . . . . . . . . . . . . . . . . . . . . . . . . . . . . . . . . . . . . 117.9 57.1 —
Net purchases of property and equipment . . . . . . . . . . . . . . . . . . . . . . . . . . . . . . . . . . . . . . . . . . — (0.1) —Net change in other investments . . . . . . . . . . . . . . . . . . . . . . . . . . . . . . . . . . . . . . . . . . . . . . . . (0.2) 0.2 —Dividends and returns of capital received from (contributions to) unconsolidated entity . . . . . . . . . . . . . 301.8 (795.9) 181.1
Net cash provided by (used in) investing activities . . . . . . . . . . . . . . . . . . . . . . . . . . . . . . . . . . 228.2 (922.3) 181.1Financing activitiesIssuance of common stock . . . . . . . . . . . . . . . . . . . . . . . . . . . . . . . . . . . . . . . . . . . . . . . . . . . . 20.6 1,123.0 36.4Acquisition of treasury stock . . . . . . . . . . . . . . . . . . . . . . . . . . . . . . . . . . . . . . . . . . . . . . . . . . (2.6) (4.1) (6.4)Dividends to common stockholders . . . . . . . . . . . . . . . . . . . . . . . . . . . . . . . . . . . . . . . . . . . . . . (176.2) (159.5) (116.7)Dividends to preferred stockholders . . . . . . . . . . . . . . . . . . . . . . . . . . . . . . . . . . . . . . . . . . . . . . (33.0) (33.0) (33.0)Issuance of long-term debt . . . . . . . . . . . . . . . . . . . . . . . . . . . . . . . . . . . . . . . . . . . . . . . . . . . . — 745.1 —
Net cash provided by (used in) financing activities . . . . . . . . . . . . . . . . . . . . . . . . . . . . . . . . . . (191.2) 1,671.5 (119.7)
Net increase in cash and cash equivalents . . . . . . . . . . . . . . . . . . . . . . . . . . . . . . . . . . . . . . . . . . 66.3 306.6 1.2Cash and cash equivalents at beginning of year . . . . . . . . . . . . . . . . . . . . . . . . . . . . . . . . . . . . . . . 304.6 (2.0) (3.2)
Cash and cash equivalents at end of year . . . . . . . . . . . . . . . . . . . . . . . . . . . . . . . . . . . . . . . . . . $ 370.9 $ 304.6 $ (2.0)
See accompanying notes.
197

Notes to Condensed Financial Statements
(1) Basis of Presentation
The accompanying condensed financial statements should be read in conjunction with the consolidated financialstatements and notes thereto of Principal Financial Group, Inc.
In the parent company only financial statements, our investments in subsidiaries are stated at cost plus equity inundistributed earnings of subsidiaries.
(2) Cash Dividends and Returns of Capital Received from (Capital Contributed to) Unconsolidated Entity
The parent company received cash dividends and returns of capital totaling $301.8 million and $181.1 million 2010and 2008, respectively, from its unconsolidated entity and contributed capital of $795.9 million to its unconsolidatedentity in 2009.
198

Schedule III — Supplementary Insurance InformationAs of December 31, 2010 and 2009 and for each of the years ended December 31, 2010, 2009 and 2008
ContractholderDeferred policy Future policy and other
acquisition benefits and policyholderSegment costs claims funds
(in millions)2010:Retirement and Investor Services . . . . . . . . . . . . . . . . . . . . . . . . . . . . . . . . . . $1,321.1 $ 8,299.5 $33,448.4Principal Global Investors . . . . . . . . . . . . . . . . . . . . . . . . . . . . . . . . . . . . . . — — —Principal International . . . . . . . . . . . . . . . . . . . . . . . . . . . . . . . . . . . . . . . . . 271.0 3,969.3 68.8U.S. Insurance Solutions . . . . . . . . . . . . . . . . . . . . . . . . . . . . . . . . . . . . . . . 1,937.7 7,586.4 4,599.8Corporate . . . . . . . . . . . . . . . . . . . . . . . . . . . . . . . . . . . . . . . . . . . . . . . . . — 191.1 (223.7)
Total . . . . . . . . . . . . . . . . . . . . . . . . . . . . . . . . . . . . . . . . . . . . . . . . . . $3,529.8 $20,046.3 $37,893.3
2009:Retirement and Investor Services . . . . . . . . . . . . . . . . . . . . . . . . . . . . . . . . . . $1,552.2 $ 8,274.1 $36,398.9Principal Global Investors . . . . . . . . . . . . . . . . . . . . . . . . . . . . . . . . . . . . . . — — —Principal International . . . . . . . . . . . . . . . . . . . . . . . . . . . . . . . . . . . . . . . . . 226.5 3,303.9 53.2U.S. Insurance Solutions . . . . . . . . . . . . . . . . . . . . . . . . . . . . . . . . . . . . . . . 1,902.7 7,475.9 4,126.6Corporate . . . . . . . . . . . . . . . . . . . . . . . . . . . . . . . . . . . . . . . . . . . . . . . . . — 194.4 (217.6)
Total . . . . . . . . . . . . . . . . . . . . . . . . . . . . . . . . . . . . . . . . . . . . . . . . . . $3,681.4 $19,248.3 $40,361.1
199
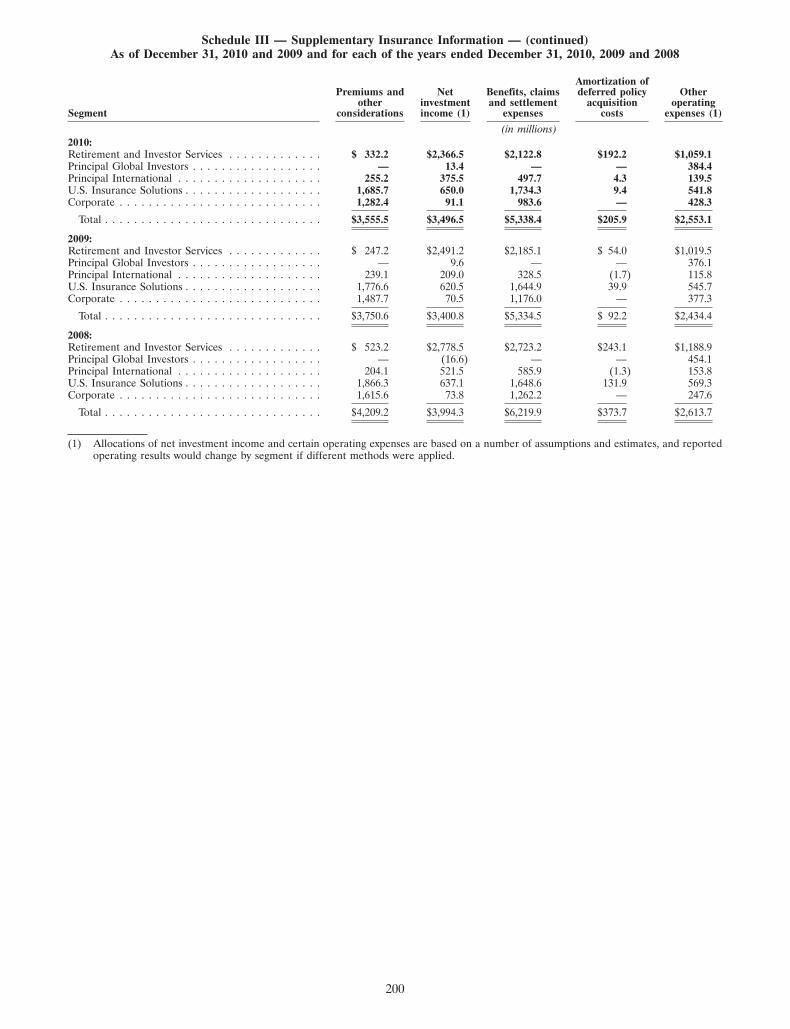
Schedule III — Supplementary Insurance Information — (continued)As of December 31, 2010 and 2009 and for each of the years ended December 31, 2010, 2009 and 2008
Amortization ofPremiums and Net Benefits, claims deferred policy Other
other investment and settlement acquisition operatingSegment considerations income (1) expenses costs expenses (1)
(in millions)2010:Retirement and Investor Services . . . . . . . . . . . . . $ 332.2 $2,366.5 $2,122.8 $192.2 $1,059.1Principal Global Investors . . . . . . . . . . . . . . . . . . — 13.4 — — 384.4Principal International . . . . . . . . . . . . . . . . . . . . 255.2 375.5 497.7 4.3 139.5U.S. Insurance Solutions . . . . . . . . . . . . . . . . . . . 1,685.7 650.0 1,734.3 9.4 541.8Corporate . . . . . . . . . . . . . . . . . . . . . . . . . . . . 1,282.4 91.1 983.6 — 428.3
Total . . . . . . . . . . . . . . . . . . . . . . . . . . . . . . $3,555.5 $3,496.5 $5,338.4 $205.9 $2,553.1
2009:Retirement and Investor Services . . . . . . . . . . . . . $ 247.2 $2,491.2 $2,185.1 $ 54.0 $1,019.5Principal Global Investors . . . . . . . . . . . . . . . . . . — 9.6 — — 376.1Principal International . . . . . . . . . . . . . . . . . . . . 239.1 209.0 328.5 (1.7) 115.8U.S. Insurance Solutions . . . . . . . . . . . . . . . . . . . 1,776.6 620.5 1,644.9 39.9 545.7Corporate . . . . . . . . . . . . . . . . . . . . . . . . . . . . 1,487.7 70.5 1,176.0 — 377.3
Total . . . . . . . . . . . . . . . . . . . . . . . . . . . . . . $3,750.6 $3,400.8 $5,334.5 $ 92.2 $2,434.4
2008:Retirement and Investor Services . . . . . . . . . . . . . $ 523.2 $2,778.5 $2,723.2 $243.1 $1,188.9Principal Global Investors . . . . . . . . . . . . . . . . . . — (16.6) — — 454.1Principal International . . . . . . . . . . . . . . . . . . . . 204.1 521.5 585.9 (1.3) 153.8U.S. Insurance Solutions . . . . . . . . . . . . . . . . . . . 1,866.3 637.1 1,648.6 131.9 569.3Corporate . . . . . . . . . . . . . . . . . . . . . . . . . . . . 1,615.6 73.8 1,262.2 — 247.6
Total . . . . . . . . . . . . . . . . . . . . . . . . . . . . . . $4,209.2 $3,994.3 $6,219.9 $373.7 $2,613.7
(1) Allocations of net investment income and certain operating expenses are based on a number of assumptions and estimates, and reportedoperating results would change by segment if different methods were applied.
200

Schedule IV — ReinsuranceAs of December 31, 2010, 2009 and 2008 and for each of the years then ended
PercentageCeded to Assumed of amount
Gross other from other assumedamount companies companies Net amount to net
(in millions)2010:Life insurance in force . . . . . . . . . . . . . . . . . . . . . . . . . . . . . . $241,996.5 $84,403.8 $2,051.9 $159,644.6 1.3%
Premiums:Life insurance . . . . . . . . . . . . . . . . . . . . . . . . . . . . . . . . . . $ 1,437.9 $ 146.2 $ 3.5 $ 1,295.2 0.3%Accident and health insurance . . . . . . . . . . . . . . . . . . . . . . . 2,421.9 161.6 — 2,260.3 —%
Total . . . . . . . . . . . . . . . . . . . . . . . . . . . . . . . . . . . . . . $ 3,859.8 $ 307.8 $ 3.5 $ 3,555.5 0.1%
2009:Life insurance in force . . . . . . . . . . . . . . . . . . . . . . . . . . . . . . $237,454.2 $76,507.1 $2,328.2 $163,275.3 1.4%
Premiums:Life insurance . . . . . . . . . . . . . . . . . . . . . . . . . . . . . . . . . . $ 1,389.6 $ 140.5 $ 5.2 $ 1,254.3 0.4%Accident and health insurance . . . . . . . . . . . . . . . . . . . . . . . 2,658.0 161.7 — 2,496.3 —%
Total . . . . . . . . . . . . . . . . . . . . . . . . . . . . . . . . . . . . . . $ 4,047.6 $ 302.2 $ 5.2 $ 3,750.6 0.1%
2008:Life insurance in force . . . . . . . . . . . . . . . . . . . . . . . . . . . . . . $243,735.9 $71,284.2 $2,593.2 $175,044.9 1.5%
Premiums:Life insurance . . . . . . . . . . . . . . . . . . . . . . . . . . . . . . . . . . $ 1,675.5 $ 121.6 $ 9.7 $ 1,563.6 0.6%Accident and health insurance . . . . . . . . . . . . . . . . . . . . . . . 2,819.6 174.0 — 2,645.6 —%
Total . . . . . . . . . . . . . . . . . . . . . . . . . . . . . . . . . . . . . . $ 4,495.1 $ 295.6 $ 9.7 $ 4,209.2 0.2%
201

Exhibit Index
ExhibitNumber Description
2.1 Plan of Conversion (1)2.2 Share Sale Deed, dated as of June 17, 1999, among BT Investments (Australia) LLC, BT Foreign Investment Corporation,
BT New Zealand Limited, BT International (Delaware), Inc., BT Nominees (H.K.) Limited, Deutsche Bank AG, Bankers TrustCorporation, Principal Financial Group (Australia) Pty Limited and Principal Financial Services, Inc. (1)
2.3 Deed to Amend the Share Sale Deed, dated as of August 31, 1999, among BT Investments (Australia) LLC, BT ForeignInvestment Corporation, BT New Zealand Limited, BT International (Delaware), Inc., BT Nominees (H.K.) Limited, DeutscheBank AG, Bankers Trust Corporation, Principal Financial Group (Australia) Pty Limited and Principal FinancialServices, Inc. (1)
2.4 Second Amendment to the Share Sale Deed, dated as of March 14, 2001, among BT Investments (Australia) LLC, BT ForeignInvestment Corporation, Deutsche New Zealand Limited (formerly called BT New Zealand Limited), BT International(Delaware), Inc., DB Nominees (H.K.) Limited (formerly called BT Nominees (H.K.) Limited), Deutsche Bank AG, BankersTrust Corporation, Principal Financial Group (Australia) Pty Limited and Principal Financial Services, Inc. (1)
2.5 Stock Purchase Agreement dated as of May 11, 2004 by and between Principal Holding Company and CitiMortgage, Inc. (2)2.6 Stock Purchase Agreement among Washington Mutual, Inc., New American Capital, Inc., Principal Financial Group, Inc., and
Principal Management Corporation for the purchase and sale of the outstanding capital stock of WM Advisors, Inc., dated as ofJuly 25, 2006. (3)
2.6.1 Amendment No. 1 and Waiver, dated as of December 29, 2006, to the Stock Purchase Agreement, dated as of July 25, 2006, byand among Washington Mutual, Inc., New American Capital, Inc., Principal Financial Group, Inc., and Principal ManagementCorporation for the purchase and sale of the outstanding capital stock of WM Advisors, Inc. (4)
2.6.2 Memorandum of Understanding dated as of December 29, 2006, amending and modifying the Stock Purchase Agreement byand among Washington Mutual, Inc., New American Capital, Inc., Principal Financial Group, Inc., and Principal ManagementCorporation for the purchase and sale of the outstanding capital stock of WM Advisors, Inc. (4)
3.1 Form of Amended and Restated Certificate of Incorporation of Principal Financial Group, Inc. (included in Exhibit 2.1) (5)3.2 Form of By-Laws of Principal Financial Group, Inc. (5)4.1 Form of Certificate for the Common Stock of Principal Financial Group, Inc., par value $0.01 per share (1)4.1.1 Certificate of Designations of the Company’s Series A Non-Cumulative Perpetual Preferred Stock, dated June 16, 2005. (5)4.1.2 Certificate of Designations of the Company’s Series B Non-Cumulative Perpetual Preferred Stock, dated June 16, 2005. (5)4.1.3 Specimen Stock Certificate for the Company’s Series A Non-Cumulative Perpetual Preferred Stock. (5)4.1.4 Specimen Stock Certificate for the Company’s Series B Non-Cumulative Perpetual Preferred Stock. (5)4.1.5 Senior Indenture, dated as of October 11, 2006, between Principal Financial Group, Inc. and The Bank of New York, as
Trustee. (6)4.1.6 First Supplemental Indenture, dated as of October 16, 2006, among Principal Financial Group, Inc., Principal Financial
Services, Inc. and The Bank of New York, as Trustee. (6)4.1.7 6.05% Senior Note ($500,000,000) due October 15, 2036. (6)4.1.8 6.05% Senior Note ($100,000,000) due October 15, 2036. (7)4.1.9 Guarantee, dated as of October 16, 2006, by Principal Financial Services, Inc. (6)4.2 Amended and Restated Stockholder Rights Agreement, dated as of October 22, 2001 (8)4.2.1 Amendment to the Amended and Restated Rights Agreement, dated as of January 17, 2005 (9)
10.1 Principal Financial Group, Inc. Stock Incentive Plan (10)10.1.1 Form of Restricted Stock Unit Award Agreement (11)10.1.2 Form of Stock Option Award Agreement (11)10.1.3 Principal Financial Group, Inc. 2005 Stock Incentive Plan (12)10.1.4 Principal Financial Group, Inc. 2010 Stock Incentive Plan (13)10.2 Principal Financial Group Long-Term Performance Plan (1)10.3 Resolution of Human Resources Committee of the Board of Directors of Principal Financial Group, Inc. amending the
Principal Financial Group Long-Term Performance Plan as of October 31, 2002 (8)10.4 Principal Financial Group Incentive Pay Plan (PrinPay), amended and restated effective January 1, 2002 (14)10.5 Principal Financial Group, Inc. Annual Incentive Plan (9)10.6 Revised Summary of Standard Compensatory Arrangement for Non-Employee Directors of the Principal Financial Group, Inc.
Board of Directors. (15)10.6.1 Revised Summary of Standard Compensatory Arrangement for Non-Employee Directors of the Principal Financial Group, Inc.
Board of Directors (16)10.6.2 Revised Summary of Standard Compensatory Arrangement for Non-Employee Directors, effective March 28, 2009 (17)10.6.3 Revised Summary of Standard Compensatory Arrangement for Non-Employee Directors of the Principal Financial Group, Inc.,
effective May 17, 2010 (25)10.7 Principal Financial Group, Inc. Directors Stock Plan (1)10.7.1 Principal Financial Group, Inc. 2005 Directors Stock Plan (12)10.8 Deferred Compensation Plan for Non-Employee Directors of Principal Financial Group, Inc. (18)10.9 Principal Select Savings Excess Plan, restated as of January 1, 2004 (19)10.9.1 Amendment No. 1 to Principal Select Savings Excess Plan (18)10.10 Supplemental Executive Retirement Plan for Employees, restated as of January 1, 2003 (19)10.10.1 Amendment No. 1 to the Principal Supplemental Executive Retirement Plan for Employees (18)10.11 Form of Principal Financial Group, Inc. and Principal Life Insurance Company Change-of-Control Employment Agreement
(Tier One Executives), dated as of February 28, 2006, by and among Principal Financial Group, Inc., Principal FinancialServices, Inc., Principal Life Insurance Company and an Executive. (20)
10.11.1 Form of Principal Financial Group, Inc. and Principal Life Insurance Company Change-of-Control Employment Agreement(Tier One Executives) (21)
10.11.2 Form of Principal Financial Group, Inc. and Principal Life Insurance Company Change of Control Employment Agreement(Tier One Executives), effective December 31, 2010 (25)
10.12 Form of Principal Financial Group, Inc. Indemnification Agreement (21)
202

ExhibitNumber Description
10.13 Compensatory Arrangement, dated as of March 14, 2002, between Principal Life Insurance Company and James P.McCaughan. (22)
10.14 Fiscal Agency Agreement, dated as of August 25, 1999, among Principal Financial Group (Australia) Holdings Pty Limited,Principal Financial Services, Inc. and U.S. Bank Trust National Association (1)
10.15 Employment Agreement dated as of June 1, 2006, by and between Principal Financial Group, Inc., Principal FinancialServices, Inc., Principal Life Insurance Company, and Larry D. Zimpleman. (4)
10.15.1 Amended and Restated Employment Agreement dated as of May 1, 2008, by and between Principal Financial Group, Inc.,Principal Financial Services, Inc., Principal Life Insurance Company and Larry D. Zimpleman (23)
10.15.2 Letter dated March 16, 2009 amending the Amended and Restated Employment Agreement dated as of May 1, 2008 by andbetween Principal Financial Group, Inc., Principal Financial Services, Inc., Principal Life Insurance Company and Larry D.Zimpleman (17)
10.15.3 Letter dated December 1, 2009 amending the Amended and Restated Employment Agreement dated as of May 1, 2008 by andbetween Principal Financial Group, Inc., Principal Financial Services, Inc., Principal Life Insurance Company and Larry D.Zimpleman (24)
10.16 The Principal Severance Plan for Senior Executives, restated effective January 1, 2009 (17)12 Computation of Earnings to Fixed Charges Ratio (25)21 Principal Financial Group, Inc. Member Companies as of December 31, 2010 (25)23 Consent of Independent Registered Public Accounting Firm (25)31.1 Certification of Larry D. Zimpleman (25)31.2 Certification of Terrance J. Lillis (25)32.1 Certification Pursuant to Section 1350 of Chapter 63 of Title 18 of the United States Code — Larry D. Zimpleman (25)32.2 Certification Pursuant to Section 1350 of Chapter 63 of Title 18 of the United States Code — Terrance J. Lillis (25)
101 The following materials from Principal Financial Group, Inc.’s Annual Report on Form 10-K for the year ended December 31,2010, formatted in XBRL (Extensible Business Reporting Language): (i) the Consolidated Statements of Financial Position,(ii) the Consolidated Statements of Operations, (iii) the Consolidated Statements of Stockholders’ Equity, (iv) the ConsolidatedStatements of Cash Flows, (v) the Notes to Consolidated Financial Statements, (vi) Schedule I — Summary of Investments —Other Than Investments in Related Parties, (vii) Schedule II — Condensed Financial Information of Registrant (Parent Only),(viii) Schedule III — Supplementary Information and (ix) Schedule IV — Reinsurance.
(1) Incorporated by reference to exhibit filed with Principal Financial Group, Inc.’s Registration Statement on Form S-1, as amended(Commission File No. 333-62558).
(2) Incorporated by reference to exhibit filed with Principal Financial Group, Inc.’s Quarterly Report on Form 10-Q for the quarter endedJune 30, 2004 (Commission File No. 1-16725).
(3) Incorporated by reference to exhibit filed with Principal Financial Group, Inc.’s Quarterly Report on Form 10-Q for the quarter endedSeptember 30, 2006 (Commission File No. 1-16725).
(4) Incorporated by reference to exhibit filed with Principal Financial Group, Inc.’s Annual Report on Form 10-K for the year endedDecember 31, 2006 (Commission File No. 1-16725).
(5) Incorporated by reference to exhibit filed with Principal Financial Group, Inc.’s Current Report on Form 8-K filed on June 17, 2005(Commission File No. 1-16725).
(6) Incorporated by reference to exhibit filed with Principal Financial Group, Inc.’s Current Report on Form 8-K filed on October 16, 2006(Commission File No. 1-16725).
(7) Incorporated by reference to exhibit filed with Principal Financial Group, Inc.’s Current Report on Form 8-K filed on December 6, 2006(Commission File No. 1-16725).
(8) Incorporated by reference to the exhibit filed with Principal Financial Group, Inc.’s Annual Report on Form 10-K for the year endedDecember 31, 2002 (Commission File No. 1-16725).
(9) Incorporated by reference to exhibit filed with Principal Financial Group, Inc.’s Annual Report on Form 10-K for the year endedDecember 31, 2004 (Commission File No. 1-16725).
(10) Incorporated by reference to exhibit filed with Principal Financial Group, Inc.’s Quarterly Report on Form 10-Q for the quarter endedJune 30, 2003 (Commission File No. 1-16725).
(11) Incorporated by reference to exhibit filed with Principal Financial Group, Inc.’s Current Report on Form 8-K filed on March 7, 2005(Commission File No. 1-16725).
(12) Incorporated by reference to exhibit filed with Principal Financial Group, Inc.’s Quarterly Report on Form 10-Q for the quarter endedJune 30, 2005 (Commission File No. 1-16725).
(13) Incorporated by reference to Appendix A of Principal Financial Group, Inc.’s 2010 Definitive Proxy Statement on Form DEF14A, filed onApril 6, 2010 (Commission File No. 1-16725).
(14) Incorporated by reference to exhibit filed with Principal Financial Group, Inc.’s Quarterly Report on Form 10-Q for the quarter endedMarch 31, 2003 (Commission File No. 1-16725).
(15) Incorporated by reference to the written description of such arrangement included in Principal Financial Group, Inc.’s Current Report onForm 8-K filed on August 28, 2006 (Commission File 1-16725).
(16) Incorporated by reference to exhibit filed with Principal Financial Group, Inc.’s Quarterly Report on Form 10-Q for the quarter endedSeptember 30, 2008 (Commission File No. 1-16725).
(17) Incorporated by reference to the Principal Financial Group, Inc. Quarterly Report on Form 10-Q for the quarter ended March 31, 2009(Commission File No. 1-16725).
203

(18) Incorporated by reference to the exhibit filed with Principal Financial Group, Inc.’s Annual Report on Form 10-K for the year endedDecember 31, 2005 (Commission File 1-16725).
(19) Incorporated by reference to exhibit filed with Principal Financial Group, Inc.’s Quarterly Report on Form 10-Q for the quarter endedMarch 31, 2004 (Commission File No. 1-16725).
(20) Incorporated by reference to exhibit filed with Principal Financial Group, Inc.’s Quarterly Report on Form 10-Q for the quarter endedMarch 31, 2006 (Commission File No. 1-16725).
(21) Incorporated by reference to exhibit filed with Principal Financial Group, Inc.’s Current Report on Form 8-K filed on December 2, 2008(Commission File No. 1-16725).
(22) Incorporated by reference to exhibit filed with Principal Financial Group, Inc.’s Quarterly Report on Form 10-Q for the quarter endedMarch 31, 2002 (Commission File No. 1-16725).
(23) Incorporated by reference to exhibit filed with Principal Financial Group, Inc.’s Quarterly Report on Form 10-Q for the quarter endedJune 30, 2008 (Commission File No. 1-16725).
(24) Incorporated by reference to the exhibit filed with Principal Financial Group, Inc.’s Annual Report on Form 10-K for the year endedDecember 31, 2009 (Commission File No. 1-16725).
(25) Filed herewith.
Paper copies of exhibits will be provided to shareholders upon reasonable request and upon payment of reasonable copying and mailingexpenses.
204

23MAR201122551363
Performance Graph
The following graph sets forth a comparison of cumulative total return for Principal Financial Group, Inc.’s commonstock, the Standard & Poor’s 500 Index (‘‘S&P 500’’), and the Standard & Poor’s 500 Financials Index (‘‘S&P 500Financials’’), adjusted to assume the reinvestment of dividends for the past five calendar years. It assumes $100 investedin each of the Company’s common stock, the S&P 500 and the S&P 500 Financials.
$20
$40
$60
$80
$100
$120
$140
$160
$18012
/30/
05
12/3
1/06
12/3
1/07
12/3
1/08
12/3
1/10
12/3
1/09
PFG S&P 500 S&P 500 Fin
Yearly PFG S&P 500 S&P 500 Fin
12/31/2005 . . . . . . . . . . . . . . . . . . . . . . . . . . . . . . . . . . . . . . . . . . . . . . . . . . . 100.00 100.00 100.0012/31/2006 . . . . . . . . . . . . . . . . . . . . . . . . . . . . . . . . . . . . . . . . . . . . . . . . . . . 124.47 115.79 119.1912/31/2007 . . . . . . . . . . . . . . . . . . . . . . . . . . . . . . . . . . . . . . . . . . . . . . . . . . . 146.85 122.16 96.9912/31/2008 . . . . . . . . . . . . . . . . . . . . . . . . . . . . . . . . . . . . . . . . . . . . . . . . . . . 53.96 76.96 43.3412/31/2009 . . . . . . . . . . . . . . . . . . . . . . . . . . . . . . . . . . . . . . . . . . . . . . . . . . . 57.96 97.33 50.8012/31/2010 . . . . . . . . . . . . . . . . . . . . . . . . . . . . . . . . . . . . . . . . . . . . . . . . . . . 76.34 111.99 56.96
205

24MAR201117102083
Related Documents