Princeton University Report on Federal Awards in Accordance with OMB Circular A-133 and New Jersey Office of Management and Budget Circular 04-04 For the year ended June 30, 2015 Employer Identification Number 21-0634501

Welcome message from author
This document is posted to help you gain knowledge. Please leave a comment to let me know what you think about it! Share it to your friends and learn new things together.
Transcript

Princeton University Report on Federal Awards in Accordance with OMB Circular A-133 and New Jersey Office of Management and Budget Circular 04-04 For the year ended June 30, 2015 Employer Identification Number 21-0634501

Princeton University Report on Federal Awards in Accordance with OMB Circular A-133 and New Jersey Office of Management and Budget Circular 04-04 For the year ended June 30, 2015 Table of Contents
Page(s)
Independent Auditor’s Report ........................................................................................................................ 1
Consolidated Statements of Financial Position as of June 30, 2015 and 2014 ............................................. 2
Consolidated Statements of Activities for the year ended June 30, 2015 and June 30, 2014 ................... 3-4
Consolidated Statements of Cash Flows for the year ended June 30, 2015 and 2014 .................................. 5
Notes to the Consolidated Financial Statements .................................................................................... 6 – 25
Schedule of Expenditures of Federal Awards for the year ended June 30, 2015 ................................26 – 35
Supplemental Schedule of New Jersey State Awards for the year ended June 30, 2015 ............................ 36
Notes to Schedule of Expenditures of Federal and State Awards for the year ended June 30, 2015 .... 37-38
Independent Auditor’s Report on Internal Control on Financial Reporting and on Compliance and Other Matters Based on an Audit of Financial Statements
Performed in Accordance with Government Auditing Standards ..................................................... 39-40
Independent Auditor’s Report on Compliance with Requirements that Could Have a Direct and Material Effect on Each Major Program and on Internal Control Over Compliance in Accordance With OMB Circular A-133 and New Jersey Circular 04-04 ..................... 41-42
Summary of Independent Auditors' Results .......................................................................................... 43-44
Schedule of Findings and Questioned Costs ................................................................................................. 45
Status of Prior Year’s Findings ...................................................................................................................... 46

Independent Auditor’s Report
To the Trustees of Princeton University:
Report on the Consolidated Financial Statements
We have audited the accompanying consolidated financial statements of Princeton University (the “University”), which comprise the consolidated statements of financial position as of June 30, 2015 and 2014 and the related consolidated statements of activities and consolidated statements of cash flows for the years then ended, and the related notes to the financial statements.
Management’s Responsibility for the Consolidated Financial Statements
Management is responsible for the preparation and fair presentation of the consolidated financial statements in accordance with accounting principles generally accepted in the United States of America; this includes the design, implementation, and maintenance of internal control relevant to the preparation and fair presentation of consolidated financial statements that are free from material misstatement, whether due to fraud or error.
Auditor’s Responsibility
Our responsibility is to express an opinion on the consolidated financial statements based on our audit. We conducted our audit in accordance with auditing standards generally accepted in the United States of America and the standards applicable to financial audits contained in Government Auditing Standards, issued by the Comptroller General of the United States. Those standards require that we plan and perform the audit to obtainreasonable assurance about whether the consolidated financial statements are free from material misstatement.
An audit involves performing procedures to obtain audit evidence about the amounts and disclosures in the consolidated financial statements. The procedures selected depend on our judgment, including the assessment of the risks of material misstatement of the consolidated financial statements, whether due to fraud or error. In making those risk assessments, we consider internal control relevant to the entity's preparation and fair presentation of the consolidated financial statements in order to design audit procedures that are appropriate in the circumstances, but not for the purpose of expressing an opinion on the effectiveness of the entity's internal control. Accordingly, we express no such opinion. An audit also includes evaluating the appropriateness of accounting policies used and the reasonableness of significant accounting estimates made by management, as well as evaluating the overall presentation of the consolidated financial statements. We believe that the audit evidence we have obtained is sufficient and appropriate to provide a basis for our audit opinion.
Opinion
In our opinion, the consolidated financial statements referred to above present fairly, in all material respects, the consolidated financial position of Princeton University as of June 30, 2015 and 2014, and the related consolidated statements of activities and consolidated statements of cash flows for the years then ended in accordance with accounting principles generally accepted in the United States of America.
Other Matters
Other Information
Our audit was conducted for the purpose of forming an opinion on the consolidated financial statements as a whole. The accompanying Schedule of Expenditures of Federal Awards for the year ended June 30, 2015 and Schedule of Expenditures of State of New Jersey Awards for the year ended June 30, 2015 is presented for purposes of additional analysis as required by Office of Management and Budget Circular A-133, Audits of States, Local Governments, and Non-Profit Organizations and The State of New Jersey Department of the Treasury Circular Letter 04-04 OMB, Single Audit Policy for Recipients of Federal Grants, State Grants and State Aid, respectively, and are not a required part of the consolidated financial statements. Such information is the responsibility of management and was derived from and relates directly to the underlying accounting and other records used to prepare the consolidated financial statements. The information has been subjected to the auditing procedures applied in the audit of the consolidated financial statements and certain additional procedures, including comparing and reconciling such information directly to the underlying accounting and other records used to prepare the consolidated financial statements or to the consolidated financial statements themselves, and other additional procedures in accordance with auditing standards generally accepted in the United States of America. In our opinion, the Schedule of Expenditures of Federal Awards and the Schedule of Expenditures of State of New Jersey Awards are fairly stated, in all material respects, in relation to the consolidated financial statements as a whole.
Other Reporting Required by Government Auditing Standards
In accordance with Government Auditing Standards, we have also issued our report dated November 24, 2015 on our consideration of Princeton University’s internal control over financial reporting and on our tests of its compliance with certain provisions of laws, regulations, contracts and grant agreements and other matters for the year ended June 30, 2015. The purpose of that report is to describe the scope of our testing of internal control over financial reporting and compliance and the results of that testing and not to provide an opinion on internal control over financial reporting and on compliance. That report is an integral part of an audit performed in accordance with Government Auditing Standards in considering Princeton University's internal control over financial reporting and compliance.
New York, New York November 24, 2015
PricewaterhouseCoopers LLP, PricewaterhouseCoopers Center, 300 Madison Avenue, New York, NY 10017T: (646) 471 3000, F: (813) 286 6000, www.pwc.com/us

2
(dollars in thousands) 2015 2014
AssetsCash $ 11,544 $ 4,788Accounts receivable 98,816 84,014Receivables associated with investments 126,671 -Educational and mortgage loans receivable 378,230 366,435Contributions receivable 186,430 209,861Inventories and deferred charges 23,482 29,320Managed investments at market value 22,472,966 20,769,281Funds held in trust by others 154,163 161,027Other investments 685,436 670,156Property, net of accumulated depreciation 3,753,676 3,501,543
Total assets $ 27,891,414 $ 25,796,425
LiabilitiesAccounts payable $ 116,608 $ 99,564Liabilities associated with investments 308,367 192,920Deposits, advance receipts, and accrued liabilities 125,025 105,132Deposits held in custody for others 158,716 142,324Deferred revenues 39,520 39,900Liability under planned giving agreements 101,657 102,719Federal loan programs 8,454 6,671Indebtedness to third parties 3,314,444 3,231,753Accrued postretirement benefi ts 382,648 367,254
Total liabilities $ 4,555,439 $ 4,288,237
Net assetsUnrestricted $ 9,928,976 $ 8,354,141Temporarily restricted 11,535,371 11,334,911 Permanently restricted 1,871,628 1,819,136
Total net assets $ 23,335,975 $ 21,508,188
Total liabilities and net assets $ 27,891,414 $ 25,796,425
See notes to consolidated fi nancial statements.
Consolidated Statements of Financial PositionJune 30, 2015 and 2014

3
Temporarily Permanently (dollars in thousands) Unrestricted Restricted Restricted 2015 Total
Operating revenuesTuition and fees $ 336,826 - - $ 336,826Less scholarships and fellowships (224,766) - - (224,766) Net tuition and fees 112,060 - - 112,060
Government grants and contracts 274,973 - - 274,973Private gifts, grants, and contracts 88,023 - - 88,023Auxiliary sales and services 86,599 - - 86,599Other sources 178,281 - - 178,281Investment earnings distributed 271,793 $ 609,346 - 881,139
Operating revenues 1,011,729 609,346 - 1,621,075Net assets released from restrictions 613,214 (613,214) - -
Total operating revenues 1,624,943 (3,868) - 1,621,075Operating expensesEducational and general: Academic departments and programs 677,927 - - 677,927 Academic support 102,014 - - 102,014 Student services 109,131 - - 109,131 Library 88,930 - - 88,930 General administration and institutional support 165,147 - - 165,147 Other student aid 55,322 - - 55,322 Plasma Physics Laboratory 119,488 - - 119,488
Total educational and general 1,317,959 - - 1,317,959
Auxiliary activities 79,709 - - 79,709Interest on indebtedness 143,952 - - 143,952
Total operating expenses 1,541,620 - - 1,541,620 Results of operations 83,323 (3,868) - 79,455
Nonoperating activitiesAdjustments to planned giving agreements - (18,549) - (18,549)Decrease in value of assets held in trust by others - (4,686) $ (2,179) (6,865)Private gifts, noncurrent 62,763 13,674 65,826 142,263Net realized and unrealized appreciation on investments 1,697,880 821,251 - 2,519,131Distribution of investment earnings (271,793) (609,346) - (881,139)Reclassifi cations, transfers, and other nonoperating 2,662 1,984 (11,155) (6,509)
Increase from nonoperating activities 1,491,512 204,328 52,492 1,748,332
Increase in net assets 1,574,835 200,460 52,492 1,827,787 Net assets at the beginning of the year 8,354,141 11,334,911 1,819,136 21,508,188
Net assets at the end of the year $ 9,928,976 $ 11,535,371 $ 1,871,628 $23,335,975
See notes to consolidated fi nancial statements.
Consolidated Statements of ActivitiesYear ended June 30, 2015

4
Temporarily Permanently (dollars in thousands) Unrestricted Restricted Restricted 2014 Total
Operating revenuesTuition and fees $ 311,426 - - $ 311,426Less scholarships and fellowships (203,586) - - (203,586) Net tuition and fees 107,840 - - 107,840
Government grants and contracts 272,280 - - 272,280Private gifts, grants, and contracts 83,873 - - 83,873Auxiliary sales and services 101,378 - - 101,378Other sources 160,015 - - 160,015Investment earnings distributed 334,944 $ 505,937 - 840,881
Operating revenues 1,060,330 505,937 - 1,566,267Net assets released from restrictions 536,806 (536,806) - -
Total operating revenues 1,597,136 (30,869) - 1,566,267Operating expensesEducational and general: Academic departments and programs 669,040 - - 669,040 Academic support 91,417 - - 91,417 Student services 124,125 - - 124,125 Library 75,592 - - 75,592 General administration and institutional support 143,331 - - 143,331 Other student aid 37,850 - - 37,850 Plasma Physics Laboratory 98,323 - - 98,323
Total educational and general 1,239,678 - - 1,239,678
Auxiliary activities 130,123 - - 130,123Interest on indebtedness 125,429 - - 125,429
Total operating expenses 1,495,230 - - 1,495,230 Results of operations 101,906 (30,869) - 71,037
Nonoperating activitiesAdjustments to planned giving agreements - 7,653 $ 4,096 11,749Increase in value of assets held in trust by others - - 18,436 18,436Private gifts, noncurrent - 78,778 30,325 109,103Net realized and unrealized appreciation on investments 1,326,542 2,068,886 - 3,395,428Distribution of investment earnings (334,944) (505,937) - (840,881)
Increase from nonoperating activities 991,598 1,649,380 52,857 2,693,835
Increase in net assets 1,093,504 1,618,511 52,857 2,764,872 Net assets at the beginning of the year 7,260,637 9,716,400 1,766,279 18,743,316
Net assets at the end of the year $ 8,354,141 $ 11,334,911 $ 1,819,136 $ 21,508,188
See notes to consolidated fi nancial statements.
Consolidated Statements of ActivitiesYear ended June 30, 2014
5
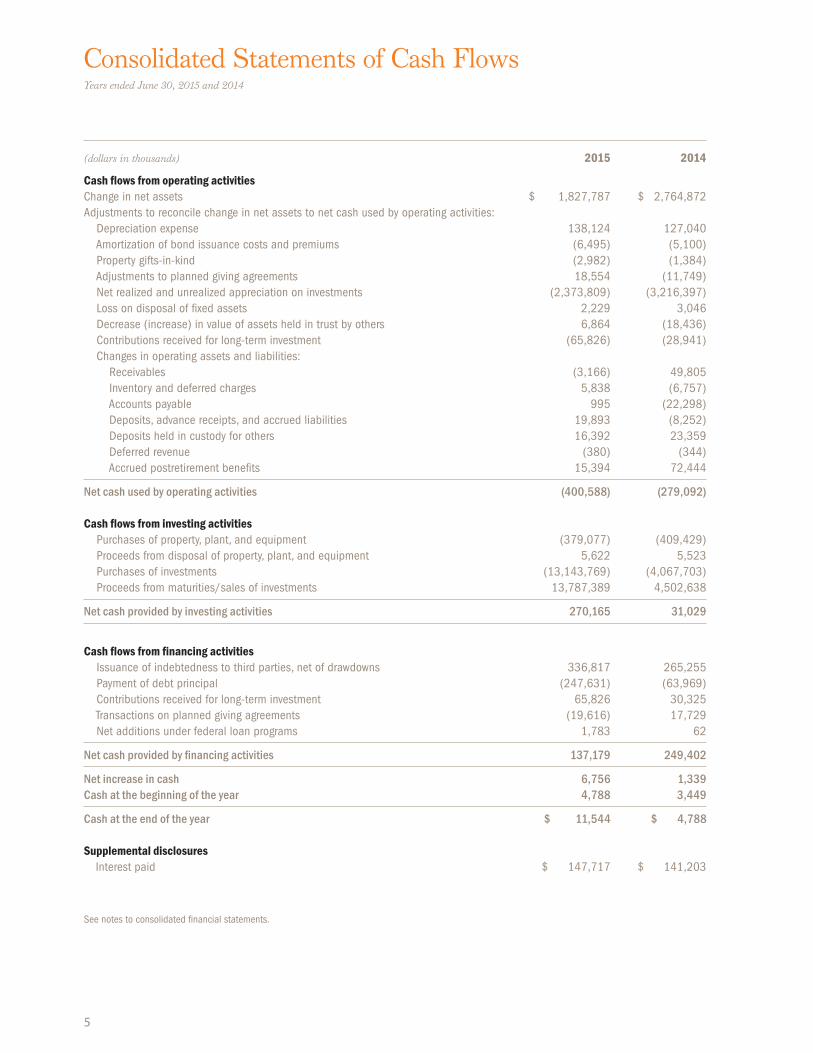
(dollars in thousands) 2015 2014
Cash ows from operating activitiesChange in net assets $ 1,827,787 $ 2,764,872Adjustments to reconcile change in net assets to net cash used by operating activities: Depreciation expense 138,124 127,040 Amortization of bond issuance costs and premiums (6,495) (5,100) Property gifts-in-kind (2,982) (1,384) Adjustments to planned giving agreements 18,554 (11,749) Net realized and unrealized appreciation on investments (2,373,809) (3,216,397) Loss on disposal of fi xed assets 2,229 3,046 Decrease (increase) in value of assets held in trust by others 6,864 (18,436) Contributions received for long-term investment (65,826) (28,941) Changes in operating assets and liabilities: Receivables (3,166) 49,805 Inventory and deferred charges 5,838 (6,757) Accounts payable 995 (22,298) Deposits, advance receipts, and accrued liabilities 19,893 (8,252) Deposits held in custody for others 16,392 23,359 Deferred revenue (380) (344) Accrued postretirement benefi ts 15,394 72,444
Net cash used by operating activities (400,588) (279,092)
Cash ows from investing activities Purchases of property, plant, and equipment (379,077) (409,429) Proceeds from disposal of property, plant, and equipment 5,622 5,523 Purchases of investments (13,143,769) (4,067,703) Proceeds from maturities/sales of investments 13,787,389 4,502,638
Net cash provided by investing activities 270,165 31,029
Cash ows from nancing activities Issuance of indebtedness to third parties, net of drawdowns 336,817 265,255 Payment of debt principal (247,631) (63,969) Contributions received for long-term investment 65,826 30,325 Transactions on planned giving agreements (19,616) 17,729 Net additions under federal loan programs 1,783 62
Net cash provided by nancing activities 137,179 249,402
Net increase in cash 6,756 1,339Cash at the beginning of the year 4,788 3,449
Cash at the end of the year $ 11,544 $ 4,788
Supplemental disclosures Interest paid $ 147,717 $ 141,203
See notes to consolidated fi nancial statements.
Consolidated Statements of Cash FlowsYears ended June 30, 2015 and 2014

6
1. N AT U R E O F O P E R AT I O N S
Princeton University (the “University”) is a privately endowed, nonsectarian institution of higher learning. When originally chartered in 1746 as the College of New Jersey, it became the fourth college in British North America. It was renamed Princeton University in 1896. First located in Elizabeth, and brie y in Newark, the school moved to Princeton in 1756.
The student body numbers approximately 5,275 undergraduates and 2,670 graduate students in more than 90 departments and programs. The University offers instruction in the liberal arts and sciences and in professional programs of the School of Architecture, the School of Engineering and Applied Science, and the Woodrow Wilson School of Public and International Affairs. The faculty numbers approximately 1,180, including visitors and part-time appointments.
2 . S U M M A R Y O F S I G N I F I C A N T AC C O U N T I N G P O L I C I E S
The consolidated nancial statements of Princeton University (now legally known as “The Trustees of Princeton University”) are prepared on the accrual basis and include the accounts of its wholly owned subsidiaries, foundation, and investments controlled by the University. Financial information conforms to the statements of accounting principles of the Financial Accounting Standards Board (FASB) and to the American Institute of Certi ed Public Accountants Audit and Accounting Guide for Not-for-Profit Entities. Relevant pronouncements include FASB Accounting Standards Codi cation (ASC) 958-310, Not-for-Profit Entities—Receivables, and ASC 958-205, Not-for-Profit Entities—Presentation of Financial Statements.
Unconditional promises to give are recognized as revenues in the year made, not in the yearin which the cash is received. The amounts are discounted based on timing of expected collections.Amounts received from donors to planned giving programs are shown in part as a liability for the present value of annuity payments to the donor; the balance is shown as a gift of either temporarily or permanently restricted net assets.
External nancial statements of not-for-pro t organizations require the preparation of a statement of nancial position, a statement of activities, and a statement of cash ows. The classi cation of the organization’s net assets and its revenues and expenses into three categories according to the existence or absence of donor-imposed restrictions—permanently restricted, temporarily restricted, or unrestricted—is also required. Changes, including reclassi cation and transfers, in each category are re ected in the statement of activities, certain of which are further categorized as nonoperating. Such nonoperating activities primarily re ect transactions of a long-term investment or capital nature, including contributions receivable in future periods, contributions subject to donor-imposed restrictions, and gains and losses on investments in excess of the University’s spending rule.
Other signi cant accounting policies are described elsewhere in these notes.The preparation of the University’s nancial statements in conformity with generally accepted
accounting principles (GAAP) requires management to make estimates and assumptions that affect the reported amounts of assets and liabilities and disclosure of contingent assets and liabilities at the dates of the consolidated statements of nancial position, and the reported amounts of revenue and expense included in the consolidated statements of activities. Actual results could differ from such estimates.
In May 2015, the Financial Accounting Standards Board issued Accounting Standard Update (ASU) 2015-07, Fair Value Measurement (Topic 820), Disclosure for Investments in Certain Entities That Calculated Net Asset Value per Share (or its Equivalent). The ASU removes the requirement to categorize within the fair value hierarchy all investments for which fair value
Notes to Consolidated Financial StatementsYears ended June 30, 2015 and 2014

7
is measured using the practical expedient. The ASU further removes the requirement to make certain disclosures for all investments that are eligible to be measured at fair value using the practical expedient. This ASU is effective for annual periods beginning after December 15, 2015. The University is evaluating the disclosure, and it is not expected to have a material impact on the University nancial statements.
Certain prior-year balances have been reclassi ed to conform to the current year presentation.
3 . I N V E S T M E N T S
Managed InvestmentsAll managed investments are reported at fair value. The fair value of marketable equity, debt, and certain derivative securities (which includes both domestic and foreign issues) is generally based upon a combination of published current market prices and exchange rates. The fair value of restricted securities and other investments for which published market prices are not available is based on estimated values using discounted cash ow analysis and other industry standard methodologies. Where applicable, independent appraisers and engineers assist in the valuation. The fair value of limited partnerships and similar investment vehicles is generally estimated by external investment managers, including general partners or valuation committees. These valuations necessarily involve assumptions and methods that are reviewed, evaluated, and adjusted, if necessary, by the University. Changes in assumptions could have a signi cant effect on the fair values of these investments. Actual results could differ from these estimates and could have a material impact on the nancial statements. These investments are generally less liquid than other investments, and the values reported may differ from the values that would have been reported had a ready market for these securities existed. Securities transactions are reported on a trade-date basis.
A summary of managed investments by asset category at fair value at June 30, 2015 and 2014, is presented below. The managed investment categories are presented on a “manager-mandate” basis, that is, all of the assets and market value of the underlying funds and accounts are included in the asset class which is the primary focus of the fund or account. (Many funds and accounts have contractual exibility to invest across more than one asset class.)
(dollars in millions) 2015 2014Managed investments: Domestic equity $ 2,191.8 $ 1,815.7 International equity 3,471.6 3,034.6 Independent return 5,535.1 5,178.2 Private equity 6,844.2 6,326.5 Real assets 3,290.5 3,499.7 Fixed income 752.5 81.5 Cash and other 387.3 833.1
Gross managed investments $ 22,473.0 $ 20,769.3Receivables (liabilities) associated with investments —net (181.7) (192.9)
Net managed investments $ 22,291.3 $ 20,576.4
The Princeton University Investment Company (PRINCO) manages investments for a foundation that the University controls, the Stanley J. Seeger Hellenic Fund, and deposits held
Notes to Consolidated Financial Statements(Continued)

8
in custody for others. The investment balances managed by PRINCO for these entities as of June 30, included in the University’s consolidated nancial statements, are as follows:
(dollars in millions) 2015 2014Princeton University $ 22,270.8 $ 20,586.7Stanley J. Seeger Hellenic Fund 43.5 40.3 Deposits held in custody for others 158.7 142.3
Gross managed investments $ 22,473.0 $ 20,769.3
The composition of net investment return from managed and other investments for the years ended June 30 was as follows:
(dollars in thousands) 2015 2014Net realized and unrealized gains $ 2,373,809 $ 3,216,397Interest, dividends, and other income 145,322 179,031
Total $ 2,519,131 $ 3,395,428
Princeton University investments together with the Stanley J. Seeger Hellenic Fund and deposits held in custody for others are invested in a single unitized pool. The market value of each unit was $10,902.38 and $10,099.61 at June 30, 2015 and 2014, respectively. The average value of a unit during the years ending June 30, 2015 and 2014, was $10,264.36 and $9,309.36, respectively.
The average invested market balance in the unitized pool during the years ending June 30, 2015 and 2014, was $20.899 billion and $18.856 billion, respectively.
The University follows a spending rule for its unitized investments, including funds functioning as endowment, that provides for regular increases in spending while preserving the long-term purchasing power of the endowment. Earnings available for spending are shown in operating revenue, and the balance is shown as nonoperating revenue. Amounts distributed per unit under that rule were $427.78 and $407.41 for scal years 2015 and 2014, respectively.
The University invests in various investment instruments. Investment securities, in general, are exposed to various risks, such as interest rate, credit, and overall market volatility. Due to the level of risk associated with certain investment securities, it is reasonably possible that changes in the values of investment securities will occur in the near term and that such changes could materially affect the amounts reported in the nancial statements.
As part of its investment strategy, the University enters into transactions utilizing a variety of nancial instruments and strategies, including futures, swaps, options, short sales, and forward foreign currency contracts. These nancial instruments and strategies allow the University to ne-tune the asset allocation of the investment portfolio. In all cases except forward foreign currency exchange and swap contracts, these instruments are traded through securities and commodities exchanges. The forward foreign currency and swap contracts are executed with creditworthy banks and brokerage rms. These nancial instruments are subject to an enforceable master netting arrangement or similar agreement, and are presented on a net basis on the consolidated statement of nancial position. In January 2013, FASB issued Accounting Standards Update (ASU) 2013-01, Balance Sheet (Topic 210): Clarifying the Scope of Disclosures about Offsetting Assets and Liabilities, which clari es the scope of ASU 2011-11 as it applies to derivatives accounted for in accordance with Topic 815, Derivatives and Hedging, requiring additional disclosures for derivative portfolios including disclosing the gross amounts of recognized nancial assets and nancial liabilities that are offset in the balance sheet and subject to an enforceable master netting arrangement. The University adopted the standard in scal year
Notes to Consolidated Financial Statements(Continued)

9
2014 and disclosures pertaining to this topic have been included below.At June 30, 2015, the aggregate notional value of futures contracts was $250.2 million
held with one counterparty, with an aggregate unrealized gain of $2.0 million on a gross basis. At June 30, 2015, the aggregate notional value of swaps was $557.0 million held with two counterparties, with an aggregate unrealized gain of $1.7 million and unrealized loss of $31.6 millions on a gross basis; and $11.3 million has been pledged as collateral. No other contracts were held during the year ended June 30, 2015. At June 30, 2014, the aggregate notional value of futures contracts was $303.5 million held with one counterparty, with an aggregate unrealized gain of $0.4 million and unrealized loss of $4.8 million on a gross basis. At June 30, 2014, the aggregate notional value of swaps was $331.0 million held with two counterparties, with an aggregate unrealized gain of $31.2 million and unrealized loss of $4.2 million on a gross basis; and $16.2 million had been pledged as collateral. These instruments, when recognized, are recorded at fair value and are included as either an asset or a liability depending on the rights or obligations of the contract. Realized gains or losses are recorded at the time the contract is closed.
Funds Held in Trust by OthersThe University is the income bene ciary of various trusts that are held and controlled by independent trustees. In addition, the University is the income bene ciary of entities that qualify as supporting organizations under Section 509(a)(3) of the U.S. Internal Revenue Code. Funds held in trust by others are recognized at the estimated fair value of the assets or the present value of the future cash ows when the irrevocable trust is established or the University is noti ed of its existence. Funds held in trust by others, stated at fair value, amounted to $154.2 million in 2015 and $161.0 million in 2014.
Other InvestmentsOther investments include working capital (consisting primarily of U.S. Treasury bonds), a small number of funds that must be separately invested due to donor or legal restrictions, planned giving investments, proceeds from debt, and local real estate holdings expected to be liquidated strategically over several years. A summary of other investments at fair value at June 30, 2015 and 2014, is as follows:
(dollars in millions) 2015 2014Working capital $ 378.7 $ 342.7Planned giving investments 178.4 198.8Proceeds from debt 75.4 81.5Strategic real estate investments 47.2 46.1Other 5.7 1.0
Total $ 685.4 $670.1
4 . FA I R VA L U E M E A S U R E M E N T S
ASC 820, Fair Value Measurements and Disclosures, de nes fair value, establishes a framework for measuring fair value in GAAP, and expands disclosure about fair value measurements. Fair value is de ned as the price that would be received to sell an asset or paid to transfer a liability (exit price) in an orderly transaction between market participants at the measurement date. Fair value should be based on assumptions that market participants would use when pricing an asset or liability, including assumptions about risk and the risks inherent in valuation techniques and the inputs to valuations. Fair value measurements assume that the transaction occurs in the
Notes to Consolidated Financial Statements(Continued)

10
principal market for the asset or liability (the market with the most volume and activity for theasset or liability from the perspective of the reporting entity), or in the absence of a principal market, the most advantageous market for the asset or liability (the market in which the reporting entity would be able to maximize the amount received or minimize the amount paid). The University applies fair value measurements to certain assets and liabilities, including the University’s managed investments, other investments, and funds held in trust by others, in accordance with the requirements described above.
The University maximizes the use of observable inputs and minimizes the use of unobservable inputs when measuring fair value. Fair value is based on actively quoted market prices, if available. In the absence of actively quoted market prices, price information from external sources, including broker quotes and industry publications, is used. If pricing information from external sources is not available, or if observable pricing is not indicative of fair value, judgment is required to develop the estimates of fair value using discounted cash ow and other income valuation approaches.
The University utilizes the following fair value hierarchy, which prioritizes, into three broad levels, the inputs to valuation techniques used to measure fair value:Level 1: Quoted prices (unadjusted) in active markets for identical assets and liabilities that the University has the ability to access at the measurement date. Instruments categorized in Level 1 primarily consist of a broadly traded range of equity and debt securities.Level 2: Inputs other than quoted prices included within Level 1 that are either directly or indirectly observable for the asset or liability, including quoted prices for similar assets or liabilities in active markets, quoted prices for identical or similar assets or liabilities in inactive markets, inputs other than quoted prices that are observable for the asset or liability, and inputs that are derived from observable market data by correlation or other means. Instruments categorized in Level 2 consist primarily of investments in certain entities that calculate net asset value per share (or its equivalent) and can be redeemed in the near term.Level 3: Unobservable inputs for the asset or liability, including situations where there is little, if any, market activity for the asset or liability. Instruments categorized in Level 3 consist primarily of limited partnership interests and other similar investment vehicles.
The fair value hierarchy gives the highest priority to quoted prices in active markets (Level 1) and the lowest priority to unobservable data (Level 3). In some cases, the inputs used to measure fair value might fall in different levels of the fair value hierarchy. The lowest level input that is signi cant to a fair value measurement in its entirety determines the applicable level in the fair value hierarchy. Assessing the signi cance of a particular input to the fair value measurement in its entirety requires judgment, considering factors speci c to the asset or liability. Fair value measurements are categorized as Level 3 when a signi cant amount of price or other inputs that are considered to be unobservable are used in their valuations. Where the University has the ability to redeem its investment with the investee at net asset value per share (or its equivalent) at the measurement date, such investments have been categorized under Level 2 fair value measurements. Certain of these investments may be subject to modest holdback provisions to cover audit and other potential expenses or adjustments in the event of a complete withdrawal.
The University has various processes and controls in place to ensure investment fair value is reasonable and performs due diligence procedures on its investments including an assessment of applicable accounting policies, a review of the valuation procedures employed, and consideration of redemption features and price transparency. The University holds direct real estate investments categorized as Level 3. Valuation for material directly held real estate investments is determined from periodic valuations prepared by independent appraisers or broker opinions.
Notes to Consolidated Financial Statements(Continued)

11
The following tables present the University’s assets that are measured at fair value for each hierarchy level, at June 30, 2015 and 2014.
Fair Value Measurements at Reporting Date Using Quoted Prices in Active Signi cant Other Signi cant(dollars in millions) Markets for Identical Observable Inputs Unobservable 2015 Total Assets (Level 1) (Level 2) Inputs (Level 3)Assets at fair valueManaged investments (gross): Domestic equity $ 2,191.8 $ (83.6) $ 87.9 $ 2,187.5 International equity 3,471.6 695.8 663.60 2,112.2 Independent return 5,535.1 - 787.6 4,747.5 Private equity 6,844.2 0.7 - 6,843.5 Real assets 3,290.5 123.8 243.3 2,923.4 Fixed income 752.5 752.5 - - Cash and other 387.3 479.6 (92.3) -Total managed investments (gross) 22,473.0 1,968.8 1,690.1 18,814.1Funds held in trust by others 154.2 - - 154.2Other investments 685.4 461.1 - 224.3
Total $ 23,312.6 $ 2,429.9 $ 1,690.1 $ 19,192.6
2014 Assets at fair valueManaged investments (gross): Domestic equity $ 1,815.7 $ (58.3) $ 254.4 $ 1,619.6 International equity 3,034.6 499.1 730.8 1,804.7 Independent return 5,178.2 - 529.3 4,648.9 Private equity 6,326.5 - - 6,326.5 Real assets 3,499.7 87.0 149.4 3,263.3 Fixed income 81.5 81.5 - - Cash and other 833.1 1,074.1 (241.4) 0.4Total managed investments (gross) 20,769.3 1,683.4 1,422.5 17,663.4Funds held in trust by others 161.0 - - 161.0Other investments 670.2 424.2 - 246.0
Total $ 21,600.5 $ 2,107.6 $ 1,422.5 $ 18,070.4
Assets and liabilities of a majority-owned investment fund have been consolidated for reporting purposes at June 30, 2015 and 2014. Managed investments, speci cally the independent return asset class, includes consolidated investment fund assets of $962.5 million and $948.5 million at June 30, 2015 and 2014, respectively, and liabilities associated with investments includes consolidated investment fund liabilities of $185.7 million and $192.9 million at June 30, 2015 and 2014, respectively.
Notes to Consolidated Financial Statements(Continued)

12
The following tables present the net change in the assets measured at fair value on a recurring basis and included in the Level 3 fair value category for the years ended June 30, 2015 and 2014:
Fair Value Measurements Using Signi cant Unobservable Inputs (Level 3) Total gains or losses included in Transfers Transfers June 30, changes in Sales and into out of June 30,(dollars in millions) 2014 net assets Purchases settlements Level 3 Level 3 2015Assets at fair valueManaged investments (gross): Domestic equity $ 1,619.6 $ 600.0 $ 73.1 $ (105.2) - - $ 2,187.5 International equity 1,804.7 273.0 1,328.5 (1,294.0) - - 2,112.2 Independent return 4,648.9 189.0 217.6 (168.3) - $ (139.7) 4,747.5 Private equity 6,326.5 1,248.1 814.4 (1,545.5) - - 6,843.5 Real assets 3,263.3 69.5 500.4 (909.8) - - 2,923.4 Fixed income - - - - - - - Cash and other 0.4 0.5 - (0.9) - - -Funds held in trust by others 161.0 (7.4) 2.1 (1.5) - - 154.2Other investments 246.0 (21.8) 5.5 (5.4) - - 224.3
Total Level 3 investments $ 18,070.4 $ 2,350.9 $ 2,941.6 $ (4,030.6) - $ (139.7) $ 19,192.6
Fair Value Measurements Using Signi cant Unobservable Inputs (Level 3) Total gains or losses included in Transfers Transfers June 30, changes in Sales and into out of June 30,(dollars in millions) 2013 net assets Purchases settlements Level 3 Level 3 2014Assets at fair valueManaged investments (gross): Domestic equity $ 1,188.4 $ 335.6 $ 266.9 $ (171.3) - - $ 1,619.6 International equity 1,298.0 406.2 298.6 (229.3) $ 31.2 - 1,804.7 Independent return 4,090.8 461.4 455.4 (358.7) - - 4,648.9 Private equity 5,592.8 1,419.0 654.4 (1,339.7) - - 6,326.5 Real assets 3,128.6 326.2 294.6 (486.1) - - 3,263.3 Fixed income 7.8 0.1 - (7.9) - - - Cash and other 0.5 (0.1) - - - - 0.4Funds held in trust by others 130.4 17.9 - - 12.7 - 161.0Other investments 238.0 24.0 2.3 (8.8) 2.6 $ (12.1) 246.0
Total Level 3 investments $ 15,675.3 $ 2,990.3 $ 1,972.2 $ (2,601.8) $ 46.5 $ (12.1) $ 18,070.4
The University assesses the valuation hierarchy for each asset or liability measured on an annual basis. From time to time, assets or liabilities will be transferred within hierarchy levels as a result of changes in valuation methodologies, liquidity, and/or redemption terms. In the year ended June 30, 2015, four managed investments transferred from Level 3 to Level 2. In the year ended June 30, 2014, one managed investment transferred from Level 2 to Level 3. The University’s policy is to recognize transfers at the beginning of the reporting period.
Realized gains of $1,836.3 million and $1,202.6 million related to Level 3 investments and unrealized gains of $514.6 million and $1,787.7 million related to Level 3 investments are included in net realized and unrealized appreciation on investments in the consolidated statements of activities for the years ended June 30, 2015 and 2014, respectively.
Notes to Consolidated Financial Statements(Continued)

13
The following tables and disclosures set forth the signi cant terms of the agreements with investment managers or funds by major category at June 30, 2015 and 2014. The information is presented on a “manager-mandate” basis.
June 30 Unfunded Redemption Frequency Redemption(dollars in millions) Fair Value Commitments (If Currently Eligible) Notice Period2015Managed investments (gross)Domestic equity (a) $ 2,191.8 $ 181.2 daily—annually 4–90 daysInternational equity—developed (b) 1,076.9 - daily—annually 7–90 daysInternational equity—emerging (c) 2,394.7 136.0 daily—annually 7–90 daysIndependent return (d) 5,535.1 306.2 monthly—annually 30–90 daysFixed income (e) 752.5 - daily 1 dayCash and other (e) 387.3 - daily 1 day
Marketable asset classes $ 12,338.3 $ 623.4
Private equity (f) 6,844.2 2,172.3Real assets (g) 3290.5 1,523.0
Nonmarketable asset classes $ 10,134.7 $ 3,695.3
Total gross investments $ 22,473.0 $ 4,318.7
2014Managed investments (gross)Domestic equity (a) $ 1,815.7 $ 82.5 daily—annually 4–90 daysInternational equity—developed (b) 1,018.1 - daily—annually 7–90 daysInternational equity—emerging (c) 2,016.5 177.3 daily—annually 7–90 daysIndependent return (d) 5,178.2 296.8 monthly—annually 30–90 daysFixed income (e) 81.5 - daily same dayCash and other (e) 833.1 - daily same day
Marketable asset classes $ 10,943.1 $ 556.6
Private equity (f) 6,326.5 2,301.2Real assets (g) 3,499.7 1,551.2
Nonmarketable asset classes $ 9,826.2 $ 3,852.4
Total gross investments $ 20,769.3 $ 4,409.0
(a) Domestic Equity: This asset class includes funds and accounts primarily invested in equities traded on domestic exchanges or in domestic over-the-counter markets. The fair values of the investments in this asset class have been estimated using the net asset value per share of the investee funds, or, in the case of custodied accounts, the fair value of the securities held. Investments representing approximately 4 percent of the market value of this asset class are invested in nonredeemable assets.(b) International Equity—Developed: This asset class includes funds primarily invested in public equity and debt securities traded in countries with developed economies other than the United States. The fair values of the investments in this asset class have been estimated using the net asset value per share of the investee funds. Investments representing approximately 7 percent of the market value of this asset class are invested in nonredeemable assets.
Notes to Consolidated Financial Statements(Continued)

14
(c) International Equity—Emerging: This asset class includes funds primarily invested in public equity and debt securities traded in countries with emerging economies. The fair values of the investments in this asset class have been estimated using the net asset value per share of the investee funds or, in the case of custodied accounts, the fair value of the securities held, at prevailing exchange rates. Investments representing approximately 5 percent of the market value of this asset class are invested in nonredeemable assets.(d) Independent Return: This asset class includes funds invested in equity and debt securities and nancial instruments such as options, swaps, futures, and other derivatives. Funds in this asset class may hold both long and short positions in any of these instruments and pursue a variety of investment strategies based upon the fund’s investment mandate and the current opportunity set. In general terms, approximately 33 percent of market value is invested in funds principally focused on long/short equity investments, 24 percent is invested in event-driven/arbitrage strategies, and 43 percent is invested in funds that opportunistically engage in both strategies. Investments representing approximately 20 percent of the market value of this asset class are invested in nonredeemable assets.(e) Fixed Income and Cash: On a combined basis, these asset classes include primarily U.S. government and U.S. government–guaranteed securities held in separate accounts at the custodial bank. Virtually all of the investments in these asset classes can be liquidated on a daily basis.(f) Private Equity: This asset class includes funds invested primarily in buyouts or venture capital. The fair values of the investments in this asset class have generally been estimated using partners’ capital statements issued by the funds, which re ect the University’s ownership interest. Generally, investments in this asset class are not redeemable. Distributions from investee funds in the portfolio are received as the underlying investments of the funds are liquidated.(g) Real Assets: This asset class includes funds invested primarily in real estate, energy, and timber. The fair values of the investments in this asset class have been estimated using partners’ capital statements issued by the funds, which re ect the University’s ownership interest. Generally, investments in this asset class are not redeemable. However, a small portion, $196.2 million at June 30, 2015, and $194.6 million at June 30, 2014, was invested in redeemable funds. More broadly, distributions from investee funds are received as the underlying investments of the funds are liquidated.
Investments in the marketable asset classes are generally redeemable, made in entities that allow the University to request withdrawals in speci ed circumstances. However, approximately $1.3 billion of the marketable asset classes are invested in “nonredeemable assets,” which are not eligible for redemption by the University. Nonredeemable assets are speci c investments within a fund designated by the fund manager as ineligible for withdrawal. Due to the illiquid nature of nonredeemable assets, it is impossible for the University to predict when these assets will liquidate and the proceeds distributed to investors.
In addition to nonredeemable assets, the University may be limited in its ability to effect a withdrawal if a fund manager invokes a “gate” provision restricting redemptions from its fund. Gates are generally triggered when aggregate fund withdrawal requests exceed a contractually predetermined threshold. No withdrawal requests were impacted by a gate in the year ended June 30, 2015.
Notes to Consolidated Financial Statements(Continued)

15
The University is obligated under certain agreements to fund capital calls periodically up to speci ed commitment amounts. At June 30, 2015, the University had unfunded commitments of $4.3 billion. Such commitments are generally called over periods of up to 10 years and contain xed expiration dates or other termination clauses.
5 . E N D O W M E N T
The University’s endowment consists of approximately 4,300 individual funds established for a variety of purposes. The endowment includes both donor-restricted endowment funds and funds designated by the University to function as endowments. As required by GAAP, net assets associated with endowment funds, including funds designated by the University to function as endowments, are classi ed and reported based on the existence or absence of donor-imposed restrictions.
ASC 958-205-45-28, Not-for-Profit Entities—Presentation of Financial Statements—Other Presentation Matters—Classification of Donor-Restricted Endowment Funds Subject to the Uniform Prudent Management of Institutional Funds Act, provides guidance on the net asset classi cation of donor-restricted endowment funds for a not-for-pro t organization that is subject to an enacted version of the Uniform Prudent Management of Institutional Funds Act of 2006 (UPMIFA), which was enacted in the state of New Jersey in June 2009.
Interpretation of relevant law —The University interprets the UPMIFA as requiring the preservation of the fair value at the original gift date of the donor-restricted endowment funds, absent explicit donor stipulations to the contrary. As a result of this interpretation, the University classi es as permanently restricted net assets: (a) the original value of gifts donated to the permanent endowment, (b) the original value of subsequent gifts to the permanent endowment, and (c) accumulations to the permanent endowment made in accordance with the direction of the applicable donor gift instrument at the time the accumulation is added to the fund. The remaining portion of the donor-restricted net assets is classi ed as temporarily restricted net assets until those amounts are appropriated for expenditure by the University in a manner consistent with the standard of prudence prescribed by UPMIFA. The University considers the following factors in making a determination to appropriate or accumulate donor-restricted endowment funds:
(1) The duration and preservation of the fund(2) The purposes of the University and the donor-restricted endowment fund(3) General economic conditions(4) The possible effect of in ation and de ation(5) The expected total return from income and the appreciation of investments(6) Other resources of the University(7) The investment policies of the University
Notes to Consolidated Financial Statements(Continued)

16
Endowment net asset composition by type of fund as of June 30, 2015 and 2014, is:
Temporarily Permanently2015 (dollars in thousands) Unrestricted Restricted Restricted TotalDonor-restricted endowment funds - $ 11,219,923 $ 1,649,703 $ 12,869,626Board-designated endowment funds $ 9,278,348 - - 9,278,348
Total $ 9,278,348 $ 11,219,923 $ 1,649,703 $ 22,147,974
2014 (dollars in thousands) Donor-restricted endowment funds - $ 10,721,605 $ 1,697,187 $ 12,418,792Board-designated endowment funds $ 8,023,126 - - 8,023,126
Total $ 8,023,126 $ 10,721,605 $ 1,697,187 $ 20,441,918
Changes in endowment net assets for the years ended June 30, 2015 and 2014, are:
Temporarily Permanently 2015 (dollars in thousands) Unrestricted Restricted Restricted 2015 TotalEndowment net assets, beginning of the year $ 8,023,126 $ 10,721,605 $ 1,697,187 $ 20,441,918Investment return: Net realized and unrealized appreciation 1,574,425 821,251 - 2,395,676 Contributions 14,616 1,460 72,608 88,684Appropriation of endowment assets for expenditure (262,253) (602,799) - (865,052)Reclassifi cations, transfers, and board designations (71,566) 278,406 (120,092) 86,748
Endowment net assets, end of the year $ 9,278,348 $ 11,219,923 $ 1,649,703 $ 22,147,974
Temporarily Permanently2014 (dollars in thousands) Unrestricted Restricted Restricted 2014 TotalEndowment net assets, beginning of the year $ 6,838,057 $ 9,209,214 $ 1,632,818 $ 17,680,089Investment return: Net realized and unrealized appreciation 1,304,881 2,068,948 - 3,373,829 Reclassifi cation for funds with defi ciencies 62 (62) - -
Total investment return 1,304,943 2,068,886 - 3,373,829
Contributions - - 30,325 30,325Appropriation of endowment assets for expenditure (318,084) (504,337) - (822,421)Reclassifi cations, transfers, and board designations 198,210 (52,158) 34,044 180,096
Endowment net assets, end of the year $ 8,023,126 $ 10,721,605 $ 1,697,187 $ 20,441,918
Funds with deficiencies—From time to time, the fair value of assets associated with individual donor-restricted endowment funds may fall below the level that the donor or UPMIFA requires the University to retain as a fund of perpetual duration. De ciencies of this nature are reportedin unrestricted net assets, although there were no funds with de ciencies at June 30, 2015 or 2014. De ciencies can result from unfavorable market uctuations that occur shortly after the investment of new permanently restricted contributions while continued appropriations are deemed prudent by the Board of Trustees.
In accordance with the terms of donor gift instruments, the University is permitted to reduce the balance of restricted endowments below the original amount of the gift. Subsequent investment gains are then used to restore the balance up to the fair market value of the original amount of the gift. Subsequent gains above that amount are recorded in temporarily restricted net assets.
Notes to Consolidated Financial Statements(Continued)

17
Return objectives and risk parameters—The University has adopted investment and spending policies for endowment assets that attempt to support the University’s current and future operating needs, while preserving intergenerational equity. Endowment assets include those assets of donor-restricted funds that the University must hold in perpetuity or for donor-speci ed periods as well as University-designated funds. Under these policies, the endowment assets are invested in a manner that is intended to produce returns that exceed both the annual rate of spending and university in ation.
Strategies employed for achieving objectives—The vast majority of the endowment assets are actively managed by PRINCO, which is structured as a University of ce, but maintains its own Board of Directors, and operates under the nal authority of the University’s Board of Trustees (the “Trustees”).
In pursuit of the investment return objectives, PRINCO maintains an equity-biased portfolio and seeks to partner with best-in-class investment management rms across diverse asset categories.
Spending policy and how the investment objectives relate to spending policy—Each year the Trustees decide upon an amount to be spent from the endowment for the following scal year. In their deliberations, the Trustees use a spending framework that is designed to enable sizable amounts to be spent in a reasonably stable fashion, while allowing for reinvestment suf cient to preserve purchasing power in perpetuity. The framework targets annual spending rates of between 4.0 percent and 6.25 percent.
The endowment must seek investment returns suf cient to meet spending policy targets as well as to maintain future purchasing power without deterioration of corpus resulting from university in ation.
6 . E D U C AT I O N A L A N D M O R T G AG E L OA N S
Educational loans include donor-restricted and federally sponsored educational loans that bear mandated interest rates and repayment terms, and are subject to signi cant restrictions on their transfer and disposition. These loans totaled $64.8 million and $68.3 million at June 30, 2015 and 2014, respectively. Determination of the fair value of educational loans receivable could not be made without incurring excessive costs.
Through a program to attract and retain excellent faculty and senior staff, the University provides home acquisition and nancing assistance on residential properties in the area surrounding the University. Notes receivable from faculty and staff and co-ownership interests in the properties are included in mortgage loans and are collateralized by mortgages on those properties. These loans and interests totaled $313.7 million and $299.0 million at June 30, 2015 and 2014, respectively.
Allowance for Doubtful Loans Management assesses the adequacy of the allowance for doubtful loans by performing evaluations of the loan portfolio, including such factors as the differing economic risks associated with each loan category, the nancial condition of borrowers, the economic environment, the level of delinquent
Notes to Consolidated Financial Statements(Continued)

18
loans, and the value of any collateral associated with the loans. In addition to general economic conditions and other factors described above, a detailed review of the aging of loans receivable is considered in management’s assessment. The level of the allowance is adjusted according to the results of management’s analysis.
Loans less than 120 days delinquent are deemed to have a minimal delay in payment and are generally not written off. Loans more than 120 days delinquent are subject to standard collection practices, including litigation. Only loans that are deemed uncollectible are written off, and this occurs only after several unsuccessful collection attempts, including placement at an external collection agency. Considering the other factors discussed herein, management considers the allowance for doubtful loans at June 30, 2015 and 2014, to be prudent and reasonable.
Educational and mortgage loans receivable at June 30, 2015 and 2014, are reported net of allowances for doubtful loans of $0.3 million and $0.9 million, respectively.
7. P RO M I S E S T O G I V E
At June 30, 2015 and 2014, the University had received from donors unconditional promises to give contributions of amounts receivable in the following periods:
(dollars in thousands) 2015 2014Less than one year $ 89,043 $ 95,907One to fi ve years 94,525 103,885More than fi ve years 14,319 22,501
Total 197,887 222,293Less unamortized discount and reserve 11,457 12,432
Net amount $ 186,430 $ 209,861
The amounts promised have been recorded after discounting the future cash ows to the present value. Current-year promises are included in revenue as additions to temporarily or permanently restricted net assets, as determined by the donors, and are included in contributions receivable at fair value based on observable ASC 820 Level 2 inputs.
In addition, at June 30, 2015, the University had received from donors promises to give of $11.4 million, conditioned upon the raising of matching gifts from other sources and other criteria. These amounts will be recognized as income in the periods in which the conditions have been ful lled.
8 . P RO P E R T Y
Land additions are reported at estimated market value at the date of gift, or on a cost basis. Buildings and improvements are stated at cost. Expenditures for operation and maintenance of physical plant are expensed as incurred.
Notes to Consolidated Financial Statements(Continued)

19
Items classi ed as property at June 30, 2015 and 2014, consisted of the following:
(dollars in thousands) 2015 2014Land $ 113,891 $ 108,910Buildings and improvements 3,815,443 3,513,322Construction in progress 353,023 364,110Equipment and systems 342,446 295,228Rare books 98,878 94,610Library books, periodicals, and bindings 281,844 275,488Fine art objects 126,805 118,079
Total property 5,132,330 4,769,747Accumulated depreciation (1,378,654) (1,268,204)
Total $ 3,753,676 $ 3,501,543
Equipment, library books, periodicals, and bindings are stated at cost net of accumulated depreciation. Equipment includes items purchased with federal government funds; an indeterminate portion of those items are expected to be transferred to the University at the termination of the respective grant or contract.
In addition to making purchases with University funds, the University, since its inception, has received a substantial number of ne art objects and rare books from individual gifts and bequests. Art objects and rare books acquired through June 30, 1973, are carried at insurable values at that date because it is not practicable to determine the historical cost or market value at the date of gift. Art objects and rare books acquired subsequent to June 30, 1973, are recorded at cost or fair value at the date of gift. Works of art, literary works, historical treasures and artifacts that are part of a collection are protected, preserved and held for public exhibition, education, and research in futherance of public service. Collections are not capitalized and contributed collection items are not recognized as revenues in the University's nancial statements.
The University uses componentized depreciation for buildings and building improvements used for research. The costs of research facilities are separated into building shell, service system, and xed equipment components that are separately depreciated.
Annual depreciation is calculated on the straight-line method over useful lives ranging from 15 to 50 years for buildings and improvements, 30 years for library books, and 10 and 15 years for equipment. Art objects and rare books having cultural, asthetic, or historical value are not depreciated.
9 . C O N D I T I O N A L A S S E T R E T I R E M E N T O B L I G AT I O N S
Under ASC 410-20, Asset Retirement and Environmental Obligations—Asset Retirement Obligations, companies must accrue for costs related to legal obligations to perform certain activities in connection with the retirement, disposal, or abandonment of assets. The obligation to perform the asset retirement activity is not conditional even though the timing or method may be conditional.
The University has identi ed asbestos abatement as a conditional asset retirement obligation. Asbestos abatement was estimated using site-speci c surveys where available and a per-square-foot estimate based on historical cost where surveys were unavailable. The estimate is recorded as a liability and as an increase to the asset, and the capitalized portion is depreciated over the remaining useful life of the asset. The asset retirement obligation included in accrued liabilities was $12.8 million and $14.8 million at June 30, 2015 and 2014, respectively, and accretion
Notes to Consolidated Financial Statements(Continued)

20
expense on the asset retirement obligation was $0.4 million and $0.5 million for the years ended June 30, 2015 and 2014, respectively.
10 . I N C O M E TA X E S
ASC 740, Income Taxes, prescribes the minimum recognition threshold a tax position must meet in connection with accounting for uncertainties in income tax positions taken or expected to be taken by an entity before being measured and recognized in the nancial statements. The University continues to evaluate its tax positions pursuant to the principles of ASC 740, and has determined that there is no material impact on the University’s nancial statements.
The University is a not-for-pro t organization as described in Section 501(c)(3) of the Internal Revenue Code and is exempt from income taxes on related income. The University les U.S. federal and various state and local tax returns. The statute of limitations on the University’s U.S. federal tax returns remains open for the years ended June 30, 2012, through the present.
11. D E F E R R E D R E V E N U E S
Deferred revenues primarily represent advance receipts relating to the University’s real estate leasing activities. Such amounts are amortized over the term of the related leases.
1 2 . I N D E B T E D N E S S T O T H I R D PA R T I E S
At June 30, 2015 and 2014, the University’s debt consisted of taxable bonds, taxable notes, loans through the New Jersey Educational Facilities Authority (NJEFA), commercial paper, various parent loans, and a note as follows:
(dollars in thousands) 2015 2014Taxable Revenue Bonds2009 Series A, 4.95% and 5.70%, due March 2019 and March 2039, net of unamortized
discount of $2,636 and $2,746 $ 997,364 $ 997,254
Taxable Notes
2012, 3.372%, due July 2042 170,000 170,0002013, 4.72%, due July 2044 75,000 75,000
NJEFA Revenue Bonds2003 Series D, 3.73%, due July 2019, including unamortized premium of $2,739 and $3,424 45,119 55,349
2005 Series A, 4.40%, due July 2030, including unamortized premium of $0.00 and $2,138 - 125,188
2005 Series B, 4.24% due July 2035, including unamortized premium of $0.00 and $1,271 - 70,076
2006 Series D, 4.39%, due July 2031, including unamortized premium of $603 and $641 58,258 60,745
2006 Series E, 4.50%, due July 2027, including unamortized premium of $57 and $62 91,727 91,887
2007 Series E, 4.53%, due July 2037, including unamortized premium of $3,781 and $3,953 278,866 286,103
2007 Series F, 4.39%, due July 2030, including unamortized premium of $599 and $639 67,354 67,529
2008 Series J, 4.39%, due July 2038, including unamortized premium of $3,620 and $3,778 224,355 229,883
2008 Series K, 4.36%, due July 2023, including unamortized premium of $3,961 and $4,456 124,766 139,616
2010 Series B, 4.03%, due July 2040, including unamortized premium of $10,137 and $10,543 241,207 246,558
2011 Series B, 4.09%, due July 2041, including unamortized premium of $14,179 and $14,724 250,929 256,094
2014 Series A, 3.77%, due July 2044, including unamortized premium of $18,613 and $19,255 218,613 219,255
2015 Series A, 2.32% due July 2035, including unamortized premium of $30,293 187,083 -
2015 Series D, 3.40% due July 2045, including unamortized premium of $19,793 169,793 -
Notes to Consolidated Financial Statements(Continued)

21
2015 2014NJEFA Dormitory Safety Trust Fund Bonds2001 Series A, due January 2016 832 1,664
NJEFA Capital Improvement Fund Bonds2005 Series A, 4.12%, 2000 Series A, 5.72%, due September 2020 702 823
2006 Series A, 4.42%, 2000 Series A, 5.72%, due September 2020 166 166
2014 Series B, 3.67%, due September 2033, including unamortized premium of $211 and $222 3,215 3,226
Commercial Paper
Taxable, .12% and .08% with maturities up to one year 5,700 65,200
Tax-exempt (NJEFA), .08% and .04% with maturities up to one year 59,000 24,500
Parent Loans, 0.5% to 5.4% with maturities up to nine years 43,489 44,562
Notes 906 1,075
Total $ 3,314,444 $ 3,231,753
The proceeds of NJEFA loans are used primarily to nance the costs of acquisition, construction, renovation and installation of capital assets of the University.
In May 2015 the University issued the 2015 Series A Bonds and the 2015 Series D Bonds. The 2015 Series A Bonds were issued for the purpose of the current refunding and defeasance of the 2005 Series A and 2005 Series B Bonds. The 2015 Series D Bonds were issued for the purpose of funding new construction and renovations, and for the refunding of portions of the taxable and tax-exempt commercial papers notes. The University is authorized by the Board of Trustees to issue new debt up to $350 million annually. The University intends to issue additional debt in the future.
The full faith and credit of the University is pledged in all loan agreements with the NJEFA.In scal 1999, the University entered into a loan facility with a national bank to fund its
parent loan program which is currently authorized by the Board of Trustees up to $100 million. Fixed or variable rates may be selected on a pass-through basis to the borrowers; terms may be as long as 14 years.
In scal year 1998, a commercial paper program was authorized as an initial step of nancing to provide construction funds for approved capital projects. The commercial paper proceeds are primarily used to nance construction expenditures until permanent nancing from gifts or other sources is made available. The program is currently authorized to a maximum level of $300 million.
Principal payments for each of the next ve years and thereafter on debt outstanding at June 30, 2015, excluding commercial paper, are as follows:
(dollars in thousands) Principal Payments2016 67,9812017 96,2882018 83,3682019 583,1512020 85,272Thereafter 2,227,733
Subtotal 3,143,793Unamortized premium 105,951
Net long-term debt $ 3,249,744
Notes to Consolidated Financial Statements(Continued)
22
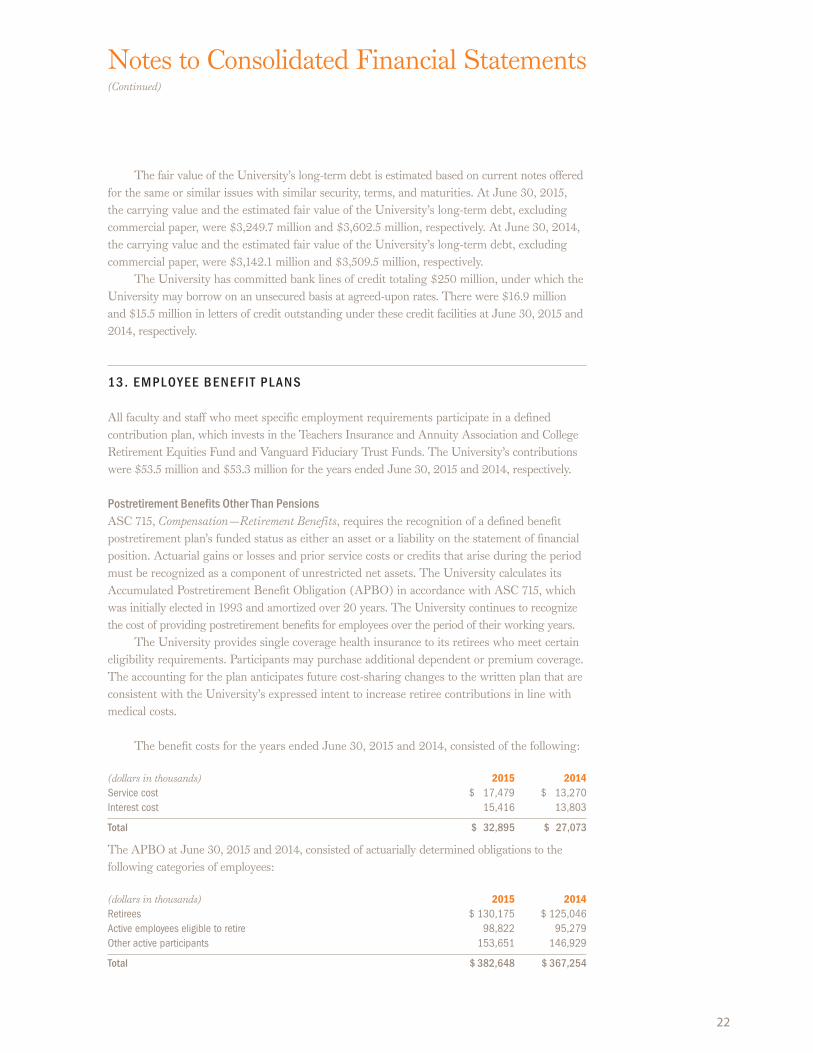
The fair value of the University’s long-term debt is estimated based on current notes offered for the same or similar issues with similar security, terms, and maturities. At June 30, 2015, the carrying value and the estimated fair value of the University’s long-term debt, excluding commercial paper, were $3,249.7 million and $3,602.5 million, respectively. At June 30, 2014, the carrying value and the estimated fair value of the University’s long-term debt, excluding commercial paper, were $3,142.1 million and $3,509.5 million, respectively.
The University has committed bank lines of credit totaling $250 million, under which the University may borrow on an unsecured basis at agreed-upon rates. There were $16.9 million and $15.5 million in letters of credit outstanding under these credit facilities at June 30, 2015 and 2014, respectively.
13 . E M P L O Y E E B E N E F I T P L A N S
All faculty and staff who meet speci c employment requirements participate in a de ned contribution plan, which invests in the Teachers Insurance and Annuity Association and College Retirement Equities Fund and Vanguard Fiduciary Trust Funds. The University’s contributions were $53.5 million and $53.3 million for the years ended June 30, 2015 and 2014, respectively.
Postretirement Benefits Other Than PensionsASC 715, Compensation—Retirement Benefits, requires the recognition of a de ned bene t postretirement plan’s funded status as either an asset or a liability on the statement of nancial position. Actuarial gains or losses and prior service costs or credits that arise during the period must be recognized as a component of unrestricted net assets. The University calculates its Accumulated Postretirement Bene t Obligation (APBO) in accordance with ASC 715, which was initially elected in 1993 and amortized over 20 years. The University continues to recognize the cost of providing postretirement bene ts for employees over the period of their working years.
The University provides single coverage health insurance to its retirees who meet certain eligibility requirements. Participants may purchase additional dependent or premium coverage. The accounting for the plan anticipates future cost-sharing changes to the written plan that are consistent with the University’s expressed intent to increase retiree contributions in line with medical costs.
The bene t costs for the years ended June 30, 2015 and 2014, consisted of the following:
(dollars in thousands) 2015 2014Service cost $ 17,479 $ 13,270Interest cost 15,416 13,803
Total $ 32,895 $ 27,073
The APBO at June 30, 2015 and 2014, consisted of actuarially determined obligations to the following categories of employees:
(dollars in thousands) 2015 2014Retirees $ 130,175 $ 125,046Active employees eligible to retire 98,822 95,279Other active participants 153,651 146,929
Total $ 382,648 $ 367,254
Notes to Consolidated Financial Statements(Continued)

23
Notes to Consolidated Financial Statements(Continued)
As of June 30, 2015 and 2014, the APBO was unfunded.An assumed discount rate of 4.5 percent and 4.25 percent was used to calculate the
APBO at June 30, 2015 and 2014, respectively. The assumed health care cost trend rate used to calculate the APBO at June 30, 2015 was 6.5 percent, declining by 0.3 percent per year until the long-term trend rate of 5.0 percent is reached for medical drug claims. For prescription drug claims, the assumed health care cost trend rate used to calculate the APBO at June 30, 2015 was 7.75 percent, declining by 0.55 percent per year until the long-term trend rate of 5.0 percent is reached. The assumed health care cost trend rate used to calculate the APBO at June 30, 2014 was 7.0 percent, declining by 0.4 percent per year until the long-term trend rate of 5.0 percent is reached, for both medical and prescription drug claims. An increase of 1 percent in the cost trend rate would raise the APBO to $465.8 million and $443.0 million and cause the service and interest cost components of the net periodic cost to be increased by $9.4 million and $6.7 million for the years ended June 30, 2015 and 2014, respectively. A decrease of 1 percent in the cost trend rate would decrease the APBO to $318.8 million and $308.6 million and cause the service and interest cost components of the net periodic cost to be decreased by $7.0 million and $5.0 million for the years ended June 30, 2015 and 2014, respectively.
Postretirement plan bene t payments for scal years 2016 through 2020 are expected to range from $8.8 million to $11.8 million per year, with aggregate expected payments of $73.5 million for scal years 2021 through 2025. These amounts re ect the total bene ts expected to be paid from the plan, net of the participants’ share of the cost and federal subsidies. Expected bene t payments are based on the same assumptions used to measure the bene t obligations and include estimated future employee service.
The University provides Medicare retiree drug coverage through an employer group waiver plan (EGWP). Under EGWP, the cost of drug coverage is offset through direct federal subsidies, brand name drug discounts and reinsurance reimbursements. The net effect of these subsidies has been recognized in the calculation of the University's postretirement bene t obligation as of June 30, 2015 and 2014.
14 . N E T A S S E T S
Net assets are categorized as unrestricted, temporarily restricted, and permanently restricted. Unrestricted net assets are derived from gifts and other institutional resources that are not subject to explicit donor-imposed restrictions. The unrestricted category also includes income and gains on these funds. Included in the total is the net investment in plant and equipment. Certain net assets classi ed as unrestricted for external reporting purposes are designated for speci c purposes or uses under the internal operating budget practices of the University. Restricted net assets are generally established by donors in support of schools or departments of the University, often for speci c purposes such as professorships, research, faculty support, scholarships and fellowships, athletics, the library, the art museum, building construction, and other speci c purposes. Temporarily restricted net assets include gifts, pledges, trusts and remainder interests, and income and gains that can be expended but for which restrictions have not yet been met. Such restrictions include purpose restrictions and time restrictions imposed by donors or implied by the nature of the gift, or by the interpretations of law. Temporary restrictions are normally released upon the passage of time or the incurrence of expenditures that

24
ful ll the donor-speci ed purpose. Permanently restricted net assets include gifts, pledges, trusts and remainder interests, and income and gains that are required by donor-imposed restrictions to be permanently retained. Investment earnings are spent for general or speci c purposes in accordance with donor wishes, based on the University’s endowment spending rule.
15 . N AT U R A L C L A S S I F I C AT I O N O F E X P E N S E S
Operating expenses incurred for the years ended June 30 were as follows:
(dollars in thousands) 2015 2014Salaries and wages $ 625,757 $ 583,475Employee benefi ts 180,712 223,713Purchased services 172,604 146,104Supplies and materials 107,843 64,467Space and occupancy 73,495 85,661Sub-recipient agreements 25,333 33,988Other expenses 17,765 67,503Other student aid 55,321 37,850Depreciation 138,838 127,040Interest 143,952 125,429
Total $ 1,541,620 $ 1,495,230
Certain prior-year balances have been reclassi ed to conform to the current year presentation.
16 . C O M M I T M E N T S A N D C O N T I N G E N C I E S
At June 30, 2015, the University had authorized major renovation and capital construction projectsfor more than $1,300.6 million. Of the total, approximately $491.1 million had not yet been expended.
Minimum operating lease commitments at June 30, 2015, for space and e quipment are as follows:
(dollars in thousands) Lease Payments2016 $ 6,5252017 6,5252018 6,5252019 6,5252020 6,765Thereafter 19,142
Total $ 52,007
The University has entered into certain agreements to guarantee the debt of others. Under these agreements, if the principal obligor defaults on the debt, the University may be required to satisfy all or part of the remaining obligation. The total amount of these guarantees was $21.9 million at June 30, 2015.
Notes to Consolidated Financial Statements(Continued)

25
The University is subject to certain legal claims that have arisen in the normal course of operations. In the opinion of management, the ultimate outcome of these actions will not have a material effect on the University’s nancial position, statement of activities, or cash ows.
17. S U B S E Q U E N T E V E N T S
The University has evaluated subsequent events through November 24, 2015, and determined that there were no subsequent events requiring adjustment or disclosure in the consolidated nancial statements.

Supplementary Information

Princeton University Supplemental Schedule of Expenditures of Federal Awards For the year ended June 30, 2015
The accompanying footnotes are an integral part of the Supplemental Schedule of Expenditures of Federal Awards
26
Federal Grantor/Pass Through Grantor/Program or Cluster TitleFederalCFDA
Pass Through IdentificationNumber Federal Expenditures
Research and Development ClusterDepartment of Energy Direct ProgramsOffice of Science Financial Assistance Program 81.049 11,514,732$Office of Science Financial Assistance Program ARRA 81.049 154,618University Coal Research 81.057 91,955Conservation Research and Development 81.086 350,170Renewable Energy Research and Development 81.087 302,635Fossil Energy Research and Development 81.089 576,453Stewardship Science Grant Program 81.112 588,192Advanced Research 81.135 512,165Subtotal Department of Energy Direct Programs 14,090,920
Department of Energy Pass Through ProgramsCalif Inst of Technology (Cal Tech) 81.049 DE SC0008634 21,023Southwest Sciences, Inc. 81.049 DE SC0011288 123,929Temple University 81.049 254998 54,353The Trustees of Columbia University 81.049 DESC0006613 (735)The Johns Hopkins University 81.049 DE FG02 08ER46544 133,931The University of Tulsa 81.049 DE SC0004125 75,204University of Arizona ARRA 81.049 DE SC00001084 3,473University of New Hampshire 81.049 DE SC0008655 17,279University of South Carolina 81.049 DE SC0001061 128,183University of Virginia 81.049 DE SC0001298 70,819Washington University 81.049 DE SC0001035 90,804Colorado State University, Fort Collins 81.087 DE EE0006086 20,997University of Delaware 81.087 DE EE0005366 3,750CSI Technologies 81.089 RES AGMT dtd 08 18 2014 100,377Purdue University 81.089 DE FE0011822 69,711The Pennsylvania State University 81.089 5089 PU DOE 3354 61,079University of South Carolina 81.089 DE FE0012005 66,370Cornell University 81.112 DE NA0001836 124,485University of Michigan 81.113 DE NA0002534 167,578Siemens Power Generation 81.134 DE FC26 05NT42644 180,526Vorbeck Materials 81.135 DE AR0000319 103,395Battelle Pacific Northwest Ntl Labs 81. 246370 32,160Brookhaven National Laboratory 81. DE AC02 98 CH10886 106,773Fermi National Accelerator Laboratory 81. DE AC02 07CH11359 151,732Fermi National Accelerator Laboratory 81. DEAC0276 CH 03000 8,158Princeton Plasma Physics Laboratory 81. 04655 77,337Sandia National Laboratories 81. 1317246 145,603URS Energy and Construction Inc. 81. DE FE0004000 119,013UT Battelle, LLC 81. DE AC05 00OR22725 89,770
Subtotal Department of Energy Pass Through Programs 2,347,077
Total Department of Energy 16,437,997
93.089 562,205
93.095 77,962Oral Diseases and Disorders Research 93.121 112,992Human Genome Research 93.172 858,781Research Related to Deafness and Communication Disorders 93.173 219,867Mental Health Research Grants 93.242 1,930,012Trans NIH Research Support 93.310 1,564,601Cancer Cause and Prevention Research 93.393 226,058Cancer Biology Research 93.396 843,703
Department of Health and Human Services National Institutes of Health Direct Programs
Emergency System for Advance Registration of Volunteer Health Professionals
HHS Programs for Disaster Relief Appropriations Act Non Construction
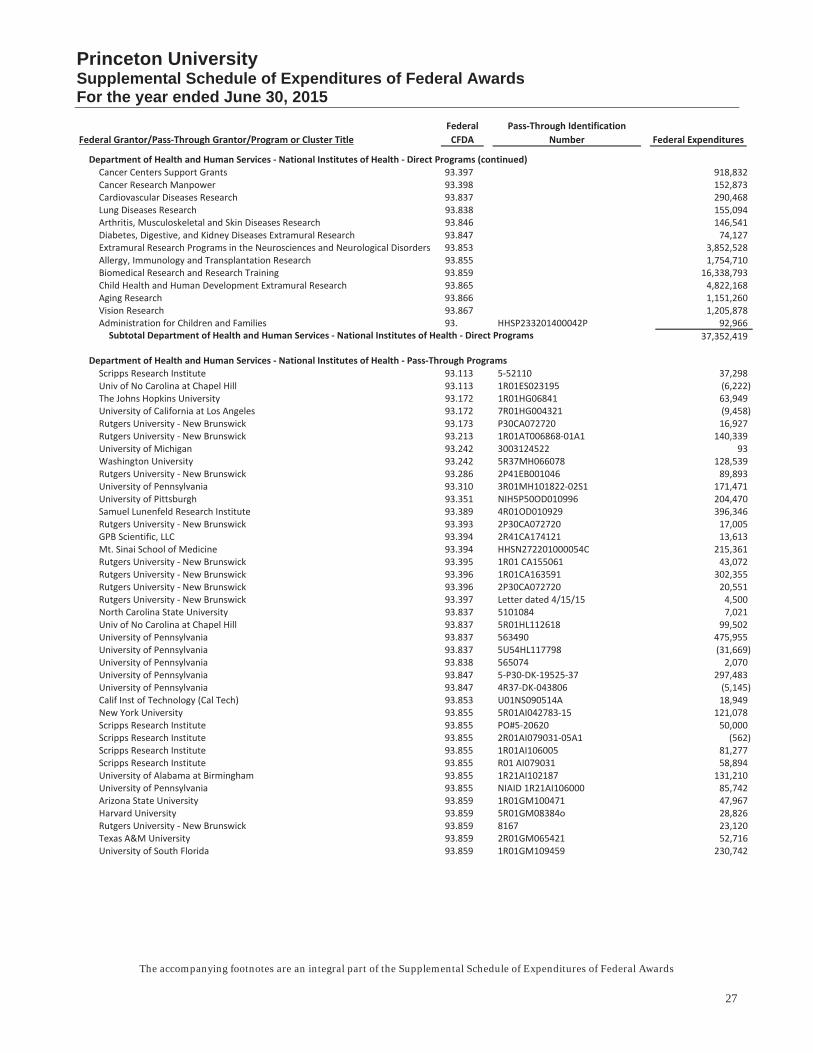
Princeton University Supplemental Schedule of Expenditures of Federal Awards For the year ended June 30, 2015
The accompanying footnotes are an integral part of the Supplemental Schedule of Expenditures of Federal Awards
27
Federal Grantor/Pass Through Grantor/Program or Cluster TitleFederalCFDA
Pass Through IdentificationNumber Federal Expenditures
Cancer Centers Support Grants 93.397 918,832Cancer Research Manpower 93.398 152,873Cardiovascular Diseases Research 93.837 290,468Lung Diseases Research 93.838 155,094Arthritis, Musculoskeletal and Skin Diseases Research 93.846 146,541Diabetes, Digestive, and Kidney Diseases Extramural Research 93.847 74,127Extramural Research Programs in the Neurosciences and Neurological Disorders 93.853 3,852,528Allergy, Immunology and Transplantation Research 93.855 1,754,710Biomedical Research and Research Training 93.859 16,338,793Child Health and Human Development Extramural Research 93.865 4,822,168Aging Research 93.866 1,151,260Vision Research 93.867 1,205,878Administration for Children and Families 93. HHSP233201400042P 92,966
37,352,419
Scripps Research Institute 93.113 5 52110 37,298Univ of No Carolina at Chapel Hill 93.113 1R01ES023195 (6,222)The Johns Hopkins University 93.172 1R01HG06841 63,949University of California at Los Angeles 93.172 7R01HG004321 (9,458)Rutgers University New Brunswick 93.173 P30CA072720 16,927Rutgers University New Brunswick 93.213 1R01AT006868 01A1 140,339University of Michigan 93.242 3003124522 93Washington University 93.242 5R37MH066078 128,539Rutgers University New Brunswick 93.286 2P41EB001046 89,893University of Pennsylvania 93.310 3R01MH101822 02S1 171,471University of Pittsburgh 93.351 NIH5P50OD010996 204,470Samuel Lunenfeld Research Institute 93.389 4R01OD010929 396,346Rutgers University New Brunswick 93.393 2P30CA072720 17,005GPB Scientific, LLC 93.394 2R41CA174121 13,613Mt. Sinai School of Medicine 93.394 HHSN272201000054C 215,361Rutgers University New Brunswick 93.395 1R01 CA155061 43,072Rutgers University New Brunswick 93.396 1R01CA163591 302,355Rutgers University New Brunswick 93.396 2P30CA072720 20,551Rutgers University New Brunswick 93.397 Letter dated 4/15/15 4,500North Carolina State University 93.837 5101084 7,021Univ of No Carolina at Chapel Hill 93.837 5R01HL112618 99,502University of Pennsylvania 93.837 563490 475,955University of Pennsylvania 93.837 5U54HL117798 (31,669)University of Pennsylvania 93.838 565074 2,070University of Pennsylvania 93.847 5 P30 DK 19525 37 297,483University of Pennsylvania 93.847 4R37 DK 043806 (5,145)Calif Inst of Technology (Cal Tech) 93.853 U01NS090514A 18,949New York University 93.855 5R01AI042783 15 121,078Scripps Research Institute 93.855 PO#5 20620 50,000Scripps Research Institute 93.855 2R01AI079031 05A1 (562)Scripps Research Institute 93.855 1R01AI106005 81,277Scripps Research Institute 93.855 R01 AI079031 58,894University of Alabama at Birmingham 93.855 1R21AI102187 131,210University of Pennsylvania 93.855 NIAID 1R21AI106000 85,742Arizona State University 93.859 1R01GM100471 47,967Harvard University 93.859 5R01GM08384o 28,826Rutgers University New Brunswick 93.859 8167 23,120Texas A&M University 93.859 2R01GM065421 52,716University of South Florida 93.859 1R01GM109459 230,742
Department of Health and Human Services National Institutes of Health Direct Programs (continued)
Department of Health and Human Services National Institutes of Health Pass Through Programs
Subtotal Department of Health and Human Services National Institutes of Health Direct Programs

Princeton University Supplemental Schedule of Expenditures of Federal Awards For the year ended June 30, 2015
The accompanying footnotes are an integral part of the Supplemental Schedule of Expenditures of Federal Awards
28
Federal Grantor/Pass Through Grantor/Program or Cluster TitleFederalCFDA
Pass Through IdentificationNumber Federal Expenditures
Virginia Polytechnic Inst & State Univ 93.859 1R01GM105245 20,467The Trustees of Columbia University 93.865 1R01HD066054 37,368The Research Foundation S.U.N.Y. 93.865 1R01HD073352 70,473Univ of No Carolina at Chapel Hill 93.865 5R21HD073044 71,530Univ of TX Southwestern Medical Ctr 93.865 5R01HD066219 22,229Duke University 93.866 5R01 AG034513 67,488Duke University 93.866 1P01 AG031719 26,805National Bureau of Economic Research 93.866 R01 AG040629 88,235University of Michigan 93.866 1R01AG047167 21,107Rutgers University New Brunswick 93.867 P30CA072720 26,931
4,077,911
41,430,330
National Science Foundation Direct ProgramsEngineering Grants 47.041 6,678,717Mathematical and Physical Sciences 47.049 26,476,216Geosciences 47.050 4,990,586Computer and Information Science and Engineering 47.070 6,630,675Biological Sciences 47.074 2,802,347Social, Behavioral, and Economic Sciences 47.075 1,219,266Education and Human Resources 47.076 4,148,807Polar Programs 47.078 358,519Office of Cyberinfrastructure 47.080 708,657Trans NSF Recovery Act Reasearch Support ARRA 47.082 29,733Subtotal National Science Foundation Direct Programs 54,043,523
National Science Foundation Pass Through ProgramsNational Science Foundation 47. IPA Agreement dtd 8 13 14 98,813Massachusetts Institute of Technology 47.041 CBET 0939511 122,769Tiger Optics (MEECO) 47.041 1347523 57,466University of Minnesota 47.041 EFRI 0937706 68,109University of Virginia 47.041 CBET 1134397 28,118Assn of Univ for Rsrch in Astronomy, Inc 47.049 1202910 500,854California State University, Northridge 47.049 1205734 37,428Cornell University 47.049 CHE 1124754 66,336Emory University 47.049 CHE 1205646 115,831Harvard University 47.049 ARO W911NF 11 1 0036 344,489National Optical Astronomy Observatory 47.049 AST 0551161 81,235New York University 47.049 F6228 01 104,824Texas Tech University 47.049 CHE 1308726 6,581The Johns Hopkins University 47.049 PHY 0969510 89,410University of Wisconsin 47.049 0821899 540,914Consortium for Ocean Leadership 47.050 SAF 14 05 18,879Harvard University 47.050 112469 5094103 5,065Pomona College 47.050 OCE 1234664 18,325University of California at Davis 47.050 EAR 0949446 117,597University of California at Davis 47.050 PLR 1246151 5,582University of Southern California 47.050 54026888 23,103University of Southern California 47.050 S3898453 18,117University of Southern California 47.050 EAR 1226343 22,305Purdue University 47.070 CCF 0939370 641,142Rutgers University New Brunswick 47.070 CNS 1247764 66,342Indiana University 47.075 BCS 1115009 65,412New York University 47.075 BCS 1226942 39,880
Department of Health and Human Services National Institutes of Health Pass Through Programs (continued)
Subtotal Department of Health and Human Services National Institutes of Health Pass Through Programs
Total Department of Health and Human Services National Institutes of Health Programs

Princeton University Supplemental Schedule of Expenditures of Federal Awards For the year ended June 30, 2015
The accompanying footnotes are an integral part of the Supplemental Schedule of Expenditures of Federal Awards
29
Federal Grantor/Pass Through Grantor/Program or Cluster TitleFederalCFDA
Pass Through IdentificationNumber Federal Expenditures
National Science Foundation Pass Through Programs (continued)Consort Univ for Rsrch in Earthquake Eng 47.076 0840185 (1,829)Rutgers University New Brunswick 47.076 DGE 0903661 160,642Louisiana State University (LSU) 47.080 OCI 0905046 (13,920)Woods Hole Oceanographic Institute 47. 119245 60,864Subtotal National Science Foundation Pass Through Programs 3,510,683
Total National Science Foundation Programs 57,554,206
National Aeronautics and Space Administration Direct ProgramsScience 43.001 5,324,432Organized Research 43.002 36,958Space Operations 43.007 4,000Education 43.008 119,702Cross Agency Support 43.009 128,890Office of Inspector General 43.011 43,406
Subtotal National Aeronautics and Space Administration Direct Programs5,657,388
National Aeronautics and Space Administration Pass Through ProgramsCal Tech Jet Propulsion Lab (JPL) 43.001 1500093 15,797Cal Tech Jet Propulsion Lab (JPL) 43.001 NNN12AA01C 9,160Indiana University 43.001 NNX11AJ01G 113,014Massachusetts Institute of Technology 43.001 NNX13AI40G 49,270Michigan State University 43.001 NNX13AI44G 13,386Smithsonian Astrophysical Observatory 43.001 NAS8 03060 128,535Smithsonian Astrophysical Observatory 43.001 NASA AR3 14016A 1,431Spectral Energies LLC 43.001 SB1407 001 1 36,000The Trustees of Columbia University 43.001 NNX12AF15G 56,859The Johns Hopkins University 43.001 NNX11AF49G 9,313University of Iowa 43.001 NNX13AG94G 65,177University of Maryland 43.001 20574 Z6936001 31,723University of Maryland 43.001 NNX10AB71G 42,539University of New Hampshire 43.001 NNX10AC04G 1,054University of Washington 43.001 NNX13AK45A 30,862Cal Tech Jet Propulsion Lab (JPL) 43. NNN12AA01C 255,355Cal Tech Jet Propulsion Lab (JPL) 43. 1513640 15,861Cal Tech Jet Propulsion Lab (JPL) 43. NM0710834 72,782Cal Tech Jet Propulsion Lab (JPL) 43. NM0711043 (518)Cal Tech Jet Propulsion Lab (JPL) 43. NMO710846 25,524Cal Tech Jet Propulsion Lab (JPL) 43. NMO711048 98,453Cal Tech Jet Propulsion Lab (JPL) 43. 1499194 274,082KalScott Engineering Inc. 43. NNX14CA35P 37,221Massachusetts Institute of Technology 43. NNG14FC03C 150,066Space Telescope Science Institute 43. NAS5 26555 575,594
2,108,540
Total National Aeronautics and Space Administration Programs 7,765,928
Subtotal National Aeronautics and Space Administration Pass Through Programs
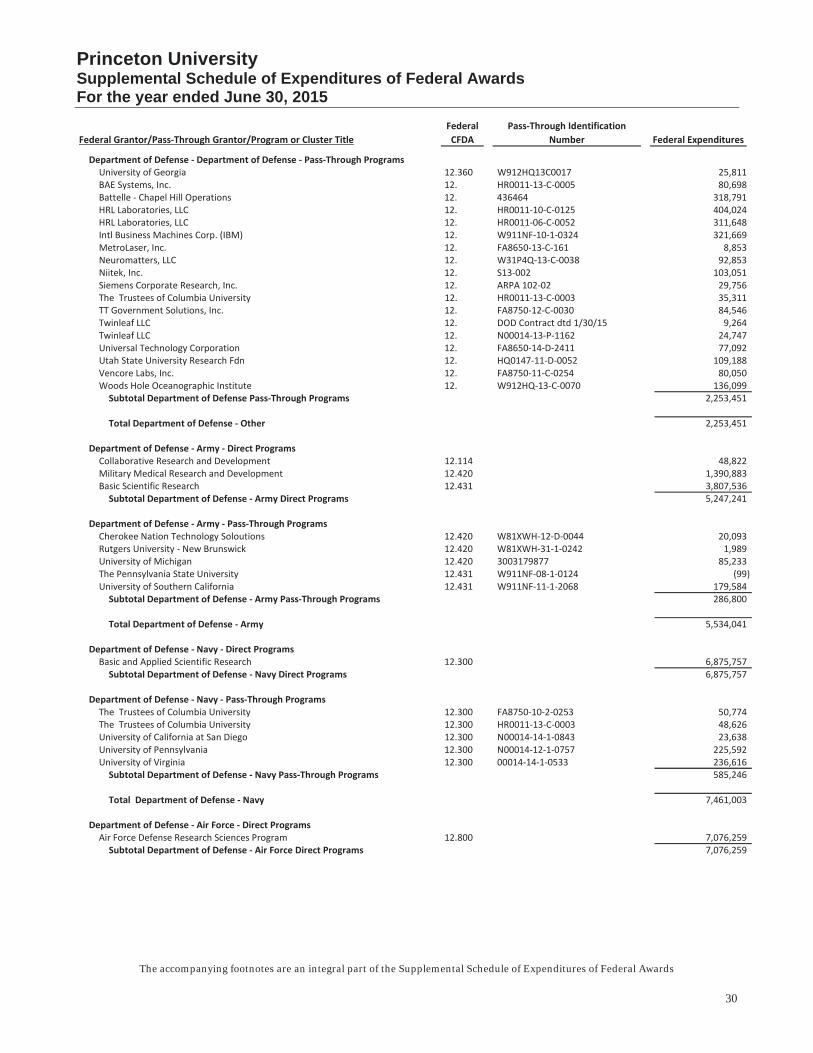
Princeton University Supplemental Schedule of Expenditures of Federal Awards For the year ended June 30, 2015
The accompanying footnotes are an integral part of the Supplemental Schedule of Expenditures of Federal Awards
30
Federal Grantor/Pass Through Grantor/Program or Cluster TitleFederalCFDA
Pass Through IdentificationNumber Federal Expenditures
Department of Defense Department of Defense Pass Through ProgramsUniversity of Georgia 12.360 W912HQ13C0017 25,811BAE Systems, Inc. 12. HR0011 13 C 0005 80,698Battelle Chapel Hill Operations 12. 436464 318,791HRL Laboratories, LLC 12. HR0011 10 C 0125 404,024HRL Laboratories, LLC 12. HR0011 06 C 0052 311,648Intl Business Machines Corp. (IBM) 12. W911NF 10 1 0324 321,669MetroLaser, Inc. 12. FA8650 13 C 161 8,853Neuromatters, LLC 12. W31P4Q 13 C 0038 92,853Niitek, Inc. 12. S13 002 103,051Siemens Corporate Research, Inc. 12. ARPA 102 02 29,756The Trustees of Columbia University 12. HR0011 13 C 0003 35,311TT Government Solutions, Inc. 12. FA8750 12 C 0030 84,546Twinleaf LLC 12. DOD Contract dtd 1/30/15 9,264Twinleaf LLC 12. N00014 13 P 1162 24,747Universal Technology Corporation 12. FA8650 14 D 2411 77,092Utah State University Research Fdn 12. HQ0147 11 D 0052 109,188Vencore Labs, Inc. 12. FA8750 11 C 0254 80,050Woods Hole Oceanographic Institute 12. W912HQ 13 C 0070 136,099Subtotal Department of Defense Pass Through Programs 2,253,451
Total Department of Defense Other 2,253,451
Department of Defense Army Direct ProgramsCollaborative Research and Development 12.114 48,822Military Medical Research and Development 12.420 1,390,883Basic Scientific Research 12.431 3,807,536Subtotal Department of Defense Army Direct Programs 5,247,241
Department of Defense Army Pass Through ProgramsCherokee Nation Technology Soloutions 12.420 W81XWH 12 D 0044 20,093Rutgers University New Brunswick 12.420 W81XWH 31 1 0242 1,989University of Michigan 12.420 3003179877 85,233The Pennsylvania State University 12.431 W911NF 08 1 0124 (99)University of Southern California 12.431 W911NF 11 1 2068 179,584Subtotal Department of Defense Army Pass Through Programs 286,800
Total Department of Defense Army 5,534,041
Department of Defense Navy Direct ProgramsBasic and Applied Scientific Research 12.300 6,875,757Subtotal Department of Defense Navy Direct Programs 6,875,757
Department of Defense Navy Pass Through ProgramsThe Trustees of Columbia University 12.300 FA8750 10 2 0253 50,774The Trustees of Columbia University 12.300 HR0011 13 C 0003 48,626University of California at San Diego 12.300 N00014 14 1 0843 23,638University of Pennsylvania 12.300 N00014 12 1 0757 225,592University of Virginia 12.300 00014 14 1 0533 236,616Subtotal Department of Defense Navy Pass Through Programs 585,246
Total Department of Defense Navy 7,461,003
Department of Defense Air Force Direct ProgramsAir Force Defense Research Sciences Program 12.800 7,076,259Subtotal Department of Defense Air Force Direct Programs 7,076,259

Princeton University Supplemental Schedule of Expenditures of Federal Awards For the year ended June 30, 2015
The accompanying footnotes are an integral part of the Supplemental Schedule of Expenditures of Federal Awards
31
Federal Grantor/Pass Through Grantor/Program or Cluster TitleFederalCFDA
Pass Through IdentificationNumber Federal Expenditures
Department of Defense Air Force Pass Through ProgramsClear Science Corporation 12.800 FA9550 13 C 0012 77,005Florida State University 12.800 FA9550 14 1 0289 39,222Georgia Institute of Technology 12.800 FA9550 14 1 0051 93,792Kansas State University 12.800 FA9550 09 1 0138 4,383Ohio State University 12.800 FA9550 10 1 0533 357,133Ohio State University 12.800 FA9550 09 1 0602 113,676Rice University 12.800 FA9550 14 1 0268 49,084Stanford University 12.800 FA9550 09 1 0593 175,908Stanford University 12.800 FA9550 14 1 0017 550,039The Aerospace Corporation 12.800 4600005310 39,060The Pennsylvania State University 12.800 FA9550 13 1 0004 442,475University of California at San Diego 12.800 FA9550 10 1 0572 520,086University of Rhode Island 12.800 FA9453 12 C 0208 270,685University of Southern California 12.800 FA9550 11 1 0217 10,188University of Toronto 12.800 FA9550 13 1 0005 127,059Subtotal Department of Defense Air Force Pass Through Programs 2,869,795
Total Department of Defense Air Force 9,946,054
Department of Defense Secretary of Defense Direct ProgramsBasic Scientific Research Combating Weapons of Mass Destruction 12.351 207,563Subtotal Department of Defense Secretary of Defense Direct Programs 207,563
Department of Defense Secretary of Defense Pass Through ProgramsUniversity of Texas at El Paso 12.630 W911NF 13 1 0156 42,918Subtotal Department of Defense Secretary of Defense Pass Through Programs 42,918
Total Department of Defense Secretary of Defense 250,481
Department of Defense National Security Agency Direct ProgramsMathematical Sciences Grants Program 12.901 (386)Subtotal Department of Defense National Security Agency Direct Programs (386)
Total Department of Defense National Security Agency (386)
Department of Defense Advanced Research Projects Agency Direct ProgramsResearch and Technology Development 12.910 3,650,648Subtotal Department of Defense Advanced Research Projects Agency Direct Programs 3,650,648
Department of Defense Advanced Research Projects Agency Pass Through ProgramsBBN Technologies 12.910 N66001 11 C 4017 9,109Duke University 12.910 D12AP200025 301,520Massachusetts Institute of Technology 12.910 HR0011 13 2 0005 216,950TT Government Solutions, Inc. 12.910 FA8750 11 C 0254 111,734University of IL at Urbana Champaign 12.910 N66001 11 2 4206 57,932University of Michigan 12.910 HR0011 13 3 0002 958,080University of Wisconsin 12.910 HR0011 12 2 0019 52,026Subtotal Department of Defense Advanced Research Projects Agency Pass Through Programs 1,707,351
Total Department of Defense Advanced Research Projects Agency 5,357,999
Office of Personnel Management Direct ProgramsIntergovernmental Personnel Act (IPA) Mobility Program 27.011 17,812Subtotal Office of Personnel Management Direct Programs 17,812
Total Office of Personnel Management 17,812

Princeton University Supplemental Schedule of Expenditures of Federal Awards For the year ended June 30, 2015
The accompanying footnotes are an integral part of the Supplemental Schedule of Expenditures of Federal Awards
32
Federal Grantor/Pass Through Grantor/Program or Cluster TitleFederalCFDA
Pass Through IdentificationNumber Federal Expenditures
Department of Commerce Direct ProgramsClimate and Atmospheric Research 11.431 957,961
11.432 3,779,661
11.483 619,947Measurement and Engineering Research and Standards 11.609 102,383Science, Technology, Business and/or Education Outreach 11.620 2,750Subtotal Department of Commerce Direct Programs 5,462,702
Department of Commerce Pass Through ProgramsNew Jersey Sea Grant Extension Program 11.417 6312 0000 17,571University of Pennsylvania 11.431 NA11OAR4310101 10,092Subtotal Department of Commerce Pass Through Programs 27,663
Total Department of Commerce 5,490,365
National Endowment for the Humanities Direct ProgramsNational Endowment for the Humanities 45.149 9,028Museums for America 45.301 37,967Subtotal National Endowment for the Humanities Direct Programs 46,995
Total National Endowment for the Humanities 46,995
Department of Education Direct ProgramsOverseas Programs Doctoral Dissertation Research Abroad 84.022 6,579Jacob K. Javits Fellowship Program 84.170 61,136Subtotal Department of Education Direct Programs 67,715
Department of Education Pass Through ProgramsRider University 84.367 CCALL 1415 26,299Subtotal Department of Education Pass Through Programs 26,299
Total Department of Education 94,014
Environmental Protection Agency Direct ProgramsP3 Award: National Student Design Competition for Sustainability 66.516 75,734Subtotal Environmental Protection Agency Direct Programs 75,734
Total Environmental Protection Agency 75,734
Department of Transportation Direct ProgramsAviation Research Grants 20.108 201,087Federal Highway Admin (DOT/FHWA) 20.205 194,764Subtotal Department of Transportation Direct Programs 395,851
Department of Transportation Pass Through ProgramsRutgers University 20.701 DTRT12 G UTC16 75,960Subtotal Department of Transportation Pass Through Programs 75,960
Total Department of Transportation 471,811
Department of the Interior Direct ProgramsU.S. Geological Survey 15.807 70,408Subtotal Department of the Interior Direct Programs 70,408
Total Department of the Interior 70,408
National Oceanic and Atmospheric Administration (NOAA) Cooperative Institutes
National Oceanic and Atmospheric Administration (NOAA) Disaster Relief

Princeton University Supplemental Schedule of Expenditures of Federal Awards For the year ended June 30, 2015
The accompanying footnotes are an integral part of the Supplemental Schedule of Expenditures of Federal Awards
33
Federal Grantor/Pass Through Grantor/Program or Cluster TitleFederalCFDA
Pass Through IdentificationNumber Federal Expenditures
National Archives and Records Administration Direct ProgramsNational Historical Publications and Records Grants 89.003 121,588Subtotal National Archives and Records Administration Direct Programs 121,588
Total National Archives and Records Administration 121,588
Department of Homeland Security Direct ProgramsScientific Leadership Awards 97.062 43,720U.S. Department of Homeland Security 97. HSHQDC 12 C 00058 320,609Subtotal Department of Homeland Security Direct Programs 364,329
Total Department of Homeland Security 364,329
Department of Agriculture Direct ProgramsAgriculture and Food Research Initiative (AFRI) 10.310 221,211Forestry Research 10.652 20,015Subtotal Department of Agriculture Direct Programs 241,226
Department of Agriculture Pass Through ProgramsChapman University 10.310 2011 67004 30224 25,704University of Kentucky 10.592 3048107834 14 099 37,785Subtotal Department of Agriculture Pass Through Programs 63,489
Total Department of Agriculture 304,715
U.S. Department of State Direct ProgramsGeneral Department of State Assistance 19.700 80,822Subtotal U.S. Department of State Direct Programs 80,822
Total U.S. Department of State 80,822
Corporation for National and Community Service Direct Programs:AmeriCorps 94.006 6,396Subtotal Corporation for National and Community Service Direct Programs 6,396
Total Corporation for National and Community Service 6,396
U.S. Department of Justice Direct ProgramsFederal Bureau of Investigation 16. DJF 15 1200 K 0001731 157,566Subtotal U.S. Department of Justice Direct Programs 157,566
Total U.S. Department of Justice 157,566
U.S. Institute of Peace Direct Programs:Annual Grant Competition 91.001 39,750Subtotal U.S. Institute of Peace Direct Programs 39,750
Total U.S. Institute of Peace 39,750
161,333,409$Total Research and Development Cluster

Princeton University Supplemental Schedule of Expenditures of Federal Awards For the year ended June 30, 2015
The accompanying footnotes are an integral part of the Supplemental Schedule of Expenditures of Federal Awards
34
Federal Grantor/Pass Through Grantor/Program or Cluster TitleFederalCFDA
Pass Through IdentificationNumber Federal Expenditures
Other Programs
Department of Energy Pass Through ProgramsNational Nuclear Security Administration 81.123 DOE CSGF 223,804Fermi National Accelerator Laboratory 81. DE AC02 07CH11359 37,031Subtotal Department of Energy Pass Through Programs 260,835
Total Other Programs Department of Energy 260,835
Human Genome Research 93.172 450,325Mental Health Research Grants 93.242 382,623Child Health and Human Development Extramural Research 93.865 234,128Subtotal Department of Health and Human Services National Institutes of Health Direct Programs 1,067,076
Total Other Programs Department of Health and Human Services National Institutes of Health 1,067,076
Department of Defense Department of Defense Pass Through ProgramsAmerican Society for Engineering Educ 12. NDSEG 09 10 530,480Subtotal Department of Defense Pass Through Programs 530,480
Total Department of Defense Other 530,480
Department of Defense Army Direct ProgramsBasic Scientific Research 12.431 142,649Subtotal Department of Defense Army Direct Programs 142,649
Total Other Programs Department of Defense Army 142,649
Department of Defense National Security Agency Direct ProgramsMathematical Sciences Grants Program 12.901 15,678Subtotal Department of Defense National Security Agency Direct Programs 15,678
Total Other Programs Department of Defense National Security Agency 15,678
Department of Education Direct ProgramsNational Resource Centers Program for Foreign Language 84.015 171,088Subtotal Department of Education Direct Programs 171,088
Total Other Programs Department of Education 171,088
Environmental Protection Agency Direct ProgramsScience To Achieve Results (STAR) Fellowship Program 66.514 20,965Subtotal Environmental Protection Agency Direct Programs 20,965
Total Other Programs Environmental Protection Agency 20,965
U.S. Department of State Direct ProgramsPublic Diplomacy Programs 19.040 1,698Subtotal U.S. Department of State Direct Programs 1,698
Total Other Programs U.S. Department of State 1,698
2,210,469$
Department of Health and Human Services National Institutes of Health Direct Programs
Total Other Direct Programs

Princeton University Supplemental Schedule of Expenditures of Federal Awards For the year ended June 30, 2015
The accompanying footnotes are an integral part of the Supplemental Schedule of Expenditures of Federal Awards
35
Federal Grantor/Pass Through Grantor/Program or Cluster TitleFederalCFDA
Pass Through IdentificationNumber Federal Expenditures
Student Financial Assistance Cluster:Federal Supplemental Educational Opportunity Grants 84.007 1,234,391Federal Work Study Program 84.033 1,075,175Federal Perkins Loan (FPL) Outstanding 84.038 5,150,366Federal Pell Grant Program 84.063 3,314,393Federal Direct Student Loans 84.268 2,421,137Total Student Financial Assistance Programs 13,195,462
Total Student Financial Assistance Cluster: 13,195,462$
176,739,340$Total Federal Awards

Princeton University Supplemental Schedule of Expenditures of State of New Jersey Awards Year Ended June 30, 2015
The accompanying footnotes are an integral part of the Supplemental Schedule of Expenditures of State of New Jersey Awards
36
State Grantor / Program Title
Grant No./ReferenceNumber
AwardAmount Grant Period
Current YearExpenditures
Life to DateExpenditures
Research & Development:
New Jersey Department of Health and Senior Services
New Jersey Commission on Brain Injury Research
NJ Commission on Brain Injury Research CBIR12FE1031 225,936 6/1/2012 5/31/2016 70,896 213,181NJ Commission on Brain Injury Research CBIR14FEL007 69,936 5/30/2014 5/29/2017 67,153 67,153NJ Commission on Brain Injury Research CBIR15FELL004 33,500 6/1/2015 5/31/2018 2,000 2,000NJ Dept of Health and Senior Services DFHS13CRP023 91,000 7/1/2012 12/31/2014 20,500 91,000
Total New Jersey Commission on Brain Injury Research $ 420,372 $ 160,549 $ 373,334
New Jersey Commission on Cancer Research (NJCCR):
NJ Commission on Cancer Research DFHS13CRP005 91,000 6/30/2012 12/31/2014 17,082 91,000NJ Commission on Cancer Research DFHS13PPC044 50,000 4/1/2013 9/30/2015 3,866 24,399NJ Commission on Cancer Research DFHS13PPC046 100,000 4/1/2013 9/30/2015 24,000 100,000NJ Commission on Cancer Research DFHS13PPC052 100,000 4/1/2013 9/30/2015 53,208 93,278NJ Commission on Cancer Research DFHS14PPC047 100,000 7/1/2013 8/31/2015 39,679 87,689NJ Commission on Cancer Research DFHS15PPC006 100,000 1/1/2015 12/31/2016 20,667 20,667NJ Commission on Cancer Research DFHS15PPC023 50,000 1/1/2015 12/31/2016 10,267 10,267NJ Commission on Cancer Research DFHS15PPC021 100,000 1/1/2015 12/31/2016 22,367 22,367
Total New Jersey Commission on Cancer Research $ 691,000 $ 191,135 $ 449,666
Total Research and Development $ 1,111,372 $ 351,684 $ 823,000
Other Programs:
New Jersey Department of State
New Jersey Council on the Arts
NJ State Council on the Arts 1505X02130 $ 30,000 7/1/2014 6/30/2015 $ 30,000 $ 30,000
Total Other Programs $ 30,000 $ 30,000 $ 30,000
Student Financial Aid:
New Jersey Higher Education Student Assistance Authority
Total NJ Student Aid None 541,687 INDEFINITE 541,687 541,687
Total Student Financial Aid $ 541,687 $ 541,687 $ 541,687
Total New Jersey State Awards $ 1,683,059 $ 923,371 $ 1,394,687
Princeton University Notes to Schedules of Expenditures of Federal and State Awards Year Ended June 30, 2015
37
1. Basis of Presentation
The accompanying Supplemental Schedule of Expenditures of Federal Awards and Supplemental Schedule of Expenditures of State of New Jersey Awards (the “Schedules”) have been prepared in accordance with OMB Circular A-133, Audits of States, Local Governments, and Non-Profit Organizations and the State of New Jersey Department of the Treasury Circular 04-04 OMB, Single Audit Policy for Recipients of Federal Grants, State Grants and State Aid, as applicable. The purpose of the Schedules is to present a summary of the activities of Princeton University (the “University”) for the year ended June 30, 2015, which have been financed by the U.S. Government and the State of New Jersey, respectively. For purposes of the Schedules, federal and state awards include all federal and state financial assistance relationships entered into directly between the University and the federal government or the State of New Jersey and sub awards from nonfederal and nonstate organizations made under federally or state sponsored agreements. Negative amounts listed on the Schedule of Expenditures of Federal Awards represent adjustments, in the normal course of business, to amounts included on the prior year’s Schedule of Expenditures of Federal Awards. The pass-through contract number on the Schedule of Expenditures of Federal Awards represents the identification number assigned by the prime to the applicable program. CFDA numbers and pass-through numbers are provided when applicable. Certain awards reference an internal management identifier when no sponsor identifier is available. Because the Schedules present only a selected portion of the activities of the University, they are not intended to and do not present either the financial position, changes in net assets or cash flows of the University.
Consistent with the provisions of OMB Circular A-133, the Schedule of Expenditures of Federal Awards does not include expenditures of the Princeton Plasma Physics Laboratory (“PPPL”) that were funded by Department of Energy (“DOE”) contract. The PPPL, a national laboratory operated and managed by the University under contract directly with DOE, represents a government-owned, contractor operated (GOCO) facility. GOCOs are excluded from the provisions of the OMB Circular A-133 (paragraph 105).
The accounting principles followed by the University in preparing the Schedules are as follows:
Sponsored Research (Research and Development) and Other Awards–Expenditures for direct costs are recognized as incurred using the accrual method of accounting and the cost accounting principles contained in the U.S. Office of Management and Budget Circular A21, Cost Principles for Educational Institutions or Uniform Guidance as applicable. Under those cost principles, expenditures also include a portion of costs associated with general University activities (indirect costs) which are allocated to federal and state awards under negotiated formulas commonly referred to as facilities and administrative cost rates.
Student Financial Assistance–Expenditures are recognized on the accrual basis for both awards made to students and allowable administrative expenses of running such programs.

Princeton University Notes to Schedules of Expenditures of Federal and State Awards Year Ended June 30, 2015
38
2. Subrecipients - Federal Awards
During fiscal year 2015, the University had subrecipient expenditures in the following programs:
Program / Cluster CFDA No. Amount
Research and Development Cluster Varioius 24,085,690$ 24,085,690$
3. Facility and Administrative Costs
The University's Federal negotiated predetermined cost rates for the year ended June 30, 2015 were as follows:
Rate
61.0%26.0%
Princeton University Sponsored Activity
On - CampusOff - Campus
Indirect cost rates for New Jersey state awards are determined by New Jersey state agencies on a proposal basis.
4. Federal Perkins Loan Program
Amounts reported in the schedule of expenditures of federal awards for the Federal Perkins Loan Program (84.038) represent the Perkins Revolving Loan Fund including outstanding loans. New Federal Perkins Loans of $656,744 were advanced to students in fiscal year 2015. The University did not receive a federal capital contribution nor make any matching contribution to the Federal Perkins Loan fund in 2015.
The federally approved administrative cost allowed under the Title IV program for Federal Work study, Federal Perkins and Federal SEOG for the fiscal year ending June 30, 2015 was $162,611. This expense was charged to three programs as follows, Federal Work-Study Program, $56,000, Federal Perkins Loan program, $31,611, and Federal SEOG, $75,000. The administrative cost allowance is determined as a percentage of the total program expenditures.
5. Federal Direct Loan Program
The University participates in the Federal Direct Loan Program (84.268), which includes subsidized and unsubsidized Federal Stafford Loans (“Stafford”) and Federal PLUS Loans (“PLUS”). Even though the University is not the recipient of the funds and loans under the Federal Direct Loan Program, which are made to students, such programs are considered a component of the student financial assistance program at the University. It is not practical to estimate the outstanding balance of loans under this program.

39
Independent Auditor’s Report on Internal Control over Financial Reporting and on Compliance and Other Matters Based on an Audit of Financial Statements Performed in Accordance with
Government Auditing Standards
To the Trustees of Princeton University:
We have audited, in accordance with auditing standards generally accepted in the United States of America and the standards applicable to financial audits contained in Government Auditing Standards, issued by the Comptroller General of the United States, the consolidated financial statements of Princeton University (the “University”) which comprise the consolidated statements of financial position as of June 30, 2015 and the related consolidated statements of activities and cash flows for the year then ended, and the related notes to the consolidated financial statements, and have issued our report thereon dated November 24, 2015.
Internal Control Over Financial Reporting
In planning and performing our audit of the consolidated financial statements, we considered the University’s internal control over financial reporting (“internal control”) to determine the audit procedures that are appropriate in the circumstances for the purpose of expressing our opinion on the financial statements, but not for the purpose of expressing an opinion on the effectiveness of the University’s internal control. Accordingly, we do not express an opinion on the effectiveness of the University’s internal control.
A deficiency in internal control exists when the design or operation of a control does not allow management or employees, in the normal course of performing their assigned functions, to prevent, or detect and correct, misstatements on a timely basis. A material weakness is a deficiency, or a combination of deficiencies, in internal control such that there is a reasonable possibility that a material misstatement of the entity’s financial statements will not be prevented, or detected and corrected on a timely basis. A significant deficiency is a deficiency, or a combination of deficiencies, in internal control that is less severe than a material weakness, yet important enough to merit attention by those charged with governance.
Our consideration of internal control was for the limited purpose described in the first paragraph of this section and was not designed to identify all deficiencies in internal control that might be material weaknesses or significant deficiencies. Given these limitations, during our audit we did not identify any deficiencies in internal control that we consider to be material weaknesses. However, material weaknesses may exist that have not been identified.
Compliance and Other Matters
As part of obtaining reasonable assurance about whether the University’s consolidated financial statements are free from material misstatement, we performed tests of its compliance with certain provisions of laws, regulations, contracts and grant agreements, noncompliance with which could have a direct and material effect on the determination of financial statement amounts. However, providing an opinion on compliance with those provisions was not an objective of our audit and, accordingly, we do not express such an opinion. The results of our tests disclosed no instances of noncompliance or other matters that are required to be reported under Government Auditing Standards.
PricewaterhouseCoopers LLP, PricewaterhouseCoopers Center, 300 Madison Avenue, New York, NY 10017T: (646) 471 3000, F: (813) 286 6000, www.pwc.com/us

40
Purpose of this Report
The purpose of this report is solely to describe the scope of our testing of internal control and compliance and the results of that testing, and not to provide an opinion on the effectiveness of the entity’s internal control or on compliance. This report is an integral part of an audit performed in accordance with Government Auditing Standards in considering the entity’s internal control and compliance. Accordingly, this communication is not suitable for any other purpose.
New York, New York November 24, 2015

40
Independent Auditor’s Report on Compliance with Requirements that Could Have a Direct and Material Effect on Each Major Federal and State Program and on Internal Control Over
Compliance in Accordance With OMB Circular A-133 and New Jersey Department of Treasury Circular Letter 04-04-Office of Management and Budget
To the Trustees of Princeton University:
Report on Compliance for Each Major Federal and State Program
We have audited Princeton University’s (the “University”) compliance with the types of compliance requirements described in the OMB Circular A-133 Compliance Supplement and The New Jersey Department of the Treasury Circular Letter 04-04 Office of Management and Budget, Single Audit Policy for Recipients of Federal Grants, State Grants and State Aid, that could have a direct and material effect on each of the University’s major federal and state programs respectively, for the year ended June 30, 2015. The University’s major federal and state programs are identified in the summary of auditor’s results section of the accompanying schedule of findings and questioned costs.
Management’s Responsibility
Management is responsible for compliance with the requirements of laws, regulations, contracts, and grants applicable to its federal and state programs.
Auditor’s Responsibility
Our responsibility is to express an opinion on compliance for each of the University’s major federal and state programs based on our audit of the types of compliance requirements referred to above. We conducted our audit of compliance in accordance with auditing standards generally accepted in the United States of America; the standards applicable to financial audits contained in Government Auditing Standards, issued by the Comptroller General of the United States; OMB Circular A-133, Audits of States, Local Governments, and Non-Profit Organizations, and The New Jersey Department of the Treasury Circular Letter 04-04 Office of Management and Budget, Single Audit Policy for Recipients of Federal Grants, State Grants and State Aid. Those standards, and OMB Circular A-133 and The New Jersey Department of the Treasury Circular Letter 04-04 Office of Management and Budget, require that we plan and perform the audit to obtain reasonable assurance about whether noncompliance with the types of compliance requirements referred to above that could have a direct and material effect on a major federal and state program occurred. An audit includes examining, on a test basis, evidence about the University’s compliance with those requirements and performing such other procedures as we considered necessary in the circumstances.
We believe that our audit provides a reasonable basis for our opinion on compliance for each major federal and state program. However, our audit does not provide a legal determination of the University’s compliance.
PricewaterhouseCoopers LLP, PricewaterhouseCoopers Center, 300 Madison Avenue, New York, NY 10017T: (646) 471 3000, F: (813) 286 6000, www.pwc.com/us

42
Opinion on Each Major Federal and State Program
In our opinion, the University complied, in all material respects, with the types of compliance requirements referred to above that could have a direct and material effect on each of its major federal and state programs for the year ended June 30, 2015.
Report on Internal Control Over Compliance
Management of the University is responsible for establishing and maintaining effective internal control over compliance with the types of compliance requirements referred to above. In planning and performing our audit of compliance, we considered the University’s internal control over compliance with the types of requirements that could have a direct and material effect on each major federal and state program to determine the auditing procedures that are appropriate in the circumstances for the purpose of expressing an opinion on compliance for each major federal and state program and to test and report on internal control over compliance in accordance with OMB Circular A-133 and The New Jersey Department of the Treasury Circular Letter 04-04 Office of Management and Budget, but not for the purpose of expressing an opinion on the effectiveness of internal control over compliance. Accordingly, we do not express an opinion on the effectiveness of the University’s internal control over compliance.
A deficiency in internal control over compliance exists when the design or operation of a control over compliance does not allow management or employees, in the normal course of performing their assigned functions, to prevent, or detect and correct, noncompliance with a type of compliance requirement of a federal or state program on a timely basis. A material weakness in internal control over compliance is a deficiency, or combination of deficiencies, in internal control over compliance, such that there is a reasonable possibility that material noncompliance with a type of compliance requirement of a federal or state program will not be prevented, or detected and corrected, on a timely basis. A significant deficiency in internal control over compliance is a deficiency, or a combination of deficiencies, in internal control over compliance with a type of compliance requirement of a federal or state program that is less severe than a material weakness in internal control over compliance, yet important enough to merit attention by those charged with governance.
Our consideration of internal control over compliance was for the limited purpose described in the first paragraph of this section and was not designed to identify all deficiencies in internal control over compliance that might be material weaknesses or significant deficiencies. We did not identify any deficiencies in internal control over compliance that we consider to be material weaknesses. However, material weaknesses may exist that have not been identified.
The purpose of this report on internal control over compliance is solely to describe the scope of our testing of internal control over compliance and the results of that testing is based on the requirements of OMB Circular A-133 and The New Jersey Department of the Treasury Circular Letter 04-04 Office of Management and Budget. Accordingly, this report is not suitable for any other purpose.
New York, New York March 21, 2016

Princeton University Summary of Independent Auditors’ Results Year Ended June 30, 2015
43
Section I—Summary of Independent Auditors’ Results
Financial Statements
Type of independent auditors’ report issued: Unmodified
Internal control over financial reporting: Material weakness(es) identified? Yes X No
Significant deficiencies(s) identified that are notconsidered to be material weaknesses?
Yes XNonereported
Noncompliance material to financial statements noted? Yes X No Federal Awards Internal Control over major programs:
Material weakness(es) identified? Yes X No
Significant deficiencies(s) identified that are not consideredto be material weaknesses
Yes XNonereported
Type of independent auditors’ report issued on compliancefor major programs: Unmodified
State of New Jersey Awards Internal Control over major programs:
Material weakness(es) identified? Yes X No
Significant deficiencies(s) identified that are not consideredto be material weaknesses
Yes XNonereported
Type of independent auditors’ report issued on compliancefor major programs: Unmodified
Any audit findings disclosed that are required to bereported in accordance with:
Circular A-133 (Section .510(a))? Yes X No
State of New Jersey OMB Circular 04-04? Yes X No
Identification of major programs:
CFDA Number(s) Name of Federal Program or Cluster
Federal: Various93.172
Research and Development Cluster Human Genome Research
State: N/A Research and Development Cluster

Princeton University Summary of Independent Auditors’ Results Year Ended June 30, 2015
44
Dollar threshold used to distinguish between
Type A and Type B programs: Federal Awards:
State of New Jersey Awards:$3,000,000
$300,000
Federal:
Auditee qualified as low-risk auditee? X Yes No
State:
Auditee qualified as low-risk auditee? X Yes No

Princeton University Schedule of Findings and Questioned Costs Year Ended June 30, 2015
45
Section II — Financial Statement Findings
The audit disclosed no items required to be reported in this section.
Section III—Federal Award Findings and Questioned Costs
The audit disclosed no items required to be reported in this section.
Section IV—State of New Jersey Award Findings and Questioned Costs
The audit disclosed no items required to be reported in this section.

Princeton University Status of Prior Year's Findings Year Ended June 30, 2015
46
Status of Prior Year’s Findings
Federal Programs- No findings in prior years which require an update in this report.
State Programs- No findings in prior years which require an update in this report.
Related Documents


