Prince William Forest Park Case Study Regan Smyth and Don Faber-Langendoen

Welcome message from author
This document is posted to help you gain knowledge. Please leave a comment to let me know what you think about it! Share it to your friends and learn new things together.
Transcript

Prince William Forest Park
Case Study
Regan Smyth and Don
Faber-Langendoen

Prince William Park
• NPS vegetation map (associations) provides “true” picture
• Located in zone of
overlap
• Shows challenges
of mapping
ecosystems in
in transition zones

All Maps Differ
LF TNC SEGAP/ NS
NPS Park Map

General Reasons for Differences
• Differences in Targets – Actual
• Differences in Targets – Conceptual
• Different Reliance on Geophysical Setting and Remote Sensing Data
• Different Use of Range Restrictions
• Different Treatment of Cultural and Ruderal/Semi-natural Types
• Deliberate Changes to Improve Product
• Different Methods - obviously

Number of Natural Systems
• Actual difference in targets
NPS LF GAP/
NS TNC # Matching 9 5 3 6 # Non-matching 10 5 5 Total # Systems 9 15 8 11

Different Use of Range Restrictions
Name NPS LF NS/GAP TNC
Appalachian (Hemlock)-Northern Hardwood Forest 0.08% 13% 0.01% 0.03%
S. Atlantic Coastal Plain Mesic Hardwood Forest 37% 4% 1%
Southern Piedmont Mesic Forest 12% 32%
Central Appalachian Dry Oak-Pine Forest 14% 5% 0.49% 1%
Southern Piedmont Dry Oak(-Pine) Forest 2% 76%
Northeastern Interior Dry-Mesic Oak Forest 9% 16% 55%
Northern Atlantic Coastal Plain [DM] Hardwood Forest 1% 9%
Southern Piedmont Small Floodplain and Riparian Forest 7% 2%
Ruderal Forest 26% 35%
Piedmont
Coastal
Plain List only includes systems > 5%
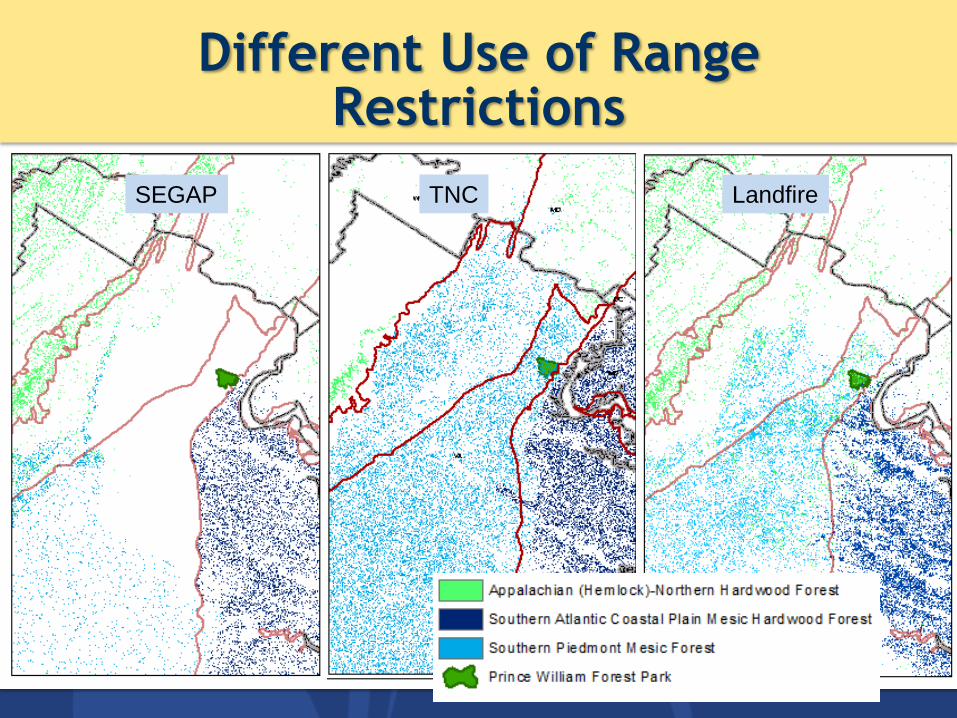
Different Use of Range Restrictions
SEGAP TNC Landfire

Different Use of Range Restrictions
Name NPS LF NS/GAP TNC
Appalachian (Hemlock)-Northern Hardwood Forest 0.08% 13% 0.01% 0.03%
S. Atlantic Coastal Plain Mesic Hardwood Forest 37% 4% 1%
Southern Piedmont Mesic Forest 12% 32%
Central Appalachian Dry Oak-Pine Forest 14% 5% 0.49% 1%
Southern Piedmont Dry Oak(-Pine) Forest 2% 76%
Northeastern Interior Dry-Mesic Oak Forest 9% 16% 55%
Northern Atlantic Coastal Plain [DM] Hardwood Forest 1% 9%
Southern Piedmont Small Floodplain and Riparian Forest 7% 2%
Ruderal Forest 26% 35%
Piedmont
Coastal
Plain

Different Use of Range Restrictions
SEGAP
Piedmont
Northern
Piedmont
TNC
TNC Landfire

Dry -> Mesic Gradient
Name NPS LF NS/GAP TNC
Appalachian (Hemlock)-Northern Hardwood Forest 0.08% 13% 0.01% 0.03%
S. Atlantic Coastal Plain Mesic Hardwood Forest 37% 4% 1%
Southern Piedmont Mesic Forest 12% 32%
Central Appalachian Dry Oak-Pine Forest 14% 5% 0.49% 1%
Southern Piedmont Dry Oak(-Pine) Forest 2% 76%
Northeastern Interior Dry-Mesic Oak Forest 9% 16% 55%
Northern Atlantic Coastal Plain [DM] Hardwood Forest 1% 9%
Southern Piedmont Small Floodplain and Riparian Forest 7% 2%
Ruderal Forest 26% 35%
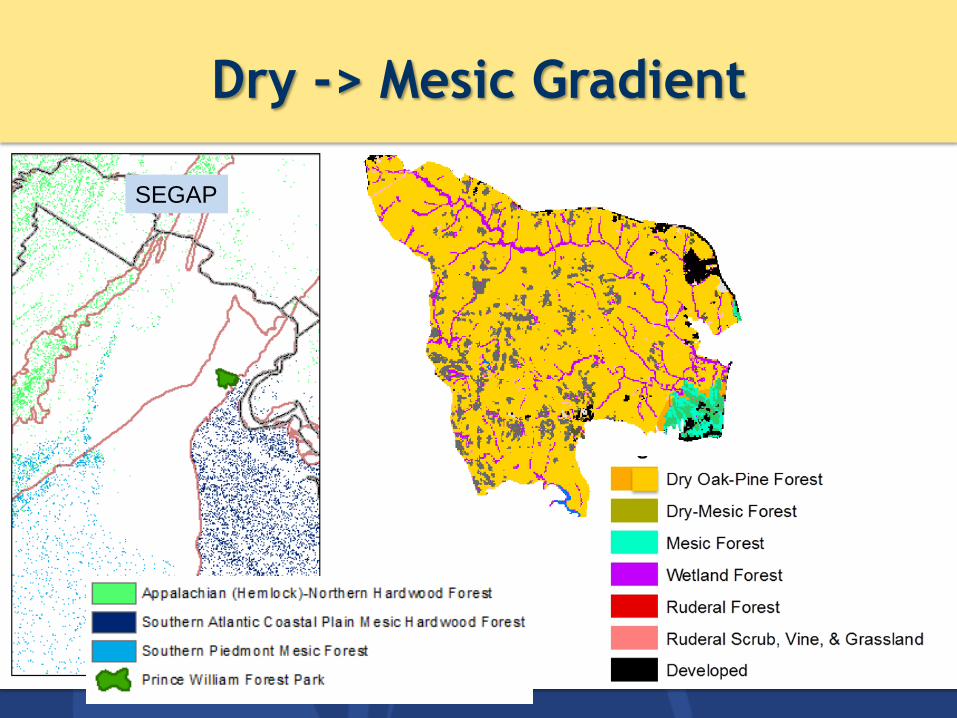
Dry -> Mesic Gradient
SEGAP
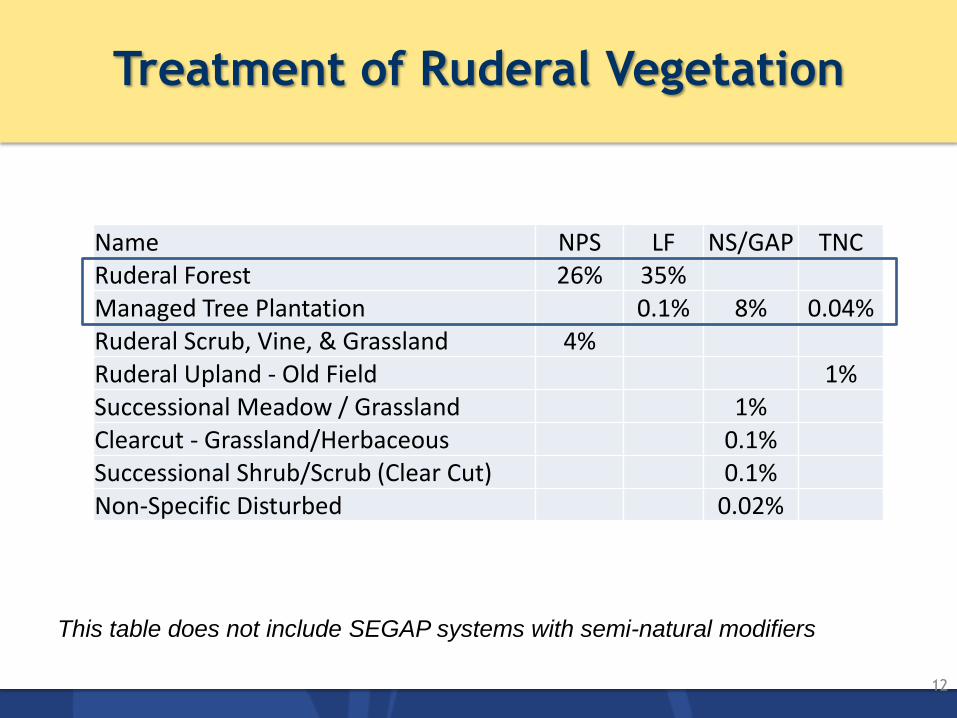
Treatment of Ruderal Vegetation
12
Name NPS LF NS/GAP TNC Ruderal Forest 26% 35% Managed Tree Plantation 0.1% 8% 0.04% Ruderal Scrub, Vine, & Grassland 4% Ruderal Upland - Old Field 1% Successional Meadow / Grassland 1% Clearcut - Grassland/Herbaceous 0.1% Successional Shrub/Scrub (Clear Cut) 0.1% Non-Specific Disturbed 0.02%
This table does not include SEGAP systems with semi-natural modifiers

Overall Accuracy
13
NPS Map: >80%*
TNC
• Raw accuracy = 6%
• 18% if merge Piedmont and Coastal Plain Mesic
• Biggest source of error: points mapped as S. Piedmont mesic observed as numerous other forest types
SEGAP
• Raw accuracy = 2%;
• 12% if merge dry forest types
• Low accuracy due to significant over-mapping of S. Piedmont Dry Oak Pine; does not reflect on SEGAP map as a whole
Landfire
• Raw accuracy = 39%
• 45% if merge mesic and dry forest types
• Higher accuracy largely due to success at capturing ruderal vegetation
*not a “true” accuracy assessment
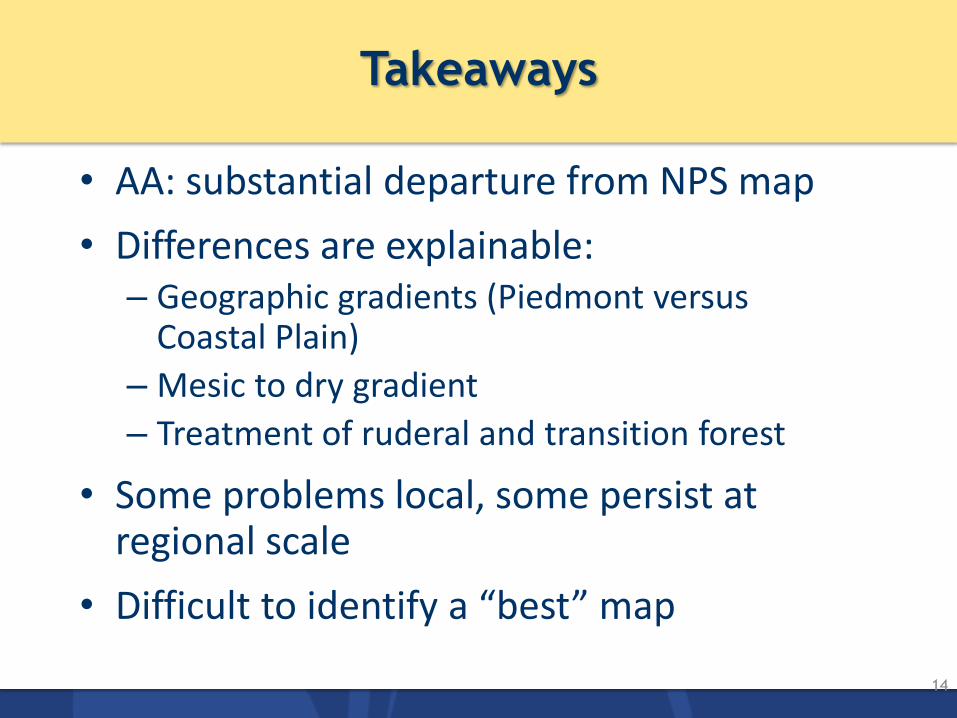
Takeaways
14
• AA: substantial departure from NPS map
• Differences are explainable: – Geographic gradients (Piedmont versus
Coastal Plain)
– Mesic to dry gradient
– Treatment of ruderal and transition forest
• Some problems local, some persist at regional scale
• Difficult to identify a “best” map
Related Documents


