Primoris Services Corporation Q3 2021 Earnings Call Nov. 8, 2021

Welcome message from author
This document is posted to help you gain knowledge. Please leave a comment to let me know what you think about it! Share it to your friends and learn new things together.
Transcript

Primoris Services Corporation
Q3 2021 Earnings Call
Nov. 8, 2021

Notice to Investors
This presentation contains forward-looking statements within the meaning of the federal securities laws. These statements give the current expectations of the Company’s management. Words such as “could,” “will,” “may,” “assume,” “forecast,” “strategy,” “guidance,” “outlook,” “target,” “expect,” “intend,” “plan,” “estimate,” “anticipate,” “believe,” or “project” and similar expressions are used to identify forward-looking statements. Without limiting the generality of the foregoing, forward-looking statements contained in this presentation include the Company’s expectations regarding the consummation of the transactions described herein.
Forward-looking statements can be affected by assumptions used or known or unknown risks or uncertainties. Consequently, no forward-looking statements can be guaranteed, and actual results may differ materially and adversely from those reflected in the forward-looking statements. Factors that could cause actual results to differ materially from those indicated in the forward-looking statements include, among other things, (a) the risk and uncertainties disclosed in the Company’s Annual Report on Form 10-K and the Company’s Quarterly Reports on Form 10-Q filed with the U.S. Securities and Exchange Commission (“SEC”) from time to time and (b) the following risks inherent in the transactions (in addition to others described elsewhere in this document and in the subsequent filings with the SEC): (1) failure to obtain regulatory approval necessary to consummate the transactions or to obtain regulatory approvals on favorable terms and (2) delays in consummating the transactions or the failure to consummate the transactions.
Because the Company’s forward-looking statements are based on estimates and assumptions that are subject to significant business, economic and competitive uncertainties, many of which are beyond the Company’s control or are subject to change, actual results could be materially different and any or all of the Company’s forward-looking statements may turn out to be wrong. Forward-looking statements speak only as of the date made and can be affected by assumptions the Company might make or by known or unknown risk and uncertainties. Many factors mentioned in this presentation and in the Company’s annual and quarterly reports will be important in determining future results. Consequently, the Company cannot assure you that the Company’s expectations or forecasts expressed in such forward-looking statements will be achieved.
Non-GAAP MeasuresThis presentation contains certain financial measures that are not recognized under generally accepted accounting principles in the United States (“GAAP”). Primoris uses earnings before interest, income taxes, depreciation and amortization (“EBITDA”), Adjusted EBITDA, Adjusted Net Income, and Adjusted EPS as important supplemental measures of the Company’s operating performance. The Company believes these measures enable investors, analysts, and management to evaluate Primoris’ performance excluding the effects of certain items that management believes impact the comparability of operating results between reporting periods. In addition, management believes these measures are useful in comparing the Company’s operating results with those of its competitors. The non-GAAP measures presented in this presentation are not intended to be considered in isolation or as a substitute for, or superior to, the financial information prepared and presented in accordance with GAAP. In addition, Primoris’ method of calculating these measures may be different from methods used by other companies, and, accordingly, may not be comparable to similarly titled measures as calculated by other companies that do not use the same methodology as Primoris. Please see the accompanying tables to this presentation for reconciliations of the following non‐GAAP financial measures for Primoris’ current and historical results: EBITDA, Adjusted EBITDA, Adjusted Net Income and Adjusted EPS.
2

Utility Segment revenue up 10%
Q3 2021 Highlights
3
Strong revenue of $913.2 million
Energy/Renewable Segment revenue up 11%
Fully diluted earnings per share (EPS) of $0.81Adjusted EPS of $0.89
Adjusted EBITDA of $94.7 million

Q3 2021 Summary
4
$942.7$913.2
2020 Q3 2021 Q3
Revenue(in millions)
$43.9 $44.1
2020 Q3 2021 Q3
Net Income(in millions)
$45.3
$48.5
2020 Q3 2021 Q3
Adjusted Net Income(in millions)

Q3 2021 Summary
5
$0.90$0.81
2020 Q3 2021 Q3
EPS
$87.9
$94.7
2020 Q3 2021 Q3
Adjusted EBITDA(in millions)
$0.93$0.89
2020 Q3 2021 Q3
Adjusted EPS

YTD 2021 Summary
6
$2,594.2 $2,613.2
2020 YTD 2021 YTD
Revenue(in millions)
$73.2
$86.2
2020 YTD 2021 YTD
Net Income(in millions)
$82.3
$108.0
2020 YTD 2021 YTD
Adjusted Net Income(in millions)
35% MSA53% MSA
$2.8 $2.7
Dec. 31, 2020 Sept. 30, 2021
MSA / Total Backlog(in billions)

YTD 2021 Summary
7
$1.50
$1.63
2020 YTD 2021 YTD
EPS
$184.7
$230.8
2020 YTD 2021 YTD
Adjusted EBITDA(in millions)
$1.69
$2.04
2020 YTD 2021 YTD
Adjusted EPS

MSA Revenue
8
24% 24%
29% 29%28%
38%
44%
39%
45%
15%
20%
25%
30%
35%
40%
45%
50%
$-
$200
$400
$600
$800
$1,000
$1,200
$1,400
$1,600
$1,800
2013 2014 2015 2016 2017 2018 2019 2020 Q3 2021LTM
% To
tal Reven
ue
$M
Ms
MSA Revenue % Total Revenue
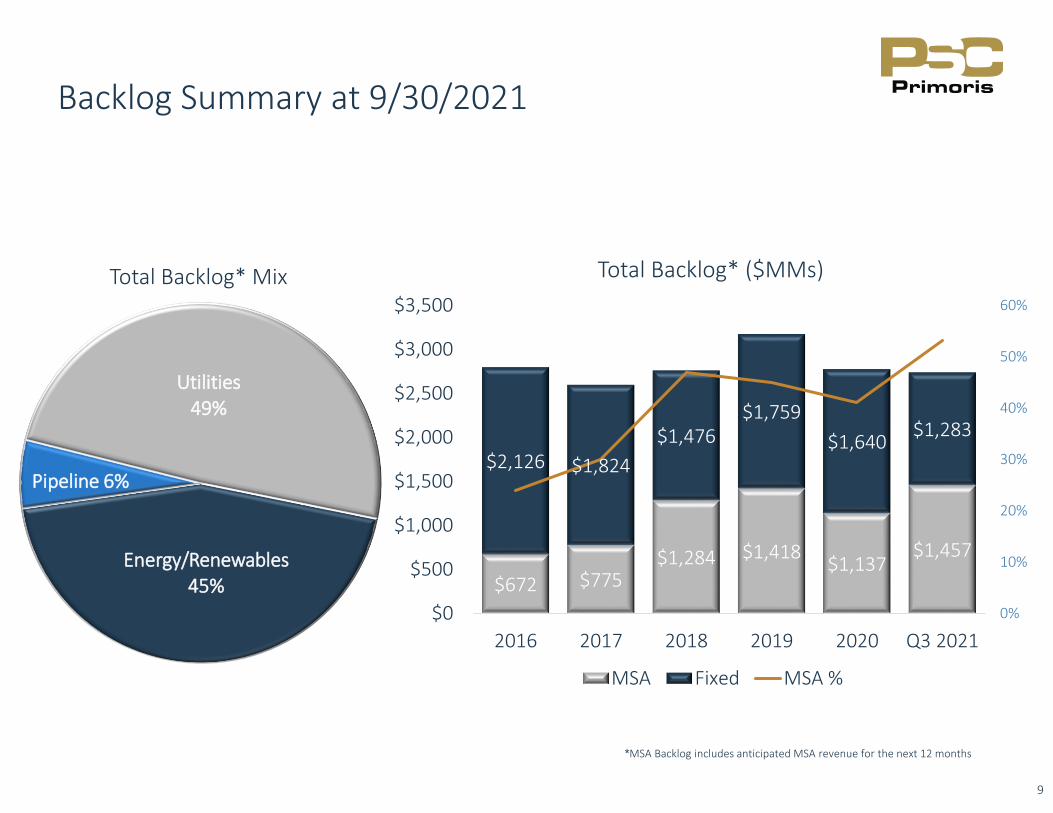
$672 $775$1,284 $1,418
$1,137$1,457
$2,126 $1,824
$1,476$1,759
$1,640$1,283
0%
10%
20%
30%
40%
50%
60%
$0
$500
$1,000
$1,500
$2,000
$2,500
$3,000
$3,500
2016 2017 2018 2019 2020 Q3 2021
Total Backlog* ($MMs)
MSA Fixed MSA %
Backlog Summary at 9/30/2021
9
Utilities49%
Energy/Renewables45%
Pipeline 6%
Total Backlog* Mix
*MSA Backlog includes anticipated MSA revenue for the next 12 months

Q3 2021 vs. Q3 2020 Segment Results
10
$ in thousands
Q3 2021 UtilitiesEnergy/
RenewablesPipeline TOTAL
Revenue $ 454,654 $ 351,026 $ 107,565 $ 913,245
Gross Profit $ 63,715 $ 35,926 $ 27,795 $ 127,436
Gross Margins* 14.0% 10.2% 25.8% 14.0%
Q3 2020 UtilitiesEnergy/
RenewablesPipeline TOTAL
Revenue $ 413,205 $ 315,115 $ 214,380 $ 942,700
Gross Profit $ 68,135 $ 27,501 $ 28,045 $ 123,681
Gross Margins* 16.5% 8.7% 13.1% 13.1%
*Gross Profit as a Percent of Revenue

Growing Revenue While Controlling SG&A
11
$1.9 $2.0
$2.4
$2.9
$3.1
$3.5 $3.5 7.9%
7.0%
7.2%
6.2%6.1%
5.8%
6.3%
5.5%
6.0%
6.5%
7.0%
7.5%
8.0%
$1.0
$1.5
$2.0
$2.5
$3.0
$3.5
$4.0
2015 2016 2017 2018 2019 2020 Q3 2021 LTM
SG&
A %
of
Rev
enu
e
Revenue SG&A % of Revenue
$ in
Bill
ion
s

Consistent Earnings Per Share Growth
12
2018 2019 2020 2021E 2021E
Note: 2018, 2019, and 2020 are actual earnings per fully diluted share. 2021E is guidance as of 11/08/2021
$2.71
Adjusted EPS GuidanceEPS Guidance
$2.20
$2.10$2.16
$1.61$1.50
$2.61

Primoris – Why Invest? Our low-risk business model creates strong, consistent growth
13(1) As of 30-Sept-2021 (2) As of 31-Dec-2020 (3) Represents states where Primoris has done business in the last 6.5 years.
Diverse Business MixOur Value Proposition
Coast-to-CoastOperationalFootprint (3)
Primoris Existing Locations
Headquarters (Dallas, Texas)
States Where Primoris Does Business
53%Master Service
Agreement (MSA) Backlog (1)
» Comprehensive suite of critical infrastructure services
» Business model limits risks & drives predictability
» Lower risk profile – smallersize contracts
» Driving predictability with increased multi-year revenue & margin visibility
» Deeper relationships with customers spanning decades provides cross-selling opportunities
» Ongoing transition to higher growth, higher margin end markets with strong secular tailwind
<$5mmAverage
Contract Size (1)
78%Reimbursable Contracts (2)
50%38%
12%
Q3 2021 Revenue
Primoris has also worked in every Canadian province
Utilities
Energy/ Renewables
Pipeline Services
49%45%
6%
Q3 2021 Backlog

Reg G Reconciliation

Schedule 1: Reconciliation of Adjusted Net Income & Adjusted EPSQ3 2021 vs. Q3 2020
15
Adjusted Net Income & Adjusted EPSPrimoris defines Adjusted Net Income as net income (loss) attributable to Primoris adjusted for certain items including, (i) non-cash stock-based compensation expense; (ii) transaction/integration and related costs; (iii) asset impairment charges; (iv) changes in fair value of our interest rate swap; (v) change in fair value of contingent consideration liabilities; (vi) amortization of intangible assets; (vii) amortization of debt discounts and debt issuance costs; (viii) losses on extinguishment of debt; (ix) severance and restructuring changes; and (x) impact of changes in statutory tax rates. The Company defines Adjusted EPS as Adjusted Net Income divided by the diluted weighted average shares outstanding. Management believes these adjustments are helpful for comparing the Company’s operating performance with prior periods. Because Adjusted Net Income and Adjusted EPS, as defined, exclude some, but not all, items that affect net income attributable to Primoris and diluted earnings per share attributable to Primoris, they may not be comparable to similarly titled measures of other companies. The most comparable GAAP financial measures, net income attributable to Primoris and diluted earnings per share attributable to Primoris, and information reconciling the GAAP and non‐GAAP financial measures, are included in the table below.
($ thousands, except per share amounts) Q3 2021 Q3 2020
Net income attributable to Primoris (GAAP) $ 44,053 $ 43,941
Non-cash stock-based compensation 1,661 528
Transaction/integration and related costs (1) 447 117
Amortization of intangible assets 4,645 2,152
Amortization of debt issuance costs 283 134
Unrealized (gain) loss on interest rate swap (929) (1,051)
Income tax impact of adjustments (1,679) (545)
Adjusted net income attributable to Primoris $ 48,481 $ 45,276
Weighted average shares (diluted) 54,367 48,574
Diluted earning per share $ 0.81 $ 0.90
Adjusted diluted earnings per share $ 0.89 $ 0.93

Schedule 1: Reconciliation of Adjusted Net Income & Adjusted EPSYTD 2021 vs. YTD 2020
16
Adjusted Net Income & Adjusted EPS
The following table set forth a reconciliation of net income attributable to Primoris per diluted share to Adjusted EPS for the nine months ended September 30, 2021, and 2020:
($ thousands, except per share amounts)
Nine Months
Ended
Sept 30, 2021
Nine Months
Ended
Sept 30, 2020
Net income attributable to Primoris (GAAP) $ 86,193 $ 73,163
Non-cash stock-based compensation 4,046 1,730
Transaction/integration and related costs (1) 32,694 117
Amortization of intangible assets 13,474 6,835
Amortization of debt issuance costs 850 295
Unrealized (gain) loss on interest rate swap (3,183) (3,856)
Income tax impact of adjustments (8,253) (3,732)
Adjusted net income attributable to Primoris $ 107,950 $ 82,301
Weighted average shares (diluted) 52,887 48,712
Diluted earning per share $ 1.63 $ 1.50
Adjusted diluted earnings per share $ 2.04 $ 1.69

Schedule 2: Reconciliation of EBITDA & Adjusted EBITDAQ3 2021 vs. Q3 2020
17
EBITDA and Adjusted EBITDAPrimoris defines EBITDA as net income (loss) attributable to Primoris before interest, income taxes, depreciation and amortization. Adjusted EBITDA is defined as EBITDA adjusted for certain items including, (i) non‐cash stock‐based compensation expense; (ii) transaction/integration and related costs; (iii) asset impairment charges; (iv) severance and restructuring changes; and (v) change in fair value of contingent consideration liabilities. The Company believes the EBITDA and Adjusted EBITDA financial measures assist in providing a more complete understanding of the Company’s underlying operational measures to manage its business, to evaluate its performance compared to prior periods and the marketplace, and to establish operational goals. EBITDA and Adjusted EBITDA are non‐GAAP financial measures and should not be considered in isolation or as a substitute for financial information provided in accordance with GAAP. These non‐GAAP financial measures may not be computed in the same manner as similarly titled measures used by other companies. The most comparable GAAP financial measure, net income attributable to Primoris, and information reconciling the GAAP and non‐GAAP financial measures are included in the table below.
($ thousands) Q3 2021 Q3 2020
Net income attributable to Primoris as reported (GAAP) $ 44,053 $ 43,941
Interest expense, net 4,698 4,715
Provision for income taxes 16,710 17,947
Depreciation and amortization 27,163 20,665
EBITDA 92,624 87,268
Non-cash stock-based compensation 1,661 528
Transaction/integration and related costs 447 117
Adjusted EBITDA $ 94,732 $ 87,913

Schedule 2: Reconciliation of EBITDA & Adjusted EBITDAYTD 2021 vs. YTD 2020
18
EBITDA and Adjusted EBITDA
The following table sets forth a reconciliation of net income to EBITDA and Adjusted EBITDA for the nine months endedSeptember 30, 2021, and 2020:
($ thousands)
Nine Months
Ended
Sept 30, 2021
Nine Months
Ended
Sept 30, 2020
Net income attributable to Primoris as reported (GAAP) $ 86,193 $ 73,163
Interest expense, net 14,154 17,172
Provision for income taxes 32,694 29,883
Depreciation and amortization 78,865 62,558
EBITDA 211,906 182,776
Non-cash stock-based compensation 4,046 1,730
Transaction/integration and related costs 14,823 154
Adjusted EBITDA $ 230,775 $ 184,660
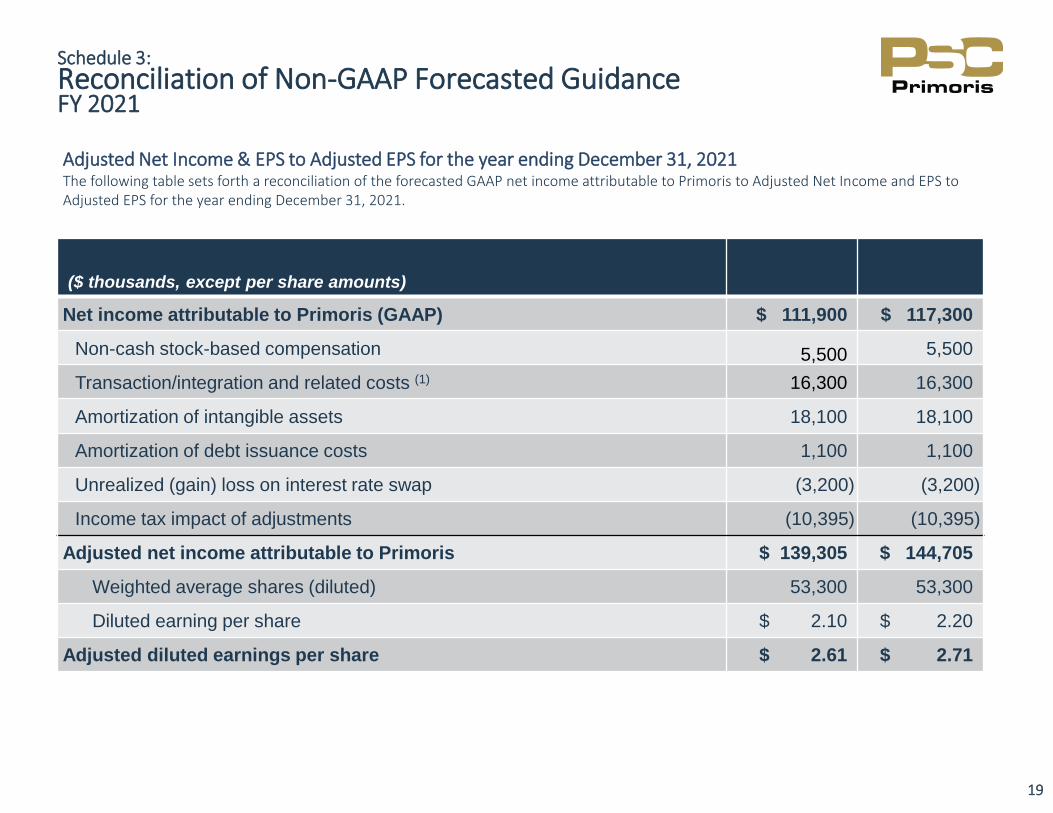
Schedule 3: Reconciliation of Non-GAAP Forecasted GuidanceFY 2021
19
Adjusted Net Income & EPS to Adjusted EPS for the year ending December 31, 2021The following table sets forth a reconciliation of the forecasted GAAP net income attributable to Primoris to Adjusted Net Income and EPS to Adjusted EPS for the year ending December 31, 2021.
($ thousands, except per share amounts)
Net income attributable to Primoris (GAAP) $ 111,900 $ 117,300
Non-cash stock-based compensation 5,500 5,500
Transaction/integration and related costs (1) 16,300 16,300
Amortization of intangible assets 18,100 18,100
Amortization of debt issuance costs 1,100 1,100
Unrealized (gain) loss on interest rate swap (3,200) (3,200)
Income tax impact of adjustments (10,395) (10,395)
Adjusted net income attributable to Primoris $ 139,305 $ 144,705
Weighted average shares (diluted) 53,300 53,300
Diluted earning per share $ 2.10 $ 2.20
Adjusted diluted earnings per share $ 2.61 $ 2.71
Related Documents