Technical Report # 40 Baseline Survey Report: In-Service Training, Health and Population Sector Program (HPSP), Bangladesh August 2003 Prepared (with technical assistance by PRIME - HPSP) by: Kazi Belayet Ali, MBBS, DTM & H, M Sc. Trop. Med., MPH Nazrul Islam, MBA, PGD Mark A. Robbins, MPA, MPH Lorraine Bell, MSN, DrPH Alfredo Fort, MD, PhD Rajeev Sadana, PhD Susan Gearon, MPH PRIME Project Technical Training Unit Line Director, In-Service Training Directorate General of Health Services Mohakhali, Dhaka 1212, Bangladesh

Welcome message from author
This document is posted to help you gain knowledge. Please leave a comment to let me know what you think about it! Share it to your friends and learn new things together.
Transcript
Technical Report # 40 Baseline Survey Report:
In-Service Training, Health and Population Sector Program (HPSP), Bangladesh
August 2003
Prepared (with technical assistance by PRIME - HPSP) by:
Kazi Belayet Ali, MBBS, DTM & H, M Sc. Trop. Med., MPH Nazrul Islam, MBA, PGD Mark A. Robbins, MPA, MPH Lorraine Bell, MSN, DrPH Alfredo Fort, MD, PhD Rajeev Sadana, PhD Susan Gearon, MPH
PRIME Project
Technical Training Unit Line Director, In-Service Training
Directorate General of Health Services Mohakhali, Dhaka 1212,
Bangladesh
This publication was produced by the PRIME II Project and was made possible through support provided by the United States Agency for International Development (USAID) under the terms of Grant No. HRN-A-00-99-00022-00. The views expressed in this document are those of the authors and do not necessarily reflect those of IntraHealth International or USAID.
Any part of this document can be reproduced or adapted to meet local needs without prior permission from IntraHealth International provided IntraHealth International is acknowledged and the material is made available free or at cost. Any reproduction for commercial purposes requires prior permission from IntraHealth. Permission to reproduce illustrations that cite a source of reference other than IntraHealth must be obtained directly from the original source. IntraHealth International would appreciate receiving a copy of any materials in which text or illustrations from this document are used.
PRIME II Partnership: IntraHealth International; Abt Associates, Inc.; EngenderHealth; Program for Appropriate Technology in Health (PATH); and Training Resources Group, Inc. (TRG), with supporting institutions, the American College of Nurse-Midwives (ACNM) and Save the Children.
ISBN 1-881961-85-0 Suggested Citation: Kazi, B.A.; N. Islam; M.A. Robbins; et al. Baseline Survey Report. In-Service Training, Health and Population Sector Program (HPSP), Bangladesh. Chapel Hill, NC: IntraHealth International/PRIME Project, 2003. (PRIME Technical Report # 40)
@2003 IntraHealth International, Inc./ The PRIME II Project
The PRIME II Project IntraHealth International CB # 8100, 1700 Airport Road, Suite 300 Chapel Hill, NC 27599-8100 • USA Phone: 919-966-5636 • Fax: 919-966-6816 E-mail: [email protected] • http://www.prime2.org East and Southern
Africa Norfolk Towers Kijabe Street P.O. Box 44958 Nairobi, Kenya Phone: 254-2-211820 Fax: 254-2-226824
West and Central Africa
B.P. 5328 Dakar-Fann, Senegal Phone: 221-864-0548 Fax: 221-864-0816
Latin America and Caribbean
Federico Henríquez y Carvajal #11
Segundo Piso - Gazcue Santo Domingo, Dominican
Republic Phone: 809-221-2921 Fax: 809-221-2914
Asia Queen Sirikit Convention
Centre Zone D, 201/4-5 60 New Ratachadapisek Rd Klongtoey, Bangkok,
Thailand Phone: 66-2-229-3121 Fax: 66-2-229-3120
For more information on this publication or to request additional copies, please contact the Communications Division of the Chapel Hill office indicated above.
iii
Contents Authors and Acknowledgements ........................................................................... ix
Acronyms............................................................................................................... xi
Executive Summary ............................................................................................. xiii
Introduction..............................................................................................................1
Methodology............................................................................................................3
Results........................................................................................................................... 7
Discussions and Conclusions...................................................................................... 45
Appendices.............................................................................................................51


v
Tables, Figures, Boxes and Appendices Tables Table 1 TTU response on job descriptions and ESP training
(n=10)..................................................................................8
Table 2 TTU response on monitoring, follow-up and performance feedback system (n=10)...............................10
Table 3 LTD response on job descriptions, ESP training, and targets................................................................................15
Table 4 Trainer’s response on monitoring, follow-up, and performance feedback system...........................................17
Table 5 DTCC members’ length of service and job responsibilities (n=23) ......................................................22
Table 6 Training status of DTCC members (n=23) .......................22
Table 7 Suggestions regarding training problems (n=23)..............24
Table 8 Length of service and job responsibilities of DUTT member .............................................................................27
Table 9 Training status of DUTT members (n=69) .......................28
Table 10 Suggestions regarding training problems (n = 70)............29
Table 11 DUTT follow-up of providers after training.....................31
Table 12 Mode of feedback given by DUTT members (n = 9) .......32
Table 13 Responsibilities and training status of immediate supervisors (n = 153) ........................................................34
Table 14 Length of service in clinics and availability of job description.........................................................................35
Table 15 Adequacy of waiting space and supplies at the clinic.......36
Table 16 Visiting time of providers and clients at the clinic ...........37
Table 17 Percentage of providers who fulfilled each performance item and average performance scores of all providers ......................................................................38
Table 18 Distribution of respondents by age groups and gender.....39
Table 19 Distribution of respondents by clinics’ schedule of operation ...........................................................................40
Table 20 Client’s access and reasons for coming to the clinics.......41
Table 21 Providers' visiting time by clients' arrival times (n=243)..............................................................................42
Table 22 Perceptions of clients about providers in the clinics.........42
vi
Figures Figure 1 Availability of TTU supplies and equipment.................... 11
Figure 2 Perception of TTU members of being listened to when making suggestions..............................................13
Figure 3 TTU self-assessment of current abilities in training roles................................................................................... 13
Figure 4 Availability of LTD equipment and supplies.................... 18
Figure 5 LTD perception of being listened to when making a suggestion ......................................................................... 19
Figure 6 Skills rating on training related activities by trainers and their supervisors ......................................................... 20
Figure 7 Percent of DTU respondents involved in training related activities ................................................................ 23
Figure 8 Percent of the respondents involved in planning within DTCs and among other stakeholders..................... 24
Figure 9 Percent of the respondents involved in training related activities ................................................................ 28
Figure 10 Percent of respondents involved in planning with DUTT and among other stakeholders (n=36) ................... 29
Figure 11 Persons responsible for follow-up (respondents gave multiple answers).................................................................. 30
Figure 12 Percent of DUTT respondents who used checklists for monitoring trainees (n=25).......................................... 31
Figure 13 Types of recordkeeping at Upazila level .......................... 32
Figure 14 Communication of training reports (respondents gave multiple responses) ............................................................... 33
Figure 15 Suggestions for improvement of 21-day basic ESP training .............................................................................. 35
Figure 16 Facility assessment scores of community clinics (n=84)................................................................................ 37
Figure 17 Arrival time of the clients to the clinics............................ 40
Figure 18 Clients first source of services .......................................... 41
Figure 19 Instructions given to clients by providers after delivering services (n=187) .............................................. 43
Boxes Box 1 Perceived problems in achieving targets and suggestions for improvement.............................................. 8
Box 2 Perceived differences between trainers and master trainers by TTU members ................................................... 9
vii
Box 3 TTU response on interpersonal relations and non-monetary motivators ......................................................... 12
Box 4 Perceived differences between trainers and master trainers by LTO staff......................................................... 16
Box 5 LTDs’ understanding of supervision ................................ 17
Box 6 LTD response on available and needed non-monetary motivators ......................................................... 19
Appendices Appendix A Monitoring and evaluation plan of ESP In-Service Training Program.............................................................. 51
Appendix B List of baseline survey participants................................... 55
Appendix C Summary of LTOs' performance needs assessment (PNA)................................................................................ 57
Appendix D Data Collection Tools
D.1 Tool to review current status of performance issues in the TTU ...................................................... 65
D.2 Tool to review current status of performance issues in the LTOs..................................................... 71
D.3 District level P/TNA and baseline capacity assessment tool..........................................................77
D.4 Upazila level P/TNA and baseline capacity assessment tool.......................................................... 81
D.5 Competence assessment tool of immediate supervisors of field service providers ....................... 85
D.6 Service provider’s competence assessment tool ....... 87
D.7 Service provider’s (HA and FWA) performance observation checklist at worksite .............................. 89
D.8 Exit interview tool for clients at Service Delivery Points.......................................................... 91
D.9 Facility (equipment, furniture and logistic supplies) assessment checklist for SDPs................... 93
Appendix E Workplan of ESP IST baseline survey data collection........................................................................... 99

ix
Authors Kazi Belayet Ali, National Consultant for Training Evaluation, PRIME II/Bangladesh
Country Office, Dhaka, Bangladesh
Nazrul Islam, National Consultant for Training Management Information Systems, PRIME II/Bangladesh Country Office, Dhaka, Bangladesh
Mark A. Robbins, Executive Program Advisor, PRIME II/Bangladesh Country Office, Dhaka, Bangladesh
Lorraine Bell, Senior Training Advisor, PRIME II/Bangladesh Country Office, Dhaka, Bangladesh
Alfredo Fort, Director of Monitoring and Evaluation, PRIME II/Chapel Hill, NC, USA
Rajeev Sadana, Regional Evaluation Manager, PRIME II/Asia and Near East Regional Office, New Delhi, India
Susan Gearon, Senior Monitoring and Evaluation Specialist, PRIME II/Chapel Hill, NC, USA
Acknowledgements This nation-wide survey assesses and documents the baseline capacity status of In-Service Training under the Health and Population Sector Program (HPSP) at both the institutional and individual levels. In-Service Training, the Technical Training Unit (TTU), conducted this survey with technical assistance from PRIME-HPSP under the direction of the Line Director (LD).
Personnel from Lead Training Organizations ― GUS, NIPORT, and PSTC ― and from JICA also greatly assisted this effort by participating in data collection and processing. The TTU provided funding for data collection activities.
District and Upazila managers/supervisors assured effective planning, scheduling, and transportation. They also helped central level team members to collect data in the field at the district, Upazila, and community levels.
We are ever grateful to the respondents at all levels, including clients in the clinics, who gave up valuable time to participate in this survey.
The authors would also like to thank Ms. Michele Teitelbaum for initial edits to this document; and to Ms. Barbara Wollan, Administrative Assistant for Monitoring and Evaluation Unit, IntraHealth International/PRIME II, Chapel Hill, for entry of final edits and formatting of this document.

Executive Summary xi
Acronyms ADCC Assistant Director Clinical Contraception
AHI Assistant Health Inspector
AOP Annual Operational Plan
AV Audio-Visual
BCC Behavior Change Communication
CC Community Clinic
CS Civil Surgeon
DCS Deputy Civil Surgeon
DDFP Deputy Director Family Planning
DGHS Directorate General of Health Services
DTCC District Training Coordination Committee
DUTT District/Upazila Training Team
EPI Expanded Program of Immunization
ESP Essential Service Package
FP Family Planning
FPI Family Planning Inspector
GOB Government of Bangladesh
GUS Gano Unnayan Sangstha
HA Health Assistant
HPSP Health and Population Sector Program
ICMH Institute of Child and Mother Health
IMR Infant Mortality Rate
IST In-Service Training
JICA Japan International Cooperative Agency
LD Line Director
LD-IST Line Director, In-Service Training
LTO Lead Training Organization
M&E Monitoring and Evaluation
MIS Management Information System
MO Medical Officer
MO MCH Medical Officer Maternity and Child Health
xii
MOCC Medical Officer Clinical Contraception
MOCS Medical Officer Civil Surgeon
MOHFW Ministry of Health and Family Welfare
NGO Non-Governmental Organization
NIPORT National Institute of Population Research and Training
PM Program Manager
PSTC Population Services and Training Center
P/TNA Performance/Training Needs Assessment
QoC Quality of Care
RH Reproductive Health
RMO Resident Medical Officer
RTC Regional Training Center
SC Satellite Clinic
SDP Service Delivery Point
TMIS Training Management Information System
TOT Training of Trainers
TTT Training Technology Transfer
TTU Technical Training Unit
UFPO Upazila Family Planning Officer
UHC Upazila Health Complex
UHFPO Upazila Health and Family Planning Officer
USAID United States Agency for International Development
Executive Summary xiii
Executive Summary Introduction
The Government of Bangladesh (GOB) launched the Health and Population Sector Program (HPSP) in 1998 to improve the health of women, children, and other vulnerable segments of society. To achieve this goal, the GOB has begun to reorganize and integrate vertical health services to deliver an Essential Service Package (ESP) at Upazila level and below. Some 13,500 community clinics (CCs) are being constructed to serve as one-stop ESP service delivery points (SDPs). A health program of this magnitude requires enormous human resources. Therefore, a TTU was established, under the Line Director for In-Service Training (LD-IST), to plan, manage, and coordinate the training of health care personnel. To support the LD-IST, a number of Lead Training Organizations (LTOs), from both the public and the non-governmental organizations (NGOs) sectors, are helping develop curricula, conduct Training of Trainers (TOT), as well as support decentralized training at the district and Upazila levels. Altogether, the LD-IST is mandated to provide training to about 100,000 workers in the Health and Population Sector.
To guide this effort, the Ministry of Health and Family Welfare (MOHFW) approved a National In-Service Training (IST) Strategy and Action Plan for the ESP 1999-2003. This strategy calls for an IST Monitoring and Evaluation (M&E) Plan and for a Baseline Survey to establish the early status of selected indicators. The TTU, with the technical assistance of PRIME, a cooperating agency of United States Agency for International Development (USAID), developed and implemented the M&E Plan and the present Baseline Survey.
The broad objectives of this survey are:
• To assess the capacity of the TTU, and the LTOs, to plan, manage, monitor, and evaluate training related activities at the central level;
• To assess the capacity of District Training Coordination Committee (DTCC) and District/Upazila Training Team (DUTT) members to manage training related activities at the district and Upazila levels;
• To assess the existing supervisory mechanisms for the service providers;
• To assess provider performance at the SDPs; and,
• To assess client reactions toward providers and SDPs.
Methods and Materials Achieving the baseline survey objectives required data collection at two levels:
• At the institutional level: This level includes the TTU, five LTOs, 12 DTCCs, and 36 DUTTs. A multistage random selection procedure selected DTCCs and DUTTs. Ten TTU members, ten LTO trainers (two from each of five LTOs), 23 DTCC members, and 70 DUTT members provided data through interviews using semi-structured questionnaires, which were prepared separately for each institutional level.
• At the SDP level: A multistage random sampling strategy selected 36 Upazilas of 12 districts under three divisions. One hundred fifty-six SDPs within these Upazilas were
xiv Baseline Survey Report: In-Service Training, HPSP, Bangladesh
then selected based on the status of CC construction. Interviewers collected data from 153 immediate supervisors (one Assistant Health Inspector (AHI) or Family Planning Inspector (FPI) from each SDP), 333 field service providers (one Health Assistant (HA) and one Family Welfare Assistant (FWA) from each SDP) using a semi-structured questionnaire. A performance assessment checklist was used to observe directly 288 field service providers (one HA and one FWA from each SDP). In addition, 289 clients answered an interview questionnaire to assess their perception of ESP services at the SDPs.
Results TTU
At the time of the survey, the TTU was operating with six professional staff and several vacant positions. Four of these professionals have experience as physicians, one is a lecturer, and one is an audio-visual (AV) engineer. Other TTU staff has technical, secretarial, or support backgrounds.
Sixty percent of the respondents stated they had written job descriptions. Fifty percent of the TTU members reported that they had carried out many additional activities not included in their job descriptions. Sixty percent of the TTU members said they had read the National In-Service Training Strategy and the In-service Training Guidelines, while 40% had read the draft National In-service Training Standards. None of the respondents had seen the training and monitoring plan or knew the exact ESP training targets to be achieved. However, most of the respondents were aware that targets for training had not been met. Half of the TTU personnel felt frustrated that all trainees got certificates, even if a trainee was obviously deficient. They suggested that a standard of performance should be met before a trainee could receive a certificate of completion.
Thirty percent of TTU respondents said that they had enough supplies and materials. Seventy percent of the TTU members said there was no organizational policy for continuing education. Sixty percent of the TTU members felt they lacked the skills and knowledge to do their jobs adequately. The remaining 40% felt they had adequate skills, but were interested in continuing education and training in order to improve their job performance. When asked to make specific suggestions, respondents provided a list of needs, including: instruction in modern training techniques and the English language, along with continuing training in needs assessment, financial management, preparing AV aids, computer use, etc.
LTOs
Seventy percent of the trainers had held their current positions for more than three years. Eighty percent of the trainers had written job descriptions but 70% said they performed tasks not included in their job descriptions. Most of the trainers (80%) did not know the exact target number and 70% did not know how many workers had already been trained. The trainers (80%) said they had a reporting system for monitoring or evaluating training. Only 40% of trainers stated they had ever seen or read the National In-Service Training Strategy and the draft National In-Service Training Standards; while 90% of them had read the ESP Training Guidelines.
Executive Summary xv
Fifty percent of the trainers reported that they had followed-up their trainees in the field. Sixty percent of trainers used checklists to evaluate trainees’ performance. Most trainers felt hesitant and uncomfortable sharing poor performance results with trainees, but many said they had given individual guidance to “weak” trainees. They also reported informing supervisors if trainees were deficient in certain areas, or if trainees needed refresher courses.
With regard to the working environment, 50% of the trainers reported that they had received training supplies as needed. The remaining 50% received needed supplies each month or “infrequently,” which they said made it difficult to appear professional when providing training. Eighty percent of the trainers reported that their organization had no written policy for continuing education. Ninety percent of the LTO personnel felt that they had adequate skills and knowledge, while 60% stated they needed additional skills and knowledge to do their jobs well.
DTCC
The majority of the DTCC members (74%) had been in their position between six months to three years. Eighty-seven percent of the respondents said that they had a job description. Eighty-seven percent of them had had a TOT course and 30% had received TOT on Basic ESP Training. Only 9% of the respondents had been trained in monitoring and supervision.
Ninety-six percent of the respondents reported that they participated in training related activities. The major areas of involvement were planning, organizing, and conducting training. There was little involvement in designing curriculum, preparing resources or documentation. Seventy-four percent of the respondents said that they had planned training jointly with others, although only 4% of the DUTT members reported participating in planning. Seventy-four percent of the respondents reported using their own venue for training, while 26% of them rented private venues. Ninety-six percent of the respondents said they had encountered some problems in conducting training.
Regarding performance feedback and organizational support, 52% of the respondents had received follow-up help while they were conducting training. Sixty-seven percent of these were followed up by their trainers and 42% were followed up with the use of a checklist. Eighty-three percent of those followed up received feedback on their performance. Fifty-seven percent said that they monitored training activities at the district and Upazila levels, but only 8% used TTU supplied checklists. Fifty-two percent of the respondents reported that they had followed up trainees at worksites and 67% of them used checklists. Thirty-three percent of the respondents reported that they provided feedback through monthly meetings held at the Upazila Health Complex (UHC), while 38% provided feedback verbally on the spot and only 29% provided feedback via written notes. In terms of using the results of monitoring and follow-up, 61% of the respondents mentioned that they had used the results for planning, problem identification, and designing interventions.
Seventy percent of the respondents stated that they kept records of training and 69% of them kept files. In addition, 74% of the respondents sent training records to different stakeholders. Of these respondents, 48% sent training records to the respective LDs and Program Managers (PMs), 33% to TTU and 19% to others. Only 22% of the respondents reported that they knew about the Training Management Information System (TMIS) and 91% did not know the person responsible for sending information to the TMIS.
xvi Baseline Survey Report: In-Service Training, HPSP, Bangladesh
District/Upazila Training Team (DUTT)
The majority of the respondents (66%) had held their current position for six months to three years. Ninety-three percent of the respondents reported that they had a job description. Only 24% of the DUTT members mentioned training as one of their main jobs. A majority of the respondents had received some ESP training, either through the Five-day Orientation (63%) or through the TOT on the Basic ESP course (61%). Only a few (10%) of the respondents had ever received training in monitoring and supervision. Almost all of the respondents felt the need for some additional training; and a majority expressed the need for training in administration and financial management (63%) and in specialized skills (58%). Eighty-one percent of the respondents reported that they were involved in training activities, and 64% of them felt that training activities interfered with their main jobs. The training activities in which respondents were most frequently involved were planning (54%), organizing (61%), managing (56%), and conducting training (66%). They participated infrequently in curriculum development (16%) and training documentation (13%).
The majority of the respondents (81%) reported that they did not have a training calendar to organize training and that they did not use any training guidelines for planning (66%). In addition, only 13% of the respondents mentioned the involvement of DTCC members in joint planning. Regarding the disbursement of training funds, 47% of the respondents had received funds to organize training. Of these; a majority (58%) faced some problems with the funding, and 42% reported that funds did not arrive on time. Eighty-six percent of the respondents stated that they had organized training in their own building and the rest of them rented space or utilized other public or private facilities. Respondents reported that they had encountered problems during training. Their suggestions on how to overcome these problems included: arranging accommodation for trainees (43%), supplying logistics in a timely manner (36%), providing sufficient teaching aids (36%), ensuring the timely flow of funds (27%), employing skilled trainers (24%), improving monitoring and follow-up (17%), and getting communications in advance (10%).
Regarding performance feedback and organizational support, 34% of the respondents stated that they received follow-up during training. Only 33% of the trainers of these respondents had used checklists. Seventy-five percent received feedback on their performance. Most respondents had not yet received key documents from the TTU, needed to guide and support their training, such as the ESP training strategy (70%), standards (84%) and guidelines (67%). Of those who had received the Basic ESP Training Guidelines, only 30% had used the checklists for follow-up of trainers and providers.
In respect to supervision and follow-up, 53% of the respondents mentioned that they had followed up the performance of providers at worksites. Of these respondents, 43% used checklists. Only 23% of the respondents reported that the trainers prepared the follow-up plan according to Basic ESP Training Guidelines. In terms of frequency of follow-up visits, 37% of the respondents said they checked providers every month as a matter of routine. With regard to training monitoring, 36% of the respondents reported that they were involved in the M&E of training at the provider worksite level. Only 12% of them used the TTU-provided checklists.
Seventy-three percent of the respondents reported that they kept records of training, and a majority of them (67%) kept records in files. On the other hand, 39% of the respondents
Executive Summary xvii
reported that they did not send training records anywhere. Regarding TMIS, only 24% of the respondents knew about it and none knew that the Upazila Family Planning Officer (UFPO) was responsible for sending information to the TMIS.
Immediate supervisors (AHI/FPI) of providers
All AHIs and FPIs interviewed for this survey mentioned that they were the immediate supervisors of service providers (HAs and FWAs) working in CC and satellite clinic (SC), or SDPs. Very few of the respondents had ever received training in management (26%) or supervision (30%). Moreover, the majority of these respondents (77% in management and 65% in supervision) had received this training more than three years ago.
Performance of providers (HA and FWA)
Forty-three percent of the respondents reported that they had a new job description but very few of them (16%) could show it to the interviewers. Out of 333 respondents, only 25 (8%) had received their 21-day Basic ESP Training. Of these, 68% felt that they could use the knowledge and skills gained from the course. Seventy-six percent of these trained respondents felt that the course would be more useful if it were strengthened in certain subject areas, such as health (63%), family planning (FP) (16%), and ESP services (11%). Only 18% of these trained respondents had been followed up at the worksite by their trainers.
The majority of the respondents (65%) reported that they had enough supplies to treat patients. The results showed differences in the availability of supplies between CCs and SCs. Seventy-six percent of the CCs lacked supplies and equipment but only 32% of the SCs did. The Facility Assessment of the clinics, which was conducted as part of the survey, had similar findings. Thirty-nine percent of the respondents at CCs and 55% of the respondents at SCs reported that they had never run out of drugs. Forty-eight percent of the respondents stated that they had reference materials at the clinic, which they could consult to treat their patients. Providers were observed and scored in their performance of ten routine skills. Average performance scores of all providers was 10.4%, with a statistically significant difference (p<0.01) between providers at CCs (6.4%) and SCs (14.7%).
Clients
Eighty-four percent of the clients interviewed were female. The mean age of the respondents was 28.7 years, with most (70%) in the age group of 21-40 years. The majority (87%) of the clients reported that it took them 1-30 minutes to come to the clinics. Most of the clients came to the clinics for reproductive health (RH) services (36%), immunization (26%), and limited curative care (45%). The majority of the clients at the SCs came for RH care (42%) and immunization services (39%); while the majority of the clients at the CCs needed limited curative care (58%).
Ninety-three percent of the respondents reported that they felt comfortable asking the providers questions. Sixty-seven percent of the respondents reported that the providers had discussed problems with them. When asked about the adequacy of supplies for their prescribed treatment, the majority (72%) of the patients interviewed reported that the clinics had the needed supplies. However, the respondents’ opinion with regard to supplies varied by type of clinic. Sixty-four percent of the respondents at the CCs and 81% of the respondents at the SCs reported that the clinics had supplies to treat patients. This indicates
xviii Baseline Survey Report: In-Service Training, HPSP, Bangladesh
that the CCs, which provided a wider range of services, were more likely to lack needed supplies. Fifty-four percent of the respondents reported that they had seen the providers wash their hands; and this finding was similar in frequency irrespective of the type of clinic (CC or SC), despite the fact that CCs (unlike SCs) are supplied with tube-well water on the premises. The majority (81%) of respondents said that they would return to the clinics for a follow-up visit or for other services, as instructed by the provider. Sixty-five percent of the respondents reported that they had received some advice from their providers, such as whether to schedule a return visit to the clinic, referrals to other providers or clinics, health education and treatment instruction, etc.
Conclusions As a training coordination unit, the TTU should have clear job expectations, which should be reflected in job descriptions for all staff members. All professional staff should be fully conversant and familiar with the key program documents, i.e., IST strategy, standards, guidelines, and monitoring and follow-up systems. They should be able to help the LTOs to follow these standards and guidelines. They should always be up-to-date on the status of their training targets and achievements.
All the LTOs were well staffed with experienced trainers, but there were deficiencies in their working environments. LTO trainers should also demonstrate familiarity and compliance with the training strategy, standards, and the monitoring and follow-up system. IST should emphasize strengthening the LTOs’ training capacity and assuring smooth coordination with the LTOs, including the timely flow of funds.
Most of DTCC and DUTT members were involved in training related activities but were not yet familiar with the national training strategy, standards and guidelines. As a result, follow-up of trainees at worksites rarely occurred, despite its prominence as an important and integral task required under Basic ESP Training Guidelines.
Only a few (8%) service providers had received their Basic ESP Training at the time of survey. These trained providers suggested improvements in some clinical skill-based areas of the 21-day Basic ESP Curriculum. They also made suggestions for the improvement of worksites so that they could better utilize their knowledge and skills. At the time of the survey, most of the CCs lacked essential equipment and supplies.
The providers were observed serving all levels of clients, between the ages of two months to 75 years. The majority of their clients were female, aged 21-40 years. At CCs, most of the clients needed limited curative care. At SCs, which at the time of the survey were more adequately supplied and equipped than CCs, comparatively more clients needed immunization and RH services.
Introduction 1
Introduction Background
With a population of almost 130 million, Bangladesh continues to grow at a rate of 1.5% annually.1 The country has undergone considerable development in many sectors during the last few years, but health indicators continue to be among the most dismal in the world. The Infant Mortality Rate (IMR) is 57/1000 live births and under-5 mortality is 116/1,000.1 Maternal mortality stands at three per 1,000 live births. Life expectancy is 59.8 years for females and 60 years for males.1 The Total Fertility Rate (TFR) is 3.3.2 Seventy percent of the mothers suffer from nutritional deficiency.3 Seventy-five percent of pregnant women do not receive antenatal care or assistance from a trained attendant at the time of birth, and less than 40% of the population has access to basic health care.3 The health system is characterized by underutilization of health services, particularly at the community level, overcrowding of health services at the district and central levels, and the inequitable distribution of funds between urban and rural areas. Moreover, users perceive the quality of care (QoC) to be poor.3
The MOHFW of the People’s Republic of Bangladesh has made a commitment to improve the quality of health care for its people. The HPSP, implemented in 1998, is designed to reorganize vertical health services into an integrated ESP that offers quality health care services at the community level.3 The goal of the program is to improve health, especially of poor women and children, and to increase the utilization of health services at the local level. The program is now building 13,500 CCs, each of which will serve about 6,000 people. The CCs will offer RH, Child Health, Communicable Disease Control, and Limited Curative Care services.3 To reach this important goal, Bangladesh must train large numbers of health and family welfare personnel. High quality training is vital to ensure that the people of Bangladesh receive better health care.
IST under HPSP The Technical Training Unit (TTU) of the IST Sector under HPSP has been mandated to train nearly 100,000 health and family welfare personnel in the ESP area to assure high quality care at the Upazila level and below. To ensure quality training, the TTU has developed a “National In-Service Training Strategy and Action Plan for ESP, 1999-2003.” This plan has six strategic objectives: 4
1 Bangladesh Bureau of Statistics (BBS). 2000. Statistical pocket book of Bangladesh 1999. Dhaka: BBS. 2 Mitra S N, Al-Sabir A, Cross A R and Jamil K. 1997. Bangladesh Demographic and Health Survey (BDHS),
1996-97. Calverton, Maryland and Dhaka, Bangladesh: NIPORT, Mitra and Associates, and Macro International Inc.
3 Program Implementation Plan (PIP), Part-1, April 1998. Health and Population Sector Program 1998-2003. MOHFW, Dhaka, Bangladesh.
4 National In-Service Training Strategy and Action Plan for ESP, 1999-2003. Line Director IST, MOHFW, 1999. Dhaka.

Baseline Survey Report: In-Service Training, HPSP, Bangladesh 2
1. To strengthen central-level capacity to plan, implement, and follow-up ESP training;
2. To standardize the process of planning, implementing, and following up IST;
3. To strengthen the capacity of LTOs to serve as leaders in the training of Upazila-level trainers;
4. To strengthen Upazila-level capacity to plan, implement, manage, supervise, and evaluate training activities;
5. To conduct and follow-up the training of personnel at the Upazila level and below in order to improve service quality and to increase coverage of the population; and,
6. To develop the TMIS while enhancing evaluation capabilities at the central and Upazila levels in order to record and assess the effects and impact of decentralized training on the availability and quality of ESP services.
Evaluation plan The TTU will evaluate the IST Program using a pre-post test evaluation design. In addition, there will be Annual Program Reviews (APR) and continuous reporting by the TMIS. With funding by the USAID, PRIME-HPSP has helped the TTU to develop its M&E plan and TMIS.
A baseline assessment has been conducted to establish the early status of selected indicators under the TTU’s M&E plan. The broad objectives of the survey are:
1. To assess the capacity of the TTU and LTOs to plan, manage, monitor, and evaluate ESP IST related activities at the central level;
2. To assess the capacity of DTCC members and DUTT members to manage training related activities in districts and Upazilas;
3. To assess existing supervisory mechanisms for the service providers;
4. To assess provider performance at the SDPs; and,
5. To assess client reactions to providers and SDPs.
Methodology 3
Methodology Study design
The baseline survey required data collection at two levels:
1. At the institutional level, to assess the capacity of the TTU, LTOs, districts and Upazilas; and,
2. At the SDP level, to assess QoC, including provider performance, factors affecting it, and satisfaction of clients and the community as a whole.
Sample strategy A needs assessment was initiated for the purpose of gathering data on the performance and training needs of the TTU at the Directorate General of Health Services (DGHS) in Mohakhali, Dhaka. The performance improvement approach was used as a model for the needs assessment in order to develop qualitative and quantitative indicators of the TTU’s performance. Each member of the TTU, including professionals, managers, trainers and office support staff, was able to express his or her views, needs, and suggestions during individual interviews.
To assist the TTU, five LTOs were contracted at the national level to conduct different types of training activities under the IST strategy. A similar needs assessment was conducted at the following LTOs.
1. National Institute of Population Research and Training (NIPORT)
2. Institute of Child and Mother Health (ICMH)
3. Training Technology Transfer (TTT)
4. Population Services and Training Center (PSTC)
5. Gano Unnayan Sangstha (GUS)
NIPORT and ICMH are government organizations, while TTT, PSTC, and GUS are NGOs.
A multistage sampling strategy was adopted for the baseline survey at the district, Upazila, and SDPs, ensuring a maximum sampling error at the 95% confidence level.
• First stage – Three (50%) out of the six divisions were selected. Two divisions (Chittagong Division and Rajshahi Division) were selected purposefully and one division (Khulna Division) was selected randomly from the remaining four divisions. Chittagong division, which is hilly, less accessible, and has a greater tribal population, is a low performing area. Rajshahi division, which is on a plain and easily accessible, is a high performing area.
• Second stage – 12 districts were randomly selected (20% of the districts in each sampled division). Of these 36 Upazilas (two to four Upazilas from each district based on population) were randomly selected.
• Third stage – 156 CCs or SCs were selected as SDPs from 12 districts (13 SDPs per district).

Baseline Survey Report: In-Service Training, HPSP, Bangladesh 4
Tools, sample populations and data collection methods Tool to review current status of performance issues in the TTU (semi-structured)
Ten out of 11 members of the TTU were interviewed at their respective offices during February and March 2001. Questions were formulated to cover performance improvement factors, including: 1. Clear Job Expectations; 2. Immediate Performance Feedback; 3. Adequate Physical Environment and Tools; 4. Motivation; 5. Organizational Support; 6. Appropriate Knowledge and Skills.
The TTU is responsible for the development, coordination, and management of the ESP IST program, and many of its members do not conduct actual training. Therefore, it was not possible to observe them during ESP training. However, appropriate members assessed their own training skills. The results of these self-assessments are contained in this report. See Appendix D.1.
Tool to review performance issues in the LTOs (semi-structured)
Ten trainers – two from each LTO – were interviewed at their respective institutes during February and March 2001. In addition, Directors of Training were asked questions and their responses were compared with those of the trainers. Questions covered the six performance improvement factors listed above. See Appendix D.2.
District level Performance/Training Needs Assessment (P/TNA) and baseline capacity assessment tool (semi-structured)
Twenty-three DTCC members – approximately one from the Civil Surgeon (CS) Office and one from the Deputy Director Family Planning (DDFP) Office in each of the 12 districts – were interviewed to assess their capacity in training related activities at district level. See Appendix D.3.
Upazila level P/TNA and baseline capacity assessment tool (semi-structured)
Seventy DUTT members from 36 Upazilas – about two from each Upazila – were interviewed to assess their capacity in training related activities at Upazila level. See Appendix D.4.
Competence assessment tool of immediate supervisors of field service providers (semi-structured)
One hundred and fifty three immediate supervisors – one AHI or one FPI from each SDP – were interviewed at CCs and SCs to assess their competence in supervising providers at their worksites. See Appendix D.5.
Service provider’s competence assessment tool (semi-structured)
In all, 333 field service providers – one HA and one FWA from each SDP – were interviewed to assess their competence in delivering ESP at their SDPs. See Appendix D.6.
Methodology 5
Provider’s performance observation checklist at worksite
Delivery of service by 288 providers – one HA and one FWA from each SDP – was directly observed, using a performance checklist to assess actual performance whenever possible. See Appendix D.7.
Exit interview tool for clients at SDP (semi-structured)
To assess client perceptions of ESP services at SDPs, two clients – one served by an HA and one served by an FWA – were interviewed immediately after they received services from the providers. In all, 289 clients were interviewed. See Appendix D.8.
Facility (equipment, furniture and logistic supplies) assessment checklist for SDPs
A checklist was used to assess the availability of equipment, furniture, and logistic supplies at 141 SDPs in one Upazila, the Sitakund of Chittagong District. The survey team could not visit SDPs because providers and their supervisors were attending a routine monthly staff meeting at the Upazila. See Appendix D.9.
Orientation of surveyors and data collection A one-day workshop was organized to orient the interviewers from the TTU, 5 LTOs, and the Japan International Cooperative Agency (JICA). The interviewers, 23 of whom were nationals and two of whom were expatriates, were familiarized with tools and interview techniques and terms of reference of team leader and members. The workshop also stressed the importance of obtaining each interviewee’s consent and assuring his or her confidentiality. Team leaders and members were briefed in detail on the terms of reference during data collection. A central team of ten to 15 members completed data collection in six stages (by division) from February to May 2001. A tour program for data collection was developed and disseminated to the sampled districts and Upazilas at least one week before each field visit. The survey teams were primarily composed of PRIME-HPSP and LTO staff. The PRIME-HPSP National Consultant for Training Evaluation, acted as the Baseline Survey Team Leader.
Data collection at institutional level
At the TTU, LTO, district, and Upazila levels, information was collected from key informants using an interview schedule to assess the capacity of various institutions. PRIME staff collected information from the TTU, LTOs, and DTCC members, while PRIME and LTO staff collected information at the Upazila levels.
Data collection at the SDP level
PRIME and LTO staff collected CC/SC level information from immediate supervisors, providers, and clients. DTCC members, DUTT members, and supervisors accompanied and assisted central team members for data collection from SDPs.
Data Processing and Analysis The team leader developed a detailed workplan and timeline for data processing, i.e., data cleaning, editing, coding responses, computing, and analysis. Three interested and experienced staff members involved in data collection were assigned to data processing activities during the month of June 2001. All tools were sorted and marked by serial
Baseline Survey Report: In-Service Training, HPSP, Bangladesh 6
numbers. Data code plans were developed for each tool. Following the coding plan, structured responses were initially coded. For open questions, responses were listed and then categorized for coding. Database formats were developed in Microsoft (MS) Excel and SPSS 11.5 for each data collection tool. Data were entered in MS Excel to generate individual data work sheets, which were then rechecked with a 15% tool chosen with a systematic random sample selection procedure.
In late June 2001, with assistance of the PRIME Regional Evaluation Manager, the data analysis plan was developed. Data were then transferred from MS Excel to a SPSS database and analyzed accordingly.
Results 7
Results TTU
Introduction
After inception of the HPSP, the TTU was established as the operational unit for the management, coordination, and implementation of the IST Strategy and Action Plan. The TTU is responsible for developing policies, guidelines, performance indicators, and curricula in accordance with service delivery priorities and guidelines. The TTU is also responsible for developing training standards and tools to measure trainer, provider, and system-wide performance against agreed-upon criteria. The TTU thus contributes to the goal of decentralizing the IST program, by building capacity at the central (LTOs), district (DTCC), and Upazila (DUTT) levels.
Clear job expectations
Eighty percent of the TTU members had been in their positions since the TTU was formed in mid-1998. At the time of the survey, there were six professional staff positions, including one PMs, two Deputy Program Managers (DPMs), two Training Specialists and one AV Officer. Several additional positions were vacant. All of the professionals were males, between 30 and 57 years old. Four had backgrounds as physicians, one member was a lecturer, and the remaining had technical, secretarial, or support backgrounds. There were two women on the TTU staff; one was a secretary and the other was a data enterer.
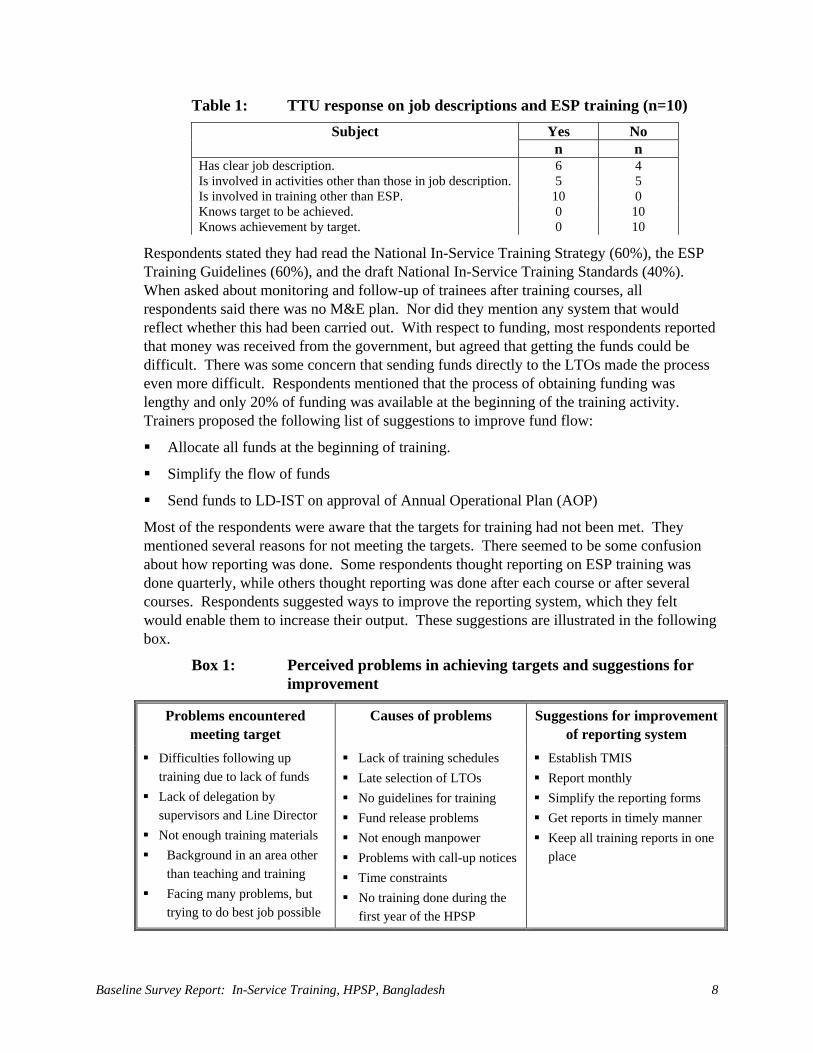
Table 1 shows that 60% of the respondents stated they had written job descriptions. Those without job descriptions said they knew what to do in their jobs most of the time because someone had told them what their responsibilities were. There was confusion, mainly among the secretarial staff, about job responsibilities. Fifty percent of the TTU members reported doing activities not mentioned in their job descriptions. Of these, approximately 50% felt that those activities interfered with their ability to carry out their primary responsibilities. The majority said their responsibilities included all IST, not limited to the ESP program.
Regarding the targets to be achieved, no respondent knew the exact number to be trained in ESP related areas. One half of respondents thought they knew a general figure, but could not relate this at the time of interview. Nor could they tell interviewers how many had already been trained (Table 1).
Baseline Survey Report: In-Service Training, HPSP, Bangladesh 8
Table 1: TTU response on job descriptions and ESP training (n=10) Yes No Subject n n
Has clear job description. 6 4 Is involved in activities other than those in job description. 5 5 Is involved in training other than ESP. 10 0 Knows target to be achieved. 0 10 Knows achievement by target. 0 10
Respondents stated they had read the National In-Service Training Strategy (60%), the ESP Training Guidelines (60%), and the draft National In-Service Training Standards (40%). When asked about monitoring and follow-up of trainees after training courses, all respondents said there was no M&E plan. Nor did they mention any system that would reflect whether this had been carried out. With respect to funding, most respondents reported that money was received from the government, but agreed that getting the funds could be difficult. There was some concern that sending funds directly to the LTOs made the process even more difficult. Respondents mentioned that the process of obtaining funding was lengthy and only 20% of funding was available at the beginning of the training activity. Trainers proposed the following list of suggestions to improve fund flow:
Allocate all funds at the beginning of training.
Simplify the flow of funds
Send funds to LD-IST on approval of Annual Operational Plan (AOP)
Most of the respondents were aware that the targets for training had not been met. They mentioned several reasons for not meeting the targets. There seemed to be some confusion about how reporting was done. Some respondents thought reporting on ESP training was done quarterly, while others thought reporting was done after each course or after several courses. Respondents suggested ways to improve the reporting system, which they felt would enable them to increase their output. These suggestions are illustrated in the following box.
Box 1: Perceived problems in achieving targets and suggestions for improvement
Problems encountered meeting target
Causes of problems Suggestions for improvement of reporting system
Difficulties following up training due to lack of funds
Lack of delegation by supervisors and Line Director
Not enough training materials Background in an area other
than teaching and training Facing many problems, but
trying to do best job possible
Lack of training schedules Late selection of LTOs No guidelines for training Fund release problems Not enough manpower Problems with call-up notices Time constraints No training done during the
first year of the HPSP
Establish TMIS Report monthly Simplify the reporting forms Get reports in timely manner Keep all training reports in one
place
Results 9
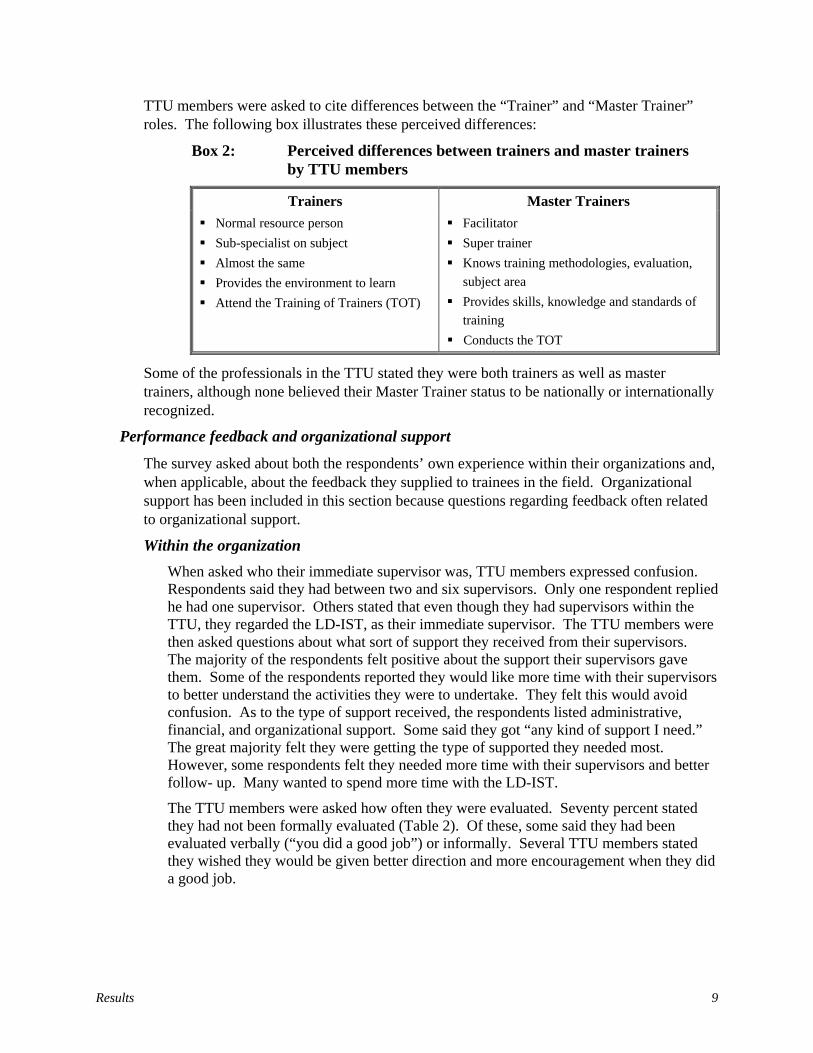
TTU members were asked to cite differences between the “Trainer” and “Master Trainer” roles. The following box illustrates these perceived differences:
Box 2: Perceived differences between trainers and master trainers by TTU members
Trainers Master Trainers Normal resource person Sub-specialist on subject Almost the same Provides the environment to learn Attend the Training of Trainers (TOT)
Facilitator Super trainer Knows training methodologies, evaluation,
subject area Provides skills, knowledge and standards of
training Conducts the TOT
Some of the professionals in the TTU stated they were both trainers as well as master trainers, although none believed their Master Trainer status to be nationally or internationally recognized.
Performance feedback and organizational support
The survey asked about both the respondents’ own experience within their organizations and, when applicable, about the feedback they supplied to trainees in the field. Organizational support has been included in this section because questions regarding feedback often related to organizational support.
Within the organization When asked who their immediate supervisor was, TTU members expressed confusion. Respondents said they had between two and six supervisors. Only one respondent replied he had one supervisor. Others stated that even though they had supervisors within the TTU, they regarded the LD-IST, as their immediate supervisor. The TTU members were then asked questions about what sort of support they received from their supervisors. The majority of the respondents felt positive about the support their supervisors gave them. Some of the respondents reported they would like more time with their supervisors to better understand the activities they were to undertake. They felt this would avoid confusion. As to the type of support received, the respondents listed administrative, financial, and organizational support. Some said they got “any kind of support I need.” The great majority felt they were getting the type of supported they needed most. However, some respondents felt they needed more time with their supervisors and better follow- up. Many wanted to spend more time with the LD-IST.
The TTU members were asked how often they were evaluated. Seventy percent stated they had not been formally evaluated (Table 2). Of these, some said they had been evaluated verbally (“you did a good job”) or informally. Several TTU members stated they wished they would be given better direction and more encouragement when they did a good job.

Baseline Survey Report: In-Service Training, HPSP, Bangladesh 10
Table 2: TTU response on monitoring, follow-up and performance feedback system (n=10)
Yes No Subject % (n) % (n)
Has monitoring and follow-up plan 0 (0) 100 (10) Is evaluated by supervisors 30 (3) 70 (7) Follows up trainees in the field using checklist 10 (1) 90 (9) Has minimum level of performance required 50 (5) 50 (5) Shares results of supervision with trainees 50 (5) 50 (5)
When asked whether they had ever been observed during a training session, 66% of those staff members directly involved in training (excluding technical and office support personnel) answered that they had been observed and received a letter grade (A, B, etc.). But they did not mention any follow-up in terms of supportive supervision, such as suggestions about how they could improve their performance.
When asked how their supervisor reacted if they did a “good job” or a “bad job,” most TTU members said they received praise for doing good work, though only occasionally. One respondent reported that the LD-IST was the only supervisor who had ever complimented him/her for work well done. Several of the respondents reported they would like to be given more encouragement. Several respondents reported that, when their work was poor, their supervisors tried to help them improve, told them to do the job over, or asked why they had not done the job properly. One respondent said he had never been told he had done a bad job.
Follow-up in the field
The survey asked TTU members if they followed trainees up in the field. Only one of the respondents said he evaluated trainees in the field after training courses (Table 2). This respondent said he had followed up four individuals and one group of 90 persons in the past month. He used the ESP Training Guidelines Checklist to complete the follow-up evaluation. The other respondents stated they had never done follow-up. (Technical and support staff said follow-up was not part of their responsibility.) When asked what supportive supervision meant to them, TTU members gave the following answers:
• Giving guidance in a non-threatening, non-punishing way
• Coaching on the job
• Giving support as and when needed
• Seeing if a person is not doing a job well and telling them how they can improve their performance
• Identifying the problem and the solution without making the participants feel threatened or afraid
• Informing a person if their performance is poor
Fifty percent of the TTU members who responded agreed there was no minimum level of performance required of trainees to pass a training course (Table 2). They believed trainees should meet standards of performance before receiving a certificate of completion. They felt frustrated that even though some trainees were obviously deficient,
Results 11
all trainees got certificates. Most felt this policy should be changed. One respondent said that 80% should be the passing level and that if trainees did not meet requirements successfully, they should have to attend re-training sessions. As far as sharing positive or negative results from post tests with trainees in the field, half of the TTU members answered they shared the results. The method of sharing results varied. Some felt sitting with the trainee and going over the positive and negative points was important. Another respondent felt it was acceptable to read the scores aloud to the class. Most respondents felt they should be kind and choose their words carefully when sharing negative results with a trainee.
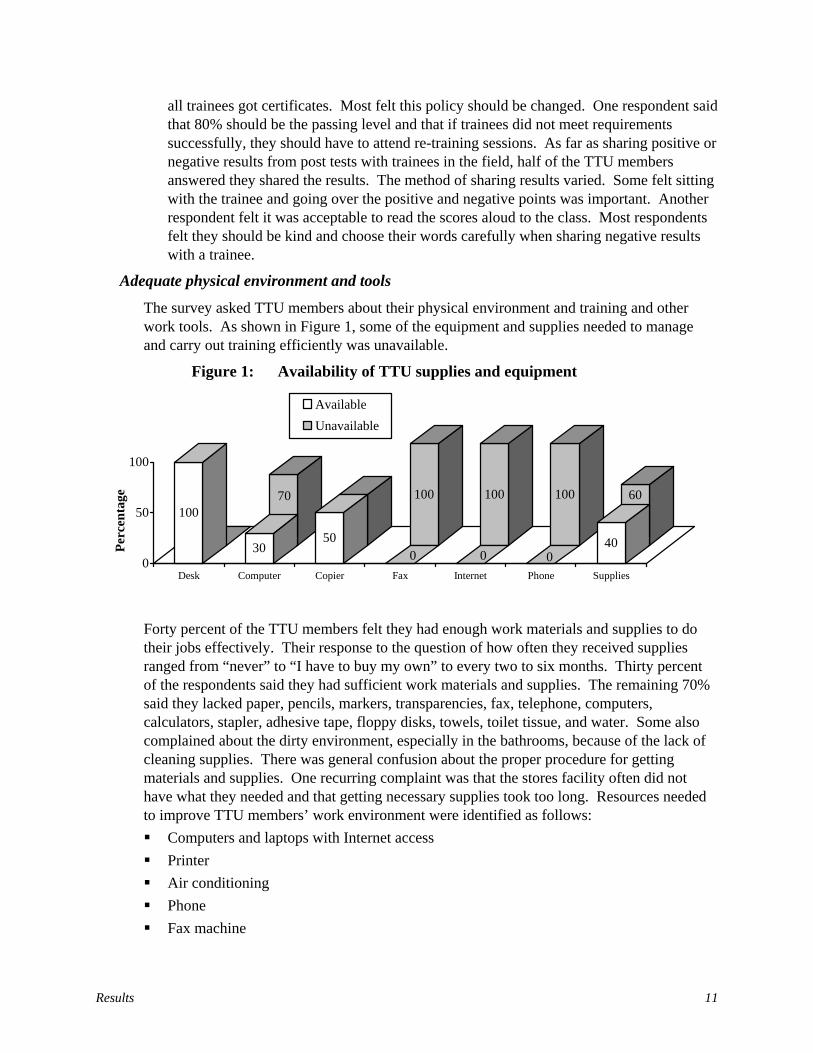
Adequate physical environment and tools
The survey asked TTU members about their physical environment and training and other work tools. As shown in Figure 1, some of the equipment and supplies needed to manage and carry out training efficiently was unavailable.
Figure 1: Availability of TTU supplies and equipment
0
70
50
100 100 100 60100
3050
0 0 040
0
50
100
Perc
enta
ge
Desk Computer Copier Fax Internet Phone Supplies
AvailableUnavailable
Forty percent of the TTU members felt they had enough work materials and supplies to do their jobs effectively. Their response to the question of how often they received supplies ranged from “never” to “I have to buy my own” to every two to six months. Thirty percent of the respondents said they had sufficient work materials and supplies. The remaining 70% said they lacked paper, pencils, markers, transparencies, fax, telephone, computers, calculators, stapler, adhesive tape, floppy disks, towels, toilet tissue, and water. Some also complained about the dirty environment, especially in the bathrooms, because of the lack of cleaning supplies. There was general confusion about the proper procedure for getting materials and supplies. One recurring complaint was that the stores facility often did not have what they needed and that getting necessary supplies took too long. Resources needed to improve TTU members’ work environment were identified as follows: Computers and laptops with Internet access Printer Air conditioning Phone Fax machine
Baseline Survey Report: In-Service Training, HPSP, Bangladesh 12
Accountant Conference room to hold meetings Computer operator or programmer
Motivation
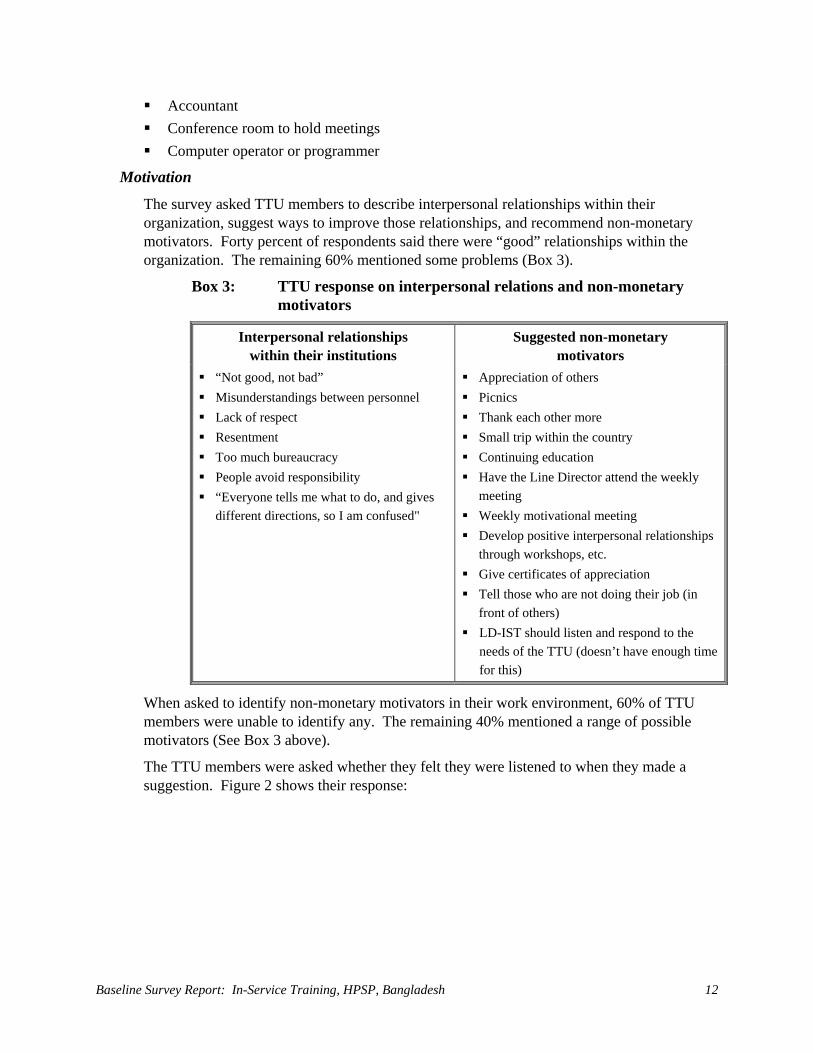
The survey asked TTU members to describe interpersonal relationships within their organization, suggest ways to improve those relationships, and recommend non-monetary motivators. Forty percent of respondents said there were “good” relationships within the organization. The remaining 60% mentioned some problems (Box 3).
Box 3: TTU response on interpersonal relations and non-monetary motivators
Interpersonal relationships within their institutions
Suggested non-monetary motivators
“Not good, not bad” Misunderstandings between personnel Lack of respect Resentment Too much bureaucracy People avoid responsibility “Everyone tells me what to do, and gives
different directions, so I am confused"
Appreciation of others Picnics Thank each other more Small trip within the country Continuing education Have the Line Director attend the weekly
meeting Weekly motivational meeting Develop positive interpersonal relationships
through workshops, etc. Give certificates of appreciation Tell those who are not doing their job (in
front of others) LD-IST should listen and respond to the
needs of the TTU (doesn’t have enough time for this)
When asked to identify non-monetary motivators in their work environment, 60% of TTU members were unable to identify any. The remaining 40% mentioned a range of possible motivators (See Box 3 above).
The TTU members were asked whether they felt they were listened to when they made a suggestion. Figure 2 shows their response:
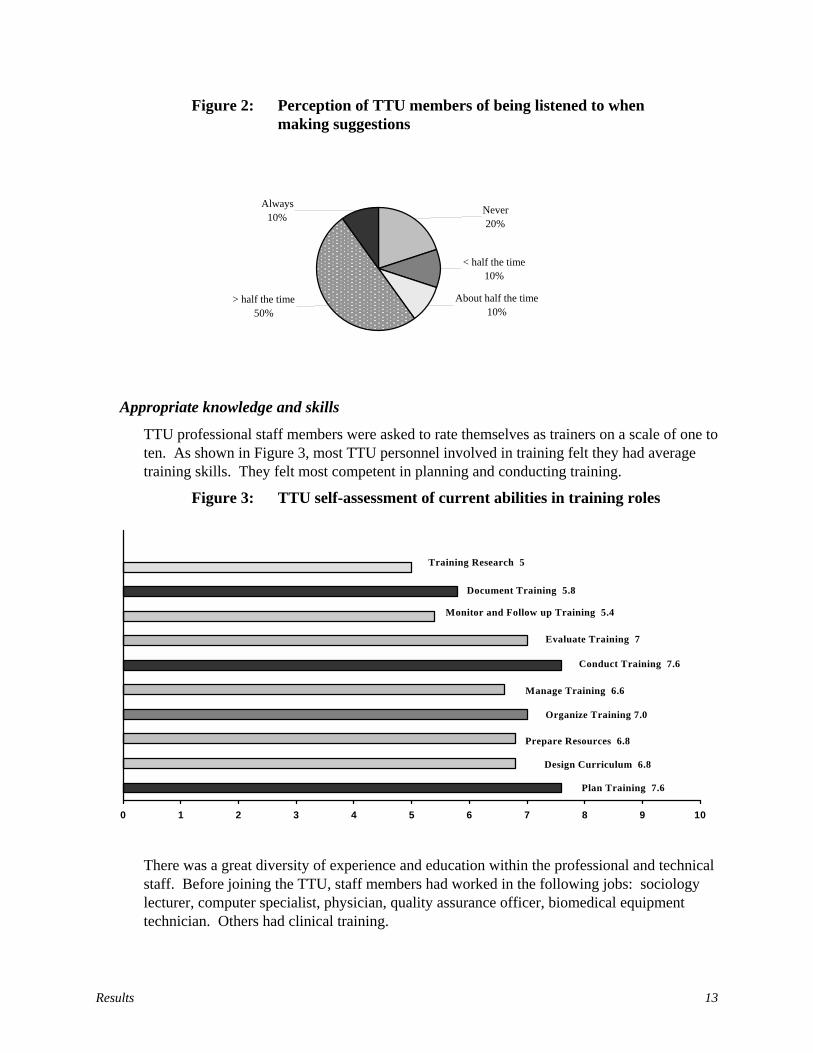
Results 13
Figure 2: Perception of TTU members of being listened to when making suggestions
Appropriate knowledge and skills
TTU professional staff members were asked to rate themselves as trainers on a scale of one to ten. As shown in Figure 3, most TTU personnel involved in training felt they had average training skills. They felt most competent in planning and conducting training.
Figure 3: TTU self-assessment of current abilities in training roles
There was a great diversity of experience and education within the professional and technical staff. Before joining the TTU, staff members had worked in the following jobs: sociology lecturer, computer specialist, physician, quality assurance officer, biomedical equipment technician. Others had clinical training.
Although 70% of TTU members reported their organization had no policy for continuing education, 90% had received some type of continuing education, most within the past year. Only one member of the TTU was aware of a policy for continuing education for government employees, related to age. (“Younger than 40 years old are eligible for PhD training, those above 40 years old are only eligible for diploma education, and after 45 years old are only eligible for orientation courses”). Most respondents had been to training courses within the country, but several had been abroad for specific training related to their TTU responsibilities. All personnel with training responsibilities had attended a TOT course within at least the last two years.
There was a great diversity of experience and education within the professional and technical staff. Before joining the TTU, staff members had worked in the following jobs: sociology lecturer, computer specialist, physician, quality assurance officer, biomedical equipment technician. Others had clinical training.
About half the time10%
< half the time10%
Never20%
> half the time 50%
Always 10%
Plan Training 7.6
Manage Training 6.6
Conduct Training 7.6
Evaluate Training 7
0 1 2 3 4 5 6 7 8 9 10
Training Research 5
Monitor and Follow up Training 5.4
Prepare Resources 6.8
Document Training 5.8
Design Curriculum 6.8
Organize Training 7.0
Baseline Survey Report: In-Service Training, HPSP, Bangladesh 14
Although 70% of TTU members reported their organization had no policy for continuing education, 90% had received some type of continuing education, most within the past year. Only one member of the TTU was aware of a policy for continuing education for government employees, related to age. (“Younger than 40 years old are eligible for PhD training, those above 40 years old are only eligible for diploma education, and after 45 years old are only eligible for orientation courses”). Most respondents had been to training courses within the country, but several had been abroad for specific training related to their TTU responsibilities. All personnel with training responsibilities had attended a TOT course within at least the last two years.
The survey asked TTU members whether they felt they had adequate skills and knowledge to do their jobs well. Sixty percent felt they lacked sufficient skills and knowledge. The remaining 40% felt they had adequate skills, but were interested in continuing education to improve their job performance. When asked what sort of continuing education would help them to do a better job, they made the following suggestions: • Modern training techniques • English language skills • Planning • Organizing • Needs assessment • Behavioral change communication • Managerial skills • Financial training • Preparing AV aids • Computer training, technology, Management Information System (MIS), programming • Latest governmental rules, circulars, financial rules
LTOs Introduction
Three LTOs (ICMH, NIPORT and TTT) are responsible for providing ESP training of district and Upazila trainers. The other two LTOs (PSTC and GUS) provide management support for district and Upazila orientation and training, respectively.
Knowledge of jobs and responsibilities
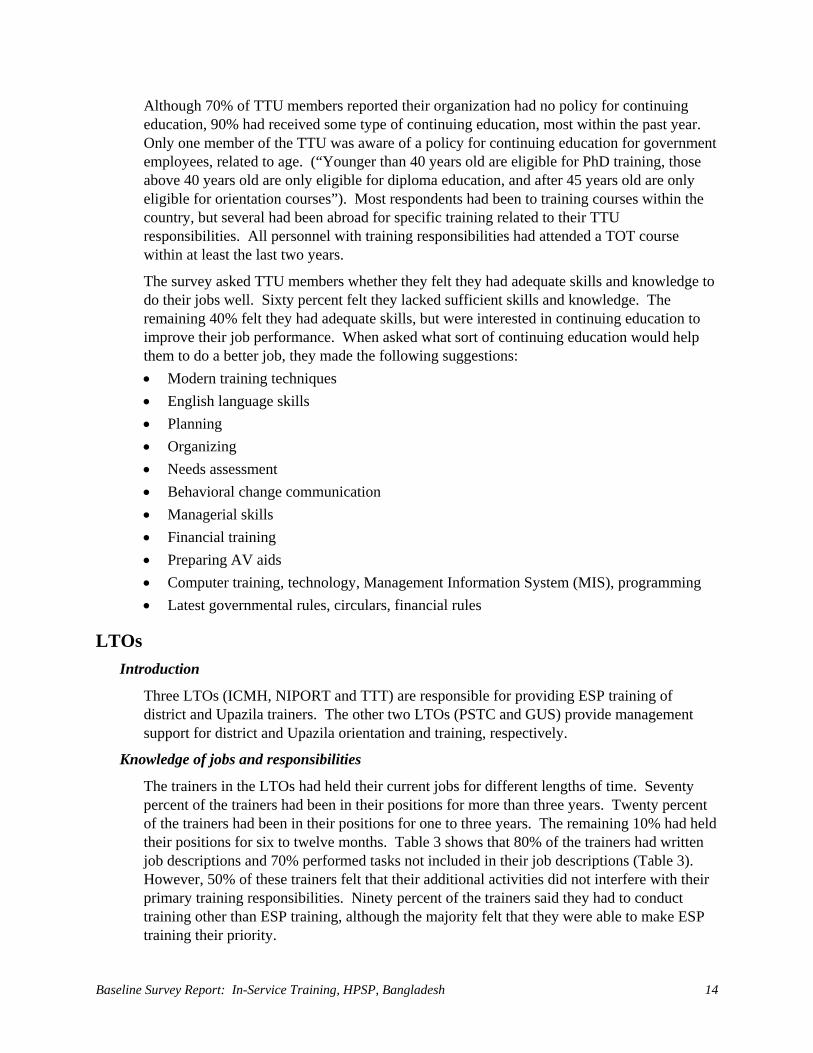
The trainers in the LTOs had held their current jobs for different lengths of time. Seventy percent of the trainers had been in their positions for more than three years. Twenty percent of the trainers had been in their positions for one to three years. The remaining 10% had held their positions for six to twelve months. Table 3 shows that 80% of the trainers had written job descriptions and 70% performed tasks not included in their job descriptions (Table 3). However, 50% of these trainers felt that their additional activities did not interfere with their primary training responsibilities. Ninety percent of the trainers said they had to conduct training other than ESP training, although the majority felt that they were able to make ESP training their priority.

Results 15
Table 3: LTD response on job descriptions, ESP training and targets (n=10)
Yes No Subject % (n) % (n)
Has clear job description 80 (8) 20 (2) Is involved in activities other than job description 70 (7) 30 (3) Is involved in training other than ESP 90 (9) 10 (1) Knows target to be achieved 20 (2) 80 (8) Knows achievement by target 30 (3) 70 (7) Had read training documents
ESP IST Strategy 40 (4) 60 (6) 21-day Basic ESP IST Guidelines 90 (9) 10 (1) National Training Standards 40 (4) 60 (6)
Experience in ESP Training
LTO trainers faced some problems in conducting ESP training. The most frequent problems mentioned by respondents were:
• Trainers: LTOs used resource persons from different institutes/organizations to teach in TOT courses. Some of these resource persons had not received TOT; sometimes they came to the class without any preparation, and they deviated from the topic of discussion.
• Conflicts about who will do the training: LTOs had some confusion about their roles and responsibilities in the implementation of training courses.
• Large groups: LTOs trained groups of 32 in Basic ESP and of 25 in TOT.
• Training finances: Money did not arrive in time; sometimes preventing LTOs from achieving their targets.
• Duration of training: TOT was too short. Trainees needed more practice time. Hartals/strikes posed difficulties in scheduling.
Table 3 shows that most trainers (80%) did not know the exact target number; and 70% did not know how many had already been trained. Ninety percent of the trainers stated they wrote training reports after each course while the remaining 10% completed training reports monthly or at other intervals. Suggestions to improve the reporting system included keeping daily records, so the final training report could be done with less confusion, and including trainee evaluations on the TMIS form.
Trainers were asked if they had read certain documents about ESP training in Bangladesh. Forty percent of the trainers stated they had seen or read the National In-Service Training Strategy and forty percent said they had seen or read the National In-Service Training Standards. Ninety percent reported reading the ESP Training Guidelines (Table 3).
The overwhelming majority of the LTO trainers (80%) said they had a reporting system for monitoring or evaluating training. Only 40% said they received funds before training commenced. There seemed to be a consensus among trainers that obtaining funding was up to their supervisors, although some suggested that opening accounts at the Upazila level would make it easier to get funding. Training supervisors viewed obtaining funding as one of the biggest challenges to conducting ESP training.

Baseline Survey Report: In-Service Training, HPSP, Bangladesh 16
The trainers were asked to explain the difference between a “trainer” and a “master trainer.” The following box shows how they responded.
Box 4: Perceived differences between trainers and master trainers by LTO staff
Trainers Master Trainers Does not regularly teach Is involved in all areas of training Conducts training and supervises the
workers)
Highly skilled and experienced Trains other trainers Has expertise in every step of training Explains planning, designing, managing and
organizing to trainers
One half of the trainers stated they had Master Trainer certification, which was recognized locally (10%) or nationally (30%), and 10% said their Master Trainer status was not recognized.
Performance feedback and organizational support
Performance feedback included both the feedback trainers received within their organization and the feedback they gave to trainees in the field. Organizational support was included in this area, as questions regarding feedback often related to organizational support.
Within the organization
When asked about support received from their supervisors, trainers gave positive responses. Trainers seemed to rely on their supervisors mainly for administrative support, but they also received information on new programs, guidelines, clarification of job responsibilities, technical support, and on the spot training. Although a great majority (80%) felt they received sufficient support from their supervisors, some said their supervisors were unable to help them effectively with computer technology, management, or planning. Twenty percent of the trainers felt their supervisors should provide more encouragement, explain programs better, and represent them more effectively. Ninety percent felt they could rely on their supervisors to help solve problems. Many stated they tried to work problems out for themselves, but they knew their supervisors would help them find a solution if they could not.
Respondents had different experiences with respect to the evaluation process. Twenty percent had never been evaluated; 10% were evaluated irregularly; 50% were evaluated annually, and 20 percent, semi-annually. (These were not specific evaluations of the respondents’ performance as trainers. They were evaluations done to fulfill administrative requirements. In some cases, however, these evaluations did include training activities.) Most trainers felt their evaluations were fair. Some said their supervisors encouraged them to discuss differences of opinion about evaluations. They added that their supervisors gave them immediate feedback on their performance after evaluations.
Most trainers said their supervisors praised them privately or in front of others for doing a “good job.” They said they were congratulated for specific jobs they had done well or for shouldering additional responsibilities. One trainer had been granted a study tour. Some

Results 17
of the trainers, however, felt they should get more positive recognition for good performance. When asked how their supervisors reacted to a “bad job,” most trainers replied that their supervisors gave them objective feedback privately. Some described this process as a discussion to “identify problems” and “find ways to improve performance.” One trainer said “bad jobs” were never addressed within the organization.
Follow-up in the field
Fifty percent of the trainers said they followed-up their trainees in the field. Thirty percent reported they had followed-up between one and 15 trainees in the field over the past month. Twenty percent reported following-up more than 15 trainees.
Trainers were asked about their understanding of and experience with supportive supervision. Their statements are illustrated in the following box.
Box 5: LTDs’ understanding of supervision
Supportive supervision means:
Supervisory field visit means:
Sharing good or bad results means:
1. Guidance 2. Sharing problem solving
techniques 3. Providing solutions to
problems
1. Observing and documenting performance using a checklist
2. Sharing findings with trainees to improve performance
1. Trainers shared strengths and weaknesses with individual trainee directly.
2. Trainers were hesitant to share poor results or did so indirectly.
Sixty percent of the trainers reported using checklists to evaluate trainees’ performance. Two trainers described the supervisory visit as something that “doesn’t happen” or as more of an administrative issue that needed to be discussed with the providers’ supervisor, not with the provider. On the other hand, most trainers felt hesitant and uncomfortable sharing poor performance results with trainees.
One-half of the LTO trainers said they had their own M&E Plan, but few were able to show surveyors a document, stating that it had not been written down. This indicates they may misunderstand how a M&E Plan is defined.
Table 4: LTD response on monitoring, follow-up and performance feedback system
Yes No Subject % (n) % (n)
Has a monitoring and follow-up plan 50 (5) 50 (5) Has a training reporting system 80 (8) 20 (2) Follows up trainees in the field 50 (5) 50 (5) Compares pre-post test score 50 (5) 50 (5) Requires minimum level of performance 50 (5) 50 (5)
When asked if there was a minimum level of performance required of trainees to pass a training course and if pre-post test results were compared, the trainers were equally divided (Table 4). Trainers said they gave individual guidance to “weak” trainees, informed supervisors if a trainee was weak in certain areas, or had the trainee undergo refresher training. Giving certificates to all trainees frustrated trainers, because they felt
Baseline Survey Report: In-Service Training, HPSP, Bangladesh 18
that successful trainees were not differentially rewarded. Trainees who did not attend lessons or did a poor job received the same certificate as those who had applied themselves and done a good job. Most trainers felt the system should be changed to reward those who successfully passed the course.
Adequate physical environment and tools
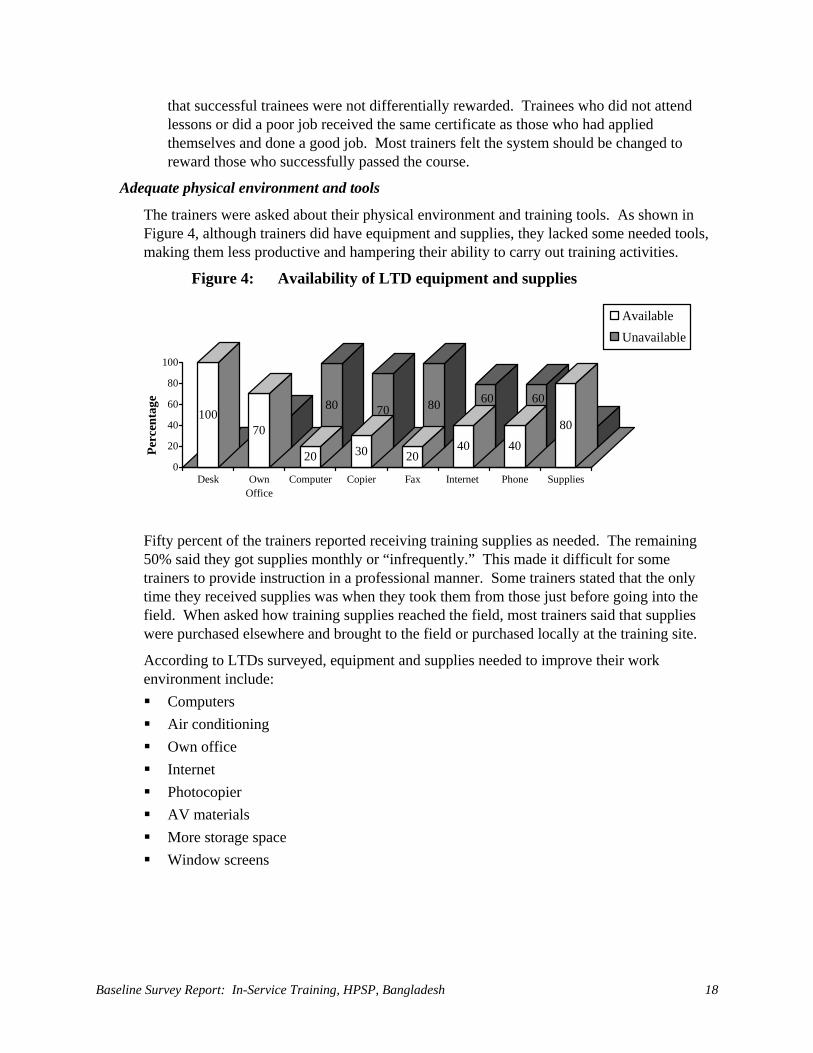
The trainers were asked about their physical environment and training tools. As shown in Figure 4, although trainers did have equipment and supplies, they lacked some needed tools, making them less productive and hampering their ability to carry out training activities.
Figure 4: Availability of LTD equipment and supplies
030
80 70 80 60 60
20
10070
20 30 2040 40
80
0
20
40
60
80
100
Perc
enta
ge
Desk OwnOffice
Computer Copier Fax Internet Phone Supplies
AvailableUnavailable
Fifty percent of the trainers reported receiving training supplies as needed. The remaining 50% said they got supplies monthly or “infrequently.” This made it difficult for some trainers to provide instruction in a professional manner. Some trainers stated that the only time they received supplies was when they took them from those just before going into the field. When asked how training supplies reached the field, most trainers said that supplies were purchased elsewhere and brought to the field or purchased locally at the training site.
According to LTDs surveyed, equipment and supplies needed to improve their work environment include: Computers Air conditioning Own office Internet Photocopier AV materials More storage space Window screens
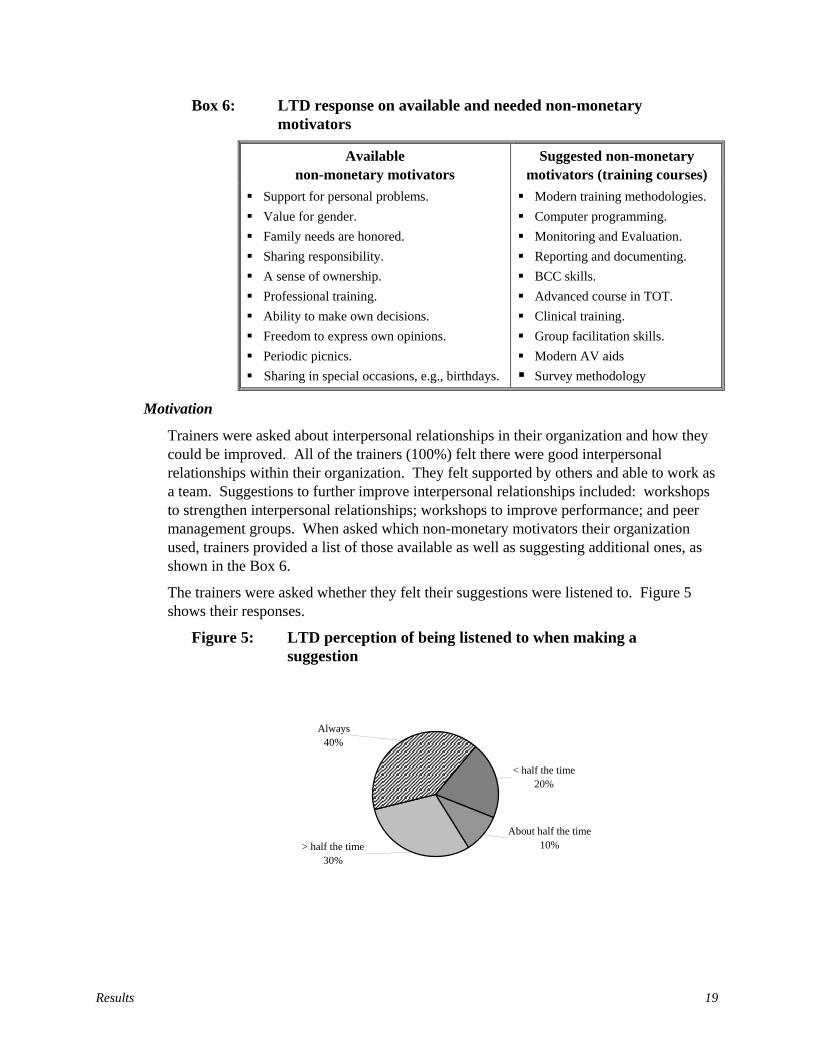
Results 19
Box 6: LTD response on available and needed non-monetary motivators
Available non-monetary motivators
Suggested non-monetary motivators (training courses)
Support for personal problems. Value for gender. Family needs are honored. Sharing responsibility. A sense of ownership. Professional training. Ability to make own decisions. Freedom to express own opinions. Periodic picnics. Sharing in special occasions, e.g., birthdays.
Modern training methodologies. Computer programming. Monitoring and Evaluation. Reporting and documenting. BCC skills. Advanced course in TOT. Clinical training. Group facilitation skills. Modern AV aids Survey methodology
Motivation
Trainers were asked about interpersonal relationships in their organization and how they could be improved. All of the trainers (100%) felt there were good interpersonal relationships within their organization. They felt supported by others and able to work as a team. Suggestions to further improve interpersonal relationships included: workshops to strengthen interpersonal relationships; workshops to improve performance; and peer management groups. When asked which non-monetary motivators their organization used, trainers provided a list of those available as well as suggesting additional ones, as shown in the Box 6.
The trainers were asked whether they felt their suggestions were listened to. Figure 5 shows their responses.
Figure 5: LTD perception of being listened to when making a suggestion
< half the time 20%
About half the time 10%> half the time
30%
Always40%
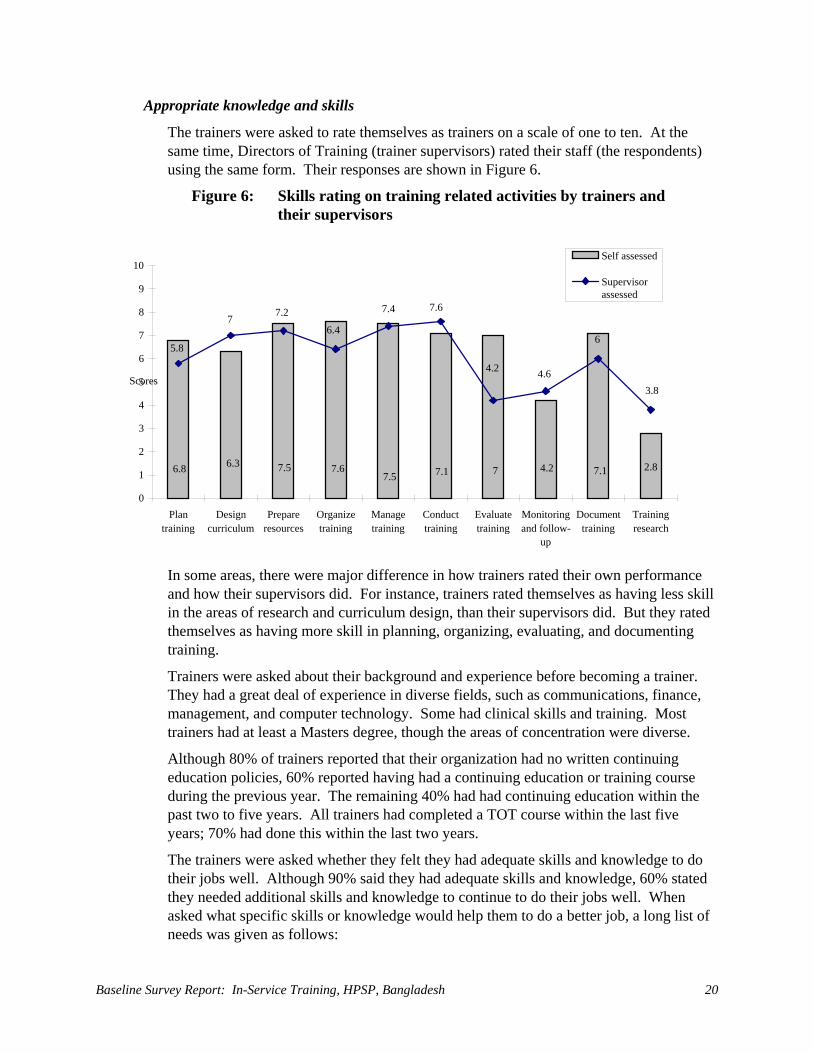
Baseline Survey Report: In-Service Training, HPSP, Bangladesh 20
Appropriate knowledge and skills
The trainers were asked to rate themselves as trainers on a scale of one to ten. At the same time, Directors of Training (trainer supervisors) rated their staff (the respondents) using the same form. Their responses are shown in Figure 6.
Figure 6: Skills rating on training related activities by trainers and their supervisors
In some areas, there were major difference in how trainers rated their own performance and how their supervisors did. For instance, trainers rated themselves as having less skill in the areas of research and curriculum design, than their supervisors did. But they rated themselves as having more skill in planning, organizing, evaluating, and documenting training.
Trainers were asked about their background and experience before becoming a trainer. They had a great deal of experience in diverse fields, such as communications, finance, management, and computer technology. Some had clinical skills and training. Most trainers had at least a Masters degree, though the areas of concentration were diverse.
Although 80% of trainers reported that their organization had no written continuing education policies, 60% reported having had a continuing education or training course during the previous year. The remaining 40% had had continuing education within the past two to five years. All trainers had completed a TOT course within the last five years; 70% had done this within the last two years.
The trainers were asked whether they felt they had adequate skills and knowledge to do their jobs well. Although 90% said they had adequate skills and knowledge, 60% stated they needed additional skills and knowledge to continue to do their jobs well. When asked what specific skills or knowledge would help them to do a better job, a long list of needs was given as follows:
6.8 6.3 7.5 7.67.5 7.1 7 4.2 7.1 2.8
5.8
7 7.2 6.4
7.4 7.6
4.2 4.6
6
3.8
0 1 2 3 4 5 6 7 8 9
10
Plan training
Design curriculum
Prepare resources
Organizetraining
Managetraining
Conducttraining
Evaluatetraining
Monitoringand follow-
up
Document training
Trainingresearch
Scores
Self assessed
Supervisor assessed
Results 21
Desired skills and knowledge • Modern training methodologies • Computer programming • Monitoring and Evaluation (M&E) • Reporting and documenting • Behavorial Change Communication (BCC) skills • Advanced course in TOT • Clinical training • Group facilitation skills • Modern AV aids • Survey methodology
DTCC Introduction
The DTCC plays a vital role in the implementation of the IST of health and population sector personnel in Bangladesh. The DTCC is designed to decentralize training to the Upazila level. It is responsible for coordinating, planning, implementing, monitoring, and documenting training activities conducted within each district and Upazila. The DTCC has the following five members:
• The Civil Surgeon (CS) is the Chairman;
• The Deputy Director, Family Planning (DDFP), is the Co-chairman;
• The Deputy Civil Surgeon (DCS) or Medical Officer in Civil Surgeon (MOCS) Office is a member;
• The Assistant Director Clinical Contraception (ADCC), or Medical Officer Clinical Contraception (MOCC), is a member; and,
• The Senior Health Education Officer (SHEO) is the Secretary.
Job and responsibilities
The respondents had varied lengths of service in their present positions. The majority of the respondents (74%) had held their jobs between six months and three years. Eighty-seven percent of the respondents said that they had a job description. They mentioned administration, finance, coordination, monitoring and supervision, training, clinical services, and BCC as their main responsibilities (Table 5).

Baseline Survey Report: In-Service Training, HPSP, Bangladesh 22
Table 5: DTCC members’ length of service and job responsibilities (n=23)
Categories % (n) Length of service in present position
Less than 6 months 9 (2) Between 6-12 months 30 (7) Between 1-3 years 44 (10) More than 3 years 17 (4)
Main job responsibilities* Administration, Finance and Coordination 83 (19) Monitoring and Supervision 39 (9) Training 48 (11) Clinical service 39 (7) Behavioral Change Communication 13 (3)
Treats patients Never treated patients 34 (8) Treated patients within last week of survey 52 (12) Treated patients within last six months 9 (2) Treated patients within last year 4 (1)
* The respondents gave multiple responses
Most respondents had not yet received key documents from the TTU, which they needed to guide and support the implementation of training, such as the ESP training strategy, standards and guidelines. Thirty-four percent of the respondents did not treat patients because they were not medical professionals. Fifty-two percent of the respondents were actively involved in clinical practice while the rest were involved irregularly (Table 5).
Training Status
All of the respondents had received some IST. Seventy-eight percent of them had received training during the past year. Eighty-seven percent of them had had a TOT course. Thirty percent of them received TOT in Basic ESP Training. Only 9% of the respondents had received training in supervision and follow-up. Almost all of the respondents felt the need for more training. The majority of the respondents (61%) expressed a need for training in administration and financial management (Table 6).
Table 6: Training status of DTCC members (n=23) Areas Assessed % (n)
Most recent training Within last year 78 (18) Within 1 - 2 years 9 (2) More than 2 years ago 13 (3)
Received training documents* ESP Training Strategy 13 (3) ESP Training Guidelines 0 (0) Training Standards 4 (1)
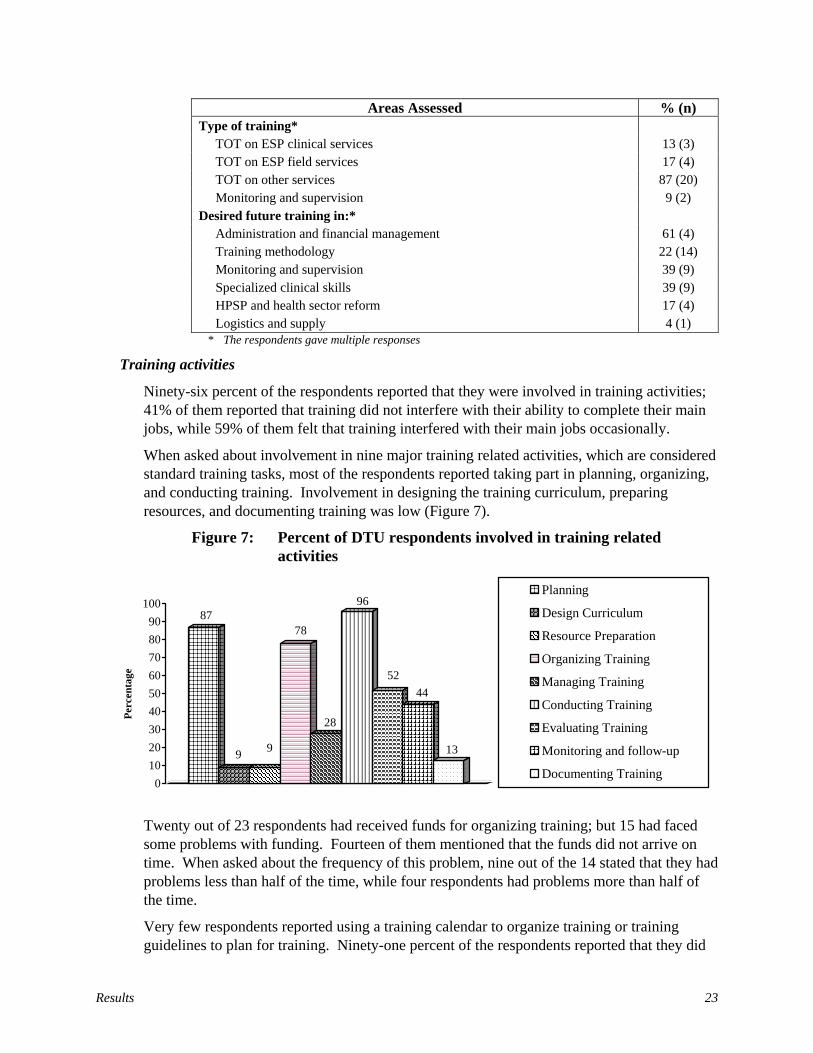
Results 23
Areas Assessed % (n) Type of training*
TOT on ESP clinical services 13 (3) TOT on ESP field services 17 (4) TOT on other services 87 (20) Monitoring and supervision 9 (2)
Desired future training in:* Administration and financial management 61 (4) Training methodology 22 (14) Monitoring and supervision 39 (9) Specialized clinical skills 39 (9) HPSP and health sector reform 17 (4) Logistics and supply 4 (1)
* The respondents gave multiple responses
Training activities
Ninety-six percent of the respondents reported that they were involved in training activities; 41% of them reported that training did not interfere with their ability to complete their main jobs, while 59% of them felt that training interfered with their main jobs occasionally.
When asked about involvement in nine major training related activities, which are considered standard training tasks, most of the respondents reported taking part in planning, organizing, and conducting training. Involvement in designing the training curriculum, preparing resources, and documenting training was low (Figure 7).
Figure 7: Percent of DTU respondents involved in training related activities
87
9 9
78
28
96
5244
13
0102030405060708090
100
Perc
enta
ge
Planning
Design Curriculum
Resource Preparation
Organizing Training
Managing Training
Conducting Training
Evaluating Training
Monitoring and follow-up
Documenting Training
Twenty out of 23 respondents had received funds for organizing training; but 15 had faced some problems with funding. Fourteen of them mentioned that the funds did not arrive on time. When asked about the frequency of this problem, nine out of the 14 stated that they had problems less than half of the time, while four respondents had problems more than half of the time.
Very few respondents reported using a training calendar to organize training or training guidelines to plan for training. Ninety-one percent of the respondents reported that they did
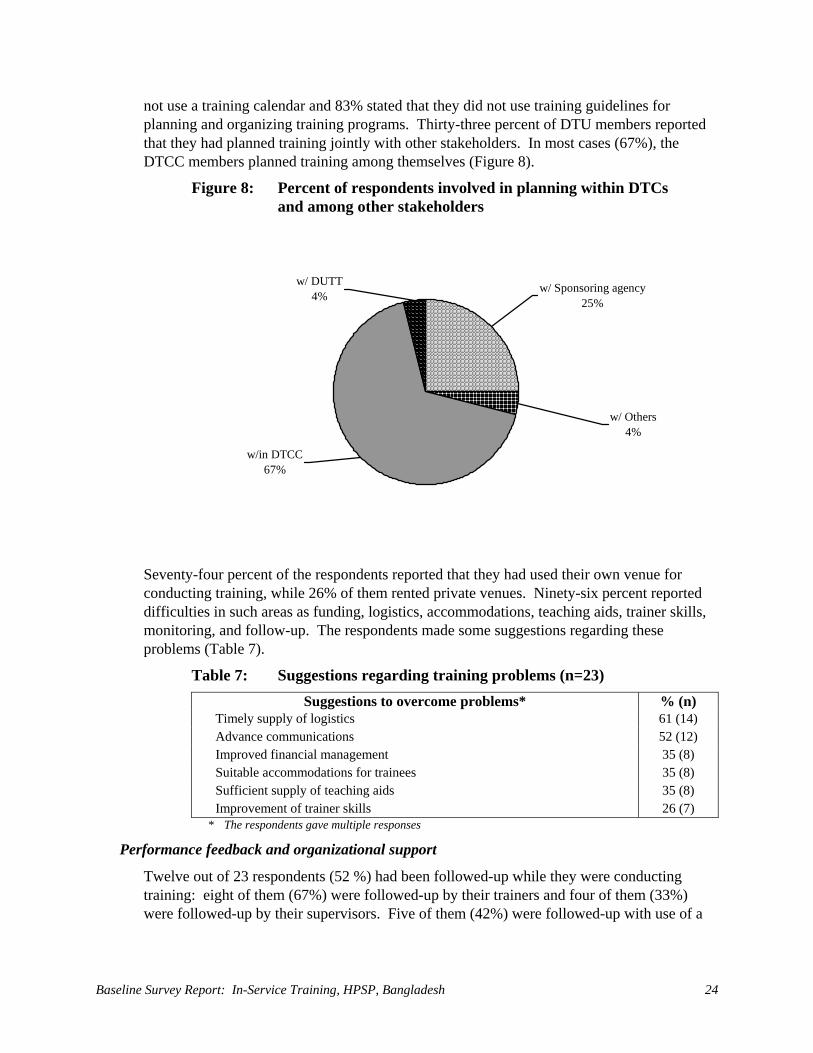
Baseline Survey Report: In-Service Training, HPSP, Bangladesh 24
not use a training calendar and 83% stated that they did not use training guidelines for planning and organizing training programs. Thirty-three percent of DTU members reported that they had planned training jointly with other stakeholders. In most cases (67%), the DTCC members planned training among themselves (Figure 8).
Figure 8: Percent of respondents involved in planning within DTCs and among other stakeholders
w/in DTCC67%
w/ Others4%
w/ Sponsoring agency25%
w/ DUTT4%
Seventy-four percent of the respondents reported that they had used their own venue for conducting training, while 26% of them rented private venues. Ninety-six percent reported difficulties in such areas as funding, logistics, accommodations, teaching aids, trainer skills, monitoring, and follow-up. The respondents made some suggestions regarding these problems (Table 7).
Table 7: Suggestions regarding training problems (n=23) Suggestions to overcome problems* % (n)
Timely supply of logistics 61 (14) Advance communications 52 (12) Improved financial management 35 (8) Suitable accommodations for trainees 35 (8) Sufficient supply of teaching aids 35 (8) Improvement of trainer skills 26 (7)
* The respondents gave multiple responses
Performance feedback and organizational support
Twelve out of 23 respondents (52 %) had been followed-up while they were conducting training: eight of them (67%) were followed-up by their trainers and four of them (33%) were followed-up by their supervisors. Five of them (42%) were followed-up with use of a
Results 25
checklist, five were followed-up verbally, without a checklist, and two did not respond. Ten of the 12 respondents (83%) received feedback on their performance.
Training monitoring and follow-up
With regard to monitoring training, 13 respondents (57%) reported that they had monitored training activities at the district and Upazila levels. Seven of them had monitored training with some kind of checklist. Only one of them had used TTU supplied checklists.
Twelve respondents out of 23 (52%) reported that they had followed up trainees at worksites. The mean number of the trainees followed up by the respondents in the last month of the survey was 29 with standard deviation 50.4 and a median of 18. This number seems to be higher because one respondent reported following up 180 trainees in the last month of the survey. Eight of them had used checklists to follow-up trainees. Ten of them followed up monthly, while the others followed up as required.
When asked how they gave feedback on follow-up results to providers, 33% of the respondents said they provided feedback through monthly meetings held at the UHC, while 38% provided feedback verbally on the spot, and 29% provided feedback via written notes.
Fourteen respondents reported using results of the training monitoring and follow-up for different purposes. Eight of them used it for planning; five of them used it for problem identification; one of them used it for designing interventions.
When asked to whom they gave results, six said they gave results directly to the field workers, while two of them passed results on to the divisional level supervisors, three to the district level supervisors and one to the Upazila level supervisors.
Documentation and reporting
Sixteen out of 23 respondents stated that they kept records of training: 11 in files, two in registers or computers, and one in other ways. Seventy-four percent of the respondents sent training records to different stakeholders. Forty-eight percent sent training records to the respective LDs and PMs, 33% sent them to TTU, and 19% sent them to others.
When asked about the TMIS, 22% of the respondents reported that they knew about it; 60% of them described TMIS as a facility for information management. Most of the respondents (91%) did not know the person responsible for sending information to TMIS. Of the 9% who said they knew the person responsible, 5% mentioned the Statistician and 4% mentioned the Office Assistant.
Districts and Upazila Training Team Introduction
DUTTs have been formed in each Upazila to help plan and conduct ESP training as part of the effort to decentralize the training system. DUTT members are also responsible for following-up the performance of the trainees (ESP providers) at their SDPs and providing on-the-job training if any trainee is found to be under performing. Thus, the DUTT contributes to performance improvement at SDPs.
DUTT members receive TOT by LTOs to train field service providers. Along with the DTCCs, the LTO trainers are responsible for following up performance of DUTT members at

Baseline Survey Report: In-Service Training, HPSP, Bangladesh 26
the Upazila training sites and providing on-the-job training if any member is found to be under performing. The DUTT consists of eight members: two from the district level and six from each Upazila. The members of the DUTT are:
At district level: • The ADCC or MOCC; • The DCS or MOCS; At the Upazila level: • The Upazila Health and Family Planning Officer (UHFPO); • The Upazila Family Planning Officer (UFPO); • The Resident Medical Officer (RMO); • The Medical Officer, Maternal and Child Health (MO MCH); • The Medical Officer (MO), Field Service; and, • The Regional Training Center (RTC) or Family Welfare Visitor Training Institute
(FWVTI) Representatives5 or the Assistant Upazila Family Planning Officer (AUFPO).
Jobs and responsibilities
As in the case of DTCC members, DUTT members had different lengths of service. The majority of the respondents (56%) had been in their current positions between six months and three years. Thirty-four percent (36 out of 70) had held their positions for more then three years. Respondents mentioned administration and financial management, monitoring and supervision, limited curative care, logistics management, training, RH services, and child health care as their main jobs (Table 8). Ninety-three percent (65 of 70) reported that they had a job description.
5 The National Institute of Population Research and Training (NIPORT) operates a network of the 20 Regional
Training Centers (RTCs) at the Upazila level and 12 Family Welfare Visitors Training Institutes (FWVTIs) at the district level.
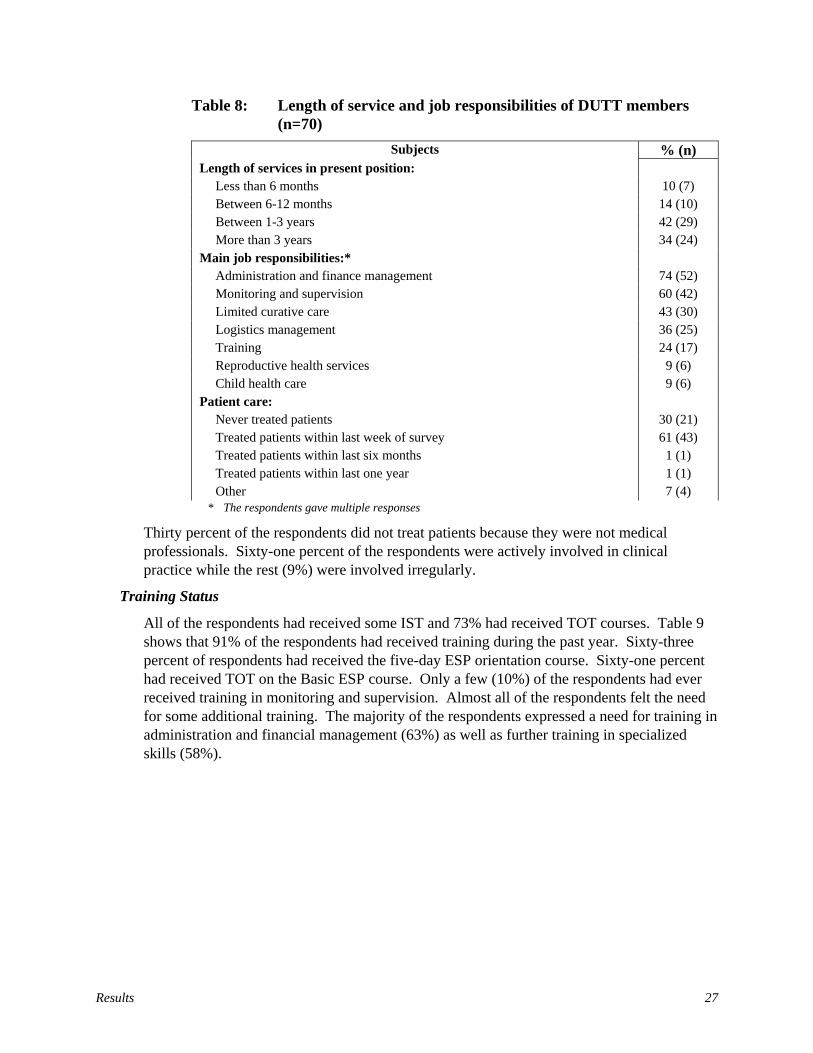
Results 27
Table 8: Length of service and job responsibilities of DUTT members (n=70)
Subjects % (n) Length of services in present position:
Less than 6 months 10 (7) Between 6-12 months 14 (10) Between 1-3 years 42 (29) More than 3 years 34 (24)
Main job responsibilities:* Administration and finance management 74 (52) Monitoring and supervision 60 (42) Limited curative care 43 (30) Logistics management 36 (25) Training 24 (17) Reproductive health services 9 (6) Child health care 9 (6)
Patient care: Never treated patients 30 (21) Treated patients within last week of survey 61 (43) Treated patients within last six months 1 (1) Treated patients within last one year 1 (1) Other 7 (4)
* The respondents gave multiple responses
Thirty percent of the respondents did not treat patients because they were not medical professionals. Sixty-one percent of the respondents were actively involved in clinical practice while the rest (9%) were involved irregularly.
Training Status
All of the respondents had received some IST and 73% had received TOT courses. Table 9 shows that 91% of the respondents had received training during the past year. Sixty-three percent of respondents had received the five-day ESP orientation course. Sixty-one percent had received TOT on the Basic ESP course. Only a few (10%) of the respondents had ever received training in monitoring and supervision. Almost all of the respondents felt the need for some additional training. The majority of the respondents expressed a need for training in administration and financial management (63%) as well as further training in specialized skills (58%).
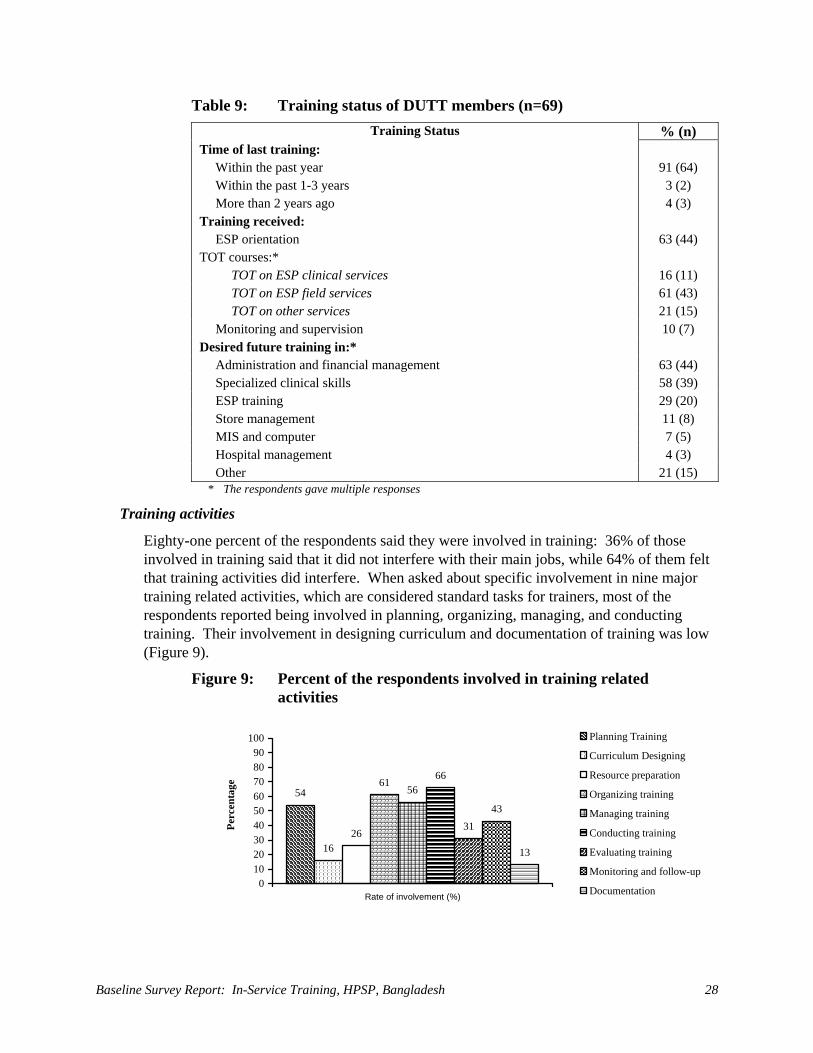
Baseline Survey Report: In-Service Training, HPSP, Bangladesh 28
Table 9: Training status of DUTT members (n=69) Training Status % (n)
Time of last training: Within the past year 91 (64) Within the past 1-3 years 3 (2) More than 2 years ago 4 (3)
Training received: ESP orientation 63 (44)
TOT courses:* TOT on ESP clinical services 16 (11) TOT on ESP field services 61 (43) TOT on other services 21 (15)
Monitoring and supervision 10 (7) Desired future training in:*
Administration and financial management 63 (44) Specialized clinical skills 58 (39) ESP training 29 (20) Store management 11 (8) MIS and computer 7 (5) Hospital management 4 (3) Other 21 (15)
* The respondents gave multiple responses
Training activities
Eighty-one percent of the respondents said they were involved in training: 36% of those involved in training said that it did not interfere with their main jobs, while 64% of them felt that training activities did interfere. When asked about specific involvement in nine major training related activities, which are considered standard tasks for trainers, most of the respondents reported being involved in planning, organizing, managing, and conducting training. Their involvement in designing curriculum and documentation of training was low (Figure 9).
Figure 9: Percent of the respondents involved in training related activities
54
1626
6156
66
3143
13
0102030405060708090
100
Rate of involvement (%)
Perc
enta
ge
Planning Training
Curriculum Designing
Resource preparation
Organizing training
Managing training
Conducting training
Evaluating training
Monitoring and follow-up
Documentation

Results 29
To find out how involved they were in planning, the respondents were asked if they had used a training calendar and followed training guidelines. The majority of the respondents (81%) reported that they did not have a training calendar to organize training and 66% did not use any planning guidelines. The following graph (Figure 10) shows involvement of the DUTT respondents in planning with other DUTT members, DTCC members, and other stakeholders. Figure 10: Percent of respondents involved in planning within DUTT
and among other stakeholders (n=36)
w/in DUTT61%
w/ DTCC21%
w/ Others13%
w/ Sponsoring agent5%
Thirty-three out of 70 respondents (47%) had received funds for organizing training: 19 of these respondents faced some problems with funding and 14 of them reported that funds did not arrive on time. Six stated that they had problems getting funding more then half of the time, and eight said that they had problems less than half of the time. When asked about the training venue, 86% of the respondents stated that they conducted training in their own building. The rest of them rented space or used other public or private facilities. Major problems were getting funding, teaching aids, logistics, and supplies, securing accommodation for trainees, finding trained trainers, and timely communications. They made the following suggestions about how to overcome these problems (Table 10):
Table 10: Suggestions regarding training problems (n = 70) Areas % (n)
Suggestions about how to overcome problems* 36 (25) Adequate accommodations for trainees 43 (30) Timely supply of logistics 36 (25) Sufficient supply of teaching aids 36 (25) Timely funds flow 27 (19) Skilled trainers 24 (17) Better monitoring and follow-up 17 (12) Advance communications 10 (7) * The respondents gave multiple responses
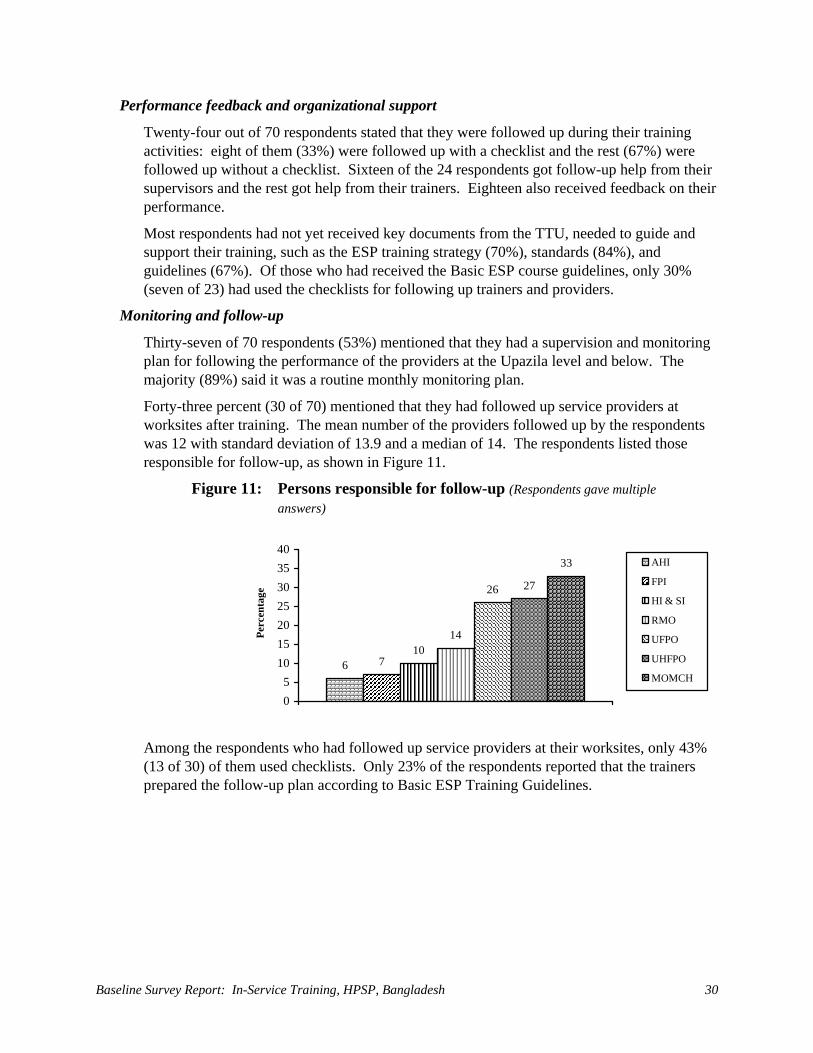
Baseline Survey Report: In-Service Training, HPSP, Bangladesh 30
Performance feedback and organizational support
Twenty-four out of 70 respondents stated that they were followed up during their training activities: eight of them (33%) were followed up with a checklist and the rest (67%) were followed up without a checklist. Sixteen of the 24 respondents got follow-up help from their supervisors and the rest got help from their trainers. Eighteen also received feedback on their performance.
Most respondents had not yet received key documents from the TTU, needed to guide and support their training, such as the ESP training strategy (70%), standards (84%), and guidelines (67%). Of those who had received the Basic ESP course guidelines, only 30% (seven of 23) had used the checklists for following up trainers and providers.
Monitoring and follow-up
Thirty-seven of 70 respondents (53%) mentioned that they had a supervision and monitoring plan for following the performance of the providers at the Upazila level and below. The majority (89%) said it was a routine monthly monitoring plan.
Forty-three percent (30 of 70) mentioned that they had followed up service providers at worksites after training. The mean number of the providers followed up by the respondents was 12 with standard deviation of 13.9 and a median of 14. The respondents listed those responsible for follow-up, as shown in Figure 11.
Figure 11: Persons responsible for follow-up (Respondents gave multiple answers)
6 710
14
26 27
33
05
10152025303540
Perc
enta
ge
AHI
FPI
HI & SI
RMO
UFPO
UHFPO
MOMCH
Among the respondents who had followed up service providers at their worksites, only 43% (13 of 30) of them used checklists. Only 23% of the respondents reported that the trainers prepared the follow-up plan according to Basic ESP Training Guidelines.
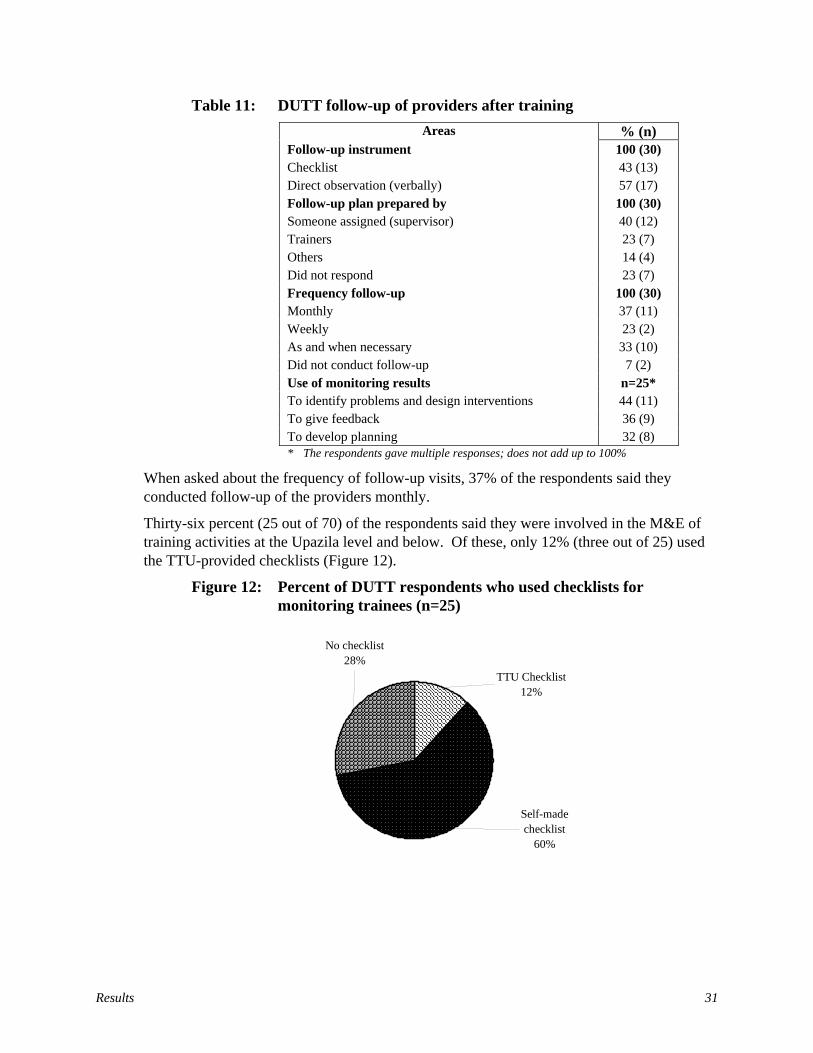
Results 31
Table 11: DUTT follow-up of providers after training Areas % (n)
Follow-up instrument 100 (30) Checklist 43 (13) Direct observation (verbally) 57 (17) Follow-up plan prepared by 100 (30) Someone assigned (supervisor) 40 (12) Trainers 23 (7) Others 14 (4) Did not respond 23 (7) Frequency follow-up 100 (30) Monthly 37 (11) Weekly 23 (2) As and when necessary 33 (10) Did not conduct follow-up 7 (2) Use of monitoring results n=25* To identify problems and design interventions 44 (11) To give feedback 36 (9) To develop planning 32 (8) * The respondents gave multiple responses; does not add up to 100%
When asked about the frequency of follow-up visits, 37% of the respondents said they conducted follow-up of the providers monthly.
Thirty-six percent (25 out of 70) of the respondents said they were involved in the M&E of training activities at the Upazila level and below. Of these, only 12% (three out of 25) used the TTU-provided checklists (Figure 12).
Figure 12: Percent of DUTT respondents who used checklists for monitoring trainees (n=25)
No checklist28%
TTU Checklist12%
Self-made checklist
60%
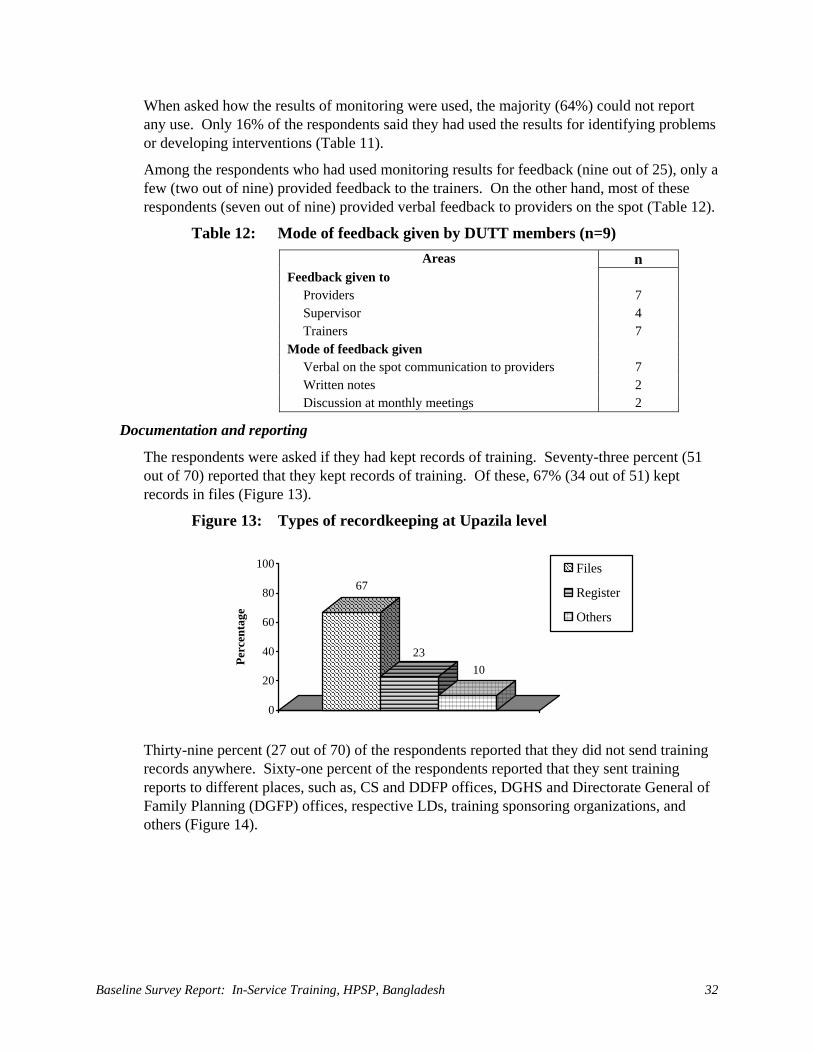
Baseline Survey Report: In-Service Training, HPSP, Bangladesh 32
When asked how the results of monitoring were used, the majority (64%) could not report any use. Only 16% of the respondents said they had used the results for identifying problems or developing interventions (Table 11).
Among the respondents who had used monitoring results for feedback (nine out of 25), only a few (two out of nine) provided feedback to the trainers. On the other hand, most of these respondents (seven out of nine) provided verbal feedback to providers on the spot (Table 12).
Table 12: Mode of feedback given by DUTT members (n=9) Areas n
Feedback given to Providers 7 Supervisor 4 Trainers 7
Mode of feedback given Verbal on the spot communication to providers 7 Written notes 2 Discussion at monthly meetings 2
Documentation and reporting
The respondents were asked if they had kept records of training. Seventy-three percent (51 out of 70) reported that they kept records of training. Of these, 67% (34 out of 51) kept records in files (Figure 13).
Figure 13: Types of recordkeeping at Upazila level
67
2310
0
20
40
60
80
100
Perc
enta
ge
Files
Register
Others
Thirty-nine percent (27 out of 70) of the respondents reported that they did not send training records anywhere. Sixty-one percent of the respondents reported that they sent training reports to different places, such as, CS and DDFP offices, DGHS and Directorate General of Family Planning (DGFP) offices, respective LDs, training sponsoring organizations, and others (Figure 14).

Results 33
Figure 14: Communication of training reports (respondents gave multiple responses)
11
24
36
29
39
0 10 20 30 40 50
Not distriuted
Others
CS & DDFP
Sponsoring org.
DGHS & DGFP
The respondents were asked if they knew about the TMIS. Only 24% (17 of 70) of the respondents reported that they knew of the TMIS. The majority (13 out of 17) defined it as a system for storing training information. When asked whose responsibility it was to send information to TMIS, 47% (eight out of 17) of the respondents said the UHFPO was responsible, while 24% said it was the Statistician’s responsibility.
Performance of Immediate Supervisors Introduction
The AHIs and FPIs are the immediate supervisors of the HAs and FWAs at the CCs. They are front-line supervisors based at union level, typically spending the majority of their time supervising service providers. One AHI and one FPI are responsible for supervising all four or five CCs in the union. Immediate supervisors must have enough knowledge of good management practices to know which factors will encourage high performance among the clinic staff. This will enable service providers to meet client needs by providing quality services.
Background characteristics and training status of immediate supervisors
The survey asked supervisors about the nature of their responsibilities. All of the respondents (100%) said they were the immediate supervisors of service providers (HAs and/or FWAs), working in CCs. Only 26% of the respondents (40 out of 153) had ever received management training and only 30% (46 out of 153) had ever received training as supervisors. Moreover, of these respondents the majority (77% in management and 65% in supervision) had received the training more than three years ago (Table 13).
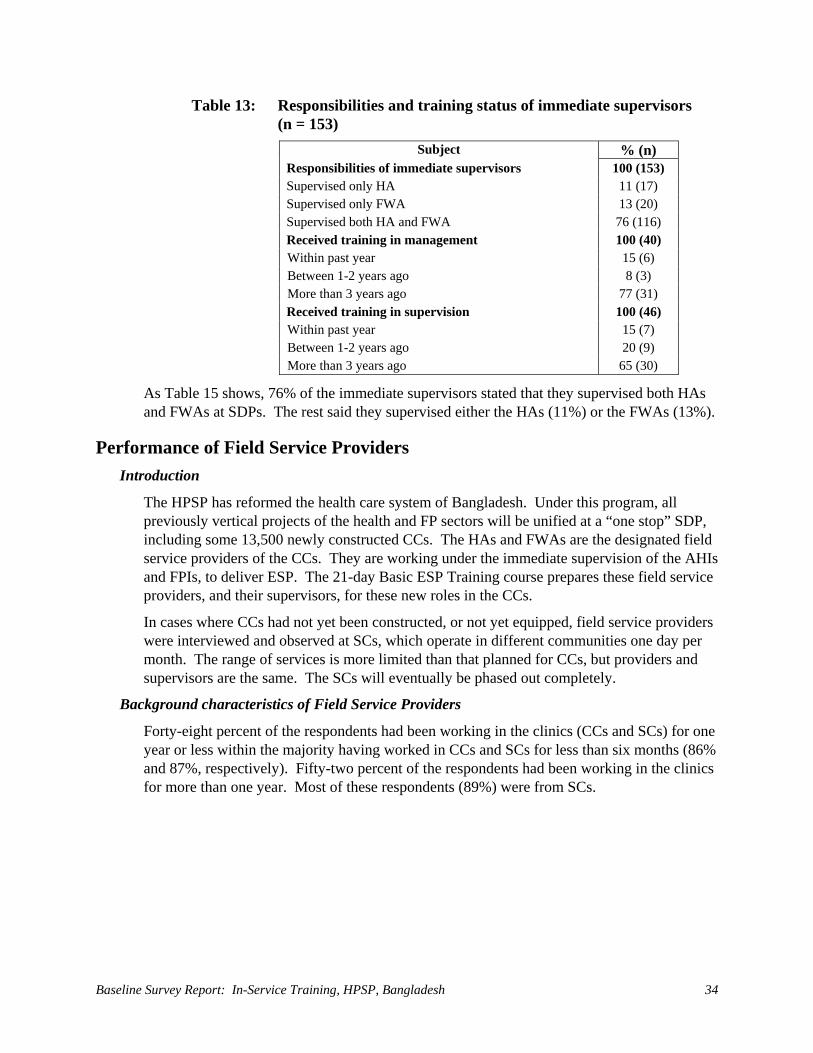
Baseline Survey Report: In-Service Training, HPSP, Bangladesh 34
Table 13: Responsibilities and training status of immediate supervisors (n = 153)
Subject % (n) Responsibilities of immediate supervisors 100 (153) Supervised only HA 11 (17) Supervised only FWA 13 (20) Supervised both HA and FWA 76 (116) Received training in management 100 (40) Within past year 15 (6) Between 1-2 years ago 8 (3) More than 3 years ago 77 (31) Received training in supervision 100 (46) Within past year 15 (7) Between 1-2 years ago 20 (9) More than 3 years ago 65 (30)
As Table 15 shows, 76% of the immediate supervisors stated that they supervised both HAs and FWAs at SDPs. The rest said they supervised either the HAs (11%) or the FWAs (13%).
Performance of Field Service Providers Introduction
The HPSP has reformed the health care system of Bangladesh. Under this program, all previously vertical projects of the health and FP sectors will be unified at a “one stop” SDP, including some 13,500 newly constructed CCs. The HAs and FWAs are the designated field service providers of the CCs. They are working under the immediate supervision of the AHIs and FPIs, to deliver ESP. The 21-day Basic ESP Training course prepares these field service providers, and their supervisors, for these new roles in the CCs.
In cases where CCs had not yet been constructed, or not yet equipped, field service providers were interviewed and observed at SCs, which operate in different communities one day per month. The range of services is more limited than that planned for CCs, but providers and supervisors are the same. The SCs will eventually be phased out completely.
Background characteristics of Field Service Providers
Forty-eight percent of the respondents had been working in the clinics (CCs and SCs) for one year or less within the majority having worked in CCs and SCs for less than six months (86% and 87%, respectively). Fifty-two percent of the respondents had been working in the clinics for more than one year. Most of these respondents (89%) were from SCs.
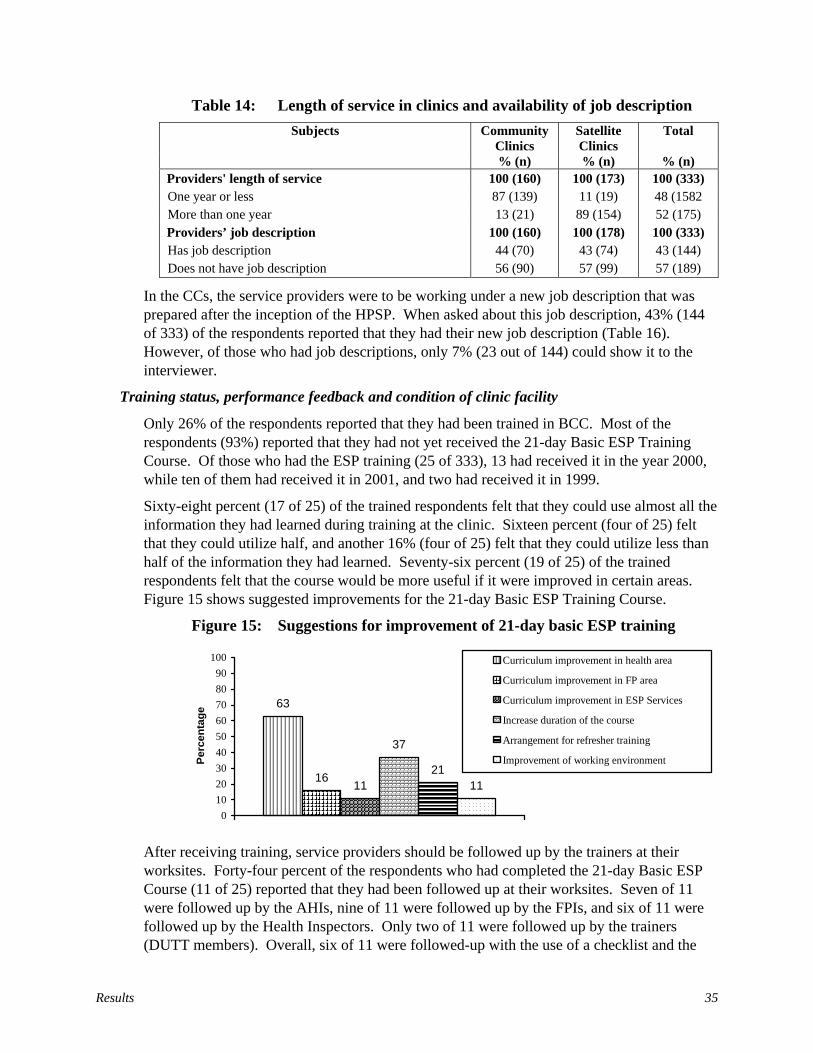
Results 35
Table 14: Length of service in clinics and availability of job description Subjects Community
Clinics Satellite Clinics
Total
% (n) % (n) % (n) Providers' length of service 100 (160) 100 (173) 100 (333) One year or less 87 (139) 11 (19) 48 (1582 More than one year 13 (21) 89 (154) 52 (175) Providers’ job description 100 (160) 100 (178) 100 (333) Has job description 44 (70) 43 (74) 43 (144) Does not have job description 56 (90) 57 (99) 57 (189)
In the CCs, the service providers were to be working under a new job description that was prepared after the inception of the HPSP. When asked about this job description, 43% (144 of 333) of the respondents reported that they had their new job description (Table 16). However, of those who had job descriptions, only 7% (23 out of 144) could show it to the interviewer.
Training status, performance feedback and condition of clinic facility
Only 26% of the respondents reported that they had been trained in BCC. Most of the respondents (93%) reported that they had not yet received the 21-day Basic ESP Training Course. Of those who had the ESP training (25 of 333), 13 had received it in the year 2000, while ten of them had received it in 2001, and two had received it in 1999.
Sixty-eight percent (17 of 25) of the trained respondents felt that they could use almost all the information they had learned during training at the clinic. Sixteen percent (four of 25) felt that they could utilize half, and another 16% (four of 25) felt that they could utilize less than half of the information they had learned. Seventy-six percent (19 of 25) of the trained respondents felt that the course would be more useful if it were improved in certain areas. Figure 15 shows suggested improvements for the 21-day Basic ESP Training Course.
Figure 15: Suggestions for improvement of 21-day basic ESP training
63
1611
37
2111
0102030405060708090
100
Perc
enta
ge
Curriculum improvement in health area
Curriculum improvement in FP area
Curriculum improvement in ESP Services
Increase duration of the course
Arrangement for refresher training
Improvement of working environment
After receiving training, service providers should be followed up by the trainers at their worksites. Forty-four percent of the respondents who had completed the 21-day Basic ESP Course (11 of 25) reported that they had been followed up at their worksites. Seven of 11 were followed up by the AHIs, nine of 11 were followed up by the FPIs, and six of 11 were followed up by the Health Inspectors. Only two of 11 were followed up by the trainers (DUTT members). Overall, six of 11 were followed-up with the use of a checklist and the
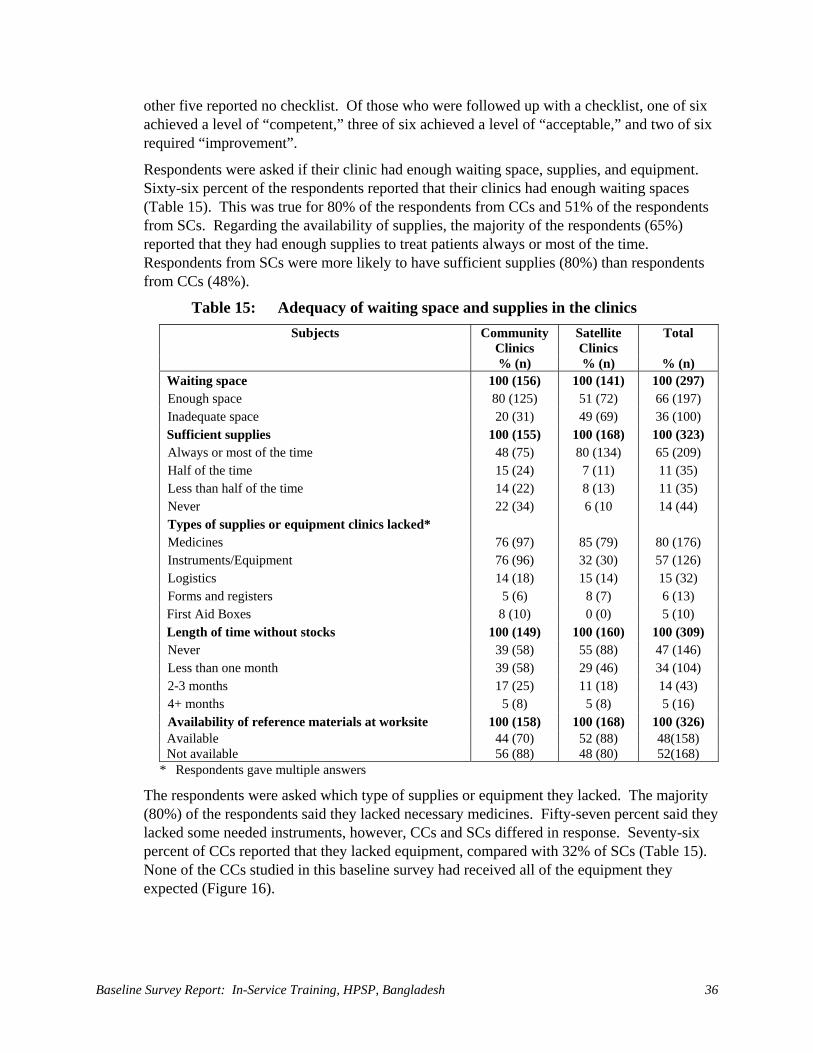
Baseline Survey Report: In-Service Training, HPSP, Bangladesh 36
other five reported no checklist. Of those who were followed up with a checklist, one of six achieved a level of “competent,” three of six achieved a level of “acceptable,” and two of six required “improvement”.
Respondents were asked if their clinic had enough waiting space, supplies, and equipment. Sixty-six percent of the respondents reported that their clinics had enough waiting spaces (Table 15). This was true for 80% of the respondents from CCs and 51% of the respondents from SCs. Regarding the availability of supplies, the majority of the respondents (65%) reported that they had enough supplies to treat patients always or most of the time. Respondents from SCs were more likely to have sufficient supplies (80%) than respondents from CCs (48%).
Table 15: Adequacy of waiting space and supplies in the clinics Subjects Community
Clinics Satellite Clinics
Total
% (n) % (n) % (n) Waiting space 100 (156) 100 (141) 100 (297) Enough space 80 (125) 51 (72) 66 (197) Inadequate space 20 (31) 49 (69) 36 (100) Sufficient supplies 100 (155) 100 (168) 100 (323) Always or most of the time 48 (75) 80 (134) 65 (209) Half of the time 15 (24) 7 (11) 11 (35) Less than half of the time 14 (22) 8 (13) 11 (35) Never 22 (34) 6 (10 14 (44) Types of supplies or equipment clinics lacked* Medicines 76 (97) 85 (79) 80 (176) Instruments/Equipment 76 (96) 32 (30) 57 (126) Logistics 14 (18) 15 (14) 15 (32) Forms and registers 5 (6) 8 (7) 6 (13) First Aid Boxes 8 (10) 0 (0) 5 (10) Length of time without stocks 100 (149) 100 (160) 100 (309) Never 39 (58) 55 (88) 47 (146) Less than one month 39 (58) 29 (46) 34 (104) 2-3 months 17 (25) 11 (18) 14 (43) 4+ months 5 (8) 5 (8) 5 (16) Availability of reference materials at worksite 100 (158) 100 (168) 100 (326) Available 44 (70) 52 (88) 48(158) Not available 56 (88) 48 (80) 52(168)
* Respondents gave multiple answers
The respondents were asked which type of supplies or equipment they lacked. The majority (80%) of the respondents said they lacked necessary medicines. Fifty-seven percent said they lacked some needed instruments, however, CCs and SCs differed in response. Seventy-six percent of CCs reported that they lacked equipment, compared with 32% of SCs (Table 15). None of the CCs studied in this baseline survey had received all of the equipment they expected (Figure 16).
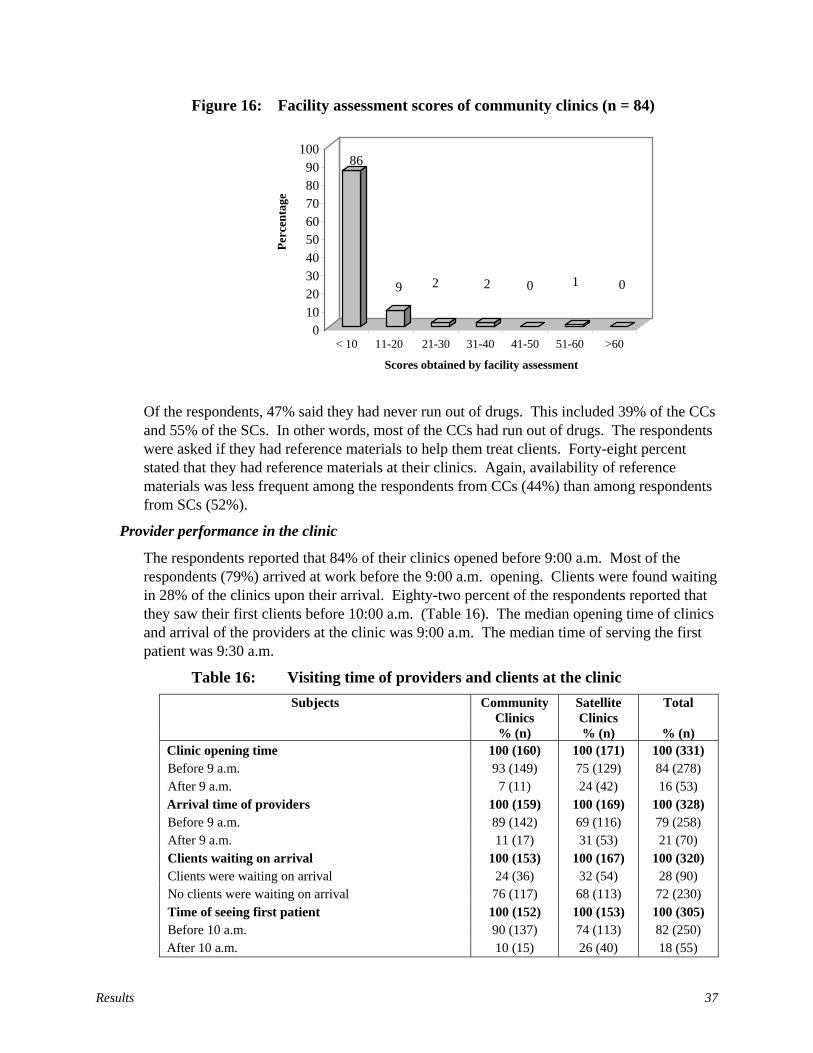
Results 37
Figure 16: Facility assessment scores of community clinics (n = 84)
Of the respondents, 47% said they had never run out of drugs. This included 39% of the CCs and 55% of the SCs. In other words, most of the CCs had run out of drugs. The respondents were asked if they had reference materials to help them treat clients. Forty-eight percent stated that they had reference materials at their clinics. Again, availability of reference materials was less frequent among the respondents from CCs (44%) than among respondents from SCs (52%).
Provider performance in the clinic
The respondents reported that 84% of their clinics opened before 9:00 a.m. Most of the respondents (79%) arrived at work before the 9:00 a.m. opening. Clients were found waiting in 28% of the clinics upon their arrival. Eighty-two percent of the respondents reported that they saw their first clients before 10:00 a.m. (Table 16). The median opening time of clinics and arrival of the providers at the clinic was 9:00 a.m. The median time of serving the first patient was 9:30 a.m.
Table 16: Visiting time of providers and clients at the clinic Subjects Community
Clinics Satellite Clinics
Total
% (n) % (n) % (n) Clinic opening time 100 (160) 100 (171) 100 (331) Before 9 a.m. 93 (149) 75 (129) 84 (278) After 9 a.m. 7 (11) 24 (42) 16 (53) Arrival time of providers 100 (159) 100 (169) 100 (328) Before 9 a.m. 89 (142) 69 (116) 79 (258) After 9 a.m. 11 (17) 31 (53) 21 (70) Clients waiting on arrival 100 (153) 100 (167) 100 (320) Clients were waiting on arrival 24 (36) 32 (54) 28 (90) No clients were waiting on arrival 76 (117) 68 (113) 72 (230) Time of seeing first patient 100 (152) 100 (153) 100 (305) Before 10 a.m. 90 (137) 74 (113) 82 (250) After 10 a.m. 10 (15) 26 (40) 18 (55)
86
9 2 2 0 1 0
0 10 20 30 40 50 60 70 80 90
100
Perc
enta
ge
< 10 11-20 21-30 31-40 41-50 51-60 >60 Scores obtained by facility assessment
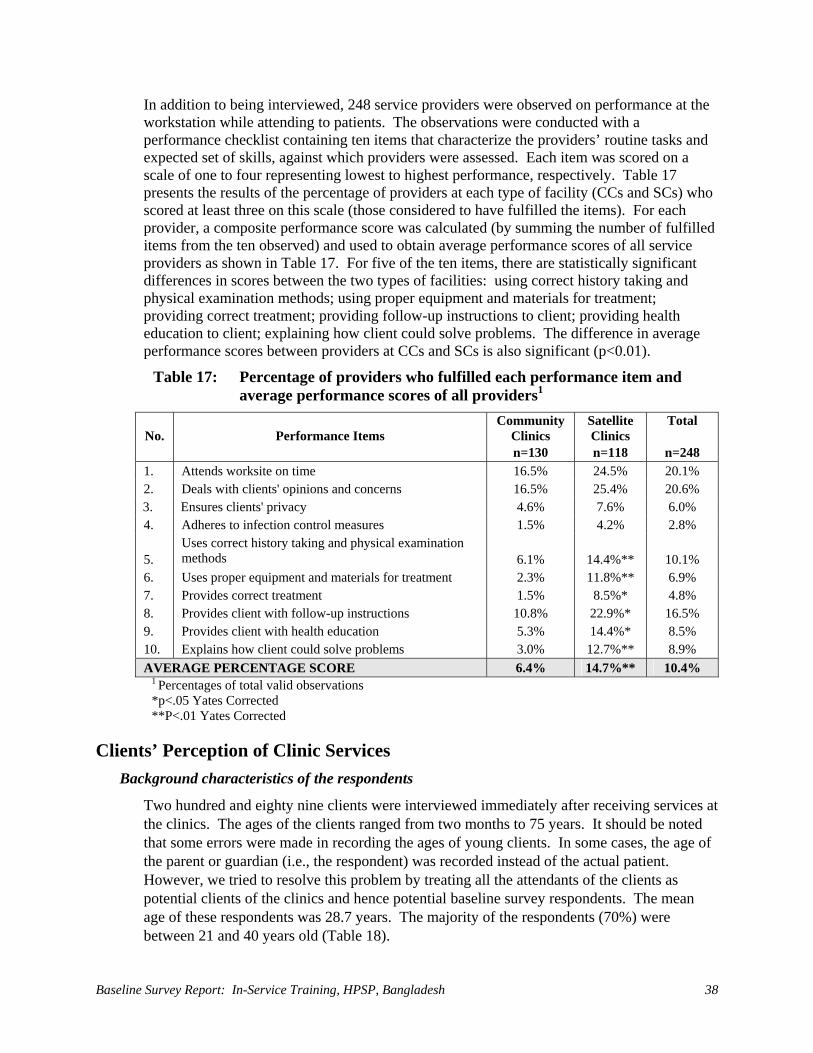
Baseline Survey Report: In-Service Training, HPSP, Bangladesh 38
In addition to being interviewed, 248 service providers were observed on performance at the workstation while attending to patients. The observations were conducted with a performance checklist containing ten items that characterize the providers’ routine tasks and expected set of skills, against which providers were assessed. Each item was scored on a scale of one to four representing lowest to highest performance, respectively. Table 17 presents the results of the percentage of providers at each type of facility (CCs and SCs) who scored at least three on this scale (those considered to have fulfilled the items). For each provider, a composite performance score was calculated (by summing the number of fulfilled items from the ten observed) and used to obtain average performance scores of all service providers as shown in Table 17. For five of the ten items, there are statistically significant differences in scores between the two types of facilities: using correct history taking and physical examination methods; using proper equipment and materials for treatment; providing correct treatment; providing follow-up instructions to client; providing health education to client; explaining how client could solve problems. The difference in average performance scores between providers at CCs and SCs is also significant (p<0.01).
Table 17: Percentage of providers who fulfilled each performance item and average performance scores of all providers1
No.
Performance Items
Community Clinics
Satellite Clinics
Total
n=130 n=118 n=248 1. Attends worksite on time 16.5% 24.5% 20.1% 2. Deals with clients' opinions and concerns 16.5% 25.4% 20.6% 3. Ensures clients' privacy 4.6% 7.6% 6.0% 4. Adheres to infection control measures 1.5% 4.2% 2.8% 5.
Uses correct history taking and physical examination methods
6.1%
14.4%**
10.1%
6. Uses proper equipment and materials for treatment 2.3% 11.8%** 6.9% 7. Provides correct treatment 1.5% 8.5%* 4.8% 8. Provides client with follow-up instructions 10.8% 22.9%* 16.5% 9. Provides client with health education 5.3% 14.4%* 8.5% 10. Explains how client could solve problems 3.0% 12.7%** 8.9% AVERAGE PERCENTAGE SCORE 6.4% 14.7%** 10.4%
1 Percentages of total valid observations *p<.05 Yates Corrected **P<.01 Yates Corrected
Clients’ Perception of Clinic Services Background characteristics of the respondents
Two hundred and eighty nine clients were interviewed immediately after receiving services at the clinics. The ages of the clients ranged from two months to 75 years. It should be noted that some errors were made in recording the ages of young clients. In some cases, the age of the parent or guardian (i.e., the respondent) was recorded instead of the actual patient. However, we tried to resolve this problem by treating all the attendants of the clients as potential clients of the clinics and hence potential baseline survey respondents. The mean age of these respondents was 28.7 years. The majority of the respondents (70%) were between 21 and 40 years old (Table 18).
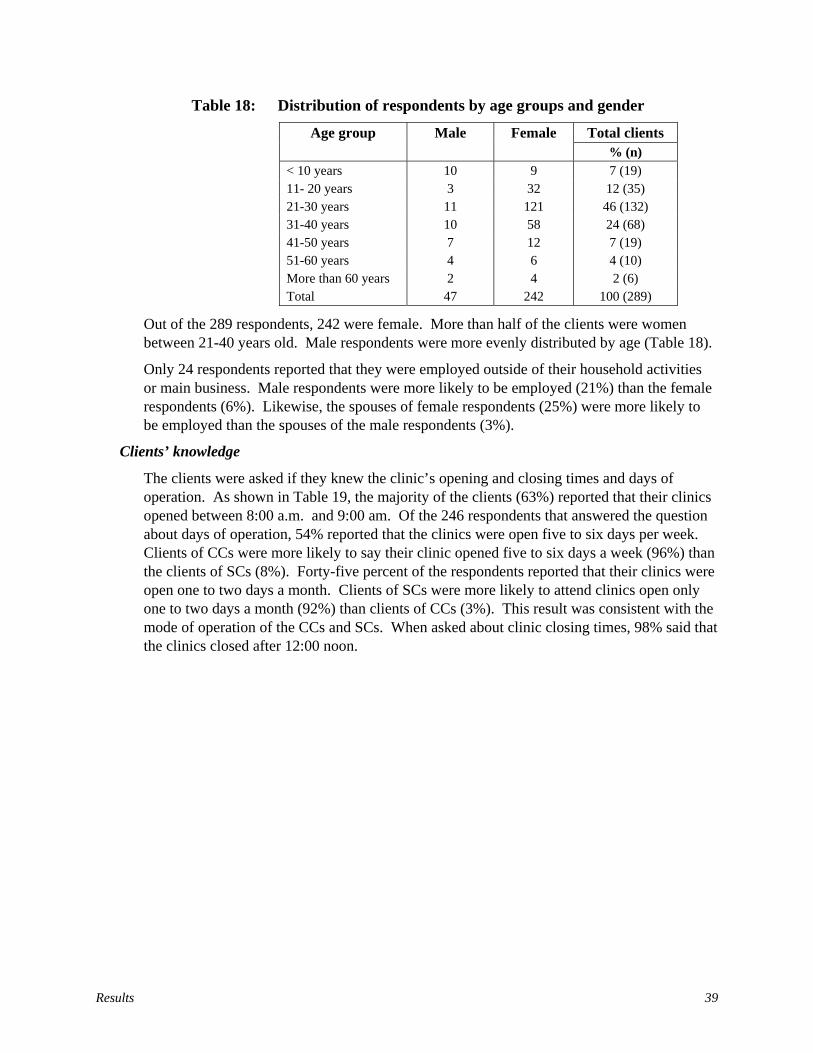
Results 39
Table 18: Distribution of respondents by age groups and gender
Total clients Age group Male Female % (n)
< 10 years 10 9 7 (19) 11- 20 years 3 32 12 (35) 21-30 years 11 121 46 (132) 31-40 years 10 58 24 (68) 41-50 years 7 12 7 (19) 51-60 years 4 6 4 (10) More than 60 years 2 4 2 (6) Total 47 242 100 (289)
Out of the 289 respondents, 242 were female. More than half of the clients were women between 21-40 years old. Male respondents were more evenly distributed by age (Table 18).
Only 24 respondents reported that they were employed outside of their household activities or main business. Male respondents were more likely to be employed (21%) than the female respondents (6%). Likewise, the spouses of female respondents (25%) were more likely to be employed than the spouses of the male respondents (3%).
Clients’ knowledge
The clients were asked if they knew the clinic’s opening and closing times and days of operation. As shown in Table 19, the majority of the clients (63%) reported that their clinics opened between 8:00 a.m. and 9:00 am. Of the 246 respondents that answered the question about days of operation, 54% reported that the clinics were open five to six days per week. Clients of CCs were more likely to say their clinic opened five to six days a week (96%) than the clients of SCs (8%). Forty-five percent of the respondents reported that their clinics were open one to two days a month. Clients of SCs were more likely to attend clinics open only one to two days a month (92%) than clients of CCs (3%). This result was consistent with the mode of operation of the CCs and SCs. When asked about clinic closing times, 98% said that the clinics closed after 12:00 noon.
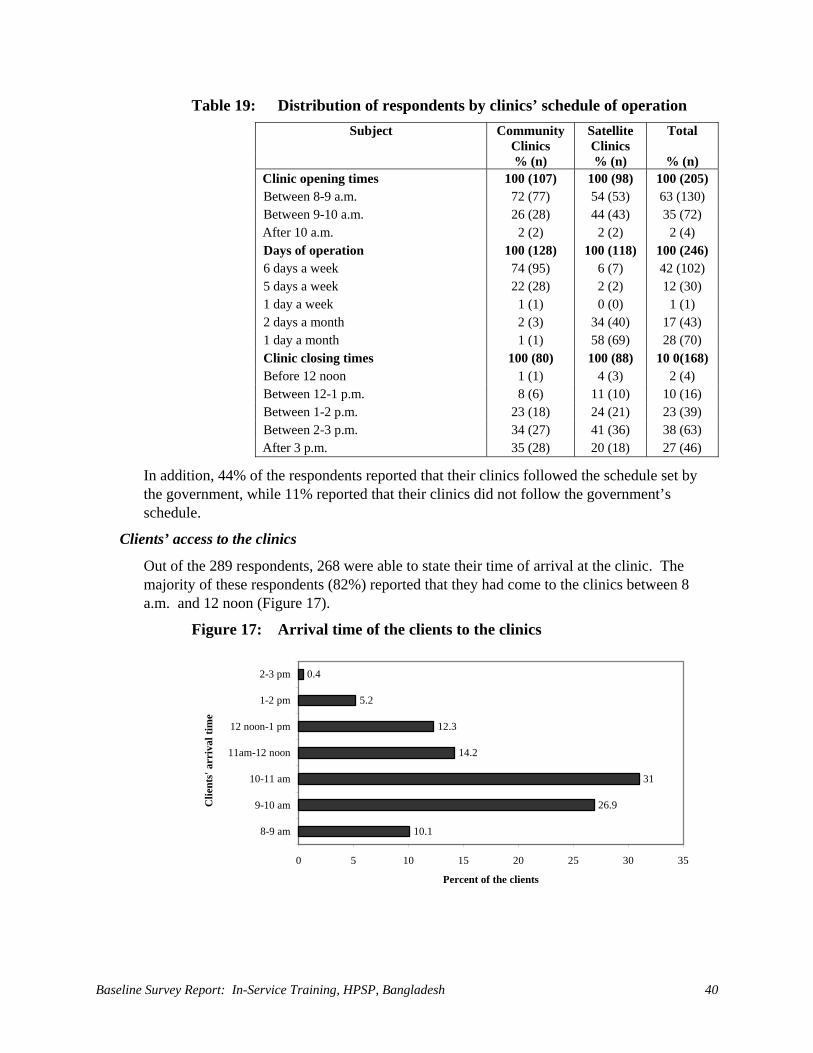
Baseline Survey Report: In-Service Training, HPSP, Bangladesh 40
Table 19: Distribution of respondents by clinics’ schedule of operation Subject Community
Clinics Satellite Clinics
Total
% (n) % (n) % (n) Clinic opening times 100 (107) 100 (98) 100 (205) Between 8-9 a.m. 72 (77) 54 (53) 63 (130) Between 9-10 a.m. 26 (28) 44 (43) 35 (72) After 10 a.m. 2 (2) 2 (2) 2 (4) Days of operation 100 (128) 100 (118) 100 (246) 6 days a week 74 (95) 6 (7) 42 (102) 5 days a week 22 (28) 2 (2) 12 (30) 1 day a week 1 (1) 0 (0) 1 (1) 2 days a month 2 (3) 34 (40) 17 (43) 1 day a month 1 (1) 58 (69) 28 (70) Clinic closing times 100 (80) 100 (88) 10 0(168) Before 12 noon 1 (1) 4 (3) 2 (4) Between 12-1 p.m. 8 (6) 11 (10) 10 (16) Between 1-2 p.m. 23 (18) 24 (21) 23 (39) Between 2-3 p.m. 34 (27) 41 (36) 38 (63) After 3 p.m. 35 (28) 20 (18) 27 (46)
In addition, 44% of the respondents reported that their clinics followed the schedule set by the government, while 11% reported that their clinics did not follow the government’s schedule.
Clients’ access to the clinics
Out of the 289 respondents, 268 were able to state their time of arrival at the clinic. The majority of these respondents (82%) reported that they had come to the clinics between 8 a.m. and 12 noon (Figure 17).
Figure 17: Arrival time of the clients to the clinics
10.1
26.9
31
14.2
12.3
5.2
0.4
0 5 10 15 20 25 30 35
8-9 am
9-10 am
10-11 am
11am-12 noon
12 noon-1 pm
1-2 pm
2-3 pm
Clie
nts'
arr
ival
tim
e
Percent of the clients
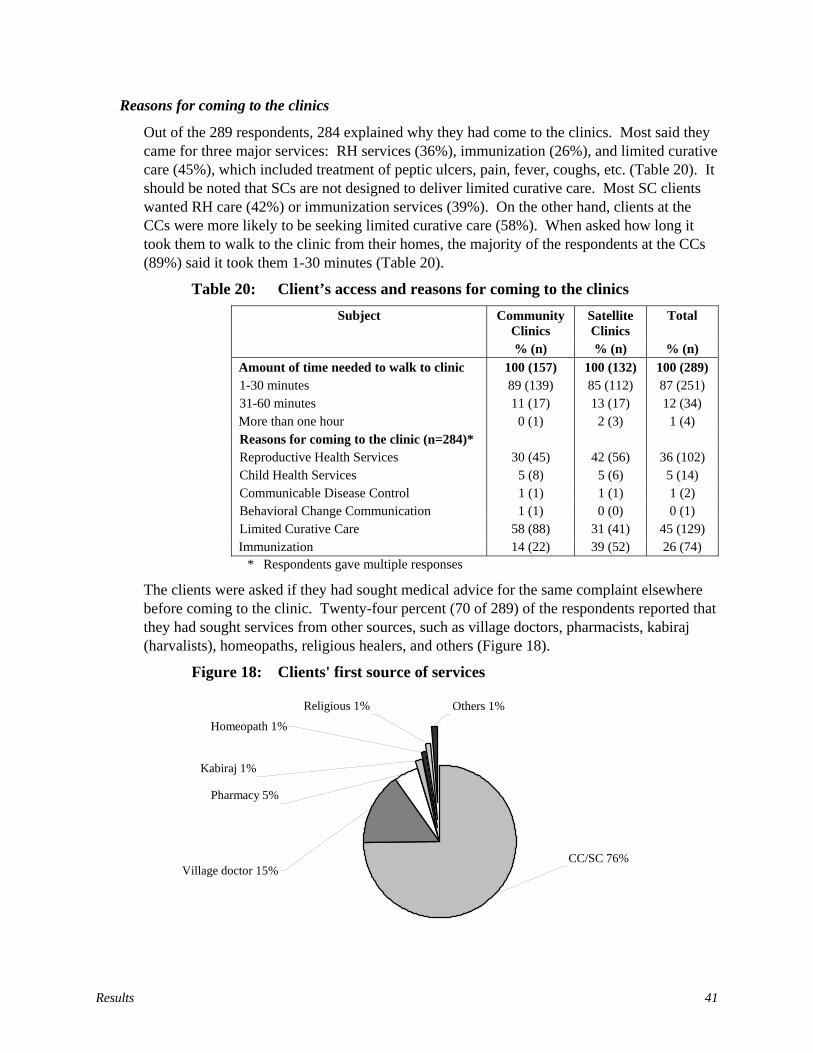
Results 41
Reasons for coming to the clinics
Out of the 289 respondents, 284 explained why they had come to the clinics. Most said they came for three major services: RH services (36%), immunization (26%), and limited curative care (45%), which included treatment of peptic ulcers, pain, fever, coughs, etc. (Table 20). It should be noted that SCs are not designed to deliver limited curative care. Most SC clients wanted RH care (42%) or immunization services (39%). On the other hand, clients at the CCs were more likely to be seeking limited curative care (58%). When asked how long it took them to walk to the clinic from their homes, the majority of the respondents at the CCs (89%) said it took them 1-30 minutes (Table 20).
Table 20: Client’s access and reasons for coming to the clinics Subject Community
Clinics Satellite Clinics
Total
% (n) % (n) % (n) Amount of time needed to walk to clinic 100 (157) 100 (132) 100 (289) 1-30 minutes 89 (139) 85 (112) 87 (251) 31-60 minutes 11 (17) 13 (17) 12 (34) More than one hour 0 (1) 2 (3) 1 (4) Reasons for coming to the clinic (n=284)* Reproductive Health Services 30 (45) 42 (56) 36 (102) Child Health Services 5 (8) 5 (6) 5 (14) Communicable Disease Control 1 (1) 1 (1) 1 (2) Behavioral Change Communication 1 (1) 0 (0) 0 (1) Limited Curative Care 58 (88) 31 (41) 45 (129) Immunization 14 (22) 39 (52) 26 (74)
* Respondents gave multiple responses
The clients were asked if they had sought medical advice for the same complaint elsewhere before coming to the clinic. Twenty-four percent (70 of 289) of the respondents reported that they had sought services from other sources, such as village doctors, pharmacists, kabiraj (harvalists), homeopaths, religious healers, and others (Figure 18).
Figure 18: Clients' first source of services
CC/SC 76%
Religious 1% Others 1%
Homeopath 1%
Kabiraj 1%
Village doctor 15%
Pharmacy 5%

Baseline Survey Report: In-Service Training, HPSP, Bangladesh 42
Client opinions about clinic services
When asked about waiting time, most of the respondents (>70%) reported that the providers saw them immediately after their arrival at the clinics (Table 21).
Table 21: Providers’ visiting time by clients’ arrival times (n=243)
Providers’ Visiting Time (Hour) Client Arrival Time (Hour) 8-9
a.m. 9-10 a.m.
10-11 a.m.
11 a.m.-noon
noon -1 p.m.
1-2 p.m.
2-3 p.m.
Total
8-9 a.m. 12 7 2 21 9-10 a.m. 44 18 1 1 1 65 10-11 a.m. 58 17 1 76 11 am-noon 30 5 1 36 noon -1 p.m. 28 3 31 1-2 p.m. 12 1 13 2-3 p.m. 1 1 After 3 p.m. Total 12 51 78 48 35 17 2 243
Ninety-three percent of the respondents (268 of 289) reported that they felt comfortable asking the providers questions. Sixty-seven percent of the respondents reported that the providers had discussed their problems with them. When asked about supplies for treating patients, the majority (72%) of the respondents reported that the clinics had the supplies needed to treat them (Table 22). However, the respondents’ opinions about the availability of supplies varied by type of clinic. Sixty-four percent of the respondents at the CCs and 81% of the respondents at the SCs reported that the clinics had supplies to treat patients, which indicates that the CCs (with a wider range of services) were more likely to lack supplies needed for treatment.
The respondents were also asked if they had seen their providers wash their hands. Fifty-four percent of the respondents said yes (Table 22).
Table 22: Perceptions of clients about providers in the clinics Subject Community
Clinics Satellite Clinics
Total
% (n) % (n) % (n) Providers explained what was wrong 100 (131) 100 (116) 100 (247) Explained 66 (87) 67 (78) 67 (165) Did not explain 34 (44) 33 (38) 33 (82) Supplies for treating clients were 100 (129) 100 (113) 100 (242) Available 64 (83) 81 (92) 72 (175) Unavailable 36 (46) 19 (21) 28 (67) Provider washed hands 100 (70) 100 (86) 100 (156) Saw providers wash hands 54 (38) 55 (47) 54 (85) Did not see them wash hands 46 (32) 45 (39) 46 (71) Attitudes of clients for next visit 100 (144) 100 (128) 100 (272) Will visit the clinic again 85 (122) 77 (98) 81 (220) Will not visit the clinic again 15 (22) 23 (30) 19 (52)
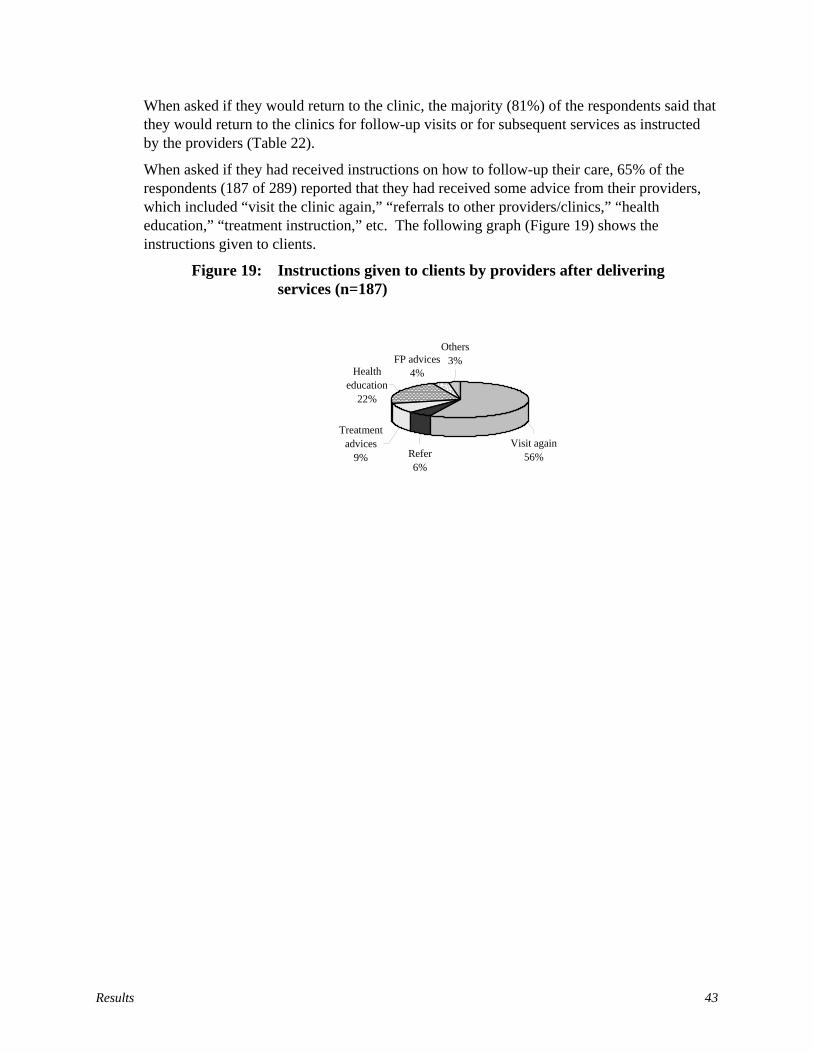
Results 43
When asked if they would return to the clinic, the majority (81%) of the respondents said that they would return to the clinics for follow-up visits or for subsequent services as instructed by the providers (Table 22).
When asked if they had received instructions on how to follow-up their care, 65% of the respondents (187 of 289) reported that they had received some advice from their providers, which included “visit the clinic again,” “referrals to other providers/clinics,” “health education,” “treatment instruction,” etc. The following graph (Figure 19) shows the instructions given to clients.
Figure 19: Instructions given to clients by providers after delivering services (n=187)
Refer 6%
Visit again56%
Others3%
Health education
22%
FP advices4%
Treatment advices
9%

Discussions and Conclusions 45
Discussion and Conclusions Under the HPSP, the IST of health and FP personnel has been organized and managed through a unified LD system. The LD-IST coordinates all ESP-related IST activities in accordance with the National In-Service Training Strategy and Action Plan for ESP 1999-2003. This strategy uses a highly decentralized approach to implement training, dividing responsibilities as follows:
• The TTU is responsible for planning and coordination;
• The LTOs are responsible for curriculum development, resource preparation, and TOT;
• The DTCCs and DUTTs are responsible for the management and training of field service providers and their immediate supervisors.
This survey should assist policy makers and PMs to assess the current situation, and identify constraints and factors affecting the implementation of the National Strategy. It should also serve as a baseline for future measurements of change over time.
CCs are the centerpiece of ESP service delivery under the HPSP. Some 13,500 are planned, serving (along with 4,500 Union level Health and Family Welfare Centers) rural catchment areas of about 6,000 people. Unfortunately, few CCs had been built - let alone equipped and put into operation - at the time of the baseline survey. The community-level survey instruments were designed to capture baseline data at CCs. The survey’s purpose was to establish a baseline for future comparison (post-ESP training and other ESP interventions) at these SDPs. In about 50% of the sample communities, no functioning CCs were available to survey. In these cases, the survey was conducted at SCs, which were also community-based and which employed the same cadres of field service providers and immediate supervisors as found at the CCs. The SCs are essentially mobile clinics that function in a private facility (usually a home) in a given community one day a month mainly to provide FP, ANC and Expanded Program of Immunization (EPI) services. This range of services is much more limited than the ESP to be delivered at CCs; and the physical facilities, equipment, supplies and drugs are not expected to be at the same level as the CC’s. Moreover, the SCs will be phased out over the next few years, so there is no expectation of future comparison to SC baseline data. Nevertheless, visiting SCs where CCs did not exist allowed the baseline survey to capture information about the providers, frontline supervisors, and clients who will eventually serve and use the CCs.
For better or worse, the Basic 21-day ESP Training Course, intended to help prepare field service providers for their new “one-stop” ESP delivery role in the CCs, had not yet been widely implemented at the time of the survey. Therefore, the survey represents largely a “pre-Basic ESP training” baseline.
The baseline findings show that, at the time of the survey, the TTU was understaffed. Although there were 15 sanctioned professional positions, only seven staff members had been working in the TTU since mid-1998. Of these, five were deputed from other departments of DGHS and some had very little prior experience in the organization and management of training programs. Moreover, they could be transferred to other departments

Baseline Survey Report: In-Service Training, HPSP, Bangladesh 46
at any time. This limited their motivation to try to improve their training skills and the likelihood that they could develop further as professional trainers.
The findings also reveal that some of the TTU personnel did not know their own job descriptions. In fact, there were no written job descriptions for TTU personnel at that time. Due to the lack of specific, written job descriptions, the TTU personnel were confused about their roles, and thought that their actual work exceeded expectations. They felt that their “additional” tasks sometimes interfered with their ability to carry out their primary responsibilities. Written job descriptions would give personnel a clearer understanding of job expectations and help them to meet those expectations.
Although the TTU is responsible for coordinating all IST activities, few TTU personnel knew of or understood IST training targets and achievements under the HPSP. A significant number of TTU personnel had little detailed knowledge of key quality and standardization components of the TTU’s program: the National IST Strategy and Action Plan for ESP 1999-2003, the draft national training standards, the IST monitoring and follow-up system, or the documentation and reporting system. Because they were unaware of or unfamiliar with these components, TTU personnel could not conceptualize the overall strategy for IST implementation and quality assurance.
TTU personnel had no clear understanding of the concept of “master trainer” as it pertains to the ESP-related TOT courses under their control, which rely heavily on outside resource persons to serve as the trainers.
In most cases, TTU personnel followed the directives of their supervisors. Some of the TTU personnel wanted more interaction with their supervisors to clear up confusion over their job responsibilities, but they felt that the supervisors were too busy to provide adequate oversight.
Most of the TTU professionals expressed frustration with the management of training, particularly the financial management. They complained about the amount of time it took to process requests for funds. They were concerned that sending funds directly to the LTOs might cause management problems. They wanted higher advance allocations of funding and said that the 20% limitation at the beginning of any training activity made it difficult to implement programs smoothly.
TTU personnel also expressed frustration with what they felt was the automatic certification of all trainees. They thought that there should be standards for certification and that only trainees meeting those standards should get certificates. Otherwise, weaker trainees would not be motivated to improve their performance.
Personnel at the LTOs appeared to be better equipped and supported than those at the TTU. They were well staffed. Most of the professional staff knew their job descriptions and had considerable past experience in training. However, as with the TTU, very few trainers had thorough knowledge of the key IST quality and standardization documents or systems. Although they were familiar with their own LTO’s reporting system, they did not understand how it related to the TTU’s training management information system (TMIS).
As with the TTU, LTOs also complained of problems with the financial management process for funding training activities. Delays in obtaining funds meant that they fell seriously short
Discussions and Conclusions 47
of achieving their contractual training targets. In addition, the LTOs had difficulties using the resource persons for TOT courses. They said some of the resource persons did not maintain expected standards of training, (e.g., they came to class unprepared or deviated from assigned lesson plans).
LTO trainers seemed to rely on supervisors mainly for administrative support, such as giving encouragement, explaining programs and policies, or providing effective representation. Some trainers felt that supervisors provided only limited technical support. Very few supervisors had visited training sites to assess trainers’ performance and give feedback. Those trainers who had been evaluated by their supervisors felt that the evaluations helped them to resolve problems or clarify issues. Very few LTO trainers followed up their trainees at the worksite because such follow-up had never been assigned to them as a required extension of the training process. Nor did the LTOs have the funding to do follow-up. Although the national strategy clearly encourages monitoring and follow-up, its importance still needs to be better understood by TTU and LTO personnel. It should be explicitly incorporated into planning and contracting for IST courses.
Respondents from DTCCs and DUTTs were generally clear about their job responsibilities, but they felt that they needed additional or different training to do their jobs well. The majority of DTCC and DUTT members mentioned their roles in administration, finance, and coordination, but very few of them had received training in these areas. They also mentioned the need for future training in monitoring and supervision as well as specialized training in clinical skills. There is a need for more systematic assessment of professional development and IST needs based on the actual job responsibilities of DTCC and DUTT personnel.
Only 48% of the DTCC respondents and 24% of the DUTT respondents considered training their main job. But almost all of these respondents said they were involved in training-related activities. Under the decentralized HPSP, training responsibilities have been increased and imposed on district and Upazila personnel. The survey found that 59% of the DTCC members and 64% of the DUTT members felt that training activities interfered with their main job responsibilities. The job descriptions of DTCC and DUTT members need to be revised to incorporate training-related activities.
The majority of the DTCC and DUTT members surveyed were found to be involved in planning, organizing, and conducting training; but very few of them followed the National IST Strategy, Basic ESP training guidelines and National IST Standards. DTCC and DUTT members need further orientation on these key elements of the IST program to be able to perform to standard as trainers and managers of training.
Almost all the DTCC and DUTT members surveyed encountered problems with funding, trainee accommodations, and the distribution of logistics and supplies, teaching aids and training materials, etc. Training facilities should be assessed to assure that all of these essential elements arrive on time, before the start of training courses.
DUTT trainers should be followed up, observed, and given feedback (based on the available standard checklist) at the training sites in order to improve their performance. They should also be encouraged to make recommendations concerning curricula and the TOT. As mentioned above, although the national strategy calls for monitoring and follow-up, it has not translated these plans adequately into LTO assignments or budgets. This principle needs to
Baseline Survey Report: In-Service Training, HPSP, Bangladesh 48
be better understood and resources made available to the LTOs, but there are practical limits to how often the LTOs can visit training sites. The Basic ESP course guidelines also provide for “peer trainer” monitoring, whereby DTCC members assess the trainers using the checklists. More systematic monitoring of the trainers, using different approaches, is needed to assess and improve their performance.
Similarly, trainees should be followed up at their worksites, receiving feedback on how to improve their performance. For example, DUTT trainers should follow-up trainees at CCs, using the available checklists, as specified in the national guidelines. In reality, very few DUTT trainers followed up their trainees in any systematic and supportive manner. The principle of follow-up, as an extension of the training process and a form of supportive supervision, is not well established. DTCC and DUTT members need further direction and orientation in order to improve performance. Field service providers themselves suggested improvements in this area.
Documenting training activities and reporting on their results is vital to help the TTU and LTOs monitor trainer and trainee performance and to implement the decentralized IST program. This requires TTU and LTOs to develop the capacity to plan, organize, prepare sites, manage, monitor, and follow-up training. The survey reveals confusion about documentation and reporting. DTCCs and DUTTs disagreed on how to document their training activities and where to submit reports. Although a TMIS had been established in the TTU, very few DTCCs and DUTTs were even familiar with it. This suggests the need for further direction and orientation of DTCC and DUTT members.
The survey shows there is a large cadre of frontline supervisors, working between the field service providers and the Upazila managers, who are responsible for assisting the providers at their worksite to properly deliver the ESP at the CC level. Very few of these immediate supervisors (especially those coming from the health sector) had had any training to prepare them for these responsibilities. Only 30% had been trained in management and supervision and most of these had been trained more than three years ago. Fortunately, these supervisors had been included, along with field service providers, in the 21-day Basic ESP training course. A brief additional course might be organized to acquaint frontline supervisors with the principles of supportive supervision and performance improvement.
Survey results show that the majority of field service providers did not know or understand the new job descriptions developed after the inception of HPSP. In addition, only 7.5% (25) of providers interviewed had taken the 21-day Basic ESP training, which is very important to help them undertake their new CC-based ESP responsibilities. Of these trained providers, the majority (68 percent) felt that they could utilize more than half of the knowledge and skills covered in the Basic ESP course in their work at either CCs or SCs. However, based on the survey team’s observations, change in basic skills performance is only 10%. There is a need to assess the adequacy of the Basic ESP curriculum, TOT programs, and the 21-day training course and/or the appropriateness of the observation checklist.
The facility assessment results also raise performance concerns. Almost all of the CCs lacked standardized equipment, supplies, and medicines that were supposed to be present in all clinics.
Discussions and Conclusions 49
Clearly this baseline survey revealed several performance areas and their factors that need addressing among the categories of supervisors and providers in the HPSP project.


Appe
ndic
es
51
App
endi
x A
: M
onito
ring
and
Eva
luat
ion
(M&
E) P
lan
of E
SP a
nd In
-Se
rvic
e Tr
aini
ng P
rogr
am, B
angl
ades
h, 2
000
- 200
3 C
once
ptua
l fra
mew
ork
The
Mon
itorin
g an
d Ev
alua
tion
(M&
E) p
lan
for t
he In
-Ser
vice
Tra
inin
g of
the
Esse
ntia
l Ser
vice
s Pac
kage
Pro
gram
rela
tes t
o ac
hiev
emen
t of
the
Six
Stra
tegi
c Pr
ojec
t Obj
ectiv
es.
Thes
e ob
ject
ives
cov
er th
ree
dist
inct
leve
ls o
f eva
luat
ion:
ind
ivid
ual (
prov
ider
and
clie
nt),
inst
itutio
nal a
nd se
ctor
al le
vels
. Th
e co
ncep
tual
fram
ewor
k up
on w
hich
the
plan
is fo
rmul
ated
is p
rese
nted
bel
ow.
SE
CT
OR
AL
INST
ITU
TIO
NA
L
IN
DIV
IDU
AL
- PR
OV
IDE
R
IN
DIV
IDU
AL
- C
LIE
NT
e.
g., N
atio
nal E
SP
e.
g., L
TO
e.
g., P
rovi
der
e.
g., p
erce
ived
qua
lity
Trai
ning
Stra
tegy
Cap
acity
Perf
orm
ance
and
use
of se
rvic
es (a
cces
s)
PRO
JEC
T
OB
JEC
TIV
ES
- PR
OC
ESS
- M
ON
ITO
RIN
G
IND
ICA
TO
RS
(TM
IS)
- R
ESU
LT
S -
EV
AL
UA
TIO
N
IND
ICA
TO
RS
PRIME II PMP
PRIME-HPSP
Indicator
EV
AL
UA
TIO
N D
AT
A
CO
LL
EC
TIO
N
SOU
RC
ES/
ME
TH
OD
S
EV
AL
UA
TIO
N
DA
TA
PE
RIO
D (S
) O
F A
PPL
ICA
TIO
N
I. St
reng
then
the
Cen
tral-l
evel
ca
paci
ty to
pla
n,
impl
emen
t and
fo
llow
-up
ESP
Trai
ning
.
C
reat
ion
& a
nnua
l upd
ate
of
Nat
iona
l Stra
tegy
Pla
n fo
r ES
P Tr
aini
ng
Es
tabl
ishm
ent o
f IST
st
ruct
ure,
wor
kpla
ns a
nd
cale
ndar
s
Esta
blis
hmen
t of T
TU
stru
ctur
e, st
aff &
equ
ipm
ent
1.
Exis
tenc
e of
a N
atio
nal
ESP
Trai
ning
Sys
tem
2.
TT
U fu
nctio
ning
at
optim
al p
erfo
rman
ce
2 1.
1,
1.3 1.7
Pr
ojec
t D
ocum
enta
tion
Rev
iew
and
In-
dept
h in
terv
iew
s w
ith k
ey in
form
ants
A
t bas
elin
e, m
id-
term
and
end
-of-
proj
ect e
valu
atio
ns
II.
Stan
dard
ize
proc
ess o
f pl
anni
ng,
impl
emen
tatio
n fo
llow
-up
of in
-se
rvic
e an
d tra
inin
g
D
evel
opm
ent o
f Nat
iona
l Tr
aini
ng S
tand
ards
and
G
uide
lines
Dev
elop
men
t of E
SP
Trai
ning
Cur
ricul
a (a
t va
rious
leve
ls)
3.
Nat
iona
l sta
ndar
ds a
nd
guid
elin
es c
reat
ed a
nd
appl
ied
at fa
cilit
ies p
ost
diss
emin
atio
n 4.
TT
U w
ith c
apac
ity to
re
view
and
eva
luat
e ES
P cu
rric
ula
21 10
1.6 1.5
D
ocum
enta
tion
Rev
iew
plu
s Fac
ility
Su
rvey
Inst
itutio
n C
apac
ity
Ass
essm
ent
A
t bas
elin
e, m
id-
term
and
end
-of-
proj
ect e
valu
atio
ns
A
t bas
elin
e, m
id-
term
and
end
-of-
proj
ect e
valu
atio
ns
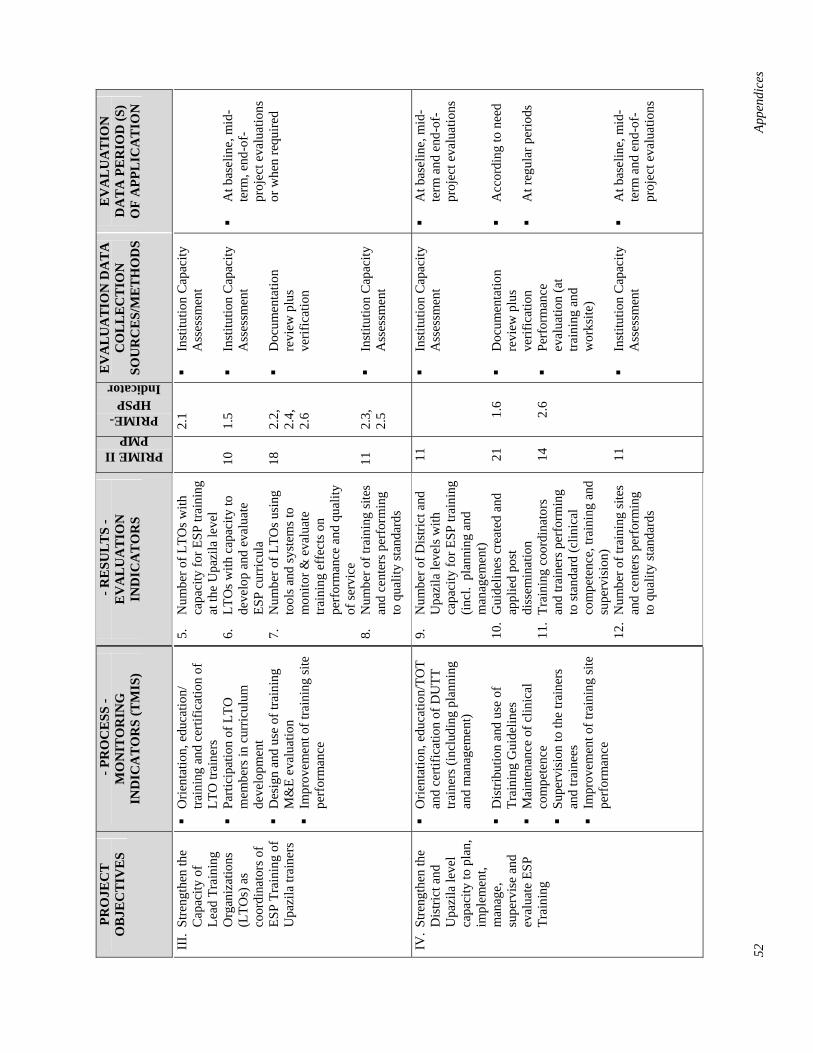
52
Appe
ndic
es
PRO
JEC
T
OB
JEC
TIV
ES
- PR
OC
ESS
- M
ON
ITO
RIN
G
IND
ICA
TO
RS
(TM
IS)
- R
ESU
LT
S -
EV
AL
UA
TIO
N
IND
ICA
TO
RS
PRIME II PMP
PRIME-HPSP
Indicator
EV
AL
UA
TIO
N D
AT
A
CO
LL
EC
TIO
N
SOU
RC
ES/
ME
TH
OD
S
EV
AL
UA
TIO
N
DA
TA
PE
RIO
D (S
) O
F A
PPL
ICA
TIO
N
III.
Stre
ngth
en th
e C
apac
ity o
f Le
ad T
rain
ing
Org
aniz
atio
ns
(LTO
s) a
s co
ordi
nato
rs o
f ES
P Tr
aini
ng o
f U
pazi
la tr
aine
rs
O
rient
atio
n, e
duca
tion/
tra
inin
g an
d ce
rtific
atio
n of
LT
O tr
aine
rs
Pa
rtici
patio
n of
LTO
m
embe
rs in
cur
ricul
um
deve
lopm
ent
D
esig
n an
d us
e of
trai
ning
M
&E
eval
uatio
n
Impr
ovem
ent o
f tra
inin
g si
te
perf
orm
ance
5.
Num
ber o
f LTO
s with
ca
paci
ty fo
r ESP
trai
ning
at
the
Upa
zila
leve
l 6.
LT
Os w
ith c
apac
ity to
de
velo
p an
d ev
alua
te
ESP
curr
icul
a 7.
N
umbe
r of L
TOs u
sing
to
ols a
nd sy
stem
s to
mon
itor &
eva
luat
e tra
inin
g ef
fect
s on
perf
orm
ance
and
qua
lity
of se
rvic
e 8.
N
umbe
r of t
rain
ing
site
s an
d ce
nter
s per
form
ing
to q
ualit
y st
anda
rds
10
18
11
2.1
1.5
2.2,
2.
4,
2.6
2.3,
2.
5
In
stitu
tion
Cap
acity
A
sses
smen
t
Inst
itutio
n C
apac
ity
Ass
essm
ent
D
ocum
enta
tion
revi
ew p
lus
verif
icat
ion
In
stitu
tion
Cap
acity
A
sses
smen
t
A
t bas
elin
e, m
id-
term
, end
-of-
proj
ect e
valu
atio
ns
or w
hen
requ
ired
IV. S
treng
then
the
Dis
trict
and
U
pazi
la le
vel
capa
city
to p
lan,
im
plem
ent,
man
age,
su
perv
ise
and
eval
uate
ESP
Tr
aini
ng
O
rient
atio
n, e
duca
tion/
TOT
and
certi
ficat
ion
of D
UTT
tra
iner
s (in
clud
ing
plan
ning
an
d m
anag
emen
t)
Dis
tribu
tion
and
use
of
Trai
ning
Gui
delin
es
M
aint
enan
ce o
f clin
ical
co
mpe
tenc
e
Supe
rvis
ion
to th
e tra
iner
s an
d tra
inee
s
Impr
ovem
ent o
f tra
inin
g si
te
perf
orm
ance
9.
Num
ber o
f Dis
trict
and
U
pazi
la le
vels
with
ca
paci
ty fo
r ESP
trai
ning
(in
cl.
plan
ning
and
m
anag
emen
t) 10
. G
uide
lines
cre
ated
and
ap
plie
d po
st
diss
emin
atio
n 11
. Tr
aini
ng c
oord
inat
ors
and
train
ers p
erfo
rmin
g to
stan
dard
(clin
ical
co
mpe
tenc
e, tr
aini
ng a
nd
supe
rvis
ion)
12
. N
umbe
r of t
rain
ing
site
s an
d ce
nter
s per
form
ing
to q
ualit
y st
anda
rds
11 21 14 11
1.6 2.6
In
stitu
tion
Cap
acity
A
sses
smen
t
Doc
umen
tatio
n re
view
plu
s ve
rific
atio
n
Perf
orm
ance
ev
alua
tion
(at
train
ing
and
wor
ksite
)
Inst
itutio
n C
apac
ity
Ass
essm
ent
A
t bas
elin
e, m
id-
term
and
end
-of-
proj
ect e
valu
atio
ns
A
ccor
ding
to n
eed
A
t reg
ular
per
iods
At b
asel
ine,
mid
-te
rm a
nd e
nd-o
f-pr
ojec
t eva
luat
ions
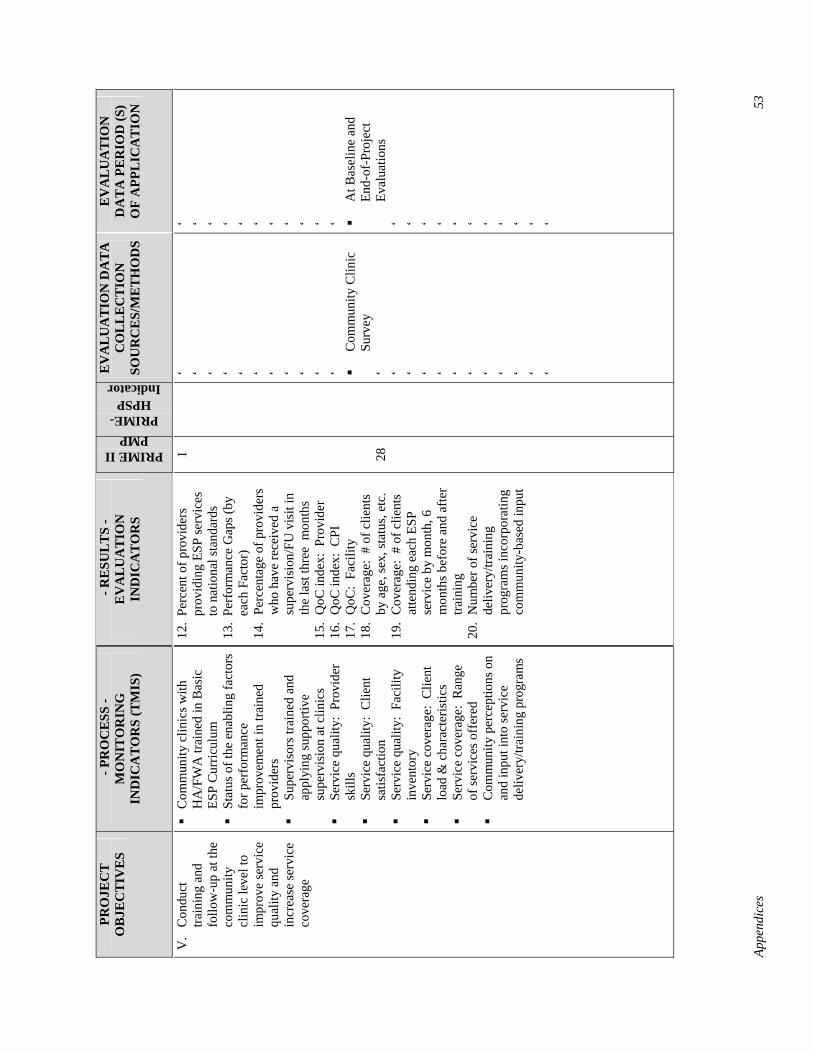
Appe
ndic
es
53
PRO
JEC
T
OB
JEC
TIV
ES
- PR
OC
ESS
- M
ON
ITO
RIN
G
IND
ICA
TO
RS
(TM
IS)
- R
ESU
LT
S -
EV
AL
UA
TIO
N
IND
ICA
TO
RS
PRIME II PMP
PRIME-HPSP
Indicator
EV
AL
UA
TIO
N D
AT
A
CO
LL
EC
TIO
N
SOU
RC
ES/
ME
TH
OD
S
EV
AL
UA
TIO
N
DA
TA
PE
RIO
D (S
) O
F A
PPL
ICA
TIO
N
V.
Con
duct
tra
inin
g an
d fo
llow
-up
at th
e co
mm
unity
cl
inic
leve
l to
impr
ove
serv
ice
qual
ity a
nd
incr
ease
serv
ice
cove
rage
C
omm
unity
clin
ics w
ith
HA
/FW
A tr
aine
d in
Bas
ic
ESP
Cur
ricul
um
St
atus
of t
he e
nabl
ing
fact
ors
for p
erfo
rman
ce
impr
ovem
ent i
n tra
ined
pr
ovid
ers
Su
perv
isor
s tra
ined
and
ap
plyi
ng su
ppor
tive
supe
rvis
ion
at c
linic
s
Serv
ice
qual
ity:
Prov
ider
sk
ills
Se
rvic
e qu
ality
: C
lient
sa
tisfa
ctio
n
Serv
ice
qual
ity:
Faci
lity
inve
ntor
y
Serv
ice
cove
rage
: C
lient
lo
ad &
cha
ract
eris
tics
Se
rvic
e co
vera
ge:
Ran
ge
of se
rvic
es o
ffer
ed
C
omm
unity
per
cept
ions
on
and
inpu
t int
o se
rvic
e de
liver
y/tra
inin
g pr
ogra
ms
12.
Perc
ent o
f pro
vide
rs
prov
idin
g ES
P se
rvic
es
to n
atio
nal s
tand
ards
13
. Pe
rfor
man
ce G
aps (
by
each
Fac
tor)
14
. Pe
rcen
tage
of p
rovi
ders
w
ho h
ave
rece
ived
a
supe
rvis
ion/
FU v
isit
in
the
last
thre
e m
onth
s 15
. Q
oC in
dex:
Pro
vide
r 16
. Q
oC in
dex:
CPI
17
. Q
oC:
Faci
lity
18.
Cov
erag
e: #
of c
lient
s by
age
, sex
, sta
tus,
etc.
19
. C
over
age:
# o
f clie
nts
atte
ndin
g ea
ch E
SP
serv
ice
by m
onth
, 6
mon
ths b
efor
e an
d af
ter
train
ing
20.
Num
ber o
f ser
vice
de
liver
y/tra
inin
g pr
ogra
ms i
ncor
pora
ting
com
mun
ity-b
ased
inpu
t
1
28
‘ ‘ ‘ ‘ ‘ ‘ ‘ ‘ ‘ ‘ ‘
Com
mun
ity C
linic
Su
rvey
‘ ‘ ‘ ‘ ‘ ‘ ‘ ‘ ‘ ‘ ‘ ‘
‘ ‘ ‘ ‘ ‘ ‘ ‘ ‘ ‘ ‘ ‘ A
t Bas
elin
e an
d En
d-of
-Pro
ject
Ev
alua
tions
‘ ‘ ‘ ‘ ‘ ‘ ‘ ‘ ‘ ‘ ‘
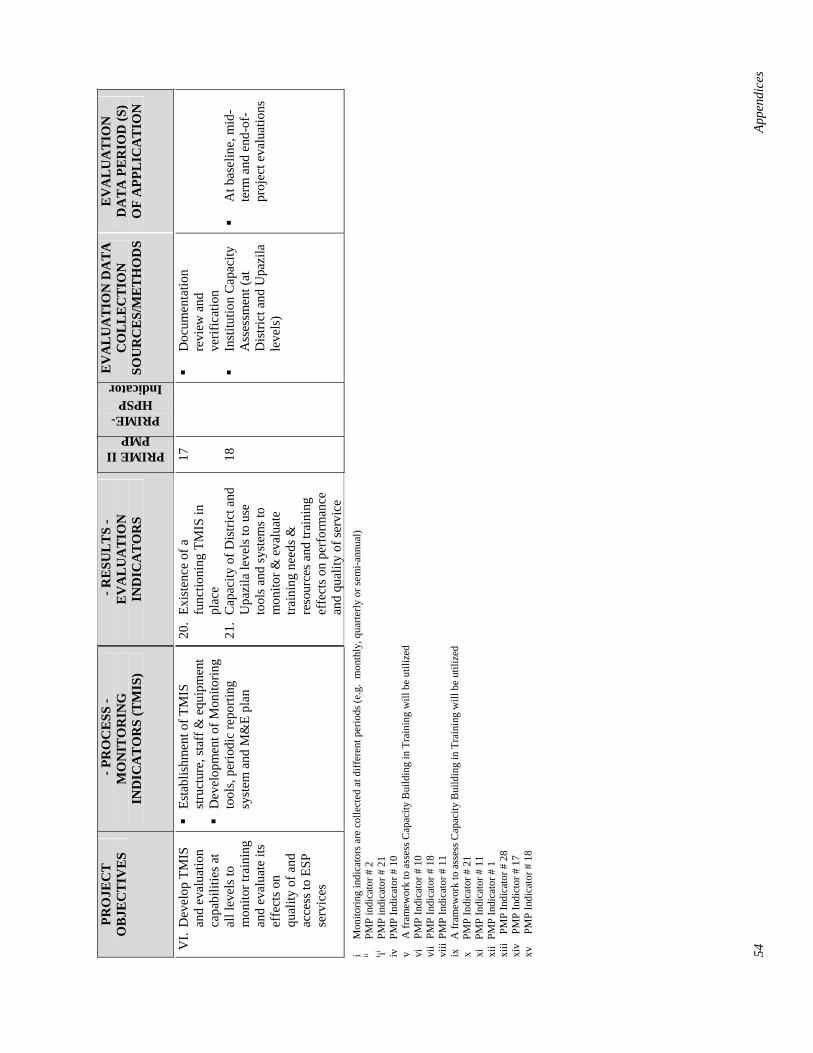
54
Appe
ndic
es
PRO
JEC
T
OB
JEC
TIV
ES
- PR
OC
ESS
- M
ON
ITO
RIN
G
IND
ICA
TO
RS
(TM
IS)
- R
ESU
LT
S -
EV
AL
UA
TIO
N
IND
ICA
TO
RS
PRIME II PMP
PRIME-HPSP
Indicator
EV
AL
UA
TIO
N D
AT
A
CO
LL
EC
TIO
N
SOU
RC
ES/
ME
TH
OD
S
EV
AL
UA
TIO
N
DA
TA
PE
RIO
D (S
) O
F A
PPL
ICA
TIO
N
VI.
Dev
elop
TM
IS
and
eval
uatio
n ca
pabi
litie
s at
all l
evel
s to
mon
itor t
rain
ing
and
eval
uate
its
effe
cts o
n qu
ality
of a
nd
acce
ss to
ESP
se
rvic
es
Es
tabl
ishm
ent o
f TM
IS
stru
ctur
e, st
aff &
equ
ipm
ent
D
evel
opm
ent o
f Mon
itorin
g to
ols,
perio
dic
repo
rting
sy
stem
and
M&
E pl
an
20.
Exis
tenc
e of
a
func
tioni
ng T
MIS
in
plac
e 21
. C
apac
ity o
f Dis
trict
and
U
pazi
la le
vels
to u
se
tool
s and
syst
ems t
o m
onito
r & e
valu
ate
train
ing
need
s &
reso
urce
s and
trai
ning
ef
fect
s on
perf
orm
ance
an
d qu
ality
of s
ervi
ce
17 18
Doc
umen
tatio
n re
view
and
ve
rific
atio
n
Inst
itutio
n C
apac
ity
Ass
essm
ent (
at
Dis
trict
and
Upa
zila
le
vels
)
A
t bas
elin
e, m
id-
term
and
end
-of-
proj
ect e
valu
atio
ns
i M
onito
ring
indi
cato
rs a
re c
olle
cted
at d
iffer
ent p
erio
ds (e
.g.
mon
thly
, qua
rterly
or s
emi-a
nnua
l)
ii PM
P in
dica
tor #
2
i ii PM
P in
dica
tor #
21
iv
PMP
Indi
cato
r # 1
0
v A
fram
ewor
k to
ass
ess C
apac
ity B
uild
ing
in T
rain
ing
will
be
utili
zed
vi
PMP
Indi
cato
r # 1
0
vii
PMP
Indi
cato
r # 1
8
viii
PMP
Indi
cato
r # 1
1
ix
A fr
amew
ork
to a
sses
s Cap
acity
Bui
ldin
g in
Tra
inin
g w
ill b
e ut
ilize
d
x PM
P In
dica
tor #
21
xi
PMP
Indi
cato
r # 1
1
xii
PMP
Indi
cato
r # 1
xiii
PMP
Indi
cato
r # 2
8
xiv
PMP
Indi
ctor
# 1
7
xv
PMP
Indi
cato
r # 1
8
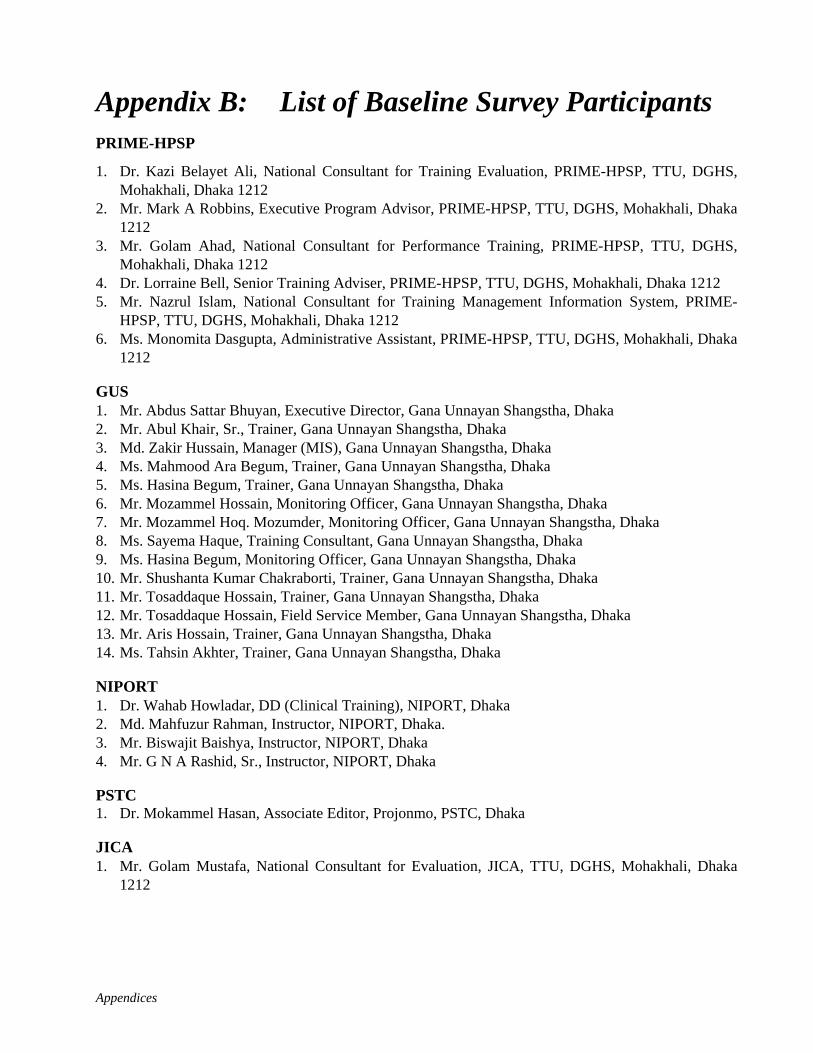
Appendices
Appendix B: List of Baseline Survey Participants PRIME-HPSP
1. Dr. Kazi Belayet Ali, National Consultant for Training Evaluation, PRIME-HPSP, TTU, DGHS, Mohakhali, Dhaka 1212
2. Mr. Mark A Robbins, Executive Program Advisor, PRIME-HPSP, TTU, DGHS, Mohakhali, Dhaka 1212
3. Mr. Golam Ahad, National Consultant for Performance Training, PRIME-HPSP, TTU, DGHS, Mohakhali, Dhaka 1212
4. Dr. Lorraine Bell, Senior Training Adviser, PRIME-HPSP, TTU, DGHS, Mohakhali, Dhaka 1212 5. Mr. Nazrul Islam, National Consultant for Training Management Information System, PRIME-
HPSP, TTU, DGHS, Mohakhali, Dhaka 1212 6. Ms. Monomita Dasgupta, Administrative Assistant, PRIME-HPSP, TTU, DGHS, Mohakhali, Dhaka
1212
GUS 1. Mr. Abdus Sattar Bhuyan, Executive Director, Gana Unnayan Shangstha, Dhaka 2. Mr. Abul Khair, Sr., Trainer, Gana Unnayan Shangstha, Dhaka 3. Md. Zakir Hussain, Manager (MIS), Gana Unnayan Shangstha, Dhaka 4. Ms. Mahmood Ara Begum, Trainer, Gana Unnayan Shangstha, Dhaka 5. Ms. Hasina Begum, Trainer, Gana Unnayan Shangstha, Dhaka 6. Mr. Mozammel Hossain, Monitoring Officer, Gana Unnayan Shangstha, Dhaka 7. Mr. Mozammel Hoq. Mozumder, Monitoring Officer, Gana Unnayan Shangstha, Dhaka 8. Ms. Sayema Haque, Training Consultant, Gana Unnayan Shangstha, Dhaka 9. Ms. Hasina Begum, Monitoring Officer, Gana Unnayan Shangstha, Dhaka 10. Mr. Shushanta Kumar Chakraborti, Trainer, Gana Unnayan Shangstha, Dhaka 11. Mr. Tosaddaque Hossain, Trainer, Gana Unnayan Shangstha, Dhaka 12. Mr. Tosaddaque Hossain, Field Service Member, Gana Unnayan Shangstha, Dhaka 13. Mr. Aris Hossain, Trainer, Gana Unnayan Shangstha, Dhaka 14. Ms. Tahsin Akhter, Trainer, Gana Unnayan Shangstha, Dhaka
NIPORT 1. Dr. Wahab Howladar, DD (Clinical Training), NIPORT, Dhaka 2. Md. Mahfuzur Rahman, Instructor, NIPORT, Dhaka. 3. Mr. Biswajit Baishya, Instructor, NIPORT, Dhaka 4. Mr. G N A Rashid, Sr., Instructor, NIPORT, Dhaka
PSTC 1. Dr. Mokammel Hasan, Associate Editor, Projonmo, PSTC, Dhaka
JICA 1. Mr. Golam Mustafa, National Consultant for Evaluation, JICA, TTU, DGHS, Mohakhali, Dhaka
1212

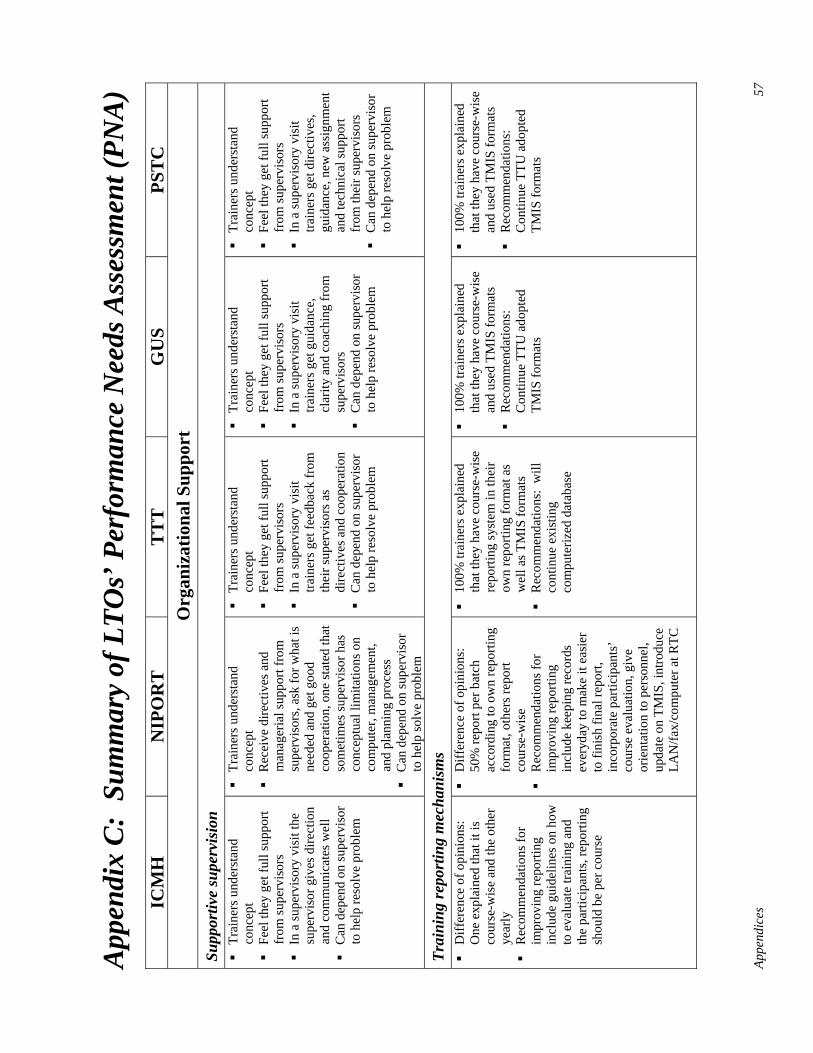
Appe
ndic
es
57
App
endi
x C
: Su
mm
ary
of L
TOs’
Per
form
ance
Nee
ds A
sses
smen
t (PN
A)
ICM
H
NIP
OR
T
TT
T
GU
S PS
TC
O
rgan
izat
iona
l Sup
port
Su
ppor
tive
supe
rvis
ion
Tr
aine
rs u
nder
stan
d co
ncep
t
Feel
they
get
full
supp
ort
from
supe
rvis
ors
In
a su
perv
isor
y vi
sit t
he
supe
rvis
or g
ives
dire
ctio
n an
d co
mm
unic
ates
wel
l
Can
dep
end
on su
perv
isor
to
hel
p re
solv
e pr
oble
m
Tr
aine
rs u
nder
stan
d co
ncep
t
Rec
eive
dire
ctiv
es a
nd
man
ager
ial s
uppo
rt fr
om
supe
rvis
ors,
ask
for w
hat i
s ne
eded
and
get
goo
d co
oper
atio
n, o
ne st
ated
that
so
met
imes
supe
rvis
or h
as
conc
eptu
al li
mita
tions
on
com
pute
r, m
anag
emen
t, an
d pl
anni
ng p
roce
ss
C
an d
epen
d on
supe
rvis
or
to h
elp
solv
e pr
oble
m
Tr
aine
rs u
nder
stan
d co
ncep
t
Feel
they
get
full
supp
ort
from
supe
rvis
ors
In
a su
perv
isor
y vi
sit
train
ers g
et fe
edba
ck fr
om
thei
r sup
ervi
sors
as
dire
ctiv
es a
nd c
oope
ratio
n
Can
dep
end
on su
perv
isor
to
hel
p re
solv
e pr
oble
m
Tr
aine
rs u
nder
stan
d co
ncep
t
Feel
they
get
full
supp
ort
from
supe
rvis
ors
In
a su
perv
isor
y vi
sit
train
ers g
et g
uida
nce,
cl
arity
and
coa
chin
g fr
om
supe
rvis
ors
C
an d
epen
d on
supe
rvis
or
to h
elp
reso
lve
prob
lem
Tr
aine
rs u
nder
stan
d co
ncep
t
Feel
they
get
full
supp
ort
from
supe
rvis
ors
In
a su
perv
isor
y vi
sit
train
ers g
et d
irect
ives
, gu
idan
ce, n
ew a
ssig
nmen
t an
d te
chni
cal s
uppo
rt fr
om th
eir s
uper
viso
rs
C
an d
epen
d on
supe
rvis
or
to h
elp
reso
lve
prob
lem
Trai
ning
repo
rtin
g m
echa
nism
s
Diff
eren
ce o
f opi
nion
s:
One
exp
lain
ed th
at it
is
cour
se-w
ise
and
the
othe
r ye
arly
Rec
omm
enda
tions
for
impr
ovin
g re
porti
ng
incl
ude
guid
elin
es o
n ho
w
to e
valu
ate
train
ing
and
the
parti
cipa
nts,
repo
rting
sh
ould
be
per c
ours
e
D
iffer
ence
of o
pini
ons:
50
% re
port
per b
atch
ac
cord
ing
to o
wn
repo
rting
fo
rmat
, oth
ers r
epor
t co
urse
-wis
e
Rec
omm
enda
tions
for
impr
ovin
g re
porti
ng
incl
ude
keep
ing
reco
rds
ever
yday
to m
ake
it ea
sier
to
fini
sh fi
nal r
epor
t, in
corp
orat
e pa
rtici
pant
s’
cour
se e
valu
atio
n, g
ive
orie
ntat
ion
to p
erso
nnel
, up
date
on
TMIS
, int
rodu
ce
LAN
/fax/
com
pute
r at R
TC
10
0% tr
aine
rs e
xpla
ined
th
at th
ey h
ave
cour
se-w
ise
repo
rting
syst
em in
thei
r ow
n re
porti
ng fo
rmat
as
wel
l as T
MIS
form
ats
R
ecom
men
datio
ns:
will
co
ntin
ue e
xist
ing
com
pute
rized
dat
abas
e
10
0% tr
aine
rs e
xpla
ined
th
at th
ey h
ave
cour
se-w
ise
and
used
TM
IS fo
rmat
s
Rec
omm
enda
tions
: C
ontin
ue T
TU a
dopt
ed
TMIS
form
ats
10
0% tr
aine
rs e
xpla
ined
th
at th
ey h
ave
cour
se-w
ise
and
used
TM
IS fo
rmat
s
Rec
omm
enda
tions
: C
ontin
ue T
TU a
dopt
ed
TMIS
form
ats
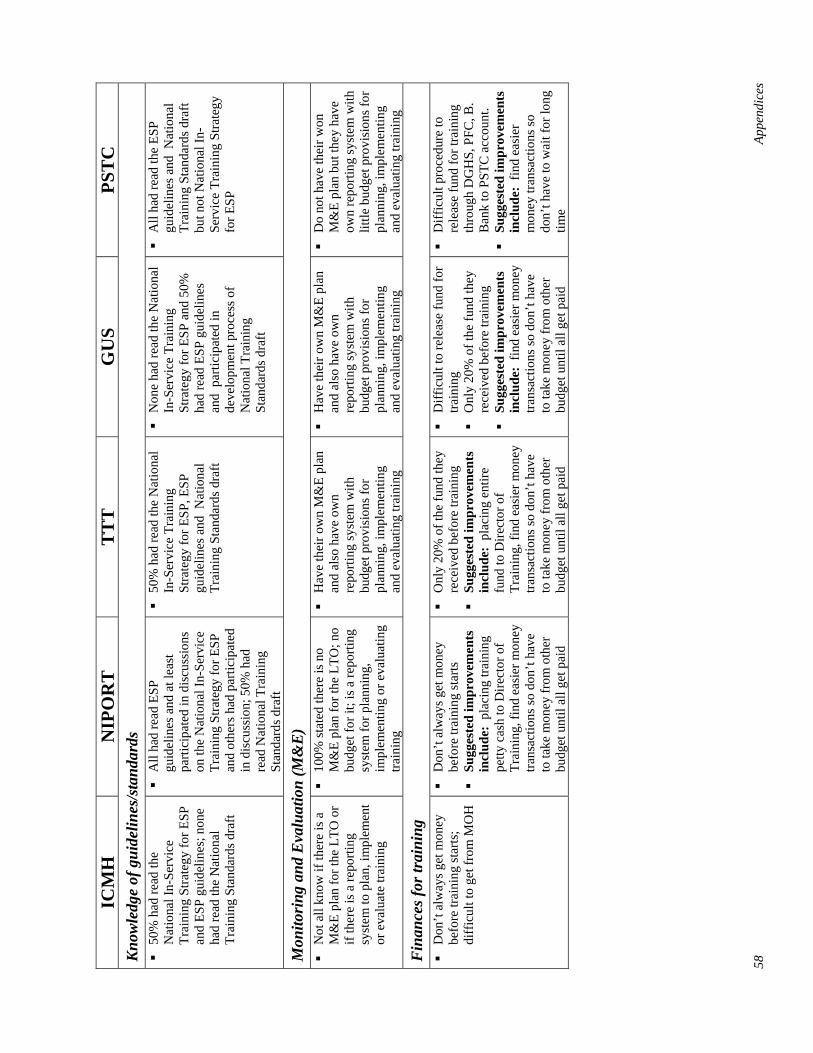
58
Appe
ndic
es
ICM
H
NIP
OR
T
TT
T
GU
S PS
TC
K
now
ledg
e of
gui
delin
es/s
tand
ards
50%
had
read
the
Nat
iona
l In-
Serv
ice
Trai
ning
Stra
tegy
for E
SP
and
ESP
guid
elin
es; n
one
had
read
the
Nat
iona
l Tr
aini
ng S
tand
ards
dra
ft
A
ll ha
d re
ad E
SP
guid
elin
es a
nd a
t lea
st
parti
cipa
ted
in d
iscu
ssio
ns
on th
e N
atio
nal I
n-Se
rvic
e Tr
aini
ng S
trate
gy fo
r ESP
an
d ot
hers
had
par
ticip
ated
in
dis
cuss
ion;
50%
had
re
ad N
atio
nal T
rain
ing
Stan
dard
s dra
ft
50
% h
ad re
ad th
e N
atio
nal
In-S
ervi
ce T
rain
ing
Stra
tegy
for E
SP, E
SP
guid
elin
es a
nd N
atio
nal
Trai
ning
Sta
ndar
ds d
raft
N
one
had
read
the
Nat
iona
l In
-Ser
vice
Tra
inin
g St
rate
gy fo
r ESP
and
50%
ha
d re
ad E
SP g
uide
lines
an
d p
artic
ipat
ed in
de
velo
pmen
t pro
cess
of
Nat
iona
l Tra
inin
g St
anda
rds d
raft
A
ll ha
d re
ad th
e ES
P gu
idel
ines
and
Nat
iona
l Tr
aini
ng S
tand
ards
dra
ft bu
t not
Nat
iona
l In-
Serv
ice
Trai
ning
Stra
tegy
fo
r ESP
Mon
itori
ng a
nd E
valu
atio
n (M
&E
)
Not
all
know
if th
ere
is a
M
&E
plan
for t
he L
TO o
r if
ther
e is
a re
porti
ng
syst
em to
pla
n, im
plem
ent
or e
valu
ate
train
ing
10
0% st
ated
ther
e is
no
M&
E pl
an fo
r the
LTO
; no
budg
et fo
r it;
is a
repo
rting
sy
stem
for p
lann
ing,
im
plem
entin
g or
eva
luat
ing
train
ing
H
ave
thei
r ow
n M
&E
plan
an
d al
so h
ave
own
repo
rting
syst
em w
ith
budg
et p
rovi
sion
s for
pl
anni
ng, i
mpl
emen
ting
and
eval
uatin
g tra
inin
g
H
ave
thei
r ow
n M
&E
plan
an
d al
so h
ave
own
repo
rting
syst
em w
ith
budg
et p
rovi
sion
s for
pl
anni
ng, i
mpl
emen
ting
and
eval
uatin
g tra
inin
g
D
o no
t hav
e th
eir w
on
M&
E pl
an b
ut th
ey h
ave
own
repo
rting
syst
em w
ith
little
bud
get p
rovi
sion
s for
pl
anni
ng, i
mpl
emen
ting
and
eval
uatin
g tra
inin
g
Fin
ance
s for
trai
ning
Don
’t al
way
s get
mon
ey
befo
re tr
aini
ng st
arts
; di
ffic
ult t
o ge
t fro
m M
OH
D
on’t
alw
ays g
et m
oney
be
fore
trai
ning
star
ts
Su
gges
ted
impr
ovem
ents
in
clud
e: p
laci
ng tr
aini
ng
petty
cas
h to
Dire
ctor
of
Trai
ning
, fin
d ea
sier
mon
ey
trans
actio
ns so
don
’t ha
ve
to ta
ke m
oney
from
oth
er
budg
et u
ntil
all g
et p
aid
O
nly
20%
of t
he fu
nd th
ey
rece
ived
bef
ore
train
ing
Su
gges
ted
impr
ovem
ents
in
clud
e: p
laci
ng e
ntire
fu
nd to
Dire
ctor
of
Trai
ning
, fin
d ea
sier
mon
ey
trans
actio
ns so
don
’t ha
ve
to ta
ke m
oney
from
oth
er
budg
et u
ntil
all g
et p
aid
D
iffic
ult t
o re
leas
e fu
nd fo
r tra
inin
g
Onl
y 20
% o
f the
fund
they
re
ceiv
ed b
efor
e tra
inin
g
Sugg
este
d im
prov
emen
ts
incl
ude:
fin
d ea
sier
mon
ey
trans
actio
ns so
don
’t ha
ve
to ta
ke m
oney
from
oth
er
budg
et u
ntil
all g
et p
aid
D
iffic
ult p
roce
dure
to
rele
ase
fund
for t
rain
ing
thro
ugh
DG
HS,
PFC
, B.
Ban
k to
PST
C a
ccou
nt.
Su
gges
ted
impr
ovem
ents
in
clud
e: f
ind
easi
er
mon
ey tr
ansa
ctio
ns so
do
n’t h
ave
to w
ait f
or lo
ng
time
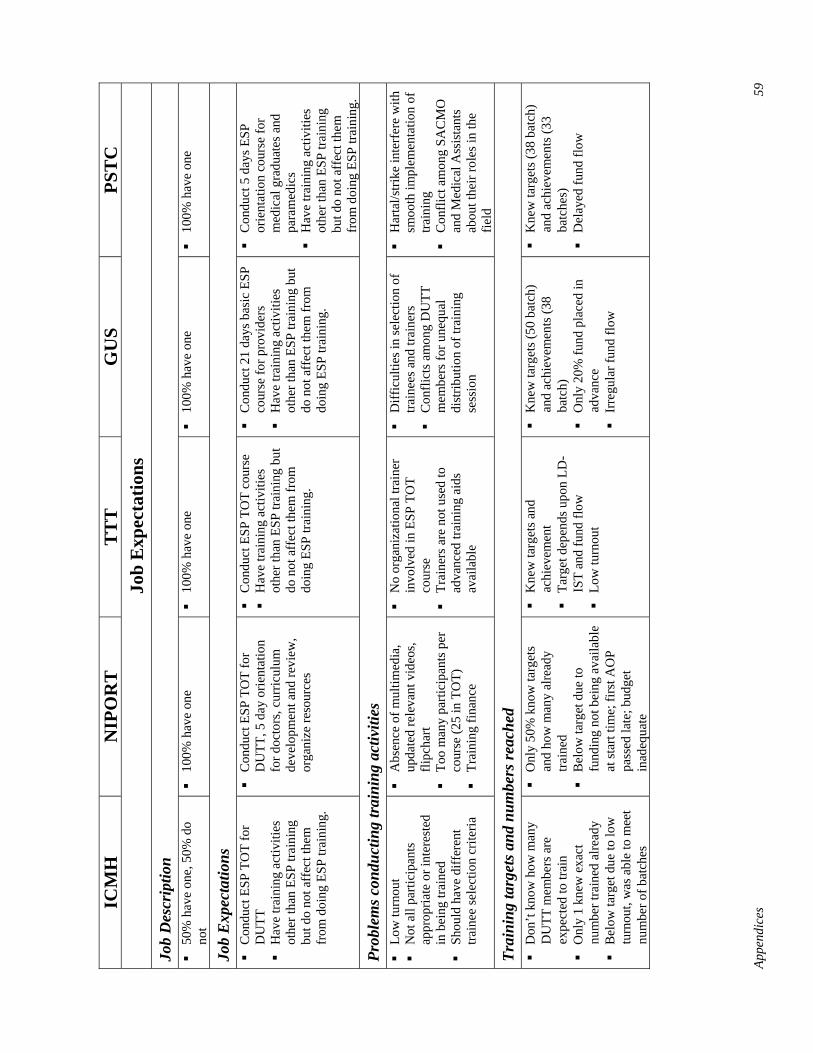
Appe
ndic
es
59
ICM
H
NIP
OR
T
TT
T
GU
S PS
TC
Jo
b E
xpec
tatio
ns
Job
Des
crip
tion
50
% h
ave
one,
50%
do
not
10
0% h
ave
one
10
0% h
ave
one
10
0% h
ave
one
10
0% h
ave
one
Job
Exp
ecta
tions
Con
duct
ESP
TO
T fo
r D
UTT
Hav
e tra
inin
g ac
tiviti
es
othe
r tha
n ES
P tra
inin
g bu
t do
not a
ffec
t the
m
from
doi
ng E
SP tr
aini
ng.
C
ondu
ct E
SP T
OT
for
DU
TT, 5
day
orie
ntat
ion
for d
octo
rs, c
urric
ulum
de
velo
pmen
t and
revi
ew,
orga
nize
reso
urce
s
C
ondu
ct E
SP T
OT
cour
se
H
ave
train
ing
activ
ities
ot
her t
han
ESP
train
ing
but
do n
ot a
ffec
t the
m fr
om
doin
g ES
P tra
inin
g.
C
ondu
ct 2
1 da
ys b
asic
ESP
co
urse
for p
rovi
ders
Hav
e tra
inin
g ac
tiviti
es
othe
r tha
n ES
P tra
inin
g bu
t do
not
aff
ect t
hem
from
do
ing
ESP
train
ing.
C
ondu
ct 5
day
s ESP
or
ient
atio
n co
urse
for
med
ical
gra
duat
es a
nd
para
med
ics
H
ave
train
ing
activ
ities
ot
her t
han
ESP
train
ing
but d
o no
t aff
ect t
hem
fr
om d
oing
ESP
trai
ning
.
Prob
lem
s con
duct
ing
trai
ning
act
iviti
es
Lo
w tu
rnou
t
Not
all
parti
cipa
nts
appr
opria
te o
r int
eres
ted
in b
eing
trai
ned
Sh
ould
hav
e di
ffer
ent
train
ee se
lect
ion
crite
ria
A
bsen
ce o
f mul
timed
ia,
upda
ted
rele
vant
vid
eos,
flipc
hart
To
o m
any
parti
cipa
nts p
er
cour
se (2
5 in
TO
T)
Tr
aini
ng fi
nanc
e
N
o or
gani
zatio
nal t
rain
er
invo
lved
in E
SP T
OT
cour
se
Tr
aine
rs a
re n
ot u
sed
to
adva
nced
trai
ning
aid
s av
aila
ble
D
iffic
ultie
s in
sele
ctio
n of
tra
inee
s and
trai
ners
Con
flict
s am
ong
DU
TT
mem
bers
for u
nequ
al
dist
ribut
ion
of tr
aini
ng
sess
ion
H
arta
l/stri
ke in
terf
ere
with
sm
ooth
impl
emen
tatio
n of
tra
inin
g
Con
flict
am
ong
SAC
MO
an
d M
edic
al A
ssis
tant
s ab
out t
heir
role
s in
the
field
Trai
ning
targ
ets a
nd n
umbe
rs re
ache
d
Don
’t kn
ow h
ow m
any
DU
TT m
embe
rs a
re
expe
cted
to tr
ain
O
nly
1 kn
ew e
xact
nu
mbe
r tra
ined
alre
ady
B
elow
targ
et d
ue to
low
tu
rnou
t, w
as a
ble
to m
eet
num
ber o
f bat
ches
O
nly
50%
kno
w ta
rget
s an
d ho
w m
any
alre
ady
train
ed
B
elow
targ
et d
ue to
fu
ndin
g no
t bei
ng a
vaila
ble
at st
art t
ime;
firs
t AO
P pa
ssed
late
; bud
get
inad
equa
te
K
new
targ
ets a
nd
achi
evem
ent
Ta
rget
dep
ends
upo
n LD
-IS
T an
d fu
nd fl
ow
Lo
w tu
rnou
t
K
new
targ
ets (
50 b
atch
) an
d ac
hiev
emen
ts (3
8 ba
tch)
Onl
y 20
% fu
nd p
lace
d in
ad
vanc
e
Irre
gula
r fun
d flo
w
K
new
targ
ets (
38 b
atch
) an
d ac
hiev
emen
ts (3
3 ba
tche
s)
D
elay
ed fu
nd fl
ow
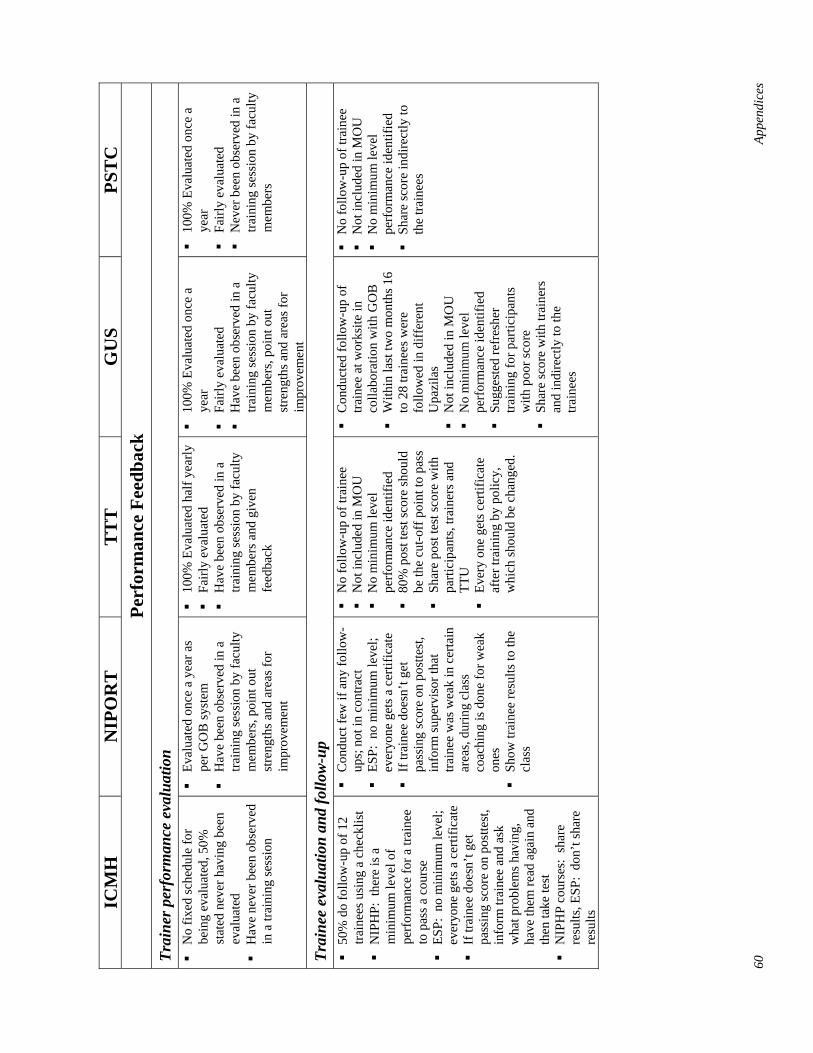
60
Appe
ndic
es
ICM
H
NIP
OR
T
TT
T
GU
S PS
TC
Pe
rfor
man
ce F
eedb
ack
Trai
ner p
erfo
rman
ce e
valu
atio
n
No
fixed
sche
dule
for
bein
g ev
alua
ted,
50%
st
ated
nev
er h
avin
g be
en
eval
uate
d
Hav
e ne
ver b
een
obse
rved
in
a tr
aini
ng se
ssio
n
Ev
alua
ted
once
a y
ear a
s pe
r GO
B sy
stem
Hav
e be
en o
bser
ved
in a
tra
inin
g se
ssio
n by
facu
lty
mem
bers
, poi
nt o
ut
stre
ngth
s and
are
as fo
r im
prov
emen
t
10
0% E
valu
ated
hal
f yea
rly
Fa
irly
eval
uate
d
Hav
e be
en o
bser
ved
in a
tra
inin
g se
ssio
n by
facu
lty
mem
bers
and
giv
en
feed
back
10
0% E
valu
ated
onc
e a
year
Fairl
y ev
alua
ted
H
ave
been
obs
erve
d in
a
train
ing
sess
ion
by fa
culty
m
embe
rs, p
oint
out
st
reng
ths a
nd a
reas
for
impr
ovem
ent
10
0% E
valu
ated
onc
e a
year
Fairl
y ev
alua
ted
N
ever
bee
n ob
serv
ed in
a
train
ing
sess
ion
by fa
culty
m
embe
rs
Trai
nee
eval
uatio
n an
d fo
llow
-up
50
% d
o fo
llow
-up
of 1
2 tra
inee
s usi
ng a
che
cklis
t
NIP
HP:
the
re is
a
min
imum
leve
l of
perf
orm
ance
for a
trai
nee
to p
ass a
cou
rse
ES
P: n
o m
inim
um le
vel;
ever
yone
get
s a c
ertif
icat
e
If tr
aine
e do
esn’
t get
pa
ssin
g sc
ore
on p
ostte
st,
info
rm tr
aine
e an
d as
k w
hat p
robl
ems h
avin
g,
have
them
read
aga
in a
nd
then
take
test
NIP
HP
cour
ses:
sha
re
resu
lts, E
SP:
don’
t sha
re
resu
lts
C
ondu
ct fe
w if
any
follo
w-
ups;
not
in c
ontra
ct
ES
P: n
o m
inim
um le
vel;
ever
yone
get
s a c
ertif
icat
e
If tr
aine
e do
esn’
t get
pa
ssin
g sc
ore
on p
ostte
st,
info
rm su
perv
isor
that
tra
inee
was
wea
k in
cer
tain
ar
eas,
durin
g cl
ass
coac
hing
is d
one
for w
eak
ones
Show
trai
nee
resu
lts to
the
clas
s
N
o fo
llow
-up
of tr
aine
e
Not
incl
uded
in M
OU
No
min
imum
leve
l pe
rfor
man
ce id
entif
ied
80
% p
ost t
est s
core
shou
ld
be th
e cu
t-off
poi
nt to
pas
s
Shar
e po
st te
st sc
ore
with
pa
rtici
pant
s, tra
iner
s and
TT
U
Ev
ery
one
gets
cer
tific
ate
afte
r tra
inin
g by
pol
icy,
w
hich
shou
ld b
e ch
ange
d.
C
ondu
cted
follo
w-u
p of
tra
inee
at w
orks
ite in
co
llabo
ratio
n w
ith G
OB
With
in la
st tw
o m
onth
s 16
to 2
8 tra
inee
s wer
e fo
llow
ed in
diff
eren
t U
pazi
las
N
ot in
clud
ed in
MO
U
N
o m
inim
um le
vel
perf
orm
ance
iden
tifie
d
Sugg
este
d re
fres
her
train
ing
for p
artic
ipan
ts
with
poo
r sco
re
Sh
are
scor
e w
ith tr
aine
rs
and
indi
rect
ly to
the
train
ees
N
o fo
llow
-up
of tr
aine
e
Not
incl
uded
in M
OU
No
min
imum
leve
l pe
rfor
man
ce id
entif
ied
Sh
are
scor
e in
dire
ctly
to
the
train
ees
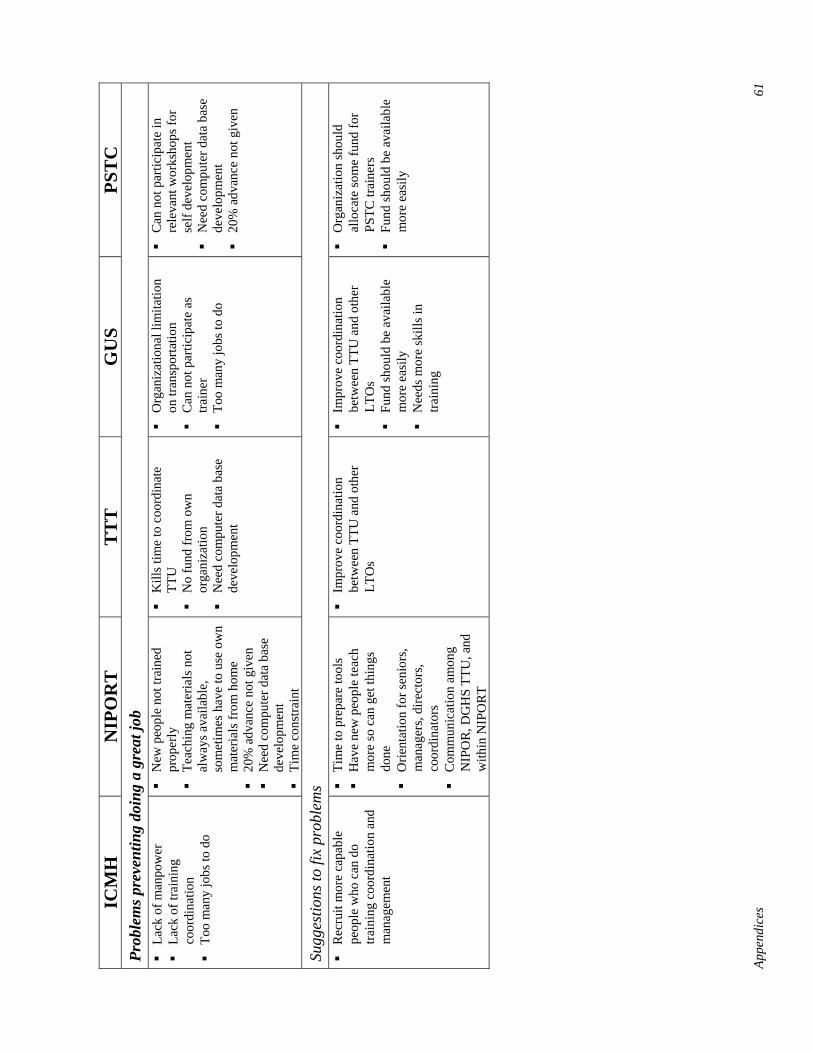
Appe
ndic
es
61
ICM
H
NIP
OR
T
TT
T
GU
S PS
TC
Pr
oble
ms p
reve
ntin
g do
ing
a gr
eat j
ob
La
ck o
f man
pow
er
La
ck o
f tra
inin
g co
ordi
natio
n
Too
man
y jo
bs to
do
N
ew p
eopl
e no
t tra
ined
pr
oper
ly
Te
achi
ng m
ater
ials
not
al
way
s ava
ilabl
e,
som
etim
es h
ave
to u
se o
wn
mat
eria
ls fr
om h
ome
20
% a
dvan
ce n
ot g
iven
Nee
d co
mpu
ter d
ata
base
de
velo
pmen
t
Tim
e co
nstra
int
K
ills t
ime
to c
oord
inat
e TT
U
N
o fu
nd fr
om o
wn
orga
niza
tion
N
eed
com
pute
r dat
a ba
se
deve
lopm
ent
O
rgan
izat
iona
l lim
itatio
n on
tran
spor
tatio
n
Can
not
par
ticip
ate
as
train
er
To
o m
any
jobs
to d
o
C
an n
ot p
artic
ipat
e in
re
leva
nt w
orks
hops
for
self
deve
lopm
ent
N
eed
com
pute
r dat
a ba
se
deve
lopm
ent
20
% a
dvan
ce n
ot g
iven
Sugg
estio
ns to
fix
prob
lem
s
Rec
ruit
mor
e ca
pabl
e pe
ople
who
can
do
train
ing
coor
dina
tion
and
man
agem
ent
Ti
me
to p
repa
re to
ols
H
ave
new
peo
ple
teac
h m
ore
so c
an g
et th
ings
do
ne
O
rient
atio
n fo
r sen
iors
, m
anag
ers,
dire
ctor
s, co
ordi
nato
rs
C
omm
unic
atio
n am
ong
NIP
OR
, DG
HS
TTU
, and
w
ithin
NIP
OR
T
Im
prov
e co
ordi
natio
n be
twee
n TT
U a
nd o
ther
LT
Os
Im
prov
e co
ordi
natio
n be
twee
n TT
U a
nd o
ther
LT
Os
Fu
nd sh
ould
be
avai
labl
e m
ore
easi
ly
N
eeds
mor
e sk
ills i
n tra
inin
g
O
rgan
izat
ion
shou
ld
allo
cate
som
e fu
nd fo
r PS
TC tr
aine
rs
Fu
nd sh
ould
be
avai
labl
e m
ore
easi
ly

62
Appe
ndic
es
ICM
H
NIP
OR
TT
TT
GU
SPS
TC
Phys
ical
Env
iron
men
t and
Too
ls
Tr
aine
rs h
ave
suff
icie
nt
supp
lies
H
ave
own
offic
e/de
sk;
lack
com
pute
r, ph
one,
fa
x, in
tern
et
R
ecei
ve st
atio
nary
su
pplie
s as n
eede
d or
ye
arly
by
subm
ittin
g an
in
dent
; get
supp
lies
imm
edia
tely
afte
r
Tr
aine
rs h
ave
suff
icie
nt
supp
lies
H
ave
own
desk
, cop
ier a
nd
fax
at h
eadq
uarte
rs
R
ecei
ve st
atio
nary
supp
lies
as n
eede
d, b
ased
on
train
ing
cour
se, r
ecei
ved
right
aw
ay, b
ased
on
inde
nt
Su
gges
tions
for
chan
ge:
desk
top
com
pute
r with
in
tern
et, w
orki
ng
phot
ocop
ier
Tr
aine
rs h
ave
suff
icie
nt
supp
lies
H
ave
own
offic
e/de
sk
com
pute
r, ph
one,
fax,
in
tern
et
R
ecei
ve st
atio
nary
supp
lies
as n
eede
d or
yea
rly b
y su
bmitt
ing
an in
dent
; get
su
pplie
s im
med
iate
ly a
fter
Su
gges
tions
for
chan
ge:
wor
king
pho
toco
pier
Tr
aine
rs h
ave
suff
icie
nt
supp
lies
H
ave
own
offic
e/de
sk ;
lack
fax
, int
erne
t
Rec
eive
stat
iona
ry su
pplie
s as
nee
ded
or y
early
by
subm
ittin
g an
inde
nt; g
et
supp
lies i
mm
edia
tely
afte
r
GU
S m
anag
e st
atio
nerie
s an
d tra
inin
g m
ater
ials
Sugg
estio
ns fo
r ch
ange
: tra
nspo
rtatio
n an
d w
orki
ng
phot
ocop
ier
Tr
aine
rs h
ave
suff
icie
nt
supp
lies
H
ave
own
offic
e/de
sk
com
pute
r, ph
one,
fax,
in
tern
et
R
ecei
ve st
atio
nary
su
pplie
s as n
eede
d or
ye
arly
by
subm
ittin
g an
in
dent
; get
supp
lies
imm
edia
tely
afte
r
PSTC
man
age
stat
ione
ries
and
train
ing
mat
eria
ls
Su
gges
tions
for
chan
ge:
trans
porta
tion
and
wor
king
pho
toco
pier
and
co
mpu
ter
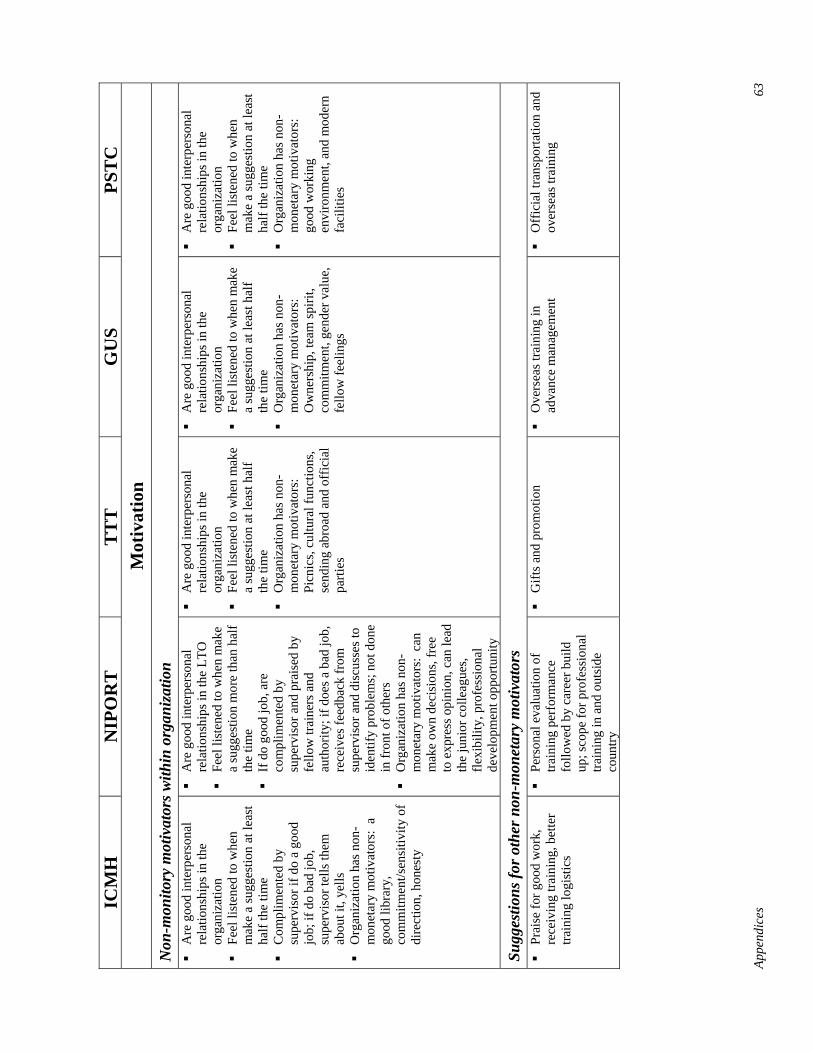
Appe
ndic
es
63
ICM
H
NIP
OR
T
TT
T
GU
S PS
TC
M
otiv
atio
n N
on-m
onito
ry m
otiv
ator
s with
in o
rgan
izat
ion
A
re g
ood
inte
rper
sona
l re
latio
nshi
ps in
the
orga
niza
tion
Fe
el li
sten
ed to
whe
n m
ake
a su
gges
tion
at le
ast
half
the
time
C
ompl
imen
ted
by
supe
rvis
or if
do
a go
od
job;
if d
o ba
d jo
b,
supe
rvis
or te
lls th
em
abou
t it,
yells
Org
aniz
atio
n ha
s non
-m
onet
ary
mot
ivat
ors:
a
good
libr
ary,
co
mm
itmen
t/sen
sitiv
ity o
f di
rect
ion,
hon
esty
A
re g
ood
inte
rper
sona
l re
latio
nshi
ps in
the
LTO
Feel
list
ened
to w
hen
mak
e a
sugg
estio
n m
ore
than
hal
f th
e tim
e
If d
o go
od jo
b, a
re
com
plim
ente
d by
su
perv
isor
and
pra
ised
by
fello
w tr
aine
rs a
nd
auth
ority
; if d
oes a
bad
job,
re
ceiv
es fe
edba
ck fr
om
supe
rvis
or a
nd d
iscu
sses
to
iden
tify
prob
lem
s; n
ot d
one
in fr
ont o
f oth
ers
O
rgan
izat
ion
has n
on-
mon
etar
y m
otiv
ator
s: c
an
mak
e ow
n de
cisi
ons,
free
to
exp
ress
opi
nion
, can
lead
th
e ju
nior
col
leag
ues,
flexi
bilit
y, p
rofe
ssio
nal
deve
lopm
ent o
ppor
tuni
ty
A
re g
ood
inte
rper
sona
l re
latio
nshi
ps in
the
orga
niza
tion
Fe
el li
sten
ed to
whe
n m
ake
a su
gges
tion
at le
ast h
alf
the
time
O
rgan
izat
ion
has n
on-
mon
etar
y m
otiv
ator
s:
Picn
ics,
cultu
ral f
unct
ions
, se
ndin
g ab
road
and
off
icia
l pa
rties
A
re g
ood
inte
rper
sona
l re
latio
nshi
ps in
the
orga
niza
tion
Fe
el li
sten
ed to
whe
n m
ake
a su
gges
tion
at le
ast h
alf
the
time
O
rgan
izat
ion
has n
on-
mon
etar
y m
otiv
ator
s:
Ow
ners
hip,
team
spiri
t, co
mm
itmen
t, ge
nder
val
ue,
fello
w fe
elin
gs
A
re g
ood
inte
rper
sona
l re
latio
nshi
ps in
the
orga
niza
tion
Fe
el li
sten
ed to
whe
n m
ake
a su
gges
tion
at le
ast
half
the
time
O
rgan
izat
ion
has n
on-
mon
etar
y m
otiv
ator
s:
good
wor
king
en
viro
nmen
t, an
d m
oder
n fa
cilit
ies
Sugg
estio
ns fo
r oth
er n
on-m
onet
ary
mot
ivat
ors
Pr
aise
for g
ood
wor
k,
rece
ivin
g tra
inin
g, b
ette
r tra
inin
g lo
gist
ics
Pe
rson
al e
valu
atio
n of
tra
inin
g pe
rfor
man
ce
follo
wed
by
care
er b
uild
up
; sco
pe fo
r pro
fess
iona
l tra
inin
g in
and
out
side
co
untry
G
ifts a
nd p
rom
otio
n
Ove
rsea
s tra
inin
g in
ad
vanc
e m
anag
emen
t
Off
icia
l tra
nspo
rtatio
n an
d ov
erse
as tr
aini
ng
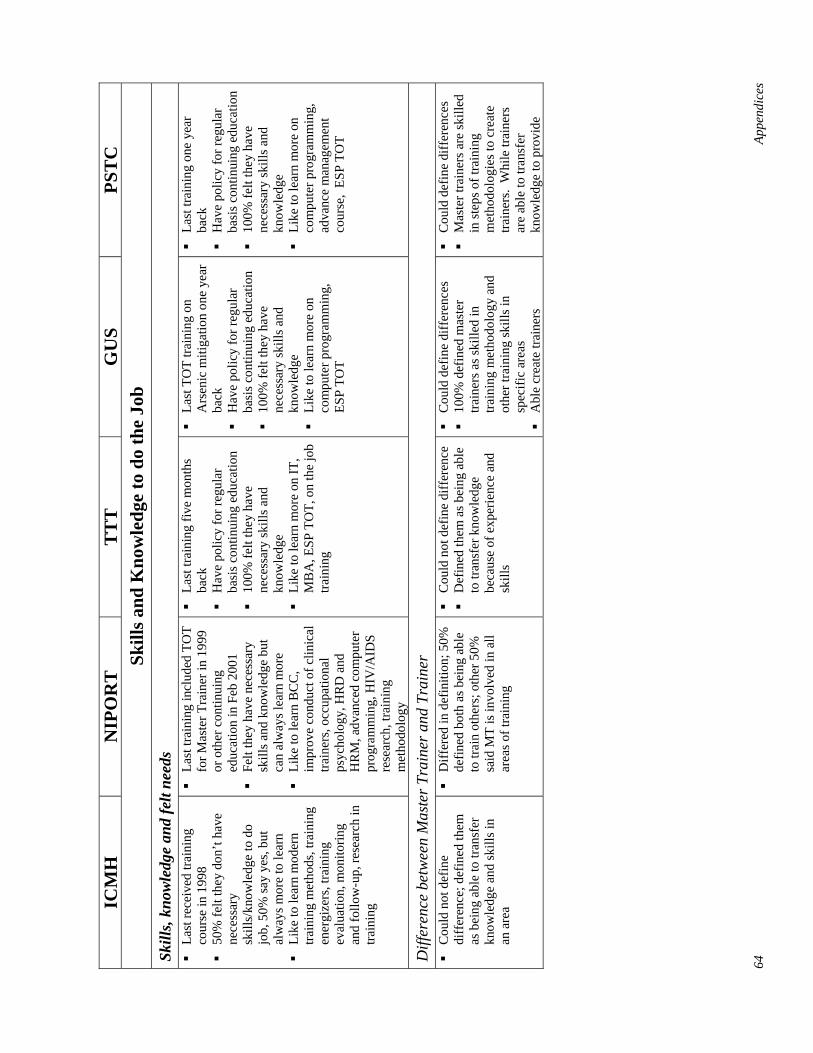
64
Appe
ndic
es
ICM
H
NIP
OR
T
TT
T
GU
S PS
TC
Sk
ills a
nd K
now
ledg
e to
do
the
Job
Skill
s, kn
owle
dge
and
felt
need
s
Last
rece
ived
trai
ning
co
urse
in 1
998
50
% fe
lt th
ey d
on’t
have
ne
cess
ary
skill
s/kn
owle
dge
to d
o jo
b, 5
0% sa
y ye
s, bu
t al
way
s mor
e to
lear
n
Like
to le
arn
mod
ern
train
ing
met
hods
, tra
inin
g en
ergi
zers
, tra
inin
g ev
alua
tion,
mon
itorin
g an
d fo
llow
-up,
rese
arch
in
train
ing
La
st tr
aini
ng in
clud
ed T
OT
for M
aste
r Tra
iner
in 1
999
or o
ther
con
tinui
ng
educ
atio
n in
Feb
200
1
Felt
they
hav
e ne
cess
ary
skill
s and
kno
wle
dge
but
can
alw
ays l
earn
mor
e
Like
to le
arn
BC
C,
impr
ove
cond
uct o
f clin
ical
tra
iner
s, oc
cupa
tiona
l ps
ycho
logy
, HR
D a
nd
HR
M, a
dvan
ced
com
pute
r pr
ogra
mm
ing,
HIV
/AID
S re
sear
ch, t
rain
ing
met
hodo
logy
La
st tr
aini
ng fi
ve m
onth
s ba
ck
H
ave
polic
y fo
r reg
ular
ba
sis c
ontin
uing
edu
catio
n
100%
felt
they
hav
e ne
cess
ary
skill
s and
kn
owle
dge
Li
ke to
lear
n m
ore
on IT
, M
BA
, ESP
TO
T, o
n th
e jo
b tra
inin
g
La
st T
OT
train
ing
on
Ars
enic
miti
gatio
n on
e ye
ar
back
Hav
e po
licy
for r
egul
ar
basi
s con
tinui
ng e
duca
tion
10
0% fe
lt th
ey h
ave
nece
ssar
y sk
ills a
nd
know
ledg
e
Like
to le
arn
mor
e on
co
mpu
ter p
rogr
amm
ing,
ES
P TO
T
La
st tr
aini
ng o
ne y
ear
back
Hav
e po
licy
for r
egul
ar
basi
s con
tinui
ng e
duca
tion
10
0% fe
lt th
ey h
ave
nece
ssar
y sk
ills a
nd
know
ledg
e
Like
to le
arn
mor
e on
co
mpu
ter p
rogr
amm
ing,
ad
vanc
e m
anag
emen
t co
urse
, ES
P TO
T
Diff
eren
ce b
etw
een
Mas
ter T
rain
er a
nd T
rain
er
C
ould
not
def
ine
diff
eren
ce; d
efin
ed th
em
as b
eing
abl
e to
tran
sfer
kn
owle
dge
and
skill
s in
an a
rea
D
iffer
ed in
def
initi
on; 5
0%
defin
ed b
oth
as b
eing
abl
e to
trai
n ot
hers
; oth
er 5
0%
said
MT
is in
volv
ed in
all
area
s of t
rain
ing
C
ould
not
def
ine
diff
eren
ce
D
efin
ed th
em a
s bei
ng a
ble
to tr
ansf
er k
now
ledg
e be
caus
e of
exp
erie
nce
and
skill
s
C
ould
def
ine
diff
eren
ces
10
0% d
efin
ed m
aste
r tra
iner
s as s
kille
d in
tra
inin
g m
etho
dolo
gy a
nd
othe
r tra
inin
g sk
ills i
n sp
ecifi
c ar
eas
A
ble
crea
te tr
aine
rs
C
ould
def
ine
diff
eren
ces
M
aste
r tra
iner
s are
skill
ed
in st
eps o
f tra
inin
g m
etho
dolo
gies
to c
reat
e tra
iner
s. W
hile
trai
ners
ar
e ab
le to
tran
sfer
kn
owle
dge
to p
rovi
de
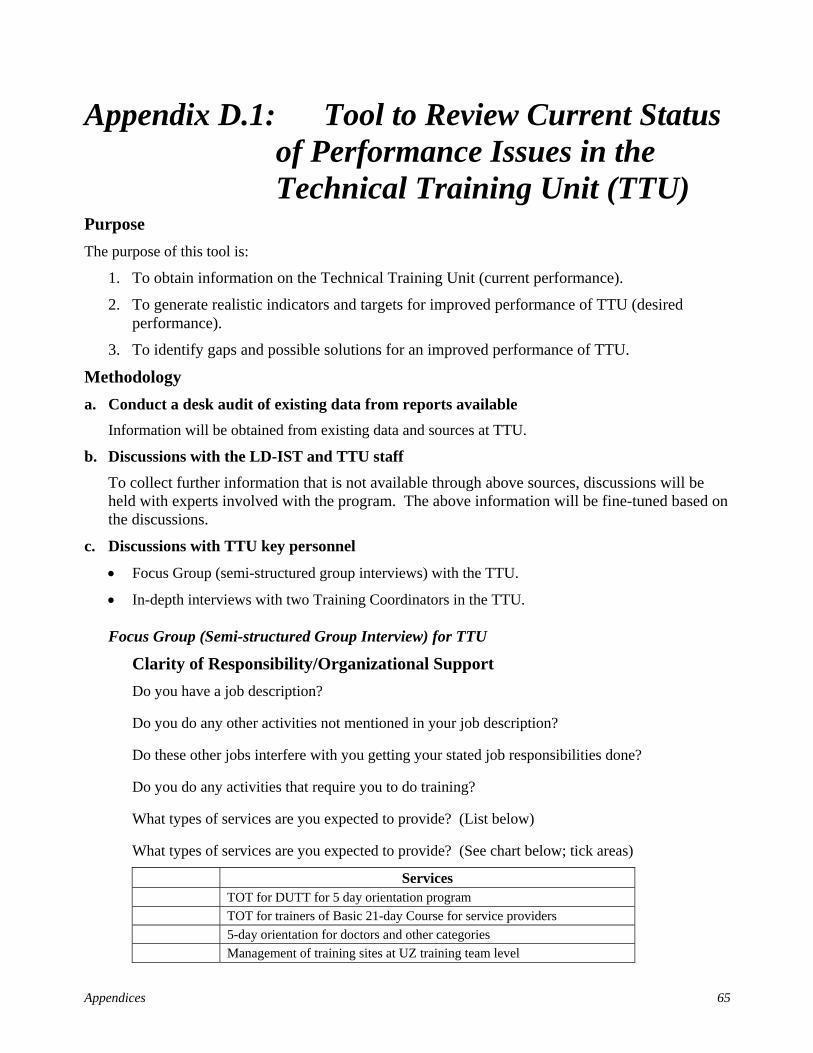
Appendices 65
Appendix D.1: Tool to Review Current Status of Performance Issues in the Technical Training Unit (TTU)
Purpose The purpose of this tool is:
1. To obtain information on the Technical Training Unit (current performance).
2. To generate realistic indicators and targets for improved performance of TTU (desired performance).
3. To identify gaps and possible solutions for an improved performance of TTU.
Methodology a. Conduct a desk audit of existing data from reports available
Information will be obtained from existing data and sources at TTU.
b. Discussions with the LD-IST and TTU staff To collect further information that is not available through above sources, discussions will be held with experts involved with the program. The above information will be fine-tuned based on the discussions.
c. Discussions with TTU key personnel
• Focus Group (semi-structured group interviews) with the TTU.
• In-depth interviews with two Training Coordinators in the TTU.
Focus Group (Semi-structured Group Interview) for TTU
Clarity of Responsibility/Organizational Support Do you have a job description?
Do you do any other activities not mentioned in your job description?
Do these other jobs interfere with you getting your stated job responsibilities done?
Do you do any activities that require you to do training?
What types of services are you expected to provide? (List below)
What types of services are you expected to provide? (See chart below; tick areas)
Services TOT for DUTT for 5 day orientation program TOT for trainers of Basic 21-day Course for service providers 5-day orientation for doctors and other categories Management of training sites at UZ training team level
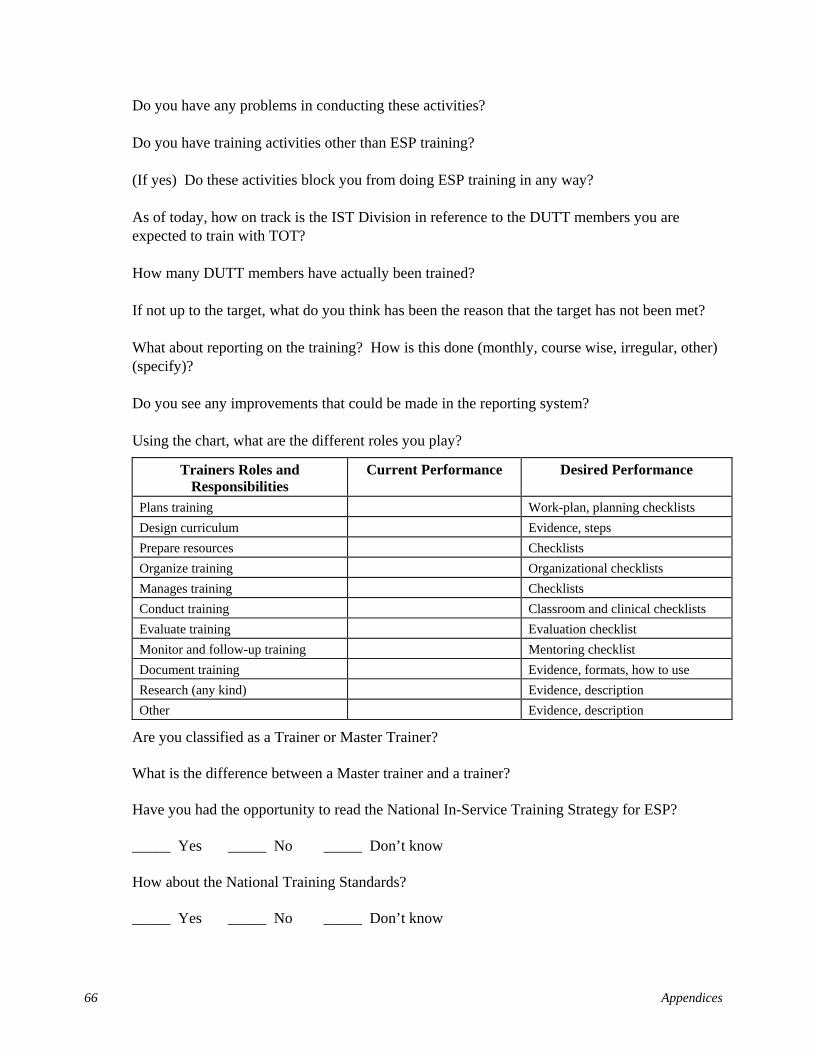
66 Appendices
Do you have any problems in conducting these activities?
Do you have training activities other than ESP training?
(If yes) Do these activities block you from doing ESP training in any way?
As of today, how on track is the IST Division in reference to the DUTT members you are expected to train with TOT?
How many DUTT members have actually been trained?
If not up to the target, what do you think has been the reason that the target has not been met?
What about reporting on the training? How is this done (monthly, course wise, irregular, other) (specify)?
Do you see any improvements that could be made in the reporting system?
Using the chart, what are the different roles you play?
Trainers Roles and Responsibilities
Current Performance Desired Performance
Plans training Work-plan, planning checklists Design curriculum Evidence, steps Prepare resources Checklists Organize training Organizational checklists Manages training Checklists Conduct training Classroom and clinical checklists Evaluate training Evaluation checklist Monitor and follow-up training Mentoring checklist Document training Evidence, formats, how to use Research (any kind) Evidence, description Other Evidence, description
Are you classified as a Trainer or Master Trainer?
What is the difference between a Master trainer and a trainer?
Have you had the opportunity to read the National In-Service Training Strategy for ESP?
_____ Yes _____ No _____ Don’t know
How about the National Training Standards?
_____ Yes _____ No _____ Don’t know
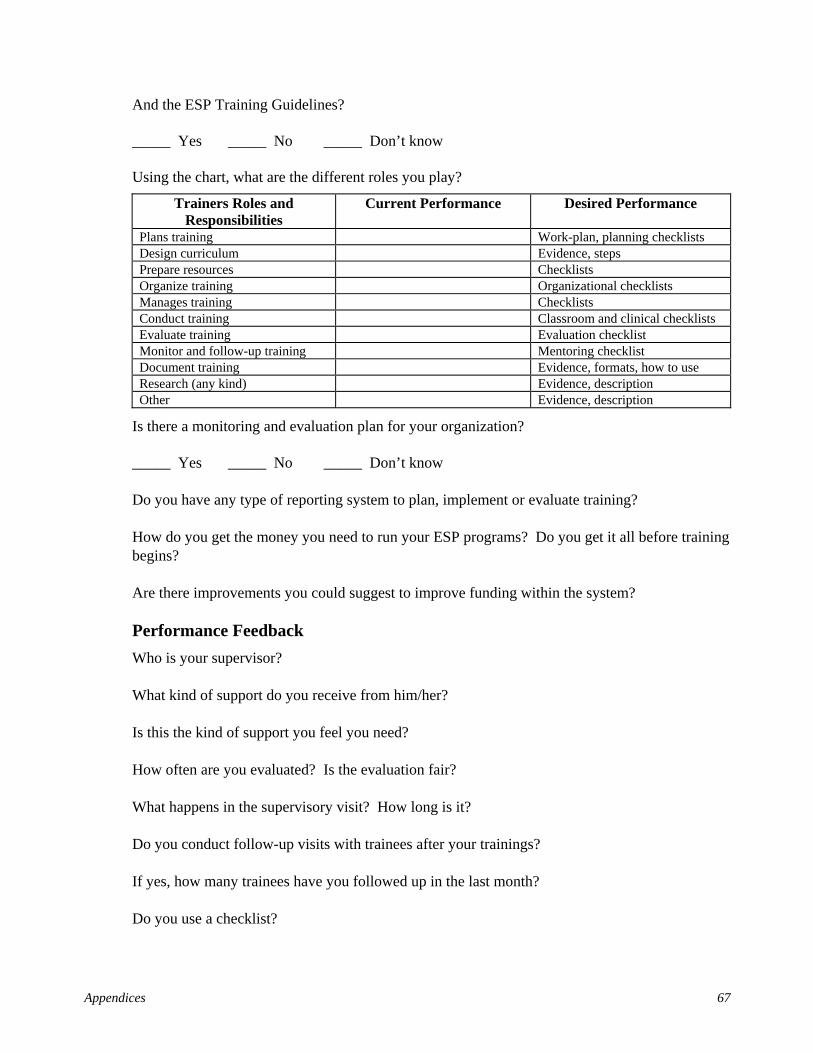
Appendices 67
And the ESP Training Guidelines?
_____ Yes _____ No _____ Don’t know
Using the chart, what are the different roles you play?
Trainers Roles and Responsibilities
Current Performance Desired Performance
Plans training Work-plan, planning checklists Design curriculum Evidence, steps Prepare resources Checklists Organize training Organizational checklists Manages training Checklists Conduct training Classroom and clinical checklists Evaluate training Evaluation checklist Monitor and follow-up training Mentoring checklist Document training Evidence, formats, how to use Research (any kind) Evidence, description Other Evidence, description
Is there a monitoring and evaluation plan for your organization?
_____ Yes _____ No _____ Don’t know
Do you have any type of reporting system to plan, implement or evaluate training?
How do you get the money you need to run your ESP programs? Do you get it all before training begins?
Are there improvements you could suggest to improve funding within the system?
Performance Feedback Who is your supervisor?
What kind of support do you receive from him/her?
Is this the kind of support you feel you need?
How often are you evaluated? Is the evaluation fair?
What happens in the supervisory visit? How long is it?
Do you conduct follow-up visits with trainees after your trainings?
If yes, how many trainees have you followed up in the last month?
Do you use a checklist?
68 Appendices
Is there a minimum level of performance required for trainees to pass a course or the clinical part?
What happens if a trainee does not get a passing score on the post-test or clinical practice checklist?
Do you share the results (good or bad) with the trainee? How is this done?
What does supportive supervision mean to you?
If you do a good job, does your boss compliment you?
What if you do a bad job?
Has anyone observed you in a training session? Do they give you feedback? Tell me about that feedback process.
If you have a problem, can you depend on your supervisor to help resolve it?
What are the main problems you feel block you from doing a great job?
What are your suggestions to fix these problems?
Are there realistic changes in policy and regulations you would recommend to help you improve performance?
Environment Do you have your own desk? Office? Computer? Copier? Fax? Internet? Telephone?
Do you have enough supplies? What is lacking?
How often do you get supplies? Do you have to order them? What is the procedure for getting supplies?
Tell me about the procedure for getting training supplies and equipment to training sites…
What would you like to see changed in your work environment (physical facilities and supplies)
Incentives, motivation
In general, do you feel there are good interpersonal relationships in your organization?
What do you think could improve relationships in your organization?
Do you feel you are heard when you make a suggestion?
What non-monetary motivators does your organization have?
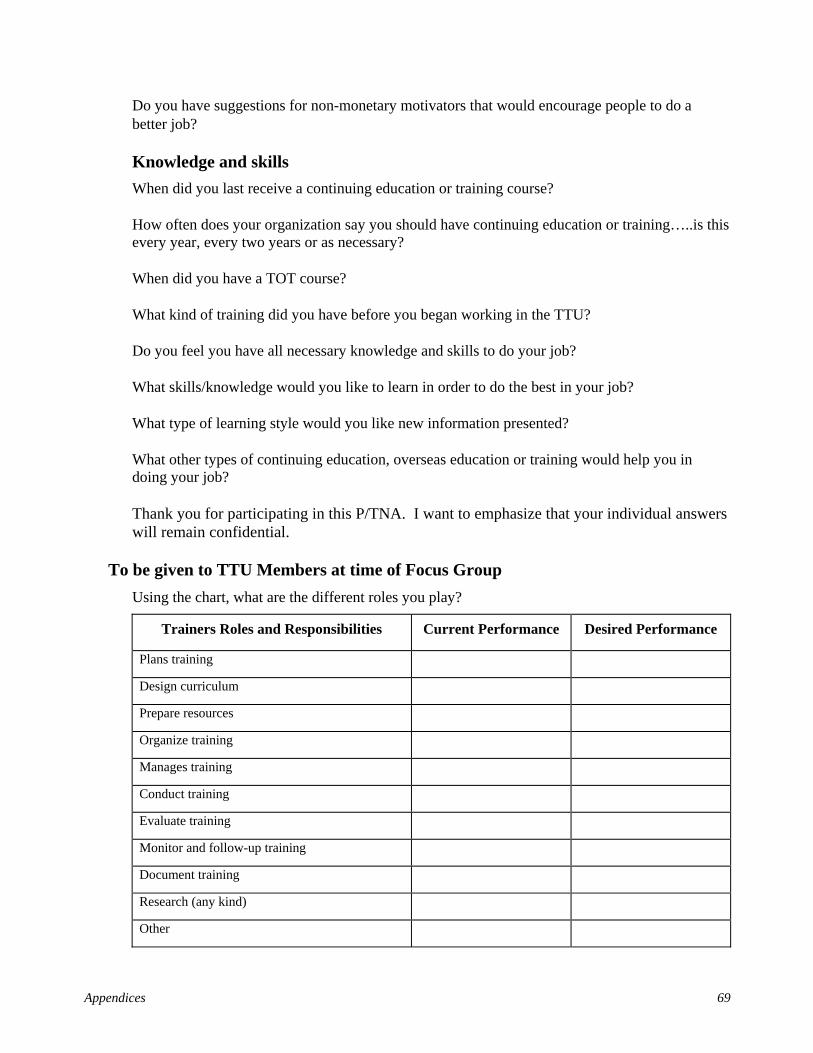
Appendices 69
Do you have suggestions for non-monetary motivators that would encourage people to do a better job?
Knowledge and skills When did you last receive a continuing education or training course?
How often does your organization say you should have continuing education or training…..is this every year, every two years or as necessary?
When did you have a TOT course?
What kind of training did you have before you began working in the TTU?
Do you feel you have all necessary knowledge and skills to do your job?
What skills/knowledge would you like to learn in order to do the best in your job?
What type of learning style would you like new information presented?
What other types of continuing education, overseas education or training would help you in doing your job?
Thank you for participating in this P/TNA. I want to emphasize that your individual answers will remain confidential.
To be given to TTU Members at time of Focus Group Using the chart, what are the different roles you play?
Trainers Roles and Responsibilities Current Performance Desired Performance
Plans training
Design curriculum
Prepare resources
Organize training
Manages training
Conduct training
Evaluate training
Monitor and follow-up training
Document training
Research (any kind)
Other

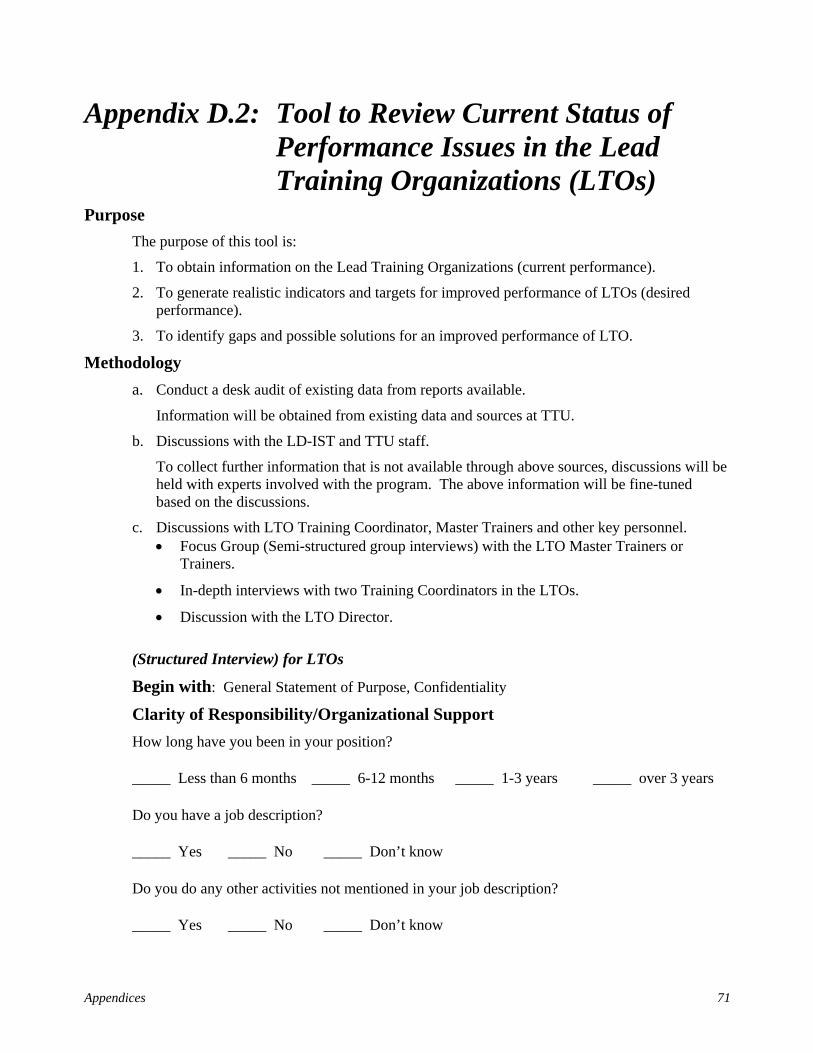
Appendices 71
Appendix D.2: Tool to Review Current Status of Performance Issues in the Lead Training Organizations (LTOs)
Purpose The purpose of this tool is:
1. To obtain information on the Lead Training Organizations (current performance).
2. To generate realistic indicators and targets for improved performance of LTOs (desired performance).
3. To identify gaps and possible solutions for an improved performance of LTO.
Methodology a. Conduct a desk audit of existing data from reports available.
Information will be obtained from existing data and sources at TTU.
b. Discussions with the LD-IST and TTU staff.
To collect further information that is not available through above sources, discussions will be held with experts involved with the program. The above information will be fine-tuned based on the discussions.
c. Discussions with LTO Training Coordinator, Master Trainers and other key personnel. • Focus Group (Semi-structured group interviews) with the LTO Master Trainers or
Trainers.
• In-depth interviews with two Training Coordinators in the LTOs.
• Discussion with the LTO Director.
(Structured Interview) for LTOs
Begin with: General Statement of Purpose, Confidentiality
Clarity of Responsibility/Organizational Support How long have you been in your position?
_____ Less than 6 months _____ 6-12 months _____ 1-3 years _____ over 3 years
Do you have a job description?
_____ Yes _____ No _____ Don’t know
Do you do any other activities not mentioned in your job description?
_____ Yes _____ No _____ Don’t know
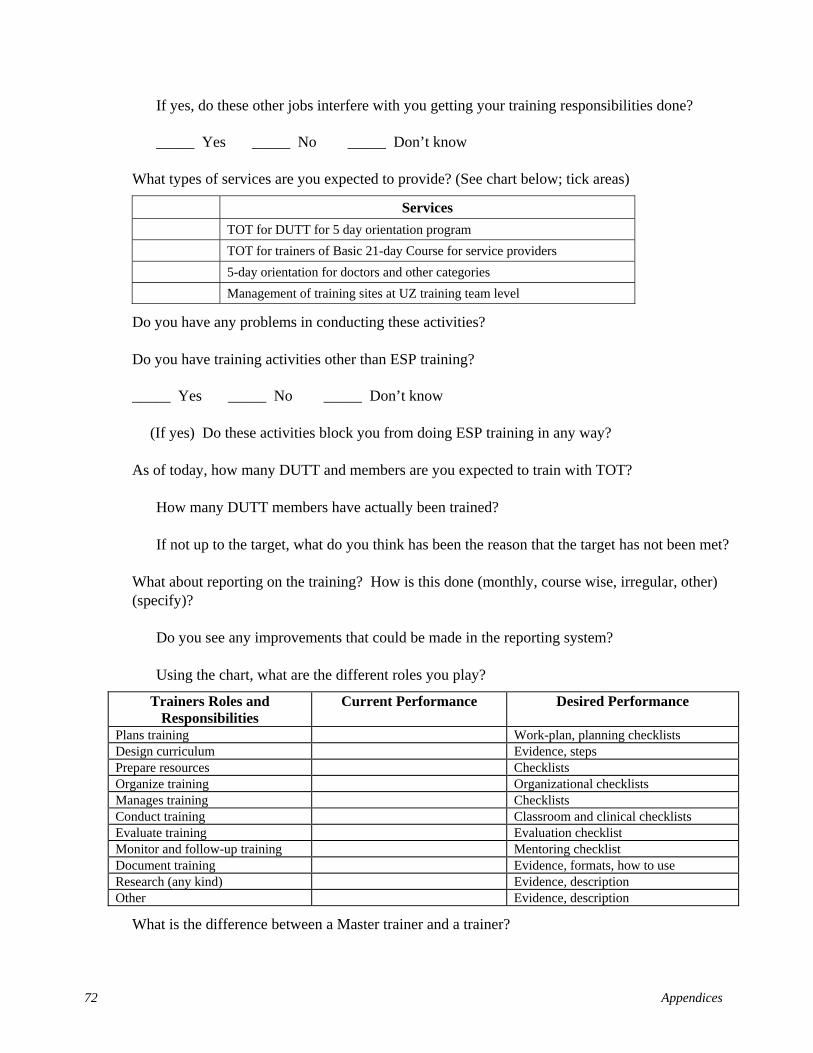
72 Appendices
If yes, do these other jobs interfere with you getting your training responsibilities done?
_____ Yes _____ No _____ Don’t know
What types of services are you expected to provide? (See chart below; tick areas)
Services TOT for DUTT for 5 day orientation program TOT for trainers of Basic 21-day Course for service providers 5-day orientation for doctors and other categories Management of training sites at UZ training team level
Do you have any problems in conducting these activities?
Do you have training activities other than ESP training?
_____ Yes _____ No _____ Don’t know
(If yes) Do these activities block you from doing ESP training in any way?
As of today, how many DUTT and members are you expected to train with TOT?
How many DUTT members have actually been trained?
If not up to the target, what do you think has been the reason that the target has not been met?
What about reporting on the training? How is this done (monthly, course wise, irregular, other) (specify)?
Do you see any improvements that could be made in the reporting system?
Using the chart, what are the different roles you play?
Trainers Roles and Responsibilities
Current Performance Desired Performance
Plans training Work-plan, planning checklists Design curriculum Evidence, steps Prepare resources Checklists Organize training Organizational checklists Manages training Checklists Conduct training Classroom and clinical checklists Evaluate training Evaluation checklist Monitor and follow-up training Mentoring checklist Document training Evidence, formats, how to use Research (any kind) Evidence, description Other Evidence, description
What is the difference between a Master trainer and a trainer?
Appendices 73
Have you had the opportunity to read the National In-Service Training Strategy for ESP?
_____ Yes _____ No _____ Don’t know
How about the ESP guidelines?
_____ Yes _____ No _____ Don’t know
How about National training standards?
_____ Yes _____ No _____ Don’t know
Is there a monitoring and evaluation plan for your organization?
_____ Yes _____ No _____ Don’t know
Do you have any type of reporting system to plan, implement or evaluate training?
_____ Yes _____ No _____ Don’t know
How do you get the money you need to run your ESP programs? How Money Gotten:
Do you get it all before training begins?
_____ Yes _____ No _____ Don’t know
Are there improvements you could suggest to improve the system?
Performance Feedback Who is your supervisor (administrative authority)?
What kind of support do you receive from him/her?
Is this the kind of support you feel you need?
How often are you evaluated? Is the evaluation fair?
What happens in a supervisory visit? Tell me about how a supervisory visit is conducted…
Do you conduct follow-up visits with trainees after your trainings?
If yes, with how many trainees?
If yes, do you use a checklist?
74 Appendices
Is there a minimum level of performance required for trainees to pass a course or the clinical part?
What happens if a trainee does not get a passing score on the post-test or clinical practice checklist?
Do you share the results (good or bad) with the trainee? How is this done?
What does supportive supervision mean to you?
If you do a good job, does your boss compliment you?
If you do a bad job, what does your boss do?
Has anyone observed you in a training session? Do they give you feedback? Tell me about that feedback process.
If you have a problem, can you depend on your supervisor to help resolve it?
What are the main problems you feel block you from doing a great job?
What are your suggestions to fix these problems?
Environment Do you have your own desk? Office? Computer? Copier? Fax? Internet? Telephone?
Do you have enough supplies? _____ Yes _____ No _____ Don’t know
If yes, what is lacking?
How often do you get stationary supplies?
_____Once a week _____Once a month _____Other (explain)
Do you have to submit an indent? _____ Yes _____ No _____ Don’t know
What is the procedure for getting stationary supplies?
How do training supplies reach the training sites? (Explain)
What would you like to see changed in your work environment (physical facilities and supplies)
Incentives, motivation In general, do you feel there are good interpersonal relationships in your organization?
Appendices 75
If not, what do you suggest would improve relationships in your organization?
_____ Yes _____ No _____ Don’t know
If NO, explain:
Do you feel you are listened to when you make a suggestion? _____ Always _____ More than half the time _____ Less than half the time _____ Never _____ Don’t know
What non-monetary motivators does your organization have?
Do you have suggestions for non-monetary motivators that would encourage people to do a better job?
Knowledge and skills When did you last receive a continuing education or training course?
How often does your organization say you should have continuing education or training…..is this every year, every two years or as necessary?
When did you have a TOT course?
What kind of training did you have before you became a trainer?
In your organization, when did you receive a certification of Master Trainer or Trainer?
_____Have not received certification ______Date (___________________)
Where is this certification recognized (locally, nationally, etc.)?
_____ Yes _____ No _____ Don’t know
_____ Locally _____ Nationally _____ Not recognized _____ Not Applicable
Do you feel you have all necessary knowledge and skills to do your job?
What skills/knowledge would you like to learn in order to do the best in your job?
What type of learning style would you like new information presented?
What other types of continuing education, overseas education or training would help you in doing your job?
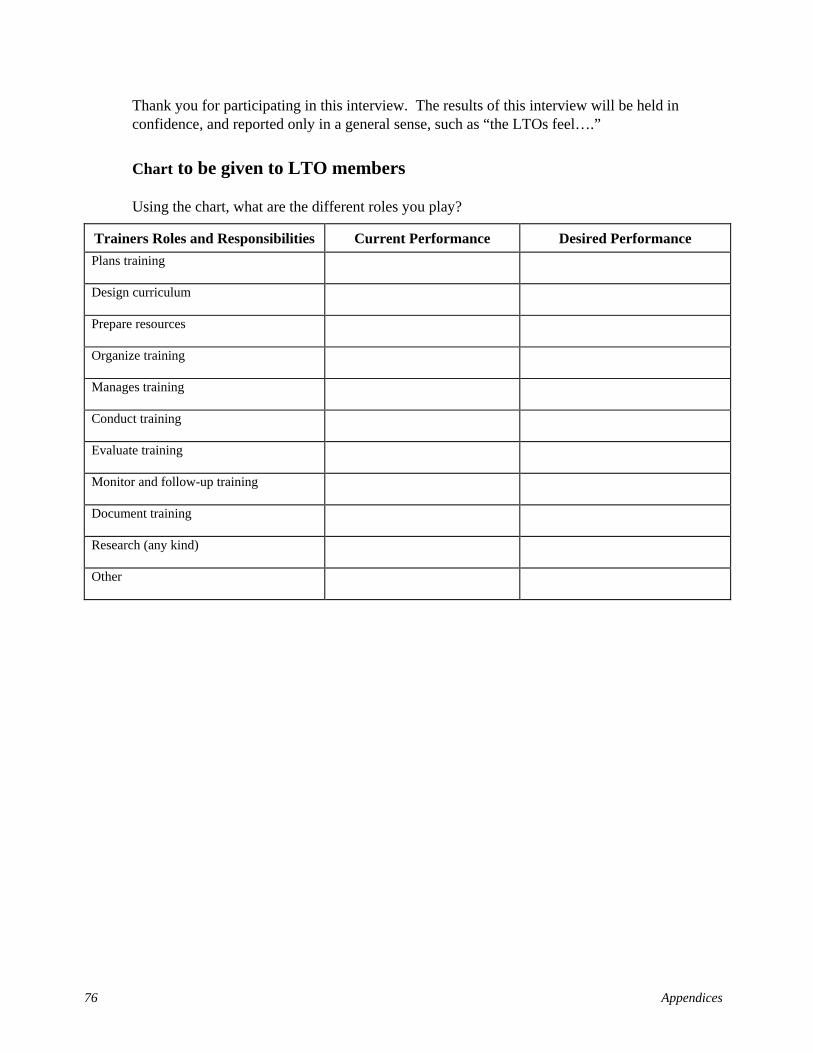
76 Appendices
Thank you for participating in this interview. The results of this interview will be held in confidence, and reported only in a general sense, such as “the LTOs feel….”
Chart to be given to LTO members
Using the chart, what are the different roles you play?
Trainers Roles and Responsibilities Current Performance Desired Performance Plans training
Design curriculum
Prepare resources
Organize training
Manages training
Conduct training
Evaluate training
Monitor and follow-up training
Document training
Research (any kind)
Other

Appendices 77
Appendix D.3: District level P/TNA and Baseline Capacity Assessment Tool
(Two interviews from the DTCC in each District)
Thank you for participating in this interview. These interviews are all confidential and we would appreciate your open attitude and honest responses to help us to improve In-Service Training in Bangladesh. This is a BASELINE interview for the ESP Program and we will be doing a similar survey in mid-2003. It will take approximately 45 minutes to one hour to complete this interview.
Note to Interviewer: Rephrasing of questions may be required.
Person Doing Interview:_________________________ Date__________________
Title of Interviewee (NO NAME)___________________ District _______________
Place of interview____________________________
Personnel Data 1. How long have you been in your present position? 1 = Less than 6 months
2 = 6 months up to one year 3 = One to three years 4 = Over 3 years
2. Do you have a job description? 1 = Yes, 2 = No, 3 = Don’t know
3. What are your three (3) main job responsibilities? 1. 2. 3.
4. When was the last time you treated a patient? 1 = Never 2 = Within the last week 3 = Within 6 months 4 = Within 6-12 months 5 = Over one-year 6 = Other
5. Are you involved in training? [If No, go on to question 6] 1 = Yes, 2 = No, 3 = Don’t know
5.1 If Yes, tick those that apply 1 = Planning Training 2 = Designing Curriculum 3 = Preparing Resources 4 = Organizing Training 5 = Managing Training 6 = Conducting Training 7 = Evaluating Training 8 = Monitoring and Follow-up of
Training 9 = Documenting Training
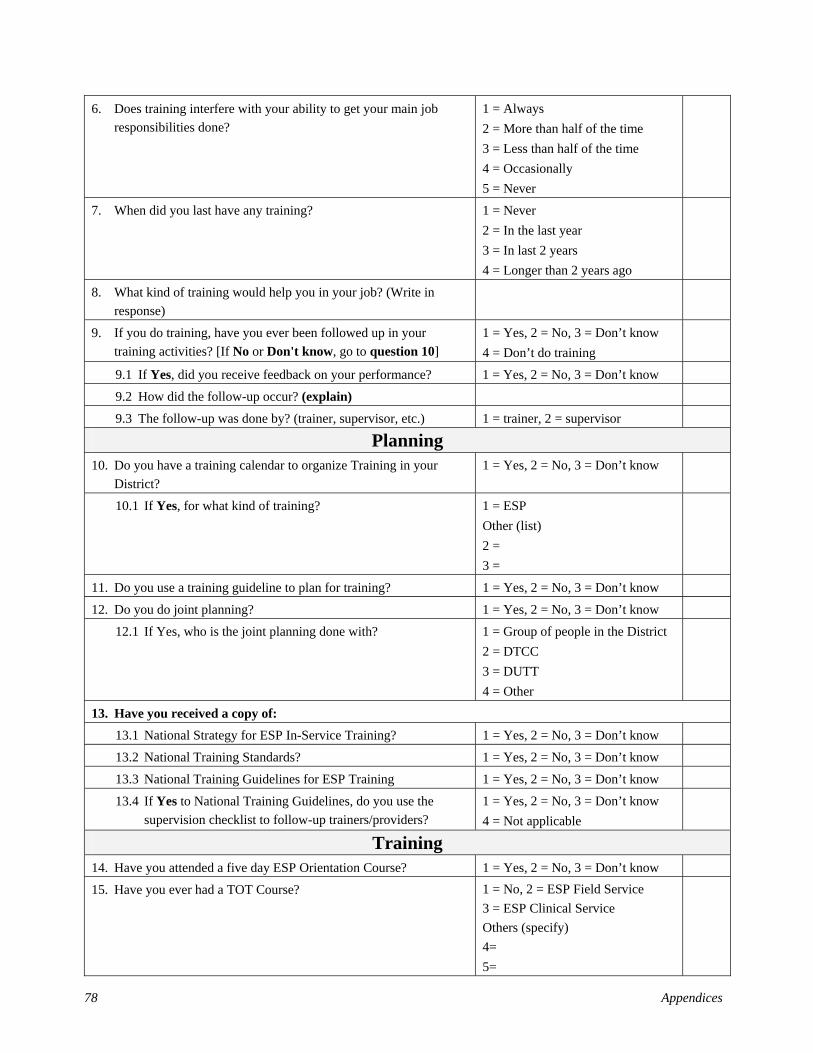
78 Appendices
6. Does training interfere with your ability to get your main job responsibilities done?
1 = Always 2 = More than half of the time 3 = Less than half of the time 4 = Occasionally 5 = Never
7. When did you last have any training? 1 = Never 2 = In the last year 3 = In last 2 years 4 = Longer than 2 years ago
8. What kind of training would help you in your job? (Write in response)
9. If you do training, have you ever been followed up in your training activities? [If No or Don't know, go to question 10]
1 = Yes, 2 = No, 3 = Don’t know 4 = Don’t do training
9.1 If Yes, did you receive feedback on your performance? 1 = Yes, 2 = No, 3 = Don’t know 9.2 How did the follow-up occur? (explain)
9.3 The follow-up was done by? (trainer, supervisor, etc.) 1 = trainer, 2 = supervisor
Planning 10. Do you have a training calendar to organize Training in your
District? 1 = Yes, 2 = No, 3 = Don’t know
10.1 If Yes, for what kind of training? 1 = ESP Other (list) 2 = 3 =
11. Do you use a training guideline to plan for training? 1 = Yes, 2 = No, 3 = Don’t know
12. Do you do joint planning? 1 = Yes, 2 = No, 3 = Don’t know
12.1 If Yes, who is the joint planning done with? 1 = Group of people in the District 2 = DTCC 3 = DUTT 4 = Other
13. Have you received a copy of: 13.1 National Strategy for ESP In-Service Training? 1 = Yes, 2 = No, 3 = Don’t know
13.2 National Training Standards? 1 = Yes, 2 = No, 3 = Don’t know
13.3 National Training Guidelines for ESP Training 1 = Yes, 2 = No, 3 = Don’t know
13.4 If Yes to National Training Guidelines, do you use the supervision checklist to follow-up trainers/providers?
1 = Yes, 2 = No, 3 = Don’t know 4 = Not applicable
Training 14. Have you attended a five day ESP Orientation Course? 1 = Yes, 2 = No, 3 = Don’t know
15. Have you ever had a TOT Course? 1 = No, 2 = ESP Field Service 3 = ESP Clinical Service Others (specify) 4= 5=
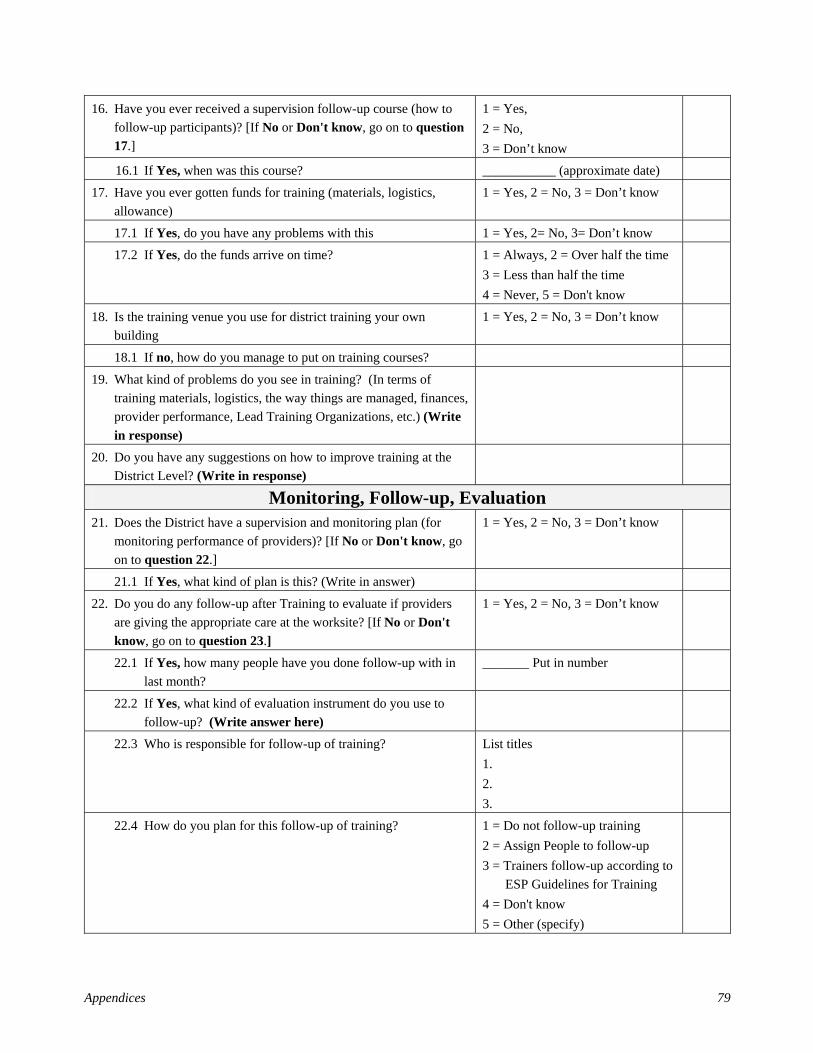
Appendices 79
16. Have you ever received a supervision follow-up course (how to follow-up participants)? [If No or Don't know, go on to question 17.]
1 = Yes, 2 = No, 3 = Don’t know
16.1 If Yes, when was this course? ___________ (approximate date)
17. Have you ever gotten funds for training (materials, logistics, allowance)
1 = Yes, 2 = No, 3 = Don’t know
17.1 If Yes, do you have any problems with this 1 = Yes, 2= No, 3= Don’t know 17.2 If Yes, do the funds arrive on time? 1 = Always, 2 = Over half the time
3 = Less than half the time 4 = Never, 5 = Don't know
18. Is the training venue you use for district training your own building
1 = Yes, 2 = No, 3 = Don’t know
18.1 If no, how do you manage to put on training courses?
19. What kind of problems do you see in training? (In terms of training materials, logistics, the way things are managed, finances, provider performance, Lead Training Organizations, etc.) (Write in response)
20. Do you have any suggestions on how to improve training at the District Level? (Write in response)
Monitoring, Follow-up, Evaluation 21. Does the District have a supervision and monitoring plan (for
monitoring performance of providers)? [If No or Don't know, go on to question 22.]
1 = Yes, 2 = No, 3 = Don’t know
21.1 If Yes, what kind of plan is this? (Write in answer)
22. Do you do any follow-up after Training to evaluate if providers are giving the appropriate care at the worksite? [If No or Don't know, go on to question 23.]
1 = Yes, 2 = No, 3 = Don’t know
22.1 If Yes, how many people have you done follow-up with in last month?
_______ Put in number
22.2 If Yes, what kind of evaluation instrument do you use to follow-up? (Write answer here)
22.3 Who is responsible for follow-up of training? List titles 1. 2. 3.
22.4 How do you plan for this follow-up of training? 1 = Do not follow-up training 2 = Assign People to follow-up 3 = Trainers follow-up according to
ESP Guidelines for Training 4 = Don't know 5 = Other (specify)
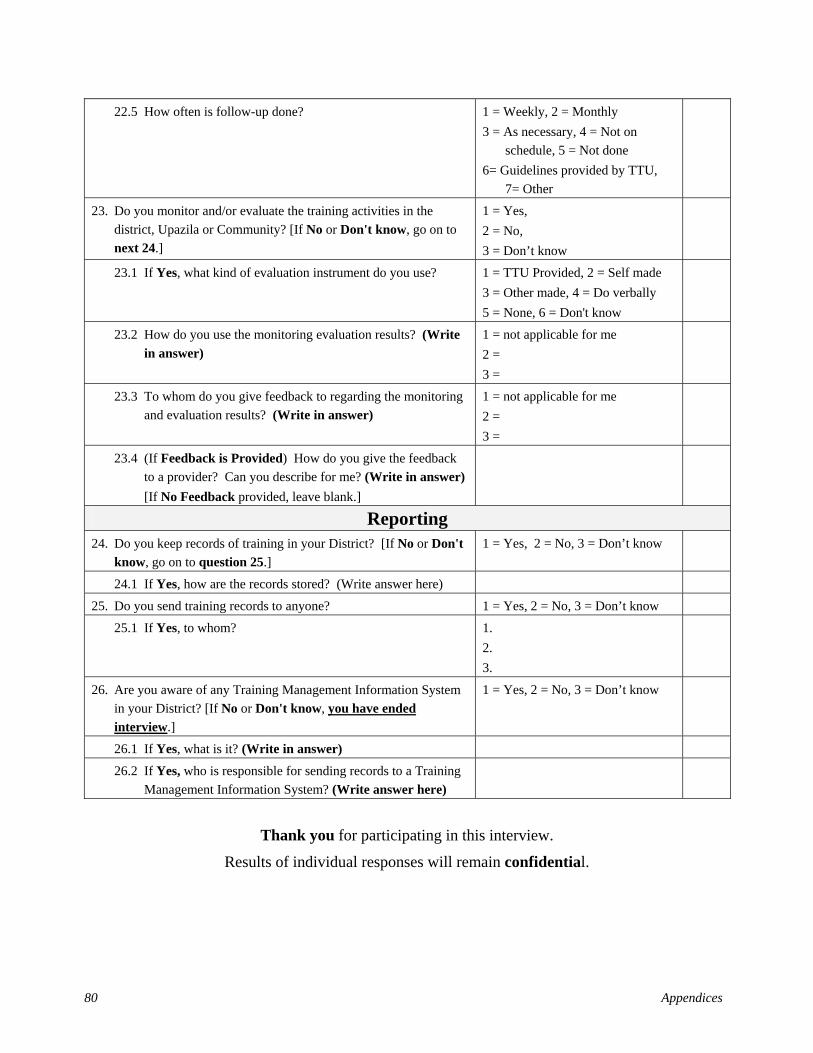
80 Appendices
22.5 How often is follow-up done? 1 = Weekly, 2 = Monthly 3 = As necessary, 4 = Not on
schedule, 5 = Not done 6= Guidelines provided by TTU,
7= Other
23. Do you monitor and/or evaluate the training activities in the district, Upazila or Community? [If No or Don't know, go on to next 24.]
1 = Yes, 2 = No, 3 = Don’t know
23.1 If Yes, what kind of evaluation instrument do you use? 1 = TTU Provided, 2 = Self made 3 = Other made, 4 = Do verbally 5 = None, 6 = Don't know
23.2 How do you use the monitoring evaluation results? (Write in answer)
1 = not applicable for me 2 = 3 =
23.3 To whom do you give feedback to regarding the monitoring and evaluation results? (Write in answer)
1 = not applicable for me 2 = 3 =
23.4 (If Feedback is Provided) How do you give the feedback to a provider? Can you describe for me? (Write in answer) [If No Feedback provided, leave blank.]
Reporting 24. Do you keep records of training in your District? [If No or Don't
know, go on to question 25.] 1 = Yes, 2 = No, 3 = Don’t know
24.1 If Yes, how are the records stored? (Write answer here) 25. Do you send training records to anyone? 1 = Yes, 2 = No, 3 = Don’t know
25.1 If Yes, to whom? 1. 2. 3.
26. Are you aware of any Training Management Information System in your District? [If No or Don't know, you have ended interview.]
1 = Yes, 2 = No, 3 = Don’t know
26.1 If Yes, what is it? (Write in answer)
26.2 If Yes, who is responsible for sending records to a Training Management Information System? (Write answer here)
Thank you for participating in this interview.
Results of individual responses will remain confidential.

Appendices 81
Appendix D.4: Upazila Level P/TNA and Baseline Capacity Assessment Tool
(Two interviews from the DUTT in each Upazila)
Thank you for participating in this interview. These interviews are all confidential and we would appreciate your open attitude and honest responses to help us to improve In-Service Training in Bangladesh. This is a BASELINE interview for the ESP Program and we will be doing a similar survey in mid-2003. It will take approximately 45 minutes to one hour to complete this interview.
Note to Interviewer: Rephrasing of questions may be required.
Person Doing Interview: _________________________ Date__________________
Title of Interviewee (NO NAME) ___________________ District _______________
Place of interview____________________________
Personnel Data 1. How long have you been in your present position? 1 = Less than 6 months
2 = 6 months up to one year 3 = One to three years 4 = Over 3 years
2. Do you have a job description? 1 = Yes, 2 = No, 3 = Don’t know
3. What are your three (3) main job responsibilities? 1. 2. 3.
4. When was the last time you treated a patient? 1 = Never 2 = Within the last week 3 = Within 6 months 4 = Within 6-12 months 5 = Over one-year 6 = Other
5. Are you involved in training? [If No, go on to question 6] 1 = Yes, 2 = No, 3= Don’t know
5.1 If Yes, tick those that apply 1 = Planning Training 2 = Designing Curriculum 3 = Preparing Resources 4 = Organizing Training 5 = Managing Training 6 = Conducting Training 7 = Evaluating Training 8 = Monitoring and Follow-up of
Training 9 = Documenting Training
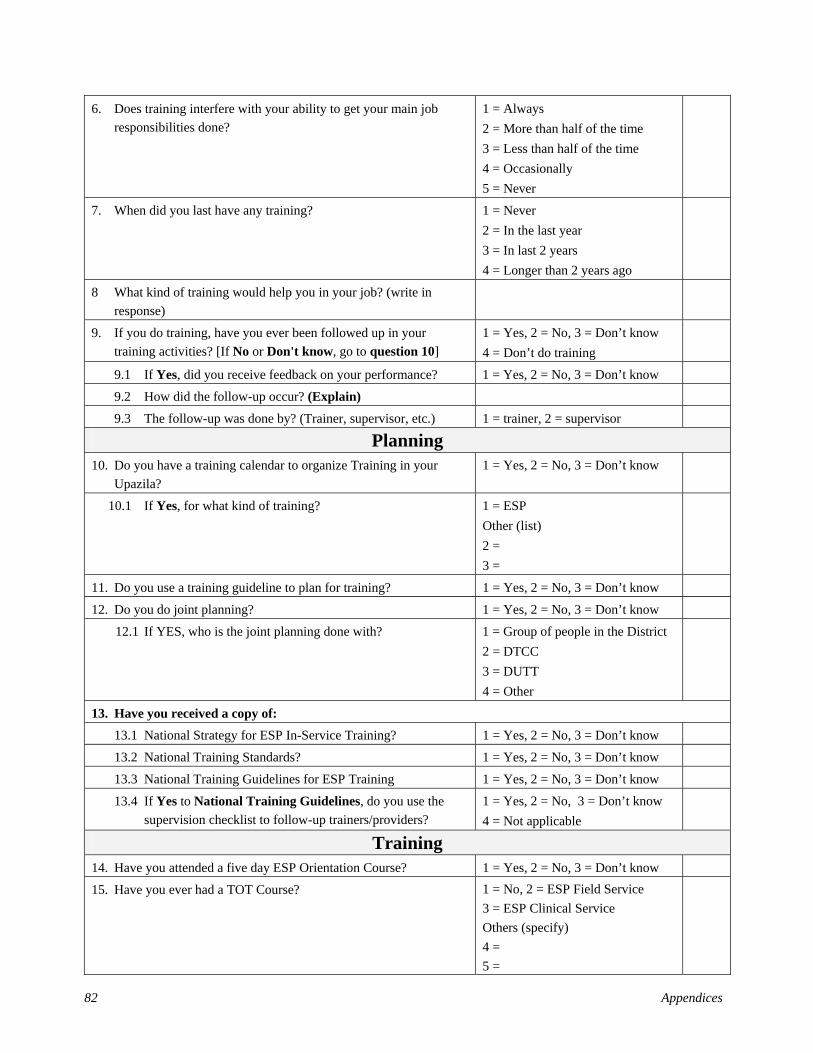
82 Appendices
6. Does training interfere with your ability to get your main job responsibilities done?
1 = Always 2 = More than half of the time 3 = Less than half of the time 4 = Occasionally 5 = Never
7. When did you last have any training? 1 = Never 2 = In the last year 3 = In last 2 years 4 = Longer than 2 years ago
8 What kind of training would help you in your job? (write in response)
9. If you do training, have you ever been followed up in your training activities? [If No or Don't know, go to question 10]
1 = Yes, 2 = No, 3 = Don’t know 4 = Don’t do training
9.1 If Yes, did you receive feedback on your performance? 1 = Yes, 2 = No, 3 = Don’t know 9.2 How did the follow-up occur? (Explain)
9.3 The follow-up was done by? (Trainer, supervisor, etc.) 1 = trainer, 2 = supervisor
Planning 10. Do you have a training calendar to organize Training in your
Upazila? 1 = Yes, 2 = No, 3 = Don’t know
10.1 If Yes, for what kind of training? 1 = ESP Other (list) 2 = 3 =
11. Do you use a training guideline to plan for training? 1 = Yes, 2 = No, 3 = Don’t know
12. Do you do joint planning? 1 = Yes, 2 = No, 3 = Don’t know
12.1 If YES, who is the joint planning done with? 1 = Group of people in the District 2 = DTCC 3 = DUTT 4 = Other
13. Have you received a copy of: 13.1 National Strategy for ESP In-Service Training? 1 = Yes, 2 = No, 3 = Don’t know
13.2 National Training Standards? 1 = Yes, 2 = No, 3 = Don’t know
13.3 National Training Guidelines for ESP Training 1 = Yes, 2 = No, 3 = Don’t know
13.4 If Yes to National Training Guidelines, do you use the supervision checklist to follow-up trainers/providers?
1 = Yes, 2 = No, 3 = Don’t know 4 = Not applicable
Training 14. Have you attended a five day ESP Orientation Course? 1 = Yes, 2 = No, 3 = Don’t know
15. Have you ever had a TOT Course? 1 = No, 2 = ESP Field Service 3 = ESP Clinical Service Others (specify) 4 = 5 =
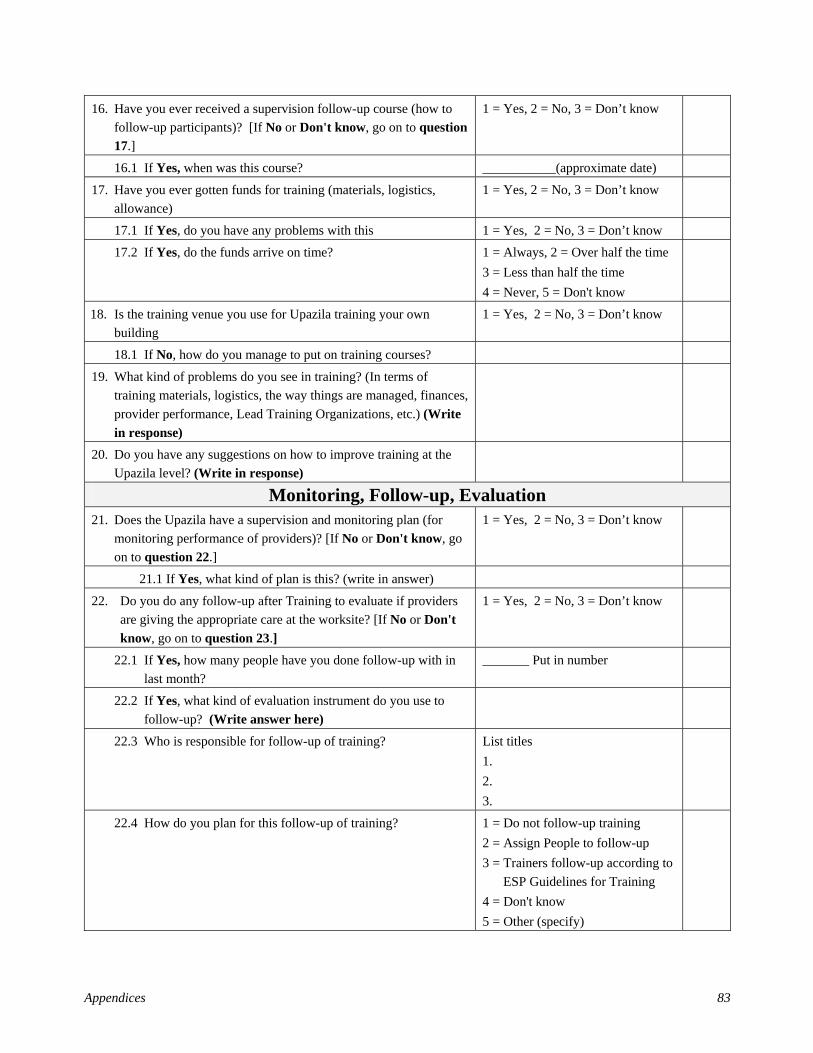
Appendices 83
16. Have you ever received a supervision follow-up course (how to follow-up participants)? [If No or Don't know, go on to question 17.]
1 = Yes, 2 = No, 3 = Don’t know
16.1 If Yes, when was this course? ___________(approximate date)
17. Have you ever gotten funds for training (materials, logistics, allowance)
1 = Yes, 2 = No, 3 = Don’t know
17.1 If Yes, do you have any problems with this 1 = Yes, 2 = No, 3 = Don’t know 17.2 If Yes, do the funds arrive on time? 1 = Always, 2 = Over half the time
3 = Less than half the time 4 = Never, 5 = Don't know
18. Is the training venue you use for Upazila training your own building
1 = Yes, 2 = No, 3 = Don’t know
18.1 If No, how do you manage to put on training courses?
19. What kind of problems do you see in training? (In terms of training materials, logistics, the way things are managed, finances, provider performance, Lead Training Organizations, etc.) (Write in response)
20. Do you have any suggestions on how to improve training at the Upazila level? (Write in response)
Monitoring, Follow-up, Evaluation 21. Does the Upazila have a supervision and monitoring plan (for
monitoring performance of providers)? [If No or Don't know, go on to question 22.]
1 = Yes, 2 = No, 3 = Don’t know
21.1 If Yes, what kind of plan is this? (write in answer)
22. Do you do any follow-up after Training to evaluate if providers are giving the appropriate care at the worksite? [If No or Don't know, go on to question 23.]
1 = Yes, 2 = No, 3 = Don’t know
22.1 If Yes, how many people have you done follow-up with in last month?
_______ Put in number
22.2 If Yes, what kind of evaluation instrument do you use to follow-up? (Write answer here)
22.3 Who is responsible for follow-up of training? List titles 1. 2. 3.
22.4 How do you plan for this follow-up of training? 1 = Do not follow-up training 2 = Assign People to follow-up 3 = Trainers follow-up according to
ESP Guidelines for Training 4 = Don't know 5 = Other (specify)
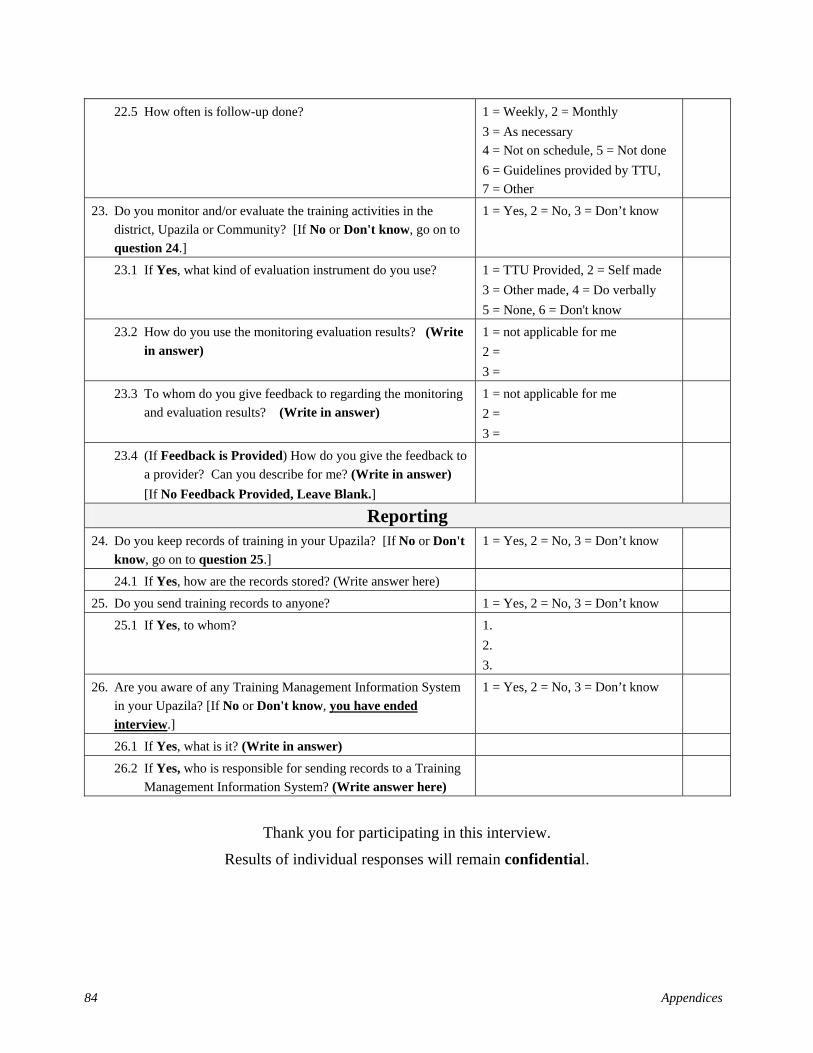
84 Appendices
22.5 How often is follow-up done? 1 = Weekly, 2 = Monthly 3 = As necessary 4 = Not on schedule, 5 = Not done 6 = Guidelines provided by TTU, 7 = Other
23. Do you monitor and/or evaluate the training activities in the district, Upazila or Community? [If No or Don't know, go on to question 24.]
1 = Yes, 2 = No, 3 = Don’t know
23.1 If Yes, what kind of evaluation instrument do you use? 1 = TTU Provided, 2 = Self made 3 = Other made, 4 = Do verbally 5 = None, 6 = Don't know
23.2 How do you use the monitoring evaluation results? (Write in answer)
1 = not applicable for me 2 = 3 =
23.3 To whom do you give feedback to regarding the monitoring and evaluation results? (Write in answer)
1 = not applicable for me 2 = 3 =
23.4 (If Feedback is Provided) How do you give the feedback to a provider? Can you describe for me? (Write in answer) [If No Feedback Provided, Leave Blank.]
Reporting 24. Do you keep records of training in your Upazila? [If No or Don't
know, go on to question 25.] 1 = Yes, 2 = No, 3 = Don’t know
24.1 If Yes, how are the records stored? (Write answer here) 25. Do you send training records to anyone? 1 = Yes, 2 = No, 3 = Don’t know
25.1 If Yes, to whom? 1. 2. 3.
26. Are you aware of any Training Management Information System in your Upazila? [If No or Don't know, you have ended interview.]
1 = Yes, 2 = No, 3 = Don’t know
26.1 If Yes, what is it? (Write in answer)
26.2 If Yes, who is responsible for sending records to a Training Management Information System? (Write answer here)
Thank you for participating in this interview.
Results of individual responses will remain confidential.

Appendices 85
Appendix D.5: Competence Assessment Tool of Immediate Supervisors of Field Service Providers
(Do when you get to clinic; speak with person in charge of the clinic - AHI/FPI)
Person Doing Interview (name): ________________________ Date: ________________
Upazila: _______________ Community/Satellite Clinic: ___________________________
Title of Person in Charge of the Community Clinic (NO NAME): ________________________
1. Are you a supervisor? 1 = Yes, 2 = No
2. If yes, whom do you supervise? 1 = HA, 2 = FWA Other (write in) 3.
3. Have you been trained in management? 1 = Yes, 2 = No
3.1 If yes, when was this training? _____________ (Date)
4. Have you been trained in supportive supervision? 1 = Yes, 2 = No
4.1 If yes, when was this training? _____________ (Date)
5. When does the clinic open in the morning? _____________ (Insert time)
6. When does the clinic close? _____________ (Insert time)
7. What days of the week are you open? 1. Monday, 2. Tuesday, 3. Wednesday, 4. Thursday, 5. Friday, 6. Saturday, 7. Sunday
8. Is this Community Clinic built and run by the government, or donated space?
1. Built/run by government, 2. Donated Space, 3. Part of the Union Health Center, 4. Other
How many clients were seen at the Community Clinic in the last month? 9. Total number of clients during last month _____________
10. How many were women? (age 15 to 49) _____________
11. How many were men? (age 15 to 49) _____________
12. Female Children? (13 months to 14 years old) _____________
13. Male Children? (13 months to 14 years old) _____________
14. Female Babies? (age 0-12 months) _____________
15. Male Babies? (age 0-12 months) _____________
Interviewer: Proceed to the Worksite Evaluation Checklist

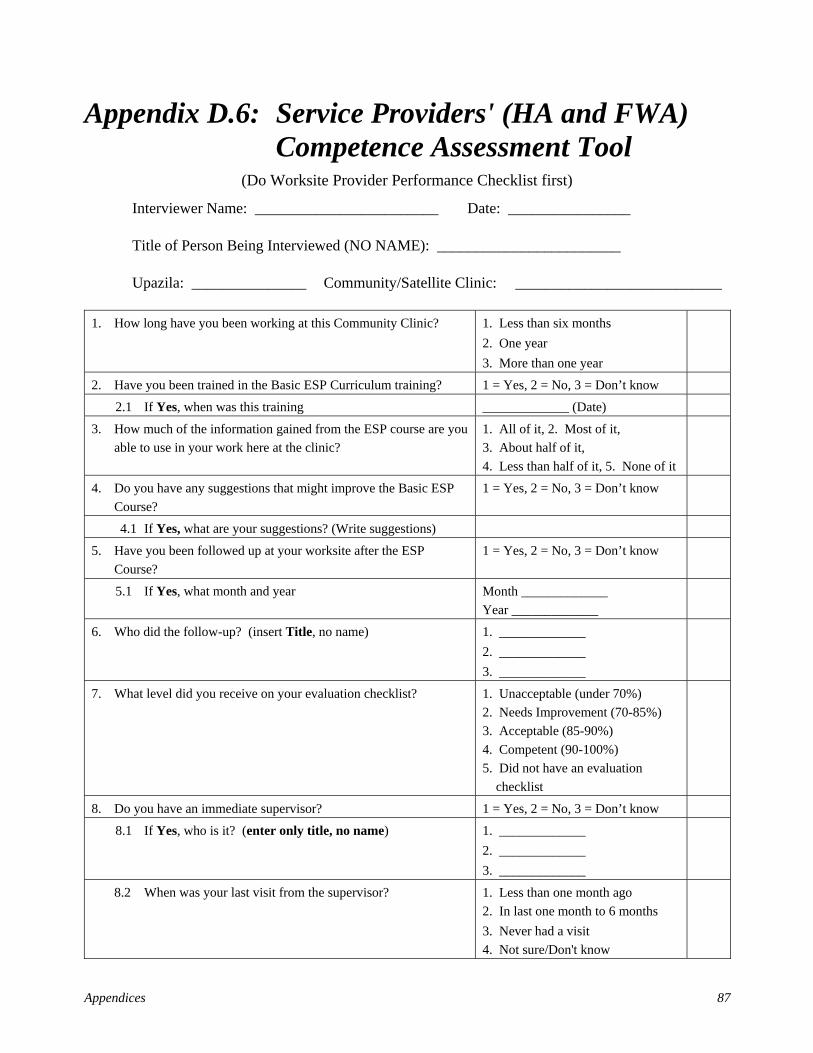
Appendices 87
Appendix D.6: Service Providers' (HA and FWA) Competence Assessment Tool
(Do Worksite Provider Performance Checklist first)
Interviewer Name: ________________________ Date: ________________
Title of Person Being Interviewed (NO NAME): ________________________
Upazila: _______________ Community/Satellite Clinic: ___________________________
1. How long have you been working at this Community Clinic? 1. Less than six months 2. One year 3. More than one year
2. Have you been trained in the Basic ESP Curriculum training? 1 = Yes, 2 = No, 3 = Don’t know
2.1 If Yes, when was this training _____________ (Date)
3. How much of the information gained from the ESP course are you able to use in your work here at the clinic?
1. All of it, 2. Most of it, 3. About half of it, 4. Less than half of it, 5. None of it
4. Do you have any suggestions that might improve the Basic ESP Course?
1 = Yes, 2 = No, 3 = Don’t know
4.1 If Yes, what are your suggestions? (Write suggestions)
5. Have you been followed up at your worksite after the ESP Course?
1 = Yes, 2 = No, 3 = Don’t know
5.1 If Yes, what month and year Month _____________ Year _____________
6. Who did the follow-up? (insert Title, no name) 1. _____________ 2. _____________ 3. _____________
7. What level did you receive on your evaluation checklist? 1. Unacceptable (under 70%) 2. Needs Improvement (70-85%) 3. Acceptable (85-90%) 4. Competent (90-100%) 5. Did not have an evaluation checklist
8. Do you have an immediate supervisor? 1 = Yes, 2 = No, 3 = Don’t know
8.1 If Yes, who is it? (enter only title, no name) 1. _____________ 2. _____________ 3. _____________
8.2 When was your last visit from the supervisor? 1. Less than one month ago 2. In last one month to 6 months 3. Never had a visit 4. Not sure/Don't know
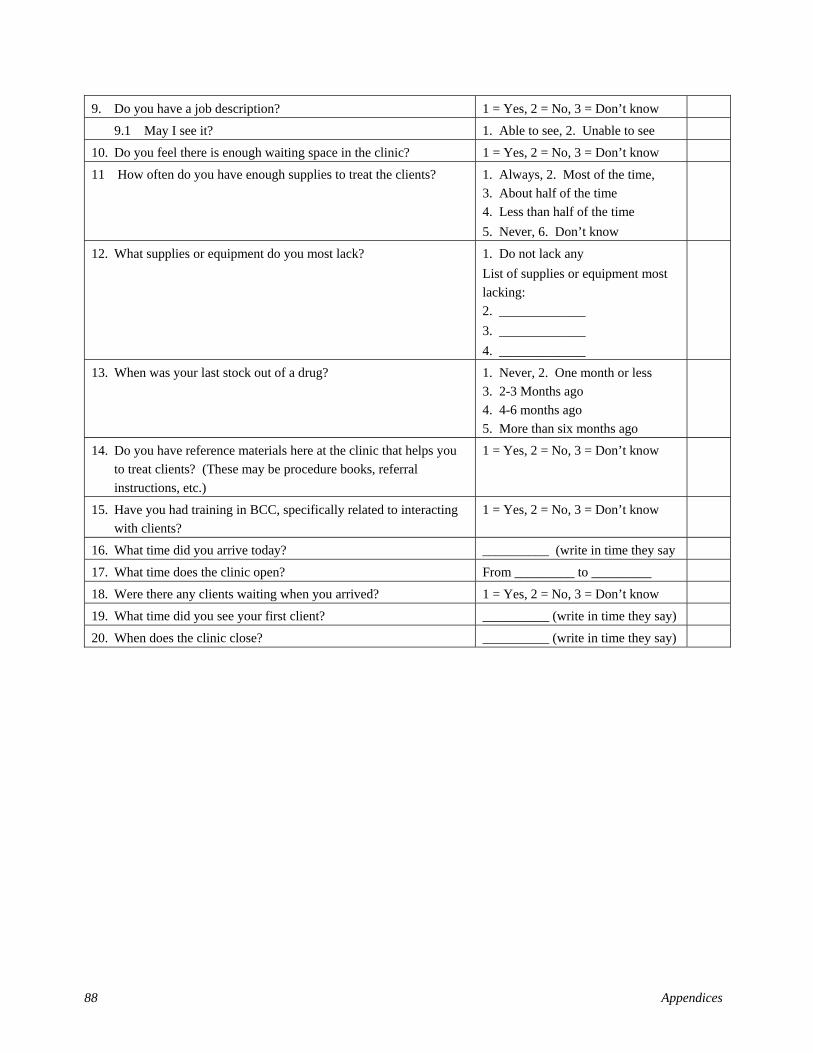
88 Appendices
9. Do you have a job description? 1 = Yes, 2 = No, 3 = Don’t know
9.1 May I see it? 1. Able to see, 2. Unable to see
10. Do you feel there is enough waiting space in the clinic? 1 = Yes, 2 = No, 3 = Don’t know
11 How often do you have enough supplies to treat the clients? 1. Always, 2. Most of the time, 3. About half of the time 4. Less than half of the time 5. Never, 6. Don’t know
12. What supplies or equipment do you most lack? 1. Do not lack any List of supplies or equipment most lacking: 2. _____________ 3. _____________ 4. _____________
13. When was your last stock out of a drug? 1. Never, 2. One month or less 3. 2-3 Months ago 4. 4-6 months ago 5. More than six months ago
14. Do you have reference materials here at the clinic that helps you to treat clients? (These may be procedure books, referral instructions, etc.)
1 = Yes, 2 = No, 3 = Don’t know
15. Have you had training in BCC, specifically related to interacting with clients?
1 = Yes, 2 = No, 3 = Don’t know
16. What time did you arrive today? __________ (write in time they say
17. What time does the clinic open? From _________ to _________
18. Were there any clients waiting when you arrived? 1 = Yes, 2 = No, 3 = Don’t know
19. What time did you see your first client? __________ (write in time they say)
20. When does the clinic close? __________ (write in time they say)
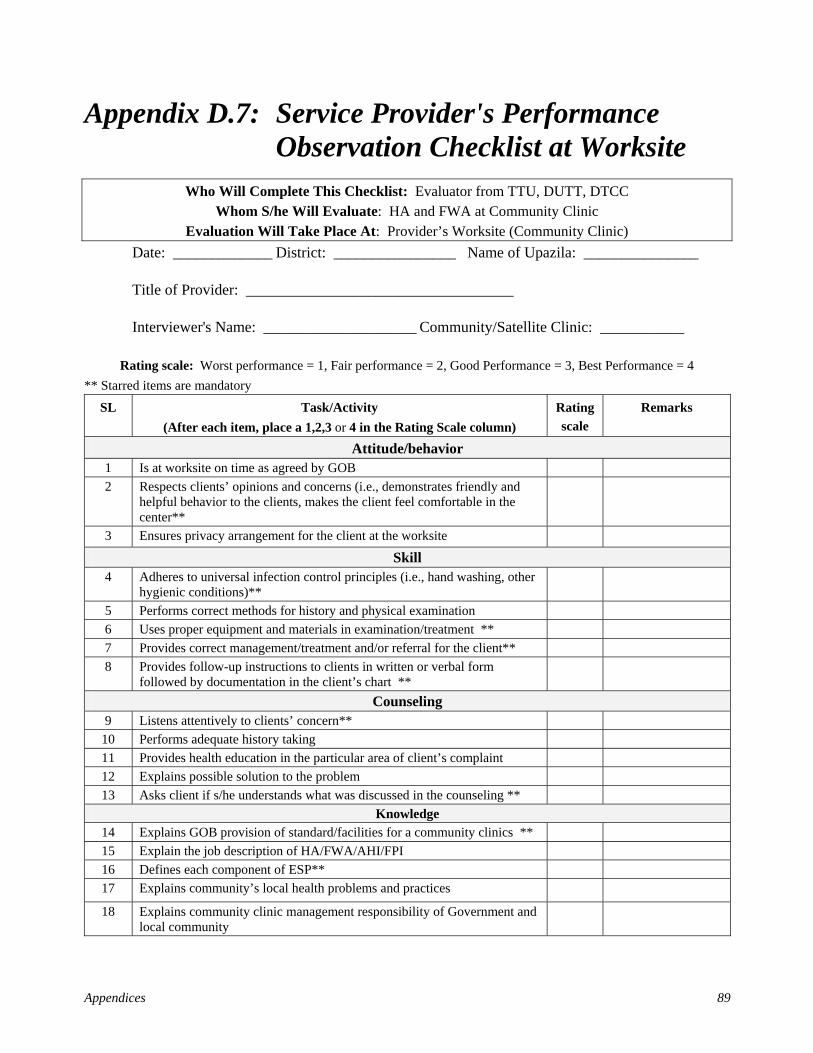
Appendices 89
Appendix D.7: Service Provider's Performance Observation Checklist at Worksite
Who Will Complete This Checklist: Evaluator from TTU, DUTT, DTCC Whom S/he Will Evaluate: HA and FWA at Community Clinic
Evaluation Will Take Place At: Provider’s Worksite (Community Clinic) Date: _____________ District: ________________ Name of Upazila: _______________
Title of Provider: ___________________________________
Interviewer's Name: ____________________ Community/Satellite Clinic: ___________
Rating scale: Worst performance = 1, Fair performance = 2, Good Performance = 3, Best Performance = 4 ** Starred items are mandatory
SL Task/Activity (After each item, place a 1,2,3 or 4 in the Rating Scale column)
Rating scale
Remarks
Attitude/behavior 1 Is at worksite on time as agreed by GOB 2 Respects clients’ opinions and concerns (i.e., demonstrates friendly and
helpful behavior to the clients, makes the client feel comfortable in the center**
3 Ensures privacy arrangement for the client at the worksite
Skill 4 Adheres to universal infection control principles (i.e., hand washing, other
hygienic conditions)**
5 Performs correct methods for history and physical examination 6 Uses proper equipment and materials in examination/treatment ** 7 Provides correct management/treatment and/or referral for the client** 8 Provides follow-up instructions to clients in written or verbal form
followed by documentation in the client’s chart **
Counseling 9 Listens attentively to clients’ concern**
10 Performs adequate history taking 11 Provides health education in the particular area of client’s complaint 12 Explains possible solution to the problem 13 Asks client if s/he understands what was discussed in the counseling **
Knowledge 14 Explains GOB provision of standard/facilities for a community clinics ** 15 Explain the job description of HA/FWA/AHI/FPI 16 Defines each component of ESP** 17 Explains community’s local health problems and practices
18 Explains community clinic management responsibility of Government and local community


Appendices 91
Appendix D.8: Exit Interview Tool for Clients at Service Delivery Points
Exit Interview (to be done when client exits the clinic)
Interviewer Name: __________________________ Date: ________________________
District: ___________ Upazila: ___________ Community/Satellite Clinic: ___________
1. Age of Client 2. Sex: 1. Female, 2. Male 3. Are you employed? 1 = Yes, 2 = No, 3 = Don’t know 4. Is your husband (or wife) employed? 1 = Yes, 2 = No, 3 = Don’t know 5. What was your main reason for coming to the clinic today?
(Write in client’s words)
6. How long did it take you to walk from your home to the clinic? 1. 1-30 minutes 2. [31-60 minutes] 3. [Over one hour]
7. Did you seek any medical advice elsewhere for the same complaint before coming here?
1 = Yes, 2 = No, 3 = Don’t know
7.1 If Yes, by whom? 1. Village doctor, 2. Pharmacy, 3. Kabiraj, 4. Homeopath, 5. Religious
8. Do you know what time the clinic opens? 1. Yes (write time _________) 2. Don't know
9. What days are the clinics open? 1. Monday, 2. Tuesday, 3. Wednesday, 4. Thursday, 5. Friday, 6. Saturday, 7. Sunday
10. When does the clinic close? 1. (insert time __________) 2. Don't know
11. Is the clinic open when it says it will be open? 1 = Yes, 2 = No, 3 = Don’t know 12. Do you feel welcomed by the clinic staff? 1 = Yes, 2 = No, 3 = Don’t know 13. Do you feel comfortable asking questions of the staff? 1 = Yes, 2 = No, 3 = Don’t know 14. When did you arrive here today? 1. (write time _________)
2. Don't know
15. When were you seen by the HA or FWA? ______________ (Write in time) 16. Were there supplies to treat you? 1 = Yes, 2 = No, 3 = Don’t know 17. Did the HA or FWA tell you what was wrong with you? 1 = Yes, 2 = No, 3 = Don’t know 18. Did you see the person who cared for you wash their hands? 1 = Yes, 2 = No, 3 = Don’t know 19. Did you get instructions on follow-up before leaving? (Write in
client’s words)
20. Are you supposed to return here? 1 = Yes, 2 = No, 3 = Don’t know 21. If Yes, what date? ______________ (Write in date)

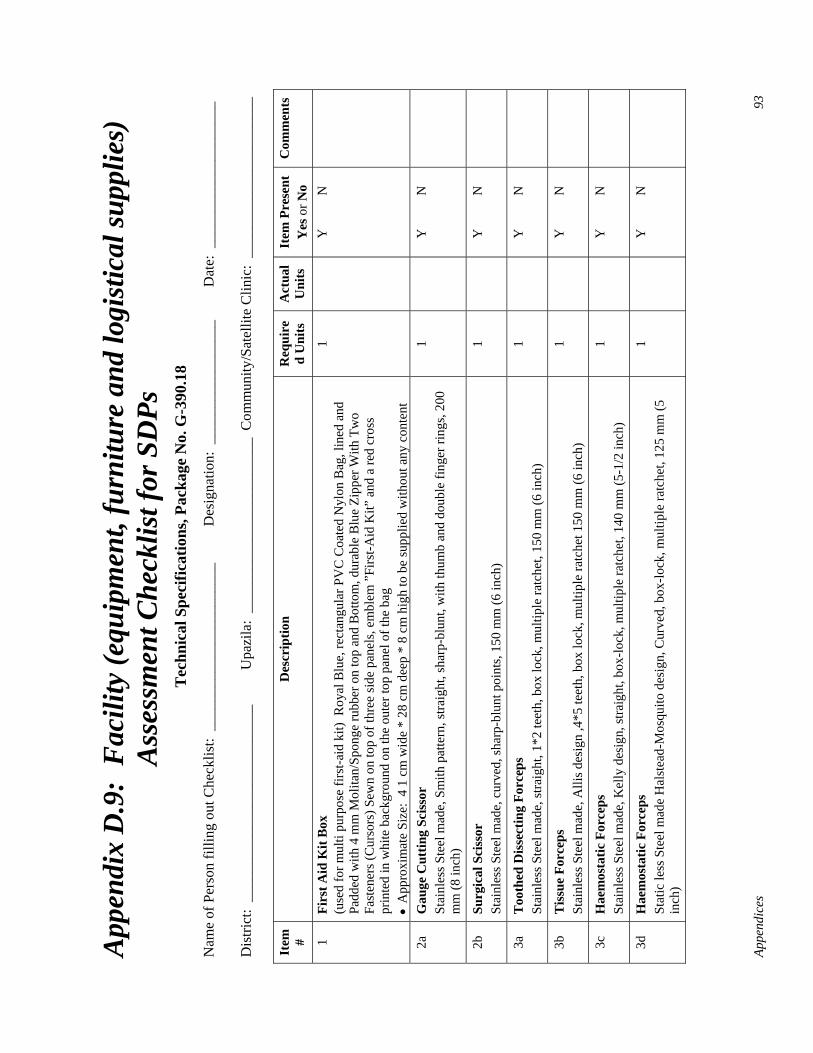
Appe
ndic
es
93
App
endi
x D
.9:
Fac
ility
(equ
ipm
ent,
furn
iture
and
logi
stic
al su
pplie
s)
Ass
essm
ent C
heck
list f
or S
DPs
T
echn
ical
Spe
cific
atio
ns, P
acka
ge N
o. G
-390
.18
Nam
e of
Per
son
fillin
g ou
t Che
cklis
t: _
____
____
____
____
____
__
Des
igna
tion:
___
____
____
____
__
Dat
e: _
____
____
____
____
___
Dis
trict
: __
____
____
____
____
____
____
_ U
pazi
la:
____
____
____
____
____
____
Com
mun
ity/S
atel
lite
Clin
ic:
____
____
____
____
____
__
Item
#
Des
crip
tion
Req
uire
d U
nits
A
ctua
l U
nits
It
em P
rese
nt
Yes
or N
o C
omm
ents
1 Fi
rst A
id K
it B
ox
(use
d fo
r mul
ti pu
rpos
e fir
st-a
id k
it) R
oyal
Blu
e, re
ctan
gula
r PV
C C
oate
d N
ylon
Bag
, lin
ed a
nd
Padd
ed w
ith 4
mm
Mol
itan/
Spon
ge ru
bber
on
top
and
Bot
tom
, dur
able
Blu
e Zi
pper
With
Tw
o Fa
sten
ers (
Cur
sors
) Sew
n on
top
of th
ree
side
pan
els,
embl
em ”
Firs
t-Aid
Kit”
and
a re
d cr
oss
prin
ted
in w
hite
bac
kgro
und
on th
e ou
ter t
op p
anel
of t
he b
ag
• A
ppro
xim
ate
Size
: 4
1 cm
wid
e *
28 c
m d
eep
* 8
cm h
igh
to b
e su
pplie
d w
ithou
t any
con
tent
1
Y
N
2a
Gau
ge C
uttin
g Sc
isso
r St
ainl
ess S
teel
mad
e, S
mith
pat
tern
, stra
ight
, sha
rp-b
lunt
, with
thum
b an
d do
uble
fing
er ri
ngs,
200
mm
(8 in
ch)
1
Y
N
2b
Surg
ical
Sci
ssor
St
ainl
ess S
teel
mad
e, c
urve
d, sh
arp-
blun
t poi
nts,
150
mm
(6 in
ch)
1
Y
N
3a
Too
thed
Dis
sect
ing
Forc
eps
Stai
nles
s Ste
el m
ade,
stra
ight
, 1*2
teet
h, b
ox lo
ck, m
ultip
le ra
tche
t, 15
0 m
m (6
inch
) 1
Y
N
3b
Tis
sue
Forc
eps
Stai
nles
s Ste
el m
ade,
Alli
s des
ign
,4*5
teet
h, b
ox lo
ck, m
ultip
le ra
tche
t 150
mm
(6 in
ch)
1
Y
N
3c
Hae
mos
tatic
For
ceps
St
ainl
ess S
teel
mad
e, K
elly
des
ign,
stra
ight
, box
-lock
, mul
tiple
ratc
het,
140
mm
(5-1
/2 in
ch)
1
Y
N
3d
Hae
mos
tatic
For
ceps
St
atic
less
Ste
el m
ade
Hal
stea
d-M
osqu
ito d
esig
n, C
urve
d, b
ox-lo
ck, m
ultip
le ra
tche
t, 12
5 m
m (5
in
ch)
1
Y
N
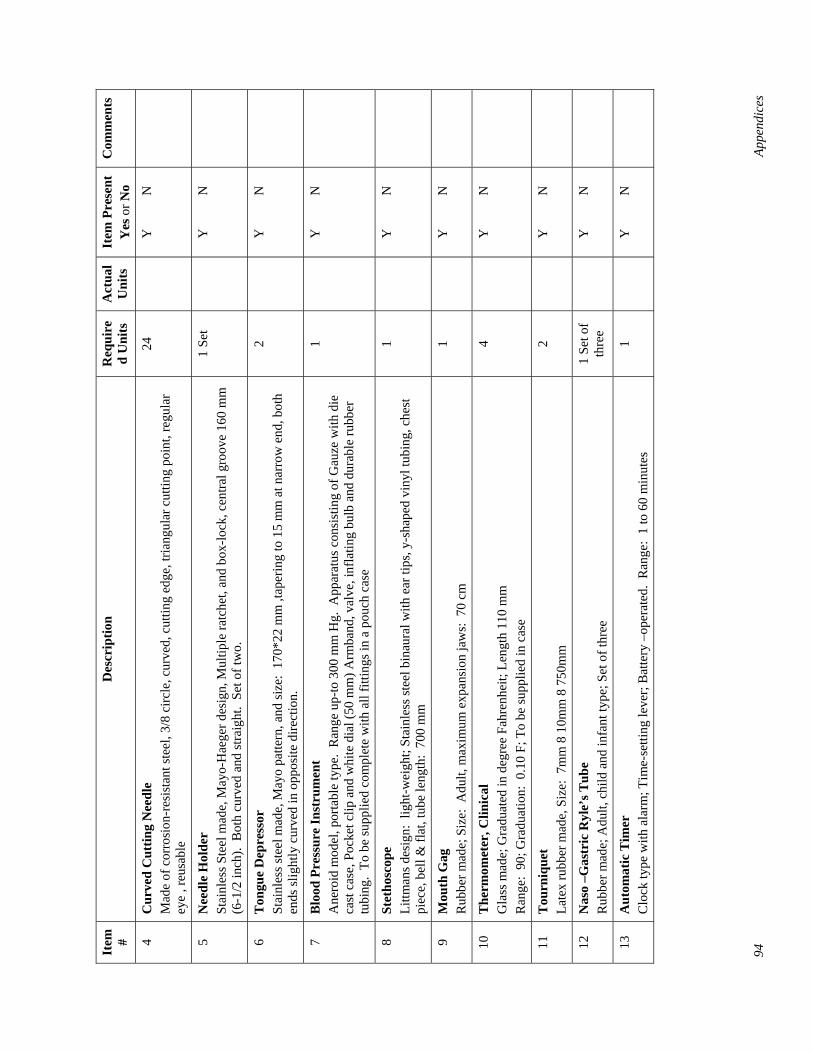
94
Appe
ndic
es
Item
#
Des
crip
tion
Req
uire
d U
nits
A
ctua
l U
nits
It
em P
rese
nt
Yes
or N
o C
omm
ents
4 C
urve
d C
uttin
g N
eedl
e M
ade
of c
orro
sion
-res
ista
nt st
eel,
3/8
circ
le, c
urve
d, c
uttin
g ed
ge, t
riang
ular
cut
ting
poin
t, re
gula
r ey
e , r
eusa
ble
24
Y
N
5 N
eedl
e H
olde
r St
ainl
ess S
teel
mad
e, M
ayo-
Hae
ger d
esig
n, M
ultip
le ra
tche
t, an
d bo
x-lo
ck, c
entra
l gro
ove
160
mm
(6
-1/2
inch
). B
oth
curv
ed a
nd st
raig
ht.
Set o
f tw
o.
1 Se
t
Y
N
6 T
ongu
e D
epre
ssor
St
ainl
ess s
teel
mad
e, M
ayo
patte
rn, a
nd si
ze:
170*
22 m
m ,t
aper
ing
to 1
5 m
m a
t nar
row
end
, bot
h en
ds sl
ight
ly c
urve
d in
opp
osite
dire
ctio
n.
2
Y
N
7 B
lood
Pre
ssur
e In
stru
men
t A
nero
id m
odel
, por
tabl
e ty
pe.
Ran
ge u
p-to
300
mm
Hg.
App
arat
us c
onsi
stin
g of
Gau
ze w
ith d
ie
cast
cas
e, P
ocke
t clip
and
whi
te d
ial (
50 m
m) A
rmba
nd, v
alve
, inf
latin
g bu
lb a
nd d
urab
le ru
bber
tu
bing
. To
be
supp
lied
com
plet
e w
ith a
ll fit
tings
in a
pou
ch c
ase
1
Y
N
8 St
etho
scop
e Li
ttman
s des
ign:
lig
ht-w
eigh
t; St
ainl
ess s
teel
bin
aura
l with
ear
tips
, y-s
hape
d vi
nyl t
ubin
g, c
hest
pi
ece,
bel
l & fl
at, t
ube
leng
th:
700
mm
1
Y
N
9 M
outh
Gag
R
ubbe
r mad
e; S
ize:
Adu
lt, m
axim
um e
xpan
sion
jaw
s: 7
0 cm
1
Y
N
10
The
rmom
eter
, Clin
ical
G
lass
mad
e; G
radu
ated
in d
egre
e Fa
hren
heit;
Len
gth
110
mm
R
ange
: 90
; Gra
duat
ion:
0.1
0 F;
To
be su
pplie
d in
cas
e
4
Y
N
11
Tou
rniq
uet
Late
x ru
bber
mad
e, S
ize:
7m
m 8
10m
m 8
750
mm
2
Y
N
12
Nas
o –G
astr
ic R
yle’
s Tub
e R
ubbe
r mad
e; A
dult,
chi
ld a
nd in
fant
type
; Set
of t
hree
1
Set o
f th
ree
Y
N
13
Aut
omat
ic T
imer
C
lock
type
with
ala
rm; T
ime-
setti
ng le
ver;
Bat
tery
–op
erat
ed.
Ran
ge:
1 to
60
min
utes
1
Y
N
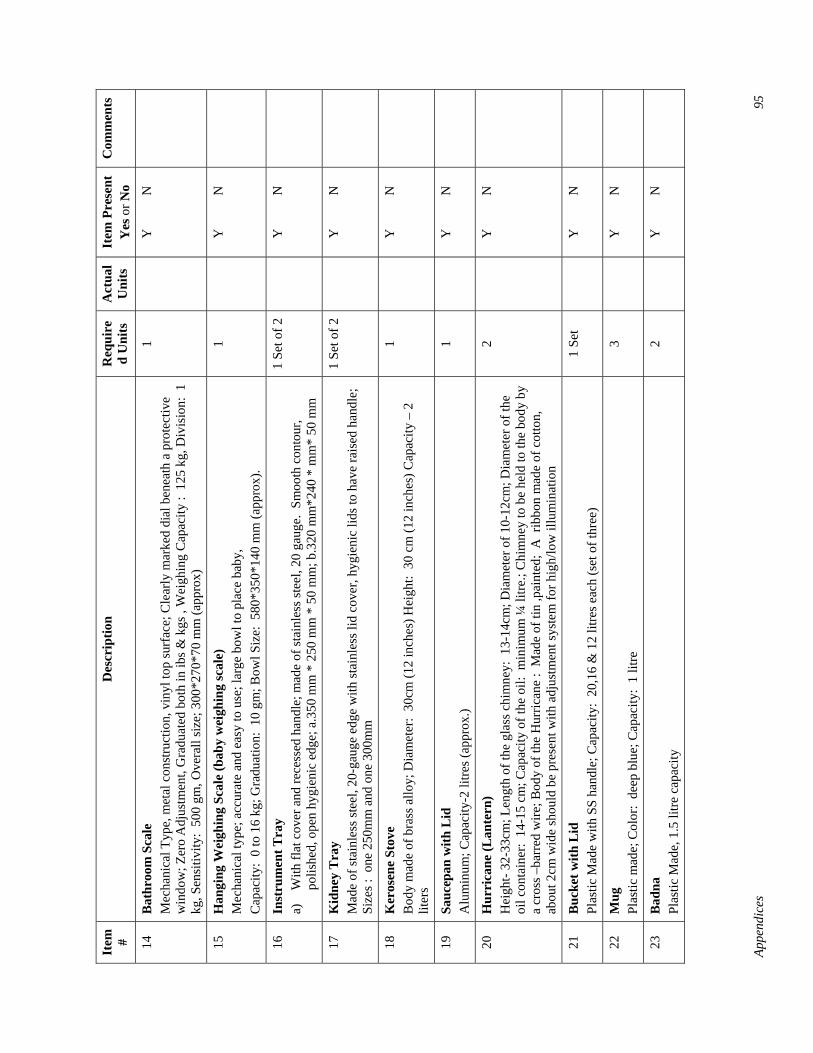
Appe
ndic
es
95
Item
#
Des
crip
tion
Req
uire
d U
nits
A
ctua
l U
nits
It
em P
rese
nt
Yes
or N
o C
omm
ents
14
Bat
hroo
m S
cale
M
echa
nica
l Typ
e, m
etal
con
stru
ctio
n, v
inyl
top
surf
ace;
Cle
arly
mar
ked
dial
ben
eath
a p
rote
ctiv
e w
indo
w; Z
ero
Adj
ustm
ent,
Gra
duat
ed b
oth
in ib
s & k
gs ,
Wei
ghin
g C
apac
ity :
125
kg,
Div
isio
n: 1
kg
, Sen
sitiv
ity:
500
gm, O
vera
ll si
ze; 3
00*2
70*7
0 m
m (a
ppro
x)
1
Y
N
15
Han
ging
Wei
ghin
g Sc
ale
(bab
y w
eigh
ing
scal
e)
Mec
hani
cal t
ype;
acc
urat
e an
d ea
sy to
use
; lar
ge b
owl t
o pl
ace
baby
, C
apac
ity:
0 to
16
kg; G
radu
atio
n: 1
0 gm
; Bow
l Siz
e: 5
80*3
50*1
40 m
m (a
ppro
x).
1
Y
N
16
Inst
rum
ent T
ray
a)
With
flat
cov
er a
nd re
cess
ed h
andl
e; m
ade
of st
ainl
ess s
teel
, 20
gaug
e. S
moo
th c
onto
ur,
polis
hed,
ope
n hy
gien
ic e
dge;
a.3
50 m
m *
250
mm
* 5
0 m
m; b
.320
mm
*240
* m
m*
50 m
m
1 Se
t of 2
Y
N
17
Kid
ney
Tra
y M
ade
of st
ainl
ess s
teel
, 20-
gaug
e ed
ge w
ith st
ainl
ess l
id c
over
, hyg
ieni
c lid
s to
have
rais
ed h
andl
e;
Size
s : o
ne 2
50m
m a
nd o
ne 3
00m
m
1 Se
t of 2
Y
N
18
Ker
osen
e St
ove
Bod
y m
ade
of b
rass
allo
y; D
iam
eter
: 30
cm (1
2 in
ches
) Hei
ght:
30
cm (1
2 in
ches
) Cap
acity
– 2
lit
ers
1
Y
N
19
Sauc
epan
with
Lid
A
lum
inum
; Cap
acity
-2 li
tres (
appr
ox.)
1
Y
N
20
Hur
rica
ne (L
ante
rn)
Hei
ght-
32-3
3cm
; Len
gth
of th
e gl
ass c
him
ney:
13-
14cm
; Dia
met
er o
f 10-
12cm
; Dia
met
er o
f the
oi
l con
tain
er:
14-1
5 cm
; Cap
acity
of t
he o
il: m
inim
um ¼
litre
.; C
him
ney
to b
e he
ld to
the
body
by
a cr
oss –
barr
ed w
ire; B
ody
of th
e H
urric
ane
: M
ade
of ti
n ,p
aint
ed;
A r
ibbo
n m
ade
of c
otto
n,
abou
t 2cm
wid
e sh
ould
be
pres
ent w
ith a
djus
tmen
t sys
tem
for h
igh/
low
illu
min
atio
n
2
Y
N
21
Buc
ket w
ith L
id
Plas
tic M
ade
with
SS
hand
le; C
apac
ity:
20,1
6 &
12
litre
s eac
h (s
et o
f thr
ee)
1 Se
t
Y
N
22
Mug
Pl
astic
mad
e; C
olor
: de
ep b
lue;
Cap
acity
: 1
litre
3
Y
N
23
Bad
na
Plas
tic M
ade,
1.5
litre
cap
acity
2
Y
N
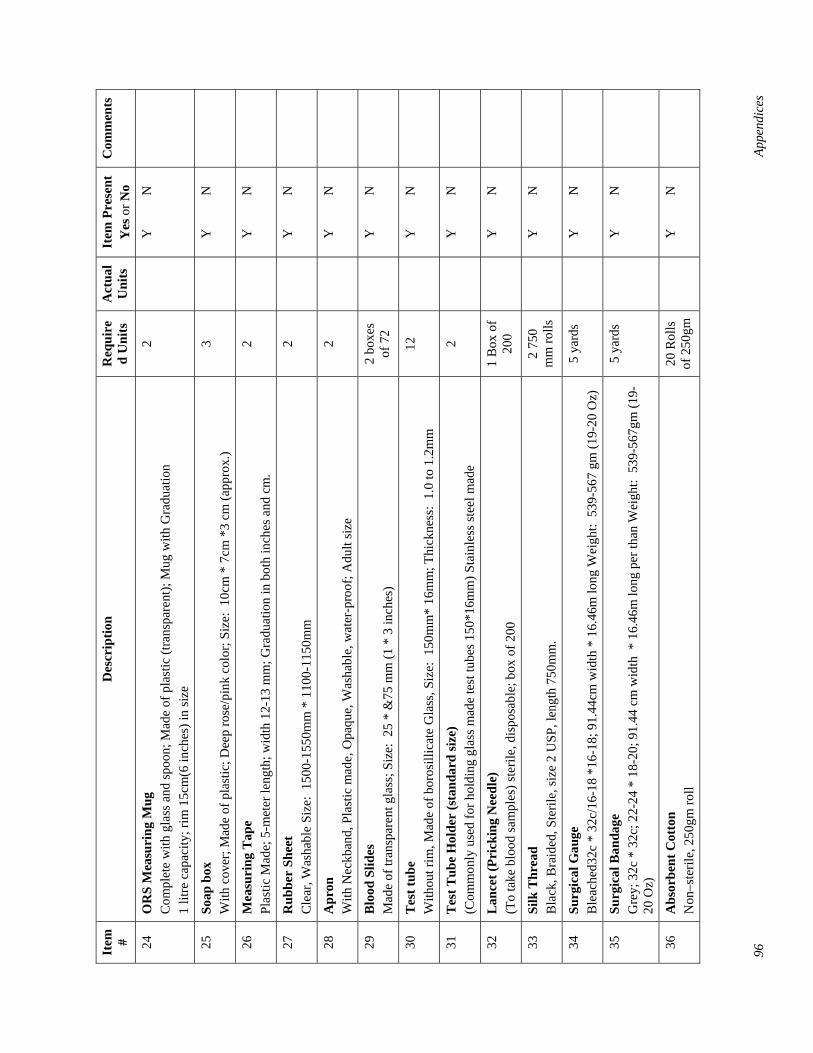
96
Appe
ndic
es
Item
#
Des
crip
tion
Req
uire
d U
nits
A
ctua
l U
nits
It
em P
rese
nt
Yes
or N
o C
omm
ents
24
OR
S M
easu
ring
Mug
C
ompl
ete
with
gla
ss a
nd sp
oon;
Mad
e of
pla
stic
(tra
nspa
rent
); M
ug w
ith G
radu
atio
n 1
litre
cap
acity
; rim
15c
m(6
inch
es) i
n si
ze
2
Y
N
25
Soap
box
W
ith c
over
; Mad
e of
pla
stic
; Dee
p ro
se/p
ink
colo
r; Si
ze:
10cm
* 7
cm *
3 cm
(app
rox.
) 3
Y
N
26
Mea
suri
ng T
ape
Plas
tic M
ade;
5-m
eter
leng
th; w
idth
12-
13 m
m; G
radu
atio
n in
bot
h in
ches
and
cm
. 2
Y
N
27
Rub
ber
Shee
t C
lear
, Was
habl
e Si
ze:
1500
-155
0mm
* 1
100-
1150
mm
2
Y
N
28
Apr
on
With
Nec
kban
d, P
last
ic m
ade,
Opa
que,
Was
habl
e, w
ater
-pro
of; A
dult
size
2
Y
N
29
Blo
od S
lides
M
ade
of tr
ansp
aren
t gla
ss; S
ize:
25
* &
75 m
m (1
* 3
inch
es)
2 bo
xes
of 7
2
Y
N
30
Tes
t tub
e W
ithou
t rim
, Mad
e of
bor
osill
icat
e G
lass
, Siz
e: 1
50m
m*
16m
m; T
hick
ness
: 1.
0 to
1.2
mm
12
Y
N
31
Tes
t Tub
e H
olde
r (s
tand
ard
size
) (C
omm
only
use
d fo
r hol
ding
gla
ss m
ade
test
tube
s 150
*16m
m) S
tain
less
stee
l mad
e 2
Y
N
32
Lan
cet (
Pric
king
Nee
dle)
(T
o ta
ke b
lood
sam
ples
) ste
rile,
dis
posa
ble;
box
of 2
00
1 B
ox o
f 20
0
Y
N
33
Silk
Thr
ead
Bla
ck, B
raid
ed, S
teril
e, si
ze 2
USP
, len
gth
750m
m.
2 75
0 m
m ro
lls
Y
N
34
Surg
ical
Gau
ge
Ble
ache
d32c
* 3
2c/1
6-18
*16
-18;
91.
44cm
wid
th *
16.
46m
long
Wei
ght:
539
-567
gm
(19-
20 O
z)
5 ya
rds
Y
N
35
Surg
ical
Ban
dage
G
rey;
32c
* 3
2c; 2
2-24
* 1
8-20
; 91.
44 c
m w
idth
* 1
6.46
m lo
ng p
er th
an W
eigh
t: 5
39-5
67gm
(19-
20 O
z)
5 ya
rds
Y
N
36
Abs
orbe
nt C
otto
n N
on–s
teril
e, 2
50gm
roll
20 R
olls
of
250
gm
Y
N
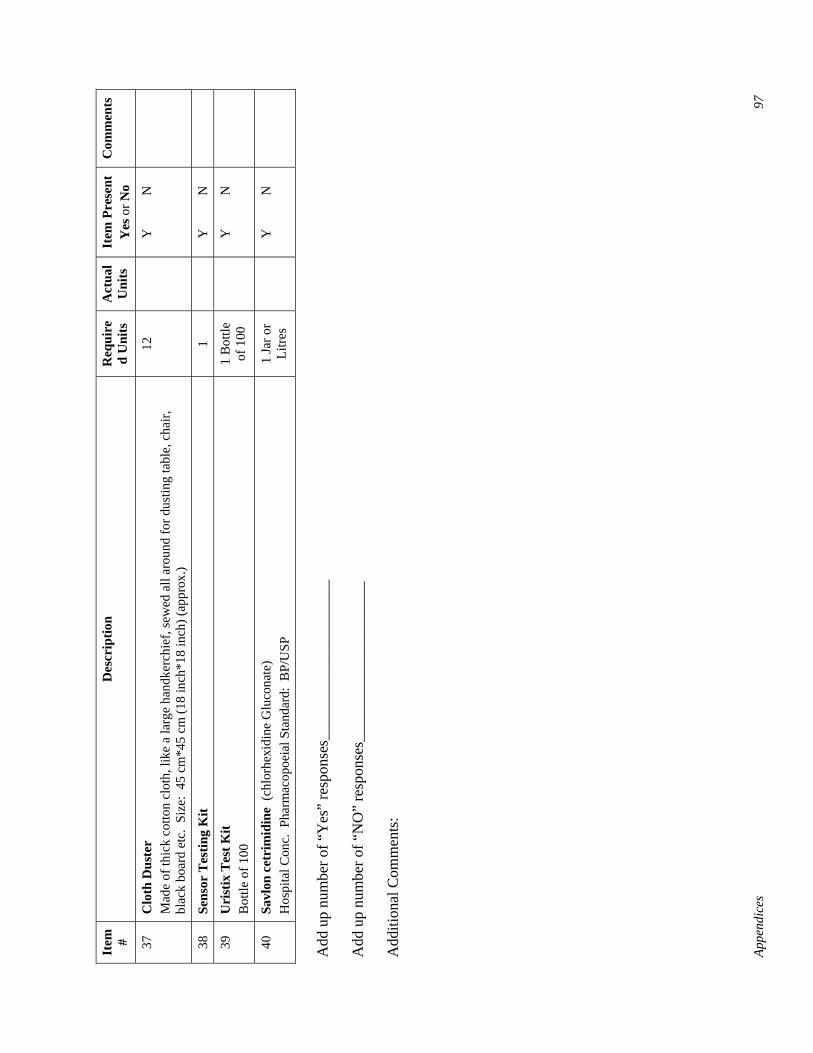
Appe
ndic
es
97
Item
#
Des
crip
tion
Req
uire
d U
nits
A
ctua
l U
nits
It
em P
rese
nt
Yes
or N
o C
omm
ents
37
Clo
th D
uste
r M
ade
of th
ick
cotto
n cl
oth,
like
a la
rge
hand
kerc
hief
, sew
ed a
ll ar
ound
for d
ustin
g ta
ble,
cha
ir,
blac
k bo
ard
etc.
Siz
e: 4
5 cm
*45
cm (1
8 in
ch*1
8 in
ch) (
appr
ox.)
12
Y
N
38
Sens
or T
estin
g K
it 1
Y
N
39
Uri
stix
Tes
t Kit
Bot
tle o
f 100
1
Bot
tle
of 1
00
Y
N
40
Savl
on c
etri
mid
ine
(chl
orhe
xidi
ne G
luco
nate
) H
ospi
tal C
onc.
Pha
rmac
opoe
ial S
tand
ard:
BP/
USP
1
Jar o
r Li
tres
Y
N
Add
up
num
ber o
f “Y
es”
resp
onse
s___
____
____
____
____
__
Add
up
num
ber o
f “N
O”
resp
onse
s___
____
____
____
____
__
Add
ition
al C
omm
ents
:


Appendices 99
Appendix E: Workplan of ESP-ISP Baseline Survey Data Collection
Team A Source of team members Activities to cover Date Chittagong
Division Central DTCC DUTT FWVT
I/RTC
Place of visit DTCC DUTT CC
22nd Feb
Subteam-1 2 1 1 B. Baria CS/DDFP Office & Sadar UHC
2 2 2
Subteam-2 2 2 Kashba UHC 2 2 Subteam-3 2 2 Akhaura UHC 2 2
24th Feb
Subteam-1 2 1 1 B. Baria Sadar UHC 3
Subteam-2 2 2 Kashba UHC 2 Subteam-3 2 2 Akhaura UHC 2
27th Feb
Subteam-1 2 1 1 Feni CS/DDFP office & Sadar UHC
2 2 2
Subteam-2 2 2 Sonagazi UHC 2 2
Subteam-3 2 2 Sonagazi UHC 2
28th Feb
Subteam-1 2 1 1 Feni Sadar UHC 3
Subteam-2 2 1 1 Feni Sadar UHC 2
Subteam-3 2 2 Sonagazi UHC 2
1st March
Subteam-1 2 Chittagong CS & DDFP office
2
Subteam-2 2 2 Anwara UHC 2 2
Subteam-3 2 2 1 Sitakund UHC 2 2
3rd March
Subteam-1 2 2 Anwara UHC 2
Subteam-2 2 2 1 Sitakund UHC 2
Subteam-3 2 2 Hathazari UHC 2 2
14th March
Subteam-1 2 2 Hathazari UHC 2
Subteam-2 2 2 Rangunia UHC 2 2
Subteam-3 2 2 Rangunia UHC 2
15th March
Subteam-1 2 1 2 Rangamati CS/DDFP office & Sadar UHC
2 2 2
Subteam-2 2 1 1 Kaptai UHC 2 2 Subteam-3 2 1 1 Nannerchar UHC 2 2
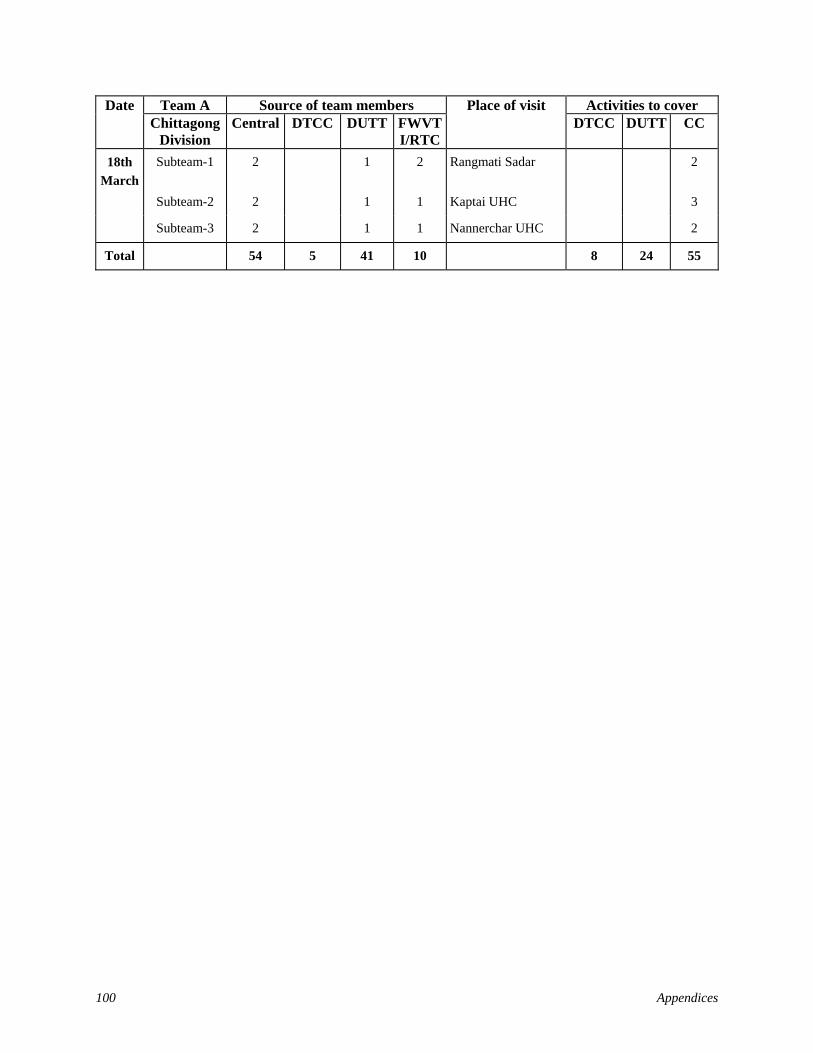
100 Appendices
Team A Source of team members Activities to cover Date Chittagong
Division Central DTCC DUTT FWVT
I/RTC
Place of visit DTCC DUTT CC
18th March
Subteam-1 2 1 2 Rangmati Sadar 2
Subteam-2 2 1 1 Kaptai UHC 3
Subteam-3 2 1 1 Nannerchar UHC 2
Total 54 5 41 10 8 24 55

Appendices 101
Workplan of Team B for Baseline Survey of In-Service Training
Team B Source of team members Place of visit Activities to cover Date Chittagong
Division Central DTCC DUTT FWVT
I/RTC DTCC DUTT CC
24th March
Subteam-1 2 1 1 Panchagor CS/DDFP office
& Sadar UHC
2 2 2
Subteam-2 2 1 Boda UHC 2 2 Subteam-3 2 2 Boda UHC 3
25th March
Subteam-1 2 1 1 Panchagor Sadar 3
Subteam-2 2 1 Boda UHC 2 Subteam-3 2 2 Panchagor Sadar 3
27th March
Subteam-1 2 1 1 1 Dinajpur CS/DDFP office &
Sadar UHC
2 2 2
Subteam-2 2 2 1 Chirrirbandar UHC 2 2 Subteam-3 2 1 2 1 Birganj UHC 2 3
28th March
Subteam-1 2 1 1 1 Dinajpur Sadar UHC 3
Subteam-2 2 2 1 Chirrirbandar UHC 3 Subteam-3 2 1 2 1 Kaharol UHC 2 3
29th March
Subteam-1 2 1 2 2 Sirajgonj CS/DDFP office &
Raigonj UHC
2 2 2
Subteam-2 2 2 Kamarkhand UHC 2 2 Subteam-3 2 3 Belkuchi UHC 2
31st March
Subteam-1 2 1 2 2 Raigonj UHC 3
Subteam-2 2 2 Kamarkhand UHC 3 Subteam-3 2 3 Belkuchi UHC 3
7th April
Subteam-1 2 1 2 1 Rajshahi CS/DDFP office &
Paba UHC
2 2 2
Subteam-2 2 2 1 Mohanpur UHC 2 2 Subteam-3 2 2 1 Bagmara UHC 2 2
8th April
Subteam-1 2 1 2 1 Paba UHC 3
Subteam-2 2 2 1 Mohanpur UHC 3 Subteam-3 2 2 1 Bagmara UHC 3
Total 48 10 44 16 8 22 61
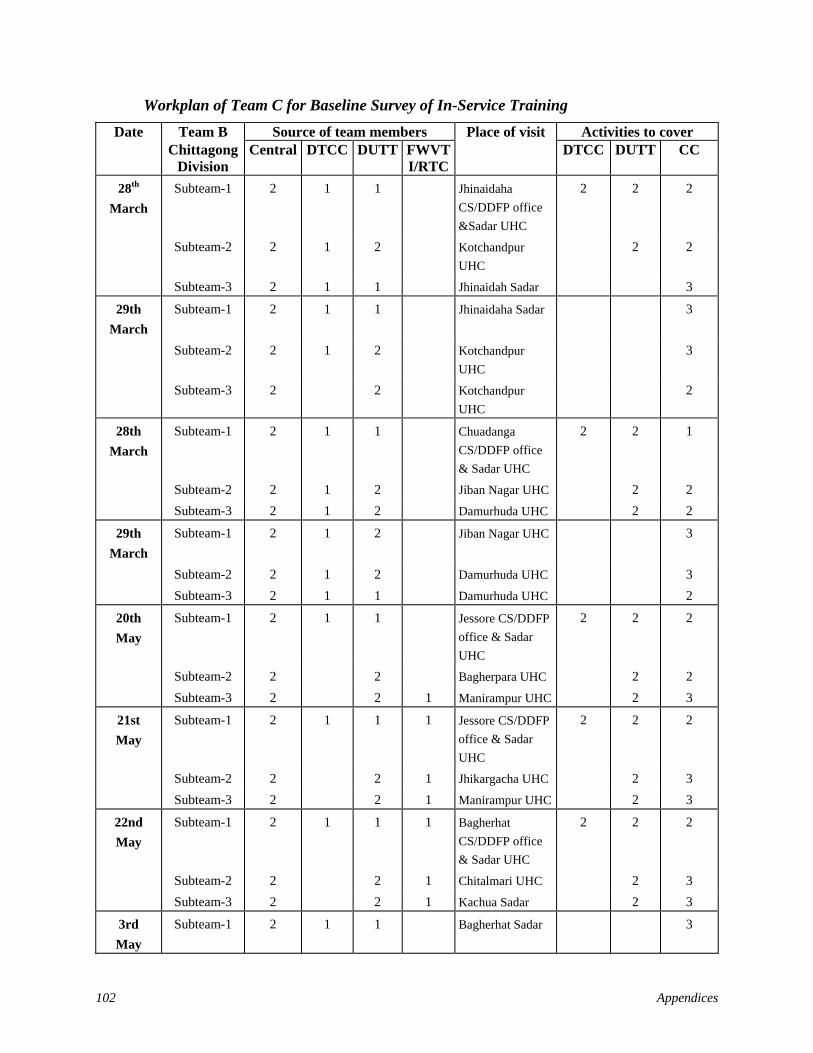
102 Appendices
Workplan of Team C for Baseline Survey of In-Service Training
Team B Source of team members Place of visit Activities to cover Date Chittagong
Division Central DTCC DUTT FWVT
I/RTC DTCC DUTT CC
28th March
Subteam-1 2 1 1 Jhinaidaha CS/DDFP office &Sadar UHC
2 2 2
Subteam-2 2 1 2 Kotchandpur UHC
2 2
Subteam-3 2 1 1 Jhinaidah Sadar 3
29th March
Subteam-1 2 1 1 Jhinaidaha Sadar 3
Subteam-2 2 1 2 Kotchandpur UHC
3
Subteam-3 2 2 Kotchandpur UHC
2
28th March
Subteam-1 2 1 1 Chuadanga CS/DDFP office & Sadar UHC
2 2 1
Subteam-2 2 1 2 Jiban Nagar UHC 2 2 Subteam-3 2 1 2 Damurhuda UHC 2 2
29th March
Subteam-1 2 1 2 Jiban Nagar UHC 3
Subteam-2 2 1 2 Damurhuda UHC 3 Subteam-3 2 1 1 Damurhuda UHC 2
20th May
Subteam-1 2 1 1 Jessore CS/DDFP office & Sadar UHC
2 2 2
Subteam-2 2 2 Bagherpara UHC 2 2 Subteam-3 2 2 1 Manirampur UHC 2 3
21st May
Subteam-1 2 1 1 1 Jessore CS/DDFP office & Sadar UHC
2 2 2
Subteam-2 2 2 1 Jhikargacha UHC 2 3 Subteam-3 2 2 1 Manirampur UHC 2 3
22nd May
Subteam-1 2 1 1 1 Bagherhat CS/DDFP office & Sadar UHC
2 2 2
Subteam-2 2 2 1 Chitalmari UHC 2 3 Subteam-3 2 2 1 Kachua Sadar 2 3
3rd May
Subteam-1 2 1 1 Bagherhat Sadar 3
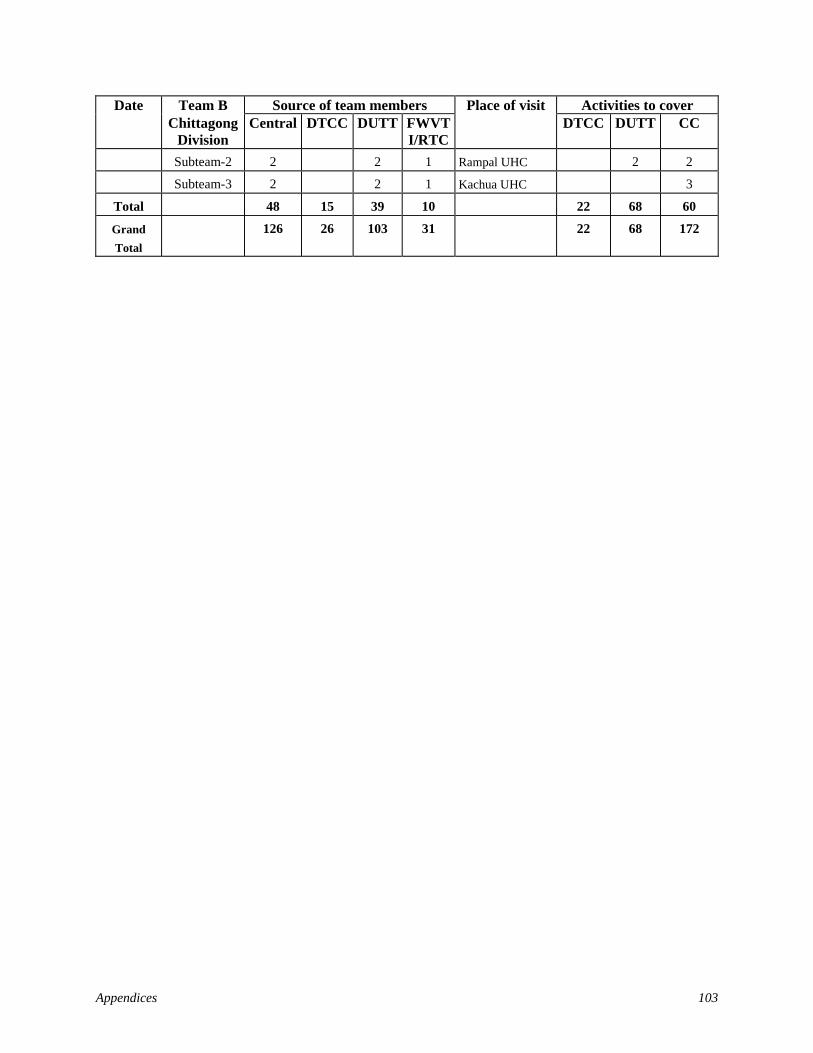
Appendices 103
Team B Source of team members Place of visit Activities to cover Date Chittagong
Division Central DTCC DUTT FWVT
I/RTC DTCC DUTT CC
Subteam-2 2 2 1 Rampal UHC 2 2
Subteam-3 2 2 1 Kachua UHC 3
Total 48 15 39 10 22 68 60
Grand Total
126 26 103 31 22 68 172
Related Documents


