Primary Source Analysis Portuguese population 1961-2003, in thousands, (2005 Data from FAO ) with emigration giving way to retornados , [2] [3] ranging from 500,000 to 1 million after the revolution.

Primary Source Analysis
Dec 31, 2015
Primary Source Analysis. Portuguese population 1961-2003, in thousands, (2005 Data from FAO ) with emigration giving way to retornados , [2] [3] ranging from 500,000 to 1 million after the revolution. Decolonization and its impact. Mr. Cruz, AC Flora High School. - PowerPoint PPT Presentation
Welcome message from author
This document is posted to help you gain knowledge. Please leave a comment to let me know what you think about it! Share it to your friends and learn new things together.
Transcript

Primary Source Analysis
Portuguese population 1961-2003, in thousands, (2005 Data from FAO) with emigration giving way to retornados,[2][3]ranging from 500,000 to 1 million after the revolution.

DECOLONIZATION AND ITS IMPACTMr. Cruz, AC Flora High School

Means to Independence: Armed
Colonies seek independence by force
International support is needed for weapons
Usually lasted longer than negotiated independence
Long lasting issues

Means to Independence: Armed
Angola 1960’s: Soviet
influenced Guerillas fight Portugal
1974: Portuguese gov’t is overthrown by Portuguese citizens
1975: New government grants independence to Portuguese imperial possessions
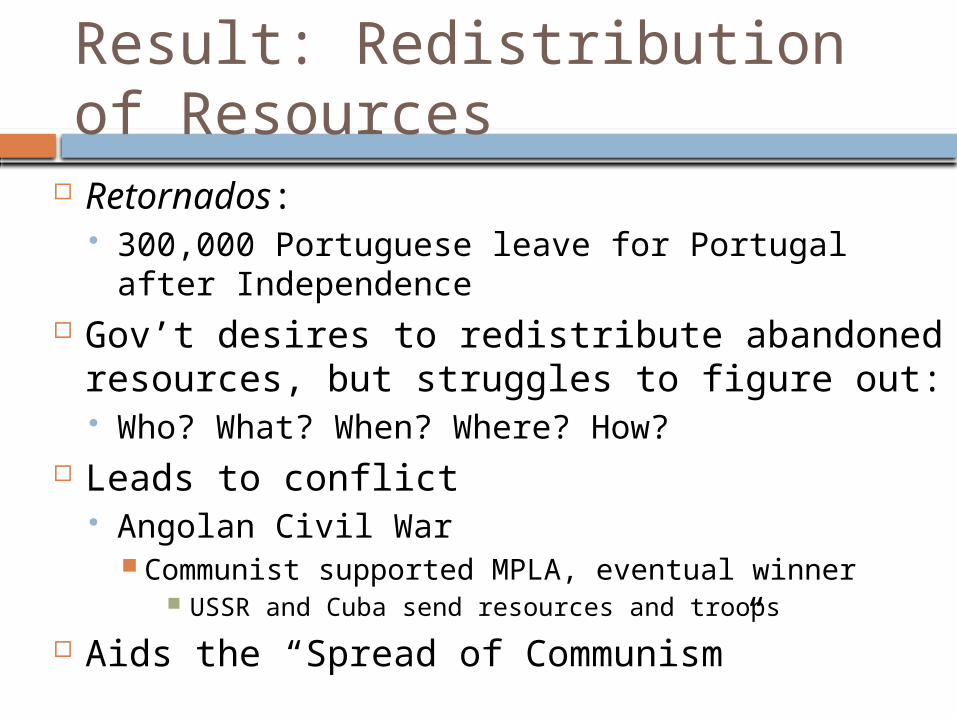
Result: Redistribution of Resources
Retornados: 300,000 Portuguese leave for Portugal after
Independence Gov’t desires to redistribute abandoned
resources, but struggles to figure out: Who? What? When? Where? How?
Leads to conflict Angolan Civil War
Communist supported MPLA, eventual winner USSR and Cuba send resources and troops
Aids the “Spread of Communism”


Result: Transnational Movements Communism Pan-Arabism Pan-Africanism
“African peoples both on the continent and in the Diaspora, share not merely a common history, but a common destiny”

Pan-Africanism
Organization of African Unity / African Union Achieve greater unity
and solidarity between African countries and the peoples of Africa
Defend the sovereignty, territorial integrity and independence of its Member States

Result: Population Resettlement

Result: Population Resettlement (cont’d)

Result: Population Resettlement
Redrawing of Colonial boundaries Imposed boundaries Ex: India/Pakistan
Religious-based Partition
Hindus persecuted in Pakistan
(20%-1945, 1%-2003) Muslims persecuted in
India Forced migration

Result: Colonial Subject Migration Imperial powers view lax migration laws
as a form of apology to former colonies Algeria to France (After 1962) – Evian
Accord Seeking a “Better Life” Maintain family ties Fear of internal conflicts in Algeria
French Reaction is negative, but committed to Post-Colonial “Obligations”

Result: Colonial Subject Migration
DO NOT WRITE THIS!
Zinedine Zidane French National
Soccer Team Member
Parents were from Aguemoune Ath Slimane, Algeria
2006 World Cup Final

Regional, Religious, and Ethnic Movements
Nigeria Biafra

Contemporary Map of Nigeria (1)
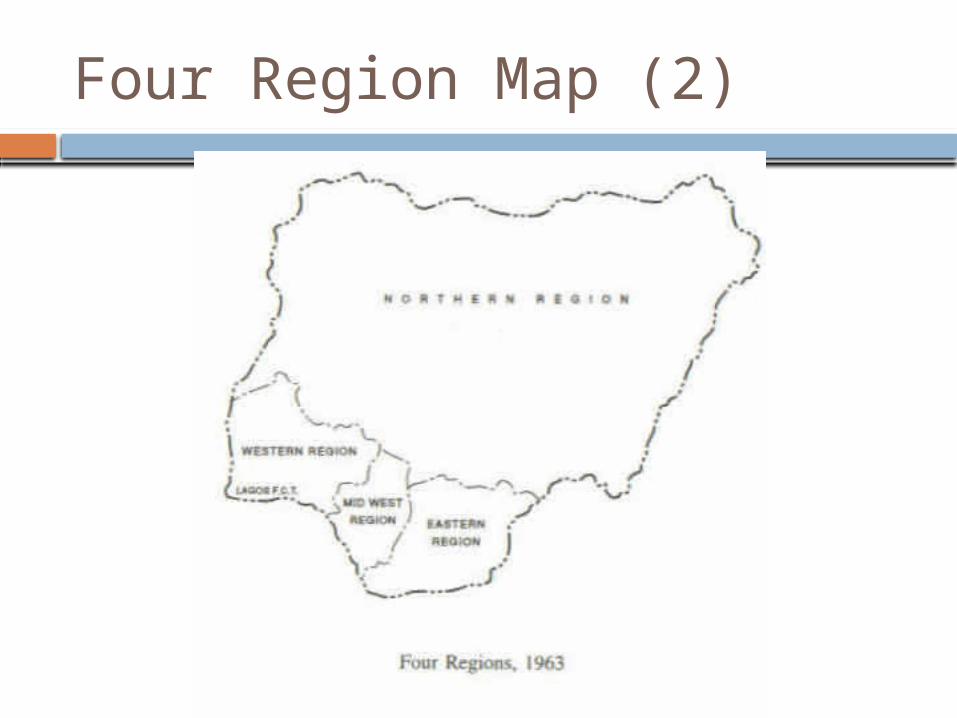
Four Region Map (2)

Ethnic Diversity (3)
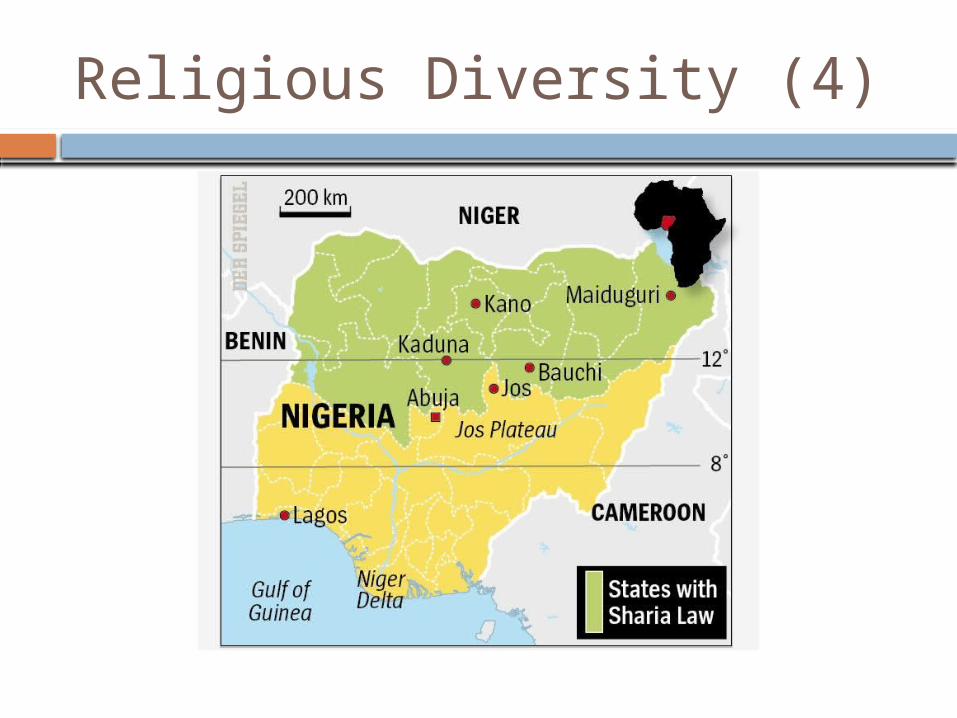
Religious Diversity (4)
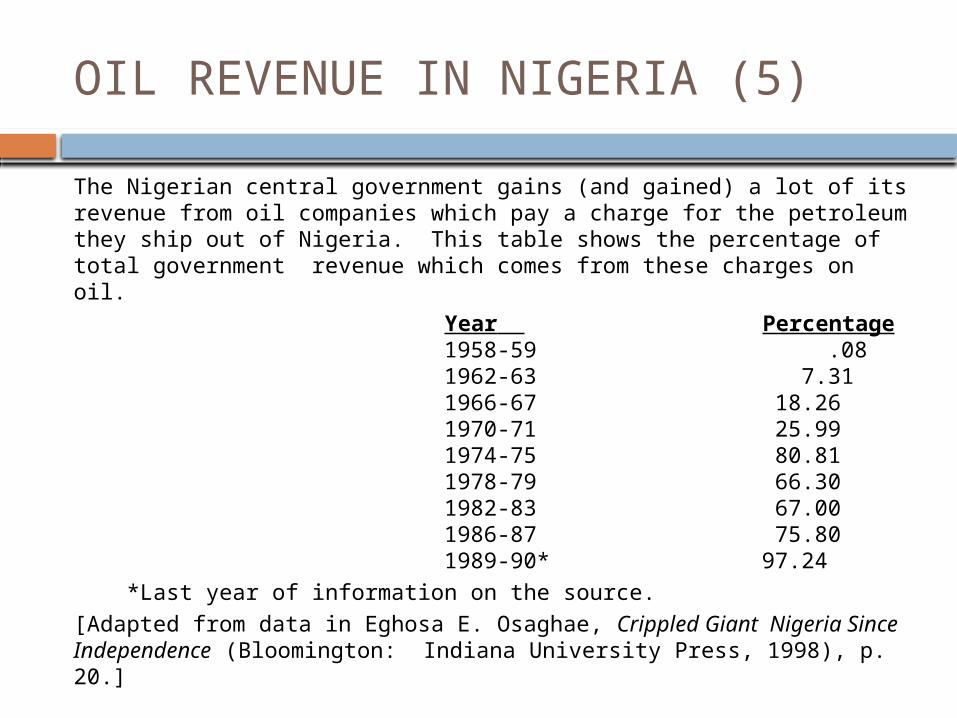
OIL REVENUE IN NIGERIA (5)
The Nigerian central government gains (and gained) a lot of its revenue from oil companies which pay a charge for the petroleum they ship out of Nigeria. This table shows the percentage of total government revenue which comes from these charges on oil. Year Percentage 1958-59 .08 1962-63 7.31 1966-67 18.26 1970-71 25.99 1974-75 80.81 1978-79 66.30 1982-83 67.00 1986-87 75.80 1989-90* 97.24 *Last year of information on the source. [Adapted from data in Eghosa E. Osaghae, Crippled Giant Nigeria Since Independence (Bloomington: Indiana University Press, 1998), p. 20.]

www.ethnologue.com/statistics/country
Ethnolinguistic Diversity (6)
Living Languages Number of Speakers
Country Count
Percent
Indigenous
Immigrant
Total Mean Median
Nigeria 529 7.45 522 7 104,138,885
216,056
13,000
USA 420 5.91 214 206 278,640,074
787,119
440
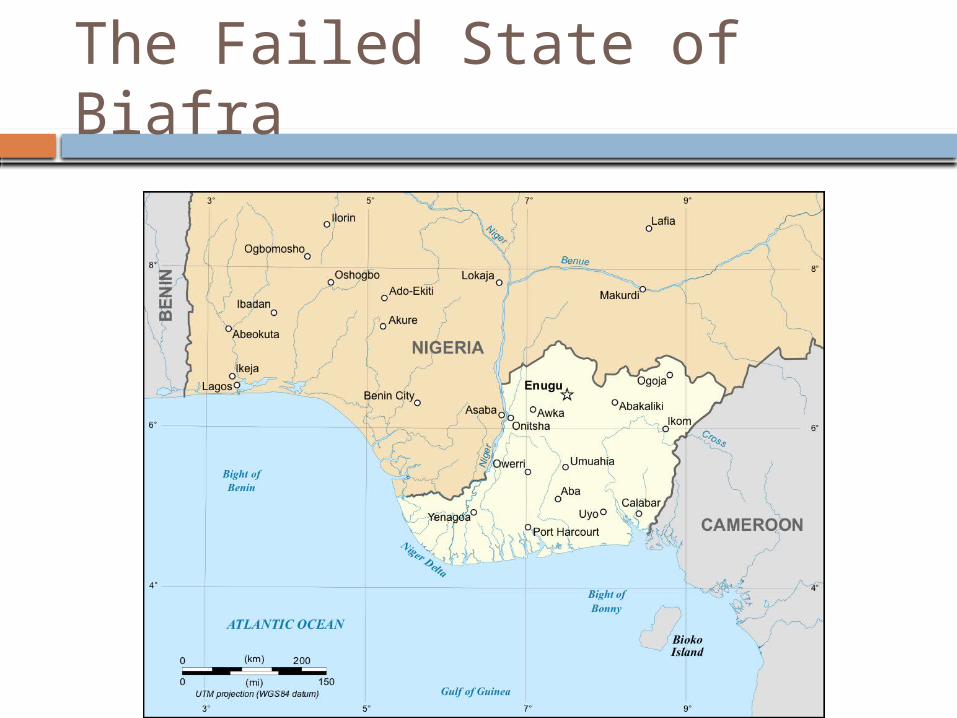
The Failed State of Biafra

Prompt (answer on your own) How did regional, religious, and ethnic
differences challenge the inherited imperial boundaries in Nigeria?
http://www.bbc.co.uk/news/world-africa-20808106
Related Documents


![Primary versus secondary source of data in observational ... · studies) in the analysis of the heterogeneity of a meta-analysis [43, 44], the type of data source (primary vs secondary)](https://static.cupdf.com/doc/110x72/5f920ae443201e447f1fa7fe/primary-versus-secondary-source-of-data-in-observational-studies-in-the-analysis.jpg)