Series-20 1f1'ld qft 2001 CENSUS OF INDIA 2001 WEST BENGAL tlTellll Cf) \i1.-- J I 0 l.-:t I 'li 1'( Primary Census Abstract GFt tiiBlll : ':fI'RUfi cp-5 tiQ:llfld \11 .... '"6lI1 : Cfi-6, ihH Gi .... tf6ll1 : 'ffNlJft Cfi-7 Volume-I Total Population: Table A-5 Institutional Population : Table A-6, Houseless Population : Table A-7 \11"11101"'11 Directorate of Census Operations, West Bengal

Welcome message from author
This document is posted to help you gain knowledge. Please leave a comment to let me know what you think about it! Share it to your friends and learn new things together.
Transcript
~-20
Series-20
~-1f1'ld qft \iI~"lolor:tl 2001
CENSUS OF INDIA 2001
q~",,~
WEST BENGAL
tlTellll Cf) \i1.-- J I 0 l.-:t I 'li 1'( Primary Census Abstract
~-I
~ GFt tiiBlll : ':fI'RUfi cp-5
tiQ:llfld \11 .... '"6lI1 : ~ Cfi-6, ihH Gi .... tf6ll1 : 'ffNlJft Cfi-7
Volume-I Total Population: Table A-5
Institutional Population : Table A-6, Houseless Population : Table A-7
\11"11101"'11 f.)~lillcl~, ~ ~ Directorate of Census Operations, West Bengal
Data Product Number
19-012-2001-Cen-Book
1OI'tdlq"ll ........................................................................................................................... v-vi
~ ............................................................................................................................ ix
~ l[CI> ~ it ........................................................................................................... xii-xxi
YICfCb;zj;;Y ..................................................................................................................... xxiii-xxv
~ \J1"1'I UI"lJ fiep6'Q"IIQ -qct qR ... ltnQ ............................................................................. xxvii-xxxv
~-~ FcI:tlttdlQ ................................................................................................... xxxvii-xli
f4~~'l UII<;'i'jep f4<1;;:fi'lloqj ................................................................................................. Ixiii-Ixxvii
~ ................ , .......................................................................................................... Ixxix
~ - if) 5: ¥ Ui'1iEiMI ............................................................................................... 1-269 cp 5 - ~ \J1"'jtiO(§Q1 '<PT ~ ~ \J1"1'I UI91 ~ : 2001 ......................................... 3-12 q;- 5 - WR Gl .... ti&ll '<PT R>tm Wl;zj('qq; Gl"l'IOI"l1 ~ : 2001 ...................................... 13-197 cp 5 - ¥ \J1 .... fiO(§Q1 '<PT ~ ID~~ep \Ol1"1'IUI"I1 'fIN : 2001 ................................. 198-269
~ - if) 6 : :fl'tl!lliid ut'1:fl&:lI ..................................................................................... 271-282 cp 6 - ti'('%!lllid GJ .... ti'<§lOll '<PT ~ ~ \J1"1' I U I .... 1 ~ : 200; ............................... 273-282
~ - if) 7 : ~ uF1it'i6ll1 .......................................................................................... 283-294 q; 7 -~ "1"1ti&l1 '<PT ~ 1l1~~q; "1'1'1 0 1'11 mx : 2001 .................................... 285-294
3("jci..,'Iq; ............................................................................................................ 295-364
311ct'''Iq; Iq;-~ I~ ~ 31~d ~ ~ 31~d Gj'1GjIRlotiT ~ ~ ............... 297-359 311ct h jq;- II ~ ~ .................................................................................... 361-362
iii
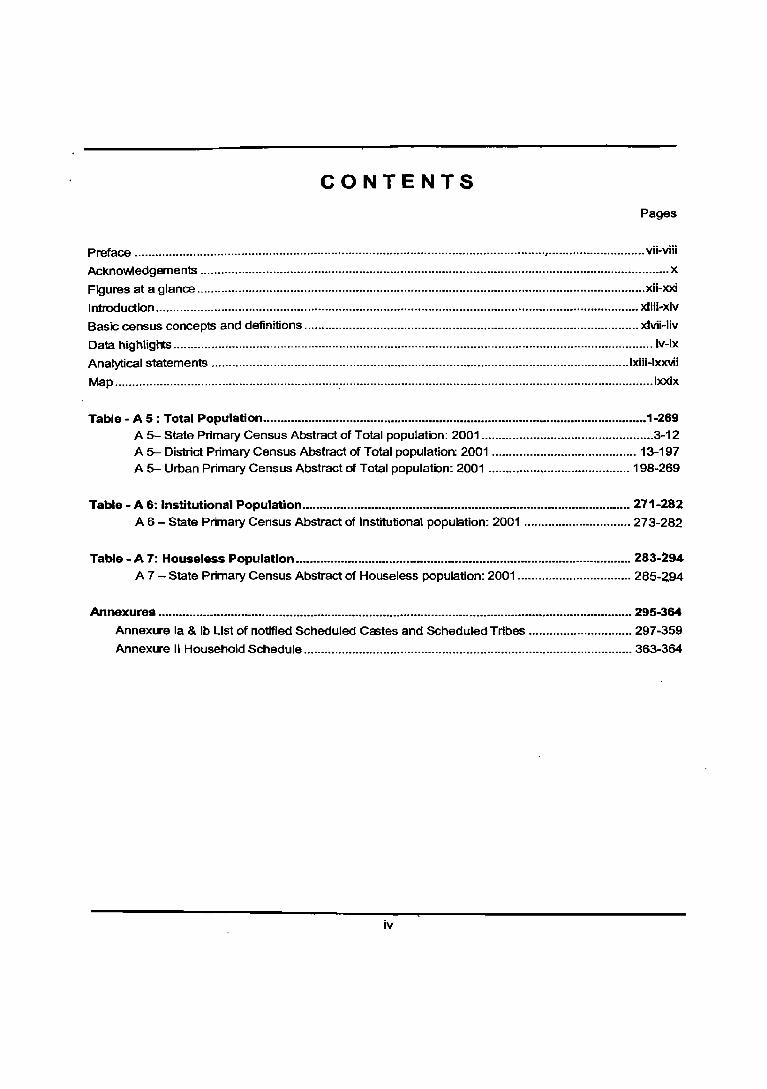
CONTENTS
Pages
Preface ....................................................................................................................... , ...........•................ vii-viii
Acknowledgements .....................................................................................•...........•.......•....•...........•............. x
Figures at a glance .................................................................................................................................. xii-xxi
Introduction ............................................................................................................................................ xliii-xlv
Basic census concepts and defiflitions ................................................................................................. xlvii-liv
Data highligl"ts ........................................................................................................................................... Iv-Ix
Analytical statements ......................................................................................................................... Ixiii-Ixxvii
Map ................................................................. : .......................................................................................... Ixxix
Table - A 5: Total population ............................................................................................................... 1-269 A 5- State Primary Census Abstract of Total populatbn: 2001 .................................................. 3-12 A 5- District Primary Census Abstract of Total population: 2001 .......................................... 13-197 A 5- Urban Primary Census Abstract of Total population: 2001 ......................................... 198-269
Table - A 6: Institutional Population .......................................................... _ ................................... 271-282 A 6 - State Primary Census Abstract of Institutional population: 2001 ............................... 273-282
Table - A 7: Houseless Population ................................................................................................. 283-294 A 7 - State Primary Census Abstract of Houseless population: 2001 ................................. 285-294
Annexure • ......................................................................................................................................... 295-364
Annexure la & Ib List of notified Scheduled Castes and Scheduled Tribes .............................. 297-359
Annexlre II Household Schedule ............................................................................................... 363-364
iv
JI fflICJ "11
~~ ~ ~ ~ 'N. \JI .... ti~1 ~ 3lf.Wr ~ 3ftx ~ ~ ~ 'JI'l'«l. qft \JI""I~I""I. 2001 qft -<·\JI .... ti(§ll1 ~ TfUAT ~ ~ "4 ~ ~ ~ 1'flUm xt ~ <f1{ ql'RIi4Cf> ~ ~ ~. ~ 3fR ttl x uflCf>,< UI ~ 311E1IRI;1 t I '+IRQ cCr \JI ..... lul"ll. 2001 ~ Ull4ftlCf> \JI ..... lul .... 1 ~ -<t» ~ Cff5 xt Cf>;qcx
~ ~ fct>zrr 'flIT t-~ 8Iili<t> .... (Scanning) c), ~ ~ ~ ~ ~ ~ '('qtjl~ct u141Q~ ;ff ~ "114f4Cf> \JI'i'1 ul .... 1 ~ cpt tiCf>~1;1 ~ <PI CPJ<f ~ ~ I 1991 qft \JI""!'IUI"'i1 ~ \JI"'iti(§ll1 ~ 31f.trq ~ atR ~ ~ cpt ~ '4"I •• )R;JCf> ~. ~ ~ tR TftcrJ.t"rR ~ \JI"'i 'I Ol"'i 1 ~ cmn UffilT ~. ~ tiCflR;Jct ~ q>[ <wf ~ '~1I'<UflCflxUI c15l<JfCit"l1 ~ Cf>A<l!p<1 qft ~ ~ orIR ~ ~ fimrr ~ 1411 ~ t1l'<uflCf>,!ul Cf>14[Citlll ~ \@If4Cf> "1'1'1 0 1'11 "(lR ~ ~ <1ft fl81'ljqJ ~ ~ (Extract) ~ ~ &f:;IT ~ TJiq ~ 3ftx ~ ~ ~ ";:f"lR/crrt ~ tR ~ fcf>m TflIT 1411 ~ ~ \JI"'I'IOI"l1
2001 c), ~ ~ fcInr 'N ~ ~ ~ ~ em ~ ~ ~ ~ ~ ~El)flJ<6l;q 4Rqd""!
~ ~ mf<p ~ ~ 'JI'l'«l qft \JI"'i.lol ..... l. 2001 ~ ~ em ~ ~ xt Cf>A2{ct'[ lR titll!?lct f<f;<rr \ill ~I ~ "l<fFr ~ElWIc6l ~fGlcCit ~ aIR ~eC'11~C ~ RCf>I~~I .... (Digital Imaging and Intelligent Character Recognition) <lIT ~J5fUT ~ ~ ~ m ~ !>Ih'lRt'1 ~ <fT1'T xt ~ ~ lR VJRT \ifTOT ~I .~ ~ \iJ'1'IOHI "4 ~ ~ ~ ~ em ~-~ 3mlN lR ~ ~ ~ 31f1I'C1I,<°1 m -<t». 't1lf>clctl,!4ct> fcf;m ..,-;q-r ~ ~ it \JI ..... IOI .... I cp;ffi ~ ~ YJ)-nc:nlll"f ~ ~ ~ ~ 1TIln3lT "4 ~ ;ff ~ 11if f4q'l(oll~Cf> 1iCIT cCr mm em <t>A2{cx ~ ~ ~. ~ <lIT ~ ~ fcf>m ~ I
1991 "4 ~ \@If4Cf> \JI'1'IOI .... 1 '{'IN em ~ \JI .... ti&f1 ~ W Q6Q >RWJ f$<:rr TfllT 141 ~ . \JI ...... I0I"II 2001 it ~ cp ~ ~ ~ if ~ fcf;m 'flIT ~ ~ if m~ \JI .... '1 0 1 .... I ~ cCr cp-5 ~ cp-9 ~ (11'1!fTJl"Ii ~ ~ ~ ~ I ~ tllxfTJllli if ~ \JI .... OJ;i&:l1 (cp-5) , ~ \Jli"1 ti&:l I (cp-6) , m \JI .... ti&f1 (cp-7). 31mfad ~ qft \JI"lti(§lll (cp-8) ~ 311tjfi1l;"1 \JI'1\J1IR1<fi ~ \J1'"lti(§ll1 (cp-9) cCr ~ ~3if em <rntm TflIT ~ I pc1" \JI'1ti'L«lI1 ~ ~ \JI"'i IIOI'11 "<iR it~. ~Cit4Rql'l( ~ \JI .... x4(§1lI.
0-6 3Il<J, ~ qft \Jl"lti'l:§!II, 3l~t1 ~ qft \Jl"lti(§lli. 3lj~fad \Jl"1\J1lf?1d'i qft \J1'"1ti(§lll, ffilffX", pc1"
cp<ff 3l'R ~ <P'ff, cfl qCf> I R:t Cf> ~ 31 CA <61 ~ <6 ~ qft 'LfR ~ tilfll Cf> ~ ~ Cf>1:/\1 <t>1 x, ~ ~. 4IRClIRCf> ~ cplff 3l'R ~ ~ ~ ~ ~ VlI .... Cf>I4'l <ft ~ ~ I ~ cp-5, cp-8 ~ cp-9 it ~ ~ em ~/Rrrc>rr~-Rrrc>rr/'f'Tfur ~/~ ~ lR ~ 3i'R fWT ~ ~ ~ fcm:rr TT"IT ~I ~ ~ m \JI'iti(§ll1 ciJ ~ G1"JlI OI'i1 ~ ("<6-6 ~ "<6-7) it ~ VI ..... {1&l1 ~ ~31l q;) ~ ~ ~ lR, f.'rcrm 1[Ct fWT ~ 1RWf fcl>m ~ I 1991 qft \JI'iti&l1 it ~ ~ m qftqffi' ~ ~ ~ ~ cp-1 iP qR~IISC-3 of ~ ~ ~ ~I"!fff ~ W c:l m~: m-I if ~ cp-5, cp-6 ~ cp-7, m-II it ~ cp-8 3i'R ~ cp-9 "Cf>I~ld ~ ~ ~I
~ m~ \JI'1I[UI'i1 "fIR ~ ~ q;) 3If.Wr Xi)q ~ ~ ~ ~ q;l ~ ~ "<t>T m ~ w '16Ixftl'fS:;lx ~ Cf>1"IYCitll ~ ~ fcr'lIT'if ~ \11'"1'1 0 ['11 Pt~:/IiCitll W ~ ~ ~ ~ San t-I if 'JI'l'«l
W '161'{fGt~lx ~ "1'1'1 01'11 3ll<J<Rf ~ ~ W"fR ~, q>[ ~ ~ ~ ~ Q~ct116'1 ~ ~ ~ :m'lTIit ~ I if 'llffii in ~ ., l51'( fGI ~'x ~ VI '11 r 01 '"1 , ~ ~ ;:;T,~. oiTf'am, "<t>T '1ft ~ ~ ~ 5X ~ lR ~ Q~ct116'i, ~ ~ ~ ~ I ~ ~ ~, ~ ~ (~.~ . .q't) 3l'R ~ ~ "'iT"ffi: ~ ~,&R. <ilcl'fWI'i, ~ ~ (:f,~,.q't), ~ ~:~, ~, '3"tr ~ (t~.lft) 3lR ~ 3lf.1<;r W"fR, ~ ~ (:f.~.lft) ~141 ~ '<1 i54'lf7141 am ~ ~ ~ ~ ~ f$1;[ ~ ~ ~ qft ~ CfRCIT ~I ~ ~ ~ ~ ~ if> <rn<t q;) ~ gr ~ ;R 6lCT ~, Cf)1clCf>ctl (~.~) am ~ 3'fR.~. ~, ~ '3"tr ~ ~ f.rtl~ it ~ ~ Gffi, ~ f.1<hrq;- 'fCf J?,ft ~ ~ Gffi ~ ~ '<1641 fi"llll -t fcJxrr I
v
'JfI'«'f <1ft \JI"'IOI"'li, 2001 qft OI~d vr@nIT ~ "1 '1 "1 IRt<1'1 "$ ~ <1ft VJtcr ~ afR ~ ~ ~ ~ <JiT q;nf m. ~.~. ~, ~ 0I1*i~1" ~ "$ lfPfG'lf"'l -q tll'""llfGl<t> ~ "WJlTll'
~ ~ TJ<IT ~ 3RT ~ "$ G<'J am ~ ~ ~ l"flIT I
~ '\JI'f'q afR ~ WfTlTT ~ ~ ~ "$ ~ ~ ~ q;l 1l<t>1~ld ~ "Cf)l m .tJfi 3{R."Gft. ~, \'llt '161\(fGlttli( (GJ"'IUI'11 ~ ttl\(of!<6\(OI) "$ ~ ~ -q 131"'1"1°1.,1 "WJlTll' irnl 'fcm:rr TJ<IT
*1 ~ ~ tRTW'<", ~ ~ -q IllejfllCf) GJ"'I'I OI"11 "tlR "$ ~ cwf"Cf)l l''lI~;n:lI'icfCj') ~ 'fcm:rrl ~ ~ -a ~ ~ "Il'f>R "$ ~ ~~, fiI~<>Itloll~<t> tll~fillq'j qft ~ ~ Il~RtCf)i(UI "Cf)l
m .tJfi lfil. "$. Cfl'rm;r, ~ ~ am ~ OIR". ~. +ftun, ttif&:lc61 ~ m;--I ~ 3RT <t><l'qIR41"$
~ ~ $?~I<;>ldl,!4Cfi ~ ~ I ~ mR -q ~ ~ 'W ~ ~ "WJlTll' irnl ~ ~ "4l'lr ~ 1 ~ ~ -fp ~ "Cf)l q;flf ~ afR ~ 1R1R ~ -q J!,fr ~. ~, ~ ~ "$ ~ "If ~ TJ<IT!I ~ ~ ~ a, ~ -q ~."'W ~ ~ ~"$ ~ GJ"1"I UI.,1 WJf1T[ $ ~ ~ ~ "$ "@ft ~ atR 4><l'qIR1I1 em 'lfi ~ mrr ~ I
"1'1'1 0 1"'11 Pi~'lll<;>lll ~ "@ft ~ ~ <t>4'qIRlI1 ~ 2001 ~ 131"'1'1 0 1"'11 "If 3l1Rl ~ ~ fq<n if \R "tl'lft "Cf)l 3lT'JTTtt ~ I tf ~ "ti"iiI" 131"'1'1 01 '11 WlJ17T "$ 01 ~ <t> I R 1I1 ~ 1JWm <Rm ~ ~ ~ m~ "'"'1'1 0 1"'11 ~ <$ ~ '<t>T ~ ~ ~ -q ~ ~ ~ I
am if,' if ~ ~ ~ ~ <$ ~ ~ ~ ~ ct><ltlIR<if Q'5T ~ ~ ~ afR ~ ~ ~ ~ ~ >i11fl<::l{) ~ ~ :w:RT 3-TT'llN ~ <Rm ~ ~ ~ ~ fiAT "1"1'1 0 1"11,
2001 ~ ~ ~ ~ -ct>T "'{'IT <PX "QAT ~ <nff 2IT 1
Cf))<;>l<t>dl
~, 2004
vi
fcnn-.:r IT-:r ~, 131""1 110 1"11 chl~f<;>l~, ~ Eflm;r
Preface
The final .population data and its basic characteristics presented in this publication is based on the processing, editing and tabulation of actual data captured through Household Schedule at the
~opulation Enumeration phase of Census of India 2001. The .generation of Primary Census Abstract for the.Census of India 2001 was a fully computerized exercise starting with the automatic capture of data through scanning of the Household Schedule to the compilation of Primary Census Abstract. In the 1991 Census, the final population totals and their basic characteristics at the lowest geographical Jevels, popularly known as the village/town Primary Census Abstract was compiled manually in Regional Tabulation Offices established for this purpose in the state. For processing the huge volume of data collected at the Census of India 2001, a major technological change was introduced, which is the kmbination of digital imaging and intelligent character recognition or better known as Image Based Form Processing. Indian Census has completed successfully 100% data capturing from very large volume of household schedules and also implemented image enabled computer assisted coding of the descriptive items hand written in many different languages under diversified and extremely challenging field Conditions.
In 1991, State Primary Census Abstract was adjunct to General Population Tables while in 2001 Censas, these are presented as part of A-series tables. This publication contains Primary Census Abstr;act Tables A-5 to A-9. These tables present basic population characteristics of Total population (A-5), Institutional population (A-6), Houseless population (A-7), Scheduled Castes population (A-8) and Scheduled Tribes population (A-g). Primary Census Abstract for Total population gives basic information on area, Total households. Population, Population in the age group 0-6, Scheduled Castes population, Scheduled Tribes population, Literates, Total workers, Non-Workers, Main workers and Marginal workers classified by four broad industrial categories, namely, Cultivators, Agricultural Labourers, Household Industry workers and Other workers. The data in tables A-5, A-8 and A-9 is presented at Union territory/ district! sub-district and Urban Agglomeration/town levels. The Primary Census Abstract of Institutional population (A-6) and Houseless population (A-7) have been given first time up to district Jevel by residenoo and sex. In the 1991 Census, only basic data on population by residence and sex for Institutional and Houseless Households were given in Appendix-3 to Table A-1. This publication has three volumes: Volume-I contains Table A-5, A-6 and A-7, Volume-II Table A-a and Volume-III Table A-g.
The task of finalizing the State Primary Census Abstract and production of this volume is the coordinated effort of various divisions in the Office of the Registrar General and Census Commissioner, India and the Directorate of Census Operations. I am extremely grateful to Shri D.K. Sikri, Registrar General and Census Commissioner, India for his guidance in bringing out this publication. I am equally grateful to Shri Jayant Kumar Banthia, former Registrar General and Census Commissioner, India for his constant inspiration, help and guidance at every stage. I am thankful to Shri Himakar, Additional Director (EDP) for his untiring efforts in data processing and his team of officers Mr. M.R. Balakrishnan, Joint Director (EDP) Mr. A.K. Srivastava, Deputy Director (EDP) and Mr. Ani! Kumar, Deputy Director (EDP) and their colleagues. The data processing of West Bengal was handled efficienUy by Data Centre, Kollata under the overall 'supervision of Mr. R.K. Malty, Ex Deputy Director supported by Ms. Ranjana Das and Mr. Prabir Kumar Das both, Assistant Directors.
Scrutinizing and finalizing the Scheduled Castes and Scheduled Tribes returns of census of India, 2001 was co-ordinated by Social Studies Division under the guidance of Dr. I.C.Aggrawal, Senior Research Officer who was ably supported by a team of officers Directorate staff provided necessary input under the guidance of Dr.·P.C. Coomer, Deputy Director in charge.
The work of finalizing the Primary Census Abstracts and bringing out this volume after detailed scrutiny and close coordination with other Divisions and Directorates has been accomplished by the Census Division of ORGI under the able guidance of Mr. R.G. Mitra, Deputy Registrar General (Census and Tabulation). Ms. Suman Prashar, Joint Director who efficiently coordinated the entire work of Primary Census Abstract. The work related to compilation, preparation of analytical tables and presentation of
vii
data in this publication has been ably done by Mr. H.K. Kaushal, Assistant Director assisted by Mr. R.C. Meena, Statistical Investigator Grade-I and other officers. Map included in this publication has been prepared by the Map Division of the ORGJ. Printing of this volume was handled by Shri C. Chakravarty, Joint Director, Printing and Data Dissemination, Cell. I am also thankful to all the officers and staff of Census Division and D.P. Division for their co-operation and support in bringing out this volume.
In the Directorate every officer/official contributed in the Census 2001 and I express my thank~ to each of them. Among those who were closely associated with this work, I appreciate Mr. B.N. Mallick Drawing Assistant, Ms. Keka Das, SI Grade II, Ms. Anjali Das, SI Grade II and Ms. Sucheta Dutta SI Grade II.
Finally, I would acknowtedge the active cooperation and support of the State Government of West Bengal and their offICials and participation of people of the State but for their support it would not have been possible to complete the massive exercise of Census-200 1.
Particular mention must be made about the records section of this office who planned and ensured continuous supply of the physical records i.e. Census schedule to be fed into the digital scanners working without stop for 24 hours a day in three working shift for long one and half years. The records section of this Directorate was under the able leadership of Late Shri Gopal Ch. Haldar WBCS who died in harness in Fe':>. 2004 just after completion of the work. The Census Directorate gratefully acknowledges his devoted selfless and untining efforts in record management of census 2001 and we pray for his departed soul. Our condolence is also due to his bereaced family. Late Sri Haldarwas also ably supported by Smt. Lakmi Saha presently Assistant. Director under this directorate.
Kolkata, October, 2004
viii
VikramSen Director of Census Operations,
West Bengal .
ut..,"IOI"1i U1fI1T
~ ~.~. "i3fUVr. \;fq '1i1Ii(RiI~I'< {uI'PI UI'11 ~ '(1Ii(Ufl<fl,<Ut), ~~ W'P' tRrn'(", ~ ~. ~ ~. ~. ~, ~ ~, ~ 3lR.~. lfturr,· m.3T.~-I, ~~ ~ fm.iR, m.3T. ~-II. ~~ -mft <tmffi. m.3T. ~-III, ~-'>ft cft;rr ~, m.3T. ~-III. ~~ ~ mc..rr, ~ tiq)~'1q)(1f. ~~ cfFrr +neT,
311~fCt<t>. JJfi it.~. ~, ~ "<"ict>~1ct>Qf
~ 't1't1ll:1"1 'g"&f(11
~ ~, 3ltR ~ (~~~IPlCP ~ Mh9!ft'I), ~ tfi.~. $I, ~ ~. -'>ft "C['1".~. l!TIlIT.
'3"q~, "'"" ~ ~, '3"q ~, ~ ~.~. ~, ~ ~, ~ ~ ~, ~ ~, ~ ~.~. ~, ~ ~, ~ ~ lffi'f, ~ ~. ~ cft.~. ~, ~ ~, ~ ~.~. JJftqm, ~ ~, -sit u:rR ~, ~ ~, ~-'>ft \3"li!T, ~ ~ ~
1jSfOT WlPT
~ ~ lRl"ffi", ~ ~, -'>ft 3ll+r WPm, m ~, -'>ft "C['1". ~. "Wlf, crftfO dCfJ;ft~ ~, ~ ~.~. ~. ~ dct> .. ·t",q;) ~, '5ft ~ ~. ~ dCf)4)c61 m, ~ cft.~. lftIT1". ~~. ~~.~.~, ~f.f&1q>
ut"1"IO'"11 C6l'lt PI~ltlR"lli ~ 3TR.~ .~, ~ ;ft ~ ~ ~ ~ ~, ~ ~."'(fi. <flR. ~ ~, ~-'>ft ~ GRf.
m ~, ~ ~ ~, ~ ~, ~-'>ft "R~ "ffiID, ~ ~, ~ ift.~. ~, ~ ~, ~~ ~ GR'f, W.3T. ~-Il, ~~ ~ GRf, X'IT.3T. W-II, ~-*l" ~ ~, m.3f. ~-II afR ~ .,ft ~ WG ~, ~;ft oril ~
ix
Acknowledgements
OFFICE OF THE REGISTRAR GENERAL, INDIA
Census Division
Mr. K.N. Unni, Deputy Registrar General (Census & Tabulation), Ms. Suman Prashar, Joint Director, Mr. H.K. Kaushal, Assistant Director, Mr. R.C. Meena, S.1. Grade I, Ms. Sadhna Chhibber, S.1. Grade II, Ms. Shashi Kalra, S.1. Grade III, Ms. Veena Kumari, S.1. Grade III, Ms. Indu Bhola, Senior Corrpiler, Ms. Veena Matta, Steno, Mr. T.K. Mahto, Assistant Compiler
Data Processing Division
Mr. Himakar, Additional Director (Electronic Data Processing), Mr. B.L. Jain, Joint Director, Mr. M.S. Thapa, Deputy Director, Mr. Anil Kumar, Deputy Director, Mr. J.S. Lamba, Assistant Director, Mr. Surendra Singh, Assistant Director, Mr. J.C. Joshi, Assistant Director, Mr. Suresh Paul, Assistant Director. Mr. V.K. Singh, Assistant Director, Mr. A.K. Shrivas, Assistant Director, Mr. pyare Lal, Assistant Director, Ms. Usha, Data Processing Assistant
Printing Division
Mrs Suman Prashar, Joint Director, Mr. Om Parkash, Assistant Director, Mr. S.C. Bhakri, Senior Technical Assistant, Mr. M.C. Sharma, Senior Technical Assistant, Mr. Bhushan Lal, Senior Tedlnical Assistant, Mr. B.K. Madan, Printing Inspector, Mr. N.K. Jain, Printing Inspector
DIRECTORATE OF CENSUS OPERATIONS
Mr. R.K. Maity, WBCS Ex Deputy Director, Ms. Ranjan Das, Mr. Prabir Kumar Das, Assistant Director, Mr. B.N. Mallick, Drawing Assistant, Ms. Keka Das, S) Grade II, Ms. Anjali Das, S) Grade II, Ms. Sucheta Dutta, SI Grade II, Late Gopal Ch. Halder, WBCS and Ms. Laxmi Saha, Assistant Director
x
3'IiCf)~ ~q) ~ it FIGURES AT A GLANCE
F"' \Jf'1'fi'8ll1 ~ ~~~'4
q~+1~
~~~~ ~~'f'trffiqft~
~Tftcif~~
~ 3lT'ifI'C:' ~ ~ ~
~-;;rRt~~
WR tti~~Cfj ~ qft ~
~ Gj;Hi&l1 ~
1rf1ftuJ ~
Gj'i>eii@11 (0-6 -3l"Pj ~
"'I't'reR (7 qtf ~ ~ 3lT<j)
~<I>1ff c!lefCfj I ~ Cfj <I>1ff a[ (i(I Cfj 1Rw1 Cfj Cfl1ff 'Cf>l't~<t> 1'<
~~ qlRqlRCf> ~ ~
3Rl Cf>lff ~-~~
~ fWr ar:fIffi (0-6 3n<J ~) ~~
'Cf>'J1t ~t:~lnlql ~
~ ~ ifiT lIfm"m G .... i ef Cfj I r& CI') Cf>lff a[ (i(I <t> I ~ CI') <I>1ff
~ <6fiftif <tft ~ Cl')1~qCl')I'(
~~ 41RqlRCI') ~ Cf>lff 3Rf 'CI>1ff
~
80,176,197
57.748.946
22.427,251
11.414,222
47.196,401
29,481,690
23,023,583
6,458,107
5,653,922
7,362,957
2.172.070
14,292.741
68.6
36.8
78.1
21.9
19.2
25.0
7.4
48.5
xii
18
341
40,782
37,945
375
123
lV'I' 41,465,985
29.616,009
11,849,976
5,824,180
27.45~,426
22,388,044
19,494,971
2.893,073
4,655,210
5,080,236
917,180
11,735,418
934
960
77.0
54.0
87.1
12.9
20.8
22.7
4.1
52.4
38.710.212
28.132,937
10,577,275
5,590,042
19,743,975
7.093,646
3,528.612
3,565,034
998,712
2,282,721
1,254,890
2,557,323
59.6
18.3
49.7
50.3
14.1
32.2
17.7
36.1
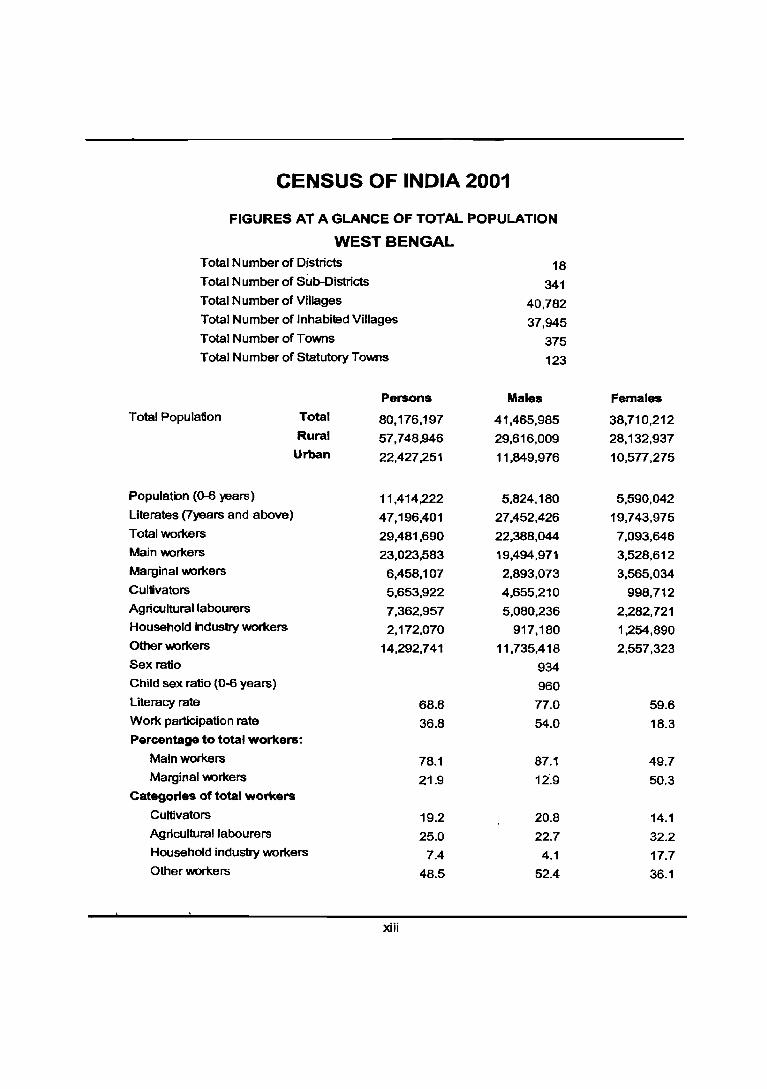
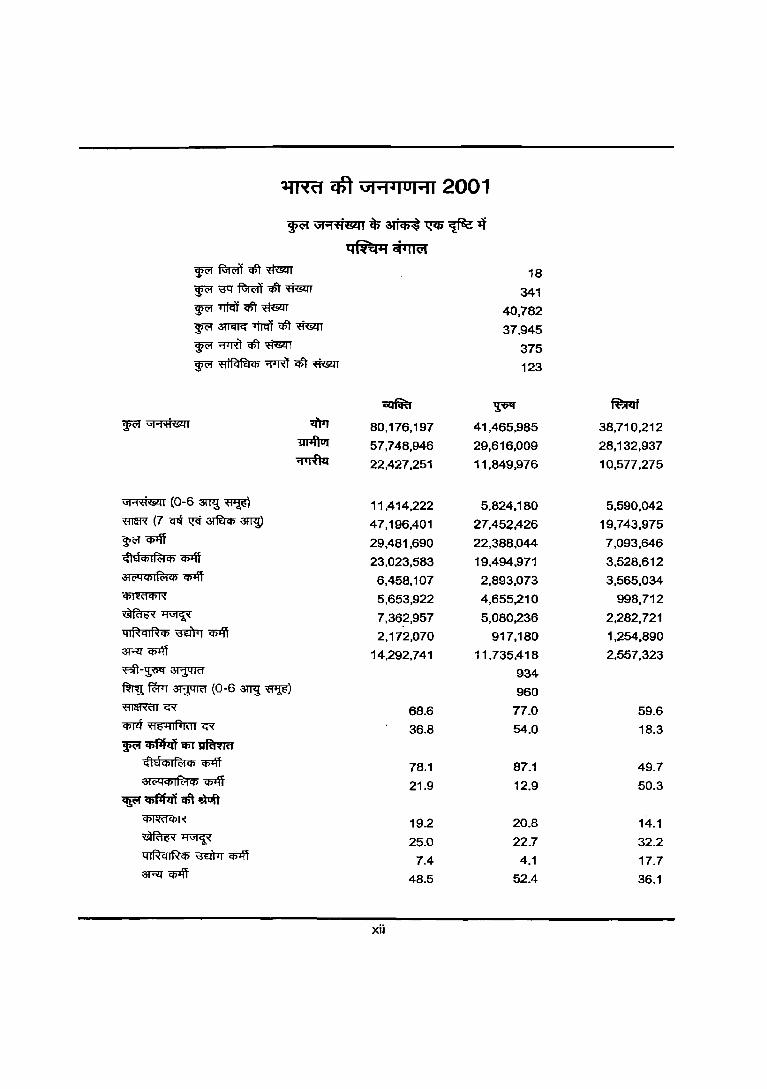
CENSUS OF INDIA 2001
FIGURES AT A GLANCE OF TOTAL POPULATION
WEST BENGAL Total Number of Districts
Total Number of Sub-Districts
Total Number of Villages
Total Number of Inhabi1ed Villages
Total Number of Towns
Total Number of Statutory Towns
Total Population
Populatbn (0-6 years)
literates (7years and above)
Total workers
Main workers
Marginal \M)rkers
Cultivators
Agricultural labourers
Household ildustry workers
Other \M)rkers
Sex ratio
Child sex ratio (0-6 years)
literacy rate
Total
Rural
Urban
Work participation rate
Percentage to total workers:
Main workers
Marginal 'tt\Orkers
Categories of total workers
Cultivators
Agriculwrallabourers
Household industry workers
Other workers
Persons
80,176,197
57,748,946
22,427,251
11,414,222
47,196,401
29,481,690
23,023,583
6,458,107
5,653,922
7,362,957
2,172,070
14,292,741
xiii
68.6
36.8
78.1
21.9
19.2
25.0
7.4
48.5
18
341
40,782
37,945
375
123
Males
41,465,985
29,616,009
11,849,976
5,824,180
27,452,426
22,388,044
19,494,971
2,893,073
4,655,210
5,080,236
917,180
11,735,418
934
960
77.0
54.0
87.1
12'.9
20.8
22.7
4.1
52.4
Females
38,710,212
28,132,937
10,577,275
5,590,042
19,743,975
7,093,646
3,528,612
3,565,034
998,712
2,282,721
1,254,890
2,557,323
59.6
18.3
49.7
50.3
14.1
32.2
17.7
36.1
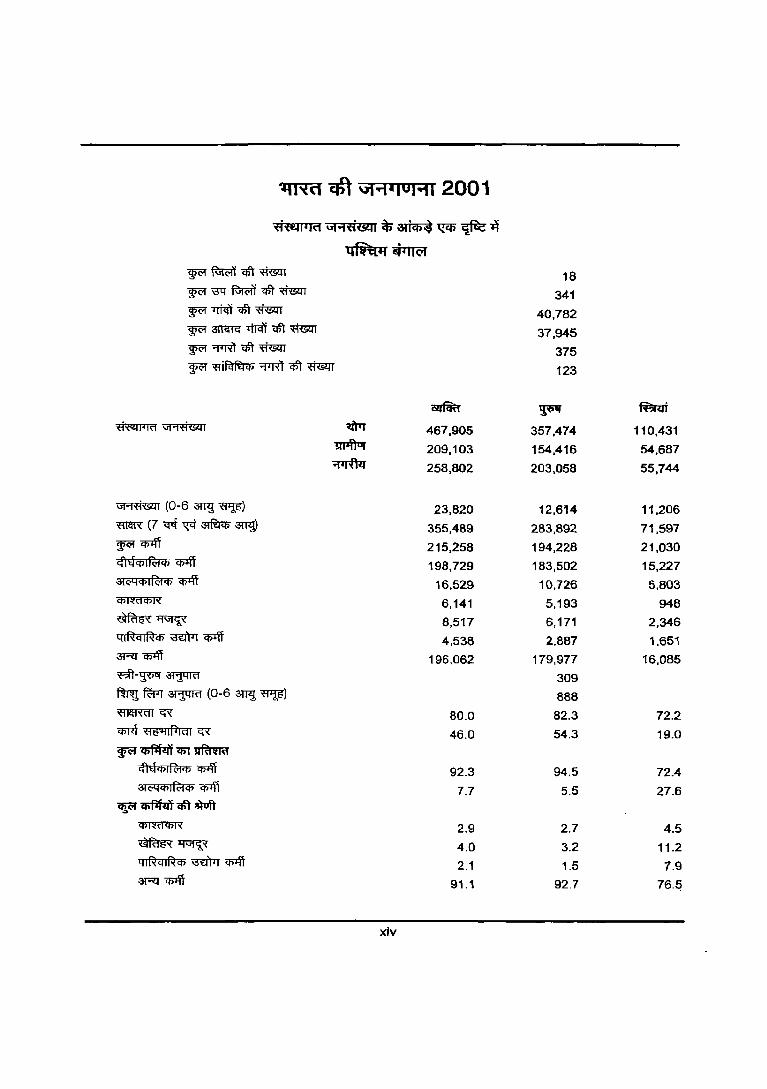
O«'Eewld ut"iO«&U -ij; ~ ~ ~ ~
q~~ Wl'f~qfi~
~\:fqftR;fiqft;ffis;zn
~TJi<ifqft~
Wl'f amrTG Tjjq'f qfi x=ffim
~ 'FRl ~ 'ffi5m ~ tl iFcl ~ if> "'J1"Rl qft ~
"1"'1ti® I (0-6 3I1<J ~) ~(7~~~amJ)
~Cf>Iff <!hf cp I~ ijj (j)lff
31 CA<t>fffit <t> <Plff
~~ q I ~ q I ~<t> \.RI)Tr '<t>+ff ~~
~-~aTj4Rf
~ fWT ~ (0-6 3m.! ~) ~c;x
~ tl5'''II~ldl C;X
wa~q;-r~
c{ltfijjl~CP ~
31 \i4 <t> I ffit ct> ~
~ iIif1fm qft WJft
~~ q I R cuR C/) ~ "C/>lff
~~
~
~ -;:prfur
?ZJfcRJ
467,905
209,103
258,802
23,820
355,489
215,258
198,729
16,529
6,141
8,517
4,538
196,062
80.0
46.0
92.3
7.7
2.9
4.0
2.1
91.1
xiv
18
341
40,782
37,945
375
123
~
357,474
154,416
203,058
12,6'4
283,892
194,228
183,502
10,726
5,193
6,171
2,887
179,977
309
888
82.3
54.3
94.5
5.5
2.7
3.2
1.5
92.7
~
110,431
54,687
55,744
11,206
71,597
21,030
15,227
5,803
948
2,346
1,651
16,085
72.2
19.0
72.4
27.6
4.5 11.2
7.9
76.!:j
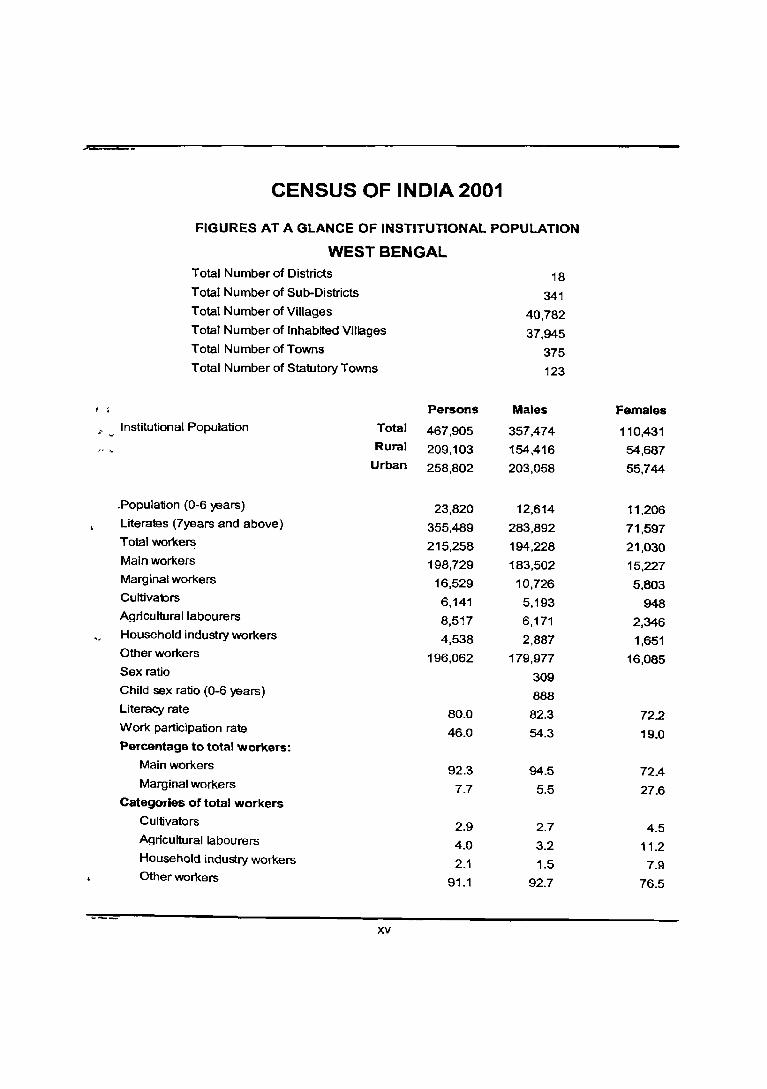
CENSUS OF INDIA 2001
FIGURES AT A GLANCE OF INSTITUTIONAL POPULATION
WEST BENGAL Total Number of Districts 18 Total Number of Sub-Districts 341 Total Number of Villages 40,782 Total Number of Inhabited Villages 37,945 Total Number of Towns 375 Total Number of Statutory Towns 123
I ; Persons Males Females
;- Institutional Population Total 467,905 357,474 110,431
" , Rural 209,103 154,416 54,687 Urban 258,802 203,058 55,744
,Population (0-6 years) 23,820 12,614 11,206 Literates (7years and above) 355,489 283,892 71,597 Total workers 215,258 194,228 21,030 Main workers 198,729 183,502 15,227 Marginal workers 16,529 10,726 5,803 Cultivabrs 6,141 5,193 948 Agricultural labourers 8,517 6,171 2,346 Household industry workers 4,538 2,887 1,651 Other workers 196,062 179,977 16,085 Sex ratio 309 Child sex ratio (0-6 years) 888 Literacy rate 80.0 82.3 72.2 Work participation rate 46.0 54.3 19.0 Percentage to total workers:
Main workers 92.3 94.5 72.4 Marginal workers 7.7 5.5 27.6
Categories of total workers
Cultivators 2.9 2.7 4.5 Agricultural labourers 4.0 3.2 11.2 Household industry workers 2.1 1.5 7.9 Other workers 91.1 92.7 76.5
XV
~ Gt'1;H&l1 ~ ~ ~ ~ it q~i1~
~~cGt-msm ~\3'q~qft'~
~~qftmsm
~ 3l1itTG -rtrcit qft ~
W01~ctr~ WC'f tt i~~ct> "fTR't "*t ~
VJ9t1&11 (0-6 ~ ~)
maR (7 <rtf ~ ~ am]
~Cf;Jff G"ht<t> I~ <t> <f>1ff
31 'A <t>1 R>1 '" ~
~~ ql~ql~'" ~ Cf>'Iff ~~
~-~~ ~fWT~(O-6~~)
"ttllfffiIT GX
~ tti:PlIfl'IClI CR
~ C6'fifm CIiJ ~ ,fhf'" 1 ~ en Cl5lff at <;>q q:; I ~ Cf> C!>'ff
~ ~ qft JJluit
~~ qlRcliRen ~ -q;-4l
3RI cRT
mrr llT1ftvt ~
xvi
~
110,535
19,126
90,809
9,463
27,896
64,989
58,528
6,461
828
4,026
970
59,165
27.6
58.8
90.1
9.9
1.3
6.2 1.5
91.0
18
341
40,782
37,945
375
123
~
78,105
10,506
67,599
4,974
20,275
52,748
48,340
4,408
665
2,454
536
49,093
415
902
27.7
67.5
91.6
8.4
1.3
4.7
1.0
93.1
~
32,430
9,220
23,210
4,489
7,621
12,241
10,188
2,053
163
1,572
434 10,072
27.3
37.7
83.2
16.8
1.3
12.8
3.5
82.3
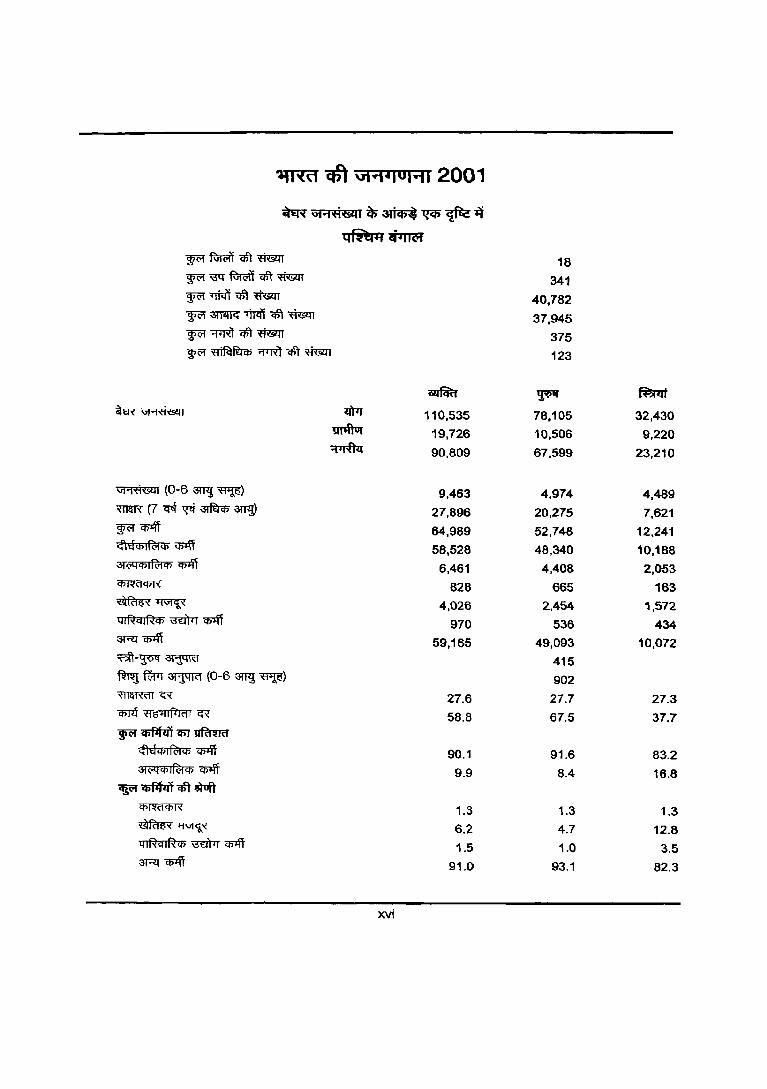
CENSUS OF INDIA 2001
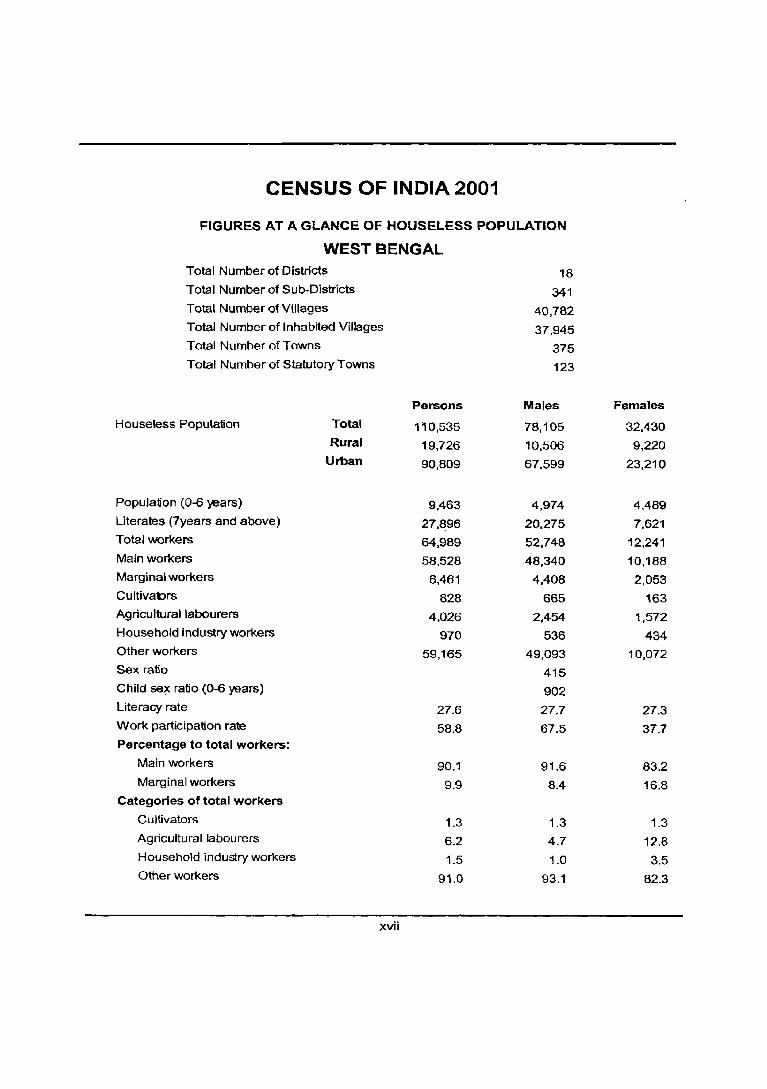
FIGURES AT A GLANCE OF HOUSELESS POPULATION
WEST BENGAL Total Number of Districts
Total Number of Sub-Districts
Total Number of Villages
Total Number of Inhabited Villages
Total Number of Towns
Total Number of Statutory Towns
Houseless Population
Population (0-6 years)
Literates (7years and above)
Total workers
Main workers
Marginal workers
Cultivabrs
Agricultural labourers
Household industry workers
Other workers
Sex ratio
Child se~ ratio (0-6 years)
Literacy rate
Work participation rate
Percentage to total workers:
Main workers
Marginal workers
Categories of total workers
Cultivators
Agricultural labourers
Household industry workers
Other workers
Total
Rural
Urban
xvii
Persons
110,535
19,726
90,809
9,463
27,896
64,989
58,528
6,461
828
4,026
970
59,165
27.6
58.8
90.1
9.9
1.3
6.2
1.5
91.0
18
341
40,782
37,945
375
123
Males
78,105
10,506
67,599
4,974
20,275
52,748
48,340
4,408
665
2,454
536
49,093
415
902
27.7
67.5
91.6
8.4
1.3
4.7
1.0
93.1
Females
32,430
9,220
23,210
4.489
7,621
12,241
10,188
2,053
163
1,572
434
10,072
27.3
37.7
83.2
16.8
1.3
12.8
3.5
82.3
3{~ct ~ 'ij; ~ ~ ~ ~
q~f(~
¥ftR;it<tt~
¥\jtfftR;it<tt~
"¥f'li<ifc$T~
"¥f ~ TfT<iT ctt ~ ~~qft~
WB tlifC'JRl4> ~ <#r ~
Gl"'lfi&:ll (0-6 3Wl~)
~ (7 <rtf ~ 3lf$:p 3Wl)
WBwsfi e'hl em fcl q) 'CffI'ff 31<!'Gq)I~Cf.l ~
Cf.l1"tct4>l~
~~ q IRq I R <$ miTrr q»ff
3Rl Cf51ff
~-~~ ~ ~ sr:rmr (0-6 ~ ~)
<PT<1~~
WR~q;r~
,,'1 -4<$ I fc1 C/') cp;ft
31 iA q) I ~ Cf) Cl>Iff ~~qftWlft
~~ QIRqIR4> ~ C!7lfi 3Rt "Cf)lff
m-r-r "!fIlftvr ~
CilJfcffi
18,452,555
15,524,925
xviii
2,927,630
2,783,690
9,251,190
7,153,225
5,291,661
1,861,564
1,333,774
2,720,526
416,227
2,682,698
59.0
38.8
74.0
26.0
18.8
38.0
18.6
38.0
18
341
40,782
37,945
375
123
~
9,469,659
7,950,837
1,518,822
1,421,538
5,677,032
5,148,910
4,364,870
784,040
1,075,236
1,803,974
185,048
2,084,652
949
958
70.5
54.4
84.8
15.2
20.9
35.0
20.9
35.0
~
8,982,896
7,574,088
1,408,808
1,362,152
3,574,158
2,004,315
926,791
1,077,524
258,538
916,552
231,179
598,046
46.9
22.3
46.2
53.8
12.9
45.7
12.9
45.7
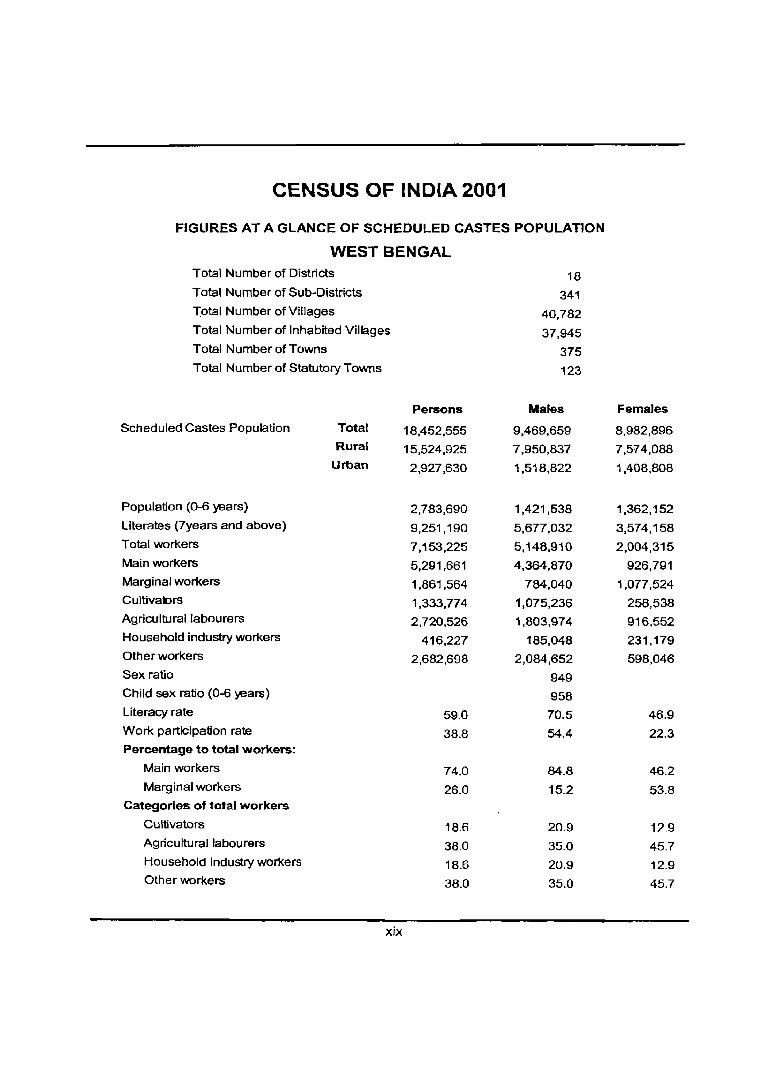
CENSUS OF INDIA 2001
FIGURES AT A GLANCE OF SCHEDULED CASTES POPULATION
WEST BENGAL Total Number of Districts
Total Number of Sub~Districts
Total Number of Villages
Total Number of Inhabited Villages
Total Number of Towns
Total Number of Statutory Towns
Scheduled Castes Population
Population (0-6 ~ars)
Literates (7years and above)
Total workers
Main workers
Marginal workers
Cultivabrs
Agricultural labourers
Household industry workers
Other workers
Sex ratio
Child sex ratio (0-6 years)
Literacy rate
Work participation rate
Percentage to total workers:
Main workers
Marginal workers
Categories of total workers
Cultivators
Agricultural labourers
Household industry workers
Other workers
Total
Rural
Urban
xix
Persons
18,452,555
15,524,925
2,927,630
2,783,690
9,251,190
7,153,225
5,291,661
1,861,564
1,333,774
2,720,526
416,227
2,682,698
59.0
38.8
74.0
26.0
18.6
38.0
18.6
38.0
18
341
40,782
37,945
375
123
Males
9,469,659
7,950,837
1,518,822
1,421,538
5,677,032
5,148,910
4,364,870
784,040
1,075,236
1,803,974
185,048
2,084,652
949
958
70.5
54.4
84.8
15.2
20.9
35.0
20.9
35.0
Females
8,982,896
7,574,088
1,408,808
1,362,152
3,574,158
2,004,315
926,791
1,077,524
258,538
916,552
231,179
598,046
46.9
22.3
46.2
53.8
12.9
45.7
12.9
45.7

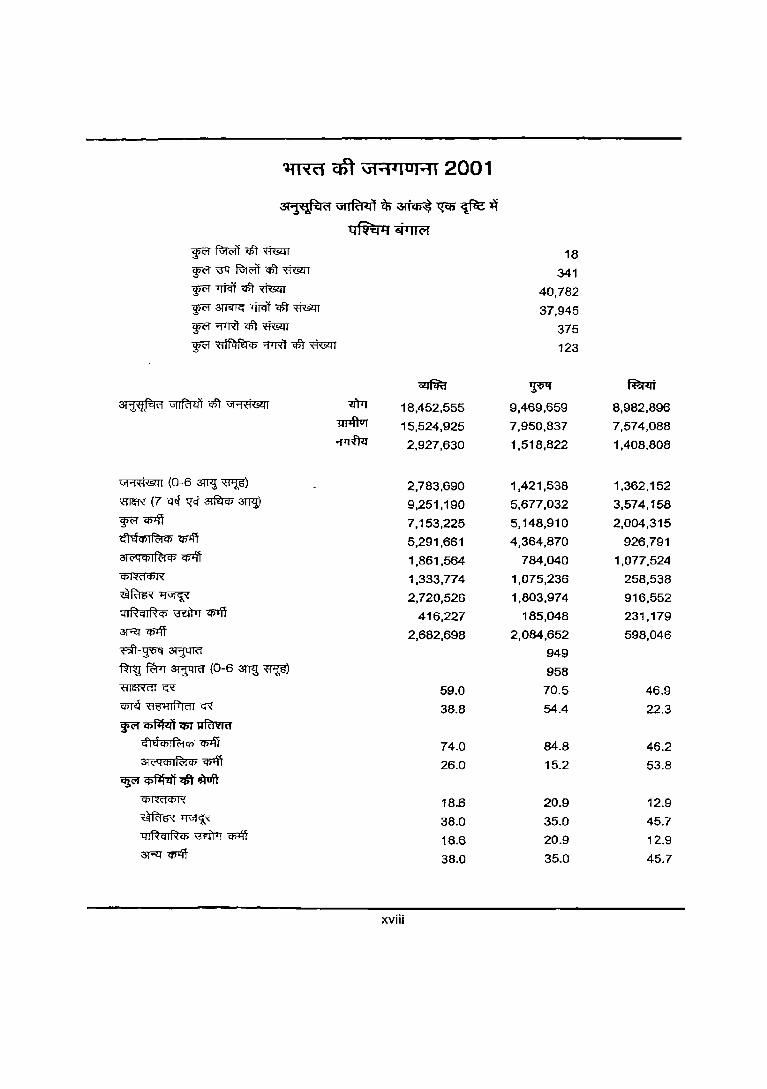
~ (1ft \1F1"IOI~1 2001
~~d G19iG1IRi41 -ij; ~ ~ ~ ~
qfi:q'1 ~
~~~"ffism
~\;fq"~ctT~
~TJtcncPt~
~ 3W{fq <trcIT c5t ~ ~¥Rf~~ ~ ~ -;pRt qfr ~
VI'"1fiMI (0-6 ~ ~)
~(7~'{<t~~
~q;lff
<fl 'thtil fC;j Cfj ~
3H;QCb I R:t Cfj ~
~~ q I R ell R CJ> ~ "CJ>+ff
3Rl"~
~-~~
~ fWr ar:rmr (0-6 ~ "f1W) W~G'(
~~<R
~ q;flftft <rrr ~ GidCfiIR:tCfi ~ 3l(;;qCJ>1f.S1CJ> ~
CIj(W[ C6f1f"lI'i qfi '!)"oft
~~ qIRqIRCf.l~~
3Rl" "CJ>+ff
xx
4,406,794
4,136,366
270,428
736,972
1,592,603
2,149,255
1,412,133
737,122
419,583
1,143,424
65,546
520,702
43.4
48.8
65.7
34.3
19.5
53.2
3.0
24.2
18
341
40,782
37,945
375
123
~
2,223,924
2,085,231
138,693
371,990
1,062,671
1,195,480
936,302
259,178
299,342
551,621
20,371
324,146
982
981
57.4
53.8
78.3
21.7
25.0
46.1
1.7
27.1
falIi
2,182,870
2,051,135
131,735
364,982
529,932
953,775
475,831
477,944
120,241
591,803
45,175
196,556
29.2
43.7
49.9
50.1
12.6
62.0
4.7
20.6
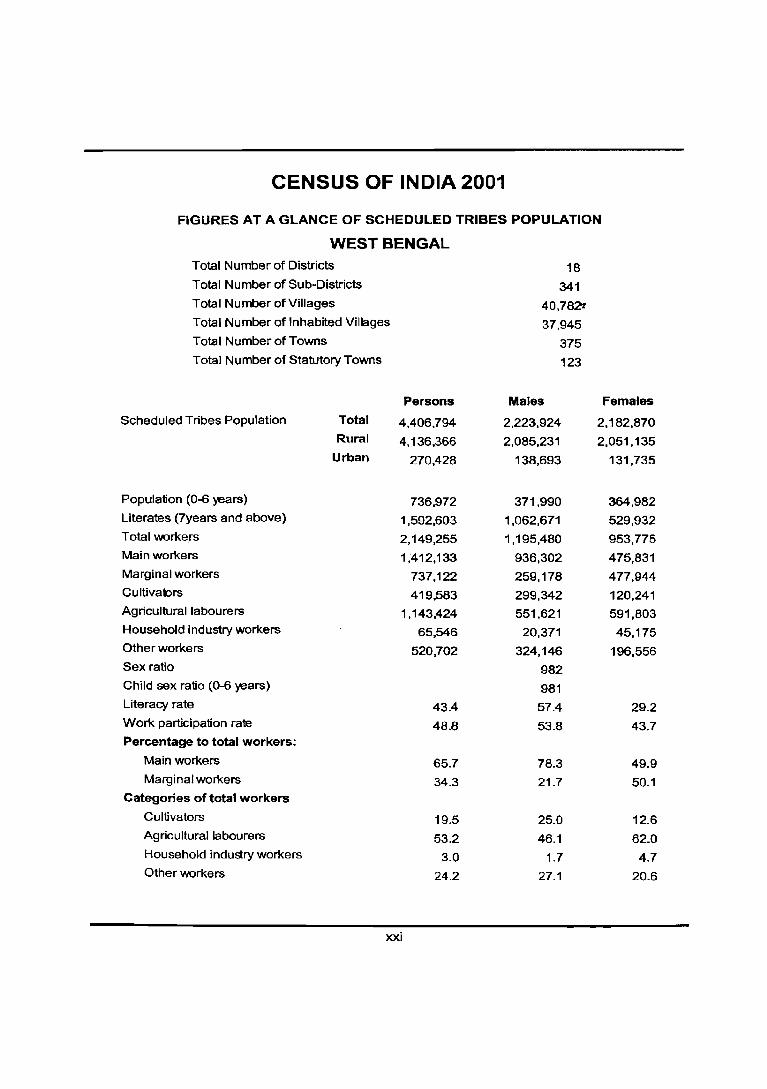
CENSUS OF INDIA 2001
FIGURES AT A GLANCE OF SCHEDULED TRIBES POPULATION
WEST BENGAL Total Number of Districts
Total Number of SUb-Districts
Total Number of Villages
Total Number of Inhabited Villages
Total Number of Towns
Total N umber of Statutory Towns
Scheduled Tribes Population
Population (0-6 years)
Literates (7years and above)
Total workers
Main workers
Marginal workers
Cultivalors
Agricultural labourers
Household industry workers
Other workers
Sex ratio
Child sex ratio (0-6 years)
Literacy rate
Work participation rate
Percentage to total workers:
Main workers
Marginal workers
Categories of total workers
Cultivators
Agricultural labourers
Household industry workers
Other workers
Total
Rural
Urban
Persons
4,406,794
4,136,366
270,428
736,972
1,592,603
2,149,255
1,412,133
737,122
419,583
1,143,424
65,546
520,702
43.4
48.8
65.7
34.3
19.5
53.2
3.0
24.2
xxi
18
341
40,782':
37,945
375
123
Males
2,223,924
2,085,231
138,693
371,990
1,062,671
1,195,480
936,302
259,178
299,342
551,621
20,371
324,146
982
981
57.4
53.8
78.3
21.7
25.0
46.1
1.7
27.1
Females
2,182,870
2,051,135
131,735
364,982
529,932
953,775
475,831
477,944
120,241
591,803
45,175
196,556
29.2
43.7
49.9
50.1
12.6
62.0
4.7
20.6

'l:IT~ qft- "1"'1'1 0 1"11. 2001 arntt 'fHH:'34IR 3fR ~CfCtfl*",cff ~ qft-~ "1"'1'1 0 1'11 ~ I <:re" ~ 1872 ..., l"ff ~ "$t \ill W ~ "''1'1 0 1'11 ~ I ~ ~ 2001 "$t "11'1 0 1"11 "ff ~ ~ it "'''1oAilSlIl 3fR ~ ~311 <)5 ~ IDtq ~ "GfEf ~ ~ ~ "ff ~ ~ ~ ~ 'HtI'b4IR "ff ~ 'Ht.:f'5IIR if CfiG1"{ ~ ~ ~ I ~ ~ ~ ~ -ij;- ~ 3m!" "ff 'If\" ~ "1'1'11"1'« R;r;:rif 80,176,1 97 ~ ~ ~ 'If\" ~ ~ -ij;-~ 3fR fcrcI;"m -ij;-~ ";fifcnrt ~ ~ it '1t1(C1~f aftx (f)ffI'R ~ ~ I
~ ~ -q "'''1'1 0111 ~, 1948 -ij, ;mtJR 1R "11'1 0 1'11 <1ft ~ ~I ~ <1ft "'''1'1 01'11,
2001 <PT ~ Gllmf-~ ~ m ~ ~ it fcf>m <mT I ",..,.oAilSlIl ~ ~ "1"'1'1 0 1"'11 -ij;- <P"nf <)5 ~ ~ -ij;- '{i)q -q w.T1l T.RUT it 1'fi.'PR ,<!T.ftCP\( 01 <PT CfiTlt ~ ~ aftx "\('fEr ~W it ~ "ff ~, 2000 <)5 ~ fcf;-m <mT ~ I 41 CPI'1'<!t:i"lCP'{O I "Cf)J Cf>1<l' ~ ~ -q 17 ~ ~ 16 ~ 2000 $" <fI-q fcpm <rml ~ $ 1R ~ ~ ahr 3l2ICIT ~ ~ ~ ~ ~ ~ ~ ~~d ~ $" ~ l"fCPR ,<!Tfl CP't 0 1 ~ q:;nf it "''1ti'&ll qft TfURT -ij, ~ ~ -wJFr aftx ~ 31l'm" ~ fclRrr 1TlIT I 1'{Cf)R ,<!-qlCP'tOI <)5 q;p.f $" G"RR ~ qft-~ 3l'R ~ it ~ ~ 3l'R qR*",J:qRrll~ <)5 ~ 'Ifi ~ ~ ~I "1'1'1 0 1'11 -ij, ~ ~ ~ "'''1oAilSlIl <1ft TfURT <PT ~ 9 ~ 28 ~. 2001 (G);U ~ 'H fUt ffild ~) -ij;- <fI-q fcnm TTm d"2IT 1 "ff 5 l'fT't:t, 2001 'dCP ~ m fcnm TTm I ,,1"1'1 ° I '11 em oA G 'let> I (it ~ fGR:J ~-~ 'QX "'''1oAilSlIl em 'ffim-"'1'rorr 'ffirm TTm <r5" 1 "'Il'if. 2001 q)J 00.00 ~ ~ I '16 ~ "1"1'1 01'11311 qft ~ "ff ~ ~ ~ ~ 1991 qft "1"'1'1 01"11 'dCP (1971 ~ ~) "'''1'1 0 1''11 em ~ 'H1'Eilf.€ld "''1'1 0 1"'11 crrf "Cf)J 1 "'"ITtf em ~ mm ~ I m <Wit qft 7f11AT 28 ~, 2001 qft "\('ffi ~ ~ ~ I
~ 3Tfa ~ m cr>T ("R;ffi aA<m am ~liRlcpl(it -q fcmrr '\ilFi ~ fcmJ em ~ ~ ~ 3lR ~ !,FW'HPtCP ~ +rr-rr urnn t) ~ ~ 1R '(iI"Il'1l1T 20 c;rror ~ 1ft artmr> ~ 3l'R q4~!fI<I>'i ~ 593 "R;rc;IT, 5,463 ~--R;rclT, 5,161 ..,-rffi 3l'R 638,588 'licIT it CR-'CR \iJTCf)\(" ~ ct)-x- 'QX ~ "TIt ~ 31 "1'Q\RIlil "$ Q)(ittc!{i)4 "ft'llq "liJO'Il<IT urr "'fICPT I ~ ~ ~ ~ 18 ~. 341 \3lJ~, 375 ;pr;r
atR 40782 'Jftq)- -q ~ ~ aiR ~'tG'tI'" ~ &f:.:i 'Ifi 'HfUtffikl ~. "''1'1 0 1'11 <PT cpnf ~ ~ I 'CZJ('q'"Cf)"
~ ~ ~ 1991 qft 61JFcRPld ~ "$ ~ 1R 1"f'{T 1TlIT ~, <)5 GFIT ~, ~ .~. 3fR 'Eft· it (ftrr ~ ~ I ~-I if ~ fcrcrxuT ~ ~ ~, "+fTIT-1I if ~4 FcR!CP fcrcrxuT ~ ~ ~ d"2IT "JfTlT -III it CPI~~CjiI'<'V"'I'lql .. n if ~ ~ "ff ~ WR ~ l"fq ~ (at¥l'''''Cf)-II) I ~ ~ "$ "JfTlT-1l it ~ ~ cll CP't 39 <PTclll cr.m 23 ~ ~ ~ ~ ~ ~ ct)-x- qx 1"f'{T TTm cr.m TfURT -ij, ~ <i>Tt ~ ~ "I1ff -FcP<n 1TlIT I
"''1 oA'&l I ~ ~ ~ !OICPI~ld ~ "$ ~ ~ *",1'tfilI4i ~ ~ ~ p l'lGl ~ ... ",r::r"1;rioA""'&IrrTl, ~. fBnrt. ffi-~ "$ ~ 0-6 qtf ~ ~ qft "'''1ti'&ll. 'ffi&RIPt-x&'R 3fR Cf>1ff cr.m ~~ -m-~ ~ ~ <)5 ~ <)5 ~ ~ if 1ft 'PO -ij;- m em ~ -FcP<n TTm ~ I ",.,oA&l1
~ ~ ~ TfUf"'1T em m ~ ~ ~ (ftrr w:aT5 <)5 ~ tft 26 l'fT't:t, 2001 ~ 'H4'H1411"'l1 <)5 ~ ~ cnx fu'q ~ I ~ ~ Pt~~lIcl4 ';f 'Ifi 31'Q";f "'''1fi'&ll -ij;-~ ~, 2001 ~-I, II * III ~ ~ ~ ~ ~ ~, ~-R;tm 3fR ~ ~ tR ~ ~ ~ ~ t I 3'f'Ifi 'dCP ~ ~ ~ "'"'loAMI ~ ~ ~ ~ ~~ 10i ;ffq ~ ~ ~ 'dCP "'''1oA'&ll ~€I\(1I!!le;: http:// www.censusindia.net.1R 'If\" ~ t I
xxiii
~ 'fi'flltl"'1'
~ tj\tl'lC/)XOI -3lR G1'1 x1&l I <fit 7JUAT GFii ~ ~ 1l ;;;1'"1'1 01'11 2001 ~ ~ em ~ ~ "$ ~ U'I £l1fi'1 c6l ~ "Q'[ rmtIft +rI?!T 1l ~ ~ t I G'A'f T.RUif qft at 1f!~ 41 m't ~ "$ ~ mm 1l ~ ~ ~ ~ 1l ~ 'l'Jfa' Cfl"B ~ ~ +nur=r ~ ~ fcpm Tf<IT ~ 3fR 3Wt 'tfi ~ ~ ~ "$ ~ ASCII ~ ~ ~ ~ ~e.c;ftJH:: ~ RC/)I'I=1!111 (~ ~ 3lN) '«llfC'lllx "$ "I1lUJ1l ~ ~ ~ ~ atjf!fu£l'i ~ ~ em ~RitC::I!?""~ '(ii1I" it ~ Tf<IT I C!Ch~qctl ~~d ~ ~ ft;rcr fclfuc;c '«llfC~4X "(/)T ~ ~ ~ ¢l1f!fillll ~ ~ 3fR Q51\(ilfe-1 "(/)T ~ ~ tft blIl'1,"!4Ch fcpm WIT
~ ~ ~ W ~ ~ ~ CfRYIT ~ ~ J ~ "ffimR <fit ~ ~ lI)£l)fT,4>"l "(/)J
'iflI'1 ~ "f'1II OI"'11 ~ ~ 1l "45C'ft iiIT'{ 'fflft 'lC/)1'1f!-q"1C/)\(01 ~ ~ tft m G1"'1x1&l1 '«lx[UI<41 m't -q;of TfUFfT m- 3ITI'ITX" tR ~ ~ ~ m ~ J
1JU1Cfffl 311 ~Cj 1'fI '1 'CIITd Gt"I'
~ ~ ~ W tmml ~ ~ ~ Cfl"B ~ ~ ~ CllICll:$IRCJ') '(ii1I" ~ W ~ m \JfRTf ~ fcl:;- ~ ~ ~ m't ;H4.{WII;:::q m't ~ ~ ~ ~ ~ qft "iJli"'q CR ~ J W ~ ~: ~~~~~~~~Wm~~~~-mct1~~~ ~ W m ~ ~ fcom"GI"RT ~J G1"1x1&11 fcrcRur 3fR ~ ~~ W ~ ~ ~~, ~ em-~ w ~ WR'R ~ w-T 3fR q'm em 'lft ~ fcl><rr "GITct1 ~ J ~ qft ~ "(/)T ~ ap:r ~ 'll:$6"I'!u! ~ ~ 'l{I"lfC:tCfi af.:;r ~: G1<J,{1&:11 qft 7JUAT W 1:RUT qft ~: ~ coT i(jPlf?-qfl CR"TI ~ J ~ mm !Wit -it TTiq ~ ~ ~ ~ it crrt ~ qcp W ~ "(/)J ~ mm t I ~ 'UCfiR ~ 7JUAT ~ qft ~ ~ ~ \3"fuo 1/I"IR:iC/) ~ i(jPl~ct Cf>\("""iT ~ ~, Rt ~ "I C/)\( mt af.:;r qft G1"1x1 &:I I W ~ qft ~ ~ f.1<t?IuT "(/)T ~ 3m:IN ~ J
'3l~fI ~ ~ '3l jf!~fI G1"'1G1 I Rt £I)' em-~ '(ii1I" ~ W ft;rcr 3ltA1<ft ~ ~ W ~ it ~ mm qft ~ it G1"1'1 01'1 I 2001 it ~ ~ fcrRn 'TJ'<IT t I ~ G1'1'I OI"1laTI it 31mfud
~ 3lR -3lmfud G1"'1G1IRilt) qft ~ G1<Jx1&:11 en) ~ '«1\(oTlCJ')\(OI CfillllC1<l1, ~ ~ '(ii1I" ~ ~ !>Ill'iGl<JI:4 ~ f<m:rr 'TJ'<IT ~, it ~ G1"1'l ol'il "«'R em ~3lc;[ ~ m-~ ~ ~ ~ 'TJ'<IT ~ I ~ ~ qft ~-3l(>fIl 3ljf!fuct ~ 3lR -3l1~d ,jl"lGlIRtll)' qft G1"ix1&11 <PT 3fC1TI ~ Cf»)'Sc/)'nI-3lT
&RT ~3lc;[ ~ ~ ~ 6ITG -it 3IR1+r ~ ~ 'flIT ~ I 2001 ~ "1"1'1 0 ''11 -it ~ 3l1f!R.ict "\"ifTfa ~ 3l1f!Rlct G1"i"1Ifc'1 Cf>T 3WflT ~ CJ')~\( qft ~ ~ ~ qft ~ ~ 1={T'i2I11 ~ ~ am
Cf>..-q:cxl' "Q'[ "'<fttt tt m ~ T["I:!" ~ W ~ ~ G1"i'IUI"11 "'«R ~ ~ W ~ ~ m tt f$m Tfm ~I Ch..-q:c\( qft mGT ~ ~ qft ~ ~ ~ ~ ii 3lmRlfi ~ ~ '3lif!fud \J1"1\J1IRtlif ~ ~Cf!1I'iotl PlCJ')I<'1ChX 3fR ~ 'QX ~ ~ W ~ ~ -it ~ ~ qft ~ 'ct>T ~ ~Cf~I'i{l m't ~ ~ ~ Cf>\("""iT tl ~ \J1'i'I OI<J1 'ffR' ~ ~ ~ m-~ ~ '4t ~ ~ ~ T["I:!" wn W~ -it ~ qft ~ ~ ~ 'lft qft11i1 ~ ~un=tm W wr W 3m:IN "Q'[ ~ at1f!fuct "\JlTR1/31jf!~ct \J1'1G1Ifc'1 qft ~ ~ f.rc:IRur ~ ~ f<l>m 'TJ'<IT ~ I
G1"'1"UI"" PI~!(I1I<'14 am ~ ~ ~ ~~ "iJli"'q ~ ~ ~ 'llffif ~ '4l:$I\(RittS;I'< W =Cf>T7Tllj~i<'1r:>T<I "$ \J1'1'I OI<J1 "W+lTlT <tt ~ ~ TIm '4141eR" -it '«1'lIRitc/) ~ "W+lTlT, ~ ~ m, ~ ~ ~ Gl1TI ~ WIT'T ~ ~ ~ Cf~ "'<'f'4'~ ~ ~ f<m:rr Tfm I
2001 ~ "1'1'1 0 1'11 -it ~ m1Trc!> \J1"'1'I OI'1I 'ffR' ~ ~ ~ ~ 'ffi ~ f$m Tfm ~ I 1991 qft =",=..,:rn'IU='"i=' ~ ~ \J1'i'IUI..,1 'ffR' -it ~)l:fCf>IR1Cf> ~ <PT ;fr aftdlfTlCf> ~ ii ~ fcl><rr 'TJ'<IT ~ ~ ;wr ~ CR f'Gm 'flIT ~ 3llx ~ ~ 'QX '<;'h:lChIR1CfJ ~' 3fR 'at<?tlCfJIR:iCfJ ~' cIT;:ff Cf>T "Cffi'
3(m'ifl'l CfJ ~ -it ~ TTm ~ J
xxiv
"-m~ v11'loF'I1 'W"'{ - ~ \JI"'1'<1&lI" ~ (f)-5 ~ 2001 -wr<fj" ~ cpr ~ ~ 2004 if fcnm 'Tf<IT 1 ~ ~ if g><'f \Jl"'j '<1 &I 1 1;[Ct ~ ~ ~ R1~l"lalc! ~ fcp 3ImRict ~ 3tR 34 j't!Rlct \JI "1 \JI 1 Ri;ql" ~ V"l"'1 fi&ll, m~, ~ Cfi1ff 3l"Tfc; <» ~ 'l1ffil, ~, "'<'itT ~ ~. ~ 3tR ~ ~/~ (100,000 3fR ~ ~ V"l"1ti&l1 ~) ~ tR ~ TJ<)- t 1
1981 qft (11"1'1 01"11 if ~ 6I'R ~ ~ \J1"'1.1 01"'1 1 "fIR <» ~ 34j*ifilct ~ 3tR 3lj~a V"l"'1V"lIRi41 "$ ~-3l'Wf m~~CJ) ''''H.IOHI "fIR QCflI~lct fcf;-c[ "l"["q" ~ 1 ~ ~ 1991 ~ '1fi gCJ)I~'d fcf;-c[ TJ"Cr 21"1 1961 3fR 1971 qft \JI"P,OI"'11:;m if ~ m <» ~ ~ <r-VIlI-fll"lIF0iCJ) 3tR 'Hit<pRiCJ) "'HRUft crlIT ~ 5G 'dCP 31j~Rld ~/31'rW~1C1 \JI""j\JIIRi41 ~ fcrirt:J fllxfCll'41· ~ ~e:r ~ I \JI'1.I OI"'11 2001 it ~ qft 31j~ct ~ 1tct ~ \J1'1\J1IR'l'4'i qft -;:;r.ffi"&IT "$ m~ \J1"'1
'l uHI 'W"'{
en) ~: ~ ~ if mxuft (f)-8 ~ (f)-9 if Gffi<n TJ<lT t" I
~ ~ if ~ \JIOj'IUI"i1 "fl"R ~ (CJ)-5) , ~ \JIOjti&ll, ~ \JI"iti'Ml ~ (f)-6) , W -:-:lV"l="'1-:rifi=&lrTTl "f1RUfi «f)-7) , 31j~ct ~ qft \J1Oj fi&l 1 «f)-8) 3i'R 31j"tiRia \JI"iV"lIRi'41· qft V"l"'1fi&ll "f1RUft «f)-g) ~ ~ ~ ~ ~ "l"["q" t", :r-'f f11"1fllI41 if -qftqffi qft ~, ~ \Jj"1'l.1&l1. 0-6 3WJ: ~ qft \JIOjfi&ll, ~, G"tUCJ)IR:iCfl cnfil<.ii, 3lC'<lCflIf<;JCfl ~ ~ ~ "ilN of'mWICJ) ~ ""1Tlm: (i) CJ)1~dCJ)I"I, (ii) ~ ~, (iii) 4IRqIRCJ) ~ ~ 3i'R (iv) ~ ~ d:i!:ll iN ~ "$ €lR it 'Fl V"l1'1CJ)I~ <ft ~ ~ 1 (f)-5, (f)-8 "Ifq CfJ-9 fliRoIl[j if ~/~/i3q-~/"f1R ~ ~ ~ q:;)- ffi-~ 3i'R f.'rq-rn "$ ~ ~ ~ TflIT t"1 ~ (f)-6 3fR (f)-7 fllxfCllll it ~ ~ ~ ~ 'dCP 1ft ~ ~~I
V"l'1.I OI"ii if ~ 1;[Ct W \JIOjt1'&11 <i> fl'"lIF0iCfl "Ifq ~ ~ "Cfl'r ~ ~ m~ V"lOj'IOI"!1
'W"'{ if Gffi<n 1"f<l1 ~ I ~ ~ qft \JI"!t1&l1 qft ~ ~3TI "$ ~ ~ ~ tR ~ ~ ~ ~ it ~ ~ ~ '1l:.:CC!,!"f ~ qft ~ ~ ~ ~ it ~ f.'iCBlctct atR R1~cil"lol ~ ~ ~ wITcRn3TI ~ ~ ~ IDTIT fc), ~ ~ diP ~~ ~ I ~ ~ en'! ~ '{:jcpc;qI~T3lT 3lt'{ ~~I~3'fT cpr tlll"1Q;4Cf> ~ ~ m atR fcmrc;r <PT<f "$ ~ -ft ~ ~ ~ ~ q:;)-~ "$ ~ "4"RcrR ~ 'l'ffil ~ "fll"l'A ~ C4Ql:.:IRCf> ~ ~ ~ ~ <PT tllR -q m m<rr I ~ m qft ;ff1rq ~ -ctcr ~ ~ ~ '1fi ~ it m-tt "'1lt't ~ qft ~ ~ -.,cpm ~ "\JlT
~13'fd: 0~en)~~it~~dWfQ- ~mqft~~ ~m,.., -aT -;ftta f.1J:!fur mm .., 1ft fcllm Fcl:! cl '" 0 1 en) ~ ~ I
~ Gl'1'luHI 'W"'{ qft "¥T fllxfill!ll ~ ~ ~ ~ it ~ ~ ~ ~ \JI'jti&ll.
3lj"ti~ct ~ ~ 3lj*ifilctll'i \JIOjV1IRi4i qft \JI Ojti'&l I. ~ \JI"1ti'L<41 (~ ~ \JIOjti'&ll 31mRid \JfIfulIT 1;[Ct ~ \JI"'1V"lIRrll) <» ~) tR ~ Fcl:!cl"lOIlCO'lCfl ctlfc;jCJ)I\! '1fi efT ~ ~ :r-'f ~ it 2001 qft
V"l"i' I 01'11 <l> ~ ~ W1l if V"l"'1 ti'l54l, fcrfm;r ~ cpr ~ \JI '1 ti&ll if ~, 0-6 3WJ: ~ "Cf>T
~, ffi-~ 3Tj%J, 0-6 ~ "ffW if ~ ~ ~, ~ ~, "Bfi-~ ~ ~ ~, G1UCf)I~Cf> ~ 3l(>GCf)1f<;JCf) ~ cpr ~ ~ -q ~ ~ ~ tR 2001 q§l \JI"!'l ul'"1l it ~ 1W t I
~ "C[Cfl" ~, R1~cil"lOIICO'lCJ) fcrcRuy "QCf 'H1"IfUl""1i ~ ~ qft V"l"1fi&l1 <l> ~ ~ qft ~:m qft "C[Cfl"
~~~I
"1RCf ~ ~ qft I'fRT 341 atR 342 <l> dl$d "1RCf ~ !iRT ~ ~ ~ "ticJ ~ "$ ~ ~ q§l ~ 3lj~d ~"QCf 3I'jJ"tiRid \Jj'"1\J1IR'ldY qft ~ 31jct'''1Cf>-1 cp3tR I ~it ~ ctT ~ ~I
xxv

1J.C'1 utrl l /oFIl WCbc;q;n(j 1[Ci ~
C:~ ~ it ~ <r<) ~ Cf>T ~ ~ ~ ,!C"<liCf>"1 ~ ~ ~ ~ ~~ ~ ~ ~ ~ ~ =i1i"Glq<'fl cBT fiCf>c><l"1I31T 3fR ~31T em ~ cr.rr ~ !ft "ii5I"fllf'i t I ~ ~ ~-~ ~ cBT ~ \(JI~41' am ~ f$<J ~ qm ~ ~ 3Rr ~ am ~ ~ .,-<T ~ m "$ ~~ cBT ~ ~ ~ ~ ~ "llffii qft- "'1"1'1 0 1"11, 2001 it ~ -rnf ~1ii.Glq<'fl "$ ~ em 'lft ~ cr.rr ~ ~ ~ I 1lT"«f cBT "'11 110 1"11, 2001 "$ ctR"R ~ -rnf fiCf>c><l"1I~ 3fR ~ ~ <ft -rnf -g: 01. m &l fcRJ 4i cBT l"fUAT cBT -rnf 02. 1JT+ftur-~ &l?r 03.~
04.~ 05.~~
06. teR~ 07.~Cf>T~ 08. 3lmRld "\"iflfcrm 3fR 3lj'{!Rla "'1 "1 "'1 1 Rill i 09.mm 10. CfiTI'I
i i. C;"P;i<'PIR>I<'P ~
i 2. 3lc><l<'P1R>i<'P ~ 13. <'P1l1d<'Pl-<
i4.~~ i 5. "41~cflft-cp \3Wll ~ i 6. 3RT <Plff 1 7. ~ "Cfilft 18.~-~~ 1 9. ~ fWT ~ (0-6 3lT<l ~) 20. ma:Rm c;x 21. Cf>Tlf t1 t5"ll [71 o;j I c;x 22. "11 110 1'11 2001 -.t ~ ~ ~ ~"ffi:sm 23.~~~
RiA ClI Fckilll rt\ 7J11AT qft ~
m ~ 1:R" \.R &lFcffilif cBT "I"fUAT ctT Vl"RtT ~ vIT l"fUAT cBT ~ ~ ~ ctR"R ~ -.t ~ m m vIT ~ ~ m f.1<nm m 3fR \ifT "I"fUAT ~ ~ WIT 11FT it Cffii ~ m m \ifT ];I"TfU]Cf) qI't 1lc -ij; ~ Cffii ~ ""11ft m ~ ~ 28 ~, 2001 tfq) ~ -.t c>ilc 3lR qft ~ it I "lfUf1T -ij; ~cl ~ -.t PtJO"i PI ftto;j &lFcffi 4i cBT TfURT cBT ~ :-
(i) ~ ~ ~ vIT t11"lIOXld: ~ -.t m m 3fR TfURT ctT ~ ~ 31~ 9 ~ -;ff 28 ~, 2001 (-zyn ~ em t1fUlR>ld ~ ~) "$ GRR 'CI"lff ~ m ;
(ii) ~ ~ -\ifT \(W11'XId: qfunx -.t ~ if 3fR "lfUf1T cBT 31CIfu" (9 ~ -fj 28 ~, 2001) ~ ~ 11FT-.t~: ~ it ~ m~ ~ cBT l"fUAT -ij) ~ ~""1" if;
xxvii
(iii) ~ Cll"fcffi uit tllill";'OlCl: ~ 'it ~ if ~ ~ qft 7"fURT"$ ~ ~";f if ~ 28~. 2001 ~ ~ ~ "C[l"tRf ~ 3lR qft ~ it; $
(iv) ~ ~ uit ~ "$ ~ ~ 'it ~ if 31'R TfURT qft ~ ~ "$ G'RR ~ 3N.f ~~~~ ~m<fiT~itl 'fURl~~~fWr~~CP)~~ <PT ~ ~ l1RT 'flIT ~ ~ TfURT 3fCWT 'it ~: ~ ~ ~ ~ ~ ~ ~ TfURT ~ 3tR ";f <fit ~ it I
\ijOj<1 0 111 'it ~ ~ qft ~ fclRfi * ~ ~ "$ ~ ~ ~ TfURT qft \J1T(fi t ~ ~ 3ln];. ~. ~. ~. ~ ~ wf WU" 1ft it ~ Cffi" 'fURl qft 1IT?ffiT ~ fWr \JitR" ~ ~ '11<iG0;S em ~ ~/~ it) ~ ~ ~ ~"lJ"UAT \31Cl'Rr 'it ~ ~ <1ft 4'l<~~<t> ~aIT 'it ~ qft ~ ~ ~ ~ 'lJUT"1T ~ rr qft ~ m. m ~ TfURT -;nft ~ 1R qft ~ ~ ~ 1R ~ ~ ~ mq ~ I <)" fcRm 7JURT -ij; ~ llT3 '11ft ~ ~ ~ 7JURT ~ c); ~ 1lffif 'it m qft ~ -..mt ~ I ~ ~ 'it 'lfg 1ft ~ ~ 'flIT ~ TfUR1 ~ <) 11ft '(I\ij~~<t> ~ ~ ~ ~ ~~~~ I2lm~TfUR1 '11ffqft~. ~~ ~ ~~~<nm ~ ~ 11<IRcp, qft- TfURT qft-~ I
"1 '1 t1&1 1 ~ 3lR1'1" ~ qft ~ 'it m4\uT 3tR ~ I!T?iT ~ "1 '1 t1&1 1 ~ ~ ~ 3R1'1-
3l(1T[ ~ T[<) .g I .~ ~ <) cl'ff<t>,(UI <P't ~ ~ ~ ~ ''1'1"( 3lR 1Wfi11J at-::l ~ ',TIer' 1lAT ~ ~ 1
1lffif qft \J11'IUFll 2001 if ~ ~ ~ ~ qft ~ ~ 1fCIlR ~ :
q,) rr<R ~. rrrR ~, meAT "i'lTt m ~ rrrR ~ ~, ~ ~ "frlfi ~ ~ I
~) ~ ~ uit 1;[<t> m~ f.'1'""1~f~H1 cft;:fi mn ~ ~ CfROT it :
i) c:n<l ~ c:n<l 5,000 qft Wlfi'@Oll;
ii) c:n<l ~ c:n<l 75 ~ ~ ~ TR-~ <t>1l1<t>cllcif 'it <>flT it; ~ iii) GFlt1&11 <PT ~ c:n<l ~ <P1'T 400 ~ m q<f f4>1."1'1'11c'( (1000 >rfa cpf -.fu;r) it I
'~' al?r ~ xqq ~ ~ ~ \11R ~ ~ qft ~ ~ ~ ~ 1991 qft- "1"'1'1 0 1011 ~ ~ ~ '1licr ~ wlfi&ll 4.000 3tR ~ 3Tfucn ~ 31N >rfa CfIt f4>C'1~'1''k,< Wlfi&ll <PT ~ 400 'ClIfcffi :?TI ~ "l6t ~ c:n<l ~ Cf>l:r 75 ~ ~ ~ TR-~ <t>14<t>('I14' ~ "C'1') ~ I ~ ~ ~ 1{
t1Pl~d ~ ~ 1R fcrc:rR FcP<n 7J<lT) ~ ~) (ii) ~ 13fB'<:1 Rsld ~ ~ Vi '1 t1&1 1 <m ~ f.'1<t'llcl<l ~ ~ ~ ~ ~ ~ crrilllR 1ft fcITnx fclRrr '1<IT I
\J1Oj<I U I'i1 ~ ""1'7RT '$ ~ ~ ~ '$ ~ 1ft ~ m .g I ~ ~ ~ ~ ~ ~ <r-Nr t ~ 1;[<t> rr<R $ ~ 3Tffi-lffif '$ ~ Effi'U fcr<pm <n err <n ~ ~ ~: ~ rr<R ~ ~ rrrm ~ ~ ~ <mU fcr<t>m ~ .g) ~ ~ ~ \f<t> ~ <n ~ rrrR ~ 3fRl
lffif ~ ~ ~3lT ~ ~ ~ rrrR <n ~ ~ x=re ~ l:fCP <TIer <n Tftci't qft ~«f m<=n3l1 ~ ~4 <t>1('I~f.'1<li. Fct~qRl€llc>1<l ~. ~ ~ 3lTfu ~ it "Iffi t I it ~ t fcp ~ ~ aBI \f<t> ~ ~ ~ 5f;l qft ~ Vl'i'{k<41 nP=rr qft wffi em ~ rr <fRm it ~ \f<t> ~ ~ ~ '$ xqq if \f<t> rrrR ~ ~ ~ ~ it I
xxviii
1lffiT qft "11'1 01'11 2001 ~ G'RR ~ ~ <1ft ~~ ~ lOI'!ll"1'11'4 ~ "11'1<:;0'$1 Cf51 irn ~ ~ : (Cfl) co'R 'flN m ~ ~ ~ ~ ~ ;:p-ffi ~ ~ Cf)l1 ~ CfllT ~ 'l'R q;l ~ "'fiR ~ m;u ~; tmT (~) ~ ~ ~ ~ ~ ~ (~ -;pM 3TR iIl1U fcr"cIm=IT) qft "¥f "1'1'{'j'&Ol1
20,000 ~ cn+r -;:ffif ~ ~ (1991 qft "'1'1 ' 101." ~ ~) I ~ G'r ~ "11'1<:;0'51 ~ ~ ~ \ilR lR 'lfi
~fcrt1'm~~~~~~~qfr~m: i) ~m~~~~~<mU ~ cnm ~ ~ m 'l'R; ii) ~ <fT"tIT ~ ~ G'r m ~ 3l'fu<n ~ 'l'R; mn iii) ~ ~ a1R ~ <fT"tIT fcl'crnIT ~ m~ ~ m ~ 3l'fu<n ~ ~ Cfl"ffi ~ ~ ~ wfi ~ ~ ~ ~tbmq~~1
'~' ~ UlRd4'i ~ ~ <ffi ~ -g -vrr flll1I""'1d: ~ ~ m 6T ~ ~ Cfl1l'f qfr 3IlCFlllCfJdl
~ ~ -;or cpt "ill ~ tt ~ ~ "&AT ~ m I ~ ~ Ulfifull1 Cf51 lft m ~ ~ 3TTtffi ~ ~ m ~ ~ ..,gr m m ~ GFIT "Q"CPR ~ ~ m I ~, ~ ~ "1""1'1 0 1'11 ~ it UlFcffim <PT ~ ~ N ~ <t ~ ~ ~ "&AT ~ ~ m cIT -q ~ ~ ~ ~ ~ ~I ~ ~ ~ CflT ~ 3WfIT ~ 'IfT'1T Tf"llT I <ffi ~ ~ ~ 7fT ~ <ffi ~ ~ ~ ~ "I 8CC1 ~r <rRf ~ fll'~J%Cf) ~ Cf51 ~ I ~ ~ ~ CflT, eft UlFcf~"jlj'j CflT m 3Act> UlFcffi m CflT m m ~ I
<ffi"t ~ fGm"it Cf)l1 xl CfllT ~ 31~d 'ffiftr CflT ~ ~ m \ffi 31mRit'l ~ <PI ~ ~ "'Tm ~ I ~ ~ it 31 mRid "1 '1 "11 Rt CflT Cfl"I ~ cn+r ~ ~ ~ ID \'ffi 31:w;R1d "1'1 "11 Rl CflT
~11RTTTm~1
~ ~ ~ ~ % ~ CllFcfull'i ~ ~ cp) ~ 3TTtffi ~ ~ ~ ., ~ ~ \ill ~ lft ~ ~ ~ ~ m, fi'{QtI'ld ~ ~ t I fi'{QtI'ld ~ ~ \3<:;18'<01 ~ : ~ ~, ~, "4fl-, ~, \3~I'{ll6, ~, 31TJWl, 31-lIWf-'WJ, ~ I "1'1'1 0 1'11 2001 ~ >f1TUTCI>T $" ~ ~ -<t>T $ ~ "CfR") ~ fu<) ~ £fRl <PI ~ ~ -.a ~ fcpm "'Tm ~ fco ~ qft ~ ~ it ~ ~ ~ em nID ~ "\1f6i ~ ClIFcffilil CflT ~ ~ ~ it ~ fj) afix ~ 1ft ~ ~ ffi'1T ~ m I teN~
'\11) ~ ~ <:IT "1"'1'1 01'11 ~ it "ltf m ~ ~ mrP $" ~ ~ it, '1'C41:!lT, ~ ip ~~ ~~~ it, ~~ ~~, ~-$~<:IT ~~, ~ -q, ~ '<1clfll'1l, ~ lR ~ -q"ffif t ~ <fER" ~ ~ ~ ~ ~"'Tm ~I
~C61~
"1'1'1 0 1""11 ip ~ it ~ Cl6 ~ ~ ~ ~ &RT ~ ~ ~ fj) I flll1l""'1l;1: "If"a Cf6 "C2Jfcttr mw ~ uIT ~ qfr ~ qft ~ IV1 dJ <:; 1-':<>1 "\3ORIT ~ ~ 41 R Cli R CfJ f.'ruflT ~ ~ I "If"a ~ ~ ~ fco ~ CflT ~ ~ ~ <:IT ~ cm;rr ~ m ~ ~ <IT CfllT \TIi qft ffi m ~ 'lfi ~ m ~ t I ~ ip "JfRTffi IDl<'r ljfurm qft ~ i'i TTUA1 ip ~ ~ qit ~ qfr
xxix
f?;jUlGI;[l 'Cfffijq ~ ~ ~ 'C.2l'fcRr tR ~ ~ ~ cpr ~ ~ ~ :1lT "'CITt em-~ ~ ffl m ~~I
~ ~ ~ 341 ~ ~ mcrcrrrr ~ ~ ~, fcfR:fi ~ "lIT ~ ~~ * ~ l{ ~ ~, ~ "lIT \iI"'I"1IR!"l) ~ ~, ~ "lIT \iI"'I\ilIR!q'j * 1WlT <IT ~ ~ em 14f.'l~c:e ~ ~,~ ~ ~ * ~ ~ ~ ~ \NT ~ <IT ~ ~~ * ~ l{:3'lj~d ~ ~ Vfl"lPlT I ~ "Wf)R ~ 342 l{ ~ ~ ~ ~ ~ XJ"\TlT <IT ~ ~ * ~ l{ ~ "1"'1 \ill R'lll)" <IT "1 'i \jj I RI ~ 3f.1lCIT "1 'i \iI I R'I ''IT "lIT VI "'I \iI I R'I ~ * mTJ1 <rr ~ ~ Cf>t 14 f.'l ~ oz ~ ~, ~ ~ ~ * ~ ~ ~ ~ \ffi" ~ <IT ~ ~ * ~ l{ :3'lj~d \iI "'I \ill R'lll i ~ Vfl"lPlT I ~ ~ * ~ it :3'l~ct ~ ~tm :3'lj~d \iI"'I\ilIR1"l'j qft ~ Cf>t ~~$~~~~~fcpm'l<ll~~~~~XJ"\TlTm~~~* ~#tt~t, ~~-;ffifl
w ~ ~ 'i~(q,!of ~ ~ ~ (:3'lj~d ~) ~, 1950 ~ 3ltfFr ~ m qQlllC'l1
am- ~ ti""1Tq ~ ~ 1{ m ~ ~ ~ ~ ~ wt <t>T ~ ~ ~ '11'iGI'Itl, <t>41"!4:i),
~ m R1<t>C'fl'I'< * ~ ~ CfJt ~ ~ wt ~ 3TWT wt Cf>t ~ ~ ~ em :3'lj~d ~ em ~ "l1ft ~ 1""["lff1 ij<;q:ttlld_~, 1956 ~ mm ID'<T :3'lj~d ~ ~ ~ ~ ~, 1950 3lR '1'flfT ~ ~ 3T$if it 31j'1ifud \Jl1fa' # ~ ~ ~ ~ it ~ mrr ~ wt Cf>t ~ <m4T \iI"'Iti'l!Al Cf>t ~ ~ tR ~ 1lm I ~ it ~ (:3'l:w;fild vrrRl") ~, 1990 it ~ ~ mTIwr ~ 3fjm'<" ~ vrrRl" ~ ~ CfR't * ~ it ~, ~ ~ ofta ~ CfJt ~ <m4T \iI"'I ti'l!A I Cf>t w:rrrr ~ tR ~ 7flIT I
~ ~/~ ~ it ~ :3'ljfj\fi1<1 ~/:3'ljfj\fi1<1 "1"'1\i1IR14f qft ~ Cf>t 3Tf.Wr "(ij1J
~ * ~ 2001 qft \iI"'I'IOI"'l1 ~ ~ '¥ ~ ~ ~ ~ <t>T UfR it ~ 7flIT I ~ "'1llIlAo;g
~ ~ ~ ~ ~ q PiCl)IElI"! ~ "C'l"1l'fiftq l{ :3'l~d ~ qft ~ ~ '"'Ilff ~ ~ 8RllIUII
~ ~ ~ ~ ilU;J)'I~, ~ 3fR qlfU:5-il'Cl ~ ~ # 3lj~d \iI"1"'1IR1llI ~ ~ ~ "Ofift ~ am: ~ ~ 3fR ~ ~ "ij; ~ it :3'l~d ~ ~ 31mfi1d \iI"1\i1IR'1 ~ \iI"1ti&l1 "ij; ~ ~";f ~ ~ ~ cpf * ~ it ~ ~ ~-gl
fcI>tft' ~ ID'<T ~, 3lj~ct ~ 3lR 31~d \iI"'I\il1 R1 "ij; ~ it ~ ~ ~ q;) GGt ~ ~ ~ WfUTCP'i <t>T ~ 7]\f ~ WJ1'I<T ¥ \iI"'I'IOI'ilaIT l{ ~ ~ ~ ~ ~ ~ I ~ "QTTUTCP em ~ ~/~ ~ ~ ~ :3'ljfj\Rl<1 ~ 3fR ~ \iI'i\ilIR1"lT ~ 1fCP :3'lfE)~d ~ eft ~ I ~ ~ ~ ~ cpr 'Cf4 ~ ll<TT I d\'<4:ttlIQ "!JftcrR ~ * ~ "'1l. 8 3fR 9 ~ ~ -u ~ ~ ~ ~ ~ ll<TT :!IT ~ CfflT em at mfi1 d "iJJTftf <IT :3'l~d \iI"'I \ill RI ~ t1Jt1 Rid t I ~ ~ ~ "<t>T \'f'ff'<" '"N' m m ~ ~/\iI'1\i1IRl ~ ""'I11l "<t>T "Q(fI 'C?1TT1<TI 7flIT I 'd't"NC;ldl ID'<T ~ ~ ~/\iI'i"'1IRl "<t>T ""'I11l WJl1ICP "ij; "4"R1 ~ ~ ~ ~ :3'lj'"1l Rd ~ it mol tR WJUlCI) ~ ~ "ClffcRr CfJt 31 ~d VI'l'ftl m 3l~d \iI"'I\ilIRl "<t>T ~ ~ ~ ~ ~ I 'llffif * ~ qft I':ffil 341 $ 342 ~ "ffi.m "Tmi 'fRCIiN ID'<T ~ ~ ~ ~ ~ -ij, ~ ~ cit ~ :3'lj~t1 ~ ~ 3lj~d "'1'1\i1IRlll~· c5t ~ 31161"'14)-1 q; ~ I ~ it ~ qft ~ ~ I
xxx
"ffiG ~ 31R ~ ~ 3Tn]; cpr \jf)' ~ ~ ~ em ~ ~ tIT 31R ~ ~ W<!fT ~ ~ m ;ffl maR lfI'lT 7Tm 1 ma:R ~ "$ ~ ~ ~ ~ % fct ~ ;f ~ 3f)q"Cl1 RCf> fum IDl<r ~ m m ~ ~ ~ ~ <1ft m 1 ~ dlFcffim cpl \jf)' ~ ~ 1)' ~ ~ % ~ "fITaR lfRT 'fITI
%1
~ c.zrfcffi \jf)' -;r at W "fICI)ffi i 3l'R OJ tt ~ "fICI)ffi % <IT ~ 'If"rm ct>T ~ W "fICI)ffi % fclR.1 ~ ~ ~ f-R&N "l1""PIT "tfm ~ 1 u-: crt m ~ ~ 3TI<j "$ ~ ~ q;) ~ it ~ 'lft ~ tIT afR WS ~ 1WlT 'lft ~ ~ tIT, fR&R "l1""PIT TT<IT ~ 1
cp]l1 em ~ "'{ilq ~ '3cqIGCf> Cf>1.QCf><illq -it ~ ~ ~ ~ ~ fc);m Tt<IT ~ I ~ cp[1l
1j~, cfflrr <IT ~ 3r.1FIT ~ 6fiR '1ft m ~ %1 Cf>T1l ~ 'IwflGlxl ltll{)RCf> afR/-m S11""tRiCf> ~ ~ m ~ t 1 <Pm ~ ~ ~ ci>Tll qw;rr tt -;ffif 3lTffi ~ ~ q)fJl" <PT 1fJlTCft ~1ffUT 3lR ~ '1ft ~ i 1 ~ ~, 4IRqIRCf> ~ 312lCIT fclR:ft 3Rl 3lTf.!rcp Cf>14Cf><'llq ~ 3i~ICf>I~Cf> ~ m ~ qwr 'lft ~ t 1 'Cf>T1l' CR ~ ~ c.zrfcffi ~ i3)1R GRll<ll TT<IT t "Cf>1ff ~ t 1 Cf>lltd Cjj I ~ 312lCIT ~ ~"$ <m41) ~ ~~ ~ it ~ ~ ~ ~ ~ tt ~ <m4 Cl'f'( ~ 51 ~ ~tl
fcRft c.1Tf<RT "Cf>l Cf>Jfi 3l2lCIT -tR-q>+ff ~ ~ ~ ~ ~ ~ ~ ~ l"fOFlT qfr ~ ~ ~ Cf1f ~ <1ft ~ lfFfi ~ % 1
~ ~ ~ ~ ~ ~ ~ 'lWT it (~ 6 11Rr amen ~ ~) <PW <W1 fct><rr m ~ cfl tf Cf> I f61 <t> '<t>lff 1WlT TT<IT 1
~ ~ ~ ~ ~ ~ ~ 6 lll5 ~ q;q ~ ~ ~ q)fJl" fct><rr m ~ 31f!\1Cf>IR:!Cjj
cp+ft +fRT TT<IT 1
Clillld(6)'<I!
"l""t'I U I'11 m ~ m- ~ <t>1~dCf)lx Cffi "&ffcRt ~ \.i'Il ~ ~ eft ~, m<fIR ;ff ~ 1R ~ ~ <IT ~ ~ c.zrfcRr -m ~ ~ ~ <IT fGm "lIT ~ 1R ~ ~ ~ 1R Wcfi CfR"dT t-I Cf>1!i1dCf>l~ "$ 3Rf1fq 3JtJ'fi ~ ~ m ~ 1)' Wcfi ~ 1ft ~ ~ 1 ~ c.zrfcRr ftR:r-'r 3N-fi ~ ~ ~ c;qfcffi m dlFcffi4'i <IT ~ q;) Wcfi ~ ~ ~ ~, ~ m ~ "$ ~ "$ ~ it ~ <ft % 31R vIT ~ ~ 1) ~"$ <nJ1l C!ft ~ 0<1> ~ <Rill, Cf>1~dCf>I'< o:rrff l'fRT ~ ~I ~ m ~ ~ \.i'Il ~ ~ FvR=r ~ "{iiq 1)' 3l2[C[T m "ffi6 ~ ~ 1R ~ c6T Vflfi;{ 1R ~ m ~ (~ ~) <t>1~dCjjI'! o:rrff llRT TflIT ~ 1
xxxi
Cflt~dCfllift II ~ ~, ~ <iFrr, tmR'r ~ "d"l1fT ~ aiR ~ ~ <PT ~ ~ ~, ~, ~, 'i.if1'JRl, -wIT, ~ ~ 3'FlT ~ ~ TIm, ~, ~, eftl41CflI, 3~ aiR "Gl"B, ~ ~ aiR ~ m qft ~ ~, "Cf)1:Jffi, fft"1<t»'11 afR 3RT ~ ~, tj')"C1' ~, ~ \3"TIT'i1 m q; ct'l til '1 m ~ c;{l1AT ~ ~ t 1 Cfl I ~d Cfl l;fl "it EIl"7TA1 "it tlGT 6f;f ~ ~ ~ 'q]'<J, 'Cfl"TQ'l't, ~. ~3fR~~~"'11fttl
~~
\JIl C2Jfcffi "'1mG m ~ m ~ m- Xi)q "it ~ lR ~ ~ "Cl:ffcffi m- ~ "it "Cfl"Tl1 ~ t erg
C2Jfcffi ~ ~ 4>6clldl t 1 ~ ~ em ~ 3rmT m ~ Ntft t ~ ~ f.rGfi ~ m mm tl erg ~ ~ ~ ~"it ~ lR"¢TIl qmrr tl ~ ~ ~ m ~ -qx ~ ~"CflT fcIR:fi m "CflT O"CV "'11ft 5RrT t I
qlRqlRCfl ~ <ffi' ~ t vtT ~ "$ "CfCP m ~ ~ aRT 1:R lR m ~ ~ "it 7Jiq
qft ~ m-~ afR ~ ~ "it ~ lfCflT'1" "$ ~ m ~ "it ~ ~ URI1 %, ~ \ifIdT
m I qlR q IRep ~ "it -cp-p:f ~ CJ"ffi i".l1 Fcffi1l1· qft ~ ~ ~ ~ "4ftcTR ip ~ ~ Ntft % I <ffi" ~ ,<fGt'fC~ ~ "$ ~ "it ~ ~ "lRT ~ ~ ¢ ~ II ~ 4>1,<'<5IHI 311?!~lJ'i ip ~ ~ m--t <W-ll-~ 4 IRcuRCfl ~ "'11ft .,-R ~ I
~ ~ "it '4t qtRqlR4> ~ "CflT ~ "114<:;0'6 ~ "$ "CfCP m ~ ~ ~ "CflT 'JlTlT
-&.=IT % I ~ ~ ~ "it ~ CJI'Rl ~ Cf) Xi)q ~ "ER -qx "'11ft m aiR 7Jiq qft ~ "$ ~ ~ '4T m "ill '4t -qftcrR "$ ~ qft ~ ~ ~ qft ~ m-ctt % I ~ ~ <1 vrtJt ~ ~ "CflT ~ ~ t, qlRqlR<t> \3El)Tr ~ "EN ~ ~ CfCf> tft ~ ~ t ~ ~ ~ <1 "Cfl"Tl1 ~ ~ ~ ~ I ~ ~ "it ~ tIftcnx m-~ aRT ~ tft mWT Tf<'fIm \iff W m ~ ~ ~ m ~ w m "ill ~ 4IRCJIR<t> ~ ~ +rPIT \ifIdT I ~ ~ ip ~ "it ~ ~ lfCflT'1" "$ ~ "it I?RT ~ ~ -qftcrR ~~~ ~l
qlRqlR4> \3El)Tr "CflT ~ ~ ~ "$ \)~rc;-'l, ~~, '{1fc'iR't'I, ~ m ffillTil "$ ~ 3lR ~ ~ (., fcp ~ ~ ~ tl) mar t I ~ ~. ~, 11l<fCf), ~/-;ffiqft. ~, ~, m-tt. ~, ~ m ~ ~ m ~ ~ CJ"ffi "'11ft 3Tffi I ~ ~ i".l1CJ'{1ll1, ~ <:IT ~ ~ "$ ~ aRT "ER lR 1ft qft un ~ m ~ 1ft ~ ~ ~ "'11ft ~ I wu-~ ~ qft ~ R;pg 41Rq I Rev \3El)Tr "$ a:rrmx lR Tf<'fIm \iff ~ %, ~ ~ -gcp N -g- : ~ qzy.4, ~ ~, ~ ~, ~ C[Bif ~, "!C, ~ m ~ C[Bif mWT, ~ C[Bif mWT, ~ ~ ~ ~ ~ ~, "CflT1T'if aiR "CflT1T'if ~ ~ ~. ~ ~ wmR, ~ ~ ~ ~ f.rllRf ~, ~, ~5::1R;ilJ'i am-~ ~ ~ ~, ffil<T'1" ~ '<1'tlllJPiCf) ~, ~ ~ ~ ~ ~-~5::1R;i1l'i ~ ~ ~ ~, ~ ~ 3fR ~ ~ ~, ~ aiR ~ \34Cf),<01, ~ \34Cf),<01 ~ I
'ffi "CfCP Cf!f "$ ~ ~ ~ CfwfCflC'11 q "it "Cf)l'i" ~ ~ \)"f "'<f4t ~ em 'aRT Cf>lff' (31:4>".)
"I'J"Ai 'flIT t. \JIl Cf)1~dCf)I'< m ~ ~ m qIRClIRCf) ~ "it ~ ~ "it ~ "'1Ift -g-I '3l.CPo'
qft ~ ~ "$ ~ ~ ~ Cf)4·tll-:1, '1'1'<41R;iCf)1 "$ ~, 3fUlT!lCf), Cf)1'<i!SIIY't "it "CflT'i ~ ~, ~ ~, ~, ~, ~, ~, ~, ~, f.1'ituT, '<1\ij~R1Cf) m 'tlt'iIRi1Cf) "Cf>"T<Il "it
xxxii
~ ~, ~, I'j;:iH"I'1 ~ ~ Cf)(.11 Cf>b! , m ma t I ~ ~, Cf>1~dCf>I'< m ~ ~ m
QIRqIRCf> ~ ~ <PT ~ "irt'f 'fflft Cf)J+1 ~ ~ '~ ~' ~ I
~ ~ ~ -.r ~ ~ $- <fuR <Ptf- q;l<f -.ffif f.lurr 2lT cIT ~ iR -CfJ1fT ~ 'l<IT I ~ erR 1R iR-~ Cfft ~ 1)' Piklf&fula 3ffif ~ :-
~ ~ ~ 3lWCIT 31 ~a PI cp ~ ~ ~ ~ cppfq,CWl" -.ffif f$<:rr t; 1J6 q;pf "Gil ~ ~~. ~mq>~. ~qft ~~, llAtC11'l, ~ ~~~ <lR'dT m ~~ ~ (31~a Pi <t» "ij; ~ "ij; ~-'& fcli5l;:fl arncrr 'ffifi -~ 3r.?lCIT ~ \3CQ'JCR it ~ ., CRdT ffl m; an&f ~ ~ 3lWCIT 3Tf$p ~ ~ ~ CJ>lfi qft ~ if mfJi(;r ~ f$<:rr 'l<IT m; ~ "Gil ifIQIPiqt1 51 ~ 51 'd"2IT ~ ~ w 51 ~ ~ 3lTfficI> cnl4cn(.1IQ "'TIff CIR w if; ~, 3ll'CJm/Ijf1Cf<t>'$, ~ 'd"2IT ~ "C2l'fcffi ~ ~ ~ ~ q)f lRIT -=riff t ~ ~ ~-~ $~ q)f lRIT -;:ffif t ~ ~ ~ ~ "ij; cfm;r ~ ~ \3~IGCf5 ~ -=riff fclKrr t ~ ~ ~ ~ it it ~ iN-cn4\ ~ ~(i'QCf5IR:lCf> ~ ~ t"Gil ~ ~ it ~ ~ '4T M ~ <n:ff 3ffit ~ fctm-m m.fi, ~ "$ &NT ~ ~ ~, cpf{{ <IT iN ~ ~ "ft ~ ~ ~. 'tI"I11I1'Rl1 ~, '11"lRiCf> <IT ~ ~ it ~ ~ czrfcffi "IT ~ ~ ~ 3lC1aPiCf> ~ ., ~ ~ 51 ~ ~ ~ "Gil <Pr1 Cfft ~ ~/<f>T11 ~ ~ ~ ~ I
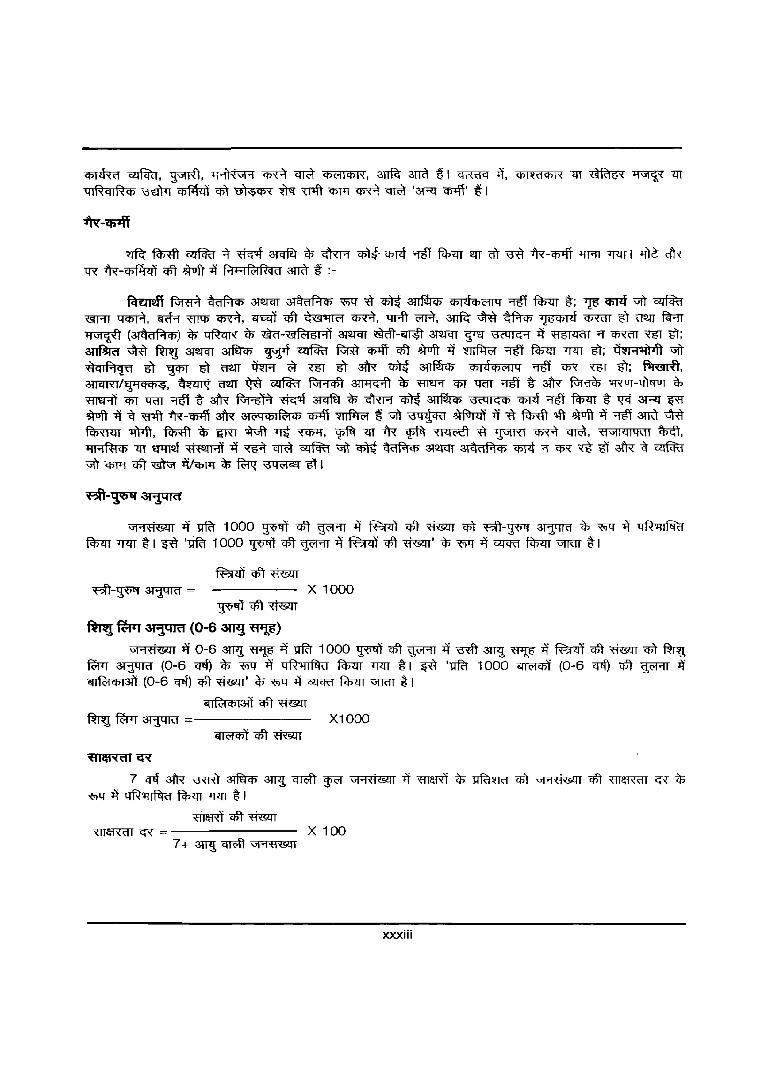
"I '1 'l1&:1 I if ufcf 1000 ~ Cfft ~ ~ ~ ~ "ffism "<t>T Bfi-~ ~ $- "WT 1)' ~ fcf;-m 7J<IT t I ~ 'IDa 1 000 ~ Cfft ~ ~ fBf<rr Cfft ~' "ij; "WT ~ czr<ffi f$<rr vnm t I
fF.srm ~~
~qft~
fmj ~ ~ (0-6 awj~)
X 1000
"I"1'l1&:11 it 0-6 3Wl ~ ~ ufcf 1000 ¥tIT ~"¥FIT if ~ 3Wl ~ if ~ ~ ~ <fiT ~ fWT ~ (0-6 CfIf) ~ ~ if ~ fcpm 'l<IT t I ~ '~ 1 000 ~ (0-6 Cflf) qft "¥AT if 'uR-iCf5laIT (0-6 Cflf) Cfft ~' * "'(i)q if ClfCRf ~ "lTdT t I
~:m Cfft WY:rr X1000
~~G'{
7 CI1f ~ ~ 3Tfucp ~ CfiC'fi WC'f "l"1 fi&ll if WOO -ij, ~ CJJl "l '1 'l1&:11 cBT "f!T~ ~ "ij; "WT it ~ ~ 'l<IT tl
w~"G"'<"= X 100 7 + 3TT1l cm;ft "I 'i ti 'MI
xxxiii
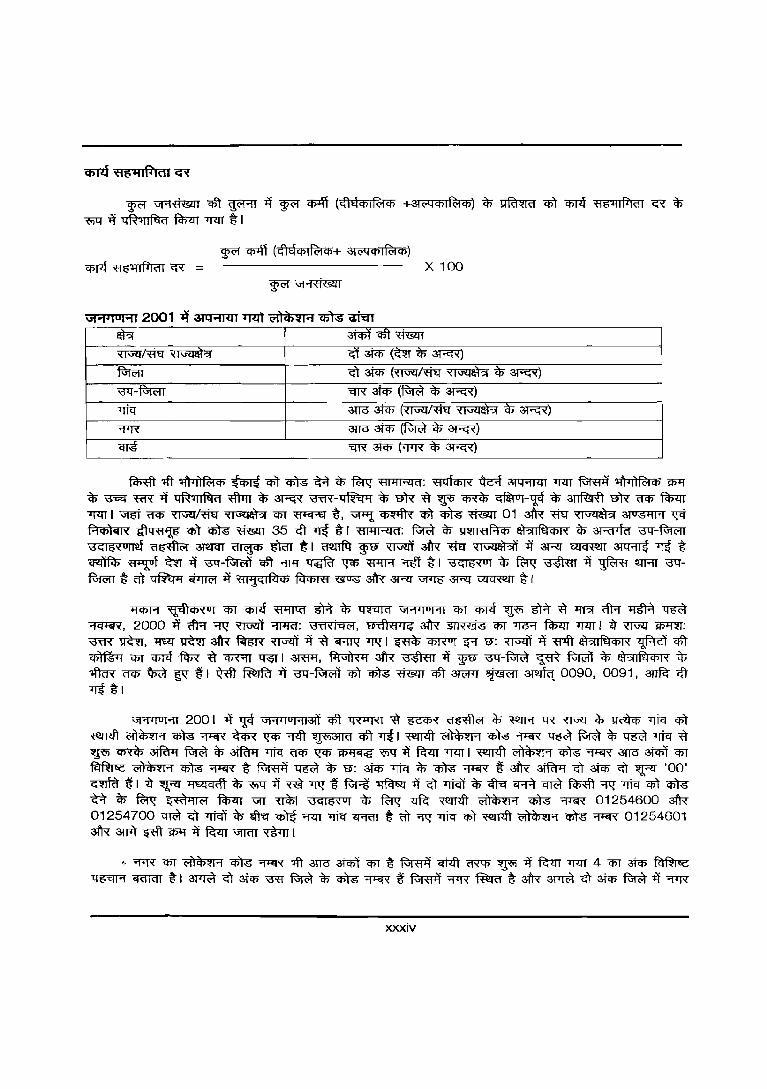
~ VAmsm qft wr-n ~ ~ q;J.ff (<flEl"if)I~if) Hl("Q if)1~ if») ~ ~ Cf>l ~ ~ ~ ~ "'{ijQ' ~ q R :q 1 ~ d fcmrr '7J<IT t I
X 100
.- ~ at<t>l qft ~
~/~~&P.f ~3tcP (~~~)
~ G) atcn (~/"&q ~&P.f "$ ~)
\'3Lr-~ "qR atcP (~ "$ ~)
<TIer 3lTO at<t>" (~/~ ~ ~ ~ "I'R \ffiO 3l'cP (~ "$ ~) cn;t "qR 3tcp (~ "$ ~)
~ 1ft ~ <t'tR?tif) ~ q;'t • ~ "$ 1m; +11"1 I~ d: fI QfC6lo( "4c;;f a:rq;m:rr '7J<IT ~ lOtI' 1'1 ~ if) Q)lf
~ ~ ~ it qR:qIfl\d ~ "$ 3RX m'R-~ "$ "9)'{ ~ ~ ~ ~-wf "$ ~ uN Q<f) ~ ~ I \1!6i Q<f) ~T\j{jl~ ~ em ~ t, ~ ~ Cf>l m ~ 01 $ ~ ~ ~ ~ Piq,).U< I4'lqfl~15 q;l ~ ~ 35 eft ~ ~I fll"ll""4d: ~ "$ !OI:;OllflPiCf) ~ "$ 3RfTftf \N-"R;rc;rr 'dc;16O(011'lf ~ ~ ~ mm tl mmq ~ ~ $ "ftEi ~ ~ ~ ~ ~ ~ t ~ ~ ~ it \')Q'-~ qft "'fT"if ~ ~ m ~ t I '3<:;160(01 "$ ~ ~ it ~ !lJFIT '3'l
ftrc;rr ~ m ~ ~ ~ 't1ljC:I~q; f<r<t>m ~ 3iR -3Rr ~ ~ ~ t I
lfCPR ~.q'jC6\:01 em Cfiflf ~ ~ "$ ~ \11'1<10111 "C6T Cf>flf ~ m ~ l11?f ~ ~ ~ ~, 2000 ~ <fA ~ ~ ';ffJffi; \3thd'il&l, 9'i'ft'fl<14 3fR ~ Cf)T 1l'<Ff fcm:rr 1TlIT I ~ ~ ~: ~~, ~ ~ ~ fiI1m ~ it ~ ~ T)'"ql ~"CJ}RIlT ~ 'J: ~ it 'f1'lft rfl?lI~Cf)I'< ~ qfr
~ <PI q;rzf m ~ ~ ~I~, ~ 3fR ~ it W'J \')Q'-~ ¢ R;wit"$ ~"$ ~ Q<f) ~ ~ ~ I ~ ~ it \3"tJ-~ "C6T • "ffis;!n qft 3fNlJ ~ ~ 0090, 0091, ~ eft ~tl
\11'1<'UI'11 2001 it ¥ "1"'1'IUHI,* qft ~ ~ ~ ~ ~ ~ ~ ~ "$ ~ 7Jiq "<t>T ~ ~il¢~I"'1 m ~ ~ ~ ~ ~3TRl qft ~ I ~ cl~¢~I'1 $ ~ ~ ~ ~ ~ TJiq ~ ~ ~ 3{fcp:f ~ ¢ ~ Tfiq "Wf) ~ ~ ~ it ~ Tfm I ~ ~ m ~ ana 3lcPT "C6T "fclfW;c <i?i¢'tI'1 m ~ t ~ ~ "$ 'J: 3icf> 1"Jiq "$ m ~ t ~ 3ifu<:r cIT at<t>" cIT ~ '00' ~ t I ~ ~ ~ "$ ~ it ffi T)'"q t ~ ~ it G1 "I1icIT ¢ <ttq m ~ ~ ~ Tfiq Cfi't ~ ~ "$ ~ i:i'ffi..,lcl fcpm \jfJ ~I \3<:;115'<01 "¢" ~ ~ ~ ~ m ~ 01254600 3l'R 01254700 ~ G'r 7ltciT ~ ~ ~ "1m Tfiq ~ t- tit ~ TJiq"C6T ~ cl)en::!l"'1 m ~ 01254601 3fR aWl ~ ~ it ~ "\i1TdT ~ I
~ "l'R Cf)T t'I)en'tI'1 ~ "'fl'<R ~ 3lTO 3Tq;'f <PT t-~ 'E'fi<ft ~ ~ it ~ ..,-m 4 <PI 3tcP ~ 1:fm ERflQT t I 3~ G) 3tcP ~ ~ "$ m ~ t ~ ~ ~ t 3fR :wrn G't 3icf> ~ it ~
xxxiv
<1ft w+r ~ CfiT ~ ~ I aRT -it ~ ;$ xqq -it -aFr ~. ~.TfC; ~ ~ ;me 3lcP1 <1ft ~ ~ m "ffift t-~ ~ l1tq ~ ~ ~ cp)-;s ~ ~ at<P1 ~ ~ ~ £f{lER ~ ~ ~ ~ t-I 3Rf:
40305000 ~ ~ "fHR ~ ~ 03 Wl1 ~ ~ ~ ~ w+r ~ 5 ~ ~ CfiT men t-I ~ ~ i[@ fctvm CfiT ~ ~ ~ ~ ~ "fHR ~ ~ :nr ~ I c't i[@ fcrcm1 m ~ ~
~ ~ t \R 0flT'ff ~ ~ crrn ~ ~ ~ \'ffit w+r -it iffiU FcrcPmT em ~~iRt<tl crrn ~ ~ ~ t I
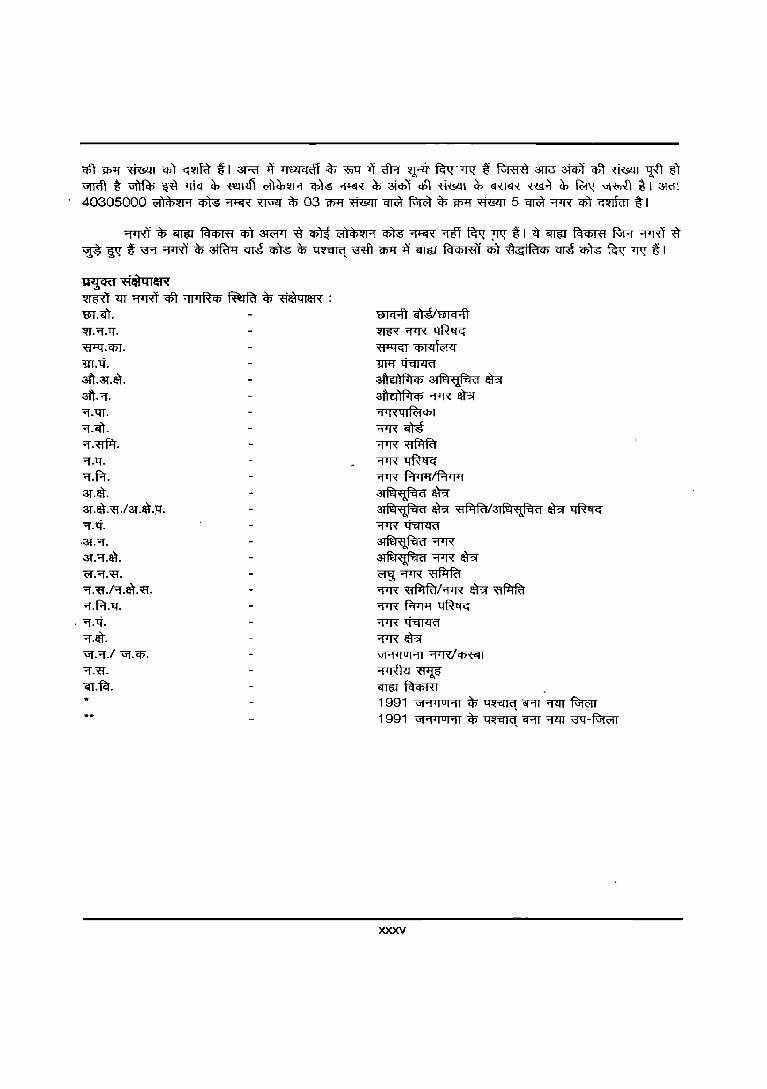
W:ICRJ -flll)trrllR ~m~<Ift~~~~: m.m. ~.Of.ll.
~.cpr.
m.ll, 3ft.3l.1ff. 3ft. Of. Of.lU. Of.m. Of.~. Of.ll. Of. f.1. 3l.1ff. 3l.1ff.~.!3l.1ff.~.
·3l.Of. 3l.Of.&'r. ~.Of.~.
Of. ~ .IOf.al. ~. 'l.f.1;q.
. Of.ll. Of.al. 'GJ.'l.l Uf."". 'l.R EI1:fct. ...
mq.ft mvmcr;ft ~0flR'~ ~ <tll"lfiil<l
1Wf~ :Ml Eillil if) ~ Iff?r :Ml ElWI if) 0flR ~ "I'I>:ql~if)1 "'1'R ElM 0flR'~ "'1'R~ "'1'R ~r"Tl:1If~f<Ff
~Iff?; ~ Iff?; ~/~ Iff?; ~ 0flR'~
3l~~d 0flR
3l~'tt~d ';flN Iff?; ~0f1N~ 0flR ~/0flR Iff?r ~ 0flR f.1lFf ~ 0flR~ 0flR Iff?; 1J1'1'I OI'11 0f<R/~
'1"lT& ~ i[@ f4ct>m . 1991 1J1'1'1 01 '1 1 ~ ~ <PfI '1<IT ~ 1991 1J1'1'1 01 '1 1 ~ ~ <PfI '1<IT '3q-1vK>rr
xxxv

TT~ ~, ~ ~ ~ ~ 1{ ~ ~ I 2001 1{ ~ \iI"1'fi&l1 80 ~ ~ I \iI"1'fi&l1 qft ~ ~ '1w ~ ~ ~ ~I ~ if ~ 18 ~, ~41 ~ (~), 40,782 m-f, 37,945 ~ Ql2ll
2,837 tR-3TIiITG ~I 2001 qft \iI'1'luHI '$ ~ ~ if ~ 375 "l<R ~ ~ 123 ~ Ql2ll 252 att1il4~q> ("'1'1'1 0 1'11 ~) ~ I
2001 qft \iI"PI OI'11 '$ ~ ~ ~ ~ ~ "'1 '1 'fi&:l I 80.1 ~ t, ~ 41.4 ~ ~ ~ 38.7 PlR:i<l'1 ~ ~I Cflt 1991 1{ ~ qft \iI'1'fi'l..c.ll1 68 ~ ~ ~ 35.5 ~ ~ ~ 32.5 ~ fBt<:iT ~ I m1ftur -.:ret ~ ~ ~ 3llilR ~ W ~ '!<IT frp ~ cit 72.0 ~ (57 ~) "'1"1 'fi &:I I -m+fiuT ~ 1{ .~ 28 ~ (22.4 ~) \iI'1'fi@41 ~ ~ it ~ ~ I 1991 ~ "l"1'IOFil if 72.5 ~ "l'1'fi@41 ~ ~ 1{ ~ 27.5 ~ "l"1'!]@41 ~ ~ if TJ'"O"AT qft ~ ~ I ~ ~ ~ ~ ~ \iI"1'fi'&l1 ~ ~ ~ ~ I
"l"1'fi'&l1 qft ~ ~ iI~;:ft ~ ~ anqrcft cmffi fC;:r(;rr t ~ iJI"1ti@41 9 .6 ~ t I
d~\!tjld ~ ~ ~ (8.9 ~) em ~ t I ~ ~ lR" '4t ~ ci'r=IT ~ tlCjf~ an<rr<ft ~ ~ ~ 1 ~ ~ "l"1'I O I'11 2001 ip &jt1R ~ ip -aFT 3RT ~ ~ ip 10 ~ 3lRTCft ~ fGrffi ~ Jl)-uft ~ '('1fil1R>id ~I ~ ~ ~ -~ ~ "tR7RT (6.9 ~). ~ (6.9 ~) ~ 4j)~I~I,sll~ (5.9 PlR:i<l~) I 2001 ~ ~ '$ ~ ~ -qcp PlR:i<l'1 ~ 3lf$p "I'1ti@41 ~ ~ I crtiffuT cfl"1I\il~ qft "I"1'fi@41 ~ q;+f 1 .5 ~ tl ~ "IlG GIRilffil'1 R>f<;rr t ~ \iH'fi@l1 1.6 PlR:ilf"1 t I
~ 'QCt ~ "1. "'1 '<1i!Slf I
\iI"1'I OI"11 2001 it ~ qft ~ \il"1'B@41 4,67,905 ffi uit ~ \iFI'!]@41 ~ 0.6 ~ tl ~ ~ \iH'fi@41 (3,57,474), Bft \iI'1'!]'&Q1 (1,10,431) ~ ~ tl ~: ~ "l"1ti&:l1
1991 01'1'1 0 1"11 ~ '3fffiRstd \11 '1 'fiMI 3,16,688 (0.2 ~) ~ EJ<t't tl "1"1'1 0 1'11 2001 1{ ~ ~ ~ qij(it Ci)id I qft ~ WI't1@41 (91,857) ~ t -.:ret 'k"tlfc1ltw< ~ qft ~ Cfj+f (8,099) 1
~ if <h:rif qft \1I"1'fi€'lOl1 1991 \iI'1'I OI'11 if 1,11,211 ~ ~ 2001 iJI'1 '1 0 1"'1 I if 1,10,535 m ~I l'lRl\!lddl ip 3lT'CIR tR <h:rif qft \iI'1'fi@41 1991 if 0.47 ~ ~ 2001 if 0.14 m ~I ~ ~ qft ~ if 'f)l(itCPldl ~ ~ qft "I"1'fi'&l1 (67 ,676) ~ t uit ~ qft ~ ;fqx "1"'1 'fi '&I I CI>T 61 ~ t ~ ~ ~ if ~ qft \iI'i'fi'l..«11 (535) ~ Cfj+f t I
at'N.~d ~ \JI"'l'<1i!Slf1
~d ~ qft ~ uIT1991 if 16.1 ~lFf~, 2001 if ~ 18.5 ~ m ~I ~ """:tliiG=I=Q(1:::ftfl if w 1991 '$ 23.6 ~ ~ ~ ~ if ~ 2001 ~ 23.01 ~ m- ~I ~ ~ 'fi*IIR=td aT?IT if ~ ~ ~ at1~~a ~ qft \iI"'Iti'&ll 5'lRl'l!lddl '$ 3lT'CIR ~ ~ ~ ~ tR t I
2001 \11'-1'1 0 1"11 '$ ~ ~ ~ if 3lm~d \ifTR1 qft ~ ~ WCit" \1I"'I'fi'&l1 em ar:rmr ~ ~ * 'k"tlfc1lt:I"! (50.1 ~) ~ Cf)f tl ~ EITCr iJI(itql~~ (36.7 ~) ~ Cf)f ~ tl CRWi: 2001 \iI~I'IOI"11 if 'k"tlfc1l!m ~ 1{ 3lj~d "\iITRl" qft \iI'1'fi'&l1 CI>T ~ ~ ~ 3R ~ qft ~ if ~ XOT I 1991 \11'1'1 0 1"'11 if '4t <ffiT ~ ~I ~ if atmRld ~ qft Gi"'I,!]'&l1 em ~ cr;l&lq;ldl
(6.G ~) if ~ Cf)11 ~I ~ EITCr 'j~IGI6jIC: (12.0 ~) em ~ XOTI 2001 if at1.t~J~(1 ~ qft iJI"'I'fi'&l1 em ~ CP~(i1Cf)I(11 em ~ wft fGrC1T if 10 ~ ~ ~ XOTI
xxxvii
31 ~d u::r;:r '\iIl'fa
~ ~ ~ "I"1"lIRi "I '1 {{&:I 1 1991 ~ 3.8 ~ ~ vi'r 2001 ~ ~ 4.4 f¥WR "8T ~ I ~ ~ ~ 1:fx ~I \1I'itixo.'4l ~ XJCf ~ 1991 ~ 5.6 >rfumr ~ ~ 2001 -.l 5.5 ~ 51 ~ I ~ ~ ~ 'Jj(.'1ql~"J41 (18.9 ~) ~ qft 3l1~a Gt"1"lIRi qft Gt"'N:1"@011 <PT.~ ~ ffi I ~ ~ ~ (18.3 ~) l{Ci ~ f4'iIGt~ (16.1 mmm) <PT ~ Wi <p)<"l4>ICI1 it 3l"j~a \1I"IGtIR'l qft Gt9fi"@Oli cpr ~ wRt Cf)ll (0.2 ~) ~ ~ ~ <PT 0.4 ~ ffi I
~~
~ ~ 1N ~ Gt"1fiL'41 ~ ~ vi'r 1981-1991 ~ c:'RFr 23.9 ~ ~ 1991-2001 ~ ifrq ~ 21.5 mmm 51 ~I ~ WPR <ro ~ ~ WltiMI ~ W[fi1 cn1 ~ ~I ~ ~ qft W'f'""IT ~ ~ ~ if \1j"1'l1'1Sl11 ~ COT ~ ~ XJCf ~ l::I'Cffi '\1jT xm ~ I 1 981-1991 ~ <:Ti3' 24.7 ~ ~ urr 1991-2001 it <re<iR 17.8 JJfum; m TflITI 1991-2001 '&> cfRR ~ if m<frur 3tq(;r ~ ~ Gt"1'f1&:11 ~ <PT ~ (17 ~) ~ ~ ~ ~ "'1"iti'@Oll ~ ~ ~ (19.9 ~) ~~ Cf)ll ~I 1991-2001 ~ 'GRFr 3l:w;RI(j ~ ~ 31~(j "1"9' ~ qft "'1"1'l1&l1 ~ G'{ ~C1 \1j 'i tixo.'4l ~ ~ qft W'f'iT ~ ~~J: 14.8 ~ 1;fCf 15.7 ~ cplf Xift r
1991-2001 ~ ~ ~ Iv!m it ~ <ft""ll"l'j)'< q,i ~ (28.7 ~) ~ -zy "<1fi ~ <P1C'l4>rClI ~ ~ cff.iI GX 3.9 ~ ffi vIT fcp ~ ffi I
"C!'P 'Cf<'t fcp(."1)4k;;: if ~ "'1;H=iL'41 cn1 Vl1fi&l1 ~ ~ XJCf if ~ fcpm "fffiT ~ I Gt"1'<k'4l
~ qft ~ ~ ~ <FfR;r ~ Cij'iti'@Oll ~ 903 ~. 2001 ~ ~ qm 'l1tHliffid. aT?n ~ ~ ~ 1N ffi I ~ ~ ~ ~ '&> ~ cpf f<h(."1',,·nc'i! ~ 136 ~ qft ~ ~ cmTfcn 1991 if "1 "1'<1L'41 ~ 75 'ClJfffi' l1U I ~ ~ <PT Gt"lx1&l1 'EFR"f ~ ~ '&> Gt"l'<1'@011 'EFRt'T urr 325 Clffffi- JrRI' CI7t f<h<>il4k"{ ~. ~ ~ -aFr 'TIT ~ I
~ ~ if <pi C'l4>r fir '4>T "1"1 <1'<9011 ~ \iIT 24718 'C2:lfffi' .l1RI' Cflt FcPC'1i4k;'i! ~. ~ ~ ~ ~ ~ \ij"1<1&l1 ~ 405 ~ IDa cpf RPcli4)ciO( t ~ C!)11 t I
~-~~
~ 1000 ~ lR ~ qft~. cn1 ffi-~ ~ ~ ~ it ~ fc)Rrr ~~. ~ 'iO(1'lflf '&> ~ ftflr ~ em ~ Cf5T <ro "C!'P ~ ~ t I .
1991 if ~ ~ ~ "'1"iti&:l1 '4>T ~-~ ~ 917 ~ f<tRrr 'T?:IT ~ '\ill 2001 if ~ 934 51 TflIT I GWCP $-~ ~ '$ mlftur ~ ~ GRf .mn it ffi-~ ary:rm it wm- S31T I m+ftur ~ if 'lf5 940 ~ ~ 950 'S3lT ~ .~ ~ if <ro 858 it ~ 893 m TflIT I 2001 if iJf44)'j)'i! ~ cpr ffi-~ ~ (955) ~ '<N ~ cp)C'lCfikll <PT ffi-~ ~ 829 '<N vIT ~v+l~1
~ qft 31~d '\1I'Tfu' "1"1x1'@011 if 1ft ffi-~ ~ 1991 if 931 X5T vIT 2001 if ~ 949 m TflIT I 2001 "1'1'1 0 1'11 ~ ~ ~ ~ ~ ftR;rr if ~ ~ ~ \ij9'<1'&l11 cpr ffi-~ ~ (977) ~ 3@rcp ffi ~ <p~I:'1Cjjlijl 'if ~ "Wffl q";l1 822 ffi I
1991 if 3l1~d \ij'iVlIRI \ij"i'l1L'41 if ffi-~ ~ 964 QTT vIT 2001 if ~ 982 it 'l'fm I ~ ~ 'tf{ ~ m -q 3l1~d \ij"l"lIRi \ij"l'f1&11 '4>T ~-~ ~ (iOI1) ~ ffi ~ 4)lC'1Cfildl if <ro ~ 'Cfi11 ~ 793 we I
xxxviU
fmJ ~-~ ~ (0-6 ~)
2001 if ~ ~ "IN 0-6 3W.! ~ cpr -eft-~ 3TTTffi 960 ffl ''It 1991 if 967 ~ I ~ fcj'<IIQI'1itl -S- fcp-~ if 0-6 ~ ~ cpr -eft-~ ~ ~ $" ~ 2001 "f1'1 0 1"1! If ~ 3ftmr 927 ~ WRT II ~ ~ 3l11Q:<p ~ 1 3lftffRJ \ifTfd $" ~ if '4l fi~J 'f-;ft-~ ~ 961 ~ ~ 9b8 S3IT -S-~ 3i:WJ~CI U'I"1"1IRt $" ~ if 1991-2001 "$ <ftq ~ ~ ~ ~ 983 ~ ~ 981 ~-m ~I ~ if j~lql<4IG 3fR ~ ~ cpr ~ Bft-~ ~ ~ XID \TJT ~ ~ $" ~ 972, 3t~q \JfTftr \Jj"1'<'i~l:Il $" ~ 970 ~ 3!'j~CI Ufif ~ \Jl1'<'i&11 $" ~ 1012 XBT f ~ fctqfu 2001 \i11'I UI11 -q Cfll<"1q)JClI -q ~ x=:fi-~ ~ ~ cp+:f ~ fctRrr "lflIT W w<'f \Jt1'<'i'l!A1 ~ 3im~d ~ \i1"1ti'l!Al "$ ~ ~: 927 ~ 931 WI
0-6 3ml ~ if fmj \iI'1'fi&:l1 em ~
\Jl'1110HI 2001 if ~ ~ "IN 0-6 31l<l ~ if ~ \1l"lti'&ll cpr ~ 14.2 ~ XID ;:;IT 1991 if 17 ~ ~ I 3!m~ij ~ $" "fiG1t if 0-6 31l<l ~ \1l"1ti'l!Al cpr ~ 1991 if 18.8 ~ ;:;IT 2001 if ~ 15.1 ~ m '"!<IT 1 3!m~ij Ufif "\Jl'"Tfu $" ~ if ~ 1991 ~ 19.5 ~ ~ ~ 2001 if 16.7 ~ m 7J?IT1 ~ wffi1 ~ w ~ mm ~ fcp WN-f if "ff4t ~ "tR \Jl'ifi~f <)7 Iff';! if ~~Cf511m~tl
~ $" \3"-ffi" R .... I"1~ ~ if 0-6 31l<l ~ if ~ \Jl"'1ti'&ll cpr ~ 2001 U'I .... II O I'11 if ~ XID ;:;IT ~ U'I"'1fi&11 -ij> ~ 21 .0 ~ 3i~i;1 ~ -ij> ~ 1 9.3 ~ Q1!ff 3!'j~i;1 U'I"'1\1lIRt ~ ~ 21.4 ~ ~ I ~ ~ CfllC'1Cfllql fGffi -q ~ U'I'1Xl'l!Al crft 5'lRt "I1C1ct 1 cpr ~ ~ ~ tp1'f
XID ;:;IT WC1" \1l'1'fi1@Q1 "$ ~ 8.5 ~ 3!mfiii;1 "Il""RI" "$ ~ 10.1 ~"Cr.!IT
C6Tlt ~ OR (~"tftoatm»
'CflTlf crft tll'Plil7lOl G'<, ~ "Q5"1ff (~- G'lt:fCflIR>iCfl 10f 3!(i'<FmR:1Cfl "Q5"1ff) 10f ~ \Jl'1fi'l!Al $" <ftq $" ~ ~ 4IRlilf(li;1 qft "\:il"R'fi ~ 1 2001 if ~ ~ 29.5 ~ \Jl"lti'@(l vIT WC1" \Jl .... 'fi1@Q1 ~ 36.8 ~ ~, "Cfllff ~I 199, if 21.9 ~ ~ ~ ,;FI'<'i&11 crft 32.2 ~ !lfil 'IT"Jll if ~"WPR ~ 2001 -q ~ qft ~ Q1!ff ~ ~ if \j<icl~;ftl:l ~ ~ t I ~ ~ ~ ~ if <J>Tlf tltHUll'iijl
<R cpr ~ 44.7 t un-~ ~ t f ~ i("]Ci ~ ~ ~ ~ cpr ~ ~ ~ 44.5 ~ t 1 U'I .... 'l ul'1l 2001 if"CflTlf ti5'1IfTli;11 <R cpr "t1Cffl Cf511 ~ G1muT ~ qxTRT ~ Cf>T t ;:;IT 32.5 ~tl
"' .... 11 01"'11 2001 -ij> 3j"JqR "IN 18.4 fllR>i4'1 3i'j'<i~C1 -;:;rrftr if 7.1 ~ "Q5"1ff tl ~ m 4.4 ~ 3! m~ CI Ufif ~ if 2., ~ "CZffffi" "Cfl+\T -S- I 3! :w;fiICI "\JfIfu "Cr.!IT 3! mFel C1 Gl., Gl 1 Rt -q 'CflTlf tii5lilfT'li;11 ctt ~ WC1" Gl"lx1'&l1 ctt 3lllen ~ ~ 1 3!mFeld \3'I'J"fff ~ ~ if <fiT"li ~ ~ 1 991 ~ 33.3 ~ ~ ~ 2001 if 38.8 ~ m "Il1f ~ 3!~CI \Jl"1GlIRt if w 1991 $ 52.3 ~ ~ ~2001 if51.2~m~1
31j'<iRlCl "Il""RI" $ ~ if ~o ~ 3[R0 g'QR:1l:1l $ ~ 47.1 ~ ~ CflIC'lCfl((11 $ ~ 7.2 ~ $ 6ffq ~ ~ tl 3!mRlCl Gl"1GlIRt "$ ~"$ '1ft ~"lltft m ~ ~ ~ ~ ~ 1:ftO 3!NO ~ ~ ;:;IT Wl'ro: 47.8 ~ 8.6 ~ ~ I
~ ~ CIft cpf4 ~ ~
~ ~ "tR ~ 'ill . ..., '<'i ,@(I. 31 'j.eyq CI ~ \'J1"1 x1 &:II "CI1!lT 3! 'j.eyqCl Gl "1 \Jl I Rt \'J1'1'<'i&:l1 if ~ ~ "CflTlf ~ <R cpr ~ ~: 54.0 ~, 54.4 ~ ~ 53.8 ~ tl 2001 -q ~ ~"IN
xxxix
7.1 ~~lFI (18.3 ~) ~, cplff i$' ~ if ~ c6t ~l 3l~d ~ ~ 3lft~d \3R "Gf1ftr i$' ~ if ~ ~ cpr ~ ~: 22.3 d"2IT 56.3 WI fF.:irm i$' 'fi<rlt if cm<t ~ CR' 1 991 ~ 11.3 ~ ~ ~ 2001 if 18.3 ~ m l1il ~ ~.x=::ft ~ ~ m ~ CR' em 3RR ~ ~ ~ 1991 ~ 40.0 ~ ~ ~ 2001 v1"PIUHI if 36] ~ m Tfm[
(fh;fcPl ~Cf) ~ 31 (Xi C6 I R::iC6 CIilft
'(]\".Kf ~ ~('f ~ if 23 ~<Pl ~ 78.1 ~ ~fucp ~ ~ 6.5 ~ (21.9 ~~ 31 &<l <t>1 i"<1Cf> "Cf>1ff t I f.RiiaT ~ xl cfl EfCf>1 ~ <t> ~ c6t ~ "IT 1 991 if 20.6 1B1'WR 11ft 2001 if ~ 23 ~~lF1 ~ ~ 1 ~ cflEfCf>IF&iCf) ~ cpr ~ 1991 if 93.9 ~ xl ~ 2001 if 78.1 ~ m Tfml cflEfCf>Ii"<1Cf> ~ ~ ~ if ~ ~ 3l&<lCf>1R1Cf> ~ ~ ~ em ~ ~ \ill 2001 if.a{(iq <t>1 R:I Ch ~ c6t ~ if WlR ~ "Cf>RUT S3l11 ~ "fRlCf ~ cr.m ~ <IT<i'f -ij) "6T ~ if s3lT[ ~ -ij; ~ if ~ 98.6 ~ ~ ~ 87.1 ~ ~ fF.:r<fl ~ ~ if 70.8 ~-;ff ~ 49.7 ~ m "llml 3l&<l<t>1R1Cf) ~ c#t ~ \31) 1991 if 1.3 ~R1lFl ~ 2001 if ~ 6.5 ~ m ~ 1 ~ m ~ it 3l<"G<t>IR1Ch ~ qft ~ it \1cffi~4'lll cffia ~ I ~ 'Qq ~ ¥f ~ II 3J(iqCf)Ii'&<t> ~ <m 3r:rm'f ~ c:rm ~ 3l(?<lCf>Ii'&¢ Cf#rm CfiT ~ 1 991 ~ 6.6 ~ 1.4 ~ ~ 29.2 J@rmr -;ff ~ 2001 if 'W"l'm: 21.3 ~ 12.9 ~ l{Ci 50.3 ~ ~ 7J<IT1 <rg
'tl"/:IjiFiht ~ fcp 2001 "1"14 10 HI it ~ d"2IT ~ '\1W1r-~ if ~ l0i 3J~df.'tCf) q>[l'f c#t w.:a ~ ~ I 3lftRJd "VI'lftr m- ~ if 1991-2001 m-~ ~ <"fhjCliIfc;!Cf) ~ <1ft ~ ~ ~ ~
~ ~ 1991 ~ 31.1 ~ xr ~ 2001 if 28.7 ~"ill TJmI 3JmRJd mFcr ~ ~ if 1ft cflQ(I'iI~<t> ~ em ~ 1991 ~ 51.3 mamr"ff ~ 2001 it 46.1 ~"ill Tfm[ ~ fBp:IT if <:ffi ~ 9.4 ~ "ff ~ 10.3 ~ m Tfml 3l<"GCf)1({;J$ ~ ~ ~ it '4t 1991-2001 ~ ~ ~ ~ ~ I ~ 3lQ'G<t>1IT>iCf) C!J1ff if <:ffi 0.8 ~ ~ 8.3 ~ ~ "Bfi 3l&<lCf)lfcl<t> C!J1ff if 3.8 ~~12.0~"ill1lm1
~ VJ'i{i"&l1 ~ 3lj'iRla ~ VJ'i{iL«Ol1 <)J ~ ~ <)J fcrcrfuf 3ij'<'!R1a VJ'iVJIRi ~ ~ if ~ ~ ~ ~RI~lddl crr.n if !ft c:rc;rq ~ fcp-m 'flIT % I 3jj~d VJ"1\J1IR1 if G~lclCjjIR1Cf) <l>Iff <PI ~ 1991 ~ 43.1 ~ xr""EfCcR 2001 if 32.0 ~ ~ 1lm1 WlfR ~ xl 1991-2001 ~ cfRA ~ if <:ffi "£ICTCf 52.6 ~ "ff 42.1 ~ c:rm fBn:rT if 33.3 ~ -;ff 21 .8 ~ ~ fc)x:rr 1lm I ~ ~ 3Ij~d VJ'iVJIR! ~ 3j<"Gcr>Ii'&<t> cplff ~ Witf if "lffi' ,qR!liilddl ~ ~ "'* c#t ~ "ViT 1991 ~ 4.6 ~ -off ~ 2001 if 16.7 ~ -m TIt I 1991-2001 ~ ~ 3l~d "l"1\JjIRi ~ x=::ft 3l(5'<lCf)1fc;!Cf) ~ if ~ qft ~ ~ ~ ift ~ W "crft 7.7 ~ ~ ~ 21.9 ~ m TIt ~ ~"$'~ if <:ffi 1.5 ~ xl~ 11.6 ~ ml
1991-2001 ctt ~ if 'lfElfQ-~ if C/)1~acpl;(f qft ~ if 10 ~ -3t<t>T qft q;1ft ~ ~I ¥f ~ if ~ ~ 1991 "$' 29.2 ~ -;ff ~ 2001 if 19.2 ~ m Tfml ~ d'!!lT -msm ~ '£fCTCT ~ ~ d'!!lT ~ CPI~dCPI,<1 if ~ ~ I ~ C/)(~dcpl'< (20.8 ~) "<PI ~ ffi C/)1'ta<t>l~ (14.1 ~) <1ft ~ -4' ~ ~I 2001 ~ \i!'1.'Ul'"ll ~ ~ :3lj{i~d ~ ~ 3j~d \J"I'1 ~ ~~-q~~ 10~-qct19.5~WI
~ ~ TfUT Cl?lctcl*U ~ if ("ViT ~ ~ -a-) <PT ~ ~ <t>Jf -a- "crft ~. 3l:wRlq
vnfu mn 31j~a vpf unfu~. ~ $1Wr 0.4 ~ ~I
3Rl' ~ if W<>f Cf)1~dc/)I'<) cpr ~ ~ m ~I ~ if <rg 5.2 ~ cr.m ~ if 31.3 JIfum; ~I 3J1'IiRld vnfu if ~ ~ ~ if ~ ~ 7,4 ~ G2U ~ F«rrx if ~ ~
xl
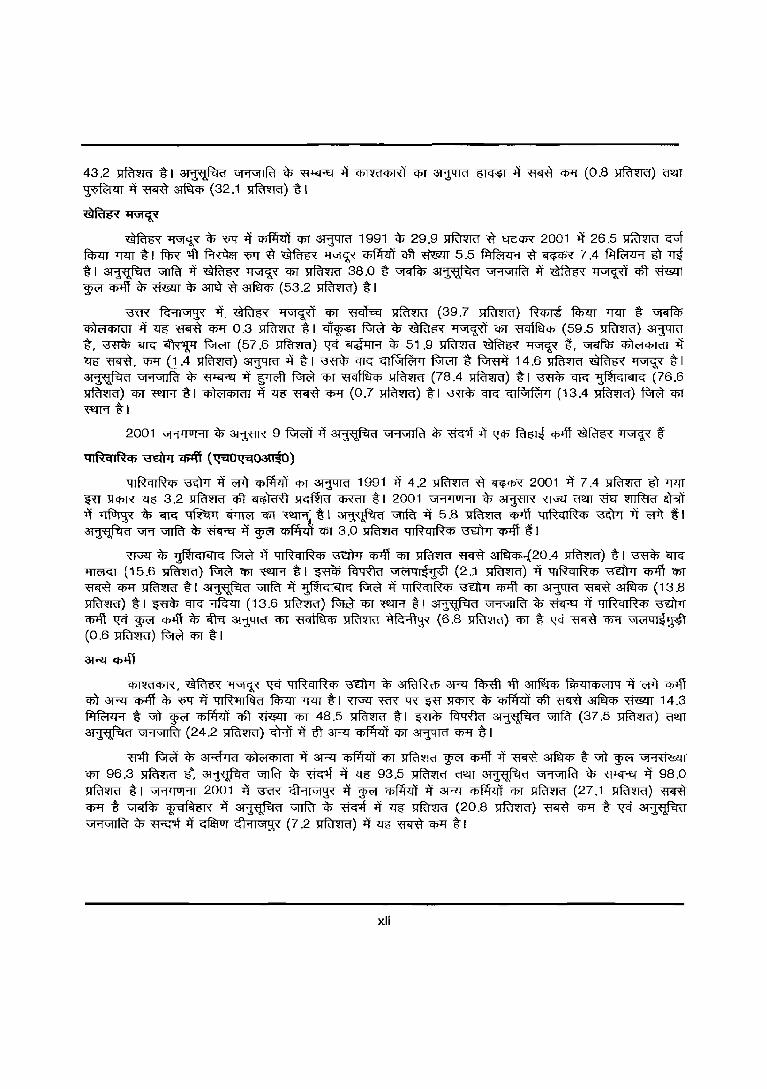
43.2 ~ il ~ \J1'1\J1IR1 ~ ~ ~ Cf)1~dCf)I,,'i cpr ~ ~ ~ ~ (j)'f (0.8 ~) -am '1'<'~lll ~ "Wffl ~ (32.1 ~) i 1
~~
~~~~if ~ cpr~ 1991 <$" 29.9 ~~~ 2001 if 26.5 ~~ fcpm7fllTil m ~ f.RtlaT~ ~ ~ ~ ~ qft~5.5 ~ ~ ~ 7.4 ~~..m il a!1~ct ~ if ~ ~ em ~ 38.0 ~ ~ 31'1~d v1'1\J1IR1 if ~ ~ qft ~ ~ cplff "$ ~ ~ 3lrcT ~ ~ (53.2 ~) i 1
\TIN ~'1I\J19)'( if. ~ ~ cpr ~ >rfumr (39.7 mmm) ft<mi fcf>m 7fllT i ~ 4>lC'1Cf)ldl ~ ~ ~ cp., 0.3 ~ il ~ ~ <$" ~ ~ cpr ~ (59.5 ~) ~ i, ~ 6fIG ~ ~ (57.6 :mmra-) ~ ~ ~ 51 .9 ~ ~ ~ ~, ~ 4>1 C'ICf)lctl "it ~~, ~ (1.4 mmm) ~ ~ il ~ C["[Ct" GIf\Jt~'1 ~i ~ 14.6 ~ ~ ~ il 31mRlct \J1'1\J1IR1 ~ ~ if ~ ~ cpr ~ ~ (78.4 ~) i I ~ C["[Ct" 'j)~IGliSllC;: (76.6 ~) em ~"il cpl<;Y1Cf>ldl ~ ~ ~"Cf>1l (0.7 ~) il ~ C["[Ct" GlfVJ~'1 (13.4 ~) ~"Cf>T ~il
2001 WI'I UI'1I "$ ~ 9 ~ ~ a!1~ct \J1'"1\J1IR1 $ ~ ~ ~ ~ CJ>lff ~ ~ ~
41&cU&C6 mWT q;lfi (~~031®)
4IRqIRCf) ~ if C'f'l ~ "Cf)f ~ 1991 if 4.2 ~ ~ ~ 2001 ~ 7.4 ~ ITI TflIT ~ m ~ 3.2 ~ qft ~".lfGffiq CfROT il 2001 1JI .... 'l ul'1l ~ ~ xruu (J2JT x:m ~ ~ -q ~ ~ (;fIG ~ ~ rm ~~ il 311'li~ct ~ "it 5.8 ~ q>1ff 4IR<nRCf> ~ "it C'f'l ~I 3l~ ct "VR "VfTfa" <$" ~ it WR ~ "Cf>T 3.0 ~ q 1 R q IR Cf> \N.!Trr Cf>lff" t 1
XT\Tlf ~ ~IGliSlIG ~ if 4IRqIRCf> ~ 'CI5l'ft cpr ~ ~ ~,.{20.4 ~) i I ~ iITG
+=rr<.>rGT (15.6 ~) ~ Cffi" ~ il ~ ~ GlC'l41~~ (2J >Ifumf) ii 4IRqIRCf> ~ 'Cf>"lft"Cf>T ~ ~ ~ it 3lm~ct urrfi'r if 'j)~IGI6!IG ~ if 4IRqlf{Cf)" ~"<t>+ff Cf>T ~ ~ ~ (13.8
~) il ~ Cff"G""'1ft"m (13.6~) ~ cpr m il 3l'j)'<iRlct Gl'1\J1IRl <$" ~ if 4IRqIRCf> ~ cplff ~ ~ CIJ1ff ~ rftq ~ <PT ~ ~ "R41~ (6.8 ~) cpr i ~ ~ cp;f \JI<;Y141~~"j (0.6~) ~ cpr il
3Flf "Cj)"1ff
Cf>1~ct<t>I'<, ~ ~ ~ 4IR cIIR<t> ~ -ij;-~ 3RT ~ 'lfi ~ f4i"11<t><;Y114 if C'f1l ~ <t>T ~ ~ ~ "'<'4" if ~ fc)Rrr Tf<IT i I XT\Tlf "ffiX qx ~ ~ -ij;-~ qft ~ ~ ~ 14.3 ~ i \J'fT ~ ~ <1ft ~ "Cf)f 48.5 ~ i I ~ fcNfur 3lj'<'!Rlct "fTFcr (37.5 mmm) -am 3lj'qRla Gl'1\J1IRl (24.2 ~) G'r.=IT ii "8T 3Rr ~ cpr ~ "Cf>ll i I
~ ~ ~ 3Rfrrq 4>1 <;Y1 Cf>lctl it 3Fll" ~ "Cf>T ~ ~ 'Cf>"lff if ~ ~ i "vft ~ Gl'1{i{..«:J 1
cpr 96.3 ~ ff: 31'j)'<i~Cl urrfi'r ~ ~ l) ~ 93.5 ~ ~ ~ Gl'1GlIRI ~ ~ it 98.0
~ t I \J1'1'I OI'11 2001 ~ '3'ffi" 4l'11\i19)"! it ~ ~ ~ ~ ~ "Cf>T ~ (27,1 ~) ~ "Cf>ll t ~ <g~~i!I'< l) 3l~q '\J1Tft'r "$ ~ if ~ ~ (20.8 ~) ~ (j)'f t l[Ci 3lmRld \i1'1\JURl ~ ~ if ~ cf1'1I\J19)x (7.2 ~) l) "lf6 ~ Cf>1'f ~ I
xli

Introduction
The first census of the third millennium and twenty first century the Census of India, 2001 was the 14th continuous and uninterrupted Indian census since 1872. Thus, 2001 Census provides data on
population and its characteristics marking transition from one century and millennium to another. The data would form the benchmark for framing of the welfare and development policies for billion plus people living in this country including 80,176,197 living in West Bengal.
The Census Act, 1948, forms. the basis for the conduct of .population censuses in independent India. The Census of India, 2001 was conducted in two distinct but inter-related phases: the first phase, the Houselisting Operation was conducted between April-September, 2000 in different states and union territories as a prelude to the exercise of undertaking the decennial Population Census. Houselisting Operations was conducted ~n the West Bengal from 1r" April to 16th May 2000. The houselisting exercise provided the basis for uniform and unambiguous frame to undertake the Population Enumeration with the ultimate objective of achieving as full coverage as is humanly possible without any omission of an area or household. During this Houselisting Operation, data on housing conditions, amenities and assets available to the households were also collected. The second phase of census i.e. Population Enumeration, was undertaken between February, 9-28th 2001 (both days inclusive) with a revisional round from 1st to 5th March, 2001. The Census moment was 00.00 hours of 1st March, 2001, the referral time at which the snapshot of the population of the country was taken. This was a departure from the earlier census tradition, as until the 1991 Census (except 1971), the sunrise of 1st March of the relevant Census year was the census moment. The enumeration of houseless population was carried out on the night of February 28th, 2001.
This gigantic operation (considered by many to be the single largest and complex peace time administrative exercise in the world) was made possible due to the door to door universal canvassing of the Household Schedule by about 2 million enumerators and supervisors covering 593 districts, 5,463 sub-districts, 5,1"61 towns and 638,588 villages at the national level. In West Bengal, Population Enumeration was carried out in the entire state covering 18 districts, 341 sub districts, 375 towns and 40,782 villages including remote and unaccessable areas. The comprehensive Household Schedule which replaced the individual slip canvassed at the 1991 Census, had three parts and two sides A and B. Part I contained the Location Particulars; Part II related to the Individual Particulars and Part III contained questions for Household engaged in Cultivation/Plantation (Annexure-II). The part II of the Household Schedule had 39 columns and 23 questions all of which were universally canvassed and no sampling was resorted to during enumeration.
To facilita1e quick tabulation for bringing out Provisional Population Totals, provision for page totaling was made in the schedule itself for a few items, namely population. males, females, population aged 0-6 years by sex, literates, illiterates and workers and their categories by sex. The Provisional Population Totals were put in the pubic domain on 26th March, 2001 within three weeks of the completion of the enumeration providing the basic statistics of the population by sex. The Directorate of Census Operations, West Bengal had released provisional data at the district, sub-district and town levels for State through the publication of Paper I, II and III of Provisional Population Totals. All the provisional population totals released so far are also available on census website: http://www.censusindia.net
Data Processing
A quantum leap was made in the technology front while processing the Census 2001 data both for Houselisting and Population Enumeration. The Schedules for both tlw phases were scanned through high speed scanners in fifteen data centres across the country and hand-written data from the schedules were converted into digitized form through Intelligent Character Recognition (ICR) software for creation of ASCII records for further processing. The designing and formatting of the Household Schedule had to be done very carefully using specialized software so as to ensure uniformity, which was an essential prerequisite for scanning. The selection of appropriale state-of-art technology in data processing has made it
xliii
possible to produce all the Houselisting as well as Population Enumeration tables on full count basis for the first time in the history of Census.
Quality Assurance
After the data is processed, it is expedient on the part of the data produdng agency to satisfy itself about its quality before putting the same in public domain. This has to be done mainly through the process of internal consistency, comparison with similar data in the past and also through validatbn with likewise data if available, from external sources. Quite often the local knowledge and perception has to be brought into play to understand both the eXisting and the new emerging trends of population distribution and characteristics. The other very important aspect of the data quality is to eAsure complete coverage of all geographical areas especially for the population enumeration phase where the data is disseminated right up to the village level in the rural areas and the ward level in the urban areas. Thus ensuring the complete coverage and correct geographical linkage of each enumeration block was one of the major planks of the quality control, especially for small area population statistics.
There has been a major departure in Census 2001 from the past in respect of the procedure followed for finalization of the Scheduled Castes and the SC,heduled Tribes population. In the earlier censuses, the total Scheduled Castes and Scheduled Tribes populatbns were finalized at the time of the manual compilation of the Primary Census Abstracts at the Regional Tabulation Offices, which were specially set up for this purpose. The individual Scheduled Castes and the Scheduled Tribes population for each state was finalized much later based on manual coding done by the coders. In 2001 Census, each individual SCheduled Caste and the Scheduled Tribe have been coded directly on the computers by the Data Entry Operators through a process known as Computer Assisted Coding (CAC) and taken up along INith the processing of Primary Census Abstract data. The CAC process involves pulling down, from the relevant dictionary of the Scheduled Castes and the Scheduled Tribes, on the computer screen and coding from the dictionary by referring to the image of the specific individual entry in the Household Schedule appearing on the screen. The CAC of the response on Religbn wherever required, was also undertaken along with the proceSSing of Primary Census Abstract. This is because the Scheduled Castes status had to be determined in relation to the religion of the individual. Two Special Task Forces, one on Religbn and the other on Scheduled Castes/Scheduled Tribes were constituted for scrutiny and appropriate classification of these responses.
The entire work relating to the data validatbn and scrutiny was completed by the Directorate under the overall supervision and monitoring of the Census Division of the Office of the Registrar General, India with active cooperatbn and support of the Social Studies Division, Data Processing Division, Data Dissemination Division and Map Division.
The format of Primary Census Abstract has been restructured slightly in the 2001 Census. The nine-fold industrial classification of main workers given in the Primary Census Abstract of 1991 Census has been discontinued and in its place, four-fold industrial classification of both 'main workers' and 'marginalv..orkers' are included.
The "Primary Census Abstract-Total population" Table A-5, India 2001 was released in July 2004 which besides population includes certain basic population dlaractenstics such as Scheduled Castes and Scheduled Tribes population, literates, workers by categories etc at India, State, Union territory, District and Urban AgglomerationlCity (with population 100,000 and above)
It was for the first time at the 1981 Census that the Primary Census Abstract was brought out for the Scheduled Castes and the Scheduled Tribes separately on the pattern of General Primary Census Abstract. This practice was continued in 1991 also. In the 1961 and 1971 Censuses, such data are available in Table C-VllI-Social and Cultural Tables and to some extent in the series 'Special Tables for Scheduled Castes and Scheduled Tribes'. Primary Census Abstracts of the Scheduled Castes and Scheduled Tribes population of 2001 Census have been presented in this publication as Table A-8 and Table A-9 respectively.
xliv
The Primary Census Abstracts of Total Population Table A-5, Institutional Population Table A-6, HO\Jseless Population Table A-7, Scheduled Castes Population Tobie A-8 and Scheduled Tribe Population Table A-9 presented in this volume give basic information on the number of households, their population, population in the age group 0-6, literates, total workers, main workers and marginal workers and their four broad industrial categories, namely. (i) Cultivalors, (ii) Agricultural labourers, (iii) Household industry workers and (iv) Other workers and also Non-lNOrkers. This data is presented at different levels, namely, state, districts, sub districts and towns for A-5, A-8 & A-9 tables. For A-6 & A-7 tables the above information is provided up to the district level only. The data for each of these characteristics are presented by sex and rural-urban residence.
It is for the first time the census is releasing socio-economic characteristics of institutional and house less population as primary census abstract. The data given at the district level provides important population characteristics of these segments of population. It would be important for the data users to adopt a certain degree of caution while making analysis and drawing inferences. The concept5 and definitions used in the census have to be carefully studied and issues related to the ground situations encountered during the canvassing of the Household Schedule have to be recognized in order to appreciate the limitation of the data collected in such a mammoth exercise. Although all humanly possible precautions were put in place, validation done, possibility of small processing errors cannot be totally ruled out. Though the data has to be understood in proper perspective, it must be clarified that in any case such unintended errors, if any, should not affect any policy planning exerdse or analysis.
In addition to the basic Primary Census Abstract tables, this publication also includes a nl,lmber of analytical statements on different segments of population such as total population, Scheduled Castes population, Scheduled Tribes population and general population i.e. total population excluding Scheduled castes and Scheduled tribes. These statements relate to descending order of population, percentage of population to total population in each category, percentage of population in the age group 0-6, sex ratio, child sex ratio in the age group 0-6, literacy rates, work participation rate, percentage of main & marginal workers, cultivators, agricultural labourers, household industry workers and other workers. These statements along with 'Figures at a glance' and data highlights provide an overview of the key population characteristics of each segments of the population in the state. .
A list of the Scheduled Castes and Scheduled Tribes notified by the Government of India in pursuance of Articles 341 & 342 of the Constitution of India for each State and Union territory is placed at Annexure-1a and 1b respectively.
xlv

Basic census concepts and definitions
It is important for the data users to familiarize themselves with the concepts and the definitions of the terms used for proper appreciations of the data contained in this publication. At the same time, it is all
the more important to understand the implications of the terms used at the Census of India 2001, for making meaningful comparisons of the similar data generated by various other agencies within the country and with the data produced by other countries in the world. The ooncepts and definitions adopted at the Census of India. 2001 are as given below:
01. Persons enumerated 02. Rural-Urban Areas 03. City 04. Household 05. Institutional Household 06. Houseless Household 07. Head of the Household 08. Scheduled Castes & Scheduled Tribes 09. Literates 10. Work 11. Main workers 12. Marginal workers 13. Cultivators 14. Agricultural Labourers 15. Household Industry workers 16. Other workers 17. Non-workers 18. Sex ratio 19. Child Sex ratio (0-6 age group) 20. Literacy Rate 21. Work Participation Rate 22. Location Code Structure adop1ed in Census 2001 23. Abbreviations Used
Persons enumerated
Generally speaking, persons who were present in the household during the entire period of enumeration or who were known to be usual residents of the household and have stayed there for part of the enumeration period or who were not present at the time of visit of the enumerator but were expected to return by 28th February, 2001 were eligible to be enumerated. For the purpose of enumeration the follOwing persons were enumerated in a household:
(i) All those who normally resided and were present in that household during the entire period of enumeration, Le. from 9th February to 28th February, 2001 (both days inclusive);
(ii) Those who were known to be normally residing and had actually stayed during a part of the enumeration period in the household (9th February to 28th February, 2001) but were not present at the time of the visit of enumerator.
(iii) Also those who were known to be normally residing in the household and were not present at the time of the visit but expected to return by 28th February, 2001; and
(iv) Visitors who were present in the household censused and expected to be away from the place(s) of their usual residence during the entire enumeration period. For the purpose of enumeration, such visitors were treated as normal residents of the household where they were actually found during the enumeration period provided they were not being enumerated elsewhere.
xlvii
In Census, every person irrespective of age, sex, caste, creed, region. origin or religion is counted only once, without omission or duplication provided she/he satisfied the criteria of enumeration listed above. Foreigners who were expected to stay within the geographical limits of this country throughout the enumeration period were counted wherever they were found, if not enumerated elsewhere. Those foreigners who were expected to stay in India for a part of enumeration period were not eligible for enumeration. It may also be important to state that the foreigners and their families who were having diplomatic status were not enumerated. But Indian nationals employed and staying with them were enumerated.
Rural-Urban Areas
The data in the table on Final Population Totals were presented separately for rural and urban areas. The unit of classification in this regard is 'town' for urban areas and 'village' for rural areas. In the Census of India 2001, the definition of urban area adopted is as follows:
(a) All statutory places with a municipality, corporation, cantonmen~ board or notified town area committee, etc.
(b) A place satisfying the following three criteria simultaneously:
i) a minimum population of 5,000;
ii) at least 75 per cent of male working population engaged h non-agricultural pursuits; and
iii) a density of population of at least 400 persons per sq. km. (1,000 per sq. mile).
For identification of places which would qualify to be classified as 'urban' all villages, which, as per the 1991 Census had a population of 4,000 and above, a population density of 400 persons per sq. km. and having at least 75 per cent of male working population engaged in non-agricultural activity were considered. To work out the proportion of male working population referred to above against b) (ii), the data relating to main workers were taken into account
An Urban Agglomeration is a continuous urban spread constituting a town and its adjoining urban outgrowths (OGs) or two or more physically contiguous towns together and any adjoining urban outgrowths of such towns. Example~ of OGs are railway colonies, university campuses, port areas, etc., that may come up near a city or statutory town outside its statutory limits but within the revenue limits of a village or villages contiguous to the town or city. Each sllch individual area by itself may not satisfy the minimum population limit to qualify it to be treated as an independert urban unit but may deserve to be clubbed vvith the town as a continuous urban spread.
For the purpose of delineation of Urban Agglomerations during Census of India 2001, following criteria are taken as pre-requisites: (a) The core town or at least one of the constituent towns of an urban agglomeration should necessarily be a statutory town; and (b) The total population of all the constituents (i.e. towns and outgrowths) of an Urban Agglomerc;ttion should not be less than 20,000 (as per the 1991 Census). With these two basic criteria having been met, the following are the possible different situations in which Urban Agglomerations would be constituted: (i) a city or town with one or more contiguous outgrowths; (ii) two or more adjoining towns with their outgrowths; and (iii) a city and one or more adjoining towns with their outgrowths all of which form a continuous spread.
City
Towns with population of 100,000 and above are called cities.
Household
A 'household' is usually a group of persons who normally live together and take their meals from a common kitchen unless the exigencies of work prevent any of them from doing so. Persons in a household may be related or unrelated or a mix of both. However, if a group of unrelated persons live in
xlviii
a census house but do not take their meals from the common kitchen, then they are not constituent of a common household. Each such person was to be treated as a separate household. The important link in finding out whether it was a household or not was a common kitchen. There may be one member households, two member households or multi-member households.
A household with at least one Scheduled Caste member is treated as Scheduled Caste Household. Similarly, a household having at least one Scheduled Tribe member is treated as a Scheduled Tribe household.
Institutional household
A group of unrelated persons who live in an institution and take their meals from a common kitchen is called an Institutional Household. Examples of Institutional Households are boarding houses, messes, hostels, hotels, rescue homes, jails, ashrams, orphanages, etc. To make the definition more clearly perceptible to the enumerators ;;It the Census 2001, it was specifically mentioned that this category of households would cover only those households where a group of unrelated persons live in an institution and share a common kitchen.
Houseless household
Households who do not live in buildings or census houses but live in. the open on roadside, pavements, in hume pipes, under fly-overs and staircases, or in the open in places of worship, mandaps, railway platforms, etc. are treated as Houseless households.
Head of the household
The head of household for census purposes is a person who is recognised as such by the household. She or he is generally the person who bears the chief responsibility for managing the affairs of the household and takes decision on behalf of the household. The head of household need not necessarily be the oldest male member or an eaming member, but may be a female or a younger member of either sex. In case of an absentee de jure 'Head' who is not eligible to be enumerated in the household, the person on whom the responsibility of managing the affairs of household rests was to be regardep as the head irrespective whether the person is male or female.
Scheduled Castes & Scheduled Tribes
Article 341 of the Constitution provides that the President may, with respect to any State or Union territory, specify the castes, races or tribes or parts of or groups within castes, races or tribes which shall for the purposes of the Constitution be deemed to be Scheduled Castes in relation to that State or Union territory. Similarly, Article 342 provides for specification of tribes or tribal communities or parts of or groups within tribes or tribal communities which are deemed to be for the purposes of the Constitution the Scheduled Tribes in relation to that State or Union territory. In pursuance of these provisions, the list of Scheduled Castes and I or Scheduled Tribes are notified for each State and Union territory and are valid only within the jurisdiction of that State or Union 1Brritory and not outside.
It is important to mention here that under the Constitution (Scheduled Castes) Order, 1950, no person who professed a religion different from Hinduism was deemed to be a member of a Scheduled Caste in addition to every member of the Ramdasi, Kabirpanthi, Majhabi or Sikligar caste resident in Punjab or Patiala and East Punjab States Union were in relation to that State whether they professed the Hindu or the Sikh religion. Subsequently, in September, 1956, by an amendment, the Presidential Order of 1950 and in all subsequent Presiden1ial Orders relating to Scheduled Castes, the population professing the Hindu and the Sikh religions were placed on the same footing with regard to their inclusion as Scheduled Castes. Later on, as per the amendment made in the Constitution (Scheduled Castes) Order 1990, the Hindu, the Sikh and the Buddhist professing population were placed on the same footing with regard to the recognition of the Scheduled Castes.
xlix
For finalizing the list of Scheduled CasteS/Scheduled Tribes notified in each StateJUnion territory, all the constitutional amendments that have taken place prior to the conduct of 2001 census were taken into account. Since there is no Scheduled Castes list for the state of West'Bengal and the Union territories of Andaman & Nicobar Islands and Lakshadweep; and no Scheduled Tribes list for the States of Haryana and Punjab and the Union territories of Chandigam, Delhi and Pondicherry, the Scheduled Castes and Scheduled Tribes population figures are furnished for only the relevant category in respect of these States and Union territories.
The instructions to the enumerators for recording the individual responses on religion and the Scheduled Castes and the Sc.heduled Tribes were more or less the same as in the past censuses. Each enumerator was provided with a notified list of Scheduled Cas~s and Scheduled Tribes in respect of his/her StateJUnion territory. The religion for each individual was first of all determined. Then it was ascertained from the respondent for each individual whether she or he belonged b a Scheduled Caste or a Scheduled Tribe through Question NO.8 & 9 of the Household Schedule. If in reply to either of this question, the answer was in the affirmative, the name of caste/tribe to which the individual belonged was ascertained. If the name of caste/tribe retumed by the respondent appeared in the approved list for the state the enumerator was expected to treat the individual, as belonging to Scheduled Caste or Scheduled Tribe and record the appropriate entry. A list of the Scheduled Castes and Scheduled Tribes notified by the Govemment of India in pursuance of Articles 341 & 342 of the Constitution of India for each State and Union territory is placed at Annexure-Ia and lb.
Literates
A person aged 7 years and above who can both read and write with understanding in any language has been taken as literate. It is not necessary for a person to have received any formal education or passed any minimum educational standard for being treated as literate. People who were blind and could read in Braille are treated literates.
A person, who can neither read nor write or can only read but cannot write in any language, is treated as illiterate. All children of age 6 years or less, even if going to school and have picked up reading and writing, are treated as illiterate.
Work
Work is defined as partiCipation in any economically productive activity with or without compensation, wages or profit. Such participation may be physical and/or mental in nature. Work involves not only actual work but also includes effective supervision and direction of work. It even includes part time help or unpaid work. on farm, family enterprise or in any other economic activity. All persons engaged in 'work' as defined above are workers, Persons who are engaged in cultivation or milk production even solely for domestic consumption are also treated as workers.
Reference period for determining a person as worker and non-worker is one year preceding the date of enumeration.
Main workers
Those persons who had worked for the major part of the reference period (Le. 6 months or more) are tenned as Main workers.
Marginal workers
Those persons who had worked for less than 6 months during reference period are termed as Marginal workers.
Cultivators
For purposes of the census a person is classified as cultivator if he or she is engaged in cultivation of land owned or held from Govemment or held from private persons or institutions for
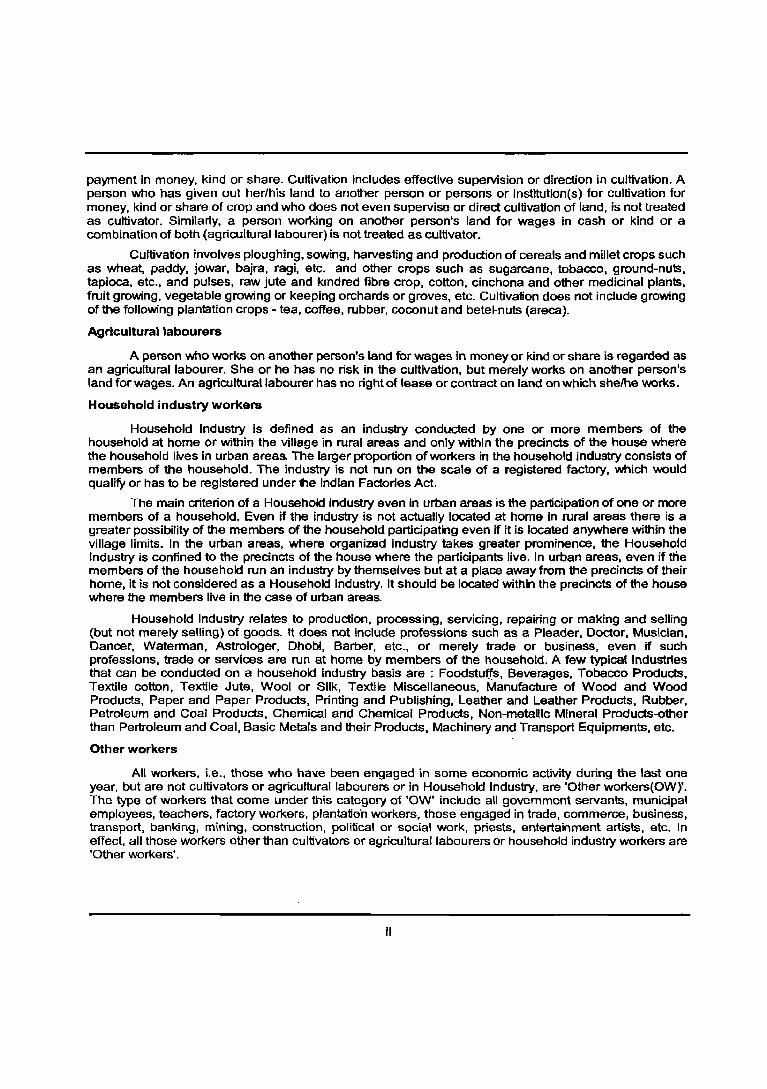
payment in money. kind or share. Cultivation includes effective supervision or direction in cultivation. A person who has given out her/his land to another person or persons or institution(s) for cultivation for money. kind or share of crop and who does not even supervise or direct cultivation of land. is not treated as cultivator. Similarly, a person working on another person's land for wages in cash or kind or a combination of both (agricultural labourer) is not treated as cultivator.
Cultivation involves ploughing, sowing, harvesting and production of cereals and millet crops such as wheat, paddy, jowar, bajra, ragi, etc. and other crops such as sugarcane, tobacco, ground-nuts, tapioca, etc., and pulses, raw jute and kmdred fibre crop, cotton, cinchona and other medicinal plants, fruit growing. vegetable growing or keeping orchards or groves, etc. Cultivation does not include growing of the following plantation crops - tea, coffee, rubber, coconut and betel-nuts (areca).
Agricultural labourers
A person who works on another person's land for wages in money or kind or share is regarded as an agricultural labourer. She or he has no risk in the cultivation, but merely works on another person's land for wages. An agricultural labourer has no rightof lease or contract on land on which she/he 'INOrl<s.
Household industry workers
Household Industry is defined as an industry conducted by one or more members of the household at home or within the village in rural areas and only within the precincts of the house where the household lives in urban areas. The larger proportion of workers in the household industry consists of members of the household. The industry is not run on the scale of a registered factory, which would qualify or has to be registered under 1I1e Indian Fadories Act.
The main criterion of a Household industry even in urban areas is the participation of one or more members of a household. Even if the industry is not actually located at home in rural areas there is a greater possibility of the members of the household participating even if it is located anywhere within the village limits. In the urban areas, where organized industry takes greater prominence, the Household Industry is confined to the preCincts of the house where the participants live. In urban areas, even if the members of the household run an industry by themselves but at a place away from the precincts of their home, it is not considered as a Household Industry. It should be located within the precincts of the house where the members live in the case of urban areas.
Household Industry relates to production, proceSSing, servicing, repairing or making and selling (but not merely selling) of goods. It does not include profeSSions such as a Pleader, Doctor, MusiCian, Dancer, Waterman, Astrologer, Dhobi, Barber, etc., or merely trade or business, even if such professions, trade or services are run at home by members of the household. A few typical Industries that can be conducted on a household industry basis are : Foodstu~s, Beverages, Tobacco Products, Textile cotton, Textile Jute, Wool or Silk, Textile Miscellaneous, Manufacture of Wood and Wood Products, Paper and Paper Products, Printing and Publishing, Leather and Leather Products, Rubber, Petroleum and Coal Products, Chemical and Chemical Products, Non-metallic Mineral Products-other than Pertroleum and Coal, Basic Metals and their Products, Machinery and Transport Equipments, etc.
Other workers
All workers, i.e., those who have been engaged in some economic activity during the last one year, but are not cultivators or agricultural labourers or in Household Industry, are 'Other workers(OW)'. The type of workers that come under this category of 'OW' include all government servants, municipal employees, teachers, factory workers, plantatie"n workers, those engaged in trade, commerce, business, transport, banking, mining, construction, political or social work, priests, entertainment artists, etc. In effect, all those workers other than cultivators or agricultural labourers or household industry workers are 'Other workers' .
Ii
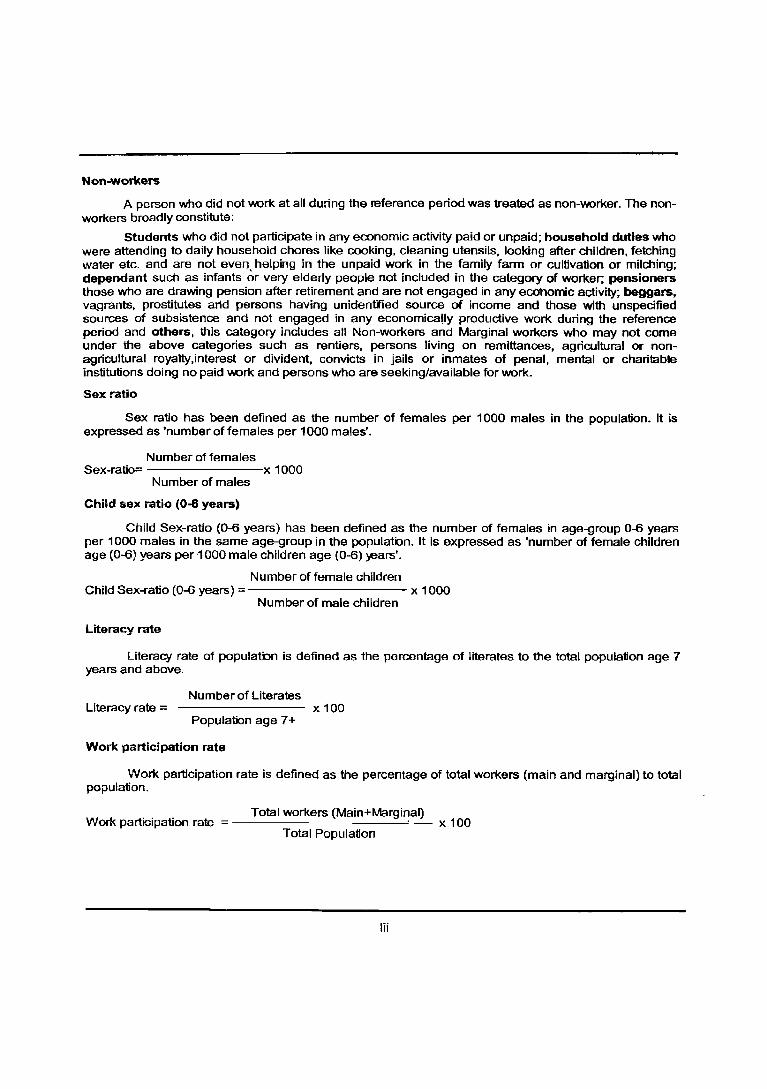
Non-workers
A person who did not work at all during the reference period was treated as non-worker. The nonworkers broadly constitute:
Students who did not participate in any economic activity paid or unpaid; household duties who were attending to daily household chores like cooking, cleaning utensils, looking after children, fetching water etc. and are not ever). helping in the unpaid work in the family farm or cultivation or milching; dependant such as infants or very elderly people not included in the category of worker; pensioners those who are drawing pension after retirement and are not engaged in any economic activity; beggars, vagrants, prostitutes arid persons having unidentiied source of income and those with unspecified sources of subsistence and not engaged in any economically productive work during the reference period and others, this category includes all Non-workers and Marginal workers who may not come under the above categories such as rentiers, persons living on remittances, agricultural or nonagricultural royalty,interest or divident, convicts in jails or inmates of penal, mental or charitable institutions doing no paid work and persons who are seeking/available for work.
Sex ratio
Sex ratio has been defined as the number of females per 1000 males in the population. It is expressed as 'number of females per 1000 males'.
Number of females Sex-ratio= x 1000
Number of males
Child sex ratio (0-6 years)
Child Sex-ratio (0-6 years) has been defined as the number of females in age-group 0-6 years per 1000 males in the same age-group in the populatbn. It is expressed as 'number of female children age (0-6) years per '1 000 male children age (0-6) }ears'.
Number of female children Child Sex-ratio (0-6 years) = x 1000
Number of male children
Literacy rate
Literacy rate of populatbn is defined as the percentage of literates to the total population age 7 years and above.
Number of Literates Literacy rate = x 100
Populatbn age 7+
Work participation rate
Work participation rate is defined as the percentage of total workers (main and marginal) to total population.
Worl< participation rate = Total workers (Main+Margi~al)
Total Population
Iii
x 100
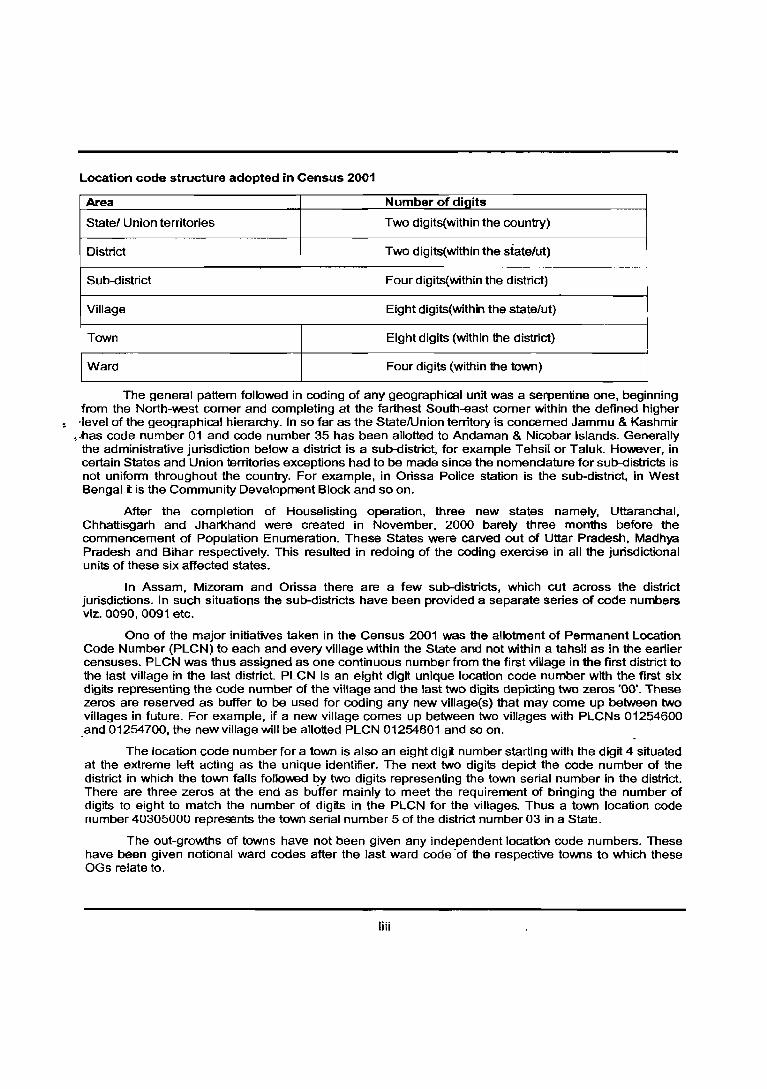
Location code structure adopted in Census 2001
Area Number of d!gits
State! Union territories Two digits(within the country)
District Two digits(withln the siate/ut)
Sub-district Four digits(within the district)
Village Eight digits(within the state/ul)
Town Eight digits (within the district)
Ward Four digits (within the town)
The general pattern followed in coding of any geographical unit was a serpentine one. beginning from the North-west comer and completing at the farthest South-east comer within the defined higher -level of the geographical hierarchy. In so far as the StatefUnion territory is concerned Jammu & Kashmir
,.has code number 01 and code number 35 has been allotted to Andaman & Nicobar Islands. Generally the administrative jurisdiction below a district is a sub-district. for example Tehsil or Taluk. However, in certain States and Union territories exceptions had to be made since the nomenclature for sub-districts is not uniform throughout the country. For example. in Orissa Police station is the sub-district. in West Bengal it is the Community Development Block and so on.
After the completion of Houselisting operation. three new states namely. U~..aranchal. Chhattisgarh and Jharkhand were created in November. 2000 barely three months before the commencement of Population Enumeration. These States were carved out of Uttar Pradesh. Madhya Pradesh and Bihar respectively. This resulted in redoing of the coding exercise in all the jurisdictional units of these six affected states.
In Assam. Mizoram and Orissa there are a few sub-districts, which cut across the district jurisdictions. In such situations the sub-districts have been provided a separate series of code numbers viz. 0090, 0091 etc.
One of the major initiatives taken in the Census 2001 was the allotment of Permanent Location Code Number (PLCN) to each and every village within the State and not within a tahsil as in the earlier censuses. PLCN was thus assigned as one continuous number from the first village in the first district to the last village in the last district. PLCN is an eight digit unique location code number with the first six digits representing the code number of the village and the last two digits depicting two zeros '00'. These zeros are reserved as buffer to be used for coding any new village(s) that may come up between two villages in future. For example. if a new village comes up between two villages with PLCNs 01254600 and 01254700, the new village will be allotted PLCN 01254601 and so on.
The location code number for a town is also an eight digit number starting with the digit 4 situated at the extreme left acting as the unique identifier. The next two digits depict the code number of the district in which the town falls followed by two digits representing the town serial number in the district. There are three zeros at the end as buffer mainly to meet the requirement of bringing the number of digits to eight to match the number of digits in the PLCN for the villages. Thus a town location code number 40305000 repres,mts the town serial number 5 of the district number 03 in a State.
The out-growths of towns have not been given any independent location code numbers. These have been given notional ward codes after the last ward code ·of the respective towns to which these OGs relate to.
liii
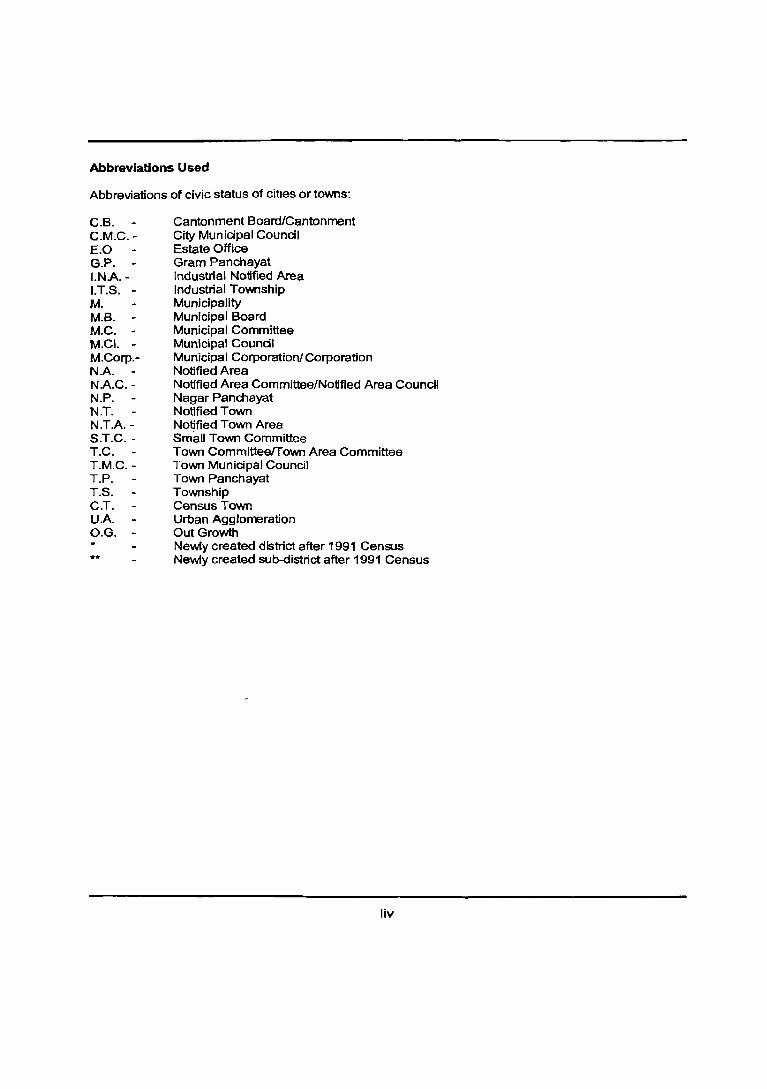
Abbreviations Used
Abbreviations of civic status of cities or towns:
C.B. C.M.C.E.O G.P. I.NAI.T.S. ~
M. M.B. M.C. M.CI. -M.Corp.N.A. NAC.N.P. N.T. N.TA -S.T.C. -T.C. T.M.C.T.P. T.S. C.T. U.A. O.G.
**
Cantonment Board/Cantonment City Municipal Council Estate Office Gram Panchayat Industrial Notified Area Industrial TOVvTlship Municipality Municipal Board Municipal Committee Municipal Council Municipal Corporation/ Corporation Notified Area Notified Area Committee/Notified Area Council Nagar Panmayat Notified Town Notified Town Area Small Town Committee Town Committee/Town Area Committee Town Municipal Council Town Panchayat Township Census Town Urban Agglomeration Out Growth Newly created district after 1991 Census Newly created sub-district after 1991 Census
liv
Data highlights
The state of West Bengal located in the eastern part of the country with 80 million population in 2001 is the fourth largest state in terms of population. The slate has 18 districts, 341 sub-dislricts (BlockS) and
40,782 villages - 37,945 inhabited and 2837 uninhabited. The urban areas of the state comprise 375 towns including 123 statutory and 252 non statutory (census towns) during 2001.
Population
The population of West Bengal in 2001 Census, is 80.1 million out of which 41.4 million are males and 38.7 million are females. In 1991, the population of the state was 68.0 million, comprising 35.5 million males and 32.5 million females. The rural and urban break up of population shows that 72.0 percent population (57.7 million) of the state live in rural areas, whereas 28.0 per cent (22.4 million) in the urban areas. In 1991 Census, 72.5 per cent population was enumerated in rural areas and 27.5 per cent in urban areas. Thus, there has been a marginal increase in the proportion of urban population.
In terms of population, Medinipur, with 9.6 million population is the most populous district, followed by North Twenty Four Parganas (8.9 million). Both these districts are most populous districts at the national level too. In addition, three more districts of the state figure among the ten most populous districts of the country in 2001, these are South Twenty Four Parganas (6.9 million), Barddhaman (6.9 million) and Murshidabad (5.9 million). All the districts in the state have more than one million population in 2001. Dakshin Dinajpur is the least populated with 1.5 million population followed by Darjiling with 1.6 million populaton.
Institutional and houselass population
Institutional population of the state in 2001 Census, is 467,905 persons. They constitute 0.6 per cent of total population. Male institutional population (357,474) is more than three times that of females (110,431). The institutional population has increased substantially from 316,688 (0.2 per cent) recorded in 1991. Among the districts, Kolkata has the highest institutional population (91 ,857) and Koch Bihar the lowest (8099) in 2001.
The houseless population in the state has declined from 111,211 in 1991 Census to 110,535 in 2001. In percentage terms, Houseless population has decreased from 0.47 in 1991 to 0.14 in 2001. Among all the districts, Kolkata has the highest houseless population (67,676) and accounts for 61 per cent of the total houseless population of the state. Bankura district, on the other extreme has the lowest houseless population (535).
Scheduled Castes population
The Scheduled Castes population of the state has increased from 16.1 million in 1991 to 18.5 million in 2001. In percentage terms, it has decreased marginally from 23.6 per cent in 1991 to 23.01 per cent in 2001. Among the states and union territories, West Bengal has third highest population of Scheduled Castes in percentage terms.
Among the districts, highest proportion of Scheduled Castes population to total population in 2001 Census has been recorded in Koch Bihar district (50.1 per cent) followed by Jalpaiguri (36.7 per cent). In fact, Koch Bihar district has the highest proportion of Scheduled castes population among all the districts of the country in 2001 Census. This was so in 1991 Census too. The lowest percentage of the Scl'!eduled Castes population has been reported in Kolkata (6.0 per cent) followed by Mushidabad (12.0 per cent). Except for Kolkata percentage of the Scheduled Castes population is more than 10 per cent in 2001 in all the districts.
Iv
Scheduled Tribes population
The Scheduled Tribes population in the state has increased from 3.8 million in 1991 to 4.4 million in 2001. In percentage terms, their populatiqn has marginalty decreased from 5.6 per cent in 1991 to 5.5 per cent in 2001. Among the districts, Jalpaiguri has the highest proportion of 18.9 percent of Scheduled Tribes population, followed by Puruliya (18.3 per cent) and Dakshin Dinajpur (16.1 per cent). Kolkata has the lowest percentage of the Scheduled Tribes population at 0.2 per cent followed by Haora district (0.4 per cent).
Decadal growth
At the national level, there has been a declining trend in the population growth-rate from 23.9 per cent during 1981-1991 to 21.5 per cent during 1991-2001. Compared to the national average, West Bengal has recorded a sharp decline in growth rate from 24.7 per cent in 1981-91 to 17.8 per cent during 1991-2001. During 1991-2001, the decadal growth rate of rural population (17.0 per cent) of the state is lower than that of urban (19.9 per cent). Among the Scheduled Castes and Scheduled Tribes, the growth rate of population during 1991-2001 is lower than that of the total populatbn at 14.8 per cent and 15.7 per cent respectively.
Among the districts, Uttar Dinajpur with 28.7 per cent has the highest decadal growth rate whereas Kolkata with 3.9 per cent has the lowest decadal growth rate of total population during 1991-2001.
Density of population
The density of populatbn is defined as the number of persons per sq. km. West 8engal with a population denSity. of 903 has the 6 th rank in population density in 2001 among the states and union territories. The state has added 136 persons per sq. km. during the decade as the density was 767 persons in 1991. The population density in West Bengal is almost three times the all India density of 325 persons per sq. km.
Among the districts, Kolkata with 24,718 persons per sq. km. has the highest density and Puruliya with 405 persons per sq. km .• the lowest density.
Sex ratio
The sex ratio of populatbn is defined as the number of females per 1000 males. It is an important indicator for measuring the extent of gender equity at a given point of time. In 2001 Census, the sex ratio of total populatbn in the state has improved to 934 from 917 recorded in 1991.The sex ratio has improved both in rural and urban areas of the state during the decade. In the rural areas, it has increased from 940 to 950 while in urban areas; the increase is from 858 to 893. Among the districts, the highest sex ratio has been recorded in Medinipur (955) while Kolkata has the lowest sex ratio of 829 in 2001 .
The sex ratio among the Scheduled Castes population for the state has also increased from 931 in 1991 to 949 in 2001. Hugli district has the highest sex ratio for the Scheduled Castes (977) whereas Kolkata has the lowest (822) as per 2001 Census.
Among the Scheduled Tribes population, the sex ratio has increased from 964 in 1991 to 982 in 2001. At the district level, the highest sex ratio of Scheduled Tribes population has been noted in Hugli (1 011) and Kolkata with 793 has the lowest.
Child sex ratio (0-6)
In 2001 Census, the sex ratio in the age group 0-6 at the state level is 960 against 967 recorded in 1991. Despite decline, the child sex ratio is far higher than the national average of 927 in 2001 Census. The child sex ratio of Scheduled Castes populatbn has also declined from 961 to 958 while for the Scheduled Tribes, it has marginally declined from 983 to 981 during 1991-2001.
lvi
Among the districts, Murshidabad and Nadia have recorded the highest child sex ratio for total (972) and Scheduled Castes population (970) and Scheduled Tribes (1012). On the other extreme Kolkata has registered the lowest child sex ratio for total and Scheduled Castes at 927 and 931 respectively in 2001. In case of Murshidabad (1010) and Darjiling (1001), also Scheduled Tribes girls out number boys in the age group 0-6. Koch Bihar district has the lowest Scheduled Tribes child sex ratio of 898 in 2001.
Percentage of child population in the age group 0-6
The overall perrentage of child population in theage group 0-6.in2001 Census at the state level is 14.2 per cent against 17.0 per cent returned in 1991 Census. For Scheduled Castes population, the percentage of 0-6 age group population has declined from 18.8 per cent in 1991 to 15.1 per cent in 2001. In the case of Scheduled Tribes, it is down from 19.5 per cent in 1991 to 16.7 in 2001. These trends are indicative of the declining fertility among all the segments of population in the state.
Among the districts Uttar Dinajpur has the highest percentage of child population (0-6) in all segments of population - 21.0 per cent for total, 19.3 per cent for Scheduled Castes and 21.4 per cent for the Scheduled Tribes in 2001. On the other end, Kolkata district has the distinction of having the lowest proportion of child population in their respective populatbns for total (8.5 per cent)., the Scheduled Castes (10.1 per cent) and for the Scheduled Tribes (9.4 per cent). In fact, Kolkata has the lowest proportion of 0-6 population among all the (urban) district of the country including Chennai, Hyderabad, Mumbai suburb and New Delhi.
Literacy status
Literacy and education are important indicators of development in a society. The literacy rate in the state has improved from 57.7 per cent in 1991 to 68.6 per cent in 2001 showing an increase of 10.9 percentage points during 1991-2001. The literacy rate of the state in 2001 is above the national average of 64.8 per cent. The literacy rate in urban (81.2 per cent) is considerably higher in the state than that in rural areas (63.4 per cent) in 2001.
Among the districts, Kolkata has the highest overall literacy rate of 80.9 per cent. Uttar Dinajpur district has the lowest literacy rate of 47.9 per cent.
The literacy rate among the Scheduled Castes population in 2001 Census, is 59.0 per cent. This was 42.2 per cent in 1991 thereby registering an increase of 16.8 percentage points. North Twenty Four Parganas has the highest literacy rate (70.8 per cent) and Bankura district the lowest (42.9 per cent) among the Scheduled Castes population.
Literacy data shows considerable gap between non tribal and the Scheduled Tribes population. This is despite the fact that the Scheduled Tribes literacy rate has increased from a very low 27.8 per cent in 1991 to 43.4 per cent in 2001. Still it is low when compared with that of non-tribal population. District wise literacy rate shows wide variations. For example, Kolkata has the highest literacy rate (76.4 per cent), followed by Darjiling (55.5 per cent). Uttar Dinajpur has the lowest (28.7 per cent), followed by Birbhum (31.2 percent) among the Scheduled Tribes population.
Male and female literacy
The male literacy rate for the state has increased from 67.8 per cent in 1991 to 77.0 per cent in 2001 and female literacy rate has increased from 46.6 per cent in 1991 to 59.6 per cent in 2001. Male literacy rate in both rural and urban areas has been higher than that of the female literacy rate. The highest male and female literacy rates have been observed in Medinipur (84.9) for males and Kolkata (77.3 per cent) for females. The lowest literacy rates for males and females have been recorded in Uttar Dinajpur (58.5 per cent) and Puruliya (36.5 per cent) respectively.
Ivii
The male literacy rate among the Scheduled Castes population has increased to 70.5 per cent form 54.6 per cent in 1991. Similarly, the female literacy rate has increased from 28.9 per cent in 1991 to 46.9 per cent in 2001.
Among the Scheduled Tribes population, male literacy rate has increased from 40.1 per cent to 57.4 per cent during 1991-2001 while the female literacy rate has increased from 15.0 per centto 29.2 per cent. The female literacy among the Scheduled Tribes continues to be low despite nearly two fold increase.
Work participation rate (WPR)
The work participation rate is defined as the proportion of total workers (Le., main and marginal workers) to total population. In the state, 29.5 million population forming 36.8 per cent of the population have been returned as workers in 2001 against 21.9 million (32.2 per cent) in 1991. The state has, thus, recorded increase in the number as well as percentage of workers in 2001.
Among the districts, Bankura with 44.7 per cent accounts for the highest overall work participation rate followed closely by Puruliya 44.5 per cent. South Twenty Four Paraganas with 32.5 per cent has the lowest work participation rate in 2001 Census.
Among the 18.4 million Scheduled Castes in 2001, nearly 7.1 million are workers. Among the 4.4 million Scheduled Tribes, 2.1 million persons are workers. The work participation rates among Scheduled Castes and Scheduled Tribes are higher than that of the total popUlation. In case of Scheduled Castes, WPR has increased from 33.3 per cent in 1991 to 38.8 per cent in 2001. In the case of Scheduled Tribes, it has increased from 47.7 per cent in 1991 to 48.8 per cent in 2001.
The WPR for Scheduled Castes varies from a high of 50.0 per cent in Bankura to the low of 33.9 per cent in South Twenty Four Parganas. The same district Le. Bankura has the highest WPR for the Scheduled Tribes 53.9 per cent and Kolkata has the lowest WPR with 38.3 per cent.
Male-female work participation rate
The overall male work participation rate at the state level is 54.0 per cent. The corresponding percentages for the Scheduled Castes and Scheduled Tribes are 54.4 per cent and 53.8 per cent respectively. At the state level, 7.1 million females (18.3 per cent) have been recorded as workers in 2001. The corresponding percentages of female workers in case of Scheduled Castes and Scheduled Tribes are 22.3 per cent and 43.7 per cent respectively. The female vvork participation rate has increased from 11.3 per cent in 1991 to 18.3 per cent in 2001. The difference in male - female work participation rates has marginally narrowed down from 40 percentage points in 1991 to 36.7 percentage points in 2001 Census.
Main and marginal workers
Out of the total workers in the state, 23 million accounting for 78.1 per cent are main workers and 6.5 million (21.9 per cent) are marginal workers. In absolute terms, the number of main workers has increased from 20.6 million in 1991 to 23.0 million in 2001. However, the proportion of main workers has decreased from 93.9 per cent in 1991 to 78.1 per cent in 2001. The sharp decline in the proportion of main workers is due to increase in the proportion of marginal workers which may be due to improved netting of marginal workers in 2001. The decline is discernable in case of both male and female main workers. For males, it has declined from 98.6 per cent to 87.1 per cent and for females from 70.8 per cent to 49.7 per cent.
The state has registered a considerable ilcrease in number of marginal workers from 1.3 million in 1991 to 6.5 million in 2001. Overall the proportion of marginal workers among persons, males as well as females, has increased from 6.1 per cent, 1.4 per cent and 29.2 per cent in 1991 to 21.9 per cent, 12.9 per cent and 50.3 per cent in 2001 respectively. This may be attributed to a better coverage of paid or unpaid work in farm and family enterprises in 2001 Census.
Iviii
In case of the Scheduled Castes, though absolute main workers have increased during 1991-2001, their proportion has decline from 31.1 per cent in 1991 to 28.7 per cent in 2001. Among the Scheduled Castes males also, the percentage of mairrworkers has dedi ned from 51.3 per cent in 1991 to 46.1 per cent in 2001. However ... among females the proportion has increased from 9.4 per cent to 10.3 per cent. The corresponding increase in the marginal workers is sharp from 0.8 per cent to 8.3 per cent for males and 3.8 per centto 12.0 per cent for females during 1991-2001.
Contrary to the trend in total and the Scheduled Castes population, main workers among the Scheduled Tribes have registered a dedine both in terms cif absolute numbers and percentages. The percentage of main workers among the Scheduled Tribes has declined from 43.1 per cent in 1991 to 32.0 per cent in 2001. Similar dedine has been noted among the males from 52.6 per cent to 42.1 per cent and among females from 33.3 per cent to 21.8 per cent during 1991- 2001. There has been corresponding increase in the percentage of the Scheduled Tribes marginal workers from 4.6 per cent in 1991 to 16.7 per cent in 2001. The increase is very sharp among the Scheduled Tribes female marginal workers from 7.7 per cent to 21.9 per cent while among males it increased from 1.5 per cent to 11.6 per cent during 1991-2001.
Cultivators
Though the number of cultivators in the state have decreased by 10 percentage points during 1991-2001, their proportion to total workers has declined from 29.2 per cent in 1991 to 19.2 per cent in 2001. The decline in proportion as well as number is discerned in total and male cultivators. Male cultivators (20.8 per cent) account for a higher proportion compared to that of female cultivators (14.1 per cent). The proportion of Cultivators among Scheduled Castes workers is 18.6 per cent and among Scheduled Tribes it is 19.5 per cent in 2001.
Among the districts, the percentage of total cultivators is the lowest in Kolkata (which is fully urban district) at 0.4 per cent each among general, Scheduled Castes and Scheduled Tribes workers. The proportion of total cultivators in other districts varies from 5.2 per cent in Haora to 31.3 per cent in Puruliya. Among the Scheduled Castes, this proportion varies from the lowest of 7.4 per cent in Haora to the highest of 43.2 per cent in Koch Bihar district. Among the Scheduled Tribes, Haora (0.8 per cent) has the lovvest while Puruliya (32.1 per cent) has the highest proportion of cultivators.
Agricultural Labourers
The proportion of workers in the category of agricultural labourers has remained same at 25.0 per cent both in 1991 and 2001. However, in absolute terms the number of agricultural labourers increased from 5.5 million to 7.4 million. Among the Scheduled Castes workers, 38.0 per cent are agricultural labourers and among the Scheduled Tribes workers the agricultural labourers account for more than half of their total workers at 53.2 per cent.
The highest percentage of agricultural labourers has been recorded in Uttar Dinajpur district (39.7 cent) while the lowest percentage is in Kolkota district with 0.3 per cent Among the Scheduled Castes, Bankura district (59.5 per cent) has the highest proportion of agricultural labourers follovved by Birbhum (57.6 per cent) and Barddhaman (51.9 per cent) while Kolkata the lowest (1.4 per cent) followed by Darjiling (14.6 per cent). Among the Scheduled Tribes, Hugli district has the highest percentage (78.4 per cent) followed by Murshidabad (76.6per cent) while Kolkata the lowest (0.7 per cent) followed by Darjiling (13.4 per cent). In nine districts more than one third workers among the Scheduled Tribes are engaged as agricultural labourers as per 2001 Census.
Household industry workers (HHI)
The proportion of workers engaged in household industry, which was 4.2 per cent in 1991, has risen to 7.4 per cent in 2001, registering an increase of 3.2 percentage points. The state holds second rank after Manipur in percentage of HHI workers among state and union territories in 2001. Among the
lix
Scheduled Castes workers, 5.8 per cent of workers are engaged in household industry and among the Scheduled Tribes those working in household industry account for 3.0 per cent of workers.
Among the districts, Murshidabad has the highest proportion (20.4 per cent) of household industry workers followed by Maida (15.6 per cent) while Jalpaiguri is at the other end with 2.1 per cent has the lowest percentage of household industry workers. Murshidabad district also has the highest proportion of household industry workers to total workers among the Scheduled Castes (13.8 per cent) followed by Nadia (13.6 per cent). Among the Scheduled Tribes, proportion of household industry workers varies from the highest 6.8 per cent in Medlnipur b the lowest 0.6 per cent In Jalpaiguri.
Other workers
All workers engaged In any category of economic activity other than cultivation, agricultural labour or household industry are treated as 'other workers' This category accounts for the highest number of workers Le., 14.3 million or 48.5 per cent of total workers at the state level. However, the proportion of 'other workers' is less both among Scheduled Castes (37.5 per cent) and Scheduled Tribes (24.2 per cent) workers.
Among the districts, Kolkata has the highest percentage of 'other workers' to total workers among the total population (96.3 percent). the Scheduled Castes (93.5 per cent) and the Scheduled Tribes population (98.0 per cent). Uttar Dinajpur has the lowest percentage of overall 'other workers' at 27.1 per cent while Koch Bihar district has the lowest among the Scheduled Castes (20.8 per cent) and Dakshin Dinajpur (7.2 per cent) among the Scheduled Tribes in 2001.
Ix
(4~clElOII~C6 (4C1'!flJllii ANALYTICAL STATEMENTS

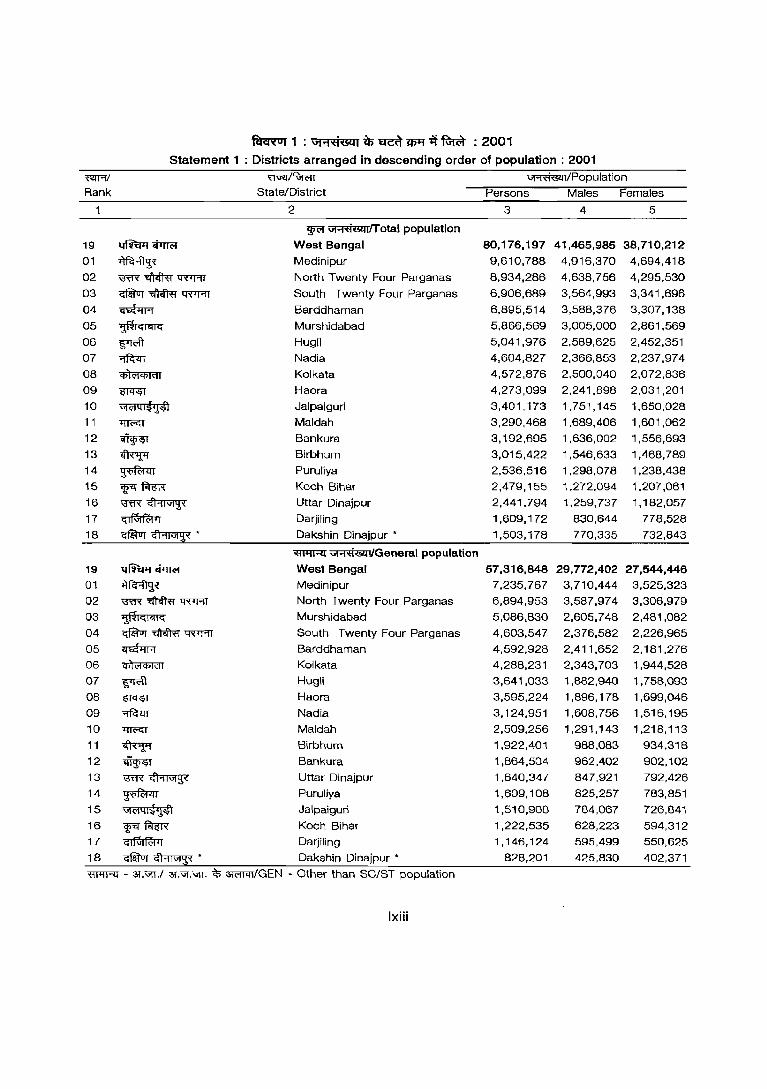
~ 1 : \l1'106'L<41 a, ~ Wllll ~ : 2001
Statement 1 : Districts arranged in descending order of population: 2001
~ ~/R;rm ~/Population
Rank State/District Persons Males Females
"1 2 3 4 5
~ \it'1't'i&uITotal population
19 ~ <trJri:;r West Bengal 80,176,197 41,465,985 38,710,212
01 ~ Medinipur 9,610,78B 4,916,370 4,694,418
02 \ffi'{ ~ tR7PIT North Twenty Four Parganas 8,934,286 4,638,756 4,295,530
03 Gretur ~ tR'J<fT South Twenty Four Parganas 6,906.689 3,564,993 3,341,696
04 ~ Barddhaman 6.895,514 3,588,376 3,307.138
05 :t~IGliSiIG Murshidabad 5,866,569 3,005,000 2.861.569
06 ~ Hugli 5.041,976 2,589,625 2,452,351
07 ~ Nadia 4,604.827 2,366,853 2,237,974
08 "'')*61<11 Kolkata 4,572,876 2,500,040 2,072,836
09 ~ Haora 4,273,099 2,241,898 2,031,201
10 "IclQ Ig14'l Jalpaiguri 3,401,173 1,751,145 1,650,028
11 ~ Maldah 3,290,468 1,689,406 1,601,062
12 ~ Bankura 3,192,695 1,636,002 1,556,693
13 ~ Birbhum 3,015,422 1,546,633 1,468,789
14 ~ Puruliya 2,536,516 1,298,078 1,238,438
15 ¥~ Koch Bihar 2,479,155 1,272,094 1,207,061
16 '3"ff'{ ~ Uttar Dinajpur 2,441,794 1,259.737 1,182.057
17 ~ Darjiling 1,609,172 830,644 778,528
18 Gf@rr Gl'1IVj~ • Dakshin Dinajpur • 1,503,178 770,335 732,843
~ \it'1't'i&:l!/Generat population
19 qfiWJ~ West Bengal 57,316,848 29.772,402 27,544.446 01 ~ Medinipur 7,235,767 3,710,444 3,525,323
02 '3'ffi ~ tRlFIT North Twenty Four Parganas 6,894.953 3,587.974 3.306,979
03 ~IGI<lIG Murshidabad 5,086,830 2,605,748 2,481,082
04 ~~'tR1'AT South Twenty Four Parganas 4,603,547 2,376,582 2,226,965
05 ~ Barddhaman 4,592,928 2,411,652 2,181,276
06 "')<"1 $Idl Kolkata 4,288,231 2,343,703 1,944,528
07 ~ Hugli 3,641,033 1,882,940 1.758,093
08 ~ Haora 3,595,224 1,896,17B 1,699,046
09 ~ Nadia 3,124,951 1,608,756 1,516,195
10 ~ Maldah 2,509,256 1,291,143 1,218,113
11 ~ Birbhum 1,922,401 988,083 934,318
12 ~ Bankura 1,864,504 962,402 902,102
13 '3'ffi~ Uttar Dinajpur 1.640,347 847,921 792,426
14 ~ Puruliya 1,609,108 825,257 783,851
15 "I<.'1ql{'J";o~ Jalpaiguri 1,510,908 784,067 726,841
16 ~ fornR Koch Bihar 1,222,535 628,223 594,312
17 ~ Darjiling 1,146,124 595,499 550,625
18 c:iiffur Gl'1I\i1g;~ • Dakshin Dinajpur * 828,201 425,830 402,371
~ - 3l."l1.1 3T:"I."l1. "$ ~!GEN - Other than SCJST poputation
Ixiii
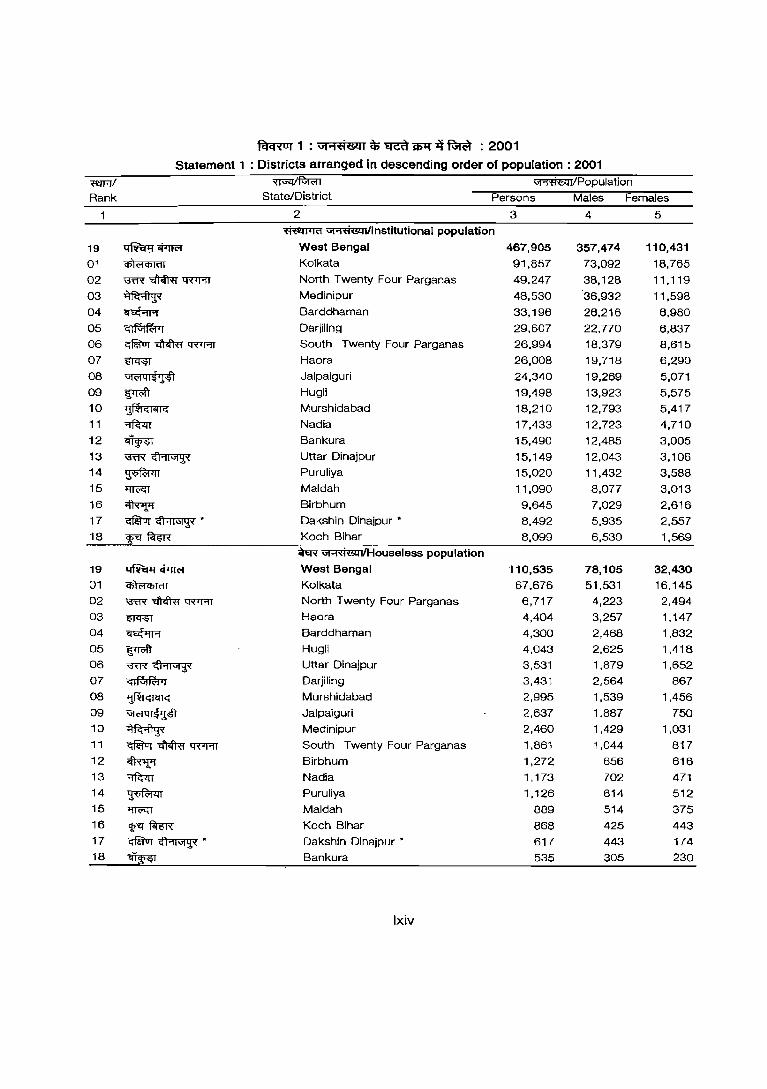
fcrcRur 1 : "'1"'i'fi(§ll1 ~ ~ iI)1l ~ ~ : 2001 Statement 1 : Districts arranged in descending order of population: 2001
~ ~f.Mn ~/Population
Rank State/District Persons Males Females
2 3 4 5
~ ut"'1't1i114i1lnstitutional population
19 ~-..j">m;r West Bengal 467,905 357,474 110,431
01 Cfi)(ijcFiltll Kolkata 91,857 73,092 18,765
02 \3ffi~~ North Twenty Four Parganas 49,247 38,128 11,119
03 ~ Medinipur 48,530 36,932 11,598
04 ~ Barddhaman 33,196 26,216 6,980
05 ~ Darjiling 29,607 22,770 6.837 06 ~~~ South Twenty Four Parganas 26,994 18,379 8,615
07 ~ Haora 26,008 19,718 6,290
08 \il(ij41$'j'$"i Jalpaiguri 24,340 19.269 5,071 09 ~ Hugli 19,498 13.923 5,575 10 'j)~IGlqlC; Murshidabad 18,210 12,793 5,417
11 ~ Nadia 17,433 12,723 4,710
12 ~ Bankura 15,490 12,485 3,005
13 13"t'R ~ Uttar Dinajpur 15,149 12,043 3,106 14 ~ Puruliya 15,020 11,432 3,588
15 ~ Maldah 11,090 8,077 3,013 16 ~ Birbhum 9,645 7,029 2,616
17 qfatur~* Dakshin Dinajpur * 8,492 5,935 2,557 18 ~~ Koch Bihar 8,099 6,530 1,569
~ ut'1't1i114I1Houseless population
19 ~<iTrrN West Bengal 110,535 78,105 32,430
01 <t» .... Cfildl Kolkata 67,676 51,531 16,145
02 ~ ~ Q"'(lT'f[ North Twenty Four Parganas 6,717 4,223 2,494
03 ~ Haora 4,404 3,257 1,147 04 ~ Barddhaman 4,300 2,468 1,832 05 ~ Hugli 4,043 2,625 1,418 06 ~~ Uttar Dinajpur 3,531 1,879 1,652 07 ~ Darjiling 3,431 2,564 867
08 'j~IGIOIIG Murshidabad 2,995 1,539 1,456
09 \il(ij41:f14l Jalpaiguri 2,637 1,887 750
10 ~ Medinipur 2,460 1,429 1,031 11 Gfijftrr~~ South Twenty Four Parganas 1,861 1,044 817 12 ~ Birbhum 1,272 656 616 13 ~ Nadia 1,173 702 471 14 ~ Puruliya 1,126 614 512 15 ~ Maldah 889 514 375 16 ~~ Koch Bihar 868 425 443 17 Gfaltrr ~. Oakshin Dinajpur • 617 443 174 18 ~ Bankura 535 305 230
Ixiv
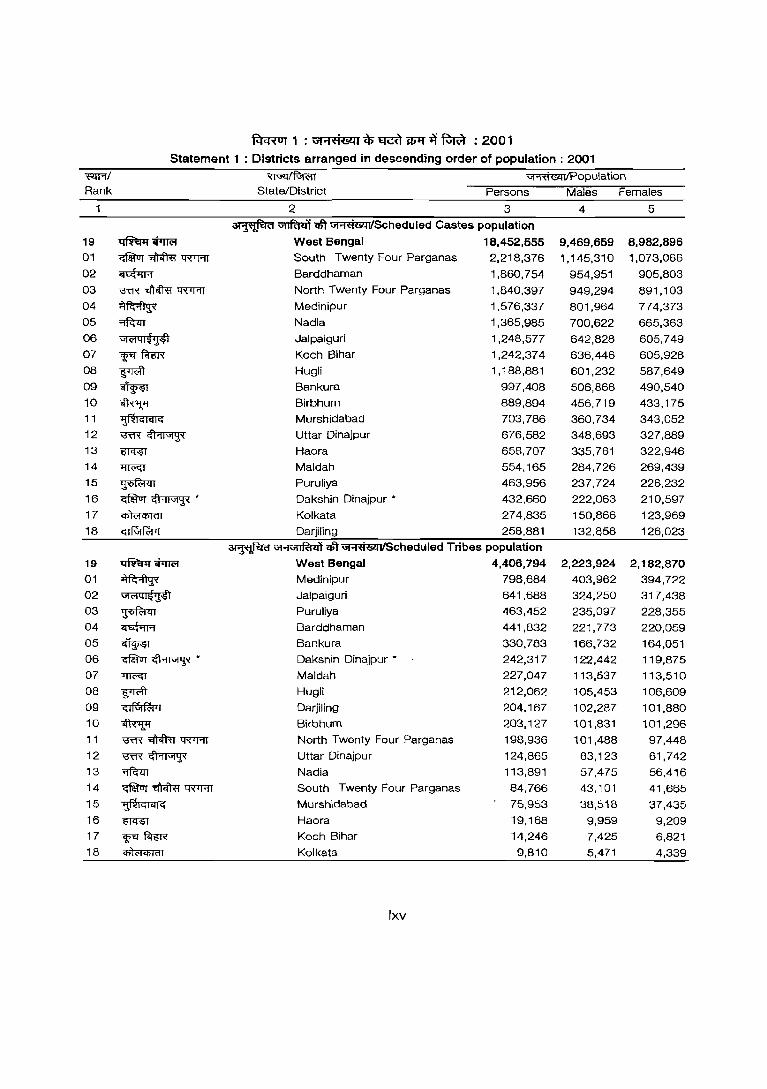
fcFRor 1 : \if",'<'i~1 ~ ~ Wlf ~ ~ : 2001 Statement 1 : Districts arranged in descending order of population: 2001
~ ~/~ ~!Popu!ation
Rank State/District Persons Males Females
1 2 3 4 5
~ ~ <1ft ~Scheduled Castes population
19 ~cj1'rn;f West Bengal 18.452,555 9,469,659 8,982,896 01 GfatoT "Ei'tifm "tRTFtT South Twenty Four Parganas 2,218,376 1,145,310 1,073,066
02 ~ Barddhaman 1,860,754 954,951 905,803
03 \3'ff{ ~ "tRTFtT North Twenty Four Parganas 1,840,397 949,294 891,103 04 ~ Medinipur 1,576,337 801,964 774,373
05 ~ Nadia 1,365,985 700,622 665,363 06 "I<1ql~'J4l Jalpaiguri 1,248,577 642,828 605,749 07 ¥ f.r"il'R Koch Bihar 1,242,374 636,446 605,928 08 ~ Hugli 1,188,881 601,232 587,649 09 ~ Bankura 997,408 506,868 490,540
10 ~ Birbhum 889,894 456,719 433,175 11 "1f?IGI<lI<: Murshidabad 703,786 360,734 343,052
12 '3m~ Uttar Dinajpur 676,582 348,693 327,889 13 ~ Haora 658,707 335,761 322,946
14 ~ Maldah 554,165 284,726 269,439 15 ~ Puruliya 463,956 237,724 226,232
16 GfatoT~ * Dakshin Dinajpur * 432,660 222,063 210,597
17 <1>1<1<1>1(11 Kolkata 274,835 150,866 123,969
18 <rrFvrfWT Darjiling 258,881 132,858 126,023
~ GtotVlIRl41 CJft Vlot'8i@lilScheduled Tribes popUlation
19 ~cj1'rn;f West Bengal 4,406,794 2,223,924 2,182,870
01 ~ Medinipur 798,684 403,962 394,722
02 VI ('I q Ii{ '}if! Jalpaiguri 641,688 324,250 317,438 03 ~ Puruliya 463,452 235,097 228,355 04 ~ Barddhaman 441,832 221,773 220,059 05 ~ Bankura 330,783 166,732 164,051 06 GfuloT~ * Dakshin Dinajpur * 242,317 122,442 119,875 07 'lI<'GT Maldah 227,047 113,537 113,510
08 ~ Hugli 212,062 105,453 106,609
09 ~ Darjiling 204,167 102,287 101,880
10 ~ Birbhum 203,127 101,831 101,296 11 '3m ~ "tRTFtT North Twenty Four Parganas 198,936 101,488 97,448 12 ~~ Uttar Dinajpur 124,865 63,123 61,742 13 ~ Nadia 113,891 57,475 56,416 14 Gf&lnT ~ lWRT South Twenty Four Parganas 84,766 43,101 41,665 15 "1f?IGI"lIG Murshidabad 75,953 38,5"\B 37,435
16 ~ Haora 19,168 9,959 9,209 17 ~~ Koch Bihar 14,246 7,425 6,821 18 (f)1(>lCf>lcll Kolkata 9,810 5,471 4,339
Ixv
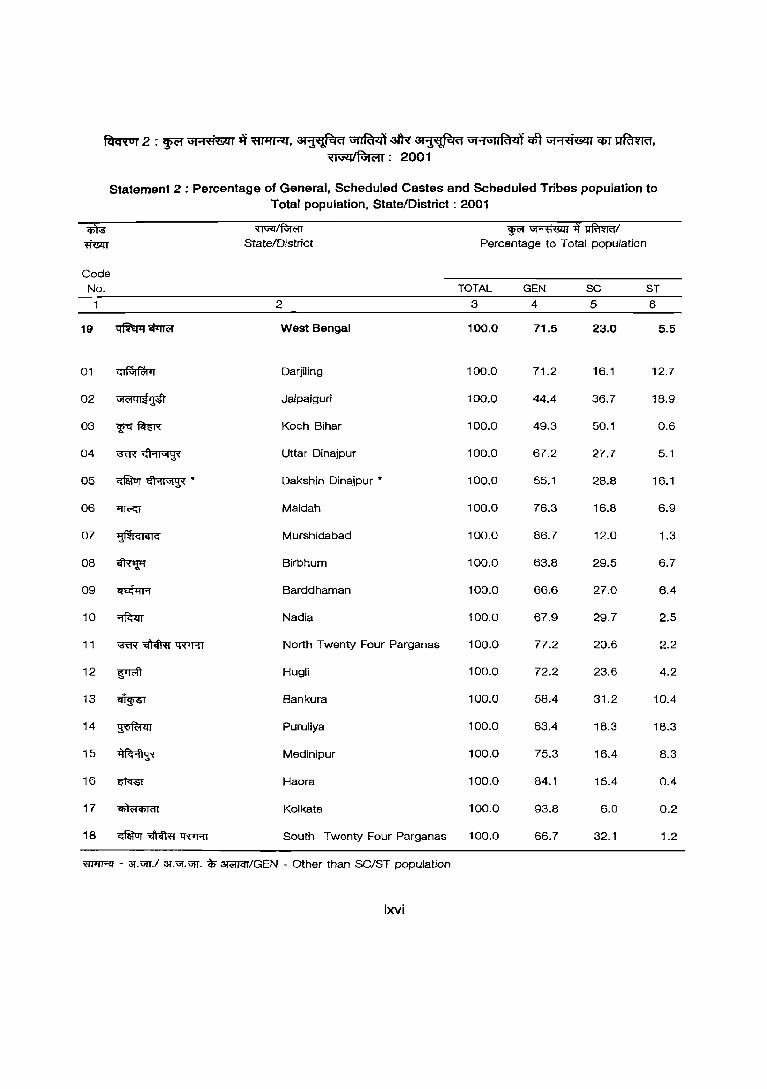
~ 2 : ~ Gj"'l't1'li'A( ll~, 31~d ~ atR" i31~d Gj:;:fUflRlzii qft Gl"1't1&l( <I>T~, ~: 2001
Statement 2 : Percentage of General, Scheduled Castes and Scheduled Tribes population to
Total population, StateIDistrict : 2001
i'ii ~/ftrffi WR~"4~/ ~ State/District Percentage to Total population
Code No. TOTAL GEN SC ST
1 2 3 4 5 6
19 ~'iPTffi West Bengal 100.0 71.5 23.0 5.5
01 ~ Darjiling 100.0 71.2 16.1 12.7
02 \ij(ij4It$>( Jalpaiguri 100.0 44.4 36.7 18.9
00 W"<! f.rn"R Koch Bihar 100.0 49.3 50.1 0.6
04 '\3"fR~ Uttar Dinajpur 100.0 67.2 27.7 5.1
05 ~~. Dakshin Dinajpur • 100.0 55.1 28.8 16.1
06 ~ Maldah 100.0 76.3 16.8 6.9
07 'i~I<:I"'<: Murshidabad 100.0 86.7 12.0 1.3
08 ~ Birbhum 100.0 63.8 29.5 6.7
09 ~ Barddhaman 100.0 66.6 27.0 6.4
10 ~ Nadia 100.0 67.9 29.7 2.5
11 ~~~ North Twenty Four Parganas 100.0 77.2 20.6 2.2
12 ~ Hugli 100.0 72.2 23.6 4.2
13 ~ Bankura 100.0 58.4 31.2 10.4
14 ~ Puruliya 100.0 63.4 lB.3 18.3
15 ~ Medinipur 100.0 75.3 16.4 8.3
16 ~ Haora 100.0 84.1 15.4 0.4
17 q;)(ijCf)I<11 Kolkata 100.0 93.8 6.0 0.2
18 ~~lfflAT South Twenty Four Parganas 100.0 66.7 32.1 1.2
~ - 3T.\iIT.I 3T.Uf.\iIT. ~ ~/GEN - Other than SC/ST population
Ixvi
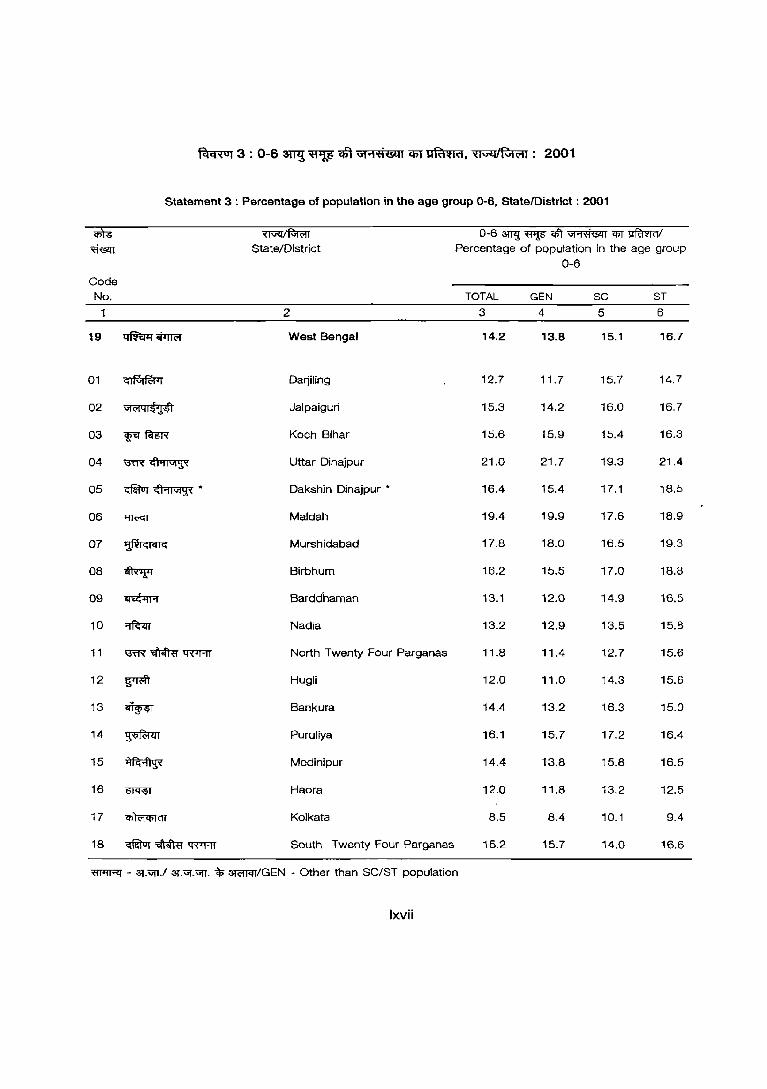
fcrcRol3 : 0-6 ~ ~ <1ft \i1"iti@l1 <PI~, ~ : 2001
Statement 3 : Percentage of population in the age group 0-6, StatelDistrict : 2001
m ~/~ 0-6 3m.! ~ <1ft ~ em ~I
~ State/District Percentage of population in the age group 0-6
Code No. TOTAL GEN 8C 8T
2 3 4 5 6
19 ~~ West Bengal 14.2 13.8 15.1 16.7
01 ~ Darjiling 12.7 11.7 15.7 14.7
02 G1<'1ql~'J4l Jalpaiguri 15.3 14.2 16.0 16.7
03 '¥I'~ Koch Bihar 15.6 15.9 15.4 16.3
04 i3ffi'~ Uttar Dinajpur 21.0 21.7 19.3 21.4
05 ~~* Dakshin Dinajpur * 16.4 15.4 17.1 18.5
06 1ffi'GT Maldah 19.4 19.9 17.6 18.9
07 ,!~IC;I'IIC: Murshidabad 17.8 18.0 16.5 19.3
08 ~ Birbhum 16.2 15.5 17.0 18.8
09 ~ Barddhaman 13.1 12.0 14.9 16.5
10 ~ Nadia 13.2 12.9 13.5 15.8
11 i3ffi'~~ North Twenty Four Parganas 11.8 11.4 12.7 15.6
12 ~ Hugli 12.0 11.0 14.3 15.6
13 ~ Bankura 14.4 13.2 16.3 15.0
14 ~ Puruliya 16.1 15.7 17.2 16.4
15 ~ Medinipur 14.4 13.8 15.8 16.5
16 ~ Haora 12.0 11.8 13.2 12.5
17 q;) Wl>lt1l Kolkata 8.5 8.4 10.1 9.4
18 ~~~ South Twenty Four Parganas 15.2 15.7 14.0 16.6
~ - 31.-m.l :3l'."I.V!T. ~ 3ffiT<Il/GEN - Other than SC/ST population
Ixvii
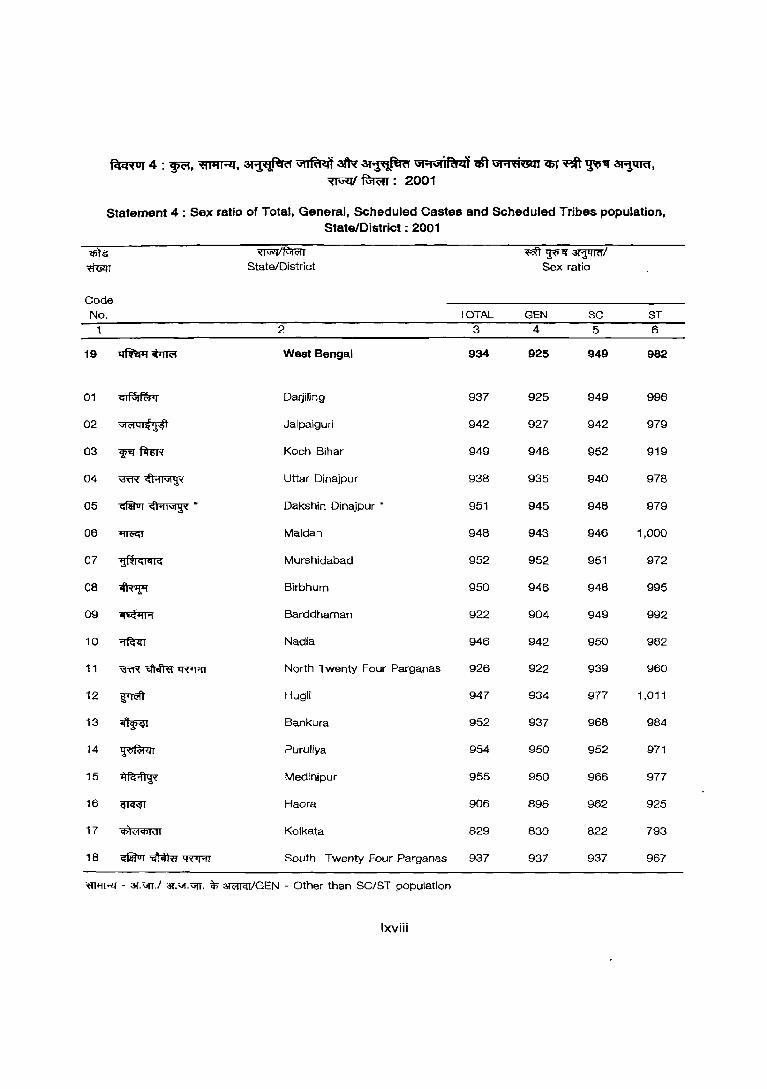
fcm'ur 4 : Wt"I, ~. 31~('j ~ aft;( at1~('j Gt"'1GtiRizal t6l U1"'1't161l1l5T ~~" ~, ~~: 2001
Statement 4: Sex ratio of Total, General, Scheduled Castes and Scheduled Tribes population, State/District; 2001
"iii ~/ttwrr ~~lf~/ ..rozrr State/District Sex ratio
Code No. TOTAL GEN SC ST
"\ 2 3 4 5 6
19 ~~ West Bengal 934 925 949 982
01 ~ Darjillng 937 925 949 996
02 <:iIclql~~ Ja\paiguri 942 927 942 979
03 err f<n:N Koch Bihar 949 946 952 919
04 \3'ff'(~ Uttar Dinajpur 938 935 940 978
05 c;1itur~ - Dakshin Dinajpur + 951 945 948 979
06 ~ Ma\dah 948 943 946 1,000
07 'j~IGI"IG Murshidabad 952 952 951 972
08 ~ Birbhum 950 946 948 995
09 ~ Barddhaman 922 904 949 992
10 ~ Nadia 946 942 950 982
11 ~~tRTMT North Twenty Four Parganas 926 922 939 960
12 ~ Hugli 947 934 977 1,011
13 ~ Bankura 952 937 968 984
14 ~r Puruliya 954 950 952 971
15 ~ Medinipur 955 950 966 977
16 ~ Haora 906 896 962 925
17 <t>lclCf>ldl Kolkata 829 830 822 793
18 GfMtrr~~ South Twenty Four Parganas 937 937 937 967
~ - 3T.\JiT.J 'H.VI"·VIT. ~ 3fcl1CIT/GEN - Other than SC/ST population
Ixviii
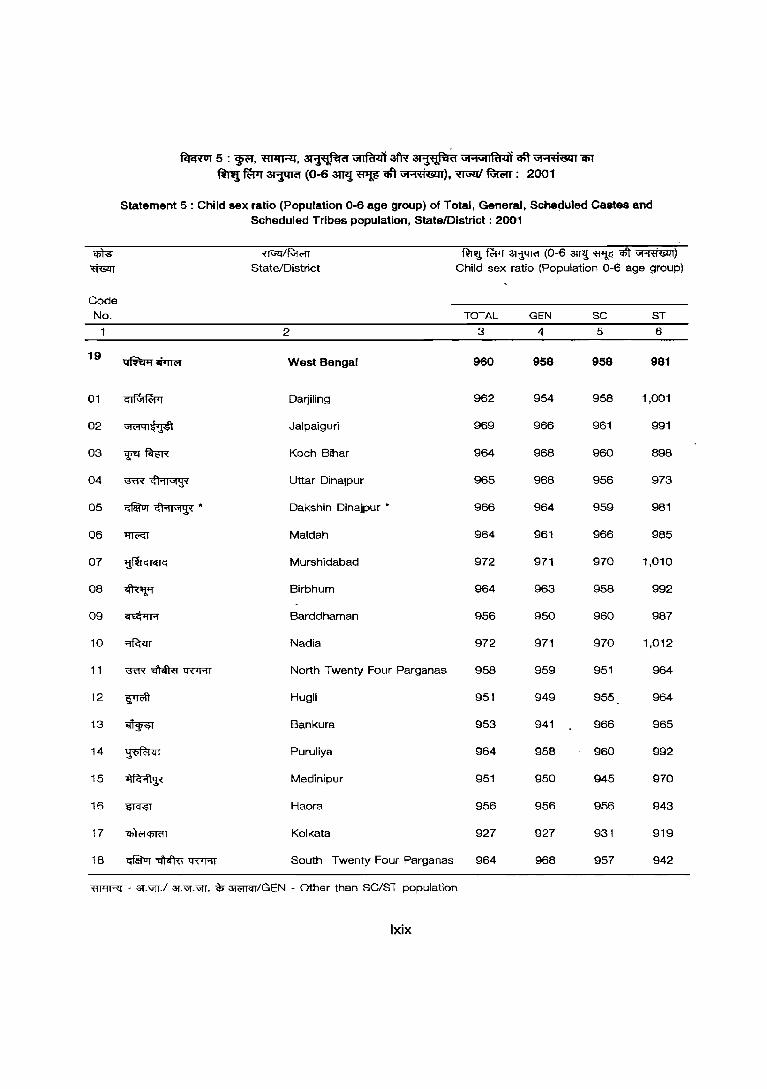
~ 5 : ~. 'fll1'I"Rf. at,!~d ~ 3ft;( at~d \'JI'1\i!lfd41 iIft' \'JI'1't1&11 CIiT
fmj fWT 31'"jQ'R'J (0-6 ~ ~ <1ft \i!'1't1&1I), ~ ~: 2001
Statement 5: Child sex ratio (Population 0-6 age group) of Total. General. Scheduled Castes and Scheduled Tribes population. StatelDistrict : 2001
m ~/Rif<;rr ~ fWT ~ (0-6 an<.! ~ qft ~) ~ State/District Child sex ratio (Population 0-6 age group)
Code No. TOTAL GEN SC ST
1 2 3 4 5 6
19 ~~ West Bengal 960 958 958 981
01 ~ Darjiling 962 954 958 1.001
02 \ijt"lql~"}tI Jalpaiguri 969 966 961 991
03 '!"<I' f.tm Koch Bihar 964 968 960 898
04 ~~ Uttar DinalPur 965 968 956 973
05 Gf&tuT~* Dakshin Dinajpur * 966 964 959 981
06 ~ Maldah 964 961 966 985
07 'j~IGI"IIC; Murshidabad 972 971 970 1.010
08 ~ Birbhum 964 963 958 992
09 ~ Barddhaman 956 950 960 987
10 ~ Nadia 972 971 970 1.012
11 ~~~ North Twenty Four Parganas 958 959 951 964
12 ~ Hugli 951 949 955 964
13 ~ Bankura 953 941 966 965
14 ~ Puruliya 964 958 960 992
"15 ~ Medinipur 951 950 945 970
"16 ~ Haora 956 956 956 943
17 q;)t"I<'6ldl Kolkata 927 927 931 919
"18 ~~1:R'AT South Twenty Four Parganas 964 968 957 942
~ - 31.V[T.I 31.\:i[.V[T. "$" 3I<'Il"'IT/GEN - Other than SC/ST population
Ixix
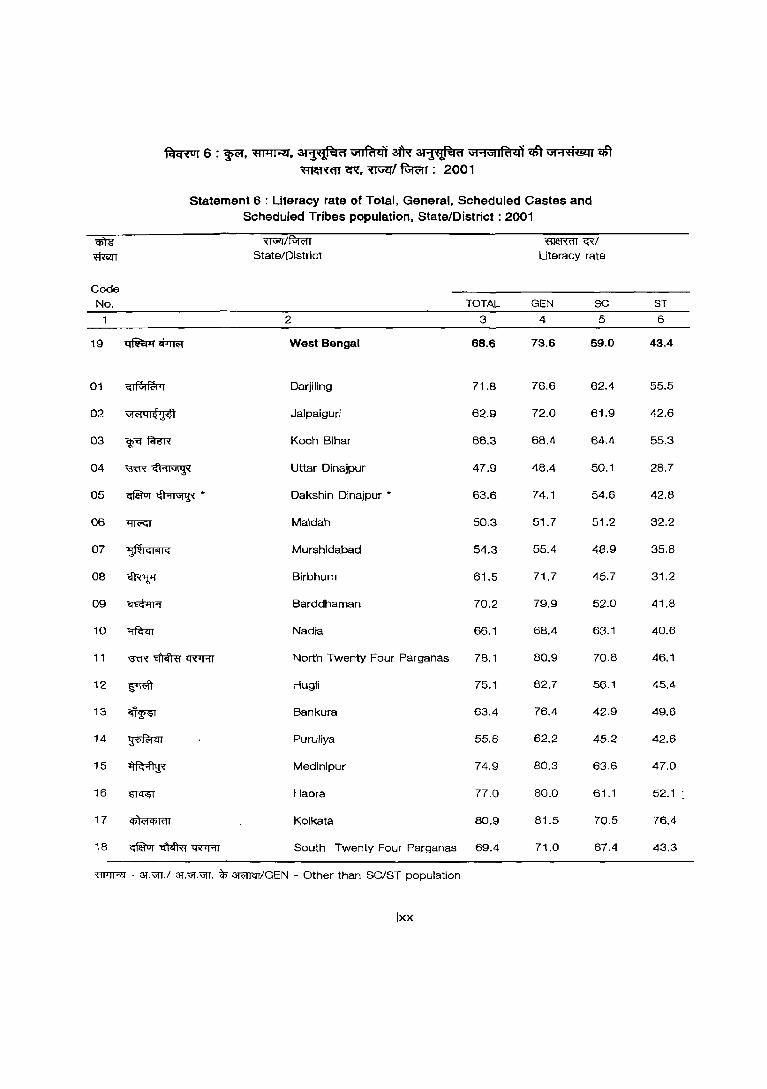
fctcRur 6 : ~. ~. 3j~t'I ~ aIR 3j~t'I G1"'1Gjlfa~ <lft Gt'1'<1'8Q1 <lft m~ CR. ~I fGwrr : 2001
Statement 6: Literacy rate of Total, General, Scheduled Castes and Scheduled Tribes population, State/District: 2001
m ~/ftrill "ffi!!ffilT ~/
msm State/District Literacy rate
Code No. TOTAL GEN SC ST
1 ·2 3 4 5 6
19 ~~ West Bengal 68.6 73.6 59.0 43.4
01 ~ Darjiling 71.8 76.6 62.4 55.5
02 \i1ct41~141 JaJpaiguri 62.9 72.0 61.9 42.6
03 ¥~ Koch Bihar 66.3 68.4 64.4 55.3
04 \.'ffiX~ Uttar Dinajpur 47.9 48.4 50.1 28.7
05 Gfiil'ur ~. Dakshin Dinajpur * 63.6 74.1 54.6 42.8
06 +m'GT Maldah 50.3 51.7 51.2 32.2
07 1~IGI"IG Murshidabad 54.3 55.4 48.9 35.8
08 ~ Birbhum 61.5 71.7 45.7 31.2
09 ~ Barddhaman 70.2 79.9 52.0 41.8
10 ~ Nadia 66.1 68.4 63.1 40.6
11 \.'ffiX ~ Q"rIT'IT North Twenty Four Parganas 78.1 80.9 70.8 46.1
12 ~ Hugli 75.1 82.7 56.1 45.4
13 ~ Bankura 63.4 76.4 42.9 49.6
14 ~ Puruliya 55.6 62.2 45.2 42.6
15 ~ Medinipur 74.9 80.3 63.6 47.0
16 ~ Haora 77.0 80.0 61.1 52.1 :
17 Cf>lct C/)1(1 I Kolkata 80.9 81.5 70.5 76.4
18 ~ ~'4'<'A1' South Twenty Four Parganas 69.4 71.0 67.4 43.3
~ - 3T.urr.l 3T.;sr.urr. ~ ~/GEN - Other than SC/ST population
Ixx
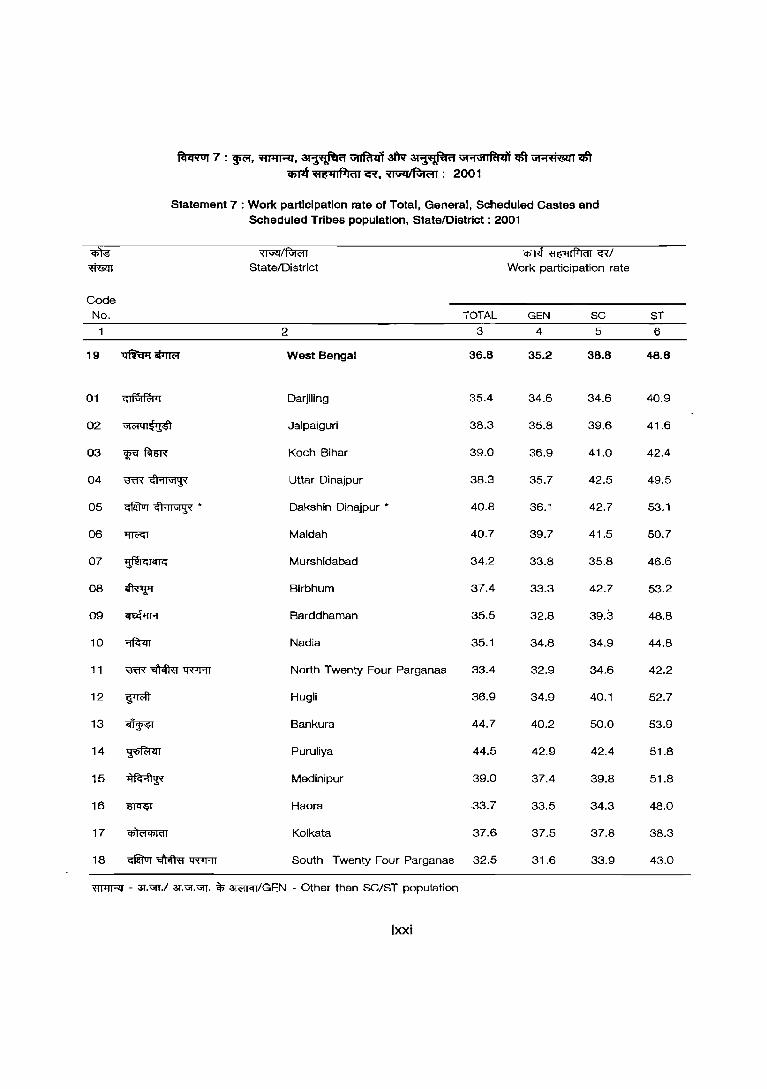
fcr<Ror 7 : ¥. ~. ~ ~ arR ~ ,iH\JIIFt'l4'i <1ft Gl"'loH&l1 <1ft 'iImt~CR'.~: 2001
Statement 7: Work participation rate of Total. General. Scheduled Castes and Scheduled Tribes population. State/District: 2001
q;);s ~!R;rc;rr q) T<f ~ "PH f?I<1I G:'{/ m:szrr State/District Work participation rate
Code No. TOTAL GEN SC ST
1 2 3 4 5 6
19 'Q$rq ojlm;r West Bengal 36.8 35.2 38.8 48.8
01 ~ Darjiling 35.4 34.6 34.6 40.9
02 \jj&l41~'141 Jalpaiguri 38.3 35.8 39.6 41.6
03 ¥~ Koch Bihar 39.0 36.9 41.0 42.4
04 ~~ Uttar Dinajpur 38.3 35.7 42.5 49.5
05 ~~* Dakshin Dinajpur * 40.8 36.1 42.7 53.1
06 ""I'T'<iGT Maldah 40.7 39.7 41.5 50.7
07 'j~IC;IElIC; Murshidabad 34.2 33.8 35.8 46.6
08 ~ Birbhum 37.4 33.3 42.7 53.2
09 ~ Barddhaman 35.5 32.8 39.3 48.8
10 ~ Nadia 35.1 34.8 34.9 44.8
11 '\"RR~~ North Twenty Four Parganas 33.4 32.9 34.6 42.2
12 ~ Hugli 36.9 34.9 40.1 52.7
13 ~ Bankura 44.7 40.2 50.0 53.9
14 ~ Puruliya 44.5 42.9 42.4 51.8
15 ~ Medinipur 39.0 37.4 39.8 51.8
16 ~ Haora 33.7 33.5 34.3 48.0
17 (j)~C'lq)ltII Kolkata 37.6 37.5 37.8 38.3
18 ~~lRTT"fT South Twenty Four Parganas 32.5 31.6 33.9 43.0
"ffil'I'RI' - aT.vrr.l aT.\if.vrr. iP 3R11<IT/GEN - Other than SC/ST population
Ixxi
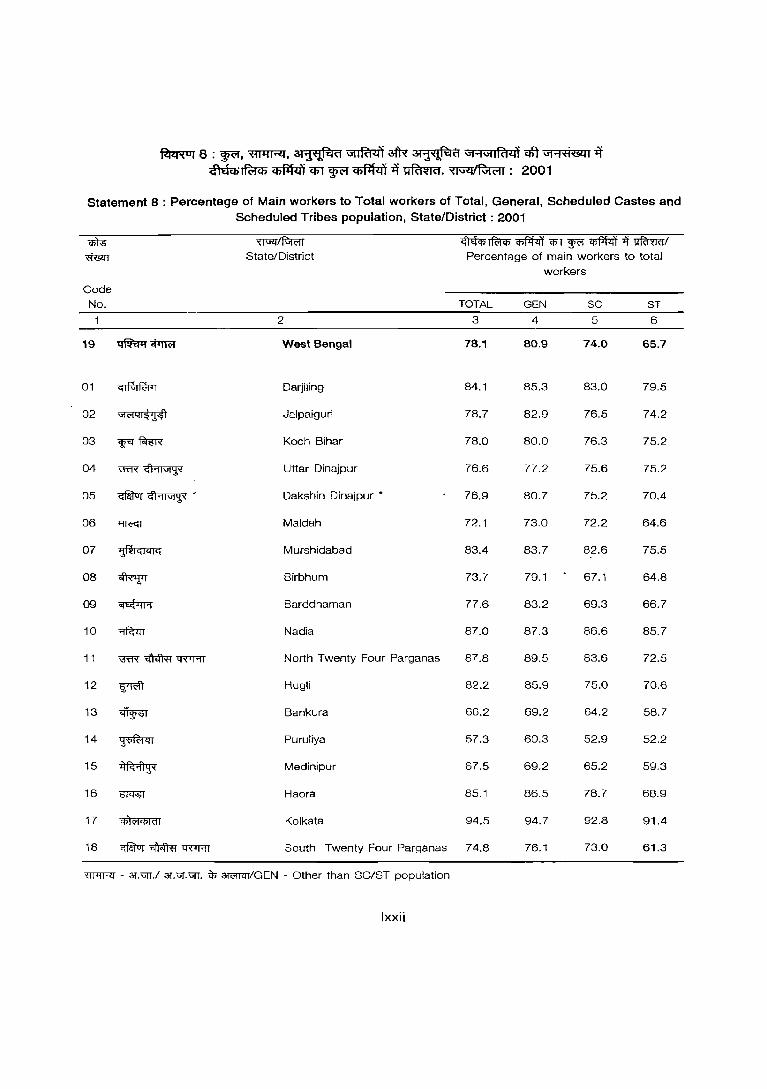
fctcRur 8 : ~, ~. 31~~ ~ 31R 3'lj~(1 \l'f"'1\l'fIRlll'i qft \l'f"'1'<1'!§Q1 -q cfta<bl~<b ~ cpr wc-r ~ -q~. ~ : 2001
Statement 8: Percentage of Main workers to Total workers of Total, General, Scheduled Castes and Scheduled Tribes population, State/District: 2001
cfit;s WRT/ftrffi <ft$pTft:tq; cnf1tm cpT WR ~ ii ~f m.sm State/District Percentage of main workers to total
workers
Code No. TOTAL GEN SC ST
1 2 3 4 5 6
19 ~~ West Bengal 78.1 80.9 74.0 65.7
01 ~ Darjiling 84.1 85.3 83.0 79.5
02 '''1<'1 q I ~ 'J~ Jalpaiguri 78.7 82.9 76.5 74.2
03 W'<f~ Koch Bihar 78.0 80.0 76.3 75.2
04 BTR'~ Uttar Dinajpur 76.6 77.2 75.6 75.2
05 Gfalur~ * Dakshin Dinajpur * 76.9 80.7 75.2 70.4
06 ~ Maldah 72.1 73.0 72.2 64.6
07 'j~IGliilIG Murshidabad 83.4 83.7 82.6 75.5
08 ~ Birbhum 73.7 70.1 67.1 64.8
09 ~ Barddhaman 77.6 83.2 69.3 66.7
iO ~ Nadia 87.0 87.3 86.6 85.7
11 BTR' ~ 'QXTAT North Twenty Four Parganas 87.8 89.5 83.6 72.5
12 ~ Hugli 82.2 85.9 75.0 70.6
13 ~ Bankura 66.2 69.2 64.2 58.7
14 ~ Puruliya 57.3 60.3 52.9 52.2
15 ~ Medinipur 67.5 69.2 65.2 59.3
16 ~ Haora 85.1 86.5 78.7 68.9
17 cp'I<:1<tJ1d1 Kolkata 94.5 94.7 92.8 91.4
18 ~~tRTr-lT South Twenty Four Parganas 74.8 76.1 73.0 61.3
~ - 3f.vrr.l 3f.ur.UJT. ~ 31<'il"IT/GEN - Other than SC/ST population
Ixxii
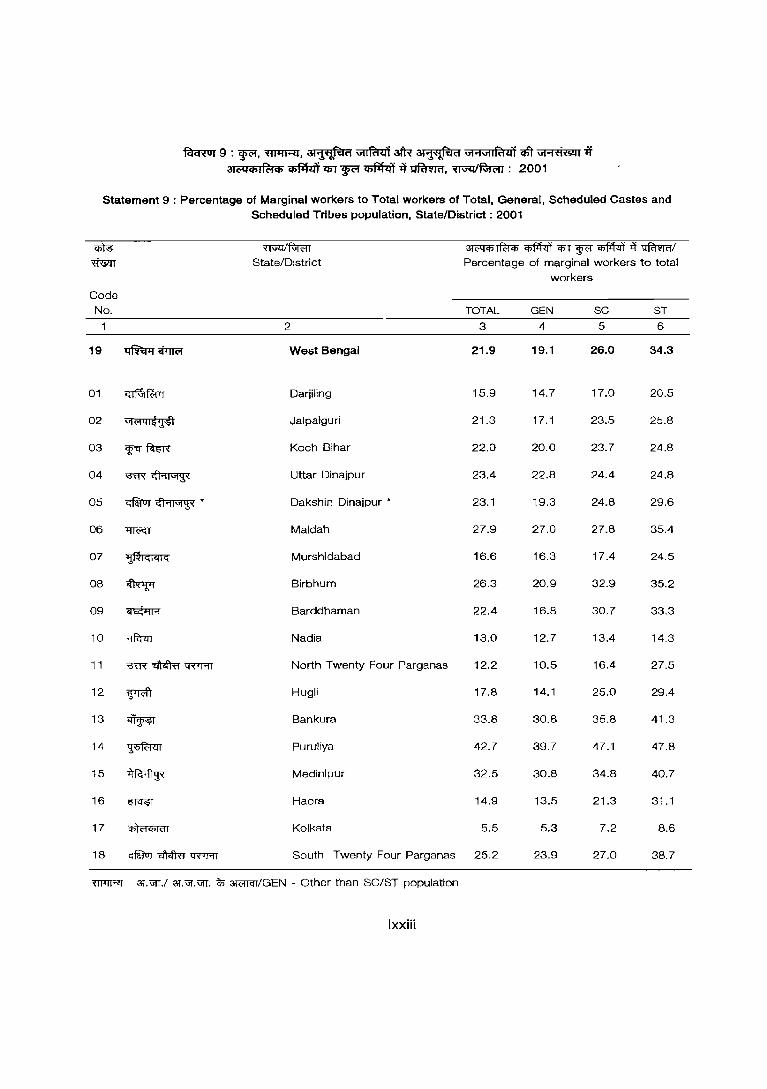
fctcRur 9 : ~, ~, 31~a ~ 3fN ~ \JHIJIIRH~1 qft lJI"'lti&llll 3lC'QQ;1R:t<6 CJ>f1mt CI>T 'WF' ~ 1)'~, ~~: 2001
Statement 9 : Percentage of Marginal workers to Total workers of Total, General, Scheduled Castes and Scheduled Tribes population, State/District: 2001
~ ~lf'(;rC'n ~TfBq;-~ cpT ¥ ~ ~ ~/ ~ State/District Percentage of marginal workers to total
workers
Code No. TOTAL GEN SC ST
2 3 4 5 6
19 ~~ West Bengal 21.9 19.1 26.0 34.3
01 ~ Darjiling 15.9 14.7 17.0 20.5
02 "n'1 q I ~:r~ Jalpaiguri 21.3 17.1 23.5 25.8
03 W'<f~ Koch Bihar 22.0 20.0 23.7 24.8
04 \3"ff'{ ~ Uttar Dinajpur 23.4 22.8 24.4 24.8
05 GfatoT~ * Dakshin Dinajpur * 23.1 19.3 24.8 29.6
06 "ffi'ia Maldah 27.9 27.0 27.8 35.4
07 'j;ffIGI<iIG Murshidabad 16.6 16.3 17.4 24.5
08 ~ Birbhum 26.3 20.9 32.9 35.2
09 ~ Barddhaman 22.4 16.8 30.7 33.3
10 ~ Nadia 13.0 12.7 13.4 14.3
11 \YfR~~ North Twenty Four Parganas 12.2 10.5 16.4 27.5
12 ~ Hugli 17.8 14.1 25.0 29.4
13 ~ Bankura 33.8 30.8 35.8 41.3
14 ~ Puruliya 42.7 39.7 47.1 47.8
15 ~ Medinipur 32.5 30.8 34.8 40.7
16 ~ Haora 14.9 13.5 21.3 31.1
17 q;'1 <1 C!1ldl Kolkata 5.5 5.3 7.2 8.6
18 crtaTur~~ South Twenty Four Parganas 25.2 23.9 27.0 38.7
~ - 3L\jf[j 3f.'if.\jf[. ~ 3l'<1lQT/GEN - Other than SC/ST population
Ixxiii
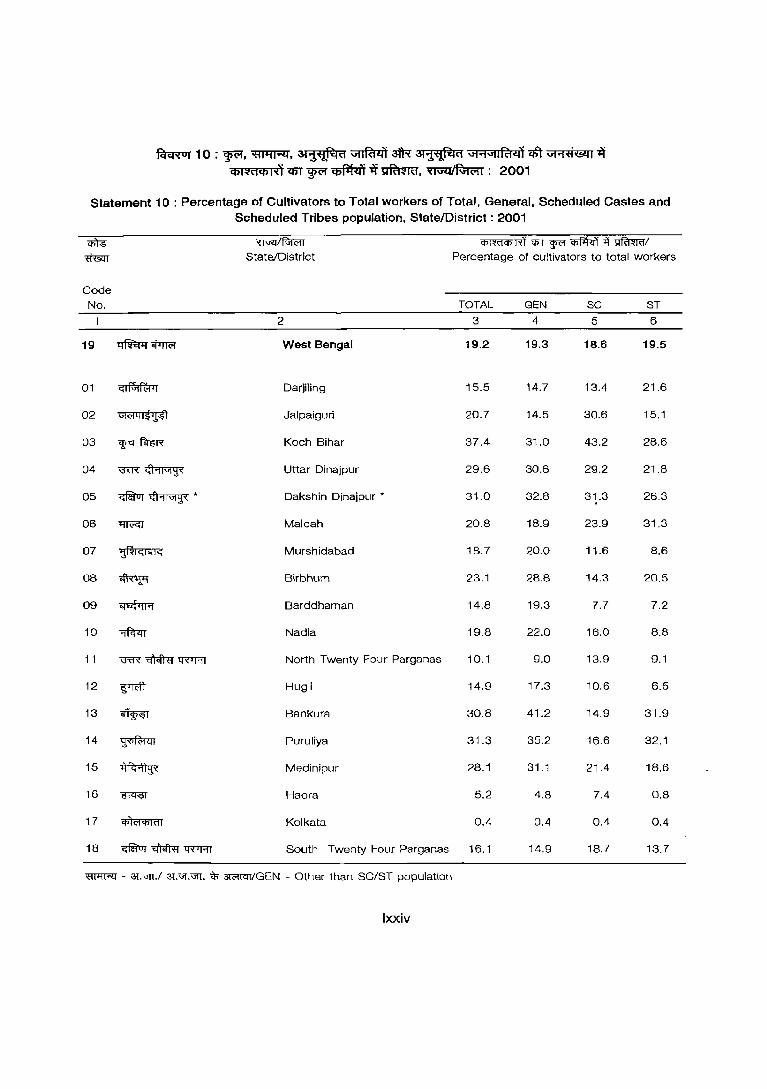
f<tcRuT 10 : CjWI'. ~. 31 ~ d ~ atR 31~d \it'1\JfIRt-m ctt \Jf'1ti6ll1 II <lMdq) Ii() C5T ~ ~ -q~. 'i("J\ftJ/f-';n;rr : 2001
Statement 10: Percentage of Cultivators to Total workers of Total, General, Scheduled Castes and Scheduled Tribes population, State/District: 2001
m- ~/fGrc;rr Cf>TmCpm cpT 3'R ~ ~ >l'fmml ~ State/District Percentage of cultivators to total workers
Code No. TOTAL GEN SC ST
2 3 4 5 6
19 ~~ West Bengal 19.2 19.3 18.6 19.5
01 ~ Darjiling 15.5 14.7 13.4 21.6
02 Vl('jqlt·}{l Jalpaiguri 20.7 14.5 30.6 15.1
03 <fG ftrim' Koch Bihar 37.4 31.0 43.2 28.6
04 \3'<R~ Uttar Dinajpur 29.6 30.6 29.2 21.8
05 ~~. Dakshin Dinajpur • 31.0 32.8 31.3 26.3
06 ~ Maldah 20.8 18.9 23.9 31.3
07 'j~IGliijIG Murshidabad 18.7 20.0 11.6 8.6
08 ~ Birbhum 23.1 28.8 14.3 20.5
09 ~ Barddhaman 14.8 19.3 7.7 7.2
10 ~ Nadia 19.8 22.0 16.0 8.B
1'1 \3'<R ~ t:R1RT North Twenty Four Parganas '10.1 9.0 13.9 9.1
12 ~ Hugli 14.9 17.3 10.6 6.5
13 ~ Bankura 30.8 41.2 14.9 31.9
14 ~ Puruliya 31.3 35.2 16.6 32.1
15 ~ Medinipur 28.1 31.1 21.4 18.6
16 ~ Haora 5.2 4.8 7.4 0.8
17 <t>lWIiI <1 I Kolkata 0.4 0.4 0.4 0.4
18 'G'faluT ~ "tRTRT South Twenty Four Parganas 16.1 14.9 18.7 13.7
~ - a{."lT./ a{.\if.'V11. 'ij, ~/GEN - Other than SC/ST population
Ixxiv
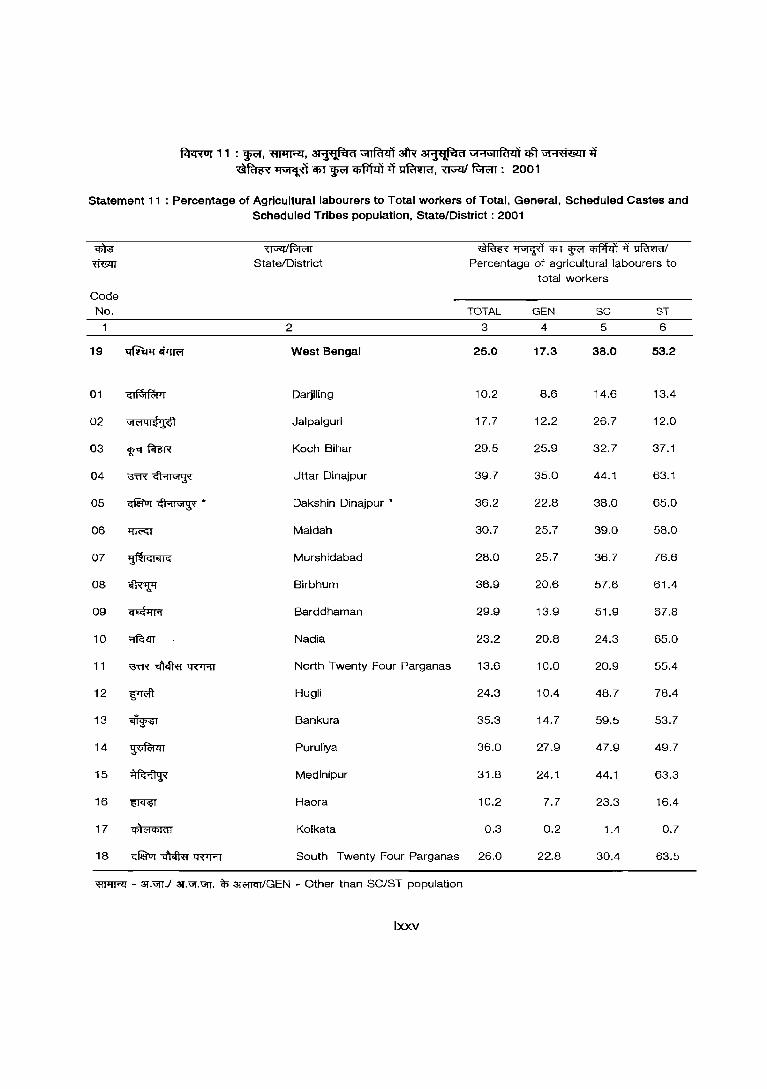
~11 :~.~. ~~3fR~ut'1utIRlzfi~ \iHtj&li~ ~~Cf>T~~-ij~.~~: 2001
Statement 11 : Percentage of Agricultural labourers to Total workers of Total. General. Scheduled Castes and Scheduled Tribes population. State/District: 2001
• ~/ftR;rr ~~cpT~~~~/ ~ State/District Percentage of agricultural labourers to
total workers
Code No. TOTAL GEN SC ST
1 2 3 4 5 6
19 ~~ West Bengal 25.0 17.3 38.0 53.2
01 ~ Darjiling 10.2 8.6 14.6 13.4
02 \if t"(4lif'l4'l Jalpaiguri 17.7 12.2 26.7 12.0
03 ¥~ Koch Bihar 29.5 25.9 32.7 37.1
04 ~~ Uttar Dinajpur 39.7 35.0 44.1 63.1
05 c:1alur~ • Dakshin Dinajpur • 36.2 22.8 38.0 65.0
06 ~ Maldah 30.7 25.7 39.0 58.0
07 'j~IG(ElIG Murshidabad 28.0 25.7 36.7 76.6
08 ~ Birbhum 36.9 20.6 57.6 61.4
Og ~ Barddhaman 29.9 13.9 51.9 67.8
10 ~m Nadia 23.2 20.8 24.3 65.0
11 \3ffi" ~ l:R1l"lT North Twenty Four Parganas 13.6 10.0 20.9 55.4
12 ~ Hugli 24.3 '10.4 48.7 78.4
13 ~ Bankura 35.3 '14.7 59.5 53.7
14 ~ Puruliya 36.0 27.9 47.9 49.7
15 ~ Medinipur 31.8 24.1 44.1 63.3
16 ~ Haora 10.2 7.7 23.3 16.4
17 cp)t"(C/)(dI Kolkata 0.3 0.2 1.4 0.7
'18 c:1alur~~ South Twenty Four Parganas 26.0 22.8 30.4 63.5
~ - 31."IT./ 3J.ur.urr. ~ 31'ffiCIT/GEN - Other than SC/ST population
Ixxv
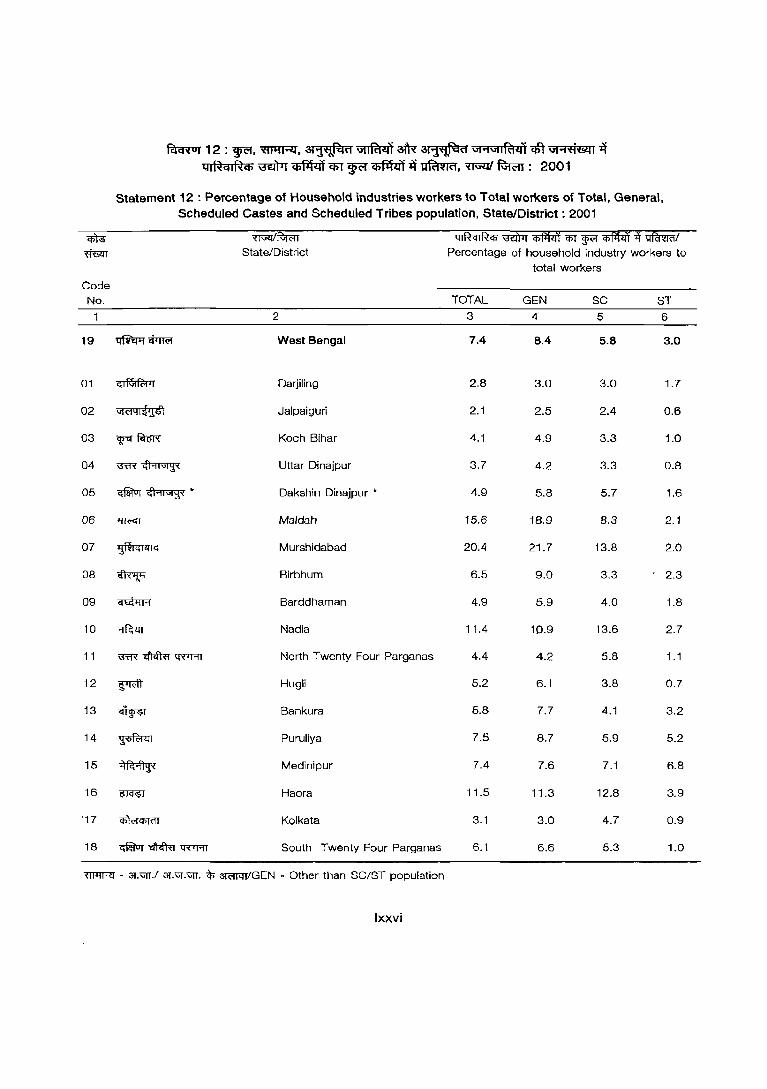
fcI-cRur 1 2 : ~, 'ffilt"RJ, aI 'j~t1 ~ atR 31~t1 \i1 "'IGII Rim qft \it<1't1m I ~ ql~ql~q; \3EWT ~ cpr ~ ~.q~, ~/ ~ : 2001
Statement 12 : Percentage of Household industries workers to Total workers of Total, General, Scheduled Castes and Scheduled Tribes population, State/District: 2001
• ~/~ qIR<uR<t> ~ ~"<liT ~ ~ ~ ~/
~ State/District Percentage of household industry workers to total workers
Code No. TOTAL GEN SC ST
2 3 4 5 6
19 ~1!(Tmor West Bengal 7.4 B.4 5.8 3.0
01 ~ Darjiling 2.8 3.0 3.0 1.7
02 \i1(1ql~'J~ Jalpaiguri 2.1 2.5 2.4 0.6
03 'lr"I f<rt:R Koch Bihar 4.1 4.9 3.3 1.0
04 ~~ Uttar Dinajpur 3.7 4.2 3.3 0.8
05 GfWrr~· Dakshin Dinajpur • 4.9 5.8 5.7 1.6
06 "fI<'GT Ma/dah 15.6 18.9 8.3 2.1
07 '1~IGI"lIG Murshidabad 20.4 21.7 13.8 2.0
08 ~ Birbhum 6.5 9.0 3.3 2.3
09 ~ Barddhaman 4.9 5.9 4.0 1.8
10 ~ Nadia 11.4 10.9 13.6 2.7
11 ~~ t:fflAT North Twenty Four Parganas 4.4 4.2 5.B 1.1
12 ~ Hugli 5.2 6.1 3.B 0.7
13 ~ Bankura 5.8 7.7 4.1 3.2
14 ~ Puruliya 7.5 8.7 5.9 5.2
15 ~ Medinipur 7.4 7.6 7.1 6.8
16 ~ Haora 11.5 11.3 12.8 3.9
'17 ~ Kolkata 3.1 3.0 4.7 0.9
18 ~~~ South Twenty Four Parganas 6.1 6.6 5.3 1.0
'ffi1fRT - 31.~./ 31.vr.~. -ij; 3ffiT1l1/GEN - Other than SC/ST population
Ixxvi
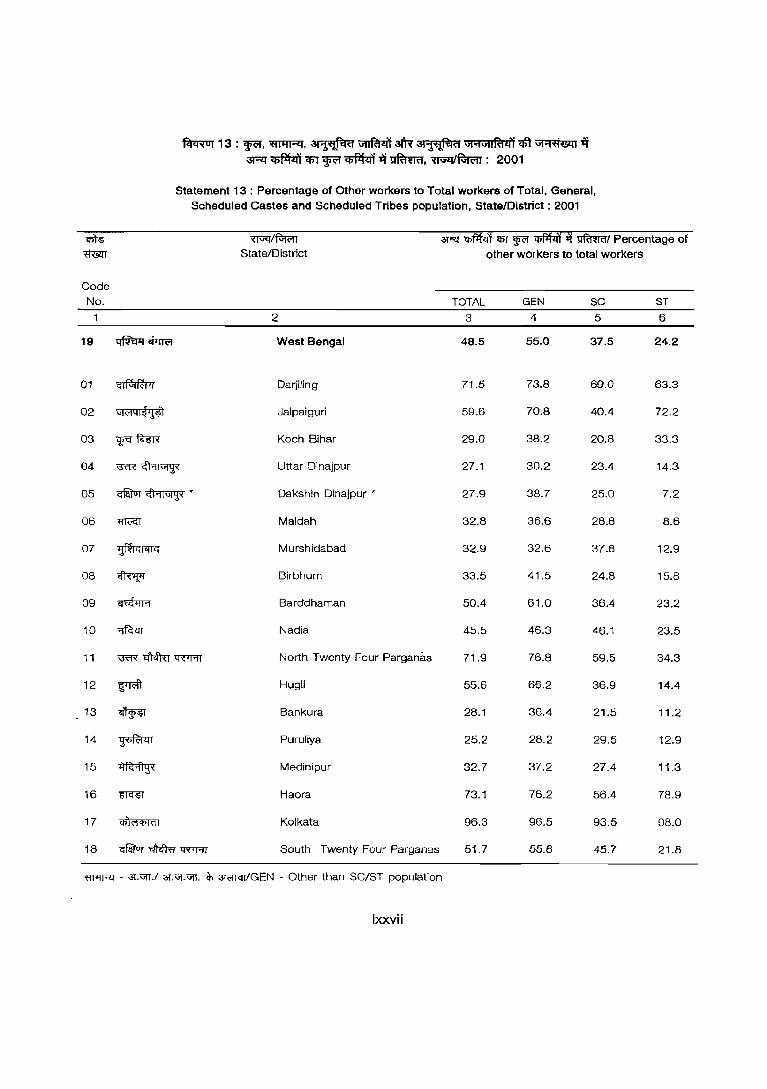
fcrcRur 13 : F"f. ~. ~ ~ 3tR ~ "'"'I"'lftlli'i qft "'"'I'!1'1!t11 if a:R~mF"f~if~,~~: 2001
Statement 13 : Percentage of Other workers to Total workers of Total, General, Scheduled Castes and Scheduled Tribes population, State/District: 2001
m ~/~ ~ ~ lPT ~ q;f'f<it if ~I Percentage of <t&rr State/District other workers to total workers
Code No. TOTAL GEN SC ST
1 2 3 4 5 6
19 ~oiTTR:! West Bengal 48.5 55.0 37.5 24.2
01 ~ Darjiling 71.5 73.8 69.0 63.3
02 "1<."1q 1~'J4'I Jalpaiguri 59.6 70.8 40.4 72.2
03 ¥~ Koch Bihar 29.0 38.2 20.8 33.3
04 i3<'R~ Uttar Dinajpur 27.1 30.2 23.4 14.3
05 c:f&Tur~ • Dakshin Dinajpur * 27.9 38.7 25.0 7.2
06 l'ff<iGT Maldah 32.8 36.6 28.8 8.6
07 '1fll «I"lI« Murshidabad 32.9 32.6 37.8 12.9
08 ~ Birbhum 33.5 41.5 24.8 15.8
09 ~ Barddhaman 50.4 61.0 36.4 23.2
10 ~ Nadia 45.5 46.3 46.1 23.5
11 \3m~tR'RT North Twenty Four Parganas 71.9 76.8 59.5 34.3
12 ~ HU91i 55.6 66.2 36.9 14.4
13 ~ Bankura 28.1 36.4 21.5 11.2
14 ~ Puruliya 25.2 28.2 29.5 12.9
15 ~ Medinipur 32.7 37.2 27.4 11.3
16 mcm Haora 73.1 76.2 56.4 78.9
17 ~ Kolkata 96.3 96.5 93.5 98.0
18 ~~W'PIT South Twenty Four Parganas 51.7 55.6 45.7 21.8
~ - 3l.vrr.l 3l.VI.vrr. in 3T<1TCIT/GEN - Other than SC/ST population
Ixxvii

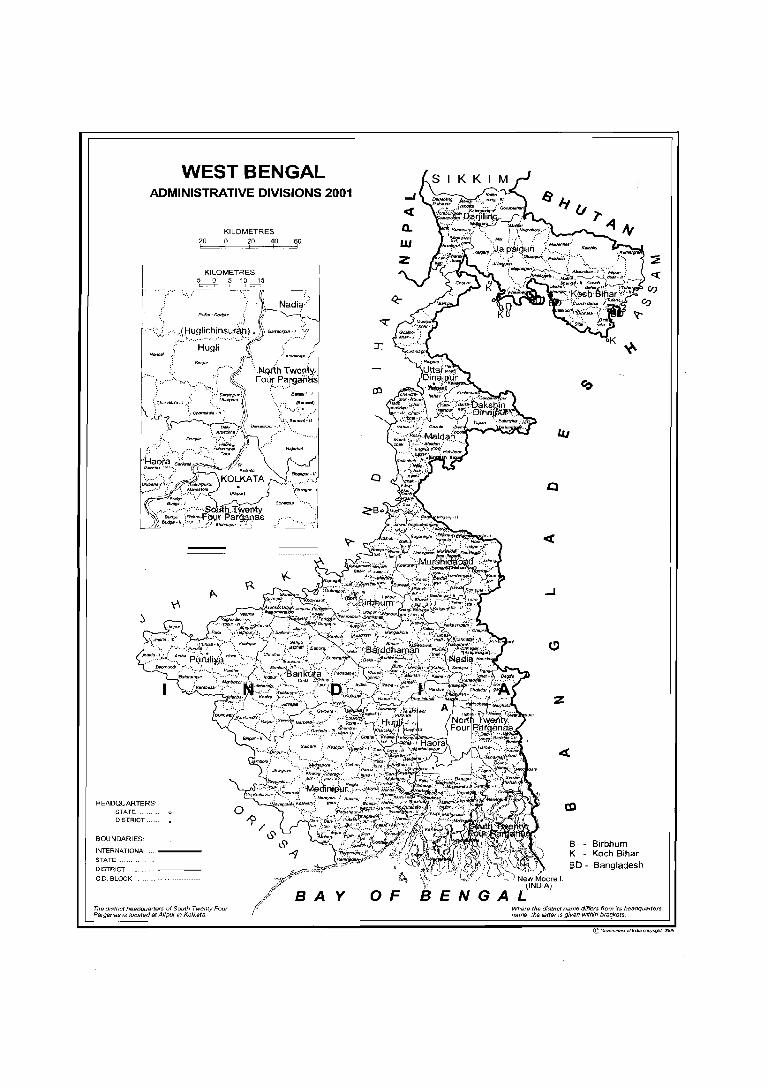
WEST BENGAL ADMINISTRATIVE DIVISIONS 2001
KILOMETRES 20 20 40 60
KILOMETRES 5~. __ ~5
, PoIrl"'DttdWr
"
,,> HugH
'-~ '-~,.:-, \: ; '",- ""~"
(Chandd:ia,',/
HEADQUARTERS' STA.TE. DISTRICT ..
BOUNDARIES:
INTERNATIONAL .. STATE
DISTRICT
C.D. BLOCK
The district headqlJarters of South Twenty Four Parganas IS located at Alipur In Kolkata
:":A~/-'
\Nqt(h Twenty.,>, Four Par~alias .. '-"'~.,;
y
:r::
o
YLJ New M~oore I. '"" (INDIA) BENGAL
B - Birbhum K - Koch Bihar BO - Bangladesh
Where the district name differs from its headquarters name, the latter IS given wIthin bra~ets.

~I'leoft CJ)-5 : ~ U1~'fi'LcOQl
TABLE A-5: TOTAL POPULATION

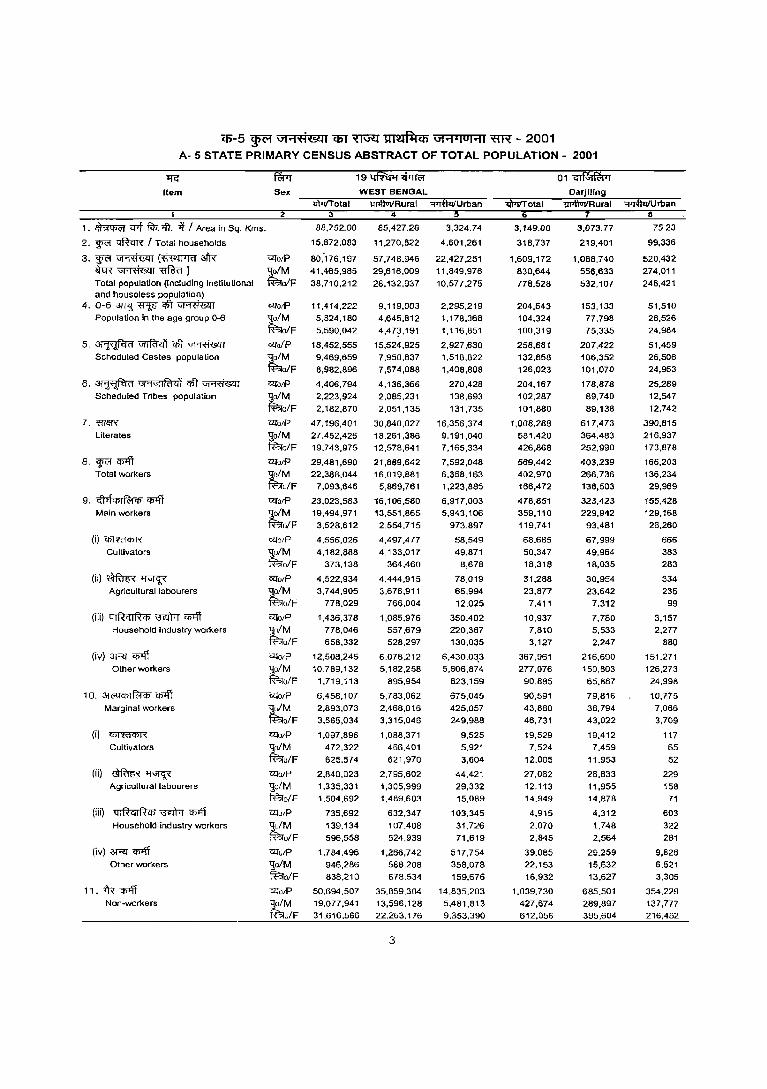
<f)-5 ~ G1 .... ti'L<lI1 <6l ~ m~ Gj ... PIOI .... 1 ~ - 2001 A- 5 STATE PRIMARY CENSUS ABSTRACT OF TOTAL POPULATION - 2001
'IfG
Item
1. ~ Cf7f f<'l>. >ft. if I Area in Sq. Kms.
2. ~ ~ I Total households
3.~~(~afR ~~~) Total population (including institutional and houseless population)
4.0-6~~qft~ Population in the age group 0-6
5.~~qft~ Scheduled Castes population
6. ~ Gf'9Gflfa41 qft ~ Scheduled Tribes population
7. 'ffi1!N
Literates
8. <§<'f 1'Il1ff Total workers
9. <fltf4>l~ifj 'f>l'ff Main workers
(i)~
Cultivators
(ii)~~ Agricultural labourers
(iii) QIRqlfh, \3EIM Cf>1if Household industry workers
(iv) ~ Cfi'ft Other workers
10. 3/01ctil~'" Cfi'ft Marginal workers
(i)~
Cultivators
(ii)~~ Agricultural labourers
(iii) QIRClIRc:n -;mT7r CIJI11 HouseholCl industry workers
(iv) ->R< <Il'ff Other workers
11. -fR 'f>l'ff Non-workers
Sex
2
Ulo/P
~o/M R=?rolF
GlTO/P
'lo/M ~o/F
Ulo/P
,-!o/M R=?rolF UlO/P
'lo/M ~o/F
<ZrO/P
,-!o/M R=?ro/F
GlTotP
,-!o/M ~u/F UlotP
,-!o/M R=?ro/F
GlTO/P
'lo/M ~o/F
C<:iolP
,-!o/M fB<o/F
UlO/P
'ln/M i'Ra/F
uto/P
1J:o/M ~o/F
C<:io/P
,-!ulM i'Ro/F
utal?
ljoiM ~u/F uto/P ,-!c/M fRo/F
UiU/P
1J:u/M i'Ru/F
C<:Iu/P
'lolM ~o/F UiatP
'l0/M fBrJF
19~~ WEST BENGAL
WVTotal 3
lH~Rural ~Urban
88.752.00
15.872.083
80:176.197
41,465,985
38,710,212
11,414.222
5,824,180
5,590,042
18,452,555
9,469,659
8,982,896
4,406,794
2,223,924
2,182,870
47,196,401
27,452,426
19,743,975
29,481,690
22.388,044
7,093,646
23,023,583
19,494,971
3,528.612
4.556.026
4,182,888 373,138
4,522,934
3,744,905
778,029
1,436.378 778,046
658,332
12.508.245
10,789.132
1,719.113
6,458,107
2,893.073
3,565,034
1,097.896
472.322
625,574
2,840,023
1,335,331
1,504,692
735,692
, 39.134
596,558
1,784,496
946,286
838.210
50,694,507
19,077,941
31,616.566
4
85,427.26
11,270,822
57,748,946
29,616,009
28,132,937
9,119,003
4,645,812
4,47~,191
15,524,925
7.950,837
7,574,088
4.136,366
2,085,231
2,051,135
30,840,027
18,261,386 12,578,641
21,889,642
16,019.881
5,869,761
16,106,580
13,551,865
2,554.715
4,497.477
4,133,017 364,460
4,444,915
3,678,911
766.004
1,085,976
557,679
528,297
6,078.212
5,182,258
895,954
5,783,062
2,468,016 3,315,046
1,088,371
466,401
621,970
2,795,602
1,305,999 1,489,603
632,347
107,408
524,939
1,266,742
588,208 678,534
35,859,304
13,596,128
22.263,176
3
3,324,74
4,601,261
22,427,251
11,849,976
10,577,275
2,295.219
1,178,368
1,116,851
2,927,630
1.518,822
1,408,808
270,428
138,693
131,735
16,356,374
9,191,040
7,165,334
7,592,048
6.368.163
1,223,885
6,917,003
5,943,106
973,897
58,549
49,871
8,678
78,019
65.994
12,025
350.402 220,367 130,035
6,430,03,3 5,606,874
823,159
675,045
425,057
249,988
9,525
5,921
3,604
44,421
29,332 15,089
103,345
31.726
71,619
517,754 358,078
159.676
14.835,203
5,481,813
9.353,390
lI)TiIi' otal 6
3,149.00
318,737
1,609,172
830,644
778,528
204,643
104,324
100,319
258,881
132,858
126,023
204,167
102,287
101,880
1,008.288
581,420 426,868
569,442
402.970
166,472
478,851
359,110
119,741
68.665
50,347 18,318
31,288
23,877
7,411
10,937
7,810
3,127
367,961
277,076
90,885
90,591
43,860
46,731
19,529
7,524
12,005
27,062
12,113
14.949
4,915
2.070
2,845
39,085 22,153
16.932
1.039.730
427,674
612,056
01~ Oarjrllng
m4lu1IRural
3,073.77
219,401
1,088,740
556,633
532,107
153,133
77,798
75,335
207,422 106,352
101,070
178,878
89,740
89,138
617,473
364,483
252,990
403,239
266,736
136,503
323,423 229,942
93.481
67.999
49,964
18,035
30,954
23,642
7,312
7.780 5,533
2,247
216,690
150,803
65.887
79,816
36,794
43,022
19,412
7,459
11,953
26,833
11,955 14,878
4,312
1.748
2,564
29.259 15,632
13.627
685.501
289,897
395,604
~rban 8
7523
99,336
520,432
274,011
246,421
51,510
26,526
24,984
51,459
26,506 24,953
25,289
12,547
12,742
390,B15
216,937 173,878
166,203
136.234 29,969
155.428 129,168
26,260
666
383
283
334
235
99
3.157
2,277
880
151,271
126.273
24,998
10,775
7,066
3,709
117
65
52
229
158 71
603
322
281
9,826 6,521
3.305
354.229
137,777
216,452

q)-5 w<'l GtOi~MI C6T ~ ~ \1101'101011 'Nff - 2001 A- 5 STATE PRIMARY CENSUS ABSTRACT OF TOTAL POPULATION - 2001
'11<:
Item
1. ~ i1"'i fclpfr. 1'i I Area i~ Sq. Kms.
2. ~ ~ I Total households
3.~~(~3fR ~~~) Total population (includin9 institutional and houseless population)
4.0-6~~<tt~ Population in the age group 0-6
5.~~<tt~ Scheduled Castes population
6. ~ Vl'1Vllfdq) <tt ~ Scheduled Tribes population
7. «r& Literates
8. ~ q;>ff Total workers
9. c:fltfcpl~q; q;>ff Main workers
(i)~
Cultivators
(ii)~~ Agricultural labourers
(iii) QIRrllRCb ~ ~ Household industry workers
(iv) aRT 'Cfl1ff Other workers
10. 31<'QC/lI~Cp q;>ff Marginal workers
(i) CI>ffifCbR
Cultivators
(ii)~~ Agricultural labourers
(iii) qlRqlR4J ~ 'Cfl1ff Household industry workers
(iv)~'Cfl1ff Other workers
11. -tR ~ Non-workers
Sex
CZl'O/P
~o/M fF.irolF
CZl'o/P
ljo/M ~oIF
CZl'oIP
~o/M ~oIF CZl'olP ljo/M ~o/F
CZl'OIP
~oIM ~oIF
Gllo/P ljo/M ~o/F
CZl'o/P ljolM fBrolF
Gllo/P ljo/M ~o/F
CZl'otP ljo/M ~oIF
Gllo/P ~oIM ~o/F
'afo/P ljolM l'Bro/F
'afo/P 'lo/M fi?Jo/F
CZl'olP ljo/M l'Bro/F
C2TO/P
t~F 'ilQ"o/P ~o/M l'Bro/F
«lO/P
'lo/M N?oIF «lotP
'9;oIM l'Bro/F
1i'ItTIT ota I 3
6,227.00
688,139
3,401,173 1,751,145 1,650,028
521,287 264,706 256,581
1,248,577 642,828 605,749
641,688 324,250
317,438
1,610,083 1,082,575
727,508
1,303,136 915,400 387,736
1,025,433 616,528 208,905
209,830 185.349
24.461
134,360 102,902
31,458
18,864 13,027
5,837
662.379 515,250 147,129
277,703 98,872
178,831
60,114 17.627 42,487
95,803 27,504 68,299
7,975
1,782 6,193
113.811 51,959 61.852
2,098,037 835,745
1.262.292
02 ,,1<1 q 1~'.l4'l Jalpalgurl maIiIiIRural ~Urban
6,105.93
560,931
2,794,291 1,437,156 1.357,135
450,236 228,639 221,597
1,124,404 578,943 545,461
625,585 315,895
309,690
1,381,307 844,837 536,470
1,106,289 750.766
355,523
843,676 660,430
183,246
207,004 182.816
24,188
131,882 100,932
30,950
14,731 10.081 4,650
490,059 366.601 123,458
262,613
90,336 172,277
59,786 17,490 42.296
94,711
27.195 67,516
6,659 1,454 5,205
101,457 44,197 57,260
1,688,002 686,390
1,001,612
4
121.07
127,208
606,882 313,989
292.893
71,051
36.067 34,984
124,173 63,B85
60,288
16,103
8,355 7,748
428,776 237,738 191.038
196,847 164,634
32,213
181,757 156,098
25,659
2,826 2,533
293
2,478 1,970
508
4,133 2,946
1,187
172,320 148,649
23,671
15.090 8,536 6,554
328 137 191
1,092
309 783
1,316 328 988
12,354
7,762 4.592
410,035 149,355 260.680
m.tITotal
3,387.00
517,878
2,479,155 1,272,094 1,207,061
387,130 197,118
190,012
1,242,374 636,446 605,928
14,246 7,425
6.821
1.386,965 816,196 570,769
966,705 698,550
268,155
754,311 639,791 114,520
290,598
259.953 30,645
186,400 146,740 41,660
29,171 16,245
12,926
246,142 216,653
29,289
212.394 56,759
153,635
71.242 17,386 53,856
97,026 23,464
73,562
10,084 1,648 8,436
34,042 16,261 17,781
1,512,450
573,544 938,906
03 ~ r.iffi Koch Bihar maIiIiIRural ~rban
3,345.66
470,336
2,253,537 1,157,241 1,096,296
364,103 185,436
178,667
1,197,449
613,853 583,596
13,136 6,855 6,281
1,214,404 722,947 491,457
893,311 638.059 255,252
665,745 582,198
103,547
289,854 259,277
30.577
187,522 145,990
41,532
26,534
14.746 11,788
181,835 162,185
19,650
207,566 55,861
151,705
71,206 17,360 53,846
96,709 23.243 73,466
9,493 1,509 7,984
30,158 13,749
16,409
1,360,226
519.182 841.044
41.34
47,542
225,618 114,853 110,765
23,027 11,682
11,345
44,925 22,593 22,332
1,110 570
540
172,561 93,249 79,312
73,394 60,491
12,903
68,566 57,593 10,973
744
676 68
878 750 128
2,637 1,499
1,138
64.307 54,668
9,639
4,828
2.898 1,930
36
26 10
317 221
96
591 139 452
3,884 2,512 1,372
152,224 54,362 97,662
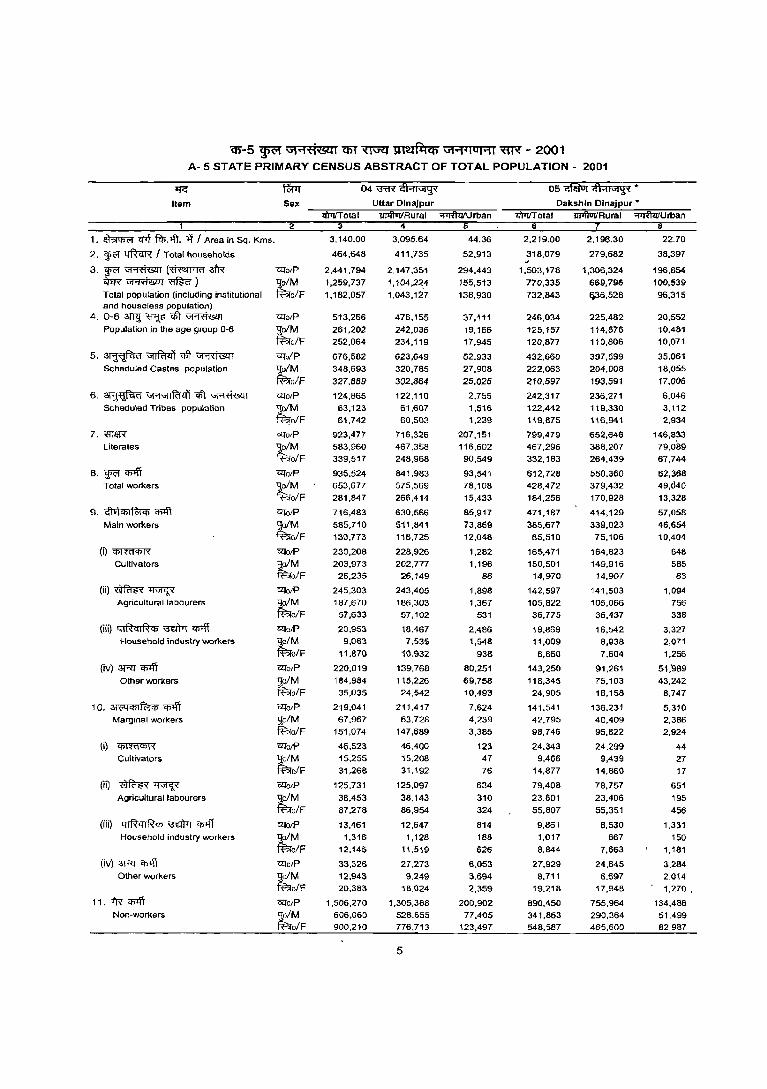
'Q}-5 ~ Gi"1'f1'Lc-lOli tIlT ~ ~ Gi"1",u!'11 "ffi'{ - 2001 A- 5 STATE PRIMARY CENSUS ABSTRACT OF TOTAL POPULATION - 2001
"IfG
Item Sex
04~~ Uttar Dlnajpur
05~~* Dakshln Olnajpur •
'liPTrTotal 1IJlllvVRurai ~Urban liWTOlal iiiiftUiIRural ~Urban
1. ~ Cf1t f$.lfi. if I Area in Sq. Kms.
2. ~ ~ I Total households
3.~~(~3fR 11m<~~) Total popUlation (inCluding institutional and houseless population)
4. 0-6 3lnj ~ cCr ~ Population in the age group 0-6
5. ~ vrrfum mt ~ Scheduled Castes population
6. ~ \ij'1\ijIRl4~ <t\ ~ Scheduled Tribes population
7. 'ffi~ Literates
8. ~ cpl\T T ota I workers
9. 41>lCl>I~'" q;l\1 Main workers
(i)cmm Cultivators
(ii)~~ Agricultural labourers
(iii) GIRqIRCI> ~ ~ Household industry workers
(iv) 3Rr~ Other WOrKers
10. 3l<"1cmfcl", q;-;ff Margmal workers
(i)~
Cultivators
(ii)~~ Agricultural labourers
(iii) GIRqIRCI> ~ 'I>'ff Household industry workers
(iv) 3Pl <n41 Other workers
11. fR C!>'fl Non-workers
2
Wa/P
,!!"/M tBro/F
Wa/P
,!!oIM fBfo/F
«l'o/P ~o/M ~o/F Wa/P
1JoIM fB.\o/F «l'O/P
~o/M fBfo/F
«l'o/P
,:!o/M tBa/F
UlO/P
lJoIM tBofF
UlO/P
~oIM fRo/F
UlO/P
'.l.oIM fRo/F
O1:l'orP ~o/M "!BrafF
C4'O/P
:!o/M "!Bro/F
ClfO/P
,:!o/M f'Bro/F
O1:l'o/p
'Jo/M f'BrolF
ClfO/P
'go/M f'Bro/F
Clfo/P
'9;oIM fF.;rofF
<UO/P
'9;o/M ~ofF
ClfO/P
~o/M f'BrofF
3
3.140.00
464.648
2,441.794
1,259,737
1.182.057
513.266 261,202
252,064
676,582 348,693
327.889
124.865 63,123 61.742
923,477
583.960 339,517
935.524 653,677 281,847
716,483
585.710 130,773
230,208 203,973 26,235
245.303 187.670 57,633
20,953 9.083
11.870
220.019 184,984 35.035
219,041 67.967
151,074
46,523 15.255 31,268
125.731
38.453 87,278
13.461 1.316
12.145
33.326 12,943 20,383
1,506.270 606,060 900.210
4
3.095.64
411,735
2.147.351
1,104,2~4
1.043.127
476.155
242.036 234,119
623,649 320,785
302.864
122.110
61.607 60.503
716,326
467.358 248.968
841,983 575.569 266,414
630.566
511.841 118,725
228,926
202.777 26.149
243,405 186.303 57,102
18,467
7.535
10.932
139.768 115,226
24,542
211,417 63.728
147,689
46,400
15.208 31.192
125,097
38.143
86,954
12,647 1,128
11.519
27.273
9.249 1B.024
1,305,368
528.655 776.713
5
44.36
52.913
294,443
155,513
138.930
37,111
19,166 17.945
52,933 27,908
25.025
2.755 1,516 1,239
207,151
116.602 90,549
93.541 78,108
15.433
85.917 73,869
12.048
1,282 1.196
86
1.898 1.367
531
2,486 1,548
938
80.251
69,758 10,493
7,624 4.239 3,385
123 47
76
634
310
324
814 188
626
6.053 3.694 2.359
200,902 77,405
123,497
e 2.219.00
318,079
1,503,178
770,335
732.843
246.034
125,157 120,877
432,660
222.063
210.597
242.317 12.2.,442 119.875
799,479
467.296 332,183
612,728 428.472 184,256
471,187
385,677
85.510
165,471 150.501
14,970
142.597 105.822 36,775
19.869 11,009
8.860
143,250
118,345 24.905
141.541 42.795 98,746
24.343 9.466
14,877
79,408
23.601
55.807
9.861 1.017
8.844
27.929
8.711 19.218
890,450 341.863 548,587
2.196.30
279,682
1,306,324
669,796
q36.528
225.482
114,676 110,806
397,599
204.008
193.591
236.271 119,330 116,941
652,646 388.207 264,439
550,360 379,432 170,928
414,129
339,023 75,106
164,823
149.916 14.907
141.503
105.066 36.437
16.542 8,938
7.604
91,261
75.103 16.158
136.231 40.409 95,822
24.299 9,439
14.860
78,757
23.406 55,351
8.530 867
7,663
24.645
6.697 17,948
755.964 290,364 465,600
8
22.70
38,397
196,854
100,539
96.315
20.552 10,481 10,071
35,061 18,055
17.006
6,046
3,112 2,934
146,8~3
79.089 67.744
62,368 49,040 13,328
57,058
46.654 10,404
648 585
63
1.094 756 338
3.327 2,071
1.256
51,'989
43.242 8,747
5,310 2,386
2.924
44
27 17
651
195
456
1.331 150
1.181
3.284 2.014
1.270 .
134,486 51.499 82.987
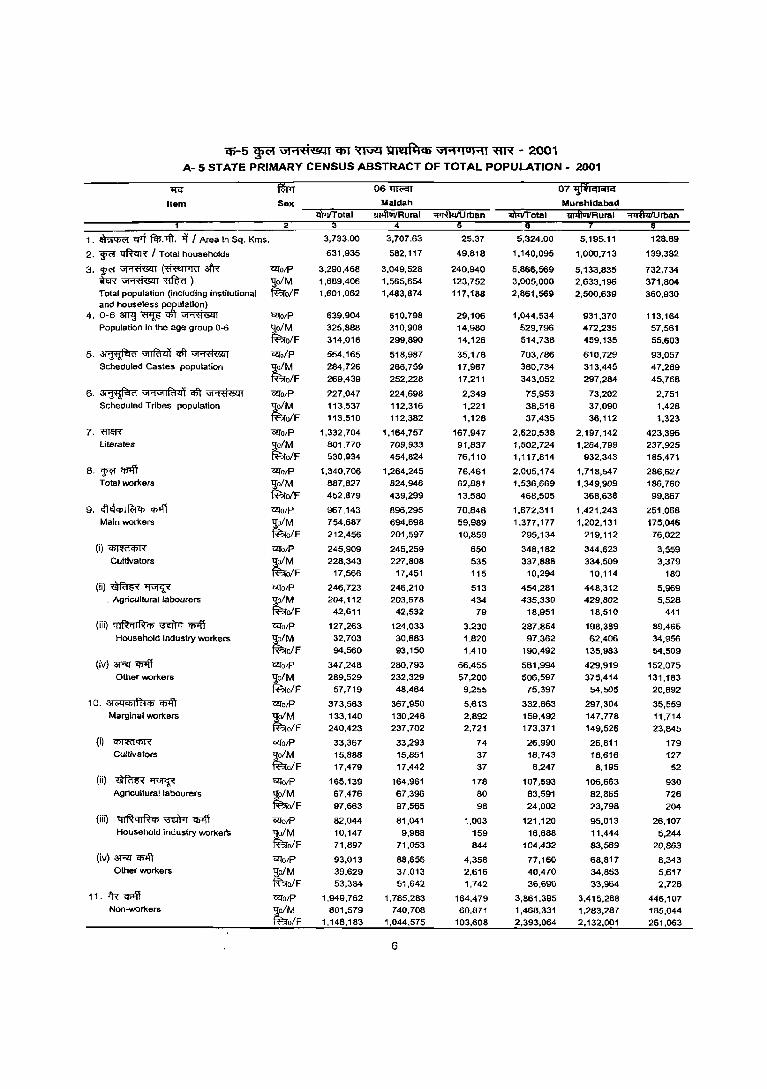
'iI)-5 ~ \i1"1'<"i&l1 i6T ~ gll!t~Cb Gt""'IUI"1I ~ - 2001 A- 5 STATE PRIMARY CENSUS ABSTRACT OF TOTAL POPULATION - 2001
111':'
Item
1. ~ eM ~.-;ft. >¥ I Area in Sq. Kms.
2. ~ ~ I Total households
3.~~(~3I'R m~~) Total population (including institutional and houseless population)
4. 0-6 3l"Pj ~ qft ~ Population in the age group 0-6
5.~~<!ft~ Scheduled Castes population
6. ~ GH\ilIRt,.li qft ~ Scheduled Tribes population
7. "ffiffl Literates
8, ~ q;1ff Total workers
9. ,!hi<t> I ~ '" Cf>lff Main workers
(i)~
Cultivators
(ii)~~ , Agricultural labourers
(iii) ql~QlRil> ~ q;1ff Household industry workers
(iv) 3Rf~ Other workers
10. 31<"l<t>Ifc:iil> C!Jlfi Marginal workers
(i)~ Cultivators
(ii)~~ Agricultural labourers
(iii) ql~ql~<t> ~ q,.ff Household industry worker's
(iv) 3Rf~ Other workers
11. -fR" cv4T Non-workers
Sex
2
CZ[olP
,:!o/M fa"o/F
CZ[O/P
~o/M fa"o/F
Clfo/p
~Q/M fa"o/F
CZ[O/P
l_!o/M fa"oIF CZ[o/p
l_!o/M fa"oIF CZ[olP
l_!o/M ff?!oIF ClIo/p
l_!o/M ff?!o/F
CZ[O/P
~o/M ff?!oIF CZ[O/P
~o/M ff?!oIF CZ[O/P
l_!o/M ff?!o/F ClfO/P
l_!o/M ~olF
C2l'o/p ~oIM ff?!o/F
C2l'o/p ~o/M ~oIF
C2l'o/P l_!o/M ff?!o/F ClIo/P
l_!o/M moiF C2l'o/P
~oIM ~oJF
CZ[o/p
:J;oIM mo/F
3,733.00
631,935
3,290,468 1,689,406 1,601,062
639,904 325.888 314,016
554,165 284,726 269,439
227,047 113,537 113,510
1.332,704 BDl,7?O
530,934
1.340,706 887,827 452,879
967,143 754,687 212,456
245,909 228.343
17,566
246,723 204.112
42,611
127,263 32.703 94.560
347,248 289.529
57,719
373.563 133.140 240,423
33,367 15,888 17,479
165,139 67.476 97,663
82,044 10,147 71.897
93,013 39,629 53,384
1,949.762 801,579
1,148,183
06~
Maldah
3,707.63
582,117
3,049,528 1.565,654 1,483,874
610.798 310.908 299.890
518.987 266.759 252.228
224.698 112.316 112,382
1.164.757 709,933 454.824
1.264.245 824.946 439,299
896.295 694.698 201.597
245.259 227.808
17.451
248.210 203.678
42.532
124.033 30.883 93.150
280.793 232.329
48.464
367.950 130,248 237.702
33.293 15.851 17,442
164,961 67,396
97.565
81.041 9.988
71.053
88,655 37,013 51,642
1.785,283 740,708
1.044,575
6
25.37
49,818
240.940 123.752 117.188
29.106 14,980 14.126
35.178 17,967 17.211
2,349 1.221 1,128
167.947 91.837 76,110
76,461 62,881
13.580
70.848 59.989 10,859
650 535 115
513 434
79
3.230 1.820 1,410
66.455 57.200
9.255
5,613 2,892 2.721
74 37 37
178 80 98
1.003 159 844
4,358 2.616 1,742
164.479 60,871
103.608
5,324.00
1.140.095
5.866.569 3.005,000 2,861.569
1.044.534 529,796
514.738
703.786 360.734 343.052
75.953 38.518 37,435
2.620.538 1.502.724 1.117.814
2.005.174 1,536.669
468.505
1.672.311 1,377.177
295,134
348,182 337,888
10,294
454.281 435,330
18.951
287,854 97.362
190,492
581,994 506,597
75,397
332,863 159,492 173,371
26,990 18.743 8,247
107,593 83,591 24,002
121,120 16,688
104,432
77,160 40,470 36,690
3.861,395 1.468,331 2,393.064
07 ijIll<UC4ICl
Murshldabad 1iiiftViiRural :;:rirtfuiUrban
e 5,195.11
1.000.713
5,133.835 2,633.196 2.500,639
931.370 472.235 459.135
610.729 313,445 297,284
73.202 37,090 36.112
2.197,142 1,264,799
932.343
1.718,547 1,349,909
368,638
1,421,243
1.202.131 219,112
344.623 334,509 10.114
448,312 429,802
18,510
198,389 62.406
135,983
429,919 375,414
54,505
297.304 147.778 149.526
26.811 18,616
8.195
106.663 82.865 23.798
95.013 11,444 83.569
68.817 34,853 33,964
3.415.288 1.283.287 2.132.001
128.89
139.382
732,734 371,804 360.930
113.164 57.561
55.603
93.057 47.289 45.768
2.751 1.428 1.323
423.396 237.925 185.471
286.627 186,760
99.867
251.068 175,046
76,022
3.559 3.379
180
5,969 5.528
441
89,465 34,956
54.509
152,075 131.183 20.892
35.559 11,714 23.845
179 127 52
930 726 204
26.107 5.244
20.863
8.343 5.617 2.726
446.107 185.044 261.063
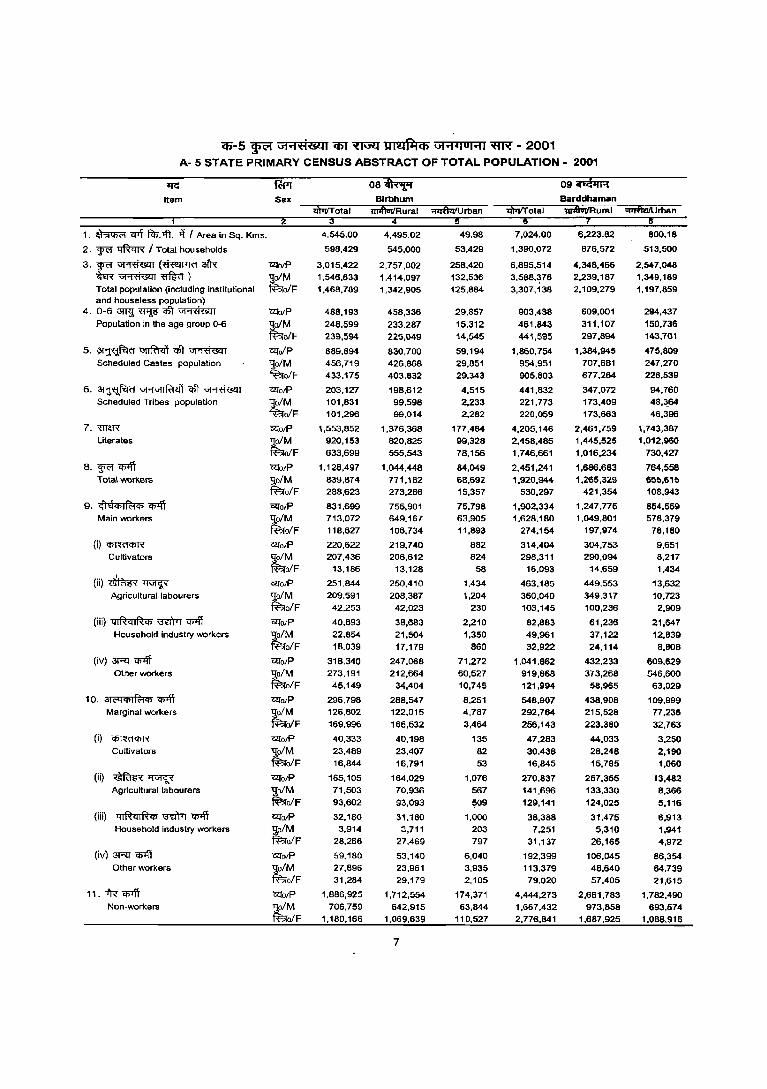
iP-5 ~ \i1 .... 'fiiLclll 'ifiT ~ UIfl!tfl:lCf) \i1 .... ~lo ..... 1 ~ - 2001 A- 5 STATE PRIMARY CENSUS ABSTRACT OF TOTAL POPULATION - 2001
~
Item
1. ~ CflT F<I>. -.ft. if I Area in Sq. Kms.
2. ~ I:lftcl"R I Total households
3. Fl ~ (~ 3l)'{ ~~~l Total population (including institutional and houseless population)
4. 0-6 ~~cBT~ Population in the age group 0-6
5.~~cBT~ Scheduled Castes population
6. ~ VI'1V1IRtdi cBT ~ Scheduled Tribes population
7. wm Literates
8. W<'! Cf>lff Total worl<.ers
9. cfl tiq;I~q; Cf>lff Main workers
(il <!fml<PR Cultivators
(ii)~~ Agricultural labourers
(iii) (jlf{qlf{q; ~ "<P1ff Household industry workers
(iV) ~"<P1ff Other worl<.ers
10. <>l<"1q;If<:iq; <!M1 Marginal workers
(i)~
Cultivators
(ii)~~ Agricultural labourers
(iii) q[f{qIRq; ~ Cf>lff Household industry workers
(iv) ~ "<P1ff Other workers
11. iR <!M1 Non-workers
<2l"a/P
1,!oIM ~o/F
Cl:IOIP 1,!oIM ~oIF
CZl"o/P ~oJM ~o/F
molP ~o/M ~o/F
CZl"o/P
~oIM ~o/F
Cl:IolP ,:;o/M ~o/F
CZl"o/P
~oIM fi';fo/F
ClIo/P
~o/M fi';folF
mo/P 'lo/M fi';fo/F
C2J"o/P
'lo/M ~o/F
C2J"o/P lj;o/M fi';fo/F
mo/P "9;oIM fi';folF
c;qO/P
1,!o/M fi';folF
C2J"o/P lj;o/M ~o/F
C2j"olP lj;o/M ~oIF
C<l"o/P
~o/M ~o/F
"12tolP ~o/M ~o/F
4.545.00
598,429
3,015,422 1,546,633 1,468,789
488,193 248.599 239,594
889,894 456,719 433,175
203,127 101,831 101,296
1,553,852 920,153 633,699
1,128,497 839,B14 288,623
831,699 713,012 118,627
220,622 207,436
13,186
251.844 209,591
42,253
40,893 22,854 18,039
318,340 273,191 45,149
296,798 126,802 169,996
40,333 23,489 16,844
165,105 71,503 93,602
32,180 3,914
28,266
59.180 27,896 31,284
1,886,925 706,759
1,180,166
08~
4,495.02
545,000
2,757,002 1,414,097 1,342,905
458,336 233.287 225,049
830,700 426,868 403,832
198,612 99,598 99,014
1,376,368 820,825 555,543
1,044,448 771,182 273,266
755,901 649,167 106,734
219,740 206,612
13,128
250,410 208,387
42,023
38,683 21,504 17,179
247,068 212,664
34,404
288,547 122,015
166,532
40,198 23,407 16,791
164,029 70,936
93,093
31,180 3,711
27,469
53,140 23,961 29,179
1,712,554 642,915
1,069,639
7
49.98
53,429
258,420 132,536 125,884
29,857 15,312 14,545
59,194 29,851 29,343
4,515 2,233 2,282
177,484 99,328 78,156
84,049 6B,692 15,357
75,798 63,905 11,893
882 824
58
1,434 1,204
230
2,210 1,350
860
71,272 60,527 10,745
8,251 4,787 3,464
135 82 53
1,076 567
~09
1,000 203 797
6,040
3,935 2,105
174,371 63,844
110,527
7,024.00
1,390,072
6,895,514 3,588,~76
3,307,138
903,438 461,843 441,595
1,860,754 954,951 905,803
441,832 221,773 220,059
4,205,146 2,458,485 1,746.661
2,451,241 1,920,944
530,297
1.902,334 1.628,180
274.154
314,404 298,311
16,093
463,185
360,040 103,145
82,883 49,961 32,922
1,041.862 919,868 121,994
548,907 292,764 256,143
47,283 30,438 16,845
270,837 141,696 129,141
38,388 7,251
31,137
192,399 113,379 79,020
4,444,273 1,667,432 2,776,841
09 iii!iJR Barddhaman 1ii1ftiIiIRurai ~rban
6,223.82
876,572
4,348,466 2,239,187 2,109,279
609,001
311.107 297,894
1.384.945 707,681 677.264
347,072
173.409 173.663
2,461,759 1,445,525 1,016,234
1,686,683 1.265,329
421,354
1,247,775 1.049,801
197,974
304,753 290,094
14,659
449,553 349,317 100,236
61,236 37,122 24,114
432,233 373,268 58,965
438,908 215,528 223,380
44,033 28,248 15,785
257,355 133.330 124,025
31,475 5,310
26,165
106,045 48,640 57,405
2,661,783 973,858
1,687,925
800.18
513,500
2,547,048 1,349,189 1,197,859
294,437
150,736 143,701
475,809 247,270 228,539
94,760
48,~64
46,396
1,743,387 1,012,960
730.427
764,558 655,615 108,943
654,559 578,379 76,180
9,651 8,217 1,434
13,632 10,723
2,909
21,647 12,839
8,B08
609.629 546,600
63,029
109,999 77,236 32,763
3,250 2,190 1,060
13,482 8,366
5,116
6,913 1,941 4,972
86,354 64,739 21,615
1,782,490 693,574
1,088,916
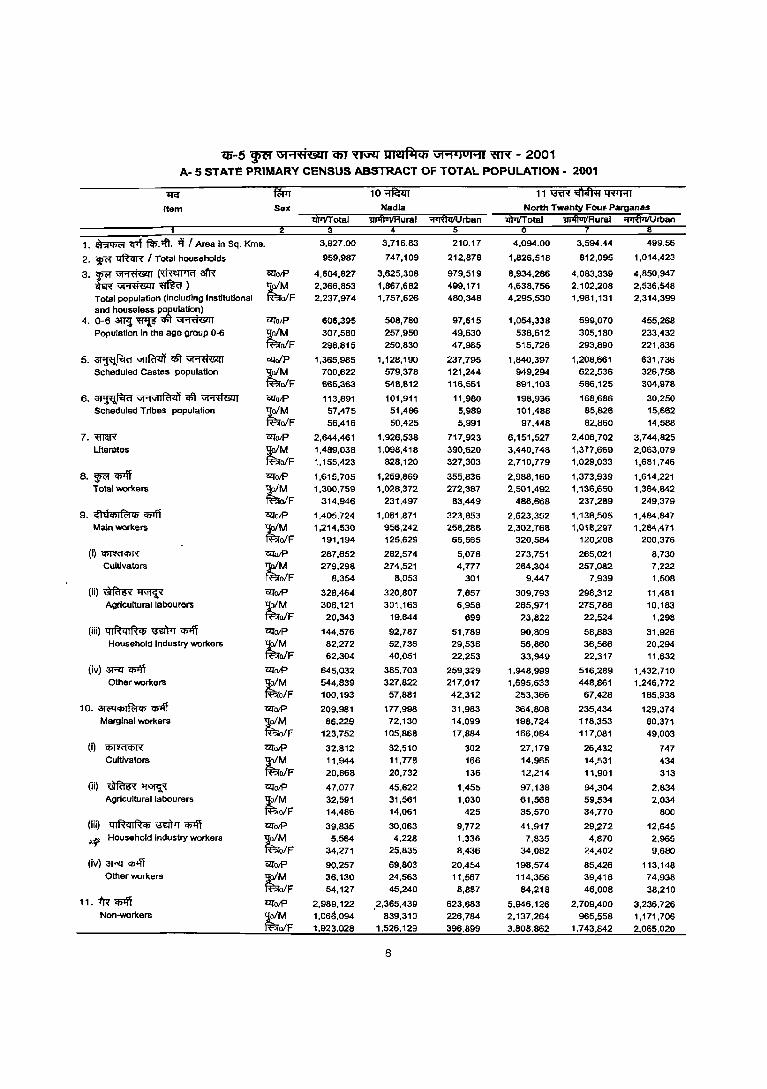
iP-5 ~ \i1"''Ifi&u i6T ~ llTll!lilI(fJ Ul ..... jOj .... 1 ~ - 2001 A- 5 STATE PRIMARY CENSUS ABSTRACT OF TOTAL POPULATION - 2001
'IJ'a' fWr 10 :;:mfui 11 ~ 'iift'iffii 'Q"!'l'RT
'tem Sex Nadia North Twenty Four-Parganas
ihliiTotal 'DJiIlUiIRural ~rban lIW'Total 'DJiIlUiIRural ~rban
1. ~ 'lf1f fIp.1fi. ~ I Area In Sq. Kms. 3,927.00 3,716.83 210.17 4,094.00 3,594.44 499.56
2. P ~ I Total households 959,987 747,109 212,878 1,826,518 812,095 1,014,423
3.p~(~afR 'I2l"olP 4,604,827 3,625,308 979,519 8,934,286 4,083,339 4,650,947
teR~~} tM 2,366,853 1,867,682 499,171 4,638,756 2,102,208 2,536,548 Total population (including Institutional ofF 2.237,974 1,757.626 480,348 4.295,530 1,981,131 2,314,399 and houseless population) 4.0-6~~~~ 'I2l"olP 606,395 508,780 97,615 1,054,338 599,070 455,268
Population in the age group 0-6 tM 307,580 257,950 49,630 538,612 305.180 233,432
ofF 298,815 250,830 47,985 515,726 293,890 221,836
5.~~~~ 'I2l"a/p 1,365,985 1,128,190 237.795 1,840,397 1,208,661 631,736 Scheduled Castes population tM 700,622 579,378 121,244 949,294 622,536 326,758
ofF 665,363 548,812 116,551 891.103 586,125 304,978
6. ~ VI"1V1IRl<ll ~ ~ 'I2l"olP 113,891 101,911 11,980 198,936 168.686 30.250 Scheduled Tribes population tM 57,475 51,486 5,989 101,488 85,826 15,662
ofF 56,416 50.425 5,991 97,448 82,860 14,588
7.~ 'I2l"olP 2,644.461 1,926,538 717,923 6,151,527 2,406,702 3,744,825 Literates tM 1,469,036 1,098,416 390,620 3,440.748 1,377,669 2,063,079
ofF 1,155,423 828,120 327,303 2,710,779 1,029,033 1,661,746
8,~~ 'i2l'olP 1,615,705 1,259,669 355,836 2,968,160 1,373,939 1,614,221 Total workers tM 1,300,759 1,028,372 272,387 2,501,492 1,136,650 1,364,842
ofF 314.946 231,497 83.449 486,668 237,289 249.379
9. <fl U<tll R:t <Ii "Cb1fi 'i2l'olP 1.405.724 1.081,871 323,653 2,623,352 1.138.505 1,484.847 Main workers
~~F 1,214,530 956,242 258,288 2,302,768 1,018,297 1,284,471 191,194 125,629 65,565 320,584 120,208 200,376
(Q~ C2JoIP 287,652 262,574 5,076 273,751 265,021 8,730 Cultivators
t~F 279,298 274,521 4,777 264,304 257,082 7,222 B,354 B.053 301 9,447 7.939 1,508
(ii)~~ 'I2l"oIP 32B,464 320,807 7,657 309,793 298,312 11,481 Agricultural labourers tM 308,121 301,163 6.958 285,971 275,788 10,183
ofF 20,343 19,644 699 23,822 22,524 1,298
(iii) ql~ql~tp ~ ~ 'I2l"o/P 144,576 92,787 51,789 90,809 58,883 31,926 Household industry workers tM 82,272 52,736 29,536 56,860 36,566 20,294
ofF 62,304 40,051 22,253 33,949 22,317 11.632
(iv) 3R"~ molP 645,032 385,703 259,329 1,948,999 516,289 1,432,710 Other workers tM 544,839 327,822 217,017 1.695,633 448,861 1.246,772
ofF 100,193 57,881 42.312 253,366 67,428 185,938
10. 31('Q<liI~tp CI>'ff O!folP 209,981 177,998 31,983 364,808 235,434 129,374 Marginal workers tM 86,229 72,130 14,099 198,724 118,353 80,371
ofF 123,752 105.868 17,884 166,084 117,081 49,003
(0 ~ C2folP 32,812 32,510 302 27,179 26,432 747 Cultivators
t~F 11,944 11,77B 166 14,965 14.531 434 20,868 20,732 136 12,214 11,901 313
(ii) ~~ molP 47,077 45,622 1,455 97,138 94,304 2.834 Agricultural labourers t,1M 32,591 31,561 1,030 61,568 59,534 2,034
ofF 14,486 14,061 425 35,570 34,770 800
(iii) 41~ql~<Ii ~lJ "Cb"Iff O!folP 39,835 30,063 9,772 41,917 29,272 12,645
*' Household industry workers tM 5,564 4,228 1.336 7,835 4,870 2.965
ofF 34,271 25,835 8,436 34,062 24,402 9,680
(iv) 3Rf"Cb"lff 'I2l"olP 90,257 69,803 20,454 198,574 85,426 113,148 Other workers
t~F 36,130 24,563 11,567 114,356 39,418 74,938 64,127 45,240 8,887 84,218 46,008 38,210
11.1R ~ 'I2l"olP 2,989,122 .2,365,439 623,683 5.946,126 2,709,400 3,236,726 Non-workers tM 1,066,094 839,310 226,784 2,137.264 965,558 1,171,706
ofF 1,923.028 1,526.129 398,899 3,808,862 1,743.842 2.065,020
8
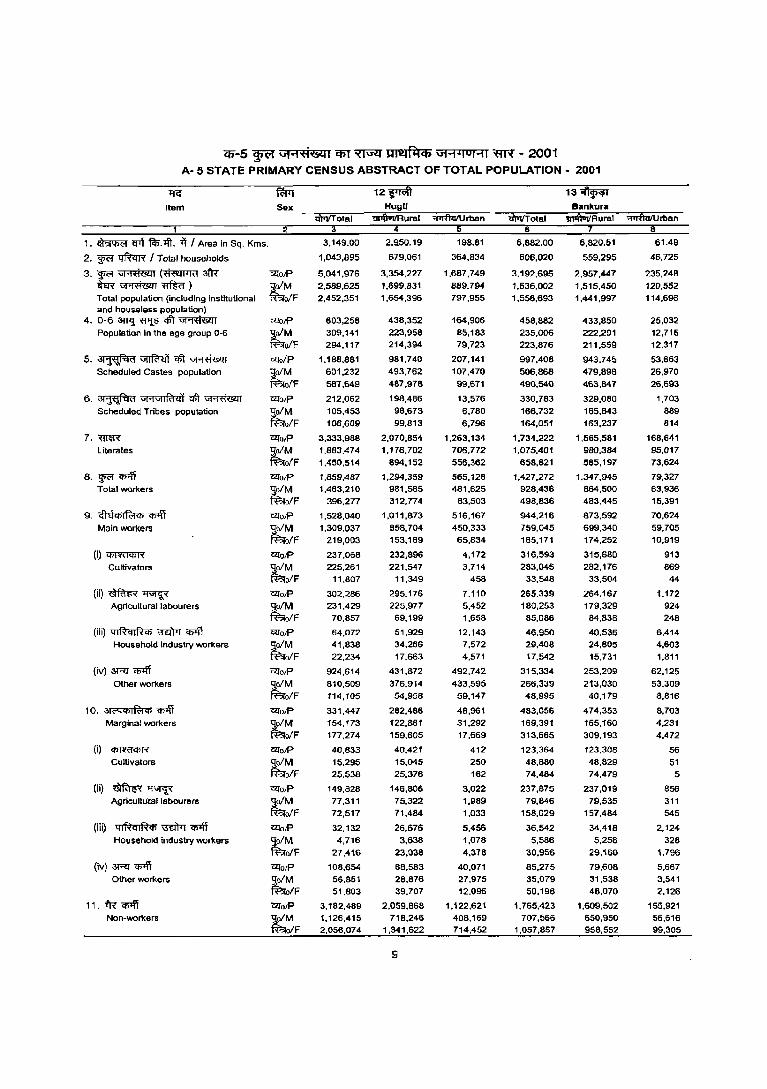
$-5 ~ Gf"1'ti'!§!l1 em ~ ~ Gf"1"IOHI ~ - 2001 A- 5 STATE PRIMARY CENSUS ABSTRACT OF TOTAL POPULATION - 2001
Item
1. ~ t(l'j fcI>.1fi. -i'i / Area in Sq. Kms.
2. ~ ~ / Total households
3. W<" ~ (~3fR ~~~) Total population (including institutional and houseless population)
4. 0-6 3m.{ ~ ql') ~ Population in the age group 0-6
5.~~~~ Scheduled Castes population
6. ~ "1'1VfIR't<l1 ql') ~ Scheduled Tribes population
7.~
literates
8.~~ Tolal workers
9. G~IQcJilf<;jCj) ~
Main workers
(i)~ Cultivators
(ii)~~ Agricultural labourers
(iii) q I fh lR Cj) \'lEITrr <i7>\1 Household industry workers
(iv) 3R1 <Il'ff Other workers
10. ~<'G<bl~q; ~ Marginal workers
(i)~
Cultivators
(ii)~~ Agricultural labourers
(iii) qlRqlR<b \'lEITrr "<blff Household industry workers
(iv)~"q)1j'f Other worl<ers
11. fR Cf>Iff Non-workers
ClIolP
:J;oIM ~oIF
ClIO/P
~oIM ~oIF
ClIoIP
:J;o/M ~o/F llIo/P
So/M ~o/F
CllolP
SoiM ~o/F llIolP So/M ~oIF
CllO/P 'S{o/M ~o/F
CllolP ~o/M fao/F CllO/P
"go/M ~o/F llIo/P
SoiM fBo/F
llIo/P "go/M ff?ro/F
llIolP go/M ff?rolF
llIolP
"So/M faolF
CllO/P
goiM faolF
CllOlP ljo/M fBl"oIF CllO/P ljolM ~o/F
ClIO/P
'loiM faolF
3.149.00
1,043,895
5,041,976 2,589,625 2,452,351
603,258 309,141 294,117
1,188,881 601,232 581,649
212,062 105,453 106,609
3,333,988 1,883.474 1,450,514
1,859,487 1,463,210
396,277
1,528,040 1,309,031
219,003
237,068 225,261
11,807
302,286 231,429
70,857
64,072 41,838 22,234
924,614 810,509 114,105
331,447 154,173 177,274
40,833 15,295 25,538
149,828 77,311 72,517
32,132 4,716
27,416
108,654 56,851 51.803
3,182,489 1,126,415 2,056,074
12 WJift
2,~50.19
679,061
3,354,227 1,699,831 1,654,396
438,352 223,958 214,394
981,740 493,762 487,978
198,486 98,673 99,813
2,070,854 1,176,702
894,152
1,294,359 981,585 312,774
1,011,873 858,704 153,169
232,896 221,547
11,349
295,176 225,977 69,199
51,929 34,266 17,663
431,872
376,914 54,958
282,486 122,881 159,605
40,421 15,045 25,376
146,806 75,322 71,484
26.676 3,638
23,038
68,583 28,876 39.707
2,059,868 718,246
1,341,622
9
198.81
364,834
1,687,749
889,794 797,955
164,906 85,183 79,723
207,141 107,470
99,671
13,576 6,780 6,796
1,263,134 706.772 556,362
565,128 481,625
83,503
516,167
450,333 65,834
4,172 3,714
458
7.110 5,452 1,658
12,143 7,572 4,571
492,742
433,595 59,147
48,001 31,292 17,669
412 250 162
3,022 1,989 1,033
5,456 1,078 4,378
40,071 27,975 12.096
1,122,621 408,169 714,452
6,882.00
606,020
3,192,695
1,636,002 1,556,693
458,882 235,006 223,876
997,408 506,868 490,540
330,783 166,732 164,051
1,734,222 1,075,401
658,821
1,427,272 928,436 498.836
944,216 759,045 185,171
316,593 283,045
33,548
265.339 180,253
85,086
46,950 29,408 17,542
315,334
266,339 48,995
483,056 169,391 313,665
123,364 48,880 74,484
237,875 79,846
158,029
36,542 5,586
30,956
85,275 35,079 50,196
1,765,423 707,566
1,057,857
13 il'ii-'iT Bankura
ti&Rural "liifuLIUrban
6,820.51
559,295
2.957,447 1,515.450 1,441,997
433,850 222,291 211,559
943,745 479,898 463,847
329,080 165,843 163,237
1,565,581 980.384 585,197
1,347,945 864,500 483,445
873,592 699,340 174,252
315,680 282,176
33,504
264.167 179,329
84,836
40,536 24,805 15,731
253,209
213,030 40,179
474,353 165,160 309.193
123.308 48,829 74,479
237,019 79,535
157,484
34,418 5,258
29,160
79,608 31,538 48,070
1,609,502 650,950 958,552
61.49
46,725
235,248
120,552 114,696
25,032 12,715 12,317
53,663 26,970 26,693
1,703 889 814
168,641 95,017 73,624
79,327 63,936 15,391
70,624 59,705 10,919
913 869 44
1.172 924 248
6,414 4,603 1,811
62,125
53,309 8,816
8,703 4,231 4,472
56 51 5
856 311 545
2,124 328
1,796
5,667 3,541 2,126
155,921 56,616 99,305
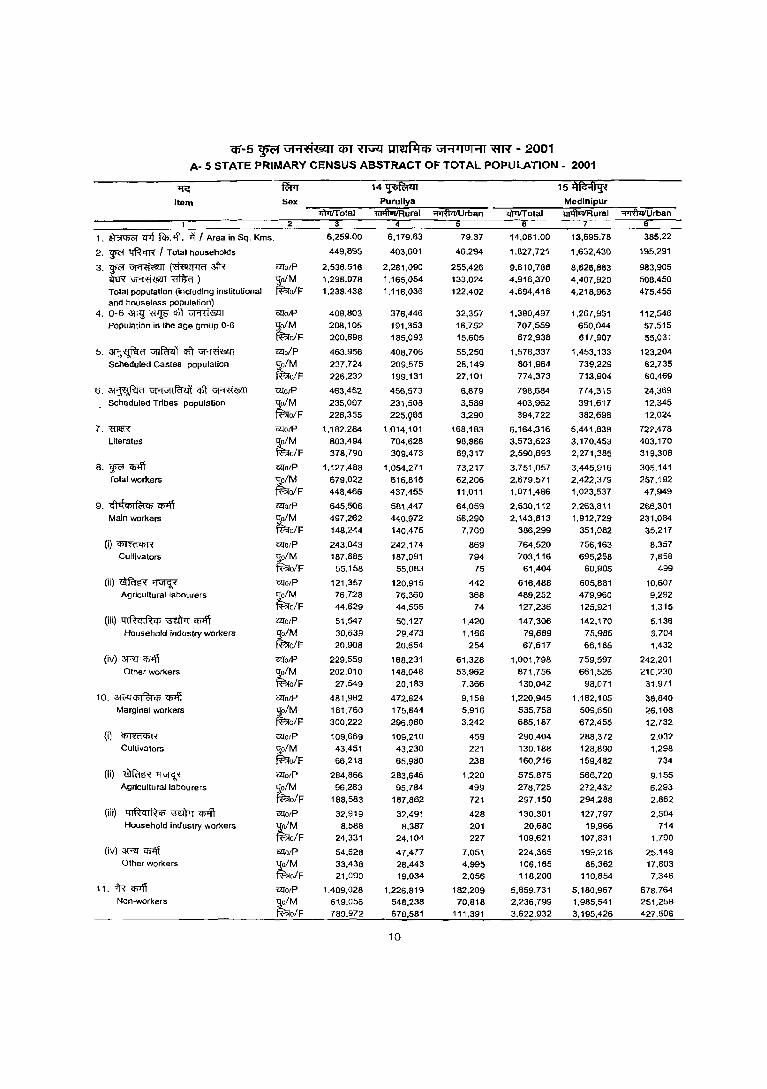
Q;'-5 ~ \J1'1fl&:l1 C6T ~ ~ \J1'1'I OI'11 ~ - 2001 A. 5 STATE PRIMARY CENSUS ABSTRACT OF TOTAL POPULATION. 2001
lIG Item
L ~~ cpt f<I>.ift. i'i ! Area in Sq. Kms.
2. WfI ~ , Total households
3. WfI ~ (~3IR ~~~n) Total population (inCluding Institutional and houseless population)
4. 0-6 ~ ~ ¢"t "PR{&r!
population in the age group 0-6
5.~~qft~ Scheduled Castes population
6. ~ GI'1G11R11l1 cti't ~ Scheduled Tribes population
7. 'ffi1<R Literates
8. WfI '15'ft Total workers
9. GI~<{)(~q) ~ Main workers
(i)~ Cultivators
(ii)~~ Agricultural labourers
(iii) ~ mWr q;>\l Household industry workers
(iv) 3RT q;>ff Other workers
10. 3l(;q<!>1~q5 CI5'lT Marginal workers
(i)~
Cultivators
(ii) ~ 'lVI'i.' Agricultural labourers
(iii)~~'<I>llt Household industry workers
(iv) 3P!:I q;>ff Other workers
11.tR~ Non-workers
Sex
2
'i'1TO/P
~o/M ~ofF
'i'1TO/P
~ofM ~o/F
'fIlolP
~o/M ~o/F CZ!O/P
-go/M ~o/F W:o/p
~o/M ~o/F
CZ!O/P
~o/M taofF CZ!O/P
ljo/M fB'o/F
CZ!OIP
~o/M tao/F mOIP
~o/M f'B;to/F
mOIP
~o/M ~o/F
mOIP
go/M fB'o/F
mOIP
qo/M ~o/F
CZ!OIP
go/M tauiF 'fIlO/P
~o/M f'B;to/F
'fIlOIP
go/M tao/F CZ!OIP
-go/M fB'o/F
CllOIP gc/M ~o/F
m.rrrotal 3
6.259.00
449,895
2,536,516 l,298,07B 1,238,438
408,803 208,105
200,698
463.956 237,724
226,232
463,452 235,097
228.355
1,1B2,284
803,494 378,790
1,127,488 679,022 448,466
645.506 497,262 148,244
243.043 187.885
55,158
121,357 76,728 44,629
51.547 30,639 20,908
229,559 202,010
27,549
481,982 lBl,760 300,222
109,669 43,451
66.218
284,866
96,283 188,583
32.919 8,588
24,331
54.528 33.438 21.090
1,409.02B 619.056 789.972
14~ Puruliya
1iliiI1IiiRurai 4
6,179.63
403,601
2,281,090 1.165,054
1.116.036
376,446 191,353
185,093
408,706 209.575 199.131
456,573 231,508
225.Q65
1,014,101
704.628 309,473
1.054,271 616,816 437,455
581,447
440,972 140,475
242,174 187.091
55,083
120.915 76,360 44,555
50.127 29.473 20.654
168,231 148,048
20,183
472,824 175,844
296.980
109,210 43.230 65,980
283,646
95,784 187,862
32,491 B.387
24.104
47,477 28,443 19,034
1,226.819 54B,238 67B.581
10
~rban
79,37
46.294
255,426 133.024 122,402
32,357 16,752 15,605
55.250 2B,149
27,101
6,879 3,589 3,290
168,183 98,866 69,317
73.217 62,206 11,011
64,059 56,290
7,769
869 794
75
442 368
74
1,420 1,166
254
61,328 53,962
7,366
9,158 5,916 3,242
459 221 238
1,220 499 721
428 201 227
7,051 4,995 2,056
182,209 70,818
111,391
<iPrlTolal 6
14,081.00
1 ,B27 ,721
9,610,788 4,916,370 4,694,418
1,380,497 707,559 672,938
1,576.337 801,964 774,373
798,684 403,962 394,722
6,164.316 3,573,623 2,590,693
3.751,057 2,679,571 1.071,486
2,530,112 2,143,813
386,299
764.520 703,116
61.404
616,488 489,252 127,236
147,306 79,689 67,617
l,OOl.79B B71,756 130,042
1.220,945 535,758 685,187
290,404 130.188 160,216
575,875
278.725 297.150
130,301 20,680
109.621
224,365 106,165 118,200
5,859.731 2,236,799 3.622,932
15~ Medlnipur >IJlltvIIFlural
7
13,695.78
1,632,430
8,626,883 4,407,920 4,218,963
1,267,951 650,044 617,907
1.453,133 739,229 713,904
774,315 391,617
382.698
5,441,838 3,170,453 2,271,385
3,445.916 2,422,379 1,023,537
2,263,811 1,912,729
351,OB2
756,163 695,258
60,905
605,881 479,960 125.921
142,170 75,985 66,185
759,597 661.525
98,071
1,182,105 509,650 672,455
288,372 128,890 159,482
566,720 272,432
294.288
127,797
19.966 107,831
199,216
88.362 110.854
5,180,967 1,985,541 3,195,426
~Urban 8
385,22
195.291
983,905 508,450 475.455
112,546 57,515 55,031
123,204 62,735 60,469
24,369
12.345 12,024
n2,478 403,170 319,308
305.141 257,192 47,949
266,301 231,084
35.217
8,357 7,858
1,99
10,607 9,292 1.315
5,136 3,704 1,432
242,201 210.230
31.971
38,840 26,108 12,732
2,032 1.298
734
9.155 6,293 2,862
2,504 714
1,790
25.149 17.803 7,346
678,764 251,258 427,506

Cf)-5 ~ \iHti&:11 CfiI ~ ~ \i1"",~lul"",1 'AN - 2001 A- 5 STATE PRIMARY CENSUS ABSTRACT OF TOTAL POPULATION - 2001
+re' fWT 16~ 17 Cj)~<'ICbldl
Item Sex ~rban
1
1. ~ <Pi f<nAt ~ I Area in Sq. Kms. 1,467.00 1,247.76 219.24 185.00 185.00
2. 'W<1' ~ I Total households 838,520 401,768 436.752 929,586 929,586
~. 'W<1' ~ (~ 3lR ClfO/P 4,273,099 2,121,109 2,151,990 4,572,876 4,572,876
<hff~~) tM
2,241,898 1,083,410 1,158,488 2,500,040 2,500,040
Total population (including institutional olF 2,031,201 1,037,699 993,502 2,072,836 2,072,836 and houseless population)
4. 0-6 3fflj ~ qft ~ ClfolP 513,218 285,145 228,073 390,282 390,282
Population in the age group 0-6 tM
262,391 145,315 117,076 202,527 202,527
olF 250,827 139,830 110,997 187,755 187,755
5.~~qft~ Clfu/P 658,707 465,837 192,670 274,635 274,835
Scheduled Castes population ljo/M 335,761 235,172 100,589 150,866 150,866
fBfo/F 322,946 230.665 92.281 123,969 123,969
6. ~ \i1 .... \i1lfc'1<i1 qft ~ ClfO/P 19,168 8,543 10,625 9,810 9,810
Scheduled Tribes population ,!o/M 9,959 4,202 5,757 5,471 5,471
~o/F 9,209 4,341 4,668 4,339 4,339
7. W&R ClfO/P 2,895,625 1,336,819 1,558.806 3,382,103 3,382,103 Literates
tM 1,647,348 757,262 890,086 1,925,008 1,925,008
o/F 1,248,277 579,557 668,720 1,457,095 1,457,095
8. 'W<1' 'Cb1ff Clfo;P 1,438,874 708,336 730,538 1,717,734 1.717,734
Total workers llQ/M 1,252.133 601,528 650.605 1,451,548 1.451,548
~o/F 186,741 106,808 79,933 266,186 266,186
9. Gltfct>l[{;jql ~ Clfo;P 1,224,972 559,539 665,433 1,623,779 1,623,779 Main workers 'lo/M 1,109,164 503,820 605,344 1,388,550 1,388,550
~o/F 115,808 55,719 60,089 235,229 235,229
(i)~ ClfO/P 63,772 61,528 2.244 5,796 5,796 Cultivators ':l,o/M 60,847 59,175 1,672 3,454 3,454
ful"oIF 2,925 2,353 572 2,342 2,342
(ii)~~ 'UTofP 88,770 84,683 4,087 3,737 3,737 A9riculturallabourers ,!o/M 84,620 80:~171 3,749 2,932 2,932
fBfoiF 4,150 3,812 338 805 805
(iii) 41RqlRiP ~ <P%T ClfOfP 120,308 70,621 49,687 43,223 43,223 Household industry workers ':l,o/M 95,143 53,424 41,719 35,722 35,722
~oIF 25,165 17,197 7,968 7,501 7,501
(iv) 3R< q;lj'j 'UTofP 952,122 342,707 609,415 1,571,023 1,571,023 Other workers ~o/M 868,554 310,350 558,204 1,346,442 1,346,442
~o/F 83,568 32,357 51,211 224,581 224,581
10, ;)lC'QiPIR:lql <P%T Cll'ufP 213,902 148,797 65,105 93,955 93,955 Marginal workers
tM 142,969 97,708 45,261 62,998 62,998
OfF 70,933 51,089 19,844 30,957 30,957
(iJ ~ Cll'ofP 11,163 10,809 354 580 580 Cultivators ,:!o/M 7.776 7,541 235 304 304
~o/F 3,387 3,268 119 276 276
(ii) ~lfvrcr< ClfOfP 57,722 54,830 2,892 641 641 Agricultural labourers 'ljo/M 47,012 44,429 2,583 346 346
fBfo/F 10,710 10,401 309 295 295
(iii) 41RqlRql -mr-r <P%T ClfO/P 45,421 26,333 17,068 9,320 9,320 Household industry workers tM 20,588 11,303 9,285 5,094 5,094
OfF 24,833 17,030 7,803 4,226 4,226
(iv) 3R' ~ ClfO/P 99.596 54,825 44,771 83.414 83.414 Other workers
tM 67,593 34,435 33,158 57,254 57,254
o/F 32,003 20,390 11,613 26,160 26,160
11. iR <P%T 'UTotP 2,834,225 1,412,773 1,421,452 2,855,142 2,855,142 Non-workers ':l,o/M 989,765 481,882 507,883 1,048,492 1,048,492
ff?ro/F 1,844,460 930,891 913,569 1,806,650 1,806,650
11
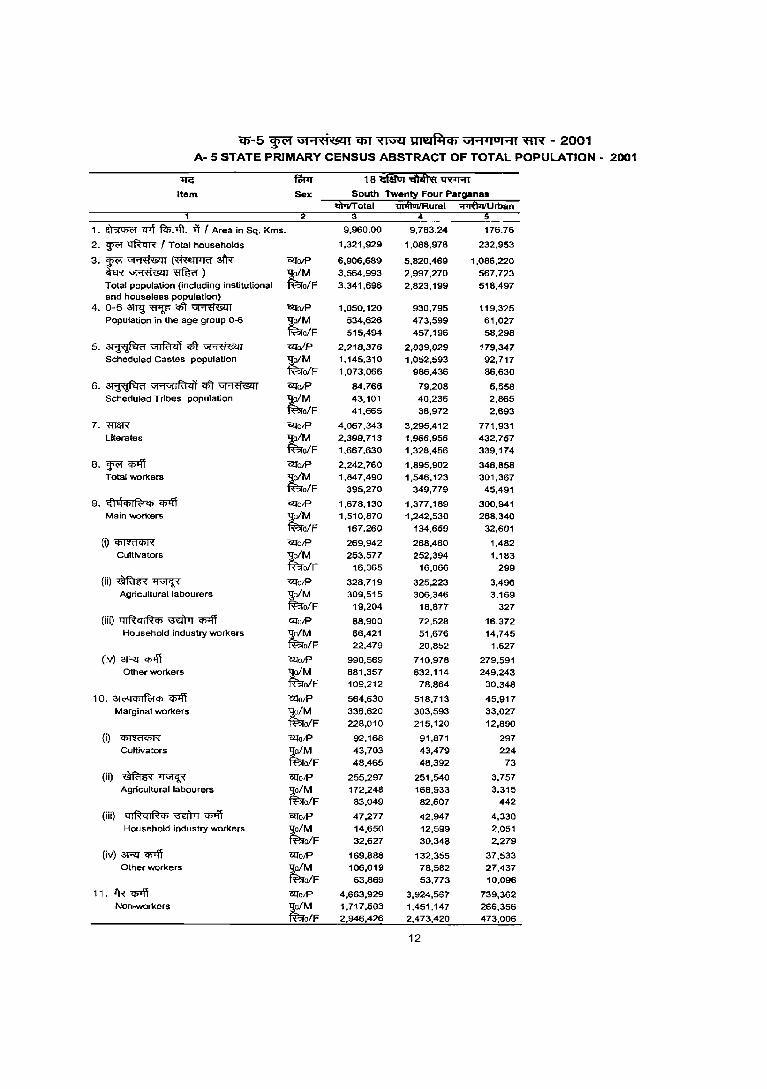
cp-5 ~ Gt"1'<1'Lc'lOU cpr ~ UI\?Ol~Cf) Gt"1.luHI ~ - 2001 A- 5 STATE PRIMARY CENSUS ABSTRACT OF TOTAL POPULATION - 2001
+re fWr 1 8 ifiitrI 'iiif.fi'i{ ~ Item Sex
,. ~ q-rt fcl;-.1ft. i'i , Area in Sq. Kms. 9,960.00 9,783.24 176.76
2. ~ ~ , Total households 1,321,929 1,088,976 232,953
3,~~(~~ Ul"otP 6,906,689 5,820,469 1,086,220 <hR~~)
tM 3.564,993 2,997,270 567,723
Total population (including institutional ofF 3,341,696 2,823,199 518,497 and houseless population)
4. 0-6 amj ~ <1ft ~ ~O/P 1.050.120 930.795 119.325 Population in the age group 0-6 ~M 534,626 473,599 61,027
ofF 515,494 457,196 58,298
5.~~qft~ Ul"o/P 2,218,376 2,039,029 179,347 Scheduled Castes population
tM 1,145,310 1,052,593 92,717
ofF 1.073.066 986.436 86.630
6. ~ G1'1G1lf<'14r qft ~ Ul"otP 84.766 79.208 5,558 Scheduled Tribes population
tM 43,101 40,236 2,865
ofF 41,665 38,972 2,693
7.~ Gllo/P 4,067.343 3,295,412 771,931 Literates
tM 2.399,713 1,966,956 432,757
ofF 1.667.630 1,328,456 339.174
8. ~ CIJIff C2tDlP 2,242,760 1.895.902 346.858 Total workers
tM 1,847,490 1,546.123 301,367
ofF 395,270 349,779 45,491
9. {lel<i>lf'<:I<i> <I>'ff <Z(O/P 1,678,130 1,377,189 300,941 Main workers
tM 1,510,870 1,242,530 268,340
ofF 167.260 134.659 32,601
(i) <i>l'tti q>1~ Gllo/P 269,942 268,460 1,482 Cultivators ~M 253,577 252,394 1,183
ofF 16.365 16,066 299
(ii)~~ <Z(O/P 328,719 325,223 3,496 Agricultural labourers "9;ofM 309,515 306,346 3,169
~o/F 19,204 18.877 327
(iii) ql~ql~<i> ~ q;+ff «latP 88,900 72,528 16,372 Household industry workers ,:!o/M 66,421 51,676 14,745
~o/F 22,479 20.852 1,627
(iv) 3Rf~ Cl<OJP 990,569 710,978 279,591 Other workers ~M 881.357 632,114 249.243
olF 109,212 78.864 30.348
10. 31;;;<jCfjIf<;!Cfj "Cf11ff CIfO/P 564.630 518,713 45,917 Marginal workers ,:!ofM 336.620 303,593 33,027
i'ao/F 228.010 215,120 12,890
(i) ~ Cl<a/P 92,168 91,871 297 Cultivators ~ofM 43,703 43,479 224
~o/F 48,465 48,392 73
(ii) ~~ CZl"OJP 255.297 251,540 3,757 Agricultural labourers :;ofM 172,248 168,933 3,315
fao/F 83,049 82.607 442
(iii) qIRcIlR<i>~~ CliO/P 47,277 42.947 4,330 Household industry workers
~ 14,650 12,599 2,051
ofF 32.627 30,348 2.279
(iv)~~ CZl"otP 169.888 132,355 37.533 Other workers ~M 106,019 78,582 27,437
olF 63,869 53,773 10,096
1'. 1R ~ CZl"OJP 4,663,929 3,924,567 739,362 Non-workers ~M 1.717,503 1.451,147 266,356
o/F 2,946,426 2,473,420 473,006
12
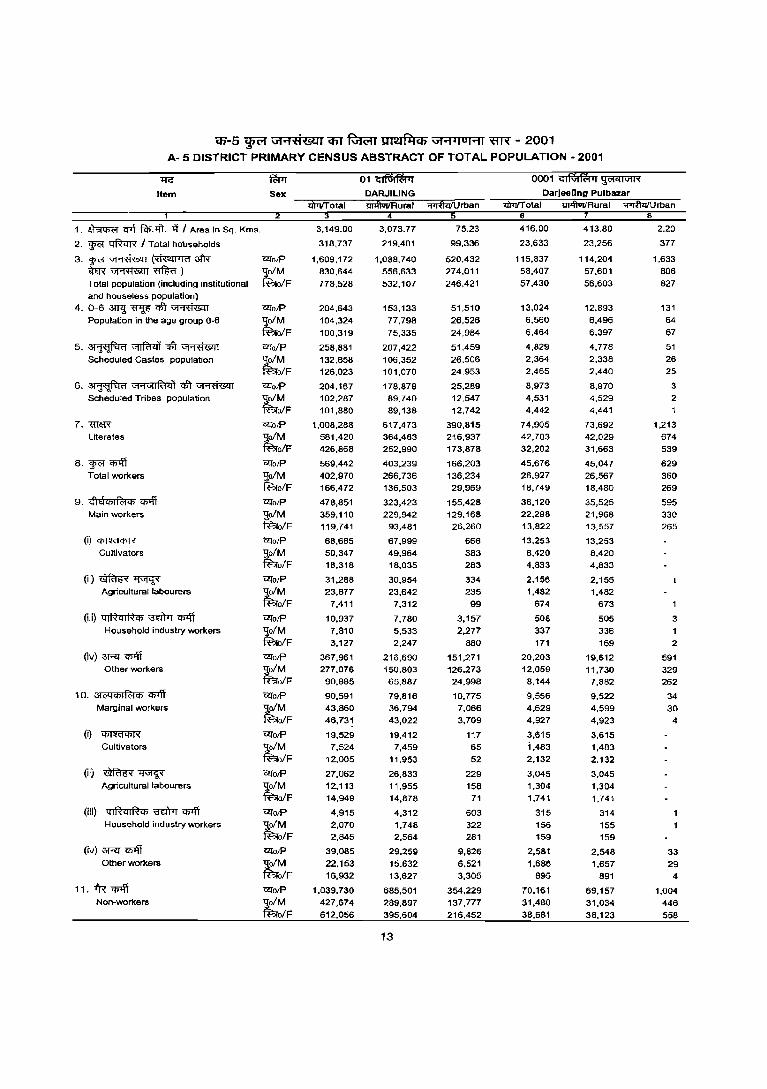
<5-5 Wt"' \:J'I"1fl'!5(Oll qrr ~ 1WZIf&lCb V1"'1'I O I"'11 ~ - 2001 A- 5 DISTRICT PRIMARY CENSUS ABSTRACT OF TOTAL POPULATION· 2001
Item Sex DARJIUNG DarJeaRng Pulbazar
lIPTITotal liiiftViIRural 'l"'rt'fufUrban lIPTITotal m>ftvrIRural ~Urban
1. ~ <'Ilf fc'i>.Bt "if' Area in Sq. Kms.
2. w<' t@crr;{ I Total ho1Jseholds
3. WC'I ~ (~ afR ~~~) Total population (Including institutional and houseless population)
4. 0-6 3mJ ~ CIIT ~ Population in the age group 0-6
5. ~ \ifl"fu<ii qft ~ Scheduled Castes population
6. ~ GfrFillR'llii CIIT ~ Scheduled Tribes population
7. mllR Literates
8. w<' <IfIff Total workers
9. G~I'C\Cj)Ift1<i> "C!>lfi Main workers
(i) "Cj)ffifCj)R
Cultivators
(ii)~~ Agricultural labourers
(iii) ql~ql~<i> ~ <IfIff Household ind ustry workers
(iv) 3RT"C!>llT Other workers
10. 3{(.;qCj)Ift1<i> <IfIff Marginal workers
(i)~
Cultivators
(ii)~~ Agricultural labourers
(iii) ql~qIR<i> ~ <IfIff Household industry workers
(iv) 3RT"C!>llT Other workers
11. i'R q;;ff Non-workers
C2:[o/P
ljo/M ff?ro/F
C2:[o!P
ljo/M ff?ro/F C2:[o/P
ljo/M ff?ro/F C2:[O/P
ljo/M ff?rolF C2:[O/P
ljoiM ff?ro/F C2:[o/P
1jo/M ff?ro/F C2:[O/P
'loiM faolF C2:[o/P
1jo/M fao/F C2:[O/P
'loiM ff?rolF C2:[o/p
1jo/M ff?ro/F C2:[orP
'lo/M ff?ro/F C2:[o/p
'loiM R";{oIF
C2:forP
'loiM fao/F C2:[o/p
ljo/M ff?ro/F C2:[orP
'lolM ff?ro/F C2:[orP
'loiM R";{o/F
C2:[o/p
'l0/M fao/F
3.149.00
318,737
1,609,172 830,644 778,528
204,643
104,324
100,319
258,881 132,858 126,023
204,167 102,287
101,880
1,008,288 581,420 426,868
569,442
402,970 166,472
478,851 359,110 119,741
68,665
50.347 18,318
31,288 23,877
7,411
10,937
7,810 3,127
367,961 277,076
90,885
90,591 43,860
46,73~
19,529 7,524
12.005
27,062
12,113 14,949
4,915
2,070 2,845
39,085
22,153 16,932
1,039,730 427,674 612,056
3,073.77
219,401
1,088,740 556,633
532,107
153,133
77,798
75,335
207,422 106,352 101,070
178,878 89,740
89,138
617.473 364,483 252.990
403.239 266,736 136,503
323,423 229,942
93,481
67,999 49.964 18,035
30.954 23.642
7,312
7.780
5,533 2,247
216,690 150,803 65,887
79,816
36.794 43,022
19,412 7,459
11,953
26,833
11,955 14,878
4,312 1,748 2,564
29,259 15,632
13,627
685,501 289,897 395,604
13
75.23
99,336
520,432 274,011
246,421
51,510
26,526
24,984
51,459 26,506 24,953
25,289 12,547
12,742
390,815 216,937 173,878
166,203 136,234 29,969
155,428 129,168
26,260
666 383 283
334 235
99
3,157
2.277 880
151,271 126,273 24.998
10,775 7,066
3,709
117 65 52
229
158 71
603 322 281
9,826 6,521
3,305
354,229 137,777
216.452
6
416.00
23,633
115,837 58,407
57,430
13,024 6,560 6,464
4,829 2,364 2,465
8,973
4.531 4,442
74.905 42,703
32,202
45,676 26,927 18,749
36,120 22,298 13,822
13,253
8.420 4,833
2,156 1,482
674
508 337 171
20,203 12.059
8,144
9,556
4.629 4,927
3,615 1,483
2,132
3,045
1,304 1,741
315 156 159
2,581 1,686
895
70,161 31,480
38.681
413.80
23,256
114,204 57,601
56,603
12,893
6,496 6,397
4,778
2,338 2,440
8,970 4.529 4,441
73,692 42,029 31,663
45,047 26,567 18,480
35,525 21,968 13,557
13,253 8.420 4,833
2,155 1,482
673
505
336 169
19,612 11,730 7,882
9,522 4,599
4,923
3,615 1,483 2,132
3,045
1,304 1,741
314
155 159
2,548 1,657
891
69,157 31,034
38,123
8
2.20
377
1,633 806
827
131
64 67
51 26 25
3 2
1,213 674
539
629
360 269
595 330 265
3
1 2
591
329 262
34
30 4
33 29
4
1,004
446
558

Qi-5 ~ G1'1-9&:J1 em R;wrr S:U~Ch \J1'1'IOI~1 'ffR - 2001 A- 5 DISTRICT PRIMARY CENSUS ABSTRACT OF TOTAL POPULATION - 2001
ZJ<:" fWr 0002 iiIift ~3fC 0003 <hI<4'l'!ti1 I .-1
Item Sax Kallmpong -l ,,; liI>rff otal lliiftiIlIRuraJ ::pffuijtJrban , 6
1. ~ <M ~. >ft. if I Area In Sq. Krns. 272.99 272.99 360.46 360.46
2. ~ ~ I Total households 13,092 13,092 12,920 12,920
3.~~(~afr< 12:fo/P 64,349 64,349 67,680 57,680 W~~) tM 32,304 32,304 34,382 34,382 Total population (including institutional oIF 32.045 32,045 33,298 33,298 and houseless population)
4. 0-6 3!l<l ~ ~ ~ 12:fO/P 6,679 6,679 8,689 8,689 Population in the age group 0-6 tM 3,481 3,481 4,445 4,445
oIF 3,198 3,198 4,244 4,244
5.~~<!ft~ 12:folP 2,508 2,508 4,806 4,806 Scheduled Castes population ~M 1,271 1,271 2,393 2,393
olF 1,237 1,237 2,413 2,413
6. ~ \i11\i1IRi4'1 ~ ~ UfotP 5,026 5,028 11,878 11,878 Scheduled Tribes population tM 2,552 2,552 5,879 5,879
o/F 2,476 2,476 5,999 5,999
7.m~ UfotP 41,958 41,958 43,741 43,741 Literates tM 23,658 23,658 24,400 24,400
o/F 18,300 18,300 19,341 19,341
8.~~ Gqo/p 20,731 20,731 27,112 27.112 Total workers ~M 13,105 13,105 17,441 17,441
oIF 7,628 7,626 9,671 9,671
9. cft>iC!>IR:tqs <p>ff 12:fotP 16,464 16,464 19,485 19,485 Main workers tM 10,976 10,976 14,209 14,2~9
oIF 5,488 5.488 5,276 5,276
(i)~ CQ'otP 2,370 2,370 9,520 9,520 Cultivators ~M 1,830 1,830 6,436 6,436
o/F 540 540 3,084 3,084
(ii)~~ CQ'o/p 2,393 2,393 1,478 1,478 Agricultural laboure",
~ 1,851 1,851 1,137 1,137 elF 542 542 341 341
(iii) QIRqllhs ~ <!>Iff CQ'o/p 632 632 691 691 Household industry workers ~M 459 459 506 506
ofF 173 173 185 185
(iv) W'lT 'q')Ij'f GqO/P 11,069 11,069 7,796 7,796 Other workers ;tM 6,836 6,836 6,130 6,130
olF 4,233 4,233 1,666 1,666
1 O. <II (ill C!> I R:t qs <!>Iff CZfotP 4,267 4,267 7,627 7,627 Marginal workers tM 2,129 2,129 3,232 3,232
ofF 2,138 2,138 4,395 4,395
0) ~ CQ'olP 1,341 1,341 3,011 3,011 Cultivators t;M 503 503 1,012 1,012
ofF 838 'l38 1.999 1,999
(ii) ~~ CZfO/P 1,559 1,559 2,922 2,922 "Agricultural labourers tM 779 779 1,272 1,272
ofF 780 780 1,650 1,650
(iii) qlfhlR<'P ~ <'I>1ff CZfO/P 172 172 348 348 HousehOld Industry WOrkers tM 65 65 122 122
olF 107 107 226 226 (iv) '3R1' 'C/)lff 12:fotP 1,195 1,195 1,346 1,346
Other WOrkers tM 782 782 826 826 ofF 413 413 520 520
1 1. 1'R' <I>1ff CllolP 43,618 43.618 40,568 40,568 Non-workers tM 19,199 19,199 16,941 16,941
ofF 24,419 24,419 23,627 23,627
14
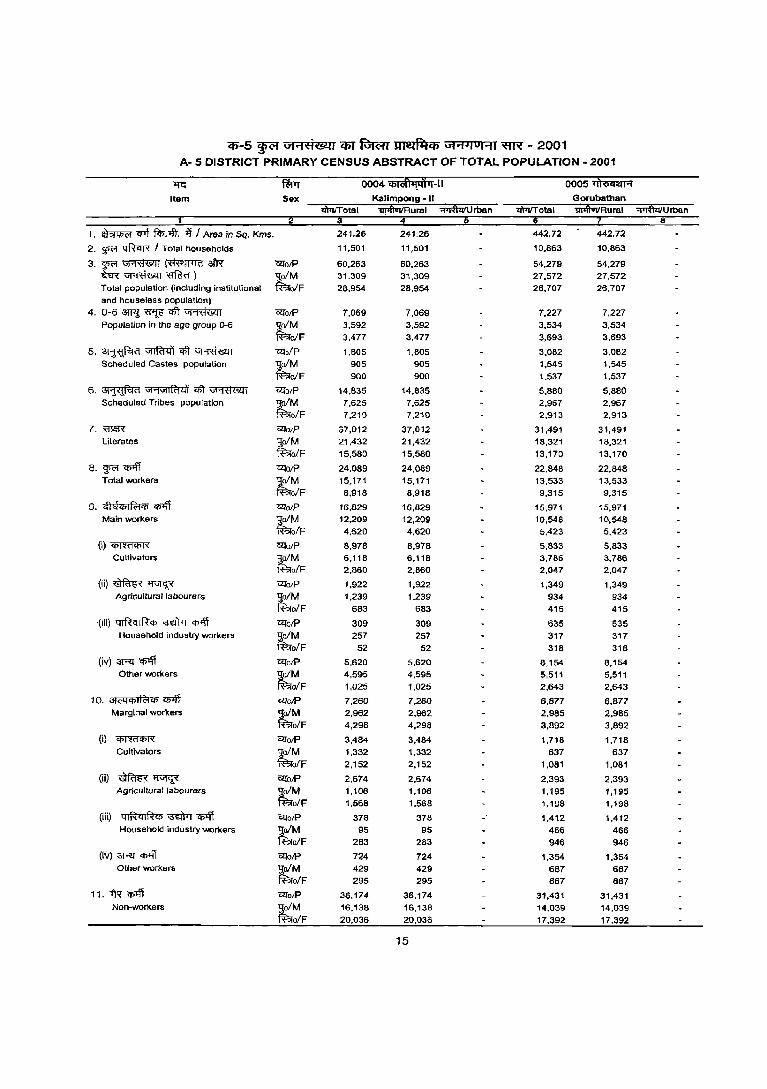
Cfi"-5 ~ \jHti6ll1 Cf)J ~ JU2l~ij) \7I"'1'loHI WR - 2001 A· 5 DISTRICT PRIMARY CENSUS ABSTRACT OF TOTAL POPULATION· 2001
"lG fair 0004 Iblifl'!.41'1-1l oo05~ Item Sex Kallmpong -II Gorubathan
m.vrotal u,41oIlRuml ~rban m.vrotal D,41OVRural '1',~"'Uroan 4 8
1. ~ cr-.t ~. >ft. if J Area in Sq. Kms. 241.26 241.26 442.72 442.72
2. ~ qftClR I Tota, tIouseholds 11,501 11,501 10.863 10,863
3.~~(~~ C2ToJP 60,263 60,263 54.279 54.279 <hR~~)
tM 31.309 31.309 27,572 27.572
Total population (including institutional o/F 28,954 28.954 26,707 26,707 and houseless population)
4. 0-6 '3Wl ~ qft Uffiffim C2TO/P 7,069 7,069 7,227 7,227 Population in the age group 0-6 ~oIM 3,592 3,592 3,534 3,534
~o/F 3,477 3,477 3,693 3,693
5.~~qft~ C4!o/p 1.B05 1,805 3,082 3,OB2 Scheduled Castes population ~o/M 905 905 1,545 1,545
1B!o/F 900 900 1,537 1,537
6. ~ "1'1"1IRi'lll qft ~ C4!o/P 14.835 14.835 5,880 5,880 Scheduled Tribes population 'JoIM 7,625 7,625 2,967 2.967
1B!o/F 7,210 7,210 2,913 2,913
7. mill< OlfO/P 37,012 37,012 31,491 31,491 Literates :l;o/M 21,432 21,432 18,321 18,321
fBio/F 15,580 15,580 13,170 13,170
8. S'<'I CI>'ff OlfotP 24.089 24,089 22.848 22,848 Total workers ~M 15,171 15.171 13,533 13,533
olF 8.918 8,918 9,315 9.315
O. ,!hhbl Riq; q;>ff C4!O/P 16,829 16,829 15,971 15.971 Main workers
~ 12,209 12,209 10,548 10.548 olF 4,620 4,620 5,423 5.423
(i)~ OlfO/P 8,978 8.978 5.833 5,833 Cultivators ~M 6,118 6.118 3,786 3.786
ofF 2.860 2.860 2,047 2.047
(ii)~~ OlfO/P 1.922 1,922 1,349 1,349 Agriculrurallabourers ~M 1.239 1,239 934 934
ofF 683 683 415 415
(iii) QIRcIlRq; ~ ~ OlfolP 309 309 635 635 Household industry workers ~M 257 257 317 317
ofF 52 52 318 318
(iv) 3Rl" Cf>lff C4!otP 5,620 5,620 8,154 8.154 Other workers r;M 4,595 4,595 5,511 5,511
ofF 1,025 1,025 2,643 2.643
10. 31 <'<l </>1 f6t </) Cf>lff Cl:/o/P 7,260 7.260 6,877 6,877 Marginal workers tM 2,962 2,962 2,985 2.985
ofF 4,298 4,298 3,892 3,892
(il ~ OlfO/P 3,484- 3,484 1,718 1,718 Cultivators tM 1,332 1,332 637 637
ofF 2,152 2,152 1,081 1,081
(ii) ~~ ~oiP 2,674 2.674 2,393 2,393 Agricultural labourers tM 1,106 1,106 1,195 1,195
ofF 1,568 1.568 1,198 1,198
(iii) Q IRq I R i!!> "'3Ei'M Cf>lff ~O/P 378 378 1,412 1,412 Household industry workers ~M 95 95 466 466
o/F 283 283 946 946
(Iv) ~ <I>'\T OlfolP 724 724 1,354 1,354 Other workers ~M 429 429 687 687
olF 295 295 667 667
11. iN ~ OlfolP 36,174 36,174 31,431 31,431 Non-workers
tM 16.138 16,13B 14.039 14,039
ofF 20,036 20,036 17.392 17,392
15
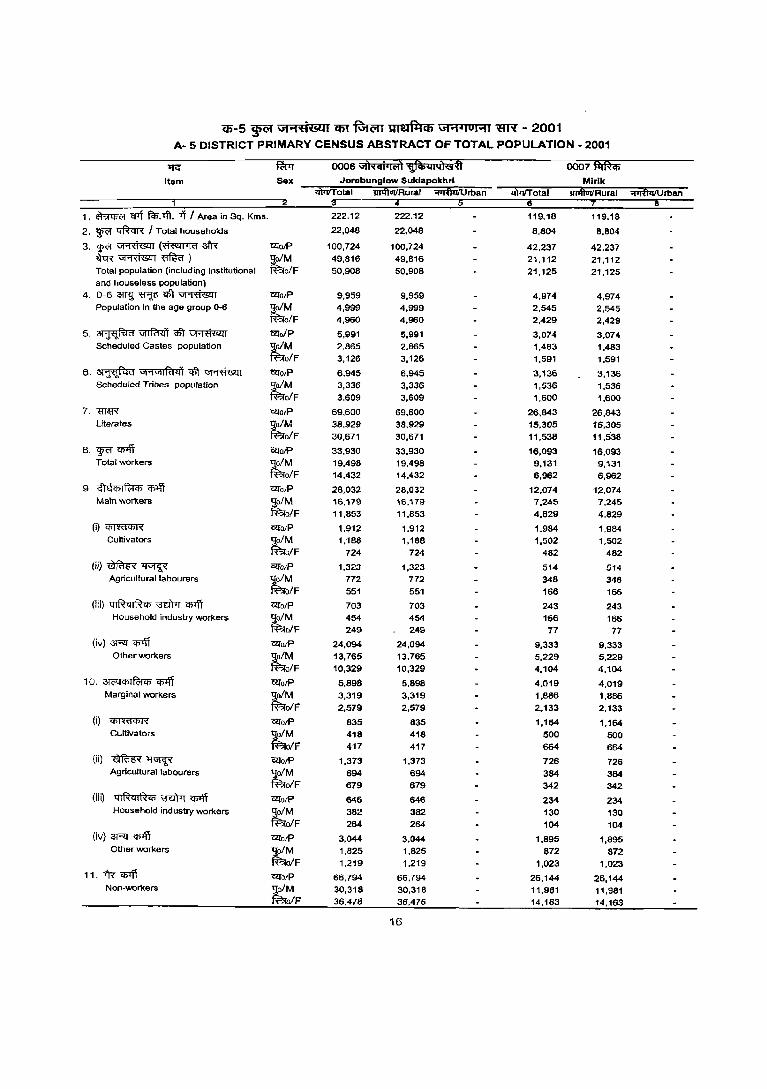
Qj-5 ~ \J1"1-H&l1 C6T"Rifffi IUlUfllCb \J1"1'IUI"11 m'l - 2001 A- 5 DISTRICT PRIMARY CENSUS ABSTRACT OF TOTAL POPULATION - 2001
11'<: fu 0006 vth"iil...'l Wi4141u3 ooo7~ Item Sex JOfabun91ow Suklapokhrl Mlrlk
'liilifT otal 'iii1ftIiIIRurar Wrban 'liilifT otal 'iii1ftIiIIRural :;;p:Jfl1ijlJrban
1. ~ CI't fcP.~. ~ I Area in Sq. Kms. 222.12 222.12 119.18 119.18
2. ~ ~ / Total households 22,048 22,048 8,804 8,804
3. w<'I ~ (~ 3l'R 12l'oiP 100,724 100,724 42,237 42.237 ~~~) ~M 49,816 49,816 21,112 21,112 Total population (including Institutional ofF 50,908 50,908 21,125 21,125 and houseless population)
4. 0-6 arnJ; ~ <1ft ~ 12l'o/P 9,959 9,959 4,974 4,974 Population in the age group 0-6 ~M 4,999 4,999 2,545 2,545
olF 4,960 4,960 2,429 2,429
5. ~~~~ C1ToIP 5,991 5,991 3,074 3,074 Scheduled Castes population ~M 2,865 2,865 1,483 1,483
olF 3,126 3,126 1,591 1,591
6. ~ G1"IGiifulll q3\ ~ <lI'O/P 6,945 6,945 3,136 3,136 Scheduled Tribes population tM 3,336 3,336 1,536 1,536
olF 3.609 3,609 1,600 1,600
7. me;R 12l'O/P 69,600 69.600 26,843 26,843 Literates ~M 38,929 38.929 15,305 15,305
olF 30,671 30,671 11,538 11,538
8. w<'f cpl\T C1ToiP 33,930 33.930 16,093 16,093 Total workers ~M 19,498 19,498 9.131 9,131
ofF 14,432 14,432 6,962 6,962
9. c;'hlCf>Ifc::lil> cpl\T C2TO/P 28,032 28.032 12.074 12,074 Main workers ~M 16,119 16.179 7.245 1,245
olF 11,853 11.853 4.829 4,829
(i)~ ClfOfP 1.912 1.912 1.984 1,984 Cultivators tM 1,188 1,188 1.502 1,502
olF 724 724 482 482
(ii)~~ C2TO/P 1,323 1.323 514 514 Agricultural labourers ~M 712 772 348 348
olF 551 551 166 166 (iii) q@cllf~q, ~ C()lj'\ 12l'ofP 703 703 243 243
Household industry workers tM 454 454 166 166 ofF 249 249 77 77
(iv) aRI' cpl\T C2TOIP 24,094 24,094 9.333 9,333 Other workers ~M 13,765 13,765 5.229 5,229
ofF 10,329 10.329 4.104 4,104
10, 3lC>QCfiIfc>tCf> ~ C2ToiP 5,898 5,898 4,019 4,019 Marginal workers tM 3,319 3,319 1.886 1,866
ofF 2,579 2,579 2.133 2,133 (i) ~ ~oiP 835 835 1,164 1,164
Cultivators tM 418 418 500 SOO ofF 417 417 664 664
(ii) ~~ ~oiP 1.373 1,373 726 726 Agricultural labourers ~M 694 694 384 384
ofF 679 679 342 342 (iii) ql~qIRil>~~ ~QfP 646 646 234 234
Household industry workers tM 382 382 130 130 ofF 264 264 104 104
(iv) aRI'~ C2ToiP 3,044 3,044 1,895 1,895 Other workers
~F 1,825 1,825 872 872 1,219 1,219 1,023 1,023
11. tR 'l>'ff tzlofP 66,794 66,794 26,144 26,144 Non-workers tM 30,318 30,318 11,981 11,981
olF 36,476 36,476 14,163 14,163
16
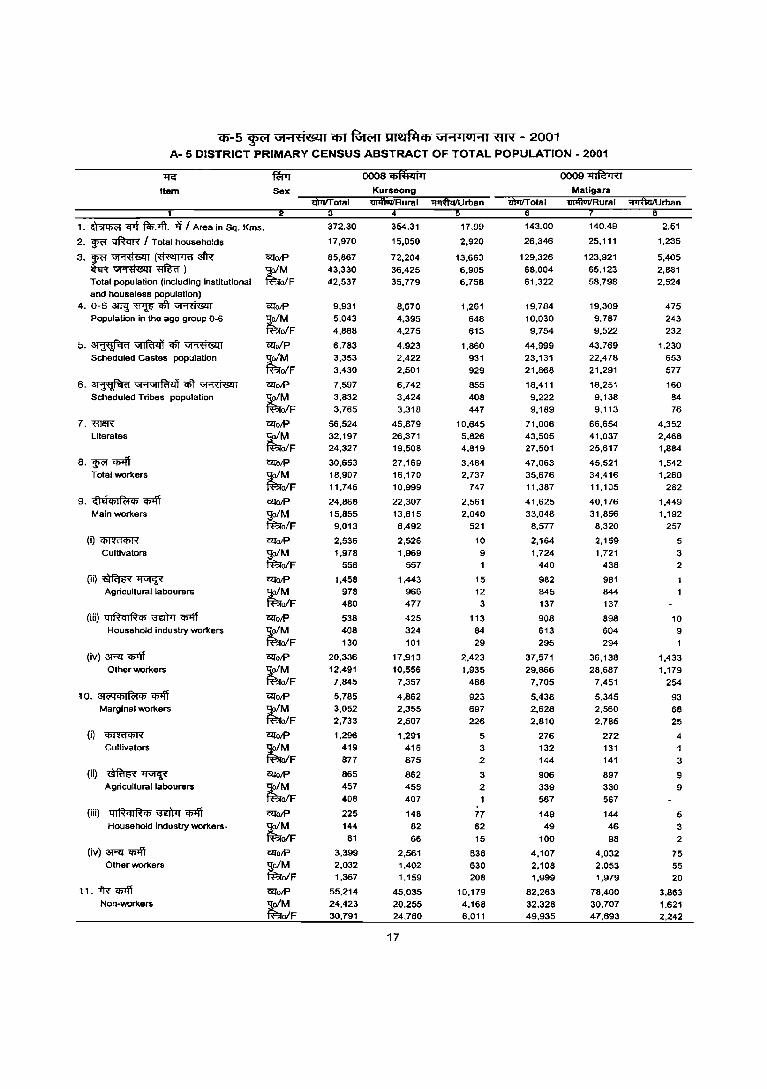
co-5 ~ V1~ti'8iQl Cfi1 fGwrr ~ \:I1"1~IUHI WX - 2001 A- 5 DISTRICT PRIMARY CENSUS ABSTRACT OF TOTAL POPULATION - 2001
~
Item
1. ~ <ftT fcI>.+ft. Ti I Area in Sq. Kms.
2. ~ ~ I Total households
3.~~(~:lfR w~'flftff) Total population (including institutional
and houseless population)
4. 0-6 31Tll ~ cffI ~ Population in the age group 0-6
5.~~cffI~ Scheduled Castes population
6. ~ ..... '1 ..... IRlI.Oi1 ~ ~ Scheduled Tribes population
7. "ffi1lR Literates
8. ~ q;>ff Total workers
9. ;!hi<j)I fc:I II> "Ih'lT Main workers
(i)~
Cultivators
(i~~~ Agricultural labourers
(iii) 41~qIRII> ~ "Ih'lT Household industry workers
(iv) 3Rl "Ih'lT Other workers
10. 31(ilj"'I~q; ~ Mar9inal workers
(il <m<fCI>R Cultivators
(ii)~~ Agricultural labourers
(iii) 4IRqIRq; ~ ~ Household industry workers.
(i\l)3Rl~ Other workers
11. -IR "Ih'lT Non-workers
Sex
1l!totP "9;oIM faolF
l21'otP -goiM faolF 1l!tolP
~oIM fao/F
1l!totP
~oIM fao/F
1l!to/P goiM faolF 1l!to/P -go/M ~o/F c.!:fo/p
-go/M fF.:Jo/F 1l!tO/P -go/M fF.:Jo/F rliotP -go/M fF.:Jo/F rlio/P -go/M tao/F 1l!totP -go/M fF.:Jo/F 1l!totP ~oIM tao/F czrotP -go/M fF.:Jo/F c.!:fotP
-go/M fF.:Jo/F czrotP -go/M tao/F GlJotP So/M fF.:Jo/F C2l0/P
So/M fBlo/F
m.vrotal
372.30
17,970
85,867 43,330 42,537
9,931 5,043 4,888
6,783 3,353 3,430
7,597 3,832 3,765
56,524 32,197 24,327
30,653 18,907 11,746
24,868 15,855
9,013
2,536 1,978
558
1,458 978
480
538 408 130
20,336 12,491 7,845
5,785 3,052 2,733
1,296 419 877
865 457 408
225 144
81
3,399 2,032 1,367
55,214 24,423 30,791
0008 iiiftiiIiTT Kurseong
Jl11flUl/Rural iiTifuiIUrban
354.31
15,050
72,204 36.425 35.779
8,670 4.395 4.275
4.923 2,422 2,501
6,742 3,424 3,318
45,879 26,371 19,50B
27.169 16,170 10,999
22,307 13,815 8,492
2,526 1,969
557
1,443 966 477
425 324 101
17,913 10,556 7,357
4.862 2.355 2,507
1,291 416 875
862 455 407
148 82 66
2,561 1,402 1,159
45,035 20,255 24,780
17
17.99
2,920
13,663 6,9.05 6,758
1,261 648 613
1.860 931 929
855 408 447
10,645 5,826 4,819
3,484 2.737
747
2,561 2,040
521
10 9 1
15 12
3
113 84 29
2,423 1,935
488
923 697 226
5 3 2
3 2
77 62
15
838 630 208
10,179 4,168 6,011
"Ii\i1IT otal
143.00
26,346
129,326 68,004 61,322
19,784 10,030 9,754
44,999 23,131 21,868
18,411 9.222 9,189
71,006 43,505 27,501
47,063 35,676 11,387
41,625 33,048 8,577
2,164 1,724
440
982 845 137
908 613 295
37,571 29,866
7,705
5,438 2.628 2.810
276 132 144
906 339 567
149 49
100
4,107 2.108 1.999
82,263 32,328 49,935
0009~ Matigara
1Il'fiuJIRurai "l'tTfui/Urban 8
140.49
25,111
123,921 65,123 58,798
19,309 9,787
9.522
43,769 22,478 21,291
18,251 9,138
9.113
66,654 41,037 25,617
45,521 34,416 11,105
40,176 31,856
8,320
2,159 1,721
438
981 844
137
898 604
294
36,138 28,687
7,451
5,345
2,560 2,785
272 131 141
897 330 567
144 46
98
4,032 2,053 1,979
78,400 30,707 47,693
2.51
1,235
5,405 2,881 2,524
475 243 232
1,230 653 577
160 84 76
4,352 2,468 1,884
1,542 1.260
282
1.449 1,192
257
5 3 2
10 9 1
1,433 1.179
254
93 68 25
4
1
3
9 9
5 3 2
75 55 20
3,863 1.621 2,242
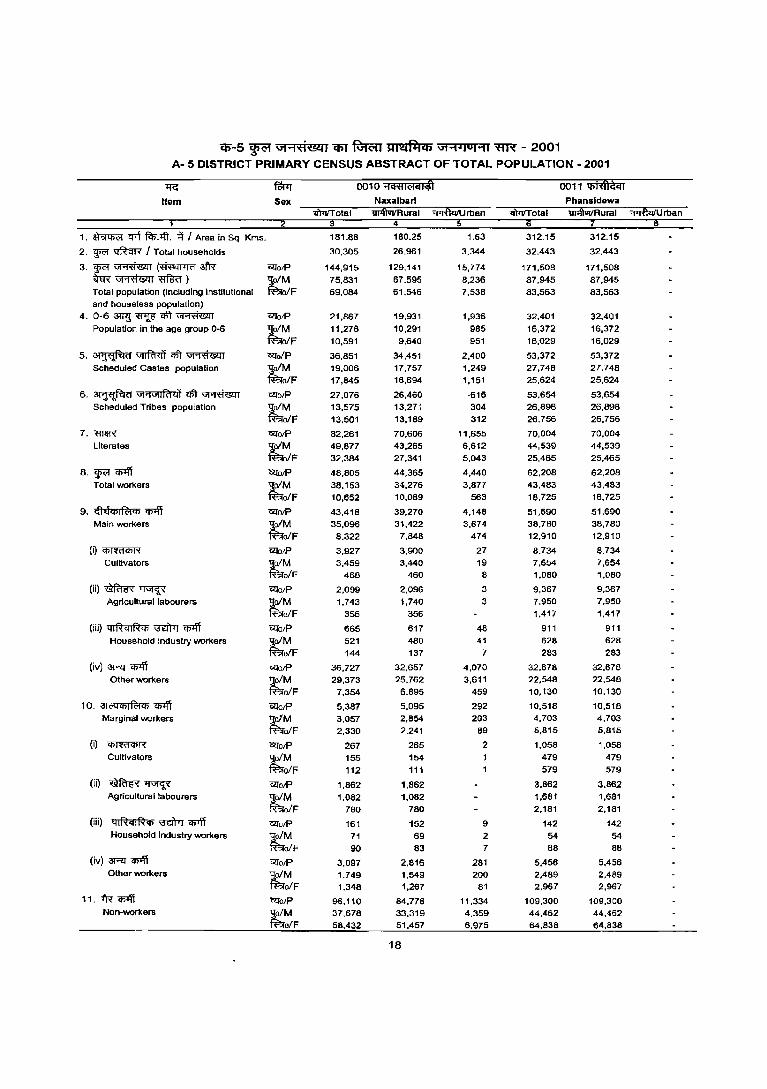
q;-5 ~ \l1"108&tJ C6T ~ JIlI!JI4Cb \l1"1 1J0I"1J ~ - 2001 A- 5 DISTRICT PRIMARY CENSUS ABSTRACT OF TOTAL POPULATION - 2001
l1c:' fWr 0010 '1CR1lclill'fl 00 11 liii""iftifcIT Item Sex Naxalbarl Phansldewa
lIFrrrotal "lIl4lvrfR ural :;:r;Tfui/U rban lIFrrrotal ~Rural :;:jiffuifU rban 1 4 6
1. ~ ?f"! ~.lfI. ":l / Area in Sq Kms. 181.88 180.25 1.63 312.15 312.15
2. W<" "tlftcIR / Tolal households 30.305 26,961 3.344 32.443 32,443
3.~~(~3fR G!lotP 144,915 129,141 15,774 171,508 171,508 iIm"~~) tM 75,831 67,595 8,236 87,945 87,945 Tolal population (including institutional o/F 69,084 61,546 7,538 83,563 83,563 and houseless popUlation)
4. 0-6 3lnl ~ <1ft ~ G!lotP 21,867 19,931 1,936 32,401 32,401 Population in the age group 0-6 tM 11,276 10,291 985 16,372 16,372
oIF 10,591 9,640 951 16,029 16,029
5. ~ ~ <1ft 'Vffihlm G!lolP 36,851 34,451 2,400 53,372 53,372 Scheduled Castes population tM 19,006 17,757 1,249 27,748 27,748
o/F 17,845 16,694 1,151 25,624 25,624
6.~Uj~<Ift~ G!lo/P 27,076 26,460 ·616 53,654 53,654 Scheduled Tribes population tM 13,575 13,27~ 304 26,898 26,898
o/F 13,501 13,189 312 26,756 26,756
7.mm G!lO/P 82,261 70,606 11,655 70,004 70,004 Literates tM 49,877 43,265 6,612 44,539 44,539
oIF 32,384 27,341 5,043 25.465 25,465
8. W<" '1Ii1fi G!lotP 48,805 44,365 4,440 62,208 62,208
Total workers tM 38,153 34,276 3,877 43,483 43,483
oIF 10,652 10,089 563 18,725 18,725
9. <ft ti'fl I R;t'fl "fl'ff G!loiP 43,418 39,270 4,148 51,690 51,690 Main workers tM 35,096 31,422 3,674 38,780 38,780
oIF 8.322 7,848 474 12,910 12,910
(Q~ G!lo/P 3,927 3,900 27 8,734 8.734 Cultivators tM 3,459 3,440 19 7,654 7,654
olF 468 460 8 1.080 1,080
(ii)~~ G!lo/P 2,099 2,096 3 9,367 9,367
Agricultural labourers ~ 1,743 1,740 3 7,950 7,950
o/F 356 356 1,417 1,417
(iii) ql~ q l~qJ \3Ei1TJ "fl'ff G!lO/P 665 617 48 911 911
Household industry workers ~M 521 480 41 628 628
oIF 144 137 7 283 283
(iv) 3RJ "fl'ff G!latP 36,727 32,657 4,070 32,678 32,678 Other workers ~M 29,373 25,762 3,611 22,548 22,548
o/F 7,354 6.895 459 10,130 10,130
1 O. 31 C'4 qJ I R;t qJ '1Ii1fi G!lotP 5,387 5.095 292 10.518 10,518 Marginal workers tM 3,057 2,854 203 4,703 4,703
oIF 2,330 2.241 89 5,815 5.815
(i) ~ G!lo/P 267 265 2 1,058 1,058 Cultivators ~M 155 154 479 479
olF 112 111 579 579
(ii) ~~ G!lotP 1,862 1,862 3.862 3,862 Agricultural labourers ~M 1,082 1,082 1,681 1,681
oIF 780 780 2,181 2,181
(iii) ql~ql~'fl ~"fl'ff G!lotP 161 152 9 142 142 Household Industry workers tM 71 69 2 54 54
oIF 90 83 7 88 88
(iv) 3RJ "fl'ff G!lotP 3,097 2,816 281 5,456 5,456 Other workers ~M 1.749 1,549 200 2,489 2,489
ofF 1,348 1,267 81 2,967 2,967
11. m"fl'ff G!lO/P 96,110 84,776 11,334 109,300 109,300 Non-workers )tM 37,678 33,319 4.359 44,462 44.462
ofF 58,432 51,457 6,975 64,838 64,838
18
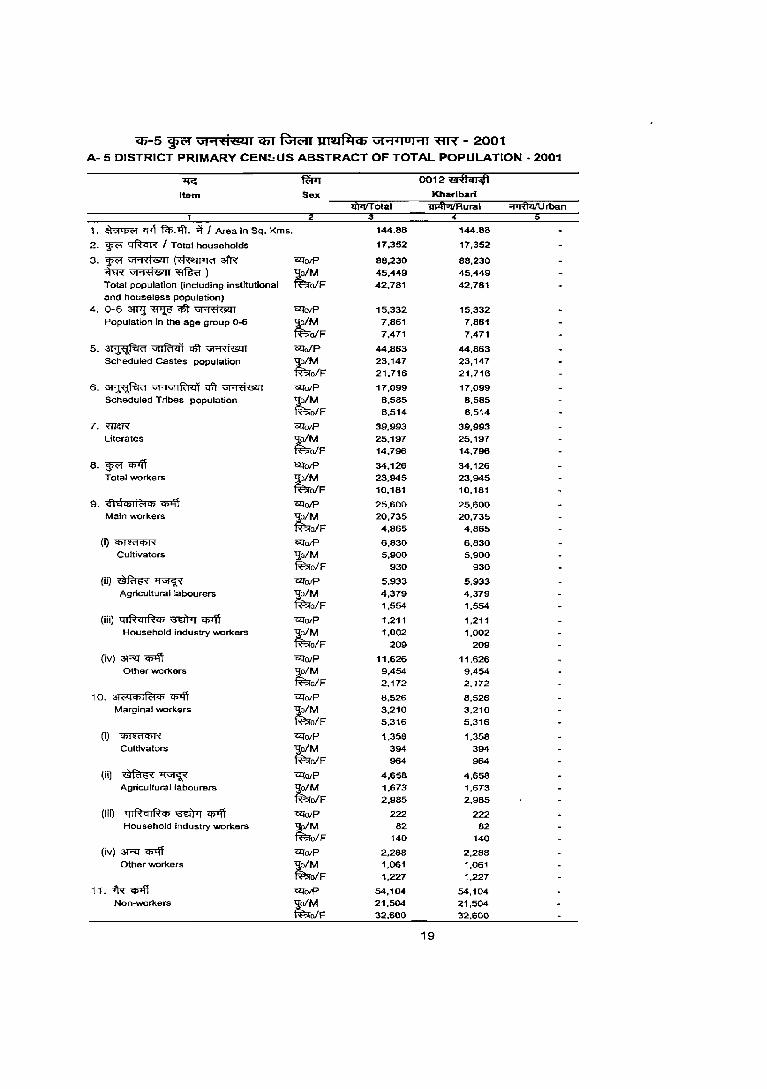
'Q1-5 ~ \iI .... ti&:J1 em ~ ~ \iI .... lIOI .... 1 "«R - 2001 A- 5 DISTRICT PRIMARY CEN!:US ABSTRACT OF TOTAL POPULATION - 2001
~ ~ 0012~ Item Sex Kharlbarl
iitiTITotal 1iFffViiRural ~rban 3
1. ~ ~ 1$.~. ii / Ar"ea in Sq. Kms. 144.88 144.88
2. ~ tfftcfR I Total households 17,352 17,352
3. ~ Vj"j'(i&ll (~al'R GlfoiP 88,230 88,230
~ Vl"Hl&l1 ~ ) ~M 45,449 45,449
Total population (including institutional ofF 42,781 42,781 and houseless population)
4. 0-6 ~ ~ qft Vl9~&l1 GlfoiP 15,332 15,332 Population in the age group 0-6 llo/M 7,861 7,861
ff:?rofF 7,471 7,471
5. ~ ~ c5t Vl'1t1&l1 Glfa/P 44,863 44.863
Scheduled Castes population ~M 23,147 23,147 o/F 21,716 21,716
6. ~ "'l .... "'lIRr'll'i qft ""H1&:11 GlfOlP 17,099 17,099 Scheduled Tribes population ~M 8,585 8,585
o/F 8,514 8.514
7. 'WI!R <'2l'o/P 39,993 39,993 Literates ~M 25,197 25,197
ofF 14,796 14,796
8. ~ 'CI51fi GlfoiP 34,126 34,126 Total workers ~M 23,945 23,945
o/F 10.181 10,181
9. cfl €I cp I ~ cp 'lP'fi ~oiP 25.600 25,600 Main workers ~M 20,735 20,735
ofF 4,865 4,865
(i) C61~dq)I"< ~oiP 6,830 6,830 Cultivators llo/M 5,900 5,900
R=?ro/F 930 930
(jj)~~ ~olP 5.933 5.933 Agricultural labourers llo/M 4,379 4,379
R=?ro/F 1,554 1,554
(iii) ql~ql~cp ~ 'lP'fi GlfoiP 1.211 1,211 Household industry workers ~~F 1,002 1,002
209 209
(iv) 3Rr q;+ff ~oiP 11.626 11.626 Other workers ~M 9,454 9,454
olF 2.172 2.172
10. 31 <'G en I ~cp 'CI51fi GlfoiP 8,526 8,526 Marginal workers ~M 3,210 3,210
o/F 5.316 5.316
(1) ~R UfOlP 1,358 1.358 Cultivators ~M 394 394
o/F 964 964
(Ii) ~~ UfO/P 4,658 4,658 Agricultural labourers ~M 1,673 1,673
ofF 2,985 2.985
(iii) ql~ql~ct> '3"ciPT ~ UfolP 222 222 Household industry workers ~M 82 82
ofF 140 140
(iv) 3Rr q;'4f Glfo/P 2,288 2,288 Other workers ~M 1,061 1,061
ofF 1,227 1,227
11. >'R <D'ft ",olP 54,104 54,104 Non-workers ~M 21,504 21,504
ofF 32.600 32.600
19
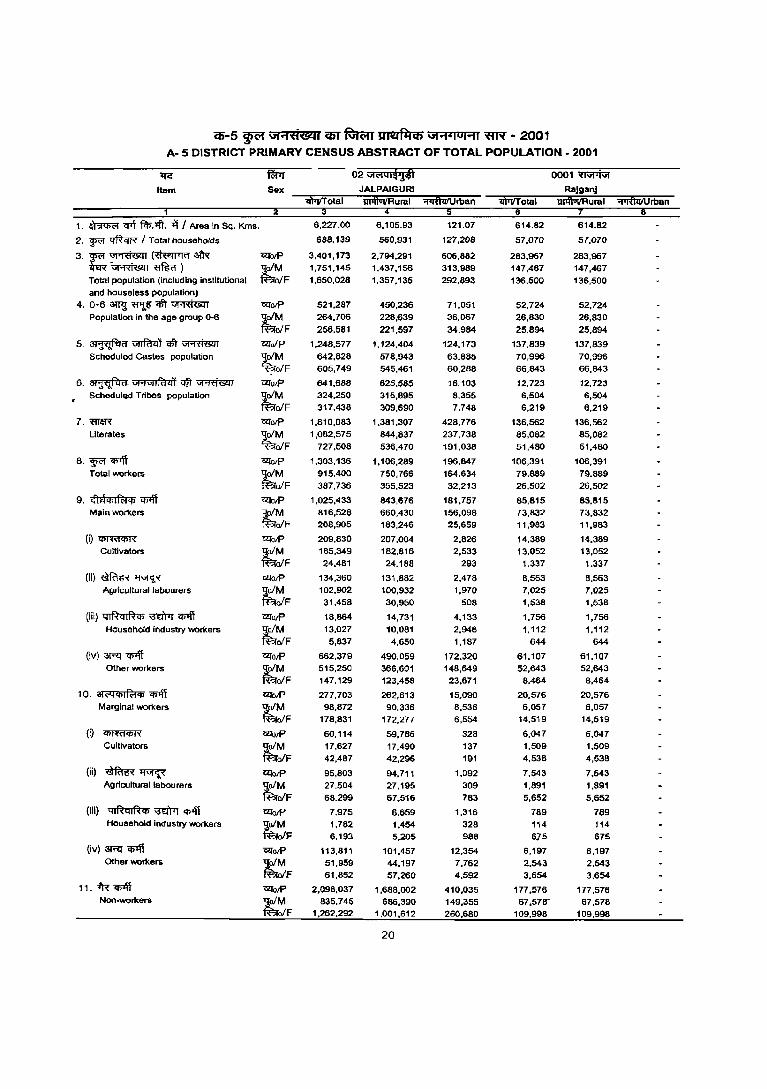
C5"-5 ~ \if ... 'ti@i' (fiT ~ J",er~C6 Ui ...... o ..... ~ ~ 2001 A- 5 DISTRICT PRIMARY CENSUS ABSTRACT OF TOTAL POPULATION - 2001
If<:' ~ 02 vt"'Qlh4\ 0001~
ftam Sax JALPAIGURI RaJganJ iliiilTotal lii1flVIIRural "fiifliiIUrban 'iIiiTIT otal rilTJRural ~rban
1. ~ ~ fIl;.1fi. 1'f I Area in Sq. Kms. 6,227.00 6,105.93 121.07 614.82 614.82
2. WC1 ~ / Total households 688,139 560,931 127,208 57,070 57,070
3.~~(~3l'R <2lo/P 3,401,173 2,794,291 606,882 283,967 283,967 t£R~~) ;tM 1,751,145 1,437,156 313,989 147,467 147,467 Total population (including Institutional ofF 1,650,028 1,357,135 292,893 136,500 136,500 and houseless population)
4. 0-6~~qjt~ <2lotP 521,287 450,236 71,051 52,724 52,724 Population in the age group 0-6 tM 264,706 228,639 36,067 26,830 26,830
ofF 256,581 221,597 34,984 25,894 25,894
5. ~ VIlfti<if c6l' ~ <2lolP 1,248,577 1,124,404 124,173 137.839 137,839 Scheduled Castes population tM 642,628 578,943 63.885 70,996 70.996
olF 605.749 545,461 60.288 66,843 66,843
6. ~ V!'1V1IRlq)" ~ ~ <2lolP 641.688 625.585 16,103 12,723 12.723 Scheduled Tribes population tM 324,250 315.895 8,355 6,504 6.504
o/F 317,438 309,690 7.748 6,219 6.219
7.mm <2lotP 1,810.083 1.381,307 428.776 136,562 136.562 Literates tM 1,082.575 844,837 237,738 85,082 85,082
o/F 727.508 536,470 191,038 51,480 51,480
8. ~ <i>'fi OliotP 1,303.136 1.106,289 196.847 106,391 106,391 TotallNOri(ers tM 915,400 750,766 164,634 79.889 79.889
o/F 387,736 355.523 32.213 26.502 26.502
9. ..1a'lllfcl", <i>'fi <2lo/P 1,025.433 843,676 181,757 85,815 85.815 Main lNOi1<ers tM 816.528 660,430 156.098 73,832 73.832
ofF 208.905 183,246 25,659 11,983 11.983
(i)~ <2lotP 209.830 207,004 2,826 14.389 14,389 Cultivators tM 185,349 182,816 2,533 13,052 13,052
olF 24,481 24.188 293 1,337 1,337
(ii)~~ OliotP 134.360 131,882 2,478 8,563 8,563 Agrlculturallabourers tM 102,902 100,932 1,970 7,025 7,025
ofF 31,458 30,950 508 1,538 1,538
(iii) Qlf.lqlf.l'll ~ Cfilfi <2lotP 18,864 14,731 4,133 1,756 1,756 Household industry wori(ers tM 13.027 10,081 2,946 1.112 1,112
ofF 5,837 4,650 1,187 644 644
(iv)3l"'XI~ ~otP 662.379 490.059 172,320 61.107 61,107 Other lNOi1<ers ~M 515,250 366,601 148,649 52,643 52,643
ofF 147,129 123,458 23.671 8,464 8,464
10. ~<"1<t>I~<t> <i>'fi OliotP 277,703 262,613 15.090 20,576 20.576 Marginal wori(ers
~F 98.872 90.336 8.536 6.057 6,057
178,831 172.277 6,554 14.519 14,519
(i) ~ ",otP 60,114 59,786 328 6,047 6,047 Cu Itlvators
~ 17,627 17.490 137 1,509 1.509 ofF 42,487 42,296 191 4,538 4,538
(ii) ~~ <2lotP 95,803 94,711 1,092 7,543 7,543 Ag ricultural labou rers tM 27,504 27,195 309 1,891 1,891
ofF 68,299 67.516 783 5,652 5,652
(iii) ql~ql~<r>~~ UlolP 7,975 6,659 1,316 789 789 Household industry wor1<ers (t..M 1,782 1.454 328 114 114
ofF 6.193 5,205 988 6]5 675
(iv) 3RI~ OliotP 113.811 101,457 12,354 6,197 6,197 Otller lNOr1<ers ~M 51,959 44,197 7,762 2,543 2.543
ofF 61,852 57,260 4,592 3,654 3,654
11. -IR CI>'ff ~otP 2,098,037 1,688,002 410,035 177,576 177,576 Non·wor1<ers
~ 835,745 686,390 149,355 67,578' 67,578 o/F 1,262.292 1.001,612 260.680 109,998 109,998
20

<5-5 ¥ Gi'1't1MI 'i.6l ~ UliZlf¥l4J 'i1"'i.IUI'1I ~ - 2001 A- 5 DISTRICT PRIMARY CENSUS ABSTRACT OF TOTAL POPULATION - 2001
lfQ fWT 0002~ 0003~ Item Sex Matlan
ul4IoilRural ~rb8n
1. ~ CfIf fcl;:Jft. 1l I Area in Sq. Kms. 545.90 545.90 204.90 204.90
2. W<'I trftl:rR I Total households 52,449 52,449 21,987 21,987
3. W<'I ~ (~aIR "Zll0lP 265,392 265,392 105,906 105,906 ~~mim) tM 135,344 135,344 53,472 53,472 Total population (including institutional ofF 130,048 130,048 52,434 52,434 and houseless population)
4. o-63Wl~"l'Ilt~ "Zll0lP 43,205 43,205 15,812 15,812 Population in the age group 0-6
t~F 21,911 21,911 8,042 8,042 21,294 21,294 7,770 7,770
5,~~"l'Ilt~ molp 72,323 72,323 15,965 15,965 Scheduled Castes population tM 37,334 37,334 8,077 8,077
oIF 34,989 34.989 7,888 7,888
6. ~ "I'1"1lf<1.l'i <Cr ~ UlalP 91,262 91,262 51,011 51,011 Scheduled Tribes population tM 46,053 46,053 25,613 25,613
ofF 45,209 45,209 25,398 25,398
7. mllR malF' 118,930 118,930 49,029 49,029 Literates tM 73,492 73,492 30,469 30,469
ofF 45,438 45,438 18,560 18,560
8.~~ mOlP 106,642 106,642 43,356 43,356 Total workers tM 67,415 67,415 26,130 26,130
ofF 39,227 39,227 17,226 17,226
9. ahht> I R;!<t> <Iilff molP BO,561 80,561 33,460 33,460 Main worken. tM 57,989 57,989 21,939 21.939
ofF 22,572 22,572 11,521 11,521
(i)~ ClfolF' 15,020 15,020 2,557 2,557 Cultivators tM 12,745 12,745 2.161 2.161
ofF 2,275 2,275 396 396
(ii)~~ moiP 8,962 8.962 1.443 1.443 Agricultural labourers tM 7,097 7,097 1,200 1,200
ofF 1,865 1,865 243 243
(iii) ql~ql~4l ~ '<t>'ff ClfoiP 911 911 . 320 320 Household industry WOrkBrs tM 642 642 243 243
ofF 269 269 77 77
(iv) 3l"'X! ~ <2ToiP 55,668 55,668 29,140 29,140 Other workers tM 37,505 37,505 18,335 18,335
ofF 18,163 18,163 10,805 10,805
10. ::stt"l4l,R;tq; ~ ClfO/P 26,081 26,081 9,896 9,896 Marginal workers tM 9,426 9,426 4,191 4,191
ofF 16,655 16,655 5.705 5,705
(0 ~ <2ToiP 3,901 3,901 1,024 1,024 Cultivators
~F 1,208 1,208 389 389 2,693 2,693 635 635
(ii) ~~ C2ToiP 8,821 6,821 1,294 1,294 Agricultural labourers ~F 2,654 2,854 533 533
5,967 5,967 761 761
(iii) ql~q,~q; ~'<t>1ff nrolP 410 410 160 160 Household industry worl<.ers tM 133 133 50 50
o/F 277 277 110 110
(iv) ;wq '<t>'ff ~oiP 12,949 12,949 7,418 7,418 Other workers tM 5,231 5,231 3,219 3,219
ofF 7,718 7,718 4,199 4,199
11. fR <t>lff C2TolP 158,750 158,750 62,550 62,550 Non-workers ~M 67,929 61.929 27.342 27,342
ofF 90,821 90,821 35,208 35,208
21

q;-5 ~ "" .... 't'iillSoUl C6l ~ 1:IIltIflfCb "" ..... ,u ..... , ~ -2001 A.5 DISTRICT PRIMARY CENSUS ABSTRACT OF TOTAL POPULATION· 2001
~ 1Wr 0004~ 0005 "11<:lfllile
Item Sex Nagrakata Madarlhat m>rrrotal 1I,41uuRural ~rban mwrotal lI,afluURural ",·,;fIlI/Urban
1. ~ cpt f*At. ~ I Area in Sq. Kms. 397.48 397.48 376.76 376.76
2. W<'f ~ , Total households 22,791 22,791 36,467 36,467
3.W<'f~(~~ C<l0IP 115.907 115,907 185,470 185,470 ~~~) t~F 58,790 58,790 94,278 94,278 Total population (Including Institutional 57,117 57,117 91,192 91,192 and houseless popUlation)
4. 0-6 W!~qft~ <ZIolP 18,112 18,112 29,744 29.744 Population in Ule age group o-a tM 9,112 9,112 15,091 15,091
ofF 9,000 9,000 14,653 14,653
5.~~<$t~ <ZI.!P 13,777 13,777 25,996 25,996 Scheduled Castes population tM 7,021 7,021 13,194 13,194
ofF 6,756 6,756 12,802 12.802
6.~WI~qft~ C<l0lP 57,325 57.325 61.252 61,252 Scheduled Tribes population tM 28,914 28,914 30,900 30,900
ofF 28,411 28,411 30,352 30,352
7.m~ "&taIP 47,421 47,421 84,369 84,369 Litarates tM 29,900 29.900 51.315 51.375
ofF 17.521 17,521 32,994 32,994
8. ~ q;1ff <ZIolP 46,227 46.227 70.506 70,506 Total workers tM 27,409 27,409 45,460 45,460
ofF 18,818 18,818 25.046 25,046
9, ~tlipllBcp ~ '&Io/P 34,170 34,170 55,336 55,336 Main workers tM 22,227 22.227 39,107 39,107
ofF 11.943 11,943 16.229 16,229
(i)~ '&IaIP 3.788 3.788 1,501 7,501 Cultivators
~ 3,011 3,011 6.347 6.347 ofF 771 771 1,154 1,154
(ii)~~ "&taIP 2,547 2.547 2,991 2.991 Agricultural labourers
t~F 1,915 1,915 2.096 2,096 632 632 895 895
(iii) ql~qIRq; ~ <I>'ff '&!alP 270 270 577 577 Household industry ~rkers
~F 194 194 416 416 76 76 161 161
(iv) 3RI <I>'ff l2I'aIP 27,565 27,005 44,267 44,267 Other workers
~ 17.101 17,101 30,248 30,248 ofF 10,464 10,464 14.019 14.019
10, 31t'<i<t>lfClqs 'If>Ifi '&!alP 12.057 12,057 15.170 15,170 Marginal workers
~F 5.182 5,182 6,353 6,353 6,a75 6,875 8,817 8,817
(i) ~ '&!alP 1,254 1,254 1,339 1,339 Cultivators
~F 522 922 440 440 732 132 899 899
(ii) ~~ '&IolP 2.923 2,923 2,953 2,953 Agricultural labourers
~F 1,291 1,291 1.103 1.103 1,632 1,632 1.850 1,850
(iii) qIR<lI~cp ~ <Plff '&!alP 112 112 213 213 Household industry workers
t~F 51 51 102 102 61 61 111 111
(iv) 3Rl~ ClIoIP 7,768 1,768 10,665 10,665 Other WOrkers tM 3.318 3.318 4,708 4,708
ofF 4,450 4,450 5,957 5.957 11. -IR' <I>'ff "&taIP 69,680 69.680 114,964 114.964
NOl1-workers
t~F 31,381 31,381 48,818 48.818 38,299 38.299 66,146 66.146
22
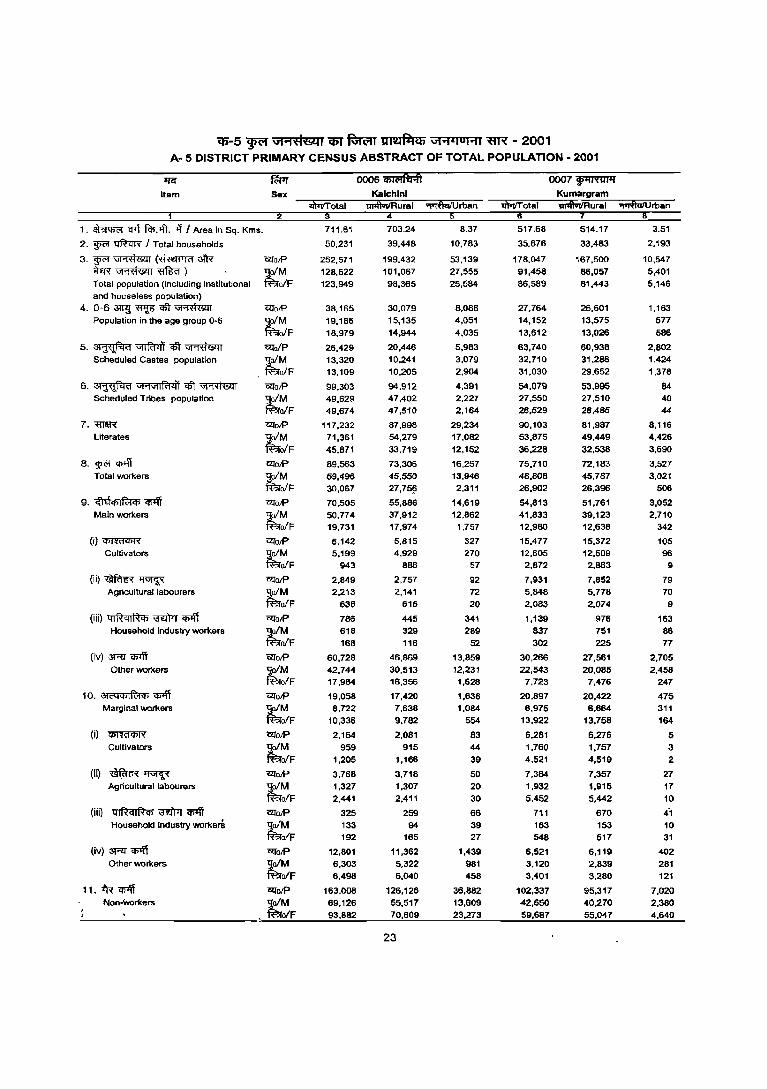
<1)-5 ~ Gt ... +i&:ll q;y ~ Ulet~Cfi Gt ... ·IUI .... 'l'I'R - 2001 A- 5 DISTRICT PRIMARY CENSUS ABSTRACT OF TOTAL POPULATION - 2001
"JfCl"
Item Sex
ooos'ilffi'ifiift Kalchlnl
0007~
Kumargram "I'!fiiiIIJrban 1l);TITotai 1l1dIViIRurai ~rban
,. ~ CI"'t ftI>.-.ft. Tf I Area in Sq. Kms.
2. ~ ~ J Total households
3.~~(~W ~~~) Total population (including institutional and houseless population)
4. 0-6 ~ 'fI1i6 ct\T ~ Population in the age group 0-6
5,~~ct\T~ Scheduled Castes population
6, ~ Gj.NIIRI<i'i ctIt ~ Scheduled Tribes population
7.~
Literates
8.~~ Total workel'$
9, <fiEhf>IR:i<t> <'fi1ff Main workers
(i)~
Cultivators
(ii)~~ Agricultural labourers
(iii) qlRqlR<t> ~ ~ Household industry workers
(iv)~~ Other workers
10. 31641PIi'<1<t> '<t>'fi Marginal workers
(i) <Pm!<t>R Cultivators
(ii)~~ Agricultural labourers
(iii) ql~qIR", ~ q;1ff Household industry workerS
(iv) 3RT'<t>'fi Other workers
11.~~ Non-Workers
CZfotP '9;oIM ~oIF
CZfotP SoiM ~o/F
CZfolP SoiM ff?ro/F
CZfotP ~oIM ~oIF
CZfolP SoiM ~o/F CZlolP 'loiM ~oIF
CZfolP SoiM ~oIF
CZfotP SolM taolF
l2!otP SoIM ~oIF
CZfotP So/M ~oIF CZfotP
~F CZfotP SoIM fB;rolF
ClTotP ~oIM faolF
CZfotP SoIM fao/F
l2!otP ~oIM ~o/F
l2!otP '!101M ~oIF
l2!olP '!101M ~oIF
711.61
50.231
252,571 128,622 123,949
38,165
19.186 18,979
26,429 13.320 13,109
99.303 49.629 49.674
117.232 71,361 45,871
89,563
59.496 30.067
70.505 50,774 19.731
6.142 5.199
943
2.849 2,213
636
786 618 168
60.728 42.744 17,984
19,058 8,722
10.336
2,164 959
1,205
3,766 1.327 2,441
325 133 192
12,801 6,303 6,498
163,008 69,126
93.882
703.24
39.448
199,432 101,067 98,365
30.079 15,135 14,944
20,446 10,241 10.205
94,912 47,402 47,510
87,998 54,279 33,719
73,306 45,550 27,75l?
55,886 37,912 17,974
5,815 4.929
886
2,757 2.141
616
445 329 116
46.869 30,513 16.356
17,420 7,638 9,782
2,081 915
1,166
3,718 1,307 2.411
259 94
165
11,362 5.322 6,040
126.126 55,517 70,609
23
8.37
10.783
53.139 27,555 25.584
8.086 4,051 4.035
5.983 3,079 2,904
4,391 2,227 2,164
29,234 17,082 12,152
16.257 13,946
2,311
14,619 12.862
1,757
327 270
57
92 72
20
341 289
52
13.859 12,231
1.628
1,638 1,084
554
83 44
39
50 20 30
66 39 27
1,439 981 458
36,882 13,609 23.273
517.68
35.676
178.047 91,458 86.589
27.764 14,152 13,612
63.740 32,710
31.030
54.079 27.550 26,529
90,103 53.875 36,228
75.710 48,608 26.902
54.813 41.833 12.980
15,477 12,605
2,872
7.931 5.648 2.083
1,139 837 302
30.266 22,543
7.723
20,897 6.975
13.922
6.281 1,760 4.521
7.384 1,932 5.452
711 163 548
6.521 3.120 3.401
102.337 42.650 59.687
514.17
33.483
167.500 86,057 81,443
26.601 13,575 13,026
60.938 31.286 29.652
53.995 27.510 26.485
81.987 49,449 32,538
72.183 45,787 26.396
51,761 39,123 12,638
15,372 12,509
2.863
7.852 5.778 2.074
976 751 225
27.561 20.085
7.476
20.422 6.664
13.758
6.276 1.757 4.519
7.357 1.915 5,442
670 153 517
6.119 2,839
3.280
95.317 40.270 55,047
3.51
2,193
10.547 5,401 5.146
1,163 577 586
2,802 1,424 1.378
84 40 44
8.116 4,426
3.690
3.527 3.021
506
3.052 2.710
342
105 96
9
79 70
9
163 86 77
2.705 2.458
247
475 311 164
5 3 2
27 17 10
4'1
10 31
402 281 121
7.020 2.380 4.640
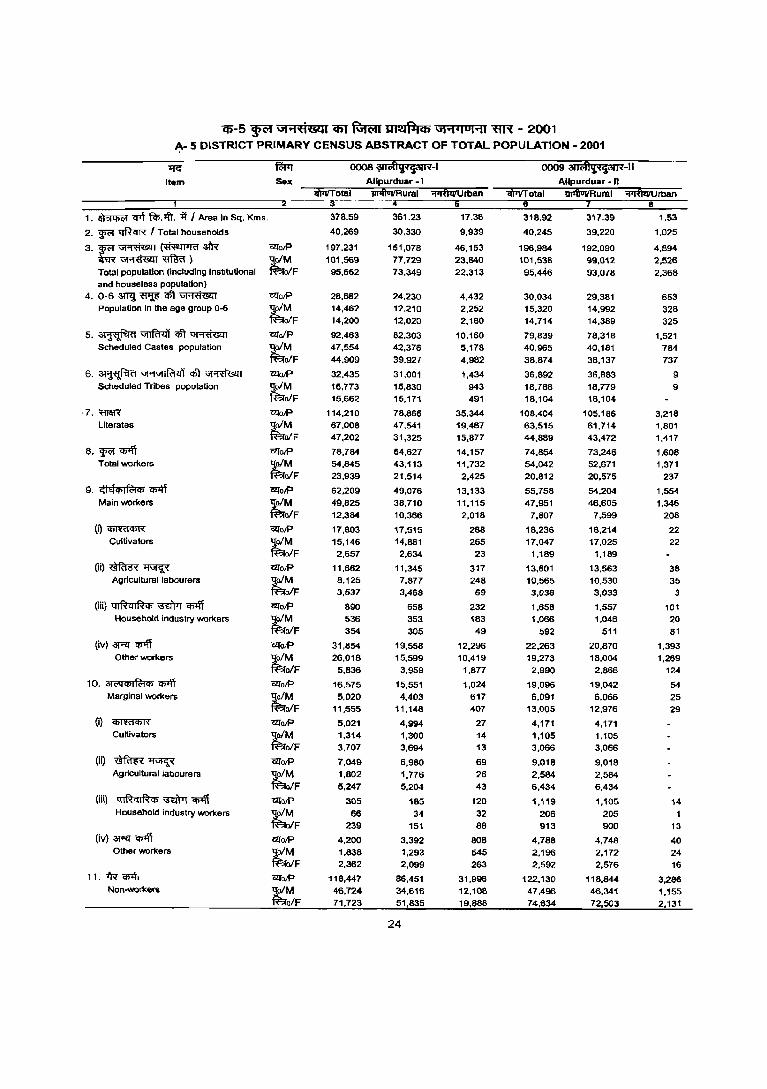
cp-s ~ \1I"'I't1Gt1I CIiI ~ llitolfli(f) \11"'1-1 0 1"'11 "ffR - 2001 A- 5 DISTRICT PRIMARY CENSUS ABSTRACT OF TOTAL POPULATION· 2001
-q;:
Item
0009 311(4'j~~'i3l1\l-1I AHpurduar • II
lI)ii(fotal '!JIlfiUiIRuml "'"I11fuiIUrban
1. ~ ~ ~.1fi. 111 Area In Sq. Kms.
2. ~ ~ I Total househOlds
3·Ff~~afR ~~~) Total population (including institutional and house less population)
4. 0-6 3W.l ~ <1ft ~ Population In the age group 0-6
5.~~<Ift~ Scheduled Castes population
6. ~ "I'1\11IRi~~ ~ ~ Scheduled Tribes population
·7.mm Literates
8. ~ q;iff Total workers
9. '!hflfi I ~Cjj "(filff Main workers
(i)~
Cultivators
(ii)~~ Agricultural labcurers
(iii) qlRqlRIfi ~ <n1ff Household industry workers
(iv) aRT CffIff Other workers
10. 3l('qlfil~Cjj Cf>Iff Marginal workers
(0 <I>1Tc'fCIffi Cultivators
(iQ~~ Agricultural labcurers
(iii) ql~ql~Cjj ~ q;iff Household industry wor1<ers
(iv) aRT CffIff Other workers
11. -Iff <1>4, Non-workers
C21o1P "9;o/M taoiF "&!oIP "9;oIM taoiF C2lOlP -go/M taoiF C21o1P -go/M taoiF C2101P
~oIM taoiF "&!oJP -goiM taoiF ClIoJP -goiM taoiF C210JP -goiM taoiF i'2l"oJP
~oIM taoiF "&!oJP -goiM taoiF C210JP -goiM taoiF C210lP -goiM taoiF C210tP "9;o/M taoiF <Z{olP
~oIM taoiF i'2l"olP -goiM taoiF "&!otP -s;oIM taoiF
378.59
40,269
197,231 101,569
95,662
28,662
14,462 14,200
92,463 47,554
44,909
32,435
16,773 15,662
114,210 67,008
47,202
78,784 54,845 23,939
62,209
49,825 12,384
17,803 15,146 2.657
11,662 8,125
3.537
890 536
354
31.854 26,018
5.836
16.575
5.020 11.555
5,021 1,314
3.707
7.049 1,802
5.247
305
66 239
4.200 1,1338 2.362
118,447
46.724 71,723
361.23
30,330
151.078 77.729 73.349
24.230 12.210 12,020
82,303 42,376
39.927
31.001
15,830 15,171
78,866 47.541 31,325
64,627 43.113
21.514
49.076
38.710 10,366
17,515 14,881
2,634
11,345 7,877 3,468
658 353
305
19,558 15,599
3,959
15,551 4,403
11,148
4,994 1,300 3,694
6.980 1,776
5.204
165
34 151
3,392 1,293 2,099
66,451
34.616 51,835
24
17.36
9.939
46.153 23,840
22,313
4.432
2.252 2,180
10,160 5,178 4,982
1,434
943 491
35,344 19,467
15,877
14,157 11,732
2,425
13,133
11,115 2,018
286 265 23
317 248 69
232 183
49
12,296 10,419
1,877
1,024
617 407
27 14 13
69 26
43
120
32 88
808 545 263
31,996 12.108
19,886
318.92
40.245
196.984 101.538
95.446
30.034 15,320 14,714
79.839 40,965
38.874
36,892
18,788 18,104
108,404 63,515 44,889
74,854 54,042
20.812
55.758 47,951
7,807
18,236 17,047
1.189
13,601
10,565 3,036
1,658 1,066
592
22.263 19.273
2,990
19,096 6,091
13,005
4.171 1.105 3.066
9.018 2,584 6,434
1,119
206 913
4,788 2,196
2,592
122.130 47.496 74,634
317.39
39,220
192,090
99.012 93,078
29,381 14,992 14,389
78,318 40,181 38,137
36,883
18,779 1B,104
105,186 61,714 43,472
73,246 52,671 20,575
54,204
46,605 7,599
18,214 17,025
1.189
13,563 10,530 3,033
1,557
1.046
511
20,870 18,004
2,866
19,042
6.066 12,976
4,171 1,105 3,066
9,018
2,584
6.434
1,105
205 900
4,748
2.172 2.576
118,844 46,341
72,503
1.53
1,025
4,894
2,526
2,368
653
328
325
1,521 784 737
9 9
3,218 1.801 1,417
1.608 1,371
237
1,554
1,346 208
22 22
38 35
3
101 20
81
1,393 1,269
124
54 25
29
14
1 13
40 24
16
3,286 1,155 2,131
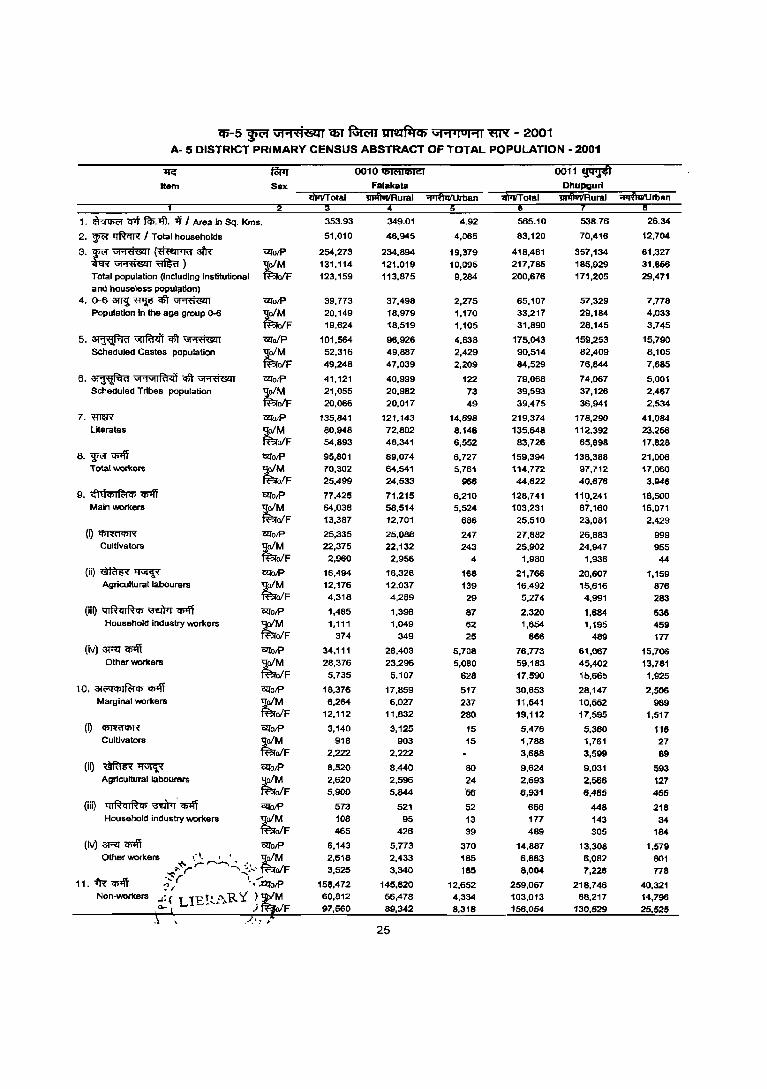
q;-5 ~ \iI'1'tt'&J1 C5T ~ MelfliCb G'I'1.I UI'1I ~ - 2001 A- 5 DISTRICT PRIMARY CENSUS ABSTRACT OF TOTAL POPULATION - 2001
lfG ~ 0010 i6ldliblel 0011 ijtiiJ.it Item Sex FaJakata
iii1iIT alai 1ilift1IiIRurai "i1i6iI'iJrban iliiliTotal
1 < ~ cpt ~< 1ft. Ti I Area in Sq. !<ms, 353.93 349.01 4.92 565.10 538.76 26.34
2. ~ ~ I Total households 51,010 46,945 4,065 83,120 70,416 12,704
3.~~~3fR' ezrolf' 254,273 234,894 19,379 418,461 357,134 61,327 'l\<R~~) tM 131,114 121,019 10,095 217,785 185,929 31,856 Total population (Including institutional alF 123,159 113,875 9,284 200,676 171,205 29,471 aml housele55 popul;ltlon)
4. 0-6 amj ~ q!T ~ ezrolf' 39,773 37,498 2,275 65,107 57,329 7,778 Population In the age group 0-6 tM 20,149 18,979 1,170 33,217 29,184 4,033
alF 19,624 18,519 1,105 31,890 28,145 3,745
5.~~qft~ ezrolP 101,564 96,926 4.638 175,043 159,253 15,790 SCheduled Castes population ~M 52,316 49,887 2,429 90,514 82,409 8,105
alF 49,248 47,039 2,209 84,529 76,844 7,685
6. ~ VI"VlI~<l1 qft ~ C2lolf' 41,121 40,999 122 79,068 74,067 5,001 Scheduled Tribes population tM 21.055 20,982 73 39,593 37,126 2.467
oIF 20,066 20,017 49 39,475 36,941 2,534
7.mm C2loIP 135,841 121,143 14,698 219,374 178.290 41,084 Literates ~M 80.948 72,802 8,146 135,648 112,392 23.256
oIF 54,893 48,341 6,552 83,726 65,898 17,828
8. w<" <Iilff CZfolP 95,801 89,074 6,727 159,394 138,388 21,006 Total workelll ~~F 70,302 64,541 5,761 114,772 91,712 17,060
25,499 24,533 966 44,622 40,676 3,946
9. ,MCf5lfdCf5'Cf51ff CZfolf' 77,425 71,215 6,210 128,741 119,241 18,500 Main workers tM 64,038 58,514 5,524 103,231 87,160 16,071
oIF 13,387 12,701 686 25,510 23,081 2,429
(Q "ifimIC!>R C2lolf' 25,335 25,088 247 27,882 26,883 999 Cultivators tM 22,375 22,132 243 25,902 24,947 955
ofF 2,960 2,956 4 1,980 1,936 44
(iO~~ "!2lolf' 16,494 16,326 168 21,766 20,607 1,159 Agricultu ral labourers ;tM 12,176 12,037 139 16,492 15,616 876
ofF 4,318 4,289 29 5,274 4,991 283 (iiQ qlfhlRIf) ~ q;1fi CZfolf' 1,485 1,398 87 2,320 1,684 636
Household industry wor1<ers
t~F 1,111 1,049 62 1,654 1,195 459 374 349 25 666 489 177
(iv)~'Cf51ff czrotP 34,111 28,403 5,708 76,773 61,067 15,706 Other wor1<ers ;tM 28,376 23,296 5,080 59,183 45,402 13,781
alF 5,735 5,107 628 17,590 15,665 1,925 10, at('qIf)I~1f) ~ GlloiP 16,376 17.859 517 30,653 28,147 2,506
Marginal wor1<ers ;tM 8,264 6,027 237 11,541 10,552 989 ofF 12,112 11,832 280 19,112 17,595 1,517
(0 ~ <2loiP 3,140 3,125 15 5,476 5,360 116 Cultlvator& tM 918 903 15 1,788 1,761 27
alF 2,222 2,222 3,688 3,599 89
(ii) ~~ CZfotP 8.520 8,440 80 9,624 9,031 593 Agricultural labourers tM 2,620 2,596 24 2,693 2,566 127
ofF 5,900 5,844 '56 6,931 6,465 4156
(iii) ql~qlRIf) ~. Cfi1ff CZfotP 573 521 52 666 448 218 Household industry workelll tM 108 95 13 177 143 34
ofF 465 426 39 489 305 184 (Iv) 3R~ <2loiP 6,143 5,773 370 14,887 13,308 1,579
Other wor1<er& \' I, " tM 2,618 2,433 185 6,883 6,082 801 ,,~~,-..---......:., '~:". alF 3,525 3,340 185 8,004 7,226 778
11, 'IR <Iilff '~r 1. /~ 156,472 145,820 12,652 259,067 218,746 40,321 ?I '. Non-wor1<ers ,4:( Ll£!~j'~.RY' ) M 60,812 56,478 4,334 103,013 88,217 14,796
"'- - ) F 97,660 89,342 8,318 156,054 130,529 25,525
25

<1>-5 WC' "i1"'"ifiil.clIl 'ifil ~ ~ \i!"i·IOHI ~ - 2001 A- 5 DISTRICT PRIMARY CENSUS ABSTRACT OF TOTAL POPULATION - 2001
~ farr 0012~ 0013 "I<ijq 1~1'fl Item Sex Jalpalgurl
m.ftvT!Rural ~rban
1. ~ <I't f<I>.-.fi. -if I Area in Sq. Kms. 530.60 518.22 12.38 500.65 500.65
2. ~ ~ I Total households 58,804 ~,738 6,066 57,587 57,587
3.~~(~af'R OllalP 281,700 254,594 27.106 280,927 280,927 ~~~) tM 145,603 131,720 13,883 145,272 145,272 Total population (including institutional oIF 136,097 122,874 13,223 135,655 135,655 and houseless populatlon)
4. 0-6~~1Iit~ UfolP 43,Bl0 40,581 3,229 44,940 44.940 Population in the age group 0-6 tM 22,231 20,606 1,625 22,972 22,972
ofF 21,579 19,975 1,604 21,968 21,966
5.~~<t'I~ Ufo/P 199,529 189,926 9,603 110,394 110,394 Scheduled castes population t~ 103,023 98,117 4,906 87,624 87,824
96,506 91,809 4,697 82,570 82,570
6, ~ \iI.,\il1f?l41 ~~. OlloJP 3,545 3,381 164 16,774 16,774 Scheduled Tribes population tM 1,842 1,766 76 8,516 8,516
oIF 1,703 1,615 88 8,258 8,256
7, 'ffi!ff'!' OllolP 157,461 137,414 20,047 154,112 154,112 Literates tM 94,600 83,620 10,980 92,722 92,722
oIF 62,861 53,794 9,067 61,390 61,390
8. WQf <I>Iff OllaJP 111,105 102,232 8,873 120,111 120,111 Total workers t~ 81,010 73,588 7,422 81,501 81,501
30,095 28,644 1,451 38,610 38,610
9. {lE\"'I~q; <I>Iff OllolP 84,407 76,587 7,820 85,364 85,364 Main workers tM 73,589 66,715 6,874 10,597 10,597
ofF 10.818 9,872 946 14,767 14.767
(i)~ OllolP 32.591 32,100 491 22,762 22,762 Cultivators tM 29,271 28,814 457 20,257 20,257
oIF 3,320 3,286 34 2,505 2,505
(ij)~~ OllalP 17,082 16,823 259 18,103 18,103 Agricultural labourers tM 13,609 13,576 233 14,044 14,044
oIF 3,273 3,247 26 4,059 4,059
(iii) ql~ql~q; '3"dI>T 'q;1ff 'UfoJP 2,131 1,982 149 2,197 2,197 HousehOld Industry workers ~M 1,378 1,270 108 1,481 1,481
ofF 753 712 41 716 716
(iv) aRf ~ ~IP 32,603 25,682 6,921 42,302 42,302 Other workers ~M 29,131 23,055 6,076 34,815 34,815
oIF 3,472 2,627 845 7,487 7,487
10, 3t<"lC6If<;1q; lI>lff 'UfolP 26,698 25,645 1,053 34,747 34,747 Marginal workers ~M 7,421 6,873 548 10,904 10,904
oIF 19,277 18,772 505 23,843 23,843 (i) ~ 'lSlI'oJP 9,427 9,381 46 10,833 10,833
Cultivators ~M 2,175 2,158 17 3,523 3,523 ofF 7,252 1,223 29 7.310 7,310
(iO ~~ 'lSlI'oJP 11,606 11,413 193 15,220 15,220 AgrtculturallatlOurers ~M 2,682 2,631 51 4,148 4,148
oIF 8,924 8,782 142 11,012 11,072 (iii) 1I1~ql~q;~~ 'UfolP 947 839 108 948 948
Household industry workers tM 153 139 14 141 141 oIF 794 700 94 807 807
(iv) aRf"ll>l'lt 'UfolP 4,718 4,012 706 7,746 7,746 Other ...::>rkers ~M 2,411 1.945 466 3,092 3,092
oIF 2,307 2,067 240 4,654 4,654 1 i. i'R q;-.ff 'lSlI'oIP 170,595 152,362 18,233 160,816 160,816
Non-workers ~M 64,593 58,132 6,461 63,771 63,771 oIF 106,002 94,230 11,772 97,045 91,045
26
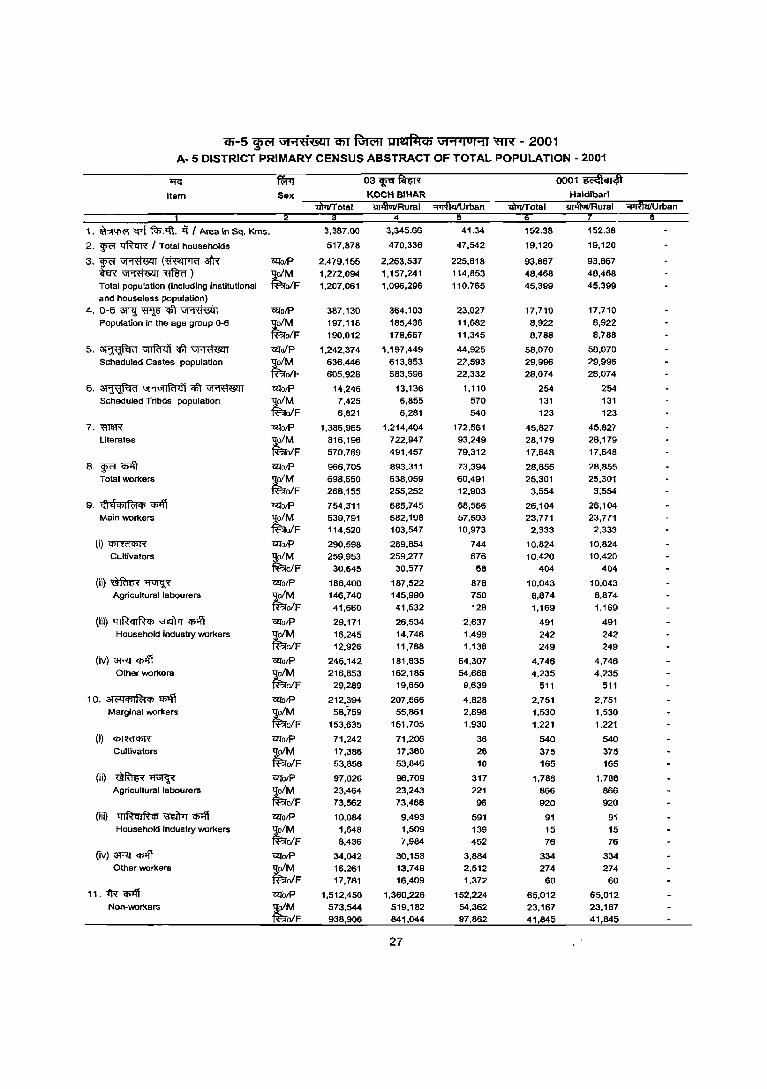
Qj"-5 ~ U1'1t1&l1 em Rirm ~ U1'1'IOI'1I "flN - 2001 A- 5 DISTRICT PRIMARY CENSUS ABSTRACT OF TOTAL POPULATION - 2001
'qG
Item
1. ~ <M ~:4'!. ~ I Area in Sq. Kms.
2. ~ ~ I Total households
3.~~(~atR ~~~) Total population (including institutional and house less population)
4. 0-6 3ITlj ~ Cjj'r ~ Population in the age group 0-6
5.~~~~ Scheduled Castes population
6. ~ \jj;j\jfIR'llj'i mt ~ Scheduled Tribes popUlation
7.~
Literates
8. WC'I ~ Total workers
9. <ftf\tj}If<:\q; ~ Main workers
(i)~
Cultivators
(ii)~~ Agricultural labourers
(iii) Q11141ih, ~ <J>4T Household industry workers
(iv) 3RJ~ Other workers
10. 31('Qq;If<:1q; ~ Marginal workers
(i)~
Cultivators
(ii)~~ Agricultural labourers
(iii) QI114111 en \'fEitrr <J>4T Household industry workers
(iv) 3RJ~ Other workers
11. 1R <Plff Non-workers
"&foiP
llolM taolF
UfoiP
llo/ M tao/F Ufu/P '9;o/M tao/F Ufo/P ~o/M taolF OlioiP '9;o/M tao/F UfO/P
'9;o/M taolF OliO/P
~o/M tao/F OliO/P
~o/M ~oIF UlotP '9;oIM taolF OliO/P '9;o/M taolF mO/P '9;o/M ~oIF
OliotP ~o/M tao/F mO/P
~oIM taolF C2l'o/P '9;o/M tao/F C2l'otP ~o/M taolF motP '9;oIM taolF C2l'oiP
llolM taolF
3,387.00
517,878
2.479.155 1,272,094 1,207.061
387.130 197,118
190,012
1,242,374 636,446
605.928
14.246
7.425 6,821
1.386,965 816,196
570.769
966.705
698.550 268,155
754,3"11 639,791 114,520
290,598
259.953 30,645
188,400 146,740
41,660
29,171
16.245 12,926
246.142 216,853
29,289
212,394 58,759
153.635
71.242
17,386 53,856
97,026 23,464 73,562
10.084 1,648 8,436
34,042 16,261 17.781
1,512,450
573.544 938,906
03 <J1'fI' t.l'irii KOCH BIHAR
"iii4OlIRural 4
3,345.66
470,336
2,253,537 1,157,241 1,096,296
364,103 185,436 178,667
1,197,449
613,853
583.596
13,136 6,855 6,281
1,214,404 722,947
491,457
893,311
638,059 255,252
685,745 582,198 103,547
289,854 259,277
30,577
187,522 145,990
41,532
26,534
14,746 11,788
181,835 162.185
19,650
207,566 55,861
151,705
71.206
17,360 53,846
96,709 23,243 73,466
9,493 1,509
7,984
30,156 13,749 16.409
1,360,226 519.182 841,044
27
41.34
47,542
225,618 114,653 110,765
23,027 11,682 11,345
44,925 2?,593
22.332
1.110 570
540
172.561 93,249
79,312
73.394
60,491 12,903
68,566 57,593 10,973
744 676
68
878 750
128
2,637 1,499 1,138
64,307 54,668 9,639
4,828 2.898
1,930
36
26 10
317 221
96
591 139 452
3,884 2,512 1,372
152,224
54,362 97,862
152.38
19,120
93,867 48,468
45,399
17,710
8,922 8,788
58,070
29,996 28.074
254 131
123
45,827 28,179
17.648
28,855 25,301
3,554
26,104 23,771
2.333
10,824
10.420 404
10,043
8,874 1,169
491
242 249
4,746 4,235
511
2,751
1,530 1,221
540
375 165
1,786 866 920
91 15 76
334 274
60
65.012 23,167
41,845
0001m Haldlbarl
iIfIIlUiIRural :;pjffujiUrban
152.38
19,120
93.B67 48,466
45,399
17,710
8,922 8,7S8
58,070 29.996 28,074
254 131 123
45.827 28,179
17.648
28.855 25,301
3;554
26,104 23,771
2,333
10,824
10.420 404
10,043 8,874 1,169
491
242 249
4,746 4,235
511
2,751 1,530
1.221
540
375 165
1,786 866
920
91 15 76
334 274
60
65,012 23.167 41,845

i6"-5 ~ vt""l'<1it.«Q1 i6"T ~ UI~~Cb vt""l'IOI""li ~ - 2001 A- 5 DISTRICT PRIMARY CENSUS ABSTRACT OF TOTAL POPULATION· 2001
1lG ~ 0002 ii<6C'll *,1 0OO3~-1
Item Sex Meldlganj Mathabhanga - I >WTITotal UI41atlRural lJl>ftatlRural ~rban
1. ~ qof ftf;:4t. ~ I Area In Sq. Kms. 302.07 302.07 319.39 319.39
2. 'WR ~ I Totall1ousel1olds 28,579 28,579 40.083 40,083
3.'WR~(~~ ~olP 133,275 133,275 186,658 186,658 W~~) tM 69,063 69,063 96.005 96,005 Total population (including Institutional oIF 64,212 64,212_ 90,653 00,653 and l10useless population)
4. 0-6 arrg ~ ctt ~ ClfO/P 22,627 22,627 31,561 31,561 Population in the age group 0-6 tM 11.556 11,556 16,104 16,104
oIF 11,071 11,071 15,457 15,457
5.~~q\t~ ClfolP 95,200 95.200 127,931 127,931 Scheduled Castes population tM 49,094 49,094 65,817 65,817
oIF 46,106 46,106 62,114 62.114
6. ~ \iI"1U1IRtll'i q\t ~ CZfoiP 1,688 1,688 64 64 Scheduled Tribes population tM 898 898 38 38
oIF 790 790 26 26
7. miff' ClfoiP 67,064 67,064 93,429 93,429 literates tM 41,600 41,600 57,574 57,574
o/F 25,464 25,464 35,855 35,855
8. 'WR 'Cl>'ff ClfolP 50.121 50.121 85,113 85,113 Total workers tM 38,131 38,131 56,105 56,105
oIF 11,990 11,990 29,008 29,008
9. ","iej<lill=a <Ii 'I>'1l CZfoiP 40.069 40.069 63,319 63,319 Main workers tM 35,378 35,378 50,918 50,918
oIF 4.691 4.691 12,401 12.401
(i)~ ClfoiP 20,085 20,085 33,180 33,180 Cultivators tM 18,490 lB,490 26,766 26,766
oIF 1,595 1,595 6,414 6,414
(ii)~~ CZfolP 10,741 10,741 16,108 16,108 Agricultural labourers tM 8,726 8,726 11.625 11,625
o/F 2.015 2.015 4,483 4,483
(iii) QIRQIR<b ~ ~ CliolP 332 332 474 474
Household industry workers tM 224 224 283 283 oIF 108 108 191 191
(iv)aRr~ CZfolP 8,911 8,911 13,557 13,557 Other workers t~F 7,938 7,938 12.244 12,244
973 973 1,313 1.313
10. ¢t<'4<bIf<;t<b '<blff ~ 10,052 10.052 21.794 21,794 Marginal WOrkers tM 2.753 2,753 5,187 5,187
oIF 7,299 7,299 16,607 16,607
(il ~ CliolP 4,564 4,564 11.504 11.504 Cultivators tM 948 948 2,762 2,762
o/F 3,616 3,616 8.742 8.742
(ii) ~~ CZfO/P 4.383 4,383 7,498 7.498 Agricultural labourers tM 1.227 1,227 1.328 1,328
oIF 3,156 3,156 6,170 6,170
(iii) q I n q IRq; \3'EI)rr 'IJ1\l CZfolP 71 71 295 295 Household industry workers tM 20 20 34 34
oIF 51 51 261 261
(iV) 3l'O;Q' <!i1fi "12WiP 1.034 1.034 2.497 2.497 Other workers ~M 558 556 1,063 1,063
oIF 476 476 1,434 1,434
11. "R q;aff CQ'oiP 83,154 83.154 101,545 101,545 Non-workers tM 30,932 30,932 39,900 39,900
oIF 52,222 52.222 61.645 61.645
28

q;-5 ~ Gl""lflMI i6J ~ Ull1lfliCb 1JI""I410 1""l1 ~ - 2001 A- 5 DISTRICT PRIMARY CENSUS ABSTRACT OF TOTAL POPULATION - 2001
lfC:" ~ 0004~-11 0005 'ifif.i r.tiR-1
Item Sex
1. ~ crt frl>.lft. Ti I Area in Sq. Kms. 309.99 309.99 361.17 352.27 8.90
2. ~ '!J'ftcrR I Total households 39,900 39,900 59,179 53,557 5,622
3.~~(~3fR 'C2l"otP 196,346 196.346 284,615 258.481 26.134
~~~) tM
100.948 100,948 146,361 133,094 13,267
Total population (including institutional ofF 95,398 95,398 138,254. 125,387 12,867
and houseless population) 4. 0-6 3Wl ~ qft ~ 'C2l"otP 32,204 32.204 44,871 42.045 2.826
Population in the age group 0-6 tM
16.271 16,271 22,973 21.520 1,453
ofF 15,933 15,933 21,898 20.525 1,373
5.~~qft~ 'C2l"o/P 12B.386 128,3B6 115,355 111,326 4,029
Scheduled Castes population tM
65,951 65,951 59,354 57,287 2,067
ofF 62,435 62,435 56,001 54,039 1,962
6. ~ VI'1V1IRl41 <ill ~ 'C2l"otP 2,329 2,329 1,090 980 ' 110
Scheduled Tribes population tM
1.180 1,180 562 508 54
ofF 1,149 1,149 528 472 56
7.~ 'C2l"otP 110,630 110,630 160,489 141,372 19,117 Literates
tM 66,282 66,2B2 94,264 83,81B 10,3B6
ofF 44,348 44,348 66,225 57,494 B,731
8. ~ <IPff 'C2l"o/P 78,152 78,152 99,667 91,320 8,347 Total workers
tM 55.999 55,999 77.841 71.185 6,656
ofF 22,153 22,153 21,826 20,135 1,691
9. <fI Q ¢ I ffi1 <h '<J>lfi 'C2l"olP 59,423 59,423 83.523 75,904 7,619
Main workers ~M 51,121 51,121 71.930 65,73B 6,192
ofF 8,302 8,302 11,593 10,166 1,427
(i)~ 'C2l"olP 25,874 25,874 2B.229 28.187 42
Cultivators ~M 23,887 23,887 26,330 26,292 38 ofF 1,987 1.987 1.899 1.895 4
(ii)~~ 'C2l"otP 16,551 16.551 18.153 18.068 85 Agricultural labourers
tM 12.251 12,251 14,277 14,195 82
ofF 4,300 4,300 3,B76 3,873 3
(iii) ql~ql~¢ ~ q;>ff 'C2l"otP 2,142 2,142 5.077 4,575 502 Household industry workers tM 1,723 1,723 2,432 2,229 203
blF 419 419 2,645 2,346 299
(iv) aRl '<J>lfi GlTotP 14,856 14.856 32.064 25,074 6.990
Other workers tM 13,260 13,260 28,B91 23,022 5,B69
ofF 1,596 1,596 3,173 2,052 1,121
10. 31<'4¢Iffi1¢ cplff 'C2l"OfP 18,729 18,729 16,144 15,416 728 Marginal workers tM 4,878 4,878 5,911 5,447 464
ofF 13,851 13,851 10,233 9.969 264
(i) ~ "l1fotP 5,210 5.210 4,286 4,280 6 CultJvators tM 1,283 1.283 1.311 1,306 5
elF 3,927 3,927 2,975 2,974
(ii) ~~ GlTotP 10,485 10,485 7,291 7,238 53 Agricultural labourers ~F 2,195 2,195 2,263 2,230 33
8,290 8,290 5,028 5,008 20
(iii) ql~ql~<h ;:roPr "<J>'1ff 'C2l"otP 577 577 1.019 950 69 Household industry workers
t~F 127 127 175 156 19 450 450 844 794 50
(iv) aRl"<J>'1ff 'C2l"otP 2,457 2,457 3,548 2,948 600 Other workers
tM 1,273 1,273 2,162 1,755 407
ofF 1,184 1.184 1,386 1,193 193
11. -fR" <IPff GlTotP 118,194 118,194 184,948 167,161 17,787 Non-workers
tM 44,949 44,949 118 ,520 61,909 6,611
olF 73.245 73,245 116.428 105.252 11,176
29
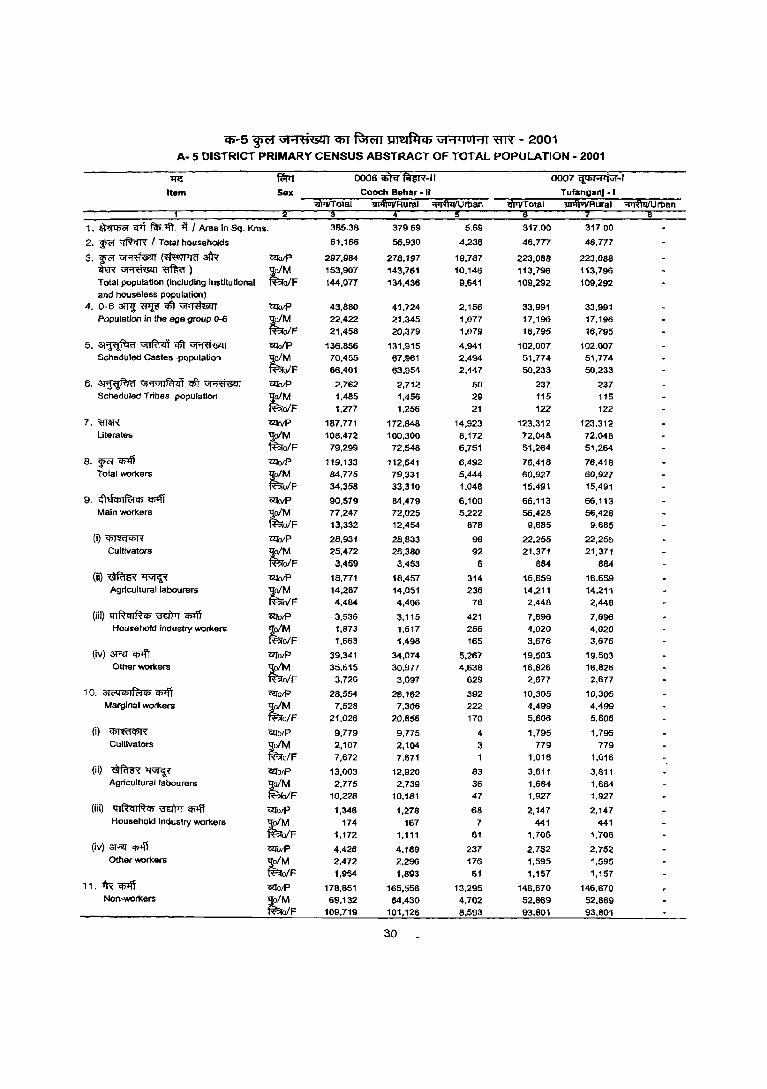
q;--5 ~ \i"''Itk.<41 em ~ lIM~C6 ,l'FPIOHI ~ - 2001 A· 5 DISTRICT PRIMARY CENSUS ABSTRACT OF TOTAL POPULATION· 2001
~ AA'IT 0006 if.i f.iiTi.1I 0OO7~-1
Item Sex Cooch Behar· II TufanganJ • I ~Rural ~l1lan "iI\1VTotal 1ii¥JiIRurai ~Ur1)an
1. ~ <f'l flf;.1fi. if I Area in Sq. Kms. 385.38 379.69 5.69 317.00 317.00
2. WR ~ I Total households 61.166 56,930 4,236 46,777 46.177
3. WR ~ (~3I'R l5!laIP 297,984 27B,197 19,787 223,088 223,088 W~~) tM 153,907 143,761 10,146 113,796 113,796 Total population (including institutional ofF 144,077 134,436 9,641 109,292 109,292 and houseless population) 4.0-6~~~~ Oll'oIP 43,880 41,724 2,156 33,991 33,991
Population in the age group ()-6 tM 22,422 21,345 1,077 17,196 17,196 ofF 21,458 20,379 1,079 16,795 16,795
5,~~~~ Oll'oIP 136,856 131,915 4,941 102,007 102.007 Scheduled Castes ,population tM 70,455 67,961 2,494 51,774 51,774
ofF 66,401 63,954 2,447 50,233 50,233
6. ~ GJ.,GJIRl<i'i $I ~ OIlolP 2,762 2,712 50 237 237 Scheduled Tribes population
~ 1,485 1,456 29 115 115 ofF 1,277 1.256 21 122 122
7.Wm CliorP 187,771 172.848 14,923 123,312 123,312 Literates
~ 108,472 100.300 8,172 72.048 72.048 ofF 79,299 72,548 6,751 51.264 51,264
8.~~ Oll'oIP 119,133 112,641 6,492 76,418 76,418 Total workers tM 84.775 79,331 5,444 60,927 60,927
olF 34,358 33,310 1.048 15,491 15,491
9. <fI&q\If'<;tCll 'q\lff Oll'O/P 90,579 84,479 6,100 66,113 66,113 Main workers r 77,247 72,025 5.222 56,428 Sti,428
olF 13,332 12,454 878 9,685 9,685
(i)~ OIlo/P 28,931 28,833 98 22.255 22,255 Cultivators tM 25,472 25,380 92 21,371 21.371
OfF 3.459 3,453 6 884 884
(ii)~~ CliorP 18.771 18,457 314 16,659 16.659 Agricultural labourers tM 14.287 14.051 236 14,211 14.211
OfF 4.484 4,406 78 2.448 2,448
(iii) qlRqlRib i.RIPT "¢'Iff C2l'orP 3,536 3.115 421 7.696 7,696 Household industry workers tM 1.873 1,617 256 4.020 4.020
OfF 1,663 1,498 165 3.676 3.676
(iv) 3Rl' ~ Oll'a/P 39.341 34.074 5,267 19.503 19,503 Other workers ~M 35.615 30.977 4,638 16,826 16,826
ofF 3.726 3,097 629 2,677 2,677 10. 'fI('Qq\,[84> "¢'Iff ~oIP 28.554 28.162 392 10.305 10,305
Marginal workers tM 7.528 7.306 222 4,499 4,499 ofF 21.026 20.856 170 5.806 5,806
(i) ~ GUotP 9,779 9,775 4 1,795 1.795 Cultivators ;tM 2,107 2.104 3 779 779
olF 7.672 7.671 1 1.016 1.016 (ii) ~~ Oll'orP 13,003 12,920 83 3,611 3,611
Agricultural labourers tM 2,775 2.739 36 1.684 1,684 ofF 10.228 10.181 47 1,927 1.927
(iii) q IRq I R q\ \'rn'M 'CIl'ff Oll'olP 1,346 1,278 68 2,147 2,147 Houllehold Industry workers ;tM 174 167 7 441 441
ofF 1.172 1,111 61 1.706 1,706 (iv) 3R:r "¢'Iff Oll'a/P 4,426 4.189 237 2.752 2.752
Other workers r 2,472 2,296 176 1.595 1,595 ofF 1,954 1,893 61 1,157 1,157
11. -IR 'q\lff Oll'otP 178,851 165,556 13.295 146.670 146,670 Non-workers
~ 69,132 64,430 4.702 52.869 52,869 ofF 109.719 101.126 8.593 93.801 93.801
30

co-5 wa vt"1.a'Lc<Q1 q:)J "R;n;n ~ vt"1"IOHI ~ - 2001 A- 5 DISTRICT PRIMARY CENSUS ABSTRACT OF TOTAL POPULATION - 2001
1«: ~ ooo8~-11 0009 "§.iiffi!T-1
Item Sex Dinhata· I lIPftuJIRural ~rban
1
1. ~ <rTf fif;:ifi. ~ I Area in Sq. Kms. 265.69 265.69 279.67 278.21 1.46
2. ~ ~ f Total households 34.796 34.796 51.954 51.093 861
3.~~(~$ ClloiP 167,455 167,455 254.682 250.569 4,113
~~~) ~ 85.213 85.213 130.747 128,633 2,114
Total population (including institutional ofF 82.242 82.242 123.935 121,936 1,999 and house less population)
4, 0-6 3lTl! '@jp qI') ~ ClloiP 25,937 25,937 40,324 39,830 494
Population In the age group 0-6 tM 13,174 13,174 20,745 20,499 246
oIF 12,763 12.763 19,579 19,331 248
5. ~ vrrfffm <1ft ~ OllaiP 84,790 84,790 111,985 110,695 1,290 Scheduled Castes population tM 42,901 42,901 57,468 56,810 658
ofF 41,889 41.889 54,517 53,885 632
6. ~ \i1'1\i1IRt<ll qfi ~ OlloiP 3.176 3,176 ·743 743 Scheduled Tribes population tM 1,635 1,635 374 374
ofF 1,541 1,541 369 369
7. ~1lR c;qotP 93,500 93,500 135,200 132,383 2,817 Literates tM 54,776 54,776 79.371 77.789 1,582
ofF 38,724 38,724 55,829 54,594 1.235
8.~~ ClloiP 62,079 62,079 99,777 98,350 1.427 Total worke rs tM 44,978 44.978 71,261 70,062 1.199
ofF 17.101 17,101 28.516 28,288 228
9. <!telq;I~q; <P'lT C!JoiP 46.670 46.670 79,198 77,905 1,293 Main workers tM 40,880 40.880 65,588 64,466 1.122
ofF 5,790 5,790 13,610 13,439 171
(i) <i>mWR ClfOIP 18,792 18,792 30,186 30,133 53 Cultivators tM 17,233 17,233 26,499 26,448 51
ofF 1,559 1,559 3,687 3,685 2
(ii)~~ .. .' ClfoiP 11.038 11,038 22,876 22,810 66 Agricultural labourers tM 8,829 8,829 17,311 17,257 54
ofF 2,209 2,209 5,565 5,553 12
(iii) lllFhlR<!i ~ ~ ClfOIP 2,235 2,235 2,300 2,224 76 Household industry workers tM 1,711 1,711 1,079 1,045 34
ofF 524 524 1,221 1,179 42
(iV) 3R:f~ ClfOIP 14,605 14,605 23,836 22.738 1,098 Other workers tM 13,107 13,107 20,699 19,716 983
ofF 1,498 1,498 3,137 3.022 115
10, 31o;;q<!iI~<!i <'f>lff ClfOlP 15,409 15,409 20,579 20,445 134 Marginal workers tM 4,098 4,098 5,673 5,596 77
ofF 11:311 11,311 14,906 14.849 57
(i) <!imf1I'iT'{ ClfoiP 4,410 4,410 5,544 5,543 Cultivators
~ 866 866 1,557 1,556 ofF 3,544 3,544 3,987 3,987
(ii) ~~ ClfO/P 7,101 7,101 11,111 11,104 7 Agricultural labourers tM 1,685 1,685 2,742 2,735 7
ofF 5,416 5,416 8,369 8,369
(iii) ql~ql~"'~~ ClfOIP 992 992 989 948 41 HousehOld industry workers
~ 204 204 104 101 3
ofF 788 788 885 847 38
(iv) 3I"i!I <P'lT ~aiP 2.906 2,906 2,935 2,850 85 Other workers r:' 1,343 1,343 1,270 1.204 66
ofF 1,563 1,563 1,665 1,646 19
11. 1R <I>'ff ClfoiP 105,376 105,376 154,905 152,219 2,686 Non-workers r:' 40,235 40,235 59,486 58,571 915
oIF 65,141 65,141 95,419 93,648 1,771
31
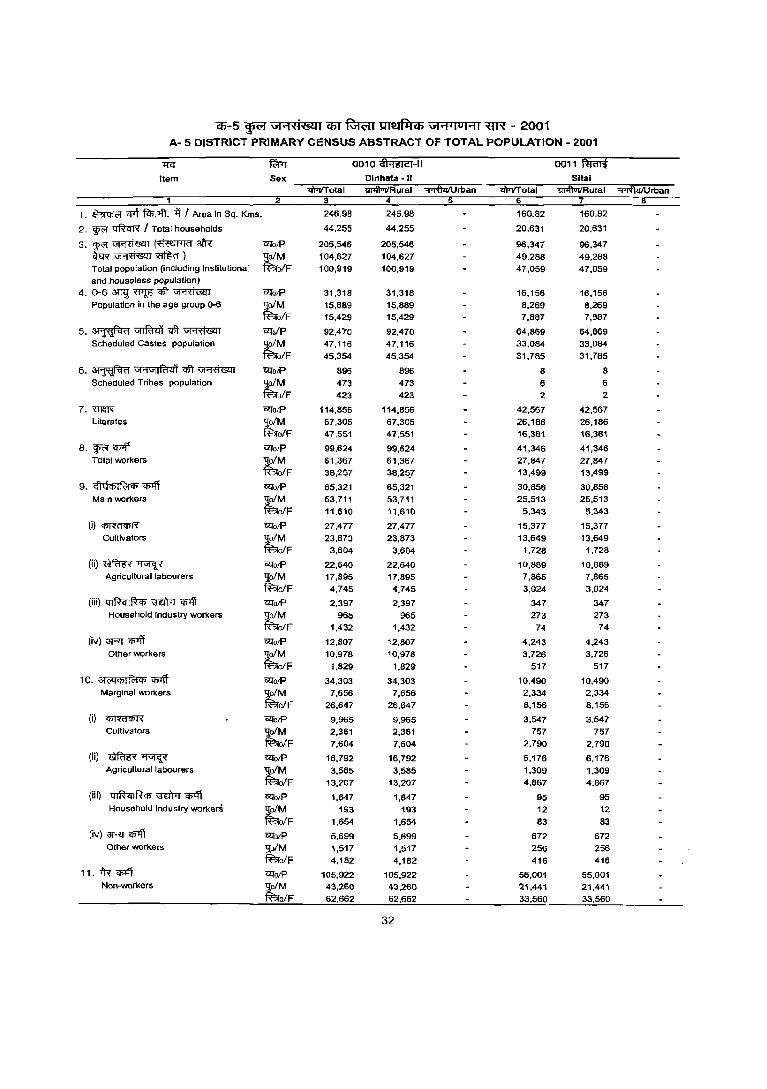
cp-5 ~ ",1"'1'<1'841 em ~ ~ "'1"' .. loHI XlR - 2001 A- 5 DISTRICT PRIMARY CENSUS ABSTRACT OF TOTAL POPULATION - 2001
'Ii<! ~ 0010~-1I 0011 ffuiii Item Sex Dlnhata -II Sital
lIPlIurIRural :;;:Tf#iI/Urban llFTITotal :;;r(4tDlIRural :;;p;:fuifUrban 4 6
,. ~ wt fcl;.~. it , Area in Sq. Kms. 246.98 246.98 160.82 160.82
2. W<'f ~ I Total households 44,255 44.255 20,631 20,631
3,~~(~aI'R iZfolP 205,546 205,546 96,347 96,347 ~~mmr) tM 104,627 104,627 49,288 49,288 Total population (including institutional ofF 100,919 100,919 47,059 47,059 and houseless population)
4. 0-6 3TT<] W!5 c5t ~ iZfolP 31,318 31,318 16,156 16,156 Population in the age group 0-6 tM 15,889 15,889 8,269 8,269
ofF 15,429 15,429 7,887 7,887
5. ~ 'VI'Tfu"d'i c5t ~ iZfolP 92.470 92.470 64,869 64,889 Scheduled Castes population tM 47,116 47,116 33,084 33,084
ofF 45,354 45.354 31,785 31,785
6. ~ GI'NIlfi'ltif qft ~ CZfolP 896 896 8 8 Scheduled Tribes population tM 473 473 6 6
olF 423 423 2 2
7.m~ iZfolP 114,856 114,856 42,567 42,567 Literates tM 67,305 67,305 26,186 26,186
ofF 47,551 47.551 16,381 16.381
8. WC' C!JIft OC[O/P 99,624 99,624 41,346 41,346 Total workers tM 61,367 61,367 27,847 27,847
ofF 38,257 38,2~7 13,499 13,499
9. i{lQEPIR:iEP ~ OC[O/P 65,321 65,321 30,856 30,856 Main workers tM 53,711 53,711 25.513 25,513
ofF 11.610 11,610 5,343 5,343
(i)~ iZfO/P 27,477 27,477 15,377 15,377 Cultivators tM 23,873 23,873 13,649 13,649
oIF 3,604 3,604 1,728 1,728
(ii)~~ Oll'o/P 22,640 22,640 10,889 10,889 Agricultural labourers :101M 17,895 17,895 7,865 7,865
R?rofF 4,745 4,745 3.024 3,024
(iii) GIRqlRQi ~ cn4T iZfO/P 2,397 2,397 347 347 Household Industry workers tM 965 965 273 273
ofF 1,432 1,432 74 74
(iv) :lRr q;>ff iZfO/P 12,807 12,807 4,243 4,243 Other workers tM 10,978 10,978 3,726 3,726
ofF 1,829 1.829 517 517
10. 3l<'llQiI~q) <wft' OC[O/P 34.303 34,303 10.490 10.490 Marginal workers tM 7,656 7,656 2,334 2,334
oIF 26,647 26,647 8,156 8,156
(il CfiffifEPR Oll'olP 9,965 9,965 3,547 3,547 Cultivators tM 2,361 2,361 757 757
olF 7,604 7,604 2,790 2.790
(ii) ~~ Oll'o/P 16,792 16,792 6,176 6,176 Agricultural labourers tM 3,585 3,585 1,309 1,309
oIF 13,207 13,207 4,867 4,867
(iii) 4IRqIRC!> ~ C!JIft OC[O/P 1,847 1,847 95 95 Household Industry workerS tM 193 193 12 12
olF 1,654 1,654 83 83 (iv) 3RJ~ iZfO/P 5,699 5,699 672 672
Other workers 'lofM 1,517 1,517 256 256 R?ro/F 4,182 4,182 416 416
11. 1R '1PI1l Gll'olP 105,922 105,922 55,001 55,001 NQn-workers
tM 43,260 43,260 21,441 21,441
olF 62.662 62.662 33,560 33.560
32
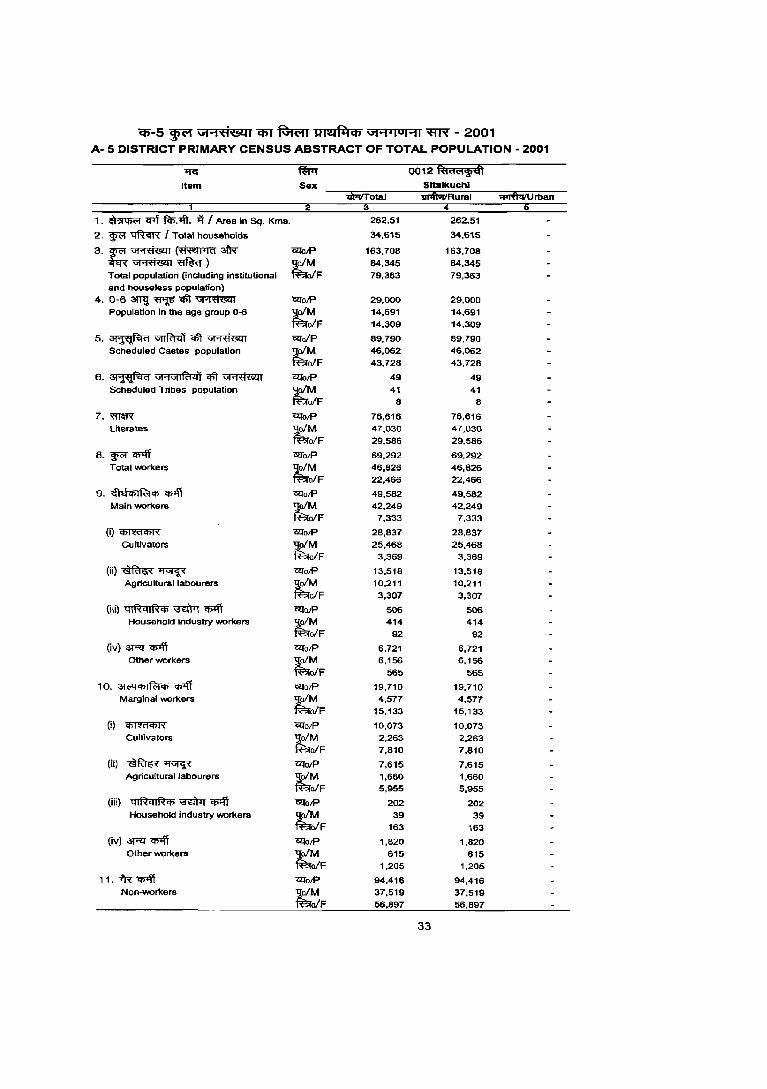
'Cff-5 ~ V1"i'<'i6lt1 ifiT ~ RI:I!I~(fi V1"i·lol"i1 ~ - 2001 A- 5 DISTRICT PRIMARY CENSUS ABSTRACT OF TOTAL POPULATION - 2001
m: ~ 0012 R!<:t('(!!i'Etl Item Sex Sltalkuchl
"Q\ITfTotal lIliftVi#Rural "'I'ifuiIU roan
1. ~ lf1t 1iI>."Ifi . ..:r I Area in Sq. Kms. 262.51 262.51
2. ~ ~ I Total households 34,615 34.615
3.~~~a1R C2loJP 163,708 163,708 W~~) ~M 84,345 84,345 Total population (including institutional ofF 79,363 79,363 and houseless population)
4. 0-6 3ml~~~ ?ZIOIP 29,000 29,000 Population In the age group 0-6 ~M 14,691 14,691
olF 14,309 14,309
5.~~~~ CQ"oIP 89,790 69,790 Scheduled Castes population ~M 46,062 46,062
alF 43,728 43,728
6. ~ Gt"1GtIRtdi ~ ~ CZfolP 49 49 SCheduled Tribes population ~M 41 41
alF 8 8
7, 'ffi~ CQ"olP 76,616 76,616 Literates ~M 47,030 47,030
alF 29,586 29,586
8. ~ cn+ff CZfO/P 69,292 69,292 Total workers ~M 46,626 46,826
ofF 22,466 22,466
9. 4hl'l>IR:!'l> ~ CQ"olP 49,582 49,582 Main workers ~M 42,249 42,249
ofF 7,333 7,333
(i) 'l>Ptij'l>l,( C2TolP 28,837 28,837 Cultlvators ~M 25,466 25,468
ofF 3,369 3,369
(ii)~~ C2TolP 13,518 13,518 Agricultural labourers ~M 10,211 10,211
OIF 3,307 3,307
(iii) ql~ql~<t> ~ ~ C2TO/P 506 506 Household industry workers ~M 414 414
alF 92 92
(iv) 3T"'Q ~ l2i"o/P 6,721 6,721 Othe r workers tM 6,156 6,156
OIF 565 565
10. 3{("4C1>IR:!CI> ~ C2TolP 19,710 19,710 Marginal workers ~M 4,577 4,577
alF 15,133 15,133
(il 'fm<14iI,( CZfO/P 10,073 10,073 Cultivators ~M 2,263 2.263
OIF 7,810 7,810
(iiJ ~~ CQ"O/P 7,615 7,615 Agricultural labourers ~M 1,660 1,660
ofF 5,955 5,955
(iii) ql~ql~'l> ~ q;;fi <:1lolP 202 202 Household industry workers ~M 39 39
OIF 163 163
(iv) 3T"'Q ~ CZfolP 1,820 1,820 Other workers ~M 615 615
ofF 1,205 1,205
11. tR~ <'2lolP 94,416 94,416 Non-workers ~M 37,519 37,519
ofF 56,897 56,897
33

q;--5 ~ G1~'<'i&:l1 q;y ~ UI~~Cfj \11'1 •• 01'11 "fl'R - 2001 A.5 DISTRICT PRIMARY CENSUS ABSTRACT OF TOTAL POPULATION· 2001
lre
Item
1. ~ 'Cf1t ~.~. '# I Area in Sq. Kms.
2. ~ ~ I Total households
3.~~{~~ ~~~J Total population (including institutional and houseless population)
4. 0-6 3Tn.! ~ ctI ~ Population in the age group 0-6
5.~~'i$t~ Scheduled Castes population
6. ~ Gj.,GtIfi'14'i qft ~ Scheduled Tribes population
7. 'ffiW{
Literates
8. g><'I ~ Total wo~ers
9. iflQcl'>lR:t'l> 'PIff Mainwo~ers
(i)~
Cultivators
(ii)~~ Agricultural labourers
(iii) 41RqlR'I> ~ C!>BT Household industry workers
(iv) 3Rl q;1ff Other workers
10. QjC'GCfiIR:tCfi C!>BT Marginal workers
(i)~
Cultivators
(ii)~~ Agricultural labourers
(iii) 41RqlRCfi \R.I'r1 C!>BT Household industry workers
(iv) 3Rl q;1ff Other wo~ers
11.~'PIff Non-wo~ers
C2Jo/P
llo/M ~oIF
C2JOIP
llo/M ~oIF
C2Jo/P
~oIM ~oIF
C2J0IP
-solM ~oIF
GlIOIP
SolM ~o/F
C2JotP
llolM ~o/F
GlIO/P
llolM ~o/F
G!!otP
'loiM ~o/F
GlIotP
'loiM ~o/F
C2JotP -go/M ~o/F
C2JotP -goiM ~o/F
12l'o/P
llolM ~o/F
C2JotP ljo/M ~o/F
GlIotP -go/M fi"lro/F ClfO/P
ljo/M fi"lroiF 12l'otP
~oIM ff'.;{oIF
12l'otP ljo/M ff'.;{oIF
04'3W!'~ UTTAR DINAJPUR
'!II'ftulIRural "PT'fttrIUroan 4
3,140.00
464,648
2,441,794 1,259,737 1,182,057
513,266 261,202 252,064
676,582 348,693 327,889
124,865 63,123 61,742
923,477 583,960 339,517
935,524
653.677 281,847
716,483 585,710 130.773
230,208 203,973
26,235
245,303 187,670
57,633
20,953 9,083
11,870
220,019 184,984 35,035
219,041 67,967
151,074
46,523 15,255 31,268
125,731 38,453 87,278
13,461 1,316
12,145
33,326 12,943 20,383
1,506,270 606,060 900,210
3,095.64
411,735
2,147,351 1,104,224 1,043,127
476,155 242,036 234,119
623,649 320,785 302,864
122,110 61,607 60,503
716,326 467,358 248,968
841,983 575,569 266,414
630,566 511,841 118,725
228,926 202,777
26,149
243,405 186,303 57,102
18,467 7,535
10,932
139,768 115,226
24,542
211,417 63,728
147,689
46,400 15,208 31,192
125,097 38,143 86,954
12,647 1,128
11,519
27,273 9,249
18,024
1,305,368 528,655 776,713
34
44.36
52,913
294,443 155,513 138,930
37,111
19,166 17,945
52,933 27,908 25,025
2,755 1,516 1,239
207,151 116,602
90,549
93,541 78,108 15,433
85,917 73,869 12,048
1,282 1,196
86
1,898 1,367
531
2,486 1,548
938
80,251 69,758 10,493
7,624 4,239 3,385
123 47 76
634 310 324
814 188 626
6,053 3,694 2,359
200,902 77,405
123,497
~otal 6
380.82
41,721
223,022 115,Q97 107,925
53,399 27,156 26,243
41,315 21,211 20,104
15,825 8,112 7,713
73,426 49,181 24,245
70,093 55,228 14,865
60,262 51,191
9,071
16,546 15,591
955
15,496 13,526
1,970
801 523 278
27,419 21,551
5,668
9,831 4,037 5,794
1,727 793 934
4,880 1,991 2,889
239 49
190
2,985 1,204 1,781
152,929 59,869 93,060
000 1 '!ftlRl Chopra
'!I'f1ftvtIRural ~rban
380.82
41,721
223,022 115,097 107,925
53,399 27,156 26,243
41,315 21,211 20,104
15,825 8,112 7,713
73,426 49,181 24,245
70,093 55,228 14,865
60,262 51,191
9,071
16,546 15,591
955
15,496 13,526
1,970
801 523 278
27,419 21,551
5,868
9,831 4,037 5,794
1,727 793 934
4,880 1,991
2.889
239 49
190
2,985 1,204 1,781
152,929 59,869 93,060
.-
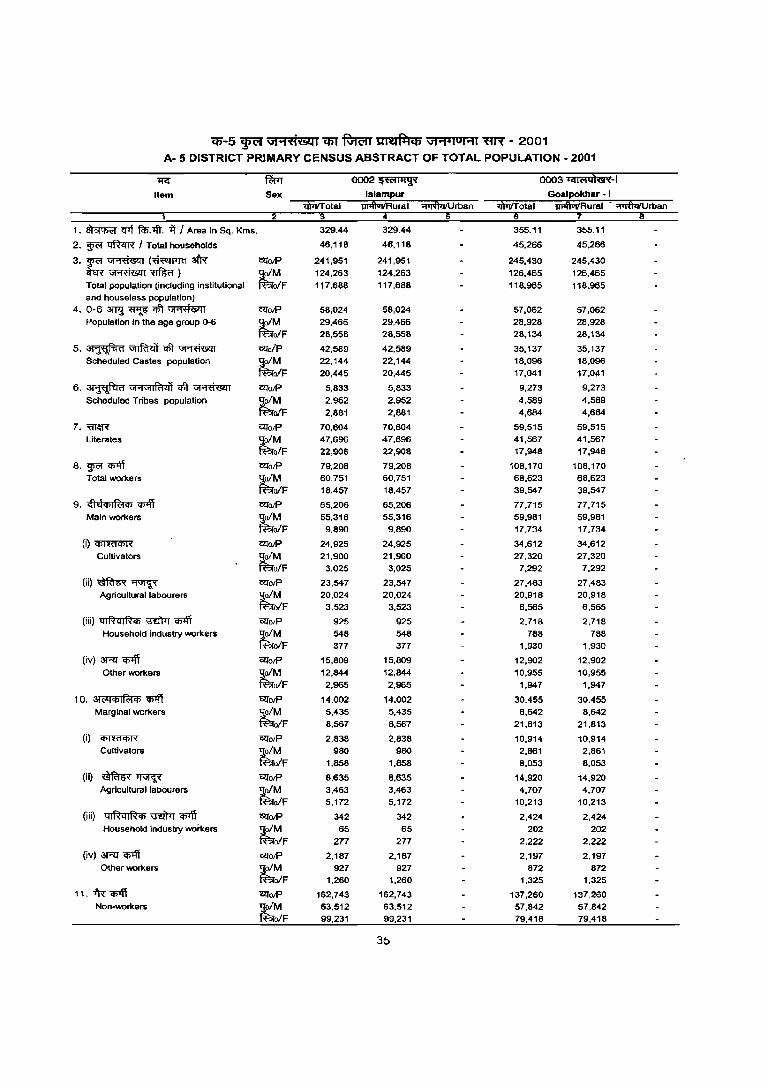
Cff-5 ~ \I1"'1't1'Bi1l1 em'R;rc;rr tm!I~q; \11'1°1°1'11 ~ - 2001 A- 5 DISTRICT PRIMARY CENSUS ABSTRACT OF TOTAL POPULATION - 2001
'I'fi:" ~ ooo2~ 0003 Iql('lQ)&'I-1
Item Sex Goalpokhar - I ",,"ui/Rural - ~rban
1. ~ crrt fm.1ft. Ti I Area in Sq. Kms. 329.44 329.44 355.11 355.11
2. ~ ~ I Total households 46.118 46,118 45.266 45.266
3. ~ ~ (~3l'R" C!l'oiP 241.951 241,951 245,430 245.430 Wm'~~) ~M 124,263 124,263 126,465 126,465 Total population (including institutional o/F 117.688 117,688 118.965 118.965 and houseless population)
4. 0-6 3Wl ~ ql') ~ C!l'O/P 58,024 58,024 57,062 57,062 Population In the age group 0-6 ~M 29,466 29,466 28,928 28.928
ofF 28,558 28,558 28,134 28,134
5.~~CIIT~ C!l'oIP 42,589 42,589 35,137 35,137 Scheduled Castes population tM 22,144 22,144 18,096 18,096
ofF 20,445 20,445 17,041 17.041
6. ~ \iI"1"1IRt4'j q\T ~ C!l'oiP 5,833 5,833 9,273 9,273
Scheduled Tribes population ~M 2,952 2,952 4,589 4,589
ofF 2,881 2,881 4,684 4,684
7.~~ C!l'oiP 70,604 70,604 59,515 59,515 Literates tM 47,696 47,696 41,567 41,567
olF 22,908 22,908 17,948 17,948
8. ~ Cji1ff C!l'otP 79,208 79,208 108,170 108.170 Total wor1<ers ~M 60,751 60,751 68,623 68,623
ofF 18,457 18,457 39,547 39,547
9. <!It:iifjl~Cjj <I>'ff C!l'otP 65,206 65,206 77,715 77,715 Main wor1<ers ~ 55,316 55,316 59.981 59.981
o/F 9,890 9.890 17,734 17,734
(i)~ C!l'oiP 24,925 24,925 34,612 34.612 Cultivators ~M 21,900 21,900 27,320 27,320
olF 3,025 3.025 7.292 7.292
(ii)~~ C!l'o/P 23,547 23.547 27,483 27,483 Agricultural labourers ~M 20,024 20,024 20,918 20,918
o/F 3,523 3.523 6.565 6,565
(iii) Q I R ell R CI> \'lEI'ITr <I>'ff GIl'O/P 925 925 2,718 2,718 Household industry wor1<ers ~M 548 548 788 788
ofF 377 377 1,930 1,930
(iv) ~ <I>'ff C!l'otP 15,809 15.809 12,902 12,902 Other wor1<ers tM 12,844 12,844 10.955 10.955
ofF 2,965 2.965 1,947 1,947
10. 31(;(jCl>I~CI> <I>Ifi C!l'otP 14,002 14,002 30,455 30.455 Marginal wor1<ers tM 5,435 5.435 8,642 8,642
ofF 8,567 8.567 21.B13 21,813
(i) <Ii'ffifCI>R GIl'o/P 2,838 2,838 10.914 10,914 Cultivators ~M 980 980 2.861 2.861
ofF 1,858 1,858 8,053 8,053
(ii) ~~ C!l'otP 8,635 8,635 14,920 14,920 Agricultural labourers ~M 3,463 3,463 4,707 4,707
o/F 5,172 5.172 10.213 10,213
(iii) ql~ql~CI> ~ <I>'ff C!l'oiP 342 342 2.424 2.424 Household industry woi'kers tM 65 65 202 202
o/F 277 277 2,222 2,222
(iv) ~ <I>Ifi 'alotP 2,187 2,187 2,197 2,197 Other wor1<ers tM 927 927 872 872
o/F 1,260 1.260 1.325 1,325
11. -IR <I>'ff 'GlfotP 162,743 162,743 137.260 137,260 Non-wor1<ers tM 63,512 63,512 57,842 57,842
ofF 99,231 99,231 79,418 79,418
35
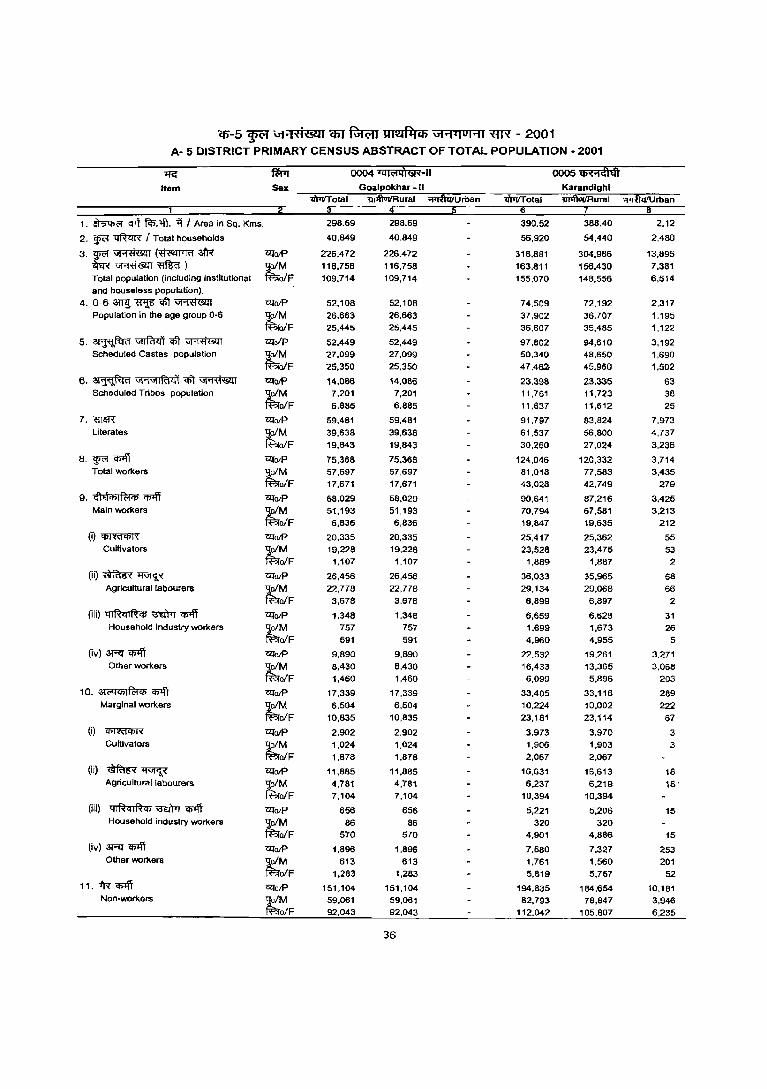
iff-5 ~ uH'tlt..c<:Il em ~ lIMfJlq; uFPJOHI "m"X - 2001
A- 5 DISTRICT PRIMARY CENSUS ABSTRACT OF TOTAL POPULATION - 2001
+re' ~ 0005~ Item Sex KarBndlghl
1I'PrrTotai trI1ftar/Ruml .. ·,tlIlfUrban
1. ~ Cfi'i ~,~, it J Area In SQ, Kms, 298,69 298,69 390,52 388,40 2,12
2. g;c;r ~ I Total households 40,849 40,849 56,920 54,440 2,480
3. g;c;r ~ (~ ~ ~OIP 226,472 226,472 318,881 304,986 13,895 W~~) tM 116,758 116,758 163,811 156,430 7,381 Total population (including institutional alF 109,714 109,714 155,070 148,556 6,514 and houseless population),
4. 0-6 3"!Tg. ~ <&I ~ ClIO/P 52,108 52,108 74,509 72,192 2,317 Population in the age group 0-6 tM 26,663 26,663 37,902 36,707 1,195
alF 25,445 25,445 36,607 35,485 1,122
5.~~qft~ 'CZtolP 52,449 52,449 97,802 94,610 3,192 Scheduled Castes poplliation tM 27,099 27,099 50,340 48,650 1,690
alF 25,350 25,350 47,462 45,960 1,502
6, ~ "I'\"IIR!lj'j qit ~ ClIOIP 14,086 14,086 23,398 23,335 63 Scheduled Tribes popUlation tM 7,201 7,201 11,761 11,723 38
alF 6,885 6,885 11,637 11,612 25
7, WaR -arO/P 59,481 59,481 91,797 83,824 7,973 Literates tM 39,638 39,638 61,537 56,800 4,737
alF 19,843 19,843 30,260 27,024 3,236
8. W"l ~ -arO/P 75.368 75,368 124.046 120.332 3.714 Total workers tM 57.697 57.697 81.018 77,583 3,435
olF 17,671 17,671 43.028 42,749 279
9. ~t!Cf)IR;iq; q;>ff 'CZtOlP 58,029 58.029 90,641 87.216 3,425 Main workers tM 51.193 51,193 70,794 67,581 3,213
olF 6.836 6.836 19,847 19.635 212
(i)~ -ar0lP 20.335 20,335 25,417 25,362 55 Cultivators tM 19,228 19,228 23.528 23,475 53
alF 1,107 1,107 1,889 1,887 2
(ii)~~ mO/p 26,456 26,456 36,033 35,965 68 Agricultural latlourers ~M 22,778 22.778 29,134 29,068 66
alF 3,678 3,678 6,899 6,897 2
(iii) ql~ql~q; -;:n:iM q;>ff mO/p 1.348 1,348 6.659 6,628 31 Household industry workers tM 757 757 1,699 1,673 26
alF 591 591 4,960 4.955 5
(iv) 3RJ q;>ff mcvP 9,890 9,890 22,532 19,261 3,271 Other workers tM 8,430 8.430 16,433 13,365 3,068
alF 1,460 1,460 6,099 5,896 203
10. '3I('lICf)IR;iqs Cf>'\T mOlP 17.339 17,339 33,405 33,116 289 Marginal workers tM 6,504 6.504 10,224 10,002 222
alF 10.835 10,835 23,181 23.114 67
(i) CIlTrtfCf)R 'UJOIP 2,902 2.902 3,973 3,970 3 Cultivators tM 1.024 1,024 1.906 1,903 3
alF 1.878 1.878 2.067 2.067
(ii) ~~ GQ'OIP 11,885 11,885 16,631 16.613 18 Agricultural labourers tM 4,781 4,781 6,237 6,219 18'
alF 7,104 7,104 10.394 10,394 (iii) ql~"I~qs \ffiTrT ~ 'CZtO/P 656 656 5.221 5,206 15
Household industry workers ;tM 86 86 320 320 alF 570 570 4,901 4,886 15
(iv) 3RJ q;>ff mOlP 1,896 1,896 7.580 7,327 253 Other workers ~M 613 613 1,761 1,560 201
oIF 1.283 1,283 5,819 5,767 52 11. -fR ~ ~olP 151,104 151,104 194,835 184,654 10,181
Non-workers tM 59,061 59,061 82,793 78,847 3.946 olF 92,043 92,043 112,042 105.807 6.235
36

(1)-5 ~ Gt"1fi\lO.clil q;r f-;rc;rr 1lM~Cb GI'1.IOI'1I "flR - 2001 A· 5 DISTRICT PRIMARY CENSUS ABSTRACT OF TOTAL POPULATION· 2001
"IG
Item
1. ~ eM ~.>fi . .,?f I Area in Sq. Kms.
2. WC" ~ I Total households
3. WC" ~ (~ al'N ~~~) Total population (including institutional and houseless population)
4. 0-6 aTl<l ~ mt ~ Population in the age group 0-6
5.~~~~ Scheduled Castes population
6. ~ "'11V1IRl<i~ ~ ~ Scheduled Tribes population
7. <=ITlfI"'f Literates
8. WC" <!J4T Total workers
9. <fl{ji'/)If<:iifl <!J4T Main workers
(i)~
Cultivators
(ii)~~ Agricultural labourers
(iii) ql~ql~i'/) ~ ~ Household industry workers
(iv) 3Rl <!J4T Other workers
10. 3lC'G<ii11B<ii "<Il"ff Marginal workers
(i)~
Cultivators
(ii)~~ Agricultural labourers
(Iii) qlRcllR<ii ~ "<Il"ff Household industry workers
(iv) 3Rl"<l11ff Other woc1<ers
11. ~ CfJ1ff Non-workers
Sex
(;!JoiP
'9:u/M ~oIF
(;!J()/P
'9:o/M ff?ro/F
1'2!./P ljo/M ~o/F
ClIoiP :l,oIM taolF ClIo/P :l,o/M tao/F ClIO/P ljoiM taoiF (;!JotP -goiM tao/F U/O/P
ljo/M tao/F ClIoJP ',!oIM f80lF
121'o/P :l,o/M f801F (;!JO/P SolM f80/F <Z[O/P
ljo/M f801F <Z[O/P
'l0/M f80/F (;!JotP ~o/M faolF ClIoJP '.!o/M f80/F <ZioiP '.!o/M f801F (;!JotP ,:!o/M ~oIF
'IlPtIT otal
47213
71,075
362,056
186,846
175,206
73,106
37,065
36,041
136,964
71.653
67,311
21,149 10,636
10,511
148,696
94,324
54.374
144,205
99,019
45,186
111,435
89.389
22.046
38,046
33,400
4.646
43,139
30,090
13,049
2,525
1,427
1.098
27,725
24,472
3,253
32,770
9,630 23,140
4,487
1,632
2,855
23,620
6,229
17,391
1,171
171 1,000
3,492
1,598
1,894
217,851
87,629
130.022
0006~ Ralganj
466.19
67,986
347,108
178,919
168,189
71,157
36,031
35,126
134,912
69.492 65,420
20,986
10,556
10,430
138,810
88,608
50,202
139,013
94,728 44,285
106,794
85,367
21.427
37,893 33,261
4,632
42,881
29,929 12,952
2,127
1,121
1,006
23,893
21,056
2.837
32,219
9,361
22,858
4,480
1,627
2,853
23,507
6,185
17,322
1,075
145 930
3,157 1,404
1,753
208.095 84.191
123,904
37
5.94
3,089
14,948
7,929
7,019
1,949
1,034
915
4,052
2,161
1,691
163
62 81
9,688
5,716
4,172
5,192
4,291
901
4.641
4,022
619
153 139
14
258
161
97
396
306
92
3,832
'3,416
416
551
269
282
7
5
2
113
44 69
96
26
70
335 194
141
9,756 3,63B
6,118
191.62
24,999
118,822
61,192
57,630
23,553
12,013
11,540
41,056
21,014
20,042
4,523 2,283
2,240
54,037
32,995
21,042
46,014
33,581 14,433
35,057
29,082
5,975
11,804 11,051
753
15.907
11,776
4,131
668
354
314
6,678
5,901
777
12,957
4.499 8,458
3,170
1,376
1,794
8,285
2,546
5.739
273
39 234
1,229
538
691
70,B08 27,611
43,197
0007~ Hemlabad
'iifililJiIRural "'ITIfuiIUrbsn
191.82
24,999
118,822
'61,192
57,630
23,553
12,013
11,540
41,056
21,014
20,042
4.523 2,283
2,240
54,037
32,995
21,042
4B,014
33,581
14,433
35,057
29,082
5.975
11,804
11,051
753
15,907
11,776
4,131
668
354
314
6,676
5,901
777
12,957 4,499
6,458
3,170
1,376
1,794
8,285
2,546
5,739
273
39 234
1,229
538
691
70,808 27,611
43,197
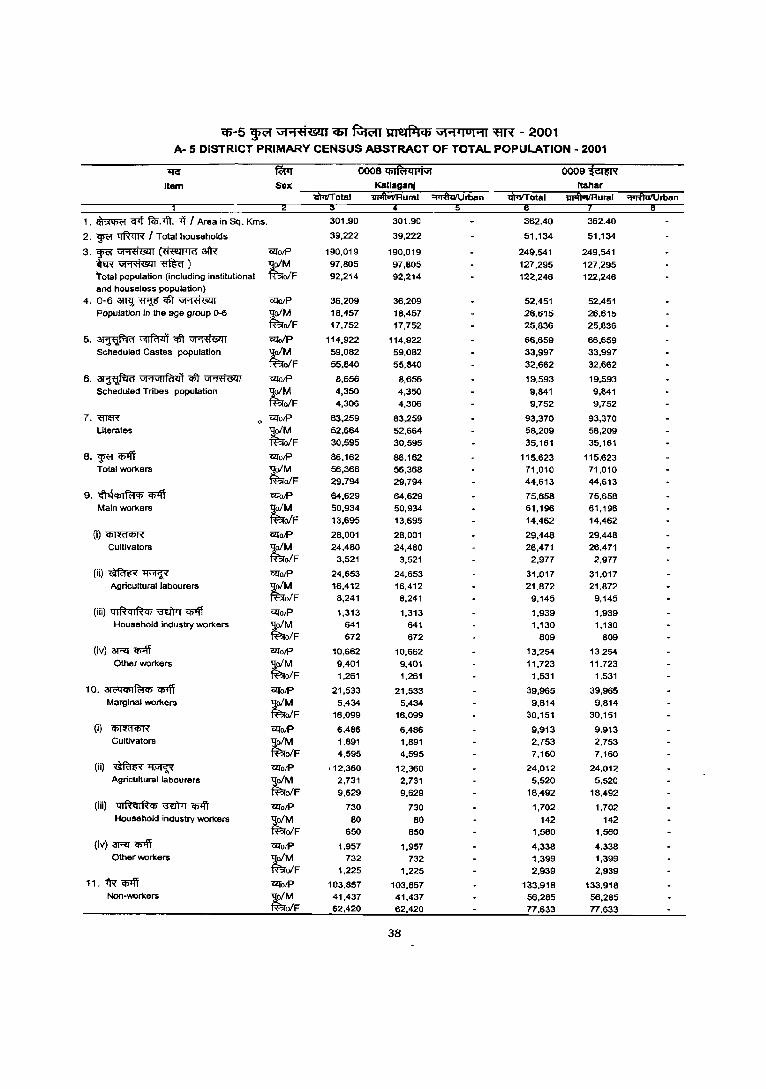
CIi-5 ~ vH+i&U <PI ~ Ultll'&ICfi \71""1.1 0 1""11 ~ - 2001 A- 5 DISTRICT PRIMARY CENSUS ABSTRACT OF TOTAL POPULATION - 2001
~ ~ 0008 (bI~'"*iI 0009~ Item Sex ltahar
u,4'luilRural ~rban
1. ~ Cflt fcl>.ljl. -.'f I Area in Sq. Kms. 301.90 301.90 362.40 362.40
2. W<1 tJftcIR I Total households 39,222 39,222 51,134 51,134
3. W<1 ~ (~3fR 'i'.lToiP 130,019 190,019 249,541 249,541 ~~~) tM 97,805 97,805 127,295 127,295 'rota I population (including institutional ofF 92,214 92,214 122,246 122,246 and houlleless population)
4. 0-6 ~ <'fI!5 <tt ~ 'i'.lTOIP 36,209 36,209 52,451 52,451 Populatlon In the age group 0-6
~ 18,457 18,457 26,615 26,615
ofF 17,752 17,752 25,836 25,836
5.~~~~ 'i'.lToIP 114,922 114,922 66,659 66,659 Scheduled Castes population tM 59,082 59,082 33,997 33,997
ofF 55,840 55,840 32,662 32,662
6. ~ Vl'1G!lfil1I1 ~ ~ <lfuiP 8.656 8,656 19.593 19.593 Scheduled Tribes population tM 4,350 4,350 9,841 9,841
ofF 4,306 4,306 9,752 9,752
7.mm 'i'.lTo/P 83,259 83,259 93,370 93,370 Literates tM 52,664 52,664 58,209 58,209
ofF 30.595 30,595 35,161 35,161
8. ~ <P'IlT 'i'.lTolP 86,162 86,162 115.623 115.623 Total workers tM 56,36B 56,368 71,010 71,010
ofF 29.794 29,794 44,613 44,613
9. ;£!q<t>IR!q> <P'IlT 'i'.lTolP 64,629 64,629 75,658 75,65B Main workers tM 50,934 50,934 61,196 61,196
ofF 13.695 13,695 14,462 14,462
(i)~ 'i'.lTo/P 28.001 28,001 29,448 29,448 Cultivators tM 24,480 24,480 26,471 26,471
olF 3,521 3.521 2,977 2,977
(ii)~~ 'i'.lTolP 24,653 24,653 31,017 31.017 Agricultural labourers tM 16.412 16.412 21,B72 21.872
ofF 8,241 8.241 9.145 9,145
(iii) q I ~ cufh, 'G'tlTrr ClJlff 'i'.lTO/P 1,313 1,313 1,939 1.939 Household industry workers tM 641 641 1,130 1.130
ofF 672 672 809 809
(iv)~~ 'i'.lTolP 10.662 10,662 13.254 13.254 Other workers tM 9,401 9.401 11,723 11,723
ofF 1.261 1,261 1,531 1,531
10. otc;q<t>I~<t> ~ CZfoiP 21,533 21,533 39,965 39,965 Mar91nal workers tM 5,434 5.434 9,814 9.814
ofF 16,099 16,099 30,151 30,151
(i) ~ CZfO/P 6.486 6.486 9,913 9.913 Cultivators tM 1,891 1.B91 2,753 2,753
ofF 4,595 4,595 7,160 7.160
(ii) ~~ CZfoiP ' 12,360 12.360 24,012 24,012 Agricultural labourers tM 2,731 2,731 5,520 5.520
ofF 9,629 9,629 18,492 18,492
(iii) ql~ql~<t>~~ CZfoiP 730 730 1,702 1,702 Household industry workers tM 80 80 142 142
ofF 650 650 1,560 1,560
(Iv) 3RI ri CZfoiP t,957 1.957 4,338 4,338 Other workers tM 732 732 1,399 1,399
ofF 1,225 1,225 2,939 2,939
11. 1R <fi1ff ClrolP 103,857 103.857 133,918 133,918 Non-workers tM 41.437 41.437 56,285 56,285
ofF 62,420 62,420 77,633 77,633
38
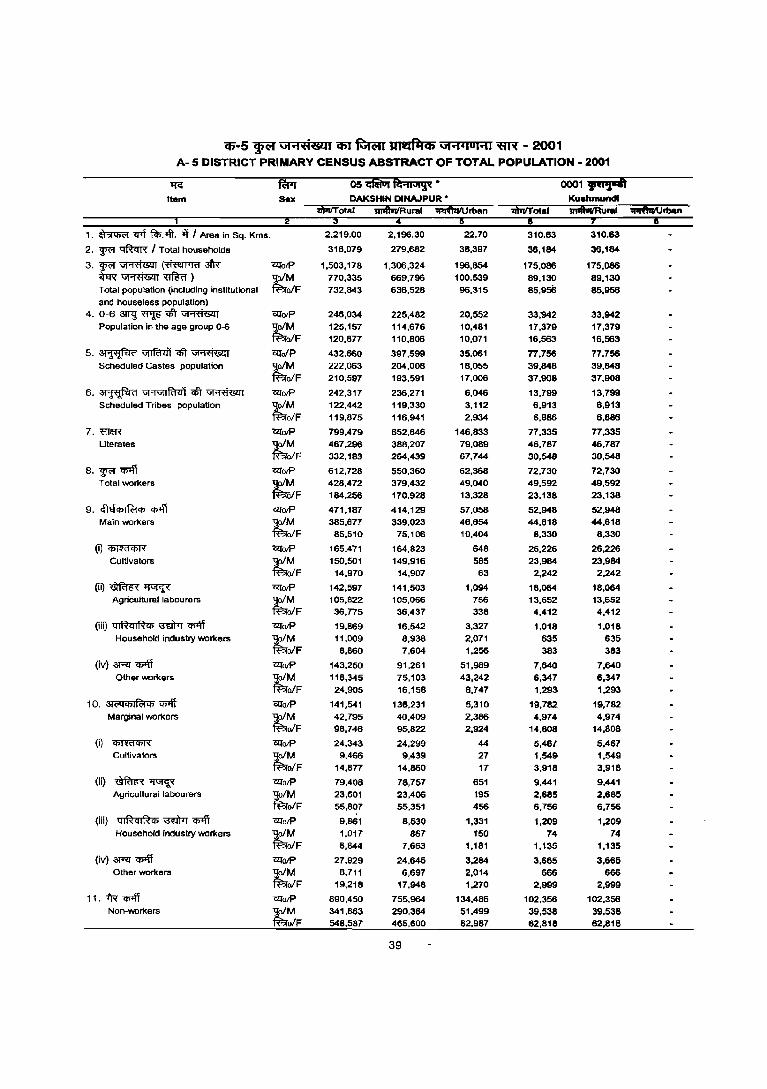
ifj-5 ~ vt .. ni&ll ifi1 ~ UIt.dllCfi "1"1410 1"11 "IR - 2001 A- 5 DISTRICT PRIMARY CENSUS ABSTRACT OF TOTAL POPULATION - 2001
'IIG fWr 05~~· 0001~ Itam Sex DAKSHIN DlNAJPUR • Ku.hmuncII
~otal ~"'- . 1. ~ crrt f*.-.fi. ~ I Area in Sq. Kms. 2,219.00 2,196.30 22.70 310.63 310.63
2. ~ ~ I Total households 318,079 279,682 38,397 38,184 36,184
3. w<'f ~ (~ 3I'ff ClI"otP 1,503,178 1,306,324 196,854 175,086 175,086 ~~~) r 770,335 669,796 100,539 89,130 89,130 Total population (induding institutional ofF 732,843 636,528 96,315 85,956 85,956 and house less population)
4.0-6~~ctr~ ClI"otP 246,034 225,482 20,552 33,"942 33,942 Population in the age group 0-6 ;tM 125,157 114,676 10,481 17,379 17,379
ofF 120,877 110,806 10.071 16,563 16,563
5. ~ ;:;rrftrlit ctr ~ ClI"oIP 432.660 397,599 35,061 77,756 77,756
Scheduled Castes population ;tM 222,063 204,008 18,055 39,848 39,848
ofF 210,597 193.591 17,006 37.908 37,908
6. ~ "''1V1IR'1<l~ ctr ~ ClI"otP 242,317 236,271 6,046 13.799 13,799
Scheduled Tribes population tM 122,442 119,330 3,112 6,913 6,913
ofF 119,875 116.941 2,934 6.886 6,886
7. mlffi' ClI"oiP 799,479 652,646 146,833 77,335 77,335
Literates ~F 467,296 388,207 79,089 46,787 46,787
332,183 264,439 67,744 30,548 30,548
8. ~ q;>ff <Il1otP 612,728 550,360 62,368 72,730 72,730 Total workers tM 428,472 379,432 49,040 49,592 49,592
ofF 184,256 170,928 13,328 23,138 23,138
9. ~d'I>IR:t", q;>ff ClI"otP 471,187 414,129 57,058 52,948 52,948 Main workers tM 385,677 339,023 46,654 44,618 44,618
ofF 85,510 75,106 10,404 8,330 8,330
(i)~ «ioiP 165,471 164,823 648 26,226 26,226
Cultivators tM 150,501 149,916 585 23,984 23,984
ofF 14,970 14,907 63 2,242 2,242
(iQ~~ ClI"otP 142,597 141,503 1,094 18,064 18,064 Agricultu reI labou ra rs tM 105,B22 105,066 756 13,652 13,652
ofF 36,775 36,437 338 4,412 4,412
(iii) ql~ql~'" ~ "<I>'ff ~oiP 19,869 16,542 3,327 1,018 1,018 Household industry workers tM 11,009 8,938 2,071 635 635
ofF B,860 7,604 1,256 383 383
(iv) 3RJ q;>ff ClI"oiP 143,250 91,261 51,989 7,640 7,640 Other workers tM l1B,345 75,103 43,242 6,347 6,347
ofF 24,905 16,158 8,747 1,293 1,293
10. 31<'1l<t>IR:i", C()1ff «iotP 141,541 136,231 5,310 19,782 19,782 Marginal workers tM 42,795 40,409 2,386 4,974 4,974
ofF 98,746 95,822 2,924 14,808 14,808
(i) ~ ~oiP 24,343 24,299 44 5,467 5,467 Cultivators tM 9,466 9,439 27 1,549 1,549
ofF 14,877 14,860 17 3,918 3,918
(ii) ~~ CZlotP 79,408 78,757 651 9,441 9,441 Agricultural labourers tM 23,601 23,406 195 2,685 2,685
ofF 55,807 55,351 456 6,756 6,756
(iii) ql~ql~<t> ~ <I>1fi «iotP 9,861 8,530 1,331 1,209 1,209 Household Industly wori<ers tM 1,017 867 150 74 74
ofF 8,844 7,663 1,181 1,135 1,135
(iv) 3RJ q;>ff ClI"oiP 27,929 24,645 3,284 3,665 3,665 Other workers
~ 8,711 6,697 2,014 666 666 ofF 19,218 17,946 1,270 2,999 2,999
11. iR q;>ff ClJotP 890,450 755,964 134,486 102,356 102,356 Non-wori<ers tM 341,863 290,364 51,499 39,538 39,538
ofF 548,587 465,600 82,9B7 62,818 62,818
39
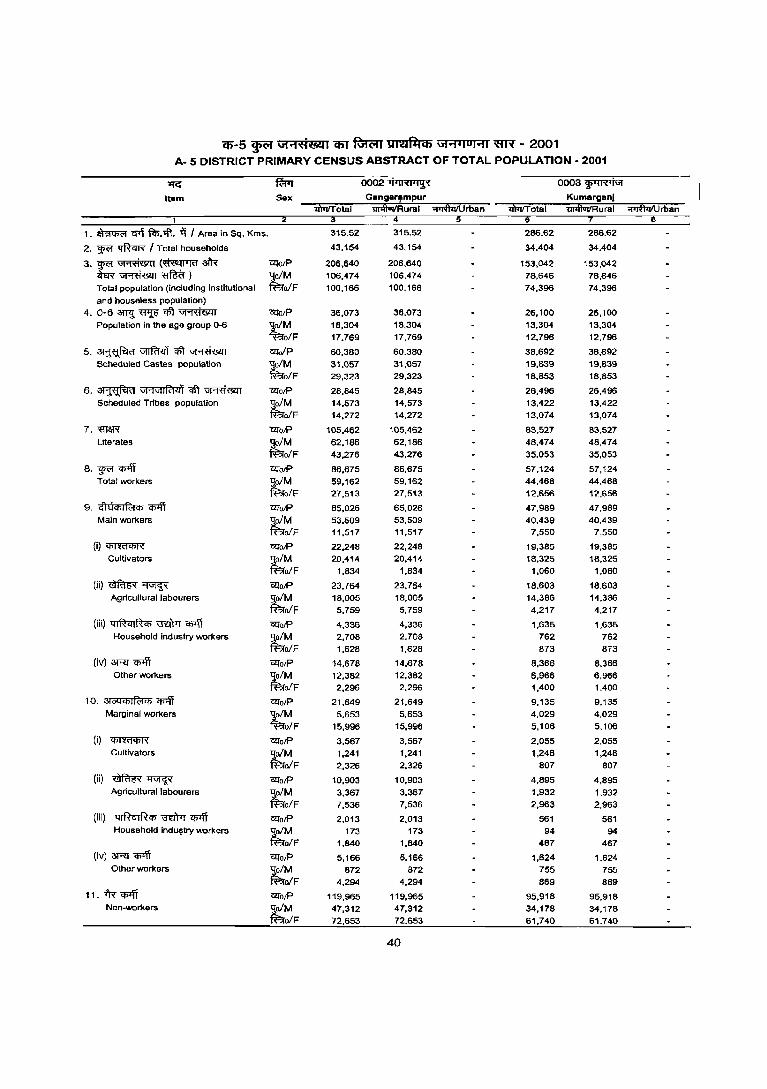
cn-5 ¥ Gi'1'fi1@l1 CIiT ~ lJl\!lfilCh Gi"'i'IOI"'i1 ~ - 2001 A- 5 DISTRICT PRIMARY CENSUS ABSTRACT OF TOTAL POPULATION - 2001
'If<: ~ 0002 ,j'IIi1I'l';f! 0OO3~ Item Sex Gangar,mpur Kumarganl
"!lIltiViiRural :;p:Jfuii(jrban 1JiiIlViiRurai ;;irtfuIU rban
1. ~ '!1"f ~.>ft. >'i I Area in Sq. Kms. 315.52 315.52 266.62 286.62
2. ~ l!ftc:IR I Total households 43.154 43,154 34,404 34,404
3.~~(~3lR <ZiotP 206,640 206.640 153.042 153,042 ~~~) tM 106,474 106,474 78,646 78,646 Tolal population (including institutional ofF 100,166 100,166 74,396 74,396 and houseless population)
4. 0-6 ~~'Ift~ <Zi<J/P 36,073 36,073 26,100 26,100 Population in the age group 0-6 ~M 18,304 18,304 13.304 13,304
ofF 17,769 17,769 12.796 12.796
5. ~ VITfm:IT '1ft ~ <ZiolP 60.380 60.380 38.692 38.692 Scheduled Castes population tM 31.057 31,057 19,839 19,839
ofF 29,323 29,323 18.853 18.853
6. ~ VI"I\il1R't41 qI1 ~ <ZiotP 28,845 28,845 26,496 26,496 Scheduled Tribes population tM 14.573 14.573 13,422 13,422
ofF 14,272 14.272 13.014 13,074
7. meN CZToJP 105,462 105,462 83.527 83.527 Literates tM 62.186 62,186 48,474 48,474
ofF 43.276 43,276 35,053 35,053
8.~~ O!l"otP 86,675 86,675 57,124 57,124 Tolal workers tM 59,162 59,162 44,468 44,468
ofF 27.513 27.513 12.656 12,656
9. cfIU<hlfcl<h ~ CZTo/P 65,026 65.026 47,989 47,989 Main workers tM 53.509 53.509 40.439 40,439
ofF 11.517 11,517 7,550 7,550
(i)~ CZTO/P 22,248 22,248 19,385 19,385 Cultivators tM 20,414 20,414 18,325 18,325
ofF 1,834 1,834 1,060 1,060
(ii)~~ CZTo/P 23.764 23,764 18.603 18.603 Agricultural labourers tM 18,005 18,005 14,386 14,386
ofF 5,759 5,759 4,217 4,217
(iii) ql~ql~<h ~ ~ "&fo/p 4,336 4,336 1,635 1.635 Household industry workers tM 2,708 2.708 762 762
ofF 1.628 1,628 873 873
(iV) ~ <fi1'fi CZTo/P 14,678 14,678 8,366 8.366 Other workers tM 12,382 12,382 6,966 6,966
ofF 2.296 2.296 1.400 1,400
1 O. 3t &4 4> I fcl <h <fllff CZTO/P 21,649 21,649 9.135 9,135 Marginal workers tM 5.653 5,653 4,029 4,029
ofF 15,996 15,996 5,106 5,106
(i) ~ O!l"otP 3.567 3,567 2,055 2,055 Cultivators
~ 1.241 1.241 1,248 1,248 ofF 2.326 2,326 807 807
(ii) ~~ CZTotP 10.903 10,903 4,895 4,895 Agricultural labourers
~ 3,367 3.367 1.932 1,932 ofF 7,536 7,536 2,963 2,963
(iii) ql~qIR<h ~ <Il'ff CZTotP 2,013 2.013 561 561 Household indu'\ltry workers
~ 173 173 94 94 ofF 1,840 1,840 467 467
(iv) 3Rl~ CZToJP 5,166 5.166 1,624 1,624 Other workers
~ 872 872 755 755 ofF 4,294 4,294 869 869
11. "i'R <'P'ft ClfotP 119,965 119,965 95,918 95,918 Non-workers r 47.312 47,312 34.178 34,178
ofF 72.653 72,653 61,740 61.740
40
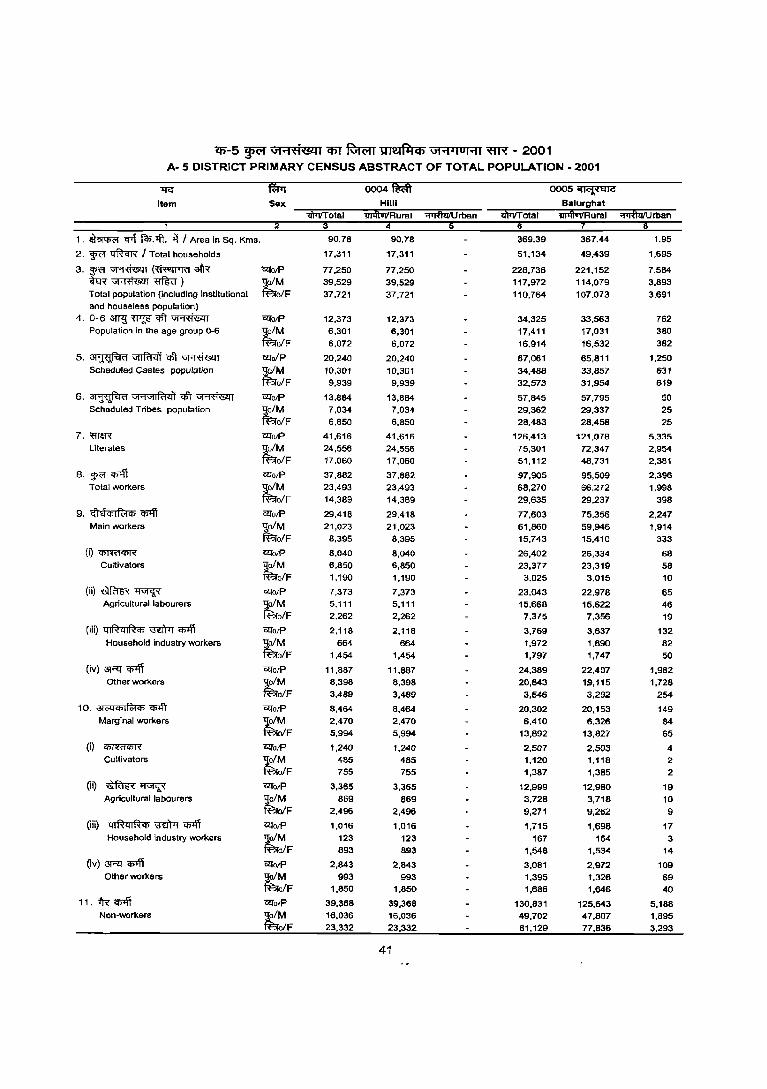
cn-5 wcwr \J1"1'<1'Lc.lIl Cffi fGn;rr ~ "1"1'101"11 ~ - 2001 A- 5 DISTRICT PRIMARY CENSUS ABSTRACT OF TOTAL POPULATION - 2001
'IlG ~ 0004 fhfi 0005~
Item Sex HIlII Balurghat
WTlTotal 1I14tUilRuml ~rban WTlTotal 1114totlRuml "'I;fI<IIUrban
1. ~ 'Cflf fcl>A1. if I Area in Sq. Kms. 90.78 90.78 369.39 367.44 1.95
2. ~ ~ I Total households 17,311 17,311 51,134 49,439 1.695
3.~~(~afR ClfotP 77,250 77,250 228,736 221,152 7.584 ~~<1f%<r) tM 39,529 39,529 117,972 114,079 3,893 Total population (including institutional ofF 37,721 37.721 110,764 107.073 3.691 and houseless population)
4. 0-6~~1'J'lT~ '&fotP 12,373 12,373 34,325 33,563 762 Population in the age group 0-6 tM 6,301 6,301 17,411 17,031 380
ofF 6,072 6,072 16.914 16,532 382
5.~~CIfi~ Cllolp 20.240 20,240 67,061 65,811 1,250 Scheduled Castes population tM 10,301 10,301 34,488 33,857 631
olF 9,939 9,939 32,573 31,954 619
6. ~ Gj'"1'illR!<il 1'J'lT ~ CllolP 13,884 13,864 57,645 57,795 50 Scheduled Tribes. population tM 7,034 7,034 29,362 29,337 25
olF 6.850 6,850 28,483 28.458 25
7. miff'( CllolP 41.616 41,616 126.413 121.078 5,335 Literates tM 24,556 24,556 75,301 72,347 2,954
ofF 17.060 17,060 51,112 48,731 2,381
8. W<'l ~ CZfO/P 37,882 37,882 97,905 95,509 2,396 Total workers tM 23,493 23,493 68,270 66,272 1,998
ofF 14,389 14,389 29,635 29.237 398
9. c(h!cfilfc1C15 ~ CZfolP 29,418 29,418 77,603 75.356 2,247 Main workers tM 21,023 21,023 61,860 59,946 1,914
OfF 8,395 8,395 15,743 15,410 333
(Q~ CllotP 8,040 8,040 26,402 26,334 68 Cultivators tM 6,850 6,850 23,377 23,319 58
ofF 1,190 1,190 3.025 3.015 10
(ii)~~ CZfotP 7,373 7,373 23,043 22,978 65 Agricultural labourers tM 5,111 5,111 15,668 15,622 46
ofF 2,262 2,262 7,375 7,356 19
(iii) 41RcliRCh '3EWT ~ CllO/P 2,118 2,118 3,769 3,637 132 Household industry workers tM 664 664 1,972 1.890 82
ofF 1,454 1,454 1,797 1,747 50
(iv) aRl" ~ CllotP 11,887 11,887 24,389 22,407 1,982 Other workers tM 8,398 8,398 20,643 1.9,115 1,728
olF 3,489 3,489 3,546 3,292 254
10. alC'GChIf<;tCh CJ>4Y CZfO/P 8,464 8,464 20,302 20,153 149 Marginal workers ~M 2,470 2,470 6,410 6.326 84
OfF 5,994 5,994 13,892 13,827 65
(i) ~ CZfolP 1,240 1,240 2,507 2,503 4 Cultivators ~M 465 485 1,120 1,118 2
OfF 755 755 1,387 1,385 2
(ii) ~~ ClfolP 3,365 3,365 12,999 12,980 19 Agricultural labourers ~M 869 869 3,728 3,718 10
OfF 2,496 2,496 9,271 9,262 9
(iii) 41~ql~Cj) ~ "<h'ff CZfo/P 1,016 1,016 1,715 1,698 17 Household industry workers ~M 123 123 167 164 3
OfF 893 893 1,548 1,534 14
(iv) aRl" "<h'ff ClfolP 2,843 2,643 3,081 2,972 109 Other workers
~ 993 993 1,395 1,326 69 IF 1,850 1,850 1,686 1,646 40
11.i'R'~ 'i7fofP 39,368 39,368 130,831 125,643 5,188 Non-workers
~F 16,036 16,036 49,702 47,807 1,895 23,332 23,332 81,129 77,836 3,293
41

Cfi-5 ~ Gt .... tiiSlll em ~ UMfliCb Gt ..... IOI'11 ~ - 2001 A- 5 DISTRICT PRIMARY CENSUS ABSTRACT OF TOTAL POPULATION - 2001
1fG fWr 0006'(fQ'"'t 0007~ Item Sex Tapan Banslharl
iI)7lffotal iiPftVlIRural ;:;:rra<iIU roan lIJiftUIiRural ~lban
1. ~ q>t f<1>.1ft. if I Area in Sq. Kms. 445.63 445.63 196.52 196.52
2. WR I:!ftcIN I Total households 48.263 48.263 25.401 25.401
3'i:~(~atR GllotP 226.136 226.136 122.091 122.091 ~~) r 115.809 115.809 62.534 62.534
Total population (Including institutional blF 110.327 110.327 59.557 59.557 and houseless population)
4. 0-6 aw;! ~ <1ft ~ 1:qorP 37.993 37.993 20.530 20.530 Population In the age group 0-6 ;tM 19.272 19.272 10,396 . 10.396
elF 18.721 18.721 10,134 10.134
5.~~<Jft~ Gllo/P 75.682 75.682 31,269 31,269 Scheduled Castes population tM 38,845 38.845 16,102 16.102
olF 36,837 36,837 15,167 15,167
6. ~ \iI'1\Jj1~4'j '$l' ~ ClI'OIP 50,509 50.509 24,267 24.267 Scheduled Tribes population ;tM 25.446 25,446 12,248 12.248
elF 25,063 25,063 12,019 12.019
7.~ GllotP 110,869 110,869 59,949 59,949 Literates ;tM 65,653 65,653 36,157 36,157
elF 45,216 45,216 23,792 23,792
8.~~ GllotP 102,131 102,131 49,197 49,197 Total workers tM 66,886 66,886 35,034 35,034
olF 35,245 35,245 14,163 14,163
9. <fl dim fc:! ijj <Il'fi 0Zl0lP 71,397 71.397 36,283 36.283 Main workers tM 58,027 58,027 31,186 31,186
elF 13,370 13,370 5,097 5,097
(i)~ iZlorP 31,672 31,672 16,233 16,233 Cultivetors ;tM 28,585 28,5B5 14,738 14,73B
elF 3,087 3,087 1,495 1,495
(ii)~~ GllotP 25,695 25,695 10,474 10,474 Agricultural labourers ;tM 18,600 18,600 B.215 8.215
ofF 7.095 7.095 2,259 2,259
(iii) 41~ql~ijj ~ ~ OZlotP 1,674 1.674 1.278 1.27B Household industry workers ~M 1.086 1,068 B11 Bl1
ofF 586 5B6 467 467
(iv) 3R:I ~ GlloiP 12,356 12,356 B.29S S,29B Other workers ;tM 9,754 9,754 7,422 7,422
ofF 2.602 2.602 876 876
10. a{c;Q<t>If<:t<t> ~ iZlotP 30,734 30,734 12,914 12,914 Marginal workers ~M 8,859 B.859 3.848 3.848
blF 21,875 21,875 9,066 9,066
(i) ~ GlloiP 5.544 5.544 2.056 2.056 Cultivators ~M 2,044 2.044 853 853
ofF 3,500 3,500 1,203 1,203
(ii) ~~ GlloiP 1B,441 18,441 8,918 8,918 Agricultural labourers
t~ 5,486 5,486 2,403 2,403 12.955 12.955 6.515 6,515
(iii) ql~ql~<t>~'Cj)"Ifi O!J'oiP 619 619 694 694 Household industry workers
t~F 105 105 69 69 514 514 625 625
(iv) 3R:I~ GllotP 6.130 6,130 1,246 1.246 Other workers tM 1,224 1,224 523 523
ofF 4,906 4,906 723 723 11. IR' 'Cj)"Ifi 1:qoiP 124,005 124,005 72,894 72.894
Non-workers tM 48,923 48,923 27,500 27.500 ofF 75,082 75,082 45,394 45.394
42
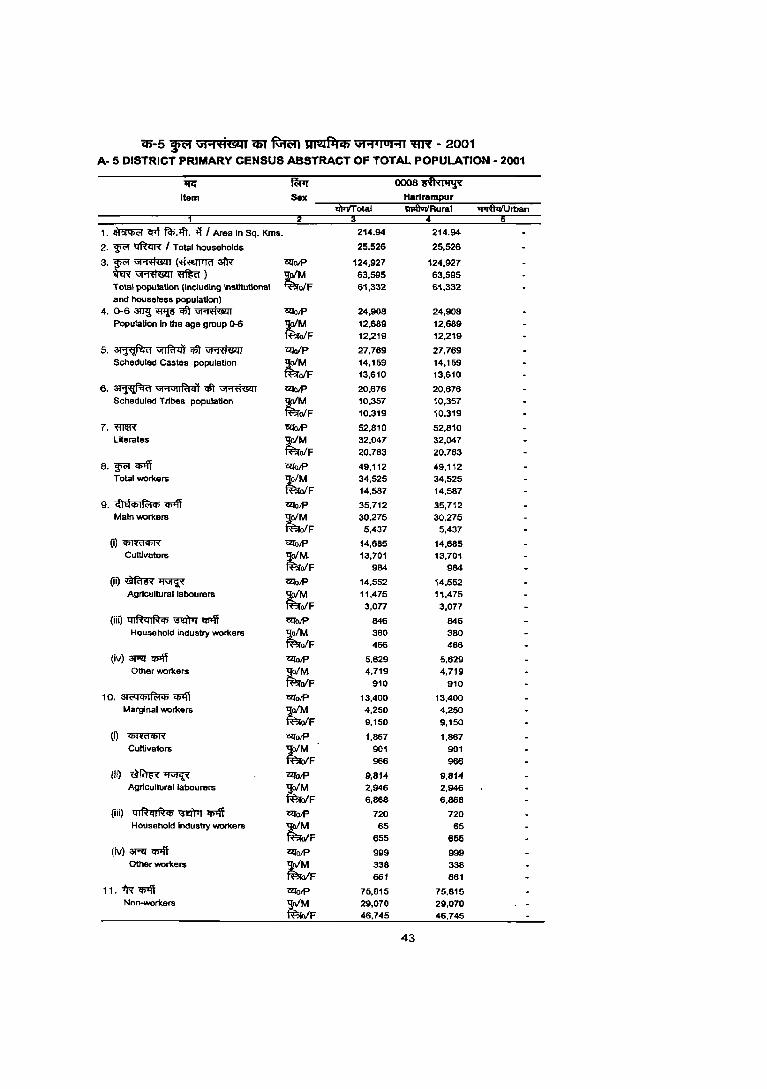
(1;-5 ~ Gi+tt&ll 'i5T'RJ:R;n UI\!IPiCf) Gi'1-IOI'11 ~ - 2001 A- 5 DISTRICT PRIMARY CENSUS ABSTRACT OF TOTAL POPULATION - 2001
lIi:' ffottr 0008 tl4\\{1't~i( Item Sex Harlrampur
tl\lTlTotal iilIIl1iiIRural :;;1JfIliiijrban
1. ~ ~ ~:Jft. T{ I Area In Sq. Kms. 214.94 214.94
2. ~ 1tftm\{ I Total households 25,526 25,526
3.~~(~3l'R -aJ0IP 124,927 124,927 ~~~)
~F 63,595 63,595
Total population (Including Institutional 61,332 61,332 and houseles5 population)
4. 0-6 3W.I 'H'll!' qft ~ -aJolP 24,908 24,908 Population In the age group 0-6 tM 12,689 12,689
ofF 12,219 12,219
5.~~~~ -aJoIP 27,769 27,769 Scheduled Castes population ~M 14,159 14,159
ofF 13,610 13,610
6. ~ ""N1I""<i'f qft ~ -aJoIP 20,676 20,676 Scheduled Tribes population ~M 10,357 10,357
ofF 10,319 10,319
7,~ -aJolP 52,810 52,810 Literates tM 32,047 32,047
ofF 20,763 20,763
8. ~ q;lff -aJolP 49,112 49,112 Tolal workers tM 34,525 34,525
ofF 14,587 14,587
9. 4hlcb I fc:icti q;lff -aJolP 35,712 35,712 Main workers tM 30,275 30,275
ofF 5,437 5,437
(i)~ czrolP 14,665 14,685 Cultivators tM 13,701 13,701
ofF 984 984
(iO~~ czrOlP 14,552 14,552 Agricultural labourers ~M 11,475 11,475
ofF 3,On 3,077
(iiO ql~ql~'" i3l:IPT q;>ff l2folP 846 846 Household industry workers ~M 380 380
ofF 466 466
(iv)~"1I>'ff czrolP 5,629 5,629 Other workers ~M 4,719 4,719
ofF 910 910
10. ai('<lCflIfc:icti"<tilff l2folP 13,400 13,400 Marginal workers
~ 4,250 4,250 ofF 9,150 9,150
(Q "ctiffifIf>ff l2f0lP 1,867 1,867 Cultivaton; tM 901 901
ofF 966 966
(ii) ~~ ClloIP 9,814 9,814 Agricultural labourers tM 2.946 2.946
ofF 6,868 6,868
(iii) ql~ql~'" ~ q;>ff czrolP 720 720 Household Industry worKers
~F 65 65 655 655
(iv) ~ q;>ff czro!P 999 999 Other workers
~F 338 338 661 661
11. ~<i>'l'i czroJP 75.815 75,815 Non-workers tM 29.070 29.070
oIF 46,745 46,745
43
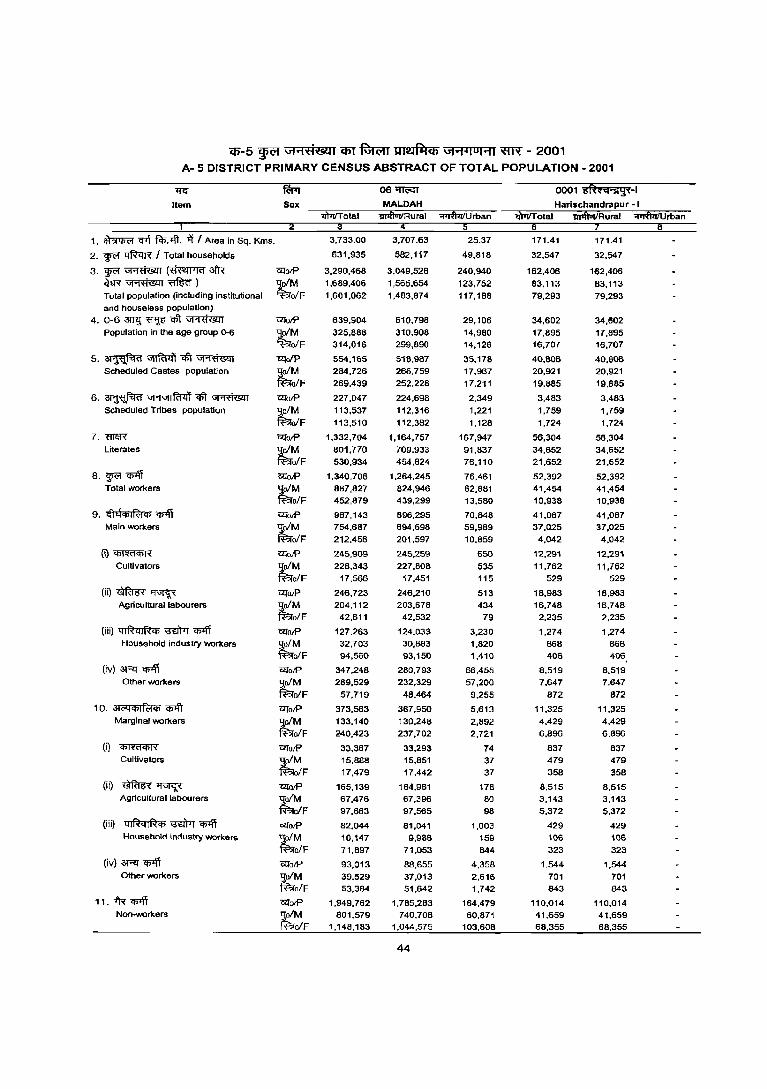
iP-5 ~ \i1'1tt'&ll QlT ~ UTla~Cf) ut .... 410 1'11 ~ - 2001 A- 5 DISTRICT PRIMARY CENSUS ABSTRACT OF TOTAL. POPUL.ATION - 2001
"I{<:"
Item
1, ~ cpf FcP,-.ft, ~ / Area in Sq, Kms,
2, WC'f ~ / Total households
3, WC'f ~ (~ 3ft< ffi~~) Total population (including institutional
and houseless population)
4, 0-6 3'ITY ~ <1ft ~ Population in the age group 0-6
5,~~ctt~ Scheduled Castes population
6, ~ Gj·!Gjlf(jll'j ~ ~ Scheduled Tribes populaUon
7, mIlR Literates
8,~~ Total workers
9, Gl<iclil~ij) ~ Main workers
(i)~
Cultivators
(ii) ~ 'I1'GI<f< Agricultural labourers
(iii) q[Rql~'" "3"rit7f'iP'fi Household industry WOrkers
(iv) ¢R:I' ~ Other workers
10, 3t~"'If(;j", CI>'ff Marginal workers
(i)~
Cultivators
(ii) ~ 'I1'GI<f< Agricultural labourers
(iii) ql~qIRij) ~ ~ Household industry workers
(iv) ~ 'iP'fi Other workers
11,~~ Non-workers
Sex
'Ul'otP 1_lolM ~oIF
'Ul'oIP 1jJ/M ~o/F 'Ul'olP
'lo/M ~oIF
'5!l'olP ;j;oIM i'aoiF 'Ul'olP 1jolM i'ao/F
'Ul'olP 1J:oIM i'ao/F 'Ul'OJP
1_lo/M i'ao/F
'5!l'OJP ;j;o/M i'ao/F
'Ul'olP 1_lo/M ~oIF
«IotP 'loiM ~oIF 'Ul'otP ;j;oIM ~oIF
<ZfotP 'loiM fi'?loIF 'Ul'otP
'loiM ~oIF «IotP
'loiM fi'?lo/F «IotP 'loiM R?ro/F
'Ul'otP 'lolM ~oIF
3,733,00
631,935
3,290,468
1,689,406
1,601,062
639,904 325,668 314,016
554,165 284,726
269,439
227,047
113,537 113,510
1,332,704 801,770 530,934
1,340,706 867,827 452,879
967,143 754,687
212.456
245,909
228,343 17,566
246,723 204,112
42,611
127,263 32,703 94,560
347,248 289,529
57,719
373,563
133,140 240,423
33,367 15,888
17,479
165,139 67,476 97,663
82,044 10,147 71,897
93,013 39,629 53,384
1,949,762 801,579
1,148,183
06~
MALDAH
3,707,63
582,117
3,049,528
1,565,654
1,483,874
610,798 310,906 299,890
518,987 266,759
252,228
224,698
112,316 112,382
1,164,757 709,933 454,824
1,264,245 624,946 439,299
696,295 694,698 201,597
245,259
227,608 17,451
246,210 203,678
42,532
124,033 30,883 93,150
280,793 232,329
48,464
367,950
130,248 237,702
33,293 15,851 17,442
164,961 67,396 97,565
81,041
9,988 71,053
88,655
37,013 51,642
1,785,283 740,708
1,044,575
44
25.37
49,818
240,940
123,752 117,188
29,106 14,980 14,126
35,178 17.967
17.211
2,349
1,221 1,128
167,947 91,837 76,110
76.461 62,881 13,580
70,848
59,989 10.859
650
535 115
513 434
79
3,230 1,820 1,410
66,455
57,200 9,255
5,613
2,892 2,721
74 37 37
178 80 98
1,003
159 844
4,358
2,616 1,742
164,479 60,871
103,608
0001 t<fh'tlOjj!l't-1 Harischandrapur -I
171,41
32,547
162,406
83,113
79,293
34,602 17,895 16,707
40,806 20,921
19.885
3,483
1,759 1,724
56,304 34,652
21,652
52,392 41,454 10,938
41,067 37,025
4,042
12,291
11,762 529
18,983 16,748
2,235
1,274
868 406
8,519 7,647
872
11,325
4,429 6,896
837 479
358
8,515
3,143 5,372
429
106 323
1,544
701 843
110,014 41,659 68,355
171.41
32,547
162,406
83,113 79,293
34,602 17,895 16,707
40,606 20,921
19,885
3,483
1,759 1,724
56,304 34,652 21,652
52,392 41,454
10,938
41,067 37,025 4,042
12,291
11,162 529
18,983 16,148
2,235
1,274 868 406
8,519 7,647
872
11,325
4,429 6,896
837 479
358
8,515 3,143 5,372
429 106
323
1,544
701 843
110,014 41,659 68,355

(fi'-5 ~ \i1"i'<1i@01i (fi'J 'R;n;n ~ \iI"i"iui"ii ~ - 2001 A- 5 DISTRICT PRIMARY CENSUS ABSTRACT OF TOTAL POPULATION - 2001
~ fWT 0002 I.'lfh'i:lOji'i~-11 0003.-~-1
Item Sex Cha"chal-I lI)l1f1' otal ifI1l\1JIIRural "'iii6iNrban
1
1. ~ ~ f.'I;.'4T. o'j J Area in Sq. Kms. 217.21 217.21 162.14 162.14
2. ~ l:JftcrR J Totel households 34,501 34,501 37,430 37,430
3.~~(~~ CZI01P 198,039 198,039 174,204 174,204 W~~) tM 102,066 102,066 89,182 89,182 Total population (including institutional olF 95,973 95,973 85,022 85,022 anc:l hOuseless population)
4. 0-6 ~ ~ qft ~ CZIotP 46,971 46,971 32,972 32,972 Population in the age group 0-6 tM 24,109 24,109 16,614 16,614
ofF 22,862 22,862 16,358 16,358
5,~~qft~ CZIo1P 22,126 22,126 23.736 23,736 Scheduled Castes popUlation tM 11,480 11,480 12,076 12,076
olF 10,646 10,646 11,660 11,660
6. ~ "1'1"1IR'1<11 ctt ~ CZI01P 5,384 5,384 664 664 Scheduled Tribes population tM 2,733 2,733 348 348
ofF 2,651 2.651 336 336
7.~ CZIotP 61,485 61.485 79,252 79,252 Literates tM 37,159 37,159 46,329 46,329
olF 24,326 24,326 32,923 32,923
8. '¥f q;>ff ~otP 62,862 62,862 61,599 61,599 Total workers tM 53,334 53,334 48,345 48,345
ofF 29,528 29,528 13,254 13,254
9. ~h!Cji I R:!CIl <fiIff <.!lotP 49.767 49,767 47,906 47.906 Main workers ~M 43,572 43,572 42,766 42,766
ofF 6,195 6,195 5,140 5,140
(i)~ QQ"otP 20.293 20,293 13,714 13,714 Cultivators tM 19,292 19,292 13,063 13,063
ofF 1.00" 1.001 651 651
(ii)~~ <.!lo/P 18.118 18,118 19,698 19,698 Agricultural labourers ~M 15.616 15,616 H,581 17,581
ofF 2.502 2,502 2.117 2,117
(iii) ql~ql~CIl '\3€1'itr ~ QQ"O/P 1,195 1,195 1,425 1,425 Household industry workers tM 686 686 843 843
ofF 509 509 582 582
(iv) 3R<~ QQ"otP 10.161 10.161 13.069 13,069 Other workers tM 7.978 7,978 11,279 11,279
olF 2.163 2,183 1,790 1,790
10. 31 <'<I q; I fcl CIl q;>ff "&rotP 33.095 33,095 13,693 13,693 Marginal workers tM 9.762 9.762 5,579 5,579
ofF 23.333 23.333 8.114 8.114
(i) ~ "&rolP 6.104 6.104 1,880 1.880 Cultivators tM 2,219 2.219 805 805
ofF 3,865 3.885 1,075 1,075
(ii) ~~ "&rolf' 14,378 14,378 8,999 8.999 Agricultural labourers ~M 6.009 6.009 3,671 3.671
ofF 8,369 8,369 5,328 5.328
(iii) ql~ql~q; ~ <Il'ff l2folP 2.059 2.059 432 432 Household industry workers tM 131 131 75 75
ofF 1.928 1,928 357 357
(iv) 3R< q;>ft "&rolP 10.554 10,5!?" 2,362 2;382 Other workers tM 1.403 1.403 1,028 1,028
ofF 9,151 9,151 1,354 1.354
1 1. -fr;{ "lIf'ff ClIolP 115,177 115.177 112,605 112.605 Non-workers tM 46,732 48,732 40,637 40,637
ofF 66,445 66.445 71,768 71.766
45

q;-5 ~ U1'1::«'8tlI1 C6l fGwrr ~~C6 G1'1'luHI ~ - 2001 A- 5 DISTRICT PRIMARY CENSUS ABSTRACT OF TOTAL POPULATION - 2001
~ ~ 0004~-'' 0OO5~-1
Item Sex Ratua -I "iii1iIT otal 1iTiftVVRural ~rban
8
1. ~ Cf'f ~:ift. -if I Area in Sq. Kms. 205.22 205.22 230.53 230.53
2. w<'! ttftcrR" f Total households 31,679 31,679 38,140 38,140
3. w<'! ~ (Wn>m ~ CZlolP 165,192 165,192 217,356 217,356 W~~) tM 84,175 84,175 112,396 112,396 Total populatlon (including Institutional ofF 81,017 81.017 104,960 104,960 and houseless population)
~ 4. 0-6 am.! ~ Clft ~ CZlolP 35,262 35,262 46,588 46,588 Population in the age group 0-6
~ 17,900 17,900 23,561 23,561 ofF 17,362 17,362 23,027 23,027
5.~~mqfi~ CZlo/p 14,518 14,518 17,646 17,646 Scheduled Castes population tM 7,215 7,275 9,109 9,109
olF 7,243 7,243 8,537 8,537
6. ~ Gl'1GlIRi41 -ott ~ CZlO/P 11,798 11,198 16,138 16,138 Scheduled Tribes population tM 5,933 5,933 8,286 8,286
ofF 5,865 5,865 7,852 7,852
7. 'ffl15X CZlO/P 57,806 51,806 76,821 16,821 Literates ~M 33,917 33,977 47,184 47,184
ofF 23,829 23,829 29,631 29,637
8. W<1~ CZlO/P 64,584 64,584 74,539 74,539 Total workers tM 44,397 44,397 56,278 56,278
ofF 20,187 20,187 18,261 18,261
9. <ft~ <l>4'i CZloiP 43,258 43,258 50,798 50,798 Main workers ;tM 37,076 31,076 45,719 45,719
ofF 6,182 6,182 5,019 5,019
(i)~ CZlO/P 16,605 16,605 18,838 18,838 Cultivators tM 15.893 15,893 18,237 18,237
ofF 712 712 601 601
(ii)~~ CZlolP 16,445 16,445 15,002 15,002 Agricultural labourers tM 13,566 13,566 13,401 13,401
ofF 2,879 2,879 1,601 1,601
(iii) QIRcilRq; ~ ~ CZlO/P 1,563 1,563 2,110 2,110 Household industry workers tM 627 627 958 958
ofF 936 936 1,152 1,152
(iv) 3RT~ CZlolP 8,645 8,645 14,848 14,848 Other workers tM 6,990 6,990 13,183 13,183
o/F 1,655 1,655 1,665 1,665
10. 6l;:;qq;1~q> <l>4'i CZlO/P 21,326 21,326 23,741 23,741 Marginal workers tM 7,321 7,321 10,499 10,499
ofF 14,005 14,005 13,242 13,242
(i) ~ CZlolP 2,839 2,839 2,423 2,423 Cultivators tM 1,319 1,319 1,354 1,354
olF 1,520 1,520 1,069 1,069
(ii) ~~ CZlO/P 12,864 12,864 14,878 14,878 Agricultural labourers tM 4,928 4,928 6,834 6,834
olF 7,936 7,936 6,044 8,044
(iii) ql~ql~q; m:Wt ~ CZlO/P 1,526 1,526 1,841 1,841 Household industry workers
~ 91 91 207 207 ofF 1.435 1,435 1,634 1,634
(iV) 3f"ll CI>Ifi CZlO/P 4,097 4,097 4,599 4,599 Other workers tM 983 963 2,104 2,104
olF 3,114 3,114 2,495 2,495
11.~~ CZloiP 100,608 100,608 142,B17 142,817 Non-workers tM 39,778 39,778 56,118 56,11B
olF 60,830 60,830 86,699 86,699
46

(fi'-5 ~ \Jt .... 'fii8tll CfiT ~ UltlfliCb \Jt ..... IO ..... 1 ~ - 2001 A- 5 DISTRICT PRIMARY CENSUS ABSTRACT OF TOTAL POPULATION - 2001
~ ~ 0006~-1I 0007'11'Fv1'tii1' Item Sex Gazol.
ul4IollRural ~rban 1
1. ~ err. fcl;.1ft. it J Area in Sq. Kms. 173.93 173.93 513.65 513.65
2. ~ "!l"ftcrR I Total households 30,789 30,789 59,487 59,487
3. w<'I ~ (~ afR 0ll"0IP 160,904 160,904 294,715 294,715 mR~~)
tM 82.297 82,297 150,303 150,303 Total population (including institutional ofF 7B,607 78,607 144,412 144,412 and houseless population)
4. 0-6~~qft~ Oll"otP 33,959 33,959 53,724 53,724 Population in the age group 0-6
tM 17,123 17,123 27,133 27,133
ofF 16,B36 16,B36 26,591 26,591
5.~~qft~ "C2:io/P 12.812 12,812 98,649 98,649 Scheduled Castes population ~ 6,531 6,531 50,683 50,683
ofF 6.281 6,281 47,966 47,966
6. ~ "1'1"11fi'141 qft ~ "&!OIP 1,607 1,607 58,076 58.076 Scheduled Tribes population
tM 797 797 28,793 28.793
ofF 810 810 29,283 29.283
7. maR "C2:io/P 60.726 60,726 122,974 122,974
Literates tM 35,509 35,509 75,739 75,739
ofF 25,217 25,217 47,235 47,235
8. w<'I ~ CZlotP 59,240 59,240 122,374 122,374 Tota I workers
tM 42,358 42.358 81,798 81,798 ofF 16,B82 16,882 40,576 40,576
g. <fI€lcl>l~q; ~ CZlotP 42.654 42,654 86,695 86,695 Main workers "9,o/M 36,435 36,435 70,640 70,640
~ofF 6,219 6,219 16,055 16,055
(i)~ Oll"otP 12,821 12,821 36,154 36,154 Cultivators
tM 11,964 11,964 32,415 32,415
ofF 857 857 3,739 3,739
(ii)~~ Oll"otP 13,458 13,45B 27,533 27,533 Agricultural labourers "9,ofM 11,716 11,716 19,985 19,985
~ofF 1,742 1,742 7,546 7,548
(iii) qlRqlR<t> \3EI)T[ ~ Oll"otP 1,243 1,243 3,024 3,024 Household industry workers
tM 546 546 1,324 1,324 ofF 697 697 1,700 1.700
(iv) 3R:I~ CZlO/P 15,132 15,132 19,984 19,984
Other workers ~M 12.209 12.209 16,916 16.916 ofF 2.923 2.923 3.066 3,066
10. 31C'4<t>I~<t> ~ CZlutP 16,586 16.566 35.679 35,679 Marginal workers
tM 5.923 5,923 11,158 11,158
ofF 10.663 10,663 24,521 24,521
(i) ~ CZlotP 1,605 1,805 5,142 5,142 Cultivators
tM B09 609 2.113 2,113
ofF 996 996 3,029 3,029
(ii) ~~ "&!otP 7,732 7,732 26,486 26,488 A9riculturallabourers
tM 3,406 3,406 7,646 7,646
ofF. 4,326 4,326 18,842 18,842
(iii) qlRcllR<t> \3EI)T[ ~ "&!otP 1,419 1,419 1,307 1,307 Household industry workers ~ 101 101 176 176
ofF 1,318 1,318 1,131 1,131
(iv) 3R:I ~ CZlotP 5,630 5,630 2,742 2,742 Other workers ~M 1,607 1,607 1,223 1,223
ofF 4,023 4,023 1.519 1,519
11. "i'R"~ <ZIotP 101,664 101,664 172,341 172,341 Non-workers tM 39,939 39.939 68,505 68,505
ofF 61,725 61,725 103,836 103,836
47

Cf)-5 ~ \jH'ttilYll Cf)J fGR;rr met~Ch U1'1'IOI'1J 'aN - 2001 A- 5 DISTRICT PRIMARY CENSUS ABSTRACT OF TOTAL POPULATION - 2001
'If<: ~ 0008 .. 1'1 ..... 1)<'11 OOOg~ Item Sex Hablbpur
ulllluVRural ~rtlan
1. ~ <I"'t f<I>.lft. -q J Area in Sq. Kms. 205.91 205.91 396.07 39~.33 2.74
2. w<'f ~ I Total households 26,238 26,238 39,357 35,902 3,455
3.~~(~afR 12T0IP 127,252 127,252 187,650 171,125 16,525 <feR~~) tM 65,258 65,258 94,945 86,549 8,396 Total population (including institutional ofF 61,994 61,994 92.705 84.576 B,129 and houseless population)
4. 0-6 am.! ~ qI't ~ ClTotP 20,923 20,923 31,554 29,349 2,205 Population in the age group 0-6 ~M 10,628 10,628 15,863 14,760 1,103
ofF 10,295 10,295 15,691 14,589 1,102
5.~~qlt~ 12ToIP 63.459 63.459 86,865 81,349 5.516 Scheduled Castes population t.M 32,Bl0 32,810 44,231 41,458 2,773
ofF 30,649 30,649 42,634 39.891 2,743
6. ~ VI'1"1IR1Ji qI't ~ "UlolP 25,083 25,083 55,961 55.777 184 Scheduled Tribes population tM 12.485 12,485 27,594 27,493 101
ofF 12,598 12,598 28,367 2B,284 83
7. miff'( 12TolP 59,655 59,655 75,267 64,711 10,556 Literates tM 36,B63 36,863 47,242 41,334 5,908
ofF 22,792 22.792 28,025 23.377 4,648
8. ~ cmff C2foIP 52,211 52,211 88,103 82,130 5,973 Total workers tM 35.917 35,917 53,237 48.908 4.329
ofF 16,294 16,294 34,866 33,222 1,644
g, ~eftjjl~q; 'tjj1ff 12T0IP 37,490 37,490 62,372 57,202 5,170 Main workers tM 31,065 31,065 45,525 41,559 3,966
ofF 6,425 6,425 16,847 15,643 1,204
(i)~ C<loIP 17,149 17,149 24,495 24,140 355 Cultivators tM 15,684 15,684 20,292 19,982 310
olF 1,465 1,465 4,203 4,158 45
(jj)~~ 'IllI'olP 12,882 12,882 21,077 20,867 210 A9ricultural labourers tM 8,B98 B,89B 12,867 12,695 172
ofF 3,984 3,984 8.210 8.172 38
(Iii) ql~<IIRq; ~ q;off 12TolP 757 757 3,986 3,008 978 Household induStry worl<ers tM 566 566 1,314 948 366
ofF 191 191 2,672 2,060 612
(iv) 3RT q;;fi 'IllI'o/P 6,702 6,702 12,814 9,187 3,627 Other workers tM 5,917 5,917 11,052 7,934 3,118
ofF 785 785 1,762 1,253 509
10. 3l(iQq;1~4> q;-.ff 'IllI'aIP 14,721 14,721 25,731 24.92B 803 Marginal workers t.M 4,652 4,852 7,712 7,349 363
olF 9,869 9,869 18,019 17,579 440
(i) '¢ffi!q;R "UlotP 2,343 2,343 2,741 2,695 46 Cultivators
t~F 1,126 1,126 1,078 1,063 15 1,217 1,217 1,663 1,632 31
(ii) ~~ CLlolP 11,440 11,440 19,058 18,992 66 Agricultural labourers tM 3,233 3,233 5,579 5,557 22
ofF 8,207 8,207 13,479 13,435 44
(iii) q I ~ ill ~ q; '3'tim q;;fi ?<fotP 302 302 1,512 1,280 232 Household industry workers tM 62 62 139 99 40
ofF 240 240 1,373 1,181 192 (~v) 3R' q;;fi <2JotP 636 636 2,420 1,961 459
Other workers tM 431 431 916 630 286 o/F 205 205 1,504 1,331 173
11. 1'R q;-.ff CLlolP 75,041 75,041 99,547 88,995 10,552 Non-workers
fZF 29,341 29,341 41,708 37,641 4,067 45;700 45,700 57,B39 51,354 6,485
48
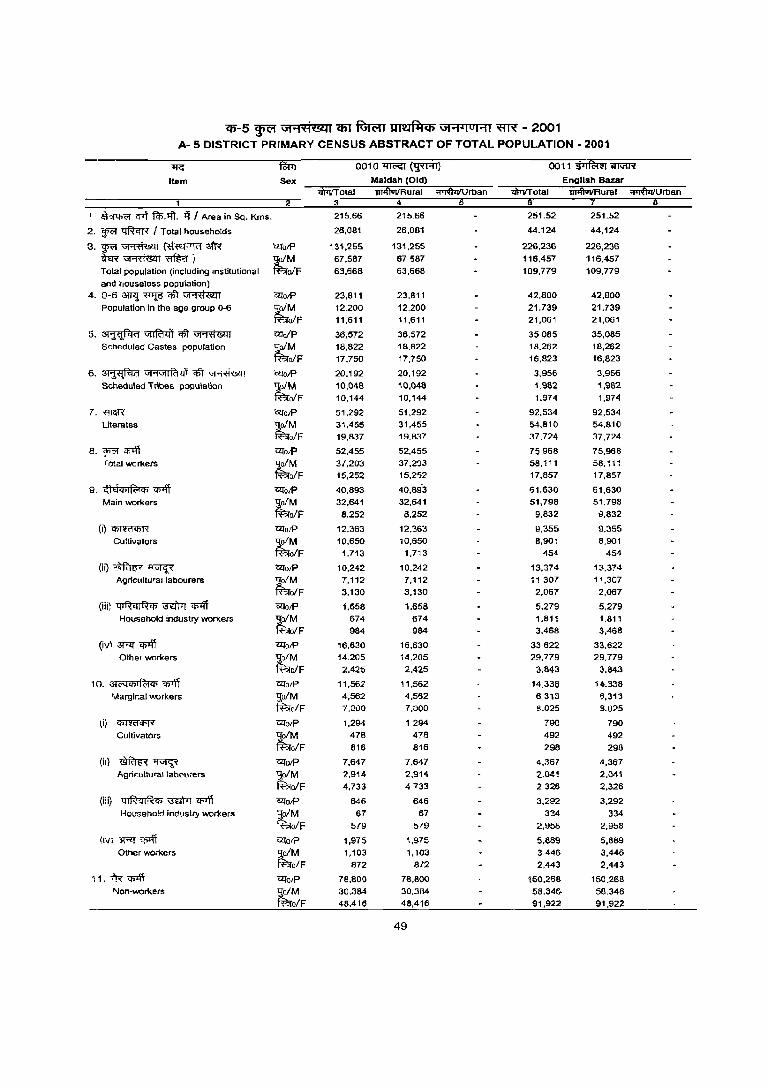
0-5 ~ Gi"1t1'L<41 <61"Rirro ~ Gi"'t.l ol"1l ~ - 2001 A- 5 DISTRICT PRIMARY CENSUS ABSTRACT OF TOTAL POPULATION - 2001
~ fu 0010 li'Il'GT (~) 00 11 '!P1fc'm 'imffi'(
Item Sex Maldah (Old) English Bazar 11\>111'0181 1JI4'lVlIRurai ~Rural <;fiJ&Urban
2 3 4 I ~ q-rj fcp.lft. i'j I Area in Sq. Krns. 215.66 215.66 251.52 251.52
2, ~ ~ I Total households 26,081 26,081 44.124 44,124
3, ~ ~ (~'""!"f<l 3fR CLIo!? 131,255 131,255 226,236 226,236
~~~j tM
67,587 67 '587 116,457 116,457
Total population (including Institutional ofF 63,668 63,668 109,779 109,779
and houseless population) 4, 0-6 3W:l ~ *' ~ Cll"O/P 23,811 23,811 42,800 42,800
Population In the age group 0-6 tM
12,200 12,200 21,739 21,739
olF 11,611 11,611 21,061 21,061
5,~~*,~ molp 36,572 36,572 35085 35,085
S<:heduled Castes population 'J;oIM 18,822 18,822 18,262 18,262
fi'l;rolF 17,750 17,750 16,823 16,823
6. ~ vt'1"1IRlll' qft ~ CZfO/P 20,192 20,192 3.956 3,956
Scheduled Tribes populaUon llo/M 10,048 10,048 1,982 1,982
ffto/F 10,144 10,144 1.974 1,974
7, -mm Cll"o/P 51,292 51,292 92,534 92,534
Literates ~o/M 31,455 31,455 54,810 54,810
fi'l;ro/F 19,837 19,837 37,7<'4 37,724
8. ~-'f 1f"Iff Cll"OJP 52,455 52,455 75968 75,968
T Dtal we rkers tM 37,203 37,2Q3 58.111 58.111
o/F 15,252 15.2'52 17,857 17,857
9, ~elq;If<:iCfl ~ Cll"otP 40,893 40,893 '31,630 61,630
Main wor!(ers tM 32.641 32,641 51,798 51,798
oIF 8,252 8,252 9,832 ,M32
(i) "Cflffi'fCflR CLlOIP 12,363 12.:!63 9,355 9.355
Cultivators tM 10,650 10,650 8,901 8,901
ofF 1,713 1,713 454 454
(iO~l>~ CLlOIP 10,242 10,242 13,374 13,374
Agricultu'al labourers tM 7,112 7,112 11307 11,307
ofF 3,130 3,130 2,067 2,067
(iii) 41~ql~'Ii ~ q;-;jf <2Io!? 1,658 1,658 5,279 5,279 Household Industry wor!(ers tM 674 674 1,811 1,811
ofF 984 984 3,468 S,468
(iv\ 3Rl' 'Cfl1ff CZ[OIP 16,630 16,630 33622 33,'322
Other wor!(ers tM 14.205 14.205 29,779 29,779
ofF 2,425 2,425 3.843 3,843
10. ~<!PlT U,[OIP 11,562 11,562 14.336 14.338
'IiIargir.al workers ~o/M 4,562 4,552 6313 ?,313
ffto/F 7,000 7,000 [1.025 8.025
(i) <Pffir<FR" <2IOIP 1,294 1294 790 790
Cultivators tM
478 478 492 492
ofF 816 816 298 298
(iI) ~~ <2IOIP 7,647 7.647 4,367 4,367
Agli~ul1ura' lab~li;"erS :!ofM 2,914 2,914 ,,0.;' 2,Q41
fftoiF 4,733 4 7 33 ;2 326 2,326
(iii) ~q;~cf'11'i <2IolP 646 646 3,292 3,292
Househo!d ind'Jstry wor!(ers tM
67 67 334 334
ofF 579 579 2,958 2,958
(IV I ,,~ o;.ofr 12IofP 1,975 1,975 5,889 5,889 Other wor!(ers -g;o/M 1,103 1,103 3446 3,446
ffto/F 872 8'2 2,443 2,443
11.fR:~ CZ!OIP 78,800 78,800 150,268 150,268
Non-worners ~M 30,384 30,384 58,34& 58.346
olF 48,416 46,416 91,922 91,922
49
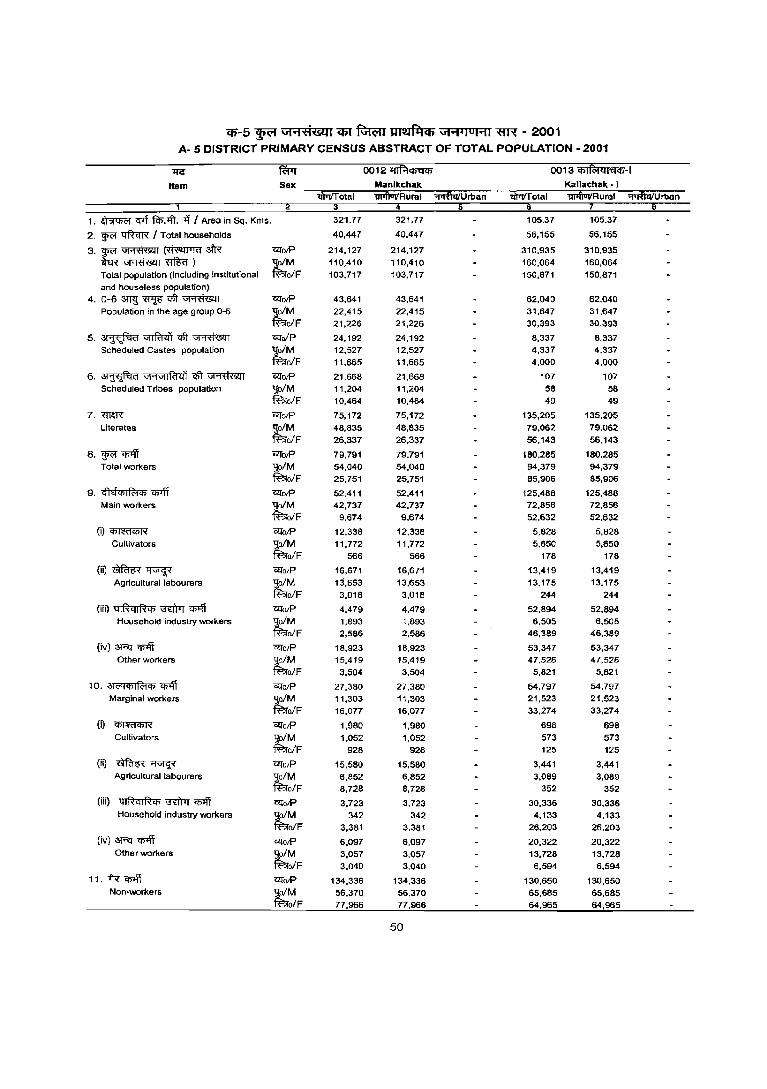
q;--5 ~ GH·('k."41 <PI ~ ~ "''''1'11 0 1''11 ~ - 2001 A- 5 DISTRICT PRIMARY CENSUS ABSTRACT OF TOTAL POPULATION· 2001
"11<:" fWT 0012 '1lf.1ijitjiji 0013 ijiIRiilU ..... iji-1
Item Sex Manlkchak Kallachak-I l/iTTIT otal WftiiifRural ~rban 1iiTtiT olal WftiiifRural ;rtTfuiIU rban
3 4
1. ~ cpf fcI;'.1ft. -<i I Area In Sq. Kms. 321.77 321.77 105.37 105.37
2. w<" qftqJ;( I Total households 40,447 40,447 56,155 56,155
3. w<" ~ (~3lR «iotP 214,127 214,127 310,935 310,935
W~~) tM
110,410 110,410 160,064 160,064
Total population (including Institutional olF 103,717 103,717 150,871 150,871 and houseless population)
4. 0-6~~qft~ «io/P 43,641 43,641 62,040 62,040
Population in the age group 0-6 tM
22,415 22,415 31,647 31,647 olF 21,226 21,226 30,393 30,393
5. ~~CIft~ «(DIP 24,192 24,192 8,337 8.337 Scheduled Castes population
tM 12,527 12,527 4,337 4,337
ofF 11.665 11,665 4,000 4,000
6. ~ Vl'1VlIRt<ll qft ~ «(oIP 21.668 21,668 107 107
Scheduled Tribes population 1jo/M 11,204 11,204 58 58 fBro/F 10,464 10,464 49 49
7.mm «iolP 75,172 75,172 135,205 135,205
Literates tM
48,835 48,835 79,062 79,062
olF 26,337 26,337 56,143 56,143
8, w<" CflIfi «iO/P 79,791 79.791 180,285 180,265 Total workers 1jo/M 54,040 54,040 94,379 94,379
iFsro/F 25,751 25,751 85,906 85,906
9. cfIelq;If<:i<b CI>lff «(O/P 52,411 52.411 125,488 125,488 Main workers 1jofM 42,737 42,737 72,856 72.856
iFsrofF 9.674 9,674 52,632 52,632
(i)~ C<:f<lIP 12.338 12,338 5.828 5,828 Cultivators 1jofM 11,772 11,772 5,650 5,650
iFsro/F 566 566 178 178
(ii)~~ «(O/P 16,671 16,671 13,419 13,419
Agricultural labourers tM
13,653 13,653 13.175 13.175 o/F 3,018 3,018 244 244
(iii) 41Rqlfh, ~ '4>lff C2loIP 4,479 4,479 52,894 52,894 Household industry workers ~M 1,893 1,893 6,505 6,505
olF 2,586 2,586 46,389 46,389
(iv) 3RT <!>4t C2l0/P 18,923 18,923 53,347 53,347 Other workers
tM 15,419 15.419 47.526 47,526
olF 3,504 3,504 5,821 5,821
10. ;:)j('qq;If<:i<b CI>lff «(alP 27,380 27,380 54,797 54,797 Mar9inal workers
tM 11,303 11,303 21,523 21,523
ofF 16,077 16,077 33,274 33,274
(i) ~ C2l0/P 1,980 1,980 698 698 Cultivators tM 1.052 1,052 573 573
ofF 928 928 125 125
(ii) ~~ C2loIP 15,580 15,580 3,441 3,441 Agricultural labourers
tM 6,852 6,852 3,089 3,089
olF 8,728 8,728 352 352
(iii) QIRqlRiJi ~ <!>4t C2loIP 3,723 3,723 30,336 30,336 Household industry workers
tM 342 342 4.133 4,133
ofF 3,381 3,381 26.203 26.203
(iv) 3RT ~ C2l:otP 6,097 6,097 20,322 20,322 Other workers
tM 3,057 3,057 13,728 13,728
ofF 3,040 3,040 6.594 6,594
II.TR~ C2lotP 134,336 134,336 130.650 130,650 Non-workers
tM 56.370 56.370 65,685 65,685
ofF 77,966 77,966 64,965 64,965
50

(6'-5 ~ \if"1'<"i'Bll1 C6T P-;wrr Ullllfl:lCh '11'1 410 1"'11 ~ - 2001 A- 5 DISTRICT PRIMARY CENSUS ABSTRACT OF TOTAL POPULATION - 2001
1fC! fWr 0014 q;1~41'tjq;-1I 0015 c"I~41i1q;-1II Item Sex Kallachak -III
IIloft.o'Rural ~rb8n
1. ~ ~ ~:tfi. if I Area in Sq. Kms. 222.73 222.73 260.12 260.12
2. ~ ~ I Total households 39,396 39,396 49,201 49,201
3.~~~3fR 1l!l'otP 211,406 211,406 284,376 284,376 ~~~) tM 108,921 108,921 146,876 146,876 Total population (including Institutional ofF 102,485 102,485 137,500 137,500 and houseless population)
4. 0-6 3mj ~ <1ft ~ 1l!l'0IP 43,217 43,217 60,939 60,939
Population in the age group 0-6 ~M 22,029 22,029 31,155 31,155
ofF 21,188 21,188 29,784 29,784
5.~~<Ift~ 1l!l'ofP 17,349 17,349 22,351 22,351 Scheduled Castes population
t~F 8,967 8,967 11,501 11,501
8,382 8,382 10,850 10,850
6. ~ "''1'''1\1141 ct5T ~' 1l!l'olP· 13 13 732 732 Scheduled Tribes population ~M 10 10 387 387
ofF 3 3 345 345
7. ~lIR 1l!l'olP 77,523 77,523 93,297 93,297 Liierates ~M 46,784 46,784 60,241 60,241
ofF 30,739 30,739 33,056 33,056
8. ~ q>ifi 1l!l'0IP 9'1,145 91,145 132,670 132,670 Total workers tM 54,601 54,601 73,823 73,823
olF 36,544 36,544 58,847 58,847
9, <fIe!<i>IIfI<t> q>ifi 1l!l'olP 65,456 65,456 93,580 93,580 Main workers ~M 46,882 46,882 61,867 61,867
ofF 18,574 18,574 31,713 31,713
(i)~ 1l!l'otP 12,836 12,836 20,534 20,534 Cultivators tM 12,444 12,444 20,099 20,099
olF 392 392 435 435
(ii)~~ 1l!l'o/P 16,698 16,698 12,820 12,820 Agricultural labourers tM 15,711 15,711 12,514 12,514
olF 987 987 306 306
(iii) Cjl~ql~<t> \3E!)Tr 'Cj)Iff 1l!l'otP 3,878 3,878 40,246 40,246 Household industry workers tM 1,323 1,323 11,311 11,311
ofF 2,555 2,555 28,935 28,935
(iv) 3Ft! q>ifi 1l!l'otP 32,044 32,044 19,980 19,980 Other workers tM 17,404 17,404 17,943 17,943
ofF 14,640 14,640 2,037 2,037
10. 31<"lq)I~q) cpoff OlfotP 25,689 25,689 39,090 39,090 Marginal workers ~F 7,719 7,719 11,956 11,956
17,970 17,970 27,134 27,134
(i) ~ 1l!l'o/P 798 798 1,665 1,665 Cultivators tM 538 538 1.431 1,431
olF 260 260 234 234
(ii) ~~ 1l!l'O/P 4,521 4,521 5,119 5,119 Agricultural labourers tM 3,383 3,383 4,690 4,690
ofF 1,138 1,138 429 429
(iii) Q IRq I ~ q) \31ll)Tr q>ifi OlfotP 3,184 3,184 29,265 29,265 Household industry workers tM 235 235 3,829 3,829
ofF 2,949 2,949 25,436 25,436
(iv) 3R)'. q;l\T 1l!l'otP 17,186 17,186 3,041 3,041 Other workers ~M 3,563 3,563 2,006 2,006
ofF 13,623 13,623 1,035 1,035
11. fR q;l\T 1l!l'0tP 120,261 120,261 151,706 151,706 Non-workers tM 54,320 54,320 73.053 73,053
O/F 65,941 65,941 78,653 78,653
51

CIi-5 ~ GH'tl'6l1l C6T ~ ~ Gt ..... luHI ~ - 2001 A- 5 DISTRICT PRIMARY CENSUS ABSTRACT OF TOTAL POPULATION - 2001
1IG
Item
1. ~ cpf fcl;.~. -if I Area in Sq. Kms.
2. g;c;r I:l'#crff I Total households
3.~~{~~ m~~) Tota' populatlon (Including Institutional and houseless population)
4. 0-6 3lT1j ~ ~ ~ Population in the age group 0-6
5.~~qIJ~ Scheduled Castes population
6, ~ ",.,""1f<l1l1 qft ~ Scheduled Tribes population
7. WIfff Uterates
B, g;c;r q;t:fi Total workers
9. ~tT"'I~'" 'C/il1T Main workers
(i)~ CUltivators
(ii)~~ Agricultura' labourers
(iff) ql~ql~'" ~ ~ Household industry workers
(IV) aR1 q;-;jl Other workers
10. 31<i<lq;IR:!", q;t:fi Marginal workers
(i)~
Cultivators
(fi)~~ Agrlcultura' labourers
(iii) ql~q,~", '3'dt>T ~ Household industry workers
(Iv) ~ <l>4l Other workers
, ,. 1'R <P'ff Non·workers
ClforP
'!lofM ~ofF
ClforP
'!lofM ~ofF
Clfo/P
'!lofM ~ofF ClforP
'!lofM ~o/F
Clfo/P
~ofM ~ofF
Clfo/P
,!!:ofM ~ofF WarP
'!lofM ~o/F
Clfo/P
~o/M ~o/F
CZforP 1_!o/M ~ofF WOIP
~ofM R';ro/F
i'1lo/p
1_!o/M ~ofF Cl!o/p
,!!:o/M faofF CZforP
'So/M ~o/F i'1lo/p
-gofM faofF
CZforP -gofM ~ofF
CZTotP 'So/M ~o/F
i'1lo/p
1_!ofM ~ofF
5,324.00
1,140,095
5,866.569 3,005,000 2,861,569
1,044,534 529,796 514,738
703,786 360,734 343,052
75,953 38,518 37,435
2,620,538 1,502,724 1,117,814
2,005,174 1,536,669
468,505
1,672,311
1,377,177 295,134
348,182 337,888
10,294
454,281 435,330
18,951
287,854 97,362
190,492
581,994 506,597
75,397
332,863 159,492 173,371
26,990 18,743
8,247
107,593 83,591 24,002
121,120 16,688
104.432
77,160 40,470 36,690
3,861,395 1,468,331 2,393,064
07 'ill'<ilfll<i MURSHIDABAD
5,195.11
1,000,713
5,133,835 2,633,196 2,500,639
931,370 472,235 459,135
610,729 313,445 297,284
73,202 37,090
36.112
2,197,142 1,264,799
932,343
1.718,547 1,349.909
368.638
1,421,243 1,202,131
219,112
344,623 334,509
10,114
448,312 429,802
18,510
198,389 62,406
135,983
429,919 375,414
54,505
297,304 147,778 149,526
26,811 18,616
8,195
106,663
82.865 23.798
95,013 11,444 83,569
68,817 34,853 33,964
3,415,288 1,283,287 2,132.001
52
128,89
139,382
732,734 371,804 360,930
113,164 57,561 55,603
93,057 47,289 45,768
2,751 1,428 1,323
423,396 237,925 185,471
286,627 186,760
99,867
251,068
175,046 76,022
3,559 3,379
180
5.969 5,528
441
89,465 34,958 54.509
152,075
131,183 20,892
35,559 11,714 23,845
179
127 52
930 726 204
26,107 5,244
20,863
8,343 5,617
2,726
446,107 185,044 261.063
132.74
39,958
220,049 112,495 107,554
45,423 23,122 22,301
22,950 11,921 11,029
3,807 1,939 1,868
82,877 50,943
31,934
97,946 52,550 45,396
75,523
44,825 30,698
4,347 4,074
273
7,224 6,772
452
35,375 7,606
27,769
28,577 26,373
2,204
22,423 7,725
14,698
528 385 143
3,606 2,789
817
14,545 1,422
13,123
3,744 3,129
615
122,103 59,945 62,158
000 1 lIffiCf<IiT
Farakka mural
129.04
34,708
197,989 101,014
96,975
42,568 21,660 20,908
15,897 8,289 7,608
3,591 1,831 1,760
67,995 42,623 25,372
90,826 46,910 43,916
68,805 39,342 29,463
4,343 4,070
273
7,219 6,768
451
34,990 7,566
27,424
22,253 20,938
1,315
22,021 7,568
14,453
528 385 143
3,606 2,789
817
14,375 1,404
12,971
3,512 2,990
522
107,163 54,104 53,059
~rban
3,70
5,250
22,060 11,481 10,579
2,855 1,462 1,393
7,053 3,632 3,421
216 108 108
14,882 8,320 6,562
7,120 5,640 1,480
6,718 5,483 1,235
4 4
5 4
385 40
345
6.324 5,435
889
402
157 245
170 18
152
232 139 93
14,940 5,841 9,099
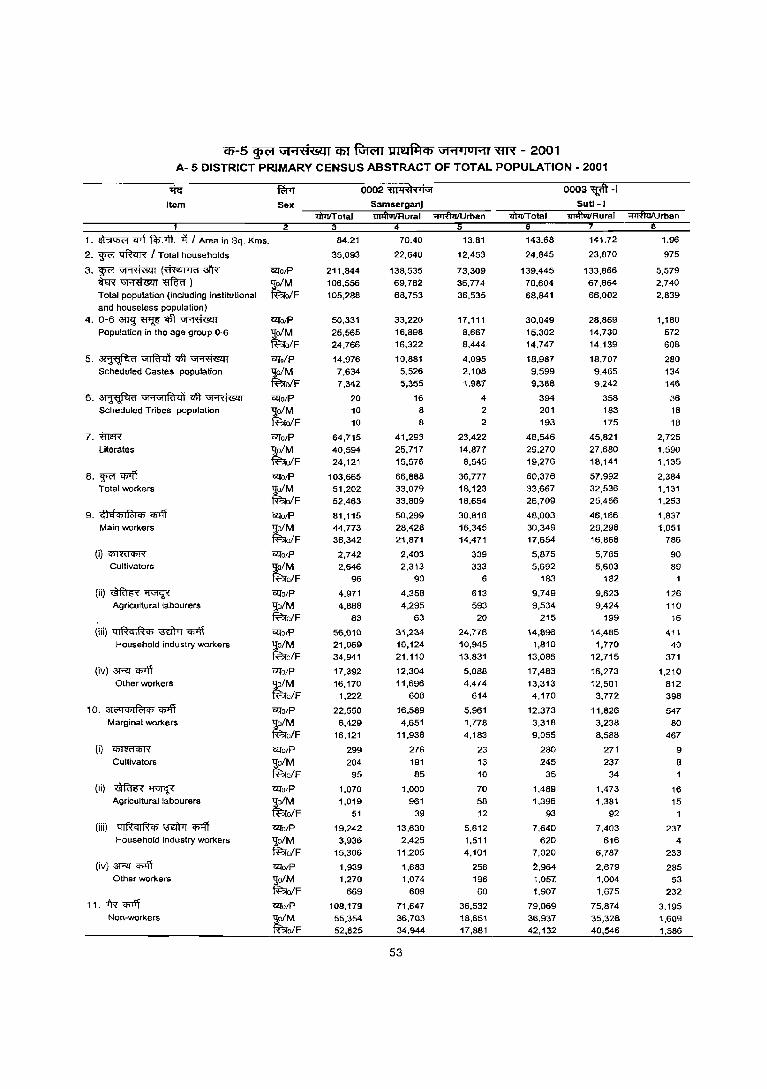
C5-5 ~ "1'"1ti'L<'ll1 CfiT fmc;rr ~ \11'"1 4 101'"11 "W"'{ - 2001 A- 5 DISTRICT PRIMARY CENSUS ABSTRACT OF TOTAL POPULATION - 2001
>tc: Item
1. ~ Cflt flo.1ft. l'i I Area in Sq. Kms.
2. ~ 1:!ftcrR I Total householcls
3."¥!~(~~ W~~) Total population (induding institutional
and houseless population) 4. 0-6 ~~qft ~
Population in the age group 0-6
5.~~qft~ Scheduled Castes population
6. ~ "I'1"lIRl41 CIlT ~ Scheduled Tribes papulation
7. mmLiterates
8. "¥! q;>ff Total workers
9.<!h:icI>lf(;j<b~ Main walkers
(i)~
Cultivators
(ii)~~ Agricultural labourers
(iii) qlf{qlf{<b '3EiM ~ Household industry workers
(iv) 3R:[ ~ Other workers
10. 3{<'!l<bjf(;jq; q;>ff Marginal wolkers
(il Cj)ffif(j)R
Cultivators
(ii)~~ Agricultural labourers
(iii) ql~ql~q; ~ ~ Household industry workers
(iv) 3R:[ '(j)lj1 Other workers
11.1R ~ Non-workers
Sex
2
C2folP :101M f'BiolF
<2lo/p
:101M f'Bio/F
<2lo/P ljo/M ~oIF <2lo/p
:1o/M N?rolF
nro/P
:1o/M ~o/F
<2lo/P
llo/M N?rolF
C2fO/P
'9;o/M i'Bro/F
<2lotP '9;o/M N?ro/F
<2lo/p
llo/M i'Bro/F
<!:IotP
llo/M N?ro/F
C2fO/P
:10/M N?ro/F
<!:Io/p
llo/M N?ro/F
C2fO/P
llo/M i'Bro/F
<!:IotP t;!oIM ff:::!oIF <2lo/P
llo/M fBlo/F
<2lotP
llo/M N?rolF
nrotp :101M i'F-fo/F
0002 "Hj'l'hqlj"l
SamserganJ m.t/Total
84.21
35,093
211,844
106,556 105,288
50,331 25,565 24,766
14,976 7,634
7,342
20
10 10
64,715
40,594 24,121
103,665
51,202
52.463
81,115
44.773 36,342
2,742 2,646
96
4.971 4,888
83
56,010 21,069
34.941
17,392
16,170 1,222
22,550 6,429
16,121
299
204 95
1,070 1,019
51
19,242
3,936 15,306
1,939 1,270
669
108,179
55,354 52,825
lIilfiiIifRural 4
70.40
22,640
138,535 69,782 68,753
33,220
16,898 16,322
10,881
5,526 5,355
16 8 8
41,293
25,717
15,576
66,888 33,079 33,809
50,299
28.428 21,871
2,403 2,313
90
4,358
4,295
63
31,234 10,124 21,110
12,304
11,696
608
16,589 4,651
11,938
276
191
85
1,000 961
39
13.630 2,425
11,205
1,683 1,074
609
71,647 36,703 34,944
53
13.81
12,453
73,309 36,774
36,535
17,111
8,667 8,444
4,095
2,108 1,987
4 2 2
23,422
14,877 8,545
36,777 18,123 18,654
30,816
16,345 14,471
339 333
6
613
593
20
24,776
10,945 13,831
5,088
4,474 614
5,961 1,778
4,183
23
13 10
70 58 .12
5,612
1,511 4,101
256 196
60
36,532
'8,651 17,881
143.68
24,845
139,445
70,604 68,841
30,049
15,302 14,747
18,987 9,599 9,388
394 201
193
48,546
29,270 19,276
60,376 33,667 26,709
48,003
30,349 17,654
5,875
5,692 183
9,749 9,534
215
14,896 1,810
13,086
17,483
13,313 4,170
12,373 3,318
9,055
280
245 35
1,489 1,396
93
7.640 620
7,020
~,964
1,057. 1,907
79,069 36,937 42,132
0003~-1 Sutl-I
'!l11IlvIIRural ;nRtuIUrban
141.72
23,870
133,866
67,864 66,002
28,869
14,730 14,139
18,707 9,465 9,242
358 183 175
45,821
27,680 18,141
57,992 32,536
25.456
46,166
29,298 16,868
5,785
5,603 182
9,623 9,424
199
14,485 1,770
12,715
16,273
12,501 3,772
11,826 3,238 8,588
271
237 34
1,473 1,381
92
7,403
616 6,787
2,679 1,004 1,675
75,874
35,328 40,546
1.96
975
5,579
2,740 2,839
1,180
572 608
280
134 146
36
18 18
2,725
1,590
1,135
2,384 1,131 1,253
1,837
1,051 786
90 89
1
126
110 16
411
40 371
1,210
B12
398
547 80
467
9
8
16 15
237 4
233
285 53
232
3,195
1,609 1,586
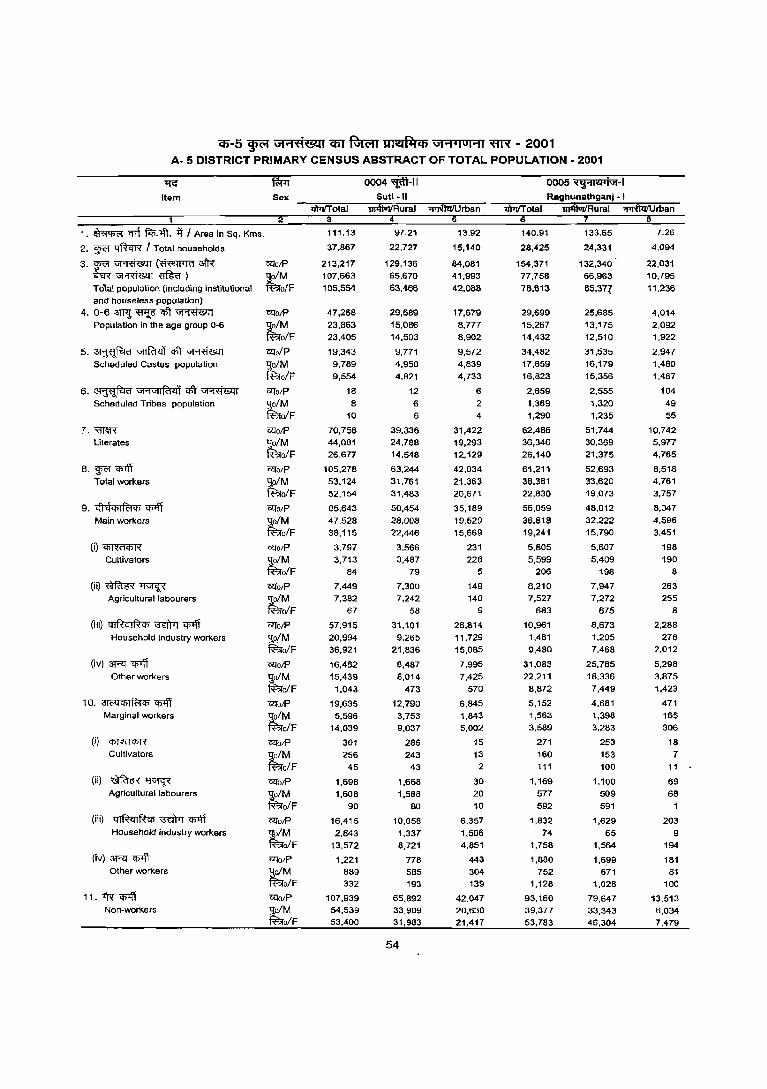
Cfi"-5 ~ "" .... "t'i'Stlt Cfi"t ~ ~ "" ...... 0 ...... 'ffi'i{ - 2001 A- 5 DISTRICT PRIMARY CENSUS ABSTRACT OF TOTAL POPULATION - 2001
~
Item
1, ~ "Eflt fcn.;fi, ii I Area in Sq. Kms.
2. g><'I ~ / Total households
3''¥l~(~$ ~~~) Tolal population (including institutional and houseless population)
4,O-6~~~~ Population in the age group 0-6
5.~~~~ Scheduled Castes population
6, ~ GI"I"1IR'141 ;$T ~ Scheduled Tribes population
7.~
Literates
8. '¥i Cj)lj'[ Total workers
9.<flQCf>Ifc;tCfl~ Main workers
(i) 'i'flml<I5T'{
Cultivators
(ii)~~ Agricultural labourers
(iii) qlRqlRCfl m:trrJ Cj)lj'[ Household industry workers
(iv) 3R!~ Other workers
10. 3l('qCf>Ii"<1Cfl <I>'ff Marginal workers
(i) 'Cf)ffifCf)']'<
Cultivators
(ii)~~ Agricultural labourers
(iii) qlRqlRCIl \3El)Tr <I>'ff Household industry workers
(iv) 3R! Cj)lj'[ Other workers
11. fR q;1ff Non-workers
Sex
c;qOtP
'l0/M i'ao/F
c;qotP
'l0/M i'ao/F O!:[o/P 'lo/M fBfo/F
aro/P
'lo/M fF.l'o/F
aro/P
IJo/M fBfo/F
ClfO/P
IJo/M fBfo/F
c;qO/P
'l0/M fF.l'o/F
arO/P
101M fF.l'o/F
c;qO/P
IJo/M l'ao/F
C2l'O/P
'l0!M fF.l'oIF C2l'ot?
1_!o/M fF.l'o/F
C2l'O/P
,!o/M fBro/F C2l'O/P
'l0/M fF.l'o/F C2l'O/P
IJo/M fF.l'oIF c;qO/P
,!o/M fF.l'o/F c;qO/P
'loiM fBro/F ClfO/P
'loiM tao/F
111.13
37,867
213,217 107,663 105,554
47,268 23,863 23,405
19,343 9,789 9,554
18 8
10
70,758 44,081 26,677
105,278 53,124 52,154
85,643 47,528 38,115
3,797 3,713
84
7,449 7,382
67
57,915 20,994 36,921
16,482 15,439
1,043
19,635 5,596
14,039
301 256
45
1,698 1,608
90
16,415 2,843
13,572
1,221 889 332
107,939 54,539 53,400
0004~-11 Sutl-II
97.21
22,727
129,136 65,670
63,466
29,589 15.0B6 14,503
9,171 4,950 4,821
12 6
6
39,336 24,788 14,548
63,244 31,761 31,483
50,454 28,008 22,446
3.566 3,487
79
7,300 7,242
58
31,101 9,265
21,836
8,487 8,014
473
12,790 3,753 9,037
286 243
43
1,668
1,588 80
10,058 1,337 8,721
778 585 193
65.892 33,909 31,983
54
13.92
15,140
84,081 41,993 42,088
17,679 8,777 8,902
9,572 4,639 4,733
6 2 4
31,422 19,293 12,129
42,034 21,363 20,671
35,189 19,520
15,669
231 226
5
149 140
9
26,814 11,729 15,085
7,995 7,425
570
6,845 1,843 5,002
15 13 2
30 20 10
6,357 1,506 4,851
443 304 139
42.047 20,630 21,417
0005 "<Ej'1It1 l ivt-1 Raghunathgan) - I
140.91
28,425
154,371 77,758 76,613
29,699 15,267
14,432
34,482 17,659 16,823
2,659 1,369 1,290
62,486 36,346 26,140
61,211 38,381 22,830
56,059 36,818 19,241
5.805 5,599
206
8,210 7,527
683
10,961 1,481 9,480
31,083 22,211
8,872
5,152 1,563 3,589
271
160 111
1,169 577 592
1,832
74 1,758
1,880 752
1,128
93,160 39,377 53,783
133.65
24,331
132,340 66,963
65,377
25,685 13.175 12,510
31,535 16,179 15,356
2,555 1,320 1,235
51,744 30,369 21,375
52,693 33,620 19,073
48,012 32,222 15,790
5,607 5,409
196
7,947 7,272
675
8,673 1,205 7,466
25,785 18,336 7,449
4,681 1,398 3,283
253 153 100
1,100 509 591
1,629
65 1,564
1,699 671
1,028
79,647 33,343 46,304
7.26
4,094
22,031 10,795
11,236
4,014 2,092 1,922
2,947 1,480 1,467
104 49 55
10,742 5,977 4,765
8,518 4,761 3,757
8,047 4,596 3,451
198 190
8
263 255
8
2,288 276
2,012
5,298 3,875 1,423
471 165 306
18 7
11
69 68
203
9 194
181 81
100
13.513 6,034 1,479

Ci)-5 ~ GH't1&11 (fiT fGrt;rr ~ \011"1. (OHI ~ - 2001 A- 5 DISTRICT PRIMARY CENSUS ABSTRACT OF TOTAL POPULATION - 2001
1'(Cf ~ 0006 'l".flltl.jGl-1I 0007~ Item Sex RaghunathganJ - II Lalgola
>WTITotsl 1iii\lUIIRurai ~rbsn iiiiliUiIRural ::rrT5IIUrbsn
1. ~ q<f f1I;. >ft. ~ I Area in Sq. Kms. 121.60 117.69 3.91 184.37 184.37
2. ~ ~ I Total households 33,145 28,502 4,643 47,422 47,422
3.~~(~afR' 'i2l'orP 192,530 165,514 27,016 267,641 267,641 ~~~) tM 94,282 81,163 13,119 136,801 136,801 Total population (including institutional ofF 98,248 84,351 13,897 130,840 130,840 and houseless population)
4.0-6~~~~ 'i2l'orP 41,976 36,487 5,489 52,987 52,987 Population in the age group 0-6
tM 21,287 18,508 2,779 26,740 26,740
ofF 20,689 17,979 2.710 26,247 26,247
5.~~~~ woIP 13,813 10,562 3,251 26,788 26,788 Scheduled Castes population tM 7,074 5,394 1,680 13,729 13,l29
ofF 6,739 5,168 1,571 13,059 13,059
6, ~ "l'1V11J'd4J ~ ~ 'i2l'orP 397 397 284 284 Scheduled Tribes population "9;o/M 219 219 138 138
~o/F 178 178 146 146
7,m~ 'i2l'o/P 72,303 59,781 12,522 108,696 108,696 Literates tM 41,264 34,202 7,062 60,778 60,778
olF 31,039 25,579 5,460 47,918 47,918
8. ~"Cff4T WatP 85,135 72,618 12,517 80,749 80,749 Total workers "9;ofM 44,617 38,314 6,303 66,529 66,529
l'Bfo/F 40,518 34,304 6,214 14,220 14,220
9. G"!dCflI~'" "Cff4T 'i2l'o/P 59,825 51,659 8,166 66,253 66,253 Main workers tM 37,627 32,348 5,279 57,902 57,902
olF 22,198 19,311 2,887 8,351 8,351
(i)~ '&jorP 4,894 4,744 150 10,303 10,303 Cultivators
tM 4,729 4,584 145 9,870 9,870 ofF 165 160 5 433 433
(ii)~~ WolP 4,495 4,290 205 17,041 17,041 Agricultural labourers 'l0fM 4,415 4,214 201 16,595 16,595
l'BfofF 80 76 4 446 446
(iii) QIRcliRCfl \RI'M ~ '&jotP 22,868 19,541 3,327 3,873 3,873 Household industry workers tM 2,330 1,731 599 1,454 1,454
ofF 20,538 17,810 2,728 2,419 2,419
(iv) 3Rl~ WO/P 27,568 23,084 4,484 35,036 35,036 Other workers jtM 26,153 21,819 4,334 29,983 29,983
olF 1,415 1,265 150 5,053 5,053
10, ¢iC'QCflI~Cfl ~ ClIotP 25,310 20,959 4,351 14,496 14,496 Marginal workers tM 6,990 5,966 1,024 8,627 8,627
olF 18,320 14,993 3,327 5,869 5,869
(i) 'CflT1ffi"CflR ClIolP 681 672 9 1,155 1,155 Cultivators tM 495 491 4 645 645
ofF 186 181 5 510 510
(ii) ~~ 'i2l'orP 1,969 1,914 55 4,816 4,816 Agricultural labourers tM 1,669 1,622 47 4,340 4,340
ofF 300 292 8 476 476
(iii) 41R-cnRq; BIOI1'! Cf>41 WO/P 19,587 15,712 3,875 2,571 2,571 Household industry workers tM 2,400 1,754 646 295 295
olF 17,187 13,958 3,229 2,276 2,276
(iv) 3Rl "Cff4T 'i2l'o/P 3,073 2,661 412 5,954 5,954 Other workers tM 2,426 2,099 327 3,347 3,347
ofF 647 562 85 2,607 2,607
11,~q;off 'i2l'orP 107,395 92,896 14,499 186,892 186,892 Non-workers
tM 49,665 42,849 6,816 70,272 70,272 ofF 57,730 50,047 7,683 116,620 116,620
55
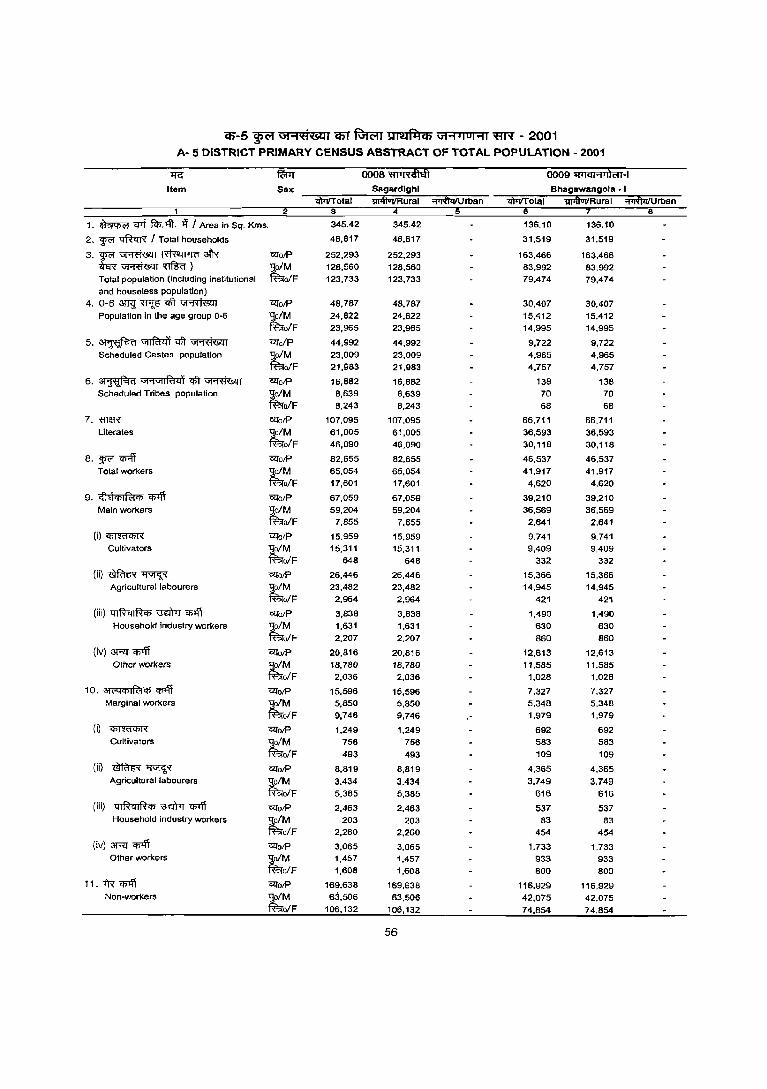
CS-5 ~ Gt"N1"IW1 q;y R7rffi 1mJfilq; \11"PIOI"'l1 ~ - 2001 A- 5 DISTRICT PRIMARY CENSUS ABSTRACT OF TOTAL POPULATIOIII - 2001
if<:" ~ 0008 'ftlll~ d'la'i 0009 ~l'IqH'~C1I-1 Item Sex Sagardlghl Bhaoawangoia - I
lIFtiTotal iiJ4iViIRural ~rban iiiifiliiiRural ~rban 1 3 8
1. ~ 'I'f fci>. llt. .q I Area in SQ. Kms. 345.42 345.42 136.10 136.10
2. ~ ~ I Total households 46,817 46,817 31,519 31,519
3.~~(~afR' CZfotP 252,293 252,293 163,466 163,466 W~~} tM 128,560 128,560 83,992 83,992 Total population (including institutional ofF 123,733 123,733 79,474 79,474 and houseless population)
4. 0-6 ~ 'ff'I6 <llT ~ CZfolP 48,787 48,787 30.407 30,407 Population in the age group 0-6 tM 24,622 24,822 15,412 15,412
olF 23,965 23,965 14,995 14,995
5.~~<llT~ CZfo/P 44,992 44,992 9,722 9,722 Scheduled Castes population tM 23,009 23,009 4,965 4,965 ofF 21,983 21,983 4,757 4,757
6. ~ "I'1"1IR'tQl <tT ~ CZfolP 16,882 16,882 138 138 Scheduled Tribes population tM B,639 8,639 70 70
olF 6,243 8,243 68 66
7. ~&R CZfatP 107.095 107,095 66,711 66,711 Literates tM 61,005 61,005 36,593 36,593
olF 46,090 46,090 30,118 30,118
8. ¥<'f <I>Iff C1:io/P 82,655 82,655 46,537 46,537 Total workers tM 65,054 65,054 41,917 41,917
olF 17,601 17,601 4,620 4,620
9. G~€l<!5I~<!5 <I>Iff C1:io/P 67,059 67,059 39,210 39,210 Main workers t,M 59,204 59,204 36,569 36,569
o/F 7,855 7,855 2,641 2,641
(i)~ C1:io/P 15.959 15.959 9.741 9.741 Cultivators "9;o/M 15.311 15,311 9,409 9,409
~o/F 648 648 332 332
(ii)~~ C1:io/P 26,446 26,446 15.366 15,366 Agricultural labourers "9;o/M 23,482 23,482 14,945 14,945
~o/F 2,964 2,964 421 421
(iii) 4IRqIR<!5 ~ ~ C1:iolP 3,838 3,838 1,490 1.490 Household industry workers tM 1,631 1,631 630 630
o/F 2,207 2.207 860 860
(iv) 3Fll <I>Iff C1:iolP 20,816 20,816 12,613 12,613 Otller workers tM 18,780 18.780 11.585 11.585
olF 2,036 2,036 1,028 1,028
1 D. ~<"4<!5lfat<!5 <I>Iff C1:io/P 15,596 15,596 7,327 7,327 Marginal workers ~!M 5,850 5,850 5,348 5,348
olF 9,746 9,746 1,979 1,979
(Q ~ C1:io/P 1,249 1,249 692 692 Cultivators tM 756 756 583 583
olF 493 493 109 109
(ii) ~~ C1:io/P 8,819 8,819 4,365 4,365 Agricultural labourers tM 3,434 3,434 3,749 3,749
olF 5,385 5,385 616 616
(iii) 4JRqJ~<!5 ~ <I>Iff C1:io/P 2,463 2,463 537 537 Household industry workers tM 203 203 83 83
olF 2,260 2,260 454 454
(iv) 3Fll ~ C1:iO/P 3,065 3,065 1,733 1,733 Other workers tM 1,457 1,457 933 933 ofF 1,608 1.608 800 800
11.f'r;(~ C1:ioiP 169,638 169,638 116,929 116,929 Non-workers tM 63,506 63,506 42,075 42,075
ofF 106,132 106,132 74,854 74,854
56

Cf)'-5 ~ Gt ... =tk.<4j em R;rm 1Th!lftiCb \71 .... 101'11 ~ - 2001 A- 5 DISTRICT PRIMARY CENSUS ABSTRACT OF TOTAL POPULATION - 2001
1f1:" fWT 0010 "l'lqH'~<'II-11 0011~-1I
Item Sex Bhagawangola • It Ranlnagar - II
WTlTotal 1ITIftlJlIRurai ~Uroan WTlTotal 1ITIftlJlIRurai :;;i1iiii'u roan 2 3 4 6 8
1. ~ <fit fiP.lft. if f Area in SQ. Kms. 175.26 175.26 175.13 175.13
2. W<'I ~ I Total households 25,851 25,851 31,657 31,657
3. W<'I ~ (~ 3lR 1'21'o/P 129,899 129,899 156,159 156,159
~~~) tM 66,849 66,849 80,879 80,879 Total population (including inslitutional o/F 63,050 63,050 75,280 75,280 and houseless populalion)
4. 0-6 am.! ~ qft ~ 1'21'o/P 24,040 24,040 26,321 26,321
Population in the age group 0-6 'J;o/M 12,003 12,003 13,218 13,218
~o/F 12,037 12,037 13,103 13,103
5.~~qft~ <ZIo/P 1,756 1,756 2,885 2,885 Scheduled Castes population tM 921 921 1,483 1,483
olF 835 835 1,402 1,402
6. ~ \J1'1\JtIRl<l1 qft ~ <ZIo/P 76 76 324 324
Scheduled Tribes population 'J;o/M 38 38 164 164
~o/F 38 38 160 160
7. WIffi' 1'21'O/P 49,932 49,932 65,100 65,100 Literates tM 27,230 27,230 36,775 36,775
o/F 22,702 22,702 28,325 28,325
8. W<'I q;<fi 1'21'o/P 37,214 37,214 47.622 47,622
Total workers tM 34,725 34,725 41,844 41,844 olF 2,489 2,489 5,778 5,778
9. G'1tI<pI~'Il q;;ft <ZIo/P 31,423 31,423 38,856 38,856 Main workers ~o/M 30,240 30,240 36,322 36,322
~o/F 1,183 1,183 2.534 2,534
(i) <PffiI<I)R' <ZIolP 10,446 10,446 16,380 16,380
Cultivators tM 10,260 10,260 15,940 15,940
olF 186 186 440 440
(ii)~~ <ZIorP 15,518 15,518 14;648 14.648 Agricultural labourers ~M 15,327 15,327 14,191 14,191
o/F 191 191 457 457
(iii) 41RqlR'Il ~ q;;ft 1'21'orP 592 592 1,682 1.682 Household industry worKers tM 241 241 741 741
olF 351 351 941 941
(iv) aRT q;;ft <ZIorP 4,867 4.867 6,146 6,146 Other workers ~ 4,412 4,412 5,450 5,450
olF 455 455 696 696
10. 3l<'4Cf)I~'Il COlfi GlTnrP 5.791 5.791 B.766 8.766
Marginal workers tM 4,485 4.485 5.522 5.522 olF 1,306 1,306 3,244 3,244
(i) ~ <ZIorP 519 519 980 980 Cultivators tM 421 421 781 781
olF 98 98 199 199
(ii) ~~ 1'21'orP 3,778 3.778 4,414 4,414 Agricultural labourers tM 3,326 3,326 3,979 3.979
o/F 452 452 435 435
(iii) qIRqIRi'.l\~~ GlTorP 323 323 1,717 1,717 Household industry workers tM 38 38 132 132
ofF 285 285 1,585 1.585
(iv) aRT COlfi i'2lorP 1,171 1.171 1,655 1,655 Other worKers tM 700 700 630 630
olF 471 471 1,025 1,025
11.~COlfi <ZIorP 92,685 92.685 108,537 108,537 Non-worKers tM 32,124 32.124 39,035 39,035
ofF 60.561 60,561 69.502 69,502
57
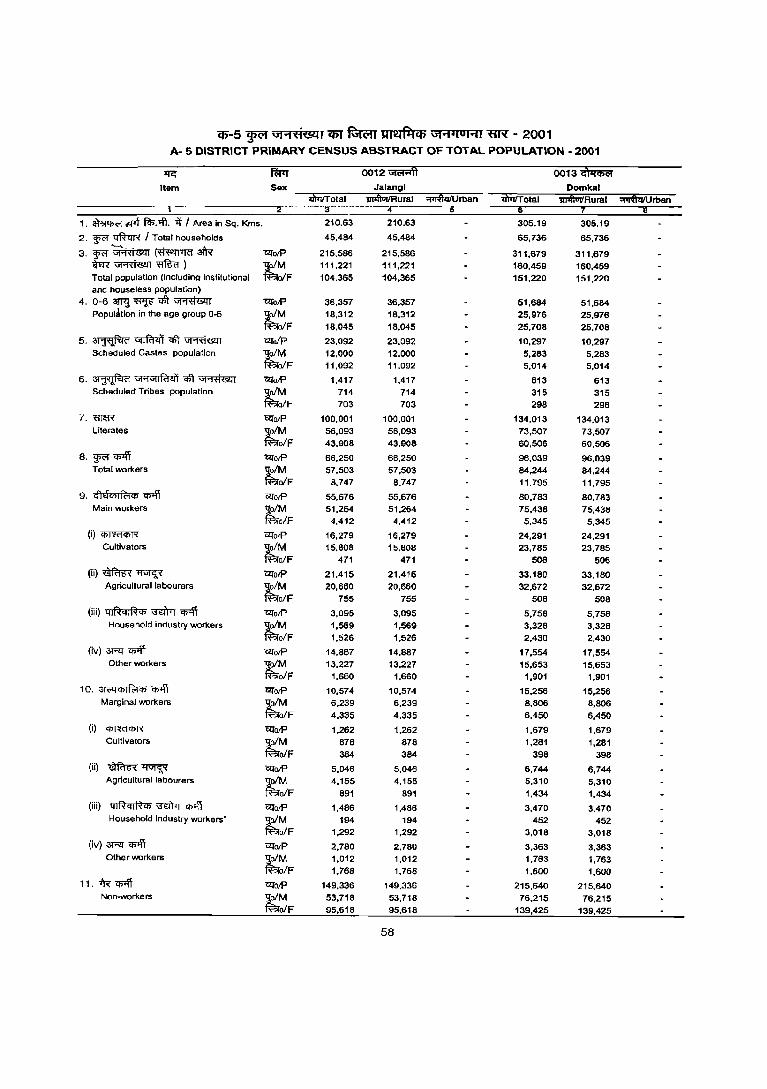
cp-5 ~ \11 "1 fl6!l 1 q;y ~ UTIQfl!tCh \11"1 4101"11 ~ - 2001 A- 5 DISTRICT PRIMARY CENSUS ABSTRACT OF TOTAL POPULATION· 2001
"Jl'G ~ 0012 'GIii.'iff oo13~ Itom Sox Jalangl
ifiiiiT otal iIPfiliiiRuml ~rban 16iTITotai
1. ~ m fcp.'Ift. 1f1 Area In Sq. Kms. 210.63 210.63 305.19 305.19
2. $'<'I' qftcn-{ I Total households 45,484 45,484 65.736 65,736
3. $'<'I' ~ (~ aiR "afolP 215.586 215,566 311,679 311,679 W~~) tM 111,221 111,221 160,459 160,459 Total population (including Institutional o/F 104,365 104,365 151,220 151,220 and houseless population)
4. 0-6 aTnj ~ ctt ~ OlTolP 36,357 36,357 51,684 51,684 Popul.r.tion in the age group 0-6 tM 18,312 18,312 25,976 25,976
o/F 18,045 18,045 25,708 25,708
5.~~qft~ "afolp 23,092 23,092 10,297 10.297 Scheduled Castes population tM 12,000 12,000 5,283 5,283
o/F 11,092 11,092 5,014 5,014
6. ~ GI"1"1IRt4i ~ ~ "afo/P 1,417 1,417 613 613 Scheduled Tribes population tM 714 714 315 315
o/F 703 703 298 298
7. mffi OlTolP 100,001 100,001 134.013 134.013 Literates tM 56,093 56,093 73,507 73,507
ofF 43,908 43,908 60,506 60,506
8. ~ 'Cp1ff OlTolP 66,250 66,250 96,039 96,039 Total workers tM 57,503 57,503 84,244 84,244
o/F 8.747 8.747 11.795 11,795
9. «IdcmR1<ri 'Cf5lft OZlotP 55,676 55,676 80.783 80,783 Main workers tM 51,264 51,264 75,438 75,438
olF 4,412 4,412 5,345 5,345
(i)~ OlTotP 16,279 16,279 24,291 24.291 Cultivators tM 15,808 15,808 23,785 23,785
o/F 471 471 506 506
(ii)~~ OlTotP 21,415 21,415 33,180 33,180 Agricultural labourers tM 20,660 20,660 32,672 32,672
o/F 755 755 508 508 (iii) ql~ql~<ri ~ 'Cp1ff OlTolP 3,095 3,095 5,758 5,756
Household industry workers tM 1,569 1,569 3,328 3,328 olF 1.526 1,526 2.430 2,430
(iv) ~ C!>'lT "afo/P 14,887 14.887 17.554 17,554 Other workers tM 13,227 13,227 15,653 15,653
ofF 1,660 1,660 1,901 1,901 10. ~<'G<rilfc;!<ri 'Cp1ff OZlolP 10,574 10,574 15,256 15,256
Marginal workers tM 6,239 6,239 8,806 8,806 olF 4,335 4,335 6,450 6.450
(il ~ OZlotP 1.262 1,262 1,679 1,679 Cultivators tM 876 878 1,281 1,281
ofF 384 384 398 398 (ii) ~~ OZlotP 5,046 5,046 6,744 6,744
Agricultural labourers tM 4,155 4,155 5,310 5,310 ofF 891 891 1,434 1,434
(iiO 41RqlRcn ~ cp-.j'j OZlotP 1,486 1,486 3,470 3.470 Household industry workers' tM 194 194 452 452
o/F 1,292 1,292 3,018 3,018 (iv)~"Cb1l'i OZlO/P 2.780 2.780 3,363 3,363
Other workers tM 1,012 1.012 1,763 1,763 olF 1.768 1.768 1.600 1.600
11. iR 'Cf5lft OlI'otP 149.336 149.336 215,640 215.640 Non-workers tM 53,716 53,716 76,215 76.215
ofF 95,618 95.618 139,425 139,425
58
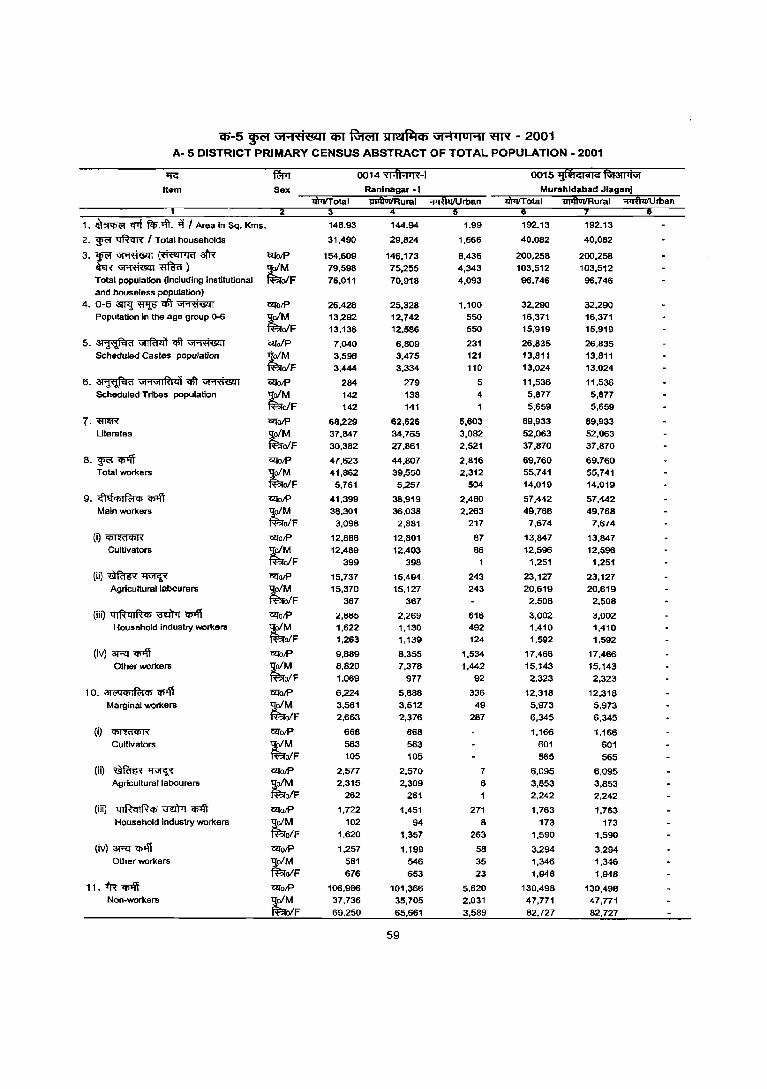
q;-5 ~ Gt'1=e&:l1 CfiT ~ lW!1fliC6 \J'I"""IOI'11 ~ - 2001 A- 5 DISTRICT PRIMARY CENSUS ABSTRACT OF TOTAL POPULATION - 2001
11<: ~ 0014~-1 0015 'jlilC:IClic: Ful3tJ1ivr Item Sex Ranlnagar - I Murshldabad JlaganJ
1l\TlfTotal liiiiVIIFlural <;firt\iiIU rban 1l\TlfTotal 1iiift1ii/Rural ~rban
1. ~ 1fTf f<l;,;ft. l'i ! Area In Sq. Kms. 146.93 144.94 1,99 192.13 192,13
2. ~ ~ I Total households 31,490 29.824 1.666 40.082 40.082
3.~~(~afR 1:Zf0lP 154,609 146.173 8.436 200.258 200.258 ~~~) ~F 79,598 75.255 4.343 103.512 103.512 Total population (Including institutional 75,011 70.918 4.093 96.746 96.746 and houseless population)
4.0-6~~'!Ift~ 1:ZfoiP 26,428 25.328 1.100 32.290 32.290 Population in the age group ()-6 tM 13,292 12.742 550 16,371 16.371
ofF 13,136 12.586 550 15.919 15,919
5.~~<ilt~ urolP 7,040 6.809 231 26.835 26,835 Scheduled Castes populatlon ~ 3,596 3.475 121 13.811 13,811
ofF 3,444 3.334 110 13.024 13,024
6. ~ \J1'1"1IR1ll~ <ilt ~ uroiP 284 279 5 11.536 11,536 Scheduled Tribes population ~F 142 138 4 5.877 5,877
142 141 5.659 5,659
7.~ urotP 68,229 62,626 5,603 89,933 89,933 Uterates tM 37.847 34,765 3.082 52.063 52,063
ofF 30,382 27,861 2.521 37.870 37,870
8, ~ 'if>lfi <2j'oiP 47,623 44,807 2,816 69,760 69,760 Total workel'$ tM 41,862 39,550 2,312 55,741 55,741
ofF 5,761 5,257 504 14,019 14,019
9, ,fhjq, I ~ q, q;>fi urolP 41,399 38,919 2,480 57,442 57,442 Main workers tM 38,301 36,038 2,263 49,768 49,768
ofF 3,098 2,881 217 7,674 7.674
(i) <PrnfCI>R <2j'olP 12,888 12,801 87 13,847 13,847 Cultivators ~F 12,489 12,403 86 12,596 12,596
399 398 1 1,251 1,251
(ii)~~ GlfotP 15,737 15,494 243 23,127 23,127 Agricultural labourers ~M 15,370 15.127 243 20,619 20,619
ofF 367 367 2,508 2.508
(iii) ql~ql~qs ~ q;1ff 'afoiP 2.885 2,269 616 3,002 3,002 Household industry \'oIC)rkers
~ 1.622 1,130 492 1,410 1,410 ofF 1,263 1,139 124 1,592 1,592
(iv)3Rl'if>lfi ClfoiP 9,889 8,355 1,534 17,466 17,466 Other workers ~M 8,820 7,378 1,442 15,143 15.143
ofF 1,069 977 92 2,323 2,323
10. ~<'4q,If<;j¢ ~ ClfOlP 6.224 5,888 336 12.318 12.318 Marginal workers tM 3,561 3,512 49 5,973 5,973
ofF 2,663 2,376 287 6,345 6,345
(il ~ 121'oiP 668 668 1.166 1,166 Cultivators tM 563 563 601 601
ofF 105 105 565 565
(ii) ~~ ClfoiP 2,577 2,570 7 6,095 6,095 A9riculturallabourel'$ ~M 2,315 2,309 6 3,853 3,853
ofF 262 261 2,242 2,242
(iii) Qll1qll1¢ ~ ~ ClIolP 1,722 1,451 271 1.763 1,763 Household industry workers
~ 102 94 8 173 173
o/F 1,620 1,357 263 1.590 1,590
(iv) 3Rl q;Jff ClfolP 1,257 1.199 58 3,294 3.294 Other workers tM 581 546 35 1,346 1,346
ofF 676 653 23 1,948 1,948
11. iR Cf>Iff ClfoiP 106,986 101,366 5,620 130,498 130,498 Non-workers
~F 37,736 35,705 2,031 47.771 47,771 69,250 65.661 3,589 82,727 82,727
59

C6-5 P \i1"1't1t.<41 ifil"Riwrr ~ \J1"1'loHI ~ - 2001 A- 5 DISTRICT PRIMARY CENSUS ABSTRACT OF TOTAL POPULATION - 2001
~ ft!pr 0016 :t<nlP!' 0017 i!RmlJ
Item Sax Nabagram Khargram
liPI\UiiRural ~Urban "iiTiiOi/Rural ~rban
1. ~ If't fcl;.1fi. if I Area in Sq. Kms. 306.63 306.63 318.45 318.45
2. w<'I 'lftcIR / Total households 39,062 39,062 46,672 46,672
3. w<'I ~ (~ afR CZfotP 196,608 196,608 234,780 234.780 ~~~) tM 100.547 100,547 120,339 120.339 Total population (Including Institutional oIF 96,061 96,061 114,441 114,441
and houseless population) 4, 0-6 3l1'g ~ mt ~ CZfotP 33.796 33,796 40,125 40,125
Population in the age group O~ tM 17,193 17,193 20,368 20,368
o/F 16,603 16,603 19,757 19.757
5. ~~ctt~ <2l'o/P 50,048 50,048 55,320 55,320
Scheduled Castes population tM 25,570 25,570 28,466 28,466
olF 24.478 24,478 26,854 26,854
6, ~ \ij"\il1R14~ ctt ~ CZfotP 14.393 14.393 1,918 1,918 Scheduled Tribes population tM 7,282 7.282 981 981
elF 7.111 7.111 937 937
7. mm- <2l'oIP 94,281 94,281 103,616 103.616 Literates tM 55,457 55,457 62,679 62,679
oIF 38,824 38,824 40,937 40.937
8. ~ q;1ff <2l'otP 59,958 59.958 78,799 78,799
Total workers tM 50.293 50,293 64,042 64,042
oIF 9,665 9,665 14,757 14,757
9. <fl>1<i>I!ti<t> ~ UiOJP 49,066 49,066 61,610 61,610 Main workers tM 43,960 43,960 55,943 55,943
oIF 5,106 5,106 5,667 5,667
(i)~ CZfotP 15,887 15,887 20,096 20,096
Cultivators tM 15,280 15,280 19,406 19,406
oIF 607 607 690 690
(ii)~~ <2l'o/P 21,022 21,022 21,218 21,218
AgricullurallaDOurers t~F 18,680 18,680 20,390 20.390
2,342 2,342 828 828
(iii) ql~qlfh, ~ qr.ff UiOlP 1,393 1.393 6,079 6,079
Household industry workers tM 922 922 4,309 4,309
o/F 471 471 1,770 1,770
(iv) aRr CI>llT C;UoIP 10,764 10,764 14,217 14,217
Other workers tM 9,078 9,078 11,838 11,838
oIF 1,686 1,686 2,379 2,379
1 O. 31 ('q q) I fcl <t> <!1'lT <2l'o/P 10,892 10,892 17,189 17,189 Marginal workers tM 6,333 6,333 8,099 8,099
OIF 4,559 4,559 9,090 9,090
(i) ~ CZfO/P 1,596 1.596 2,594 2,594 Cultivators tM 1,012 1,012 1,558 1,558
olF 584 584 1,036 1,036
(ii) ~~ CQotP 7.263 7,263 5,679 5,679 Agricultural labourers tM 4,562 4,562 4,455 4,455
oIF 2,701 2.701 1,224 1,224
(iii) ql~CJl~<il ~ <!1'lT <2l'oIP 589 589 2,926 2,926 Household industry workers tM 121 121 387 387
oIF 468 468 2,539 2,539
(iv) aRr '<Il1ff <2l'oIP 1,444 1,444 5,990 5,990 Other wor1<ers tM 638 638 1,699 1,699
OIF 806 806 4,291 4,291
11. 1R <!1'lT CQoIP 136.650 136,650 155.981 155,981 Non-worKers tM 50,254 50,254 56,297 56,297
oIF 86,396 86,396 99,684 99,684
60
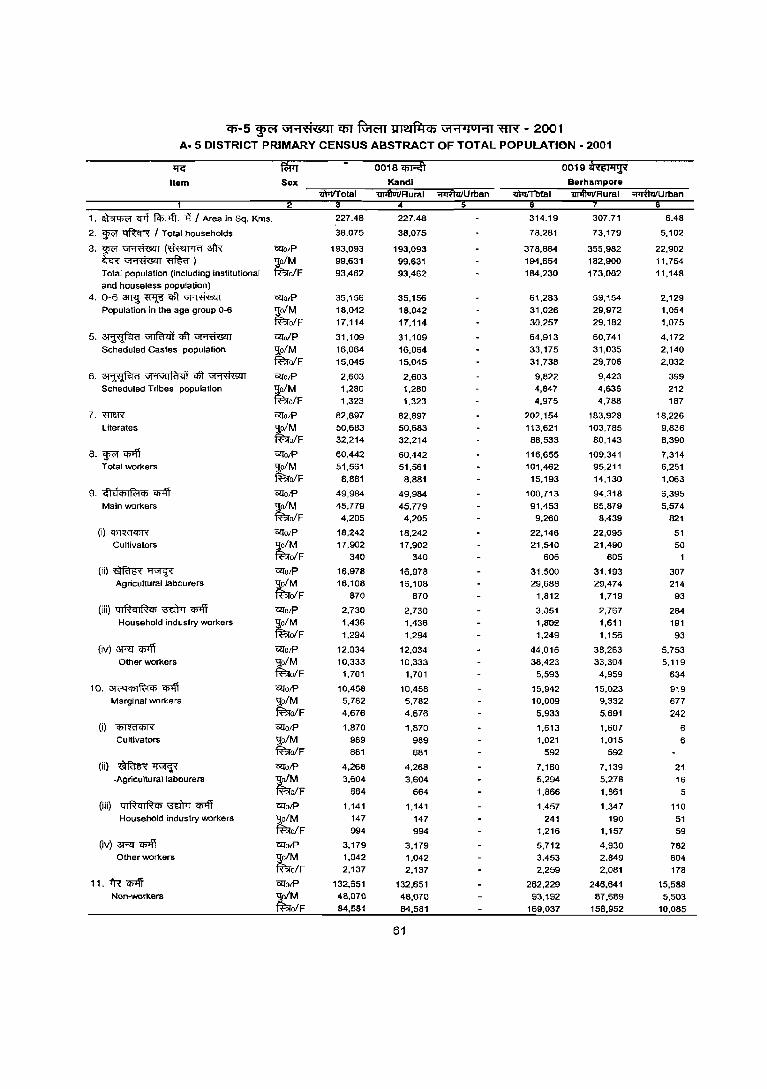
cp-s ~ ut .... 'C'i'Lcl11 q)1 Rircffi !>111:!1~Ch ut'1.IOI .... 1 WR - 2001 A· 5 DISTRICT PRIMARY CENSUS ABSTRACT OF TOTAL POPULATION· 2001
"iG ~ 0018~ 0019~ Item Sex Kandl Berhampore
!i141.rfRural ~Urban
1. ~ crrt fln."4t. l'f / Area in Sq. Kms. 227.48 227.48 314.19 307.71 6.48
2. ~ ~ I Total households 38,075 38,075 78,281 73,179 5,102
3. "WC'l ~ (~ afR CZTO/P 193,093 193,093 378,884 355,982 22,902 ~~~) tM 99,631 99,631 194,654 182,900 11,754 Total population (inCluding institutional ofF 93,462 93,462 184,230 173.082 11,148 and house less population)
4. 0-6 ~ ~ <1ft ~ CZTO/P 35,156 35,156 61,283 59,154 2,129 Population in the age group 0-6 tM 18,042 18,042 31,026 29,972 1,054
o/F 17,114 17,114 30,257 29.182 1,075
5,~~qjl~ CZToJP 31,109 31,109 64,913 60.741 4,172
Scheduled Castes population ~o/M 16,064 16,064 33,175 31,035 2,140
~ofF 15,045 15,045 31,738 29,706 2,032
6. ~ \iA'~ CIIt ~ CZTO/P 2,603 2,603 9,822 9,423 399 Scheduled Tribes population ~M 1,280 1,280 4,847 4,635 212
ofF 1,323 1,323 4,975 4,788 187
7.mW CZTO/P 82,897 82,897 202,154 183,928 18,226 Literates ~M 50,683 50,683 113,621 103,785 9,836
ofF 32,214 32,214 88,533 80,143 8,390
8, ~ <I>'ff CZTO/P 60,442 60,442 116,655 109,341 7,314 Total workers tM 51,561 51,561 101,462 95,211 6,251
ofF 8,881 8,881 15,193 14,130 1,063
9. ,flEhhlt"<;tCf) ~ CZTolP 49,984 49,984 100,713 94,318 6,395
Main workers "9;ofM 45,779 45,779 91,453 85,879 5,574 ~o/F 4,205 4,205 9,260 8,439 821
(i)~ CZTU/P 18,242 18,242 22,146 22,095 51 Cultivators tM 17,902 17,902 21,540 21,490 50
ofF 340 340 606 605 1
(ii)~~ C2fO/P 16,978 16,978 31,500 31,193 307 Agricultural labourers ~M 16,108 16,108 29,688 29,474 214
ofF 870 870 1,812 1,719 93
(iii) qlRqlRCf) ~ ~ C2fO/P 2,730 2,730 3,ll51 2,767 284 Household industry workers tM 1,436 1,436 1.BU2 1,611 191
ofF 1,294 1,294 1,249 1,156 93
(iv) 3Rr <t>1ff C2folP 12,034 12,034 44,016 38,263 5,753
Other workers ~M 10,333 10,333 38,423 33,304 5,119 ofF 1,701 1,701 5,593 4,959 634
10, 3l«Y,,>1t"<;tCf) ~ C2fO/P 10,458 10,458 15,942 15,023 919 Marginal workers "9;o/M 5,782 5,782 10,009 9,332 677
~o/F 4,676 4,676 5,933 5,691 242
(i) ~ C2fO/P 1,870 1,870 1,613 1,607 6 Cultivators "9;o/M 989 989 1,021 1,015 6
~o/F 881 881 592 592
(ii) ~~ C2fO/P 4,268 4,268 7,160 7,139 21 .Agriculturallabourers "9;ofM 3,604 3,604 5,294 5,278 16
~ofF 664 664 1,866 1,861 5
(iii) ql~ql~Cf) ;ro'fT! ~ «<olP 1,141 1,141 1,457 1,347 110 Household industry workers tM 147 147 241 190 51
o/F 994 994 1,216 1,157 59
(iv) 3Rr'i!>lft CZTolP 3,179 3,179 5,712 4,930 782 Other workers tM 1,042 1,042 3,453 2,849 604
o/F 2,137 2,137 2,259 2,081 178
11. 11< ~ C2fO/P 132.651 132,651 262,229 246,641 15,588 Non-wort.ers tM 48,070 48,070 93,192 87,689 5,503
ofF 84,581 84,581 169,037 158.952 10,085
61

cn-5 ~ Gi"1fl<Sll1 q;y ~ ~ """1'1 0 1011 ~ - 2001 A- 5 DISTRICT PRIMARY CENSUS A"BSTRACT OF TOTAL POPULATION - 2001
1fG fRrr 0020 EIii;~QI'$1 0021 "IfI3C:T
Item Sex NaWC1a 1I»rfT otal tI»lff otal Wfi1iiIRula I ~rban
I, ~ cpf fip,~, if I Area In Sq, Kms, 253.14 253.14 231.39 231.39
2, WR' 'C!ftcl'R I Total households 47,769 47,769 40,981 40,981
3,P~(~~ '12l'olP 221,741 221,741 196,246 196,246
~~~) tM 114,600 114,600 100,992 100,~2
Total population (including Institutlonal blF 107,141 107,141 95,254 95,254
and houseless population) 4. 0-6 3m] ~ qI't ~ '12l'o/P 35.530 35,530 31,158 31,158
Population in the age group 0-6 tM 1B,046 18,046 15,595 15,595
blF 17,484 17,484 15,563 15,563
5.~~qI't~ '12l'o/p 15,195 15,195 12,696 12,696
Scheduled Castes population ~M 7,781 7,781 6,518 6,518
ofF 7,414 7,414 6,178 6,178
6. ~ GFl"lIRl41 ~ ~ '12l'oJP 1,700 1,700 1,437 1.437
Scheduled Tribes population ~M 869 869 731 731
ofF 831 831 706 706
7.mm '12l'otP 103,913 103,913 88,047 88,047
Literates ~M 57,002 57,002 47,890 47,890 ofF 46,911 46,911 40,157 40,157
8.p~ '12l'elP 69,979 69,979 61.160 61,160
Total workers ~M 62.429 62,429 55,980 55,980 blF 7,550 7,550 5,180 5,180
9, G"lE!iPl~q; ~ '12l'otP 59,962 59,962 53,414 53,414
Main workers 'lefM 56,142 56,142 50,533 50,533
l'ao/F 3,820 3,820 2.881 2,881
(i)~ '12l'e/P 20,877 20,877 16.265 16,265
Cultivators ~M 20,503 20.503 15,999 15,999
ofF 374 374 266 266
(ii)~~ '12l'oJP 24,205 24.205 21.970 21,970
Agricultural labourers ~M 23,715 23,715 21,590 21,590
ofF 490 490 380 380
(iii) ql~ql~q; ~ ~ '12l'o/P 3,809 3,809 1.727 1,727
Household industry workers ~M 2,080 2.080 988 988 ofF 1,729 1.729 739 739
(iv) 3Rl'~ <:zJolP 11,071 11,071 13,452 13,452
Other workers ~M 9,844 9,844 11,956 11,956
ofF 1,227 1,227 1,496 1,496
10. 3Jc;QQ;Ifi;!(fj <I>lff molP 10,017 10,017 7,746 7.746
Marginal workers tM 6,287 6,287 5,447 5,447
elF 3,730 3,730 2,299 2,299
(i) ~ '12l'olP 1,147 1,147 1,087 l,OB7 Cultivators tM 865 865 711 711
oIF 282 282 376 376
(ii) ~~ motP 4,511 4.511 4,059 4.059 Agricullurallabourers tM 3,964 3,964 3,568 3,568
ofF 547 547 491 491
(iii) ql~qiRQ;~~ mO/P 2,129 2,129 805 B05 Household industry workers tM 232 232 138 138
ofF 1.897 1.897 667 667
(iV) 3Rl' CI>'fi '12l'oIP 2,230 2,230 1,795 1,795 Other workers tM 1,226 1,226 1,030 1,030
o/F 1.004 1.004 765 765
11.1R~ '12l'oIP 151,762 151,762 135,086 135,086 Non-workers tM 52,171 52.171 45.012 45,012
oIF 99,591 99,591 90,074 90,074
62

iP-5 ~ Gi'1:a""-.c41 q;y ~ UI24f'tCb \J1'1'IOI'1J ~ - 2001 A· 5 DISTRICT PRIMARY CENSUS ABSTRACT OF TOTAL POPULATION· 2001
'IfG fWr 0022~·1 0023 lh'iiFiiT-1i Item Sax Beldilngil-I Beldangil-n
11)iJj'f 0 tal 1iIiftUiiRurai ~Urban -.imlTotal '!Iii$\1iifRural "flRtliIU rban
1. ~ qrf ~...tt. ~ / Area in Sq. Kms. 168.75 168.75 207.93 207.93
2. wc;r ~ / Total households 48.902 48.902 40.438 40.438
3. wc;r ~ (~ afR «rolP 259.237 259.237 210.188 210.188 tm"~~) tM 134,609 134.609 109.059 109.059 Total population (including institutional oIF 124.628 124.628 101.129 101.129 and houseless population)
4. 0-6 an'l ~ <fit ~ «rolP 49.136 49.136 36.366 36.366 Population in the age group 0-6 tM 24.904 24.904 18.377 18.377
oIF 24.232 24.232 17.989 17.989
5.~~<fit~ <2IoIP 13.655 13,655 18.169 18.169 Scheduled Castes population tM 7.024 7,024 9.335 9.335
olF 6.631 6.631 8.834 8.834
6. ~ VI"1V1IR1"i'i <fit ~ UlotP 29 29 626 626 Scheduled Tribes population
~ 14 14 321 321 oIF 15 15 305 305
7. mw (;Q'otP 117.155 117.155 90,034 90.034 Literates ~M 66.878 66.878 52.425 52.425
ofF 50.277 50.277 37.609 37.609
8. wc;r iff'lT <qotP 76.429 76,429 64.337 64.337 Total workers ~ 68.259 68.259 56.957 56.957
olF 8.170 8,170 7,380 7.380
9. ~~CjiI~Cji iff'lT «rot? 67.618 67.618 56,728 56.728 Main workers ~M 62.385 62.385 52,176 52,176
ofF 5,233 5,233 4,552 4.552
(i)~ O!WP 14,963 14.963 15,588 15,588 Cultivators tM 14,696 14,696 15,320 15.320
ofF 267 267 268 268
(ii)~~ ClTolP 21,844 21.844 20.328 20.328 Agricultural labourers tM 21.684 21.684 19.740 19.740
olF 160 160 588 588
(iii) 41~ql~Cji ~ q;off ClTotP 4.768 4,768 2.872 2.872 Household industry workers tM 1,613 1,613 1,243 1.243
ofF 3,155 3.155 1.629 1.629
(iv) 3F'Il' cn4T Cll'OIP 26.043 26.043 17,940 17.940 Other workers tM 24.392 24.392 15.873 15,873
ofF 1,651 1.651 2,067 2,067
10. <11 <.'4ifl IR:!CP 'CJ>1ff Cll'otP 8,811 8,811 7,609 7,609 Marginal workers ;tM 5,874 5.874 4,781 4.781
olF 2,937 2,937 2.828 2,828
(i) ~ ClTotP 670 670 698 698 Cultivators ;tM 589 589 640 640
olF 81 81 58 58
(ii) ~~ 'I2l'olP 3,387 3,387 3,154 3,154 Agricultural labourers tM 3.300 3,300 2,826 2.826
ofF 87 87 328 328
(ii~ 4IRql~ifl~~ ClTO/P 2,288 2.288 1.619 1.619 Household industry workers ~M 180 180 116 116
ofF 2,106 2,108 1,503 1.503
(iv) 3F'Il' ~ 'I2l'otP 2.466 2,466 2,138 2.138 Other workers tM 1.805 1.805 1.199 1.199
ofF 661 661 939 939
11. -fR <5>ff 'C2l'o/P 182.808 182.808 145.851 145,851 Non·workers tM 66,350 66,350 52.102 52.102
ofF 116,456 116.458 93,749 93.749
63
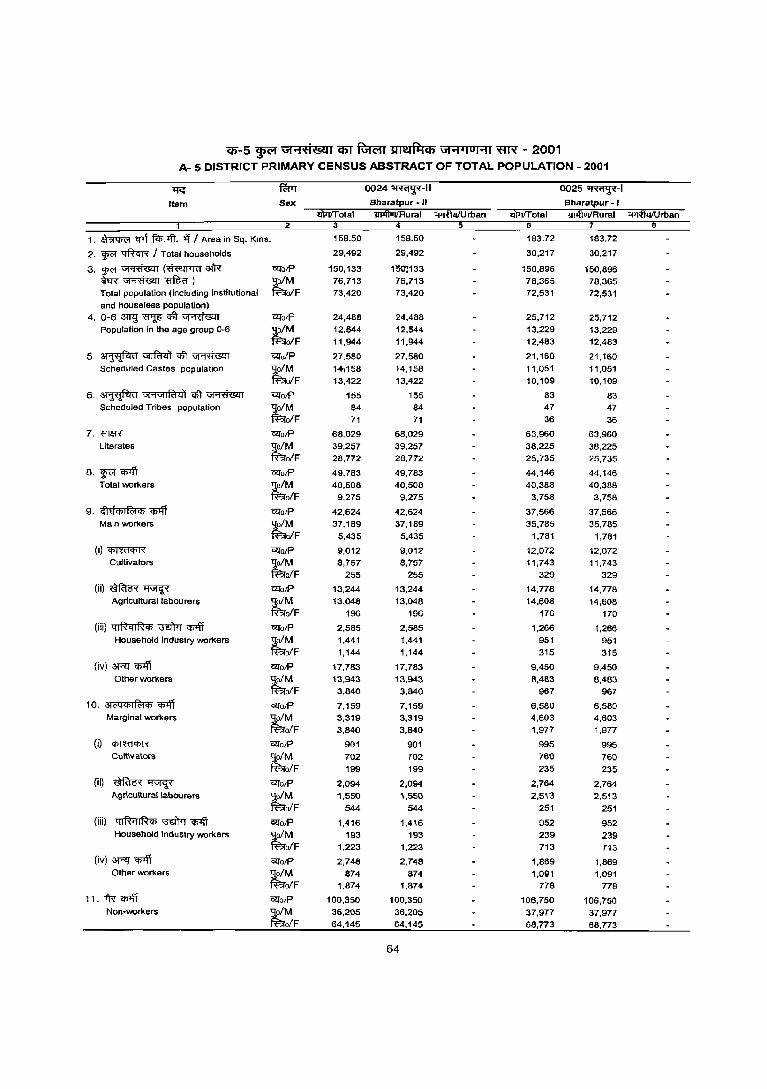
Cl)-5 ~ UI'1ti'1§lll C5T ftrffi ~ UI'1.I OI'1I 'ffR - 2001
A- 5 DISTRICT PRIMARY CENSUS ABSTRACT OF TOTAL POPULATION - 2001
~ fWr 0024~-1I 0025~-1
Item Sex Bharatpur - II 8haratpur - I iI\iTIT otal iiiift1Ii/Rural Of'TfurIU rban il\iTlTotal iiiift1IiIRural ;p:Jfulju rban
1 2 4 6
1. ~ crrt ~.>ft. -if I Area in Sq. Kms. 156.50 156.50 183.72 183.72
2. ~ ~ I Total households 29,492 29,492 30,217 30.217
3.~~(~3fR "i7fotP 150,133 ll5O!133 150,896 150,896 ~~~)
tM 76,713 76,713 78,365 78,365
Total population (including institutional oIF 73,420 73,420 72,531 72,531 and houseless popUlation)
4. 0-6 "lnj ~ qft ~ "i7fofP 24,486 24,488 25,712 25,712 Population In the age group 0-6
tM 12,544 12,544 13,229 13.229
oIF 11,944 11.944 12.483 12,483
5. ~ 'GI'Tfu<i'f qft ~ "i7folP 27.580 27,580 21,160 21.160 Scheduled Castes population
tM 14J158 14,158 11,051 11.051
oIF 13,422 13,422 10,109 10,109
6. ~ V1'1V11R'l41 qft ~ "i7fofP 155 155 83 83 Scheduled Tribes population
tM 84 84 47 47
oIF 71 71 36 36
7. ffillR "i7fofP 68.029 68,029 63.960 63,960 Literates
tM 39,257 39,257 38,225 38,225
oIF 28,772 28.772 25,735 25,735
8. WC'f ~ "i7fufP 49,763 49,783 44,146 44,146 Total workers :J;o/M 40,508 40,508 40,388 40,388
ff?ro/F 9,275 9,275 3,758 3,758
9. <!leiCfiI~Cfi"Cfi"lff "i7fofP 42.624 42.624 37.566 37,566 Main workers "9,o/M 37,189 37,169 35,785 35,785
fi:':!ofF 5,435 5,435 1,781 1,781
(i)~ "i7fo/P 9,012 9,012 12,072 12,072 Cultivators
;tM 8,757 8,757 11,743 11,743 oIF 255 255 329 329
(ii)~~ G!lotP 13,244 13,244 14,778 14,778 Agricultural labourers
tM 13,048 13,048 14,608 14,608
o/F 196 196 170 170
(iii) ql~ca~Cfi ~ "Cfi"Iff "i7fofP 2,585 2,585 1,266 1,266 Household industry workers
tM 1,441 1,441 951 951
o/F 1,144 1,144 315 315
(iv)~"Cfi"Iff "i7fo/P 17.783 17,783 9,450 9,450 Other workers
;tM 13,943 13,943 8,483 8,483 o/F 3,840 3,840 967 967
10. "I&lIcplf<1cp "Cfi"Iff G!la/P 7,159 7,159 6,580 6,580 Marginal workers
;tM 3,319 3,319 4,603 4,603 o/F 3,840 3,840 1.977 1.977
(il ~ G!lo/P 901 901 995 995 Cultivators tM 702 702 760 760
ofF 199 199 235 235
(ii) ~~ "i7fOfP 2,094 2,094 2,764 2,764 Agricultural labourers
tM 1,550 1,550 2,513 2,513
o/F 544 544 251 251
(iii) qIRqIRCfi~"CIl1ff Cl4"o/p 1,416 1,416 952 952 HousehOld in<lustry workers llo/M 193 193 239 239
fi:':!o/F 1,223 1,223 713 713
(ivl 3Rl' "Cfi"Iff i2:fa/P 2,748 2,748 1,869 1,869 Other workers
;tM 874 874 1,091 1,091 oIF 1.874 1.874 718 778
11. fR Cff'fi G!lotP 100,350 100,350 106,750 106,750 Non-workers
;tM 36,205 36,205 37,977 37,977 o/F 64,145 64,145 68,773 68,773
64
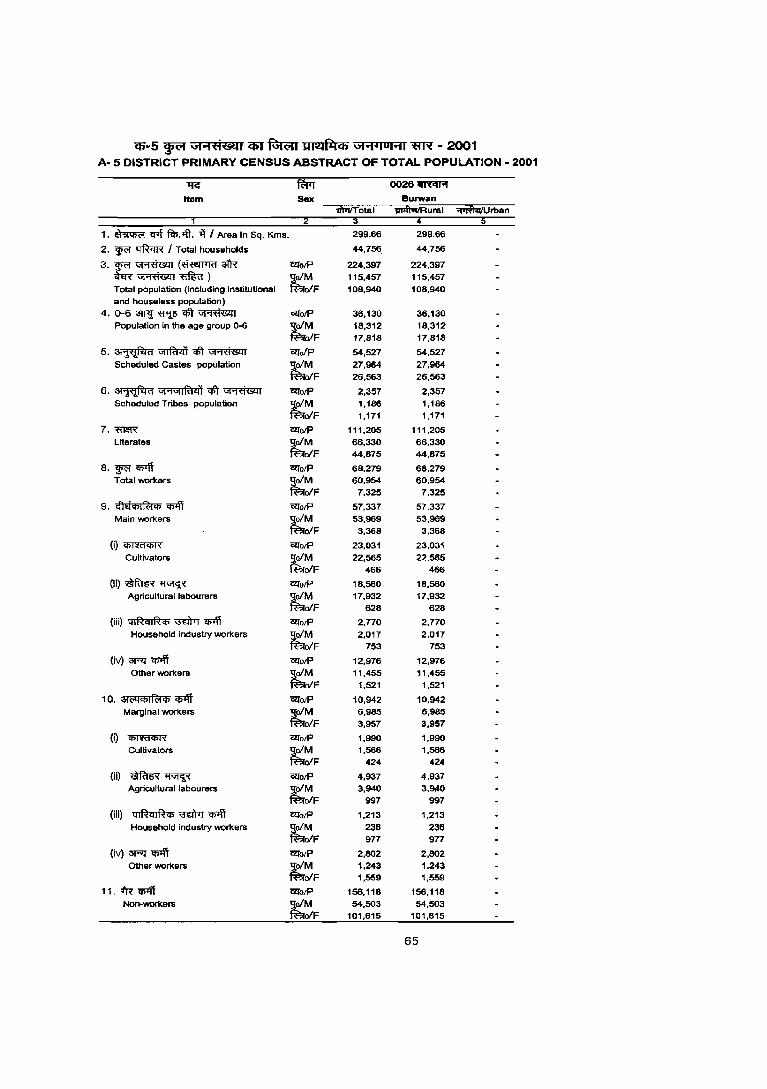
q;-5 ~ \if""l;H6Q' CIiT ~ UM~Cfi iSi"'f4 ,O'"i1 ~ - 2001 A- 5 DISTRICT PRIMARY CENSUS ABSTRACT OF TOTAL POPULATION - 2001
~ ~ 0026~
Itum Sax Burwan 1I'Io!I'r'otai ~ural ~rban
1. ~ ~ ffl>.-.ft. ~ I Area In Sq. Kms. 299.66 299.66
2. ~ ~ I Total households 44,756. 44,756
3.~~(~a1R UlatP 224.397 224,397 w~mirn) ~M 115,457 115,457 Total population (including institutional oIF 108,940 108,940 and houseless population)
4. 0-6 aTf1j Wi& qlt ~ ColfatP 36,130 36,130 Population in the age group 0-6 tM 18,312 18,312
oIF 17,818 17.818
5.~~qlt~ ColfolP 54,527 54,527 Scheduled Castes population tM 27,964 27,964
oIF 26,563 26,563
6. ~ Gf'lGllfi'lll1 q\T ~ c.zrotP 2,357 2,357 Scheduled Tribes population tM 1,186 1,186
oIF 1,171 1,171
7.~ c.zrotP 111,205 111,205 Literates tM 66,330 66,330
oIF 44,875 44,875
8. wc:r~ c.zrotP 68,279 68,279 Total \YOrkers tM 60,954 60,954
alF 7.325 7.325
9. G'1eiclil~Cjj q;>\T ColfotP 57.337 57.337 Main \YOrkers tM 53,969 53,969
alF 3,368 3,368
(i) "CjjffifCjjff ColfO/P 23,031 23,031 Cultivators ~M 22,565 22,565
o/F 466 466
(ii) ~ l'fGf"Cf< ClfotP 18,560 18,560 Agricultural labourers tM 17,932 17,932
oIF 628 628
(iii) 41~ql~Cjj ~ ~ c.zrotP 2,770 2,770 Household industry workers tM 2,017 2,017
oIF 753 753
(iv) 3Rl <fiIff <::!fotP 12,976 12,976 Other \YOrkers tM 11,455 11,455
oIF 1.521 1,521
10. 3t('tjCjjI~<t> CI>1ff <::!fotP 10,942 10,942 Marginal \YOrkers tM 6,985 6,985
oIF 3,957 3,957
(i) ~ <::!fotP 1,990 1,990 Cultivators tM 1.566 1,566
oIF 424 424
(ii) ~~ ColfatP 4,937 4,937 Agricultural labourers ;tM 3,940 3,~O
oIF 997 997
(iii) ql~ql~(jj ~ q;>\T ClfatP 1,213 1,213 Household industry workers tM 236 236
oIF 977 977
(iv) 3Rl q;t\'i <::!foR 2,802 2,802 Other workers ~
1,243 1,243 oIF 1,559 1,559
, 1. 1R <fiIff c.zrotP 156,118 156,118 Non-workers tM 54,503 54,503
oIF 101,615 101,615
65
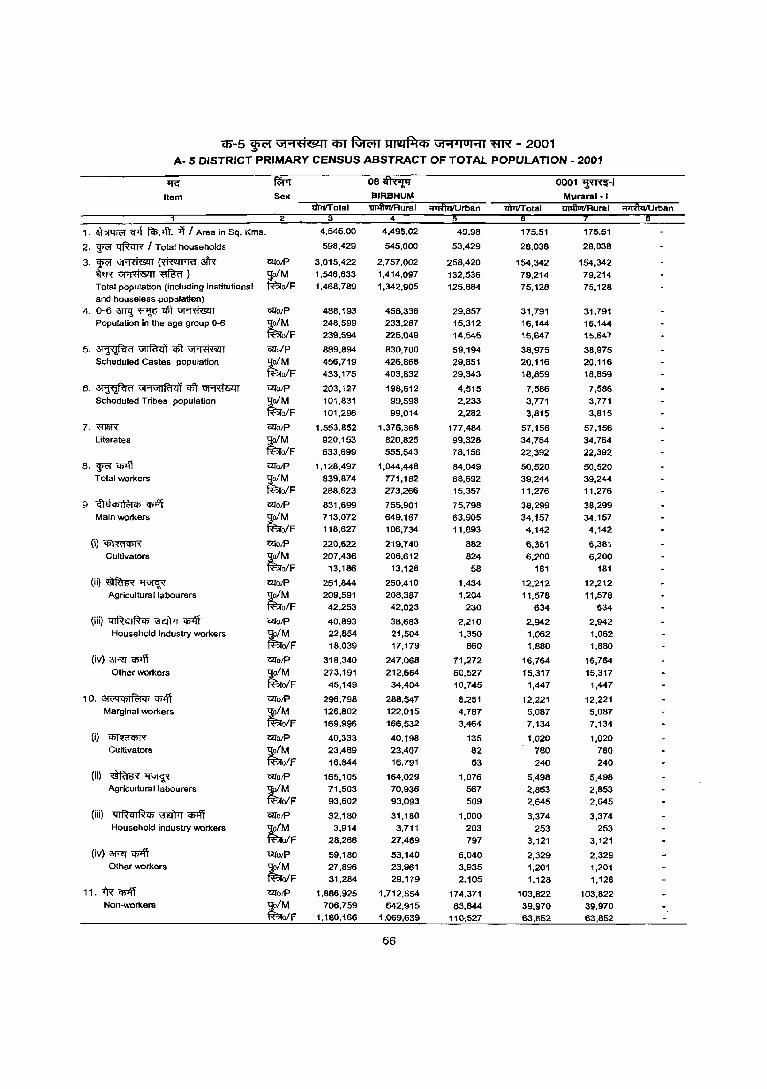
0-5 ¥ \iI ... tii@ll C6T ~ ~ \iI .... IOI ... 1 ~ - 2001 A- 5 DISTRICT PRIMARY CENSUS ABSTRACT OF TOTAL POPULATION - 2001
1lG ~ 08~ 0001 ~-I
Item Sel( BIRBHUM m'l/Total riiIiIRural ~Urt>an
2 4
1. ~ cpf f<l>. <!T. ill Area in Sq. Kms. 4,545.00 4,495.02 49.98 175.51 175.51
2, ~ ~ I Total households 598,429 545,000 53,429 28,038 28,038
3.~~(~3l'R C21'olP 3,015,422 2,757,002 258,420 154,342 154,342 W~~) ~M 1,546,633 1,414,097 132,536 79,214 79,214 Total population (including institutional ofF 1,468,789 1,342,905 125,884 75,128 75,128 and houseless ,poptllatkln)
4. 0-6 3W.! ~ qlt ~ C21'O/P 488,193 458,336 29,857 31,791 31,791 Population in the age group 0-6 ~M 248,599 233,287 15,312 16,144 16,144
olF 239,594 225,049 14.545 15,647 15.641
5.~~qft~ C21'o/p 889,894 830,700 59,194 38,975 38.975 Scheduled Castes population ~M 456,719 426,868 29,851 20,116 20,116
ofF 433,175 403,832 29,343 18,859 18,859
6. ~ u!'1u!l~ql qft ~ UiolP 203,127 198,612 4,515 1,566 7,586 Scheduled Tribes population ~M 101,831 99,598 2,233 3,771 3,771
olF 101,296 99,014 2,282 3,815 3.815
7. <1T&R UiolP 1,553,852 1,376,368 177,484 57,156 57,156 Literates ~M 920.153 820,825 99,328 34,764 34,764
olF 633,699 555,543 78,156 22,392 22,392
8.~'iI>'\T UioJP 1,128,497 1,044,448 84,049 50,520 50,520 Total workers tM 839,874 771,182 68,692 39,244 39,244
ofF 288.623 273,266 15,357 11,276 11,276
9, cfJaChIf<;td'l ~ WOJP 831,699 755,901 75,798 38,299 38,299 Main workers tM 713,072 649,167 63,905 34,157 34,157
ofF 118,627 106,734 11,893 4,142 4,142
(i)~ UioJP 220,622 219,740 882 6,381 6,381 Cultivators ~M 207,436 206,612 824 6,200 6,200
olF 13,186 13,128 58 181 181
(iQ~~ WO/P 251,844 250.410 1,434 12,212 12,212 Agricultural labourers tM 209,591 208,387 1,204 11,578 11,578
olF 42,253 42,023 230 634 634
(iii) 41~ql~Ch ~ ~ WO/P 40,893 38,683 2,210 2,942 2,942 Household industry workers tM 22,854 21,504 1,350 1,062 1,062
elF 18.039 17,179 860 1,880 1,880
(iv) 3RT <PIff WolP 318.340 247,068 71,272 16,764 16,764 Other workers tM 273,191 212,664 60,527 15.317 15,317
elF 45,149 34,404 10,745 1,447 1,447
i O. 3WtIi'ji1~q> <'P1ft 'UforP 296,798 288,547 8,251 12,221 12,221 Marginal workers ;tM 126,802 122,015 4,787 5,087 5,087
olF 169,996 166,532 3,464 7,134 7,134
(i) ~ WolP 40,333 40.198 135 1,020 1,020 Cultivators ;tM 23,489 23,407 82 780 780
olF 16,844 16.791 53 240 240
(ii) ~~ WolP 165,105 164,029 1,076 5,498 5,498 Agricultural labourers tM 71,503 70,936 567 2,853 2,853
elF 93,602 93,093 509 2,645 2,645
(iii) QI~qIRd'l~~ C2TolP 32,180 31,180 1,000 3,374 3,374 Household industry workers tM 3,914 3,711 203 253 253
elF 28,266 27,469 797 3,121 3,121
(iv) 3RT q;>ff 'Ufo/P 59,180 53,140 6,040 2,329 2.329 Other workers tM 27,896 23,961 3,935 1,201 1,201
elF 31,284 29,179 2,105 1,128 1,128
ii, iR' 'i:JPff C2folP 1,886,925 1,712,554 174,371 103,822 103,822 Non-workers
tZF 706,759 642,915 63,844 39,970 39,970
1,180,166 1,069,639 110;527 63,852 63,852
66

cn-5 ~ Gt""tiMI i61 ~ JlMIllIb Gt""'IOI'11 ~ - 2001 A- 5 DISTRICT PRIMARY CENSUS ABSTRACT OF TOTAL POPULATION - 2001
~ fWt 0OO2~-11 0003~-1 Item Sex Nalnati· I
m.t/Total m>ftvt/Rural ~Urban 6 6
1. ~ <fit f<l>.oft. -q J Area in Sq. Kms. 185.33 185.33 249.71 249.71
2. W<'I11ft<rr;( I Total households 33.229 33.229 40,474 40,474
3. W<'I ~ (~ 3fR' «[oiP 177.748 177.748 208.642 208,642
~~~) tM
90,473 90.473 107.527 107.527 Total population (inCluding institutional o/F 87.:275 87.275 101.115 101.115 and houseless population)
4. 0-6~~qft~ «[OIP 34.584 34.584 36.229 36,229
Population in the age group 0-6 tM
17,466 17,466 18.497 18,497
o/F 17.118 17,118 17,732 17,732
5.~~~~ «[alP 31.766 31.766 69.079 69,079
Scheduled Castes population tM
16.302 16.302 35.719 35,719 ofF 15,464 15,464 33.360 33,360
6. ~ GI'1G1IRl1l1 qft ~ <7foiP 663 663 9,093 9,093
Scheduled Tribes population ,!ofM 336 336 4.567 4,567
'R'?ro/F 327 327 4,526 4,526
7. -m&R <llolP 66.201 66.201 109,883 109.883
Literates tM
39.777 39.777 65.140 65,140
o/F 26,424 26,424 44.743 44.743
8. W<'I Cj)Iff «[OIP 57,581 57,581 73.357 73.357
Total workers tM 46,166 46,166 55.707 55,707
ofF 11.415 11,415 17.650 17.650
9. <lhTCf5I~'Ii q;l\T <7folP 46,108 46.108 54,981 54.981 Main workers tM 40,810 40.810 48.944 48.944
oIF 5,29d 5.298 6.037 6.037
(i)~ <2ToIP 10,216 10.216 13.656 13.656
Cu Itivators tM 10.020 10.020 12,932 12.932
oIF 196 196 724 724
(ii)~~ ~OIP 18,028 18.028 17,020 17,020
Agricultural labourers tM 17,556 17.556 15.023 15.023
ofF 472 472 1.997 1.997
(iii) QlR41R'Ii m:iP1 q;#i «[OIP 6,330 6.330 2.374 2.374
Household industry \llQrkers tM 2,831 2.831 1,418 1.418 olF 3,499 3.499 956 956
(iv) aM <i>Iff «[OIP 11,534 11,534 21.931 21.931
Other workers tM 10.403 10.403 19.571 19.571
ofF 1,131 1.131 2.360 2.360
10. a:t6Y'liI~'Ii ~ <7fO/P 11,473 11,473 18.376 18,376
Marginal workers ~M 5,356 5.356 6.763 6,763
oIF 6,117 6,117 11,613 11.613
(i) ~ ClfO/P 1,356 1.356 2.244 2.244
Cultivators tM 921 921 1,194 1,194
o/F 435 435 1,050 1,050
(ii) ~~ ClfotP 4,138 4,138 10,819 10.819
Agricultural labourers tM 2,966 2.966 3,852 3.852 olF 1,172 1,172 6.967 6,967
(iii) 4IRqIR4> ~ '4>'\1 <7fotP 4,232 4,232 1,236 1,236 Household industry workers tM 485 485 154 154
o/F 3.747 3,747 1,082 1,082
(iv) 3Rl'~ <2TOIP 1.747 1.747 4.077 4.077
Other workers tM 984 984 1.563 1.563
o/F 763 763 2.514 2.514
11. i'R q;#i <7fO/P 120.167 120,167 135,285 135.285 Non-workers tM 44.307 44.307 51,820 51,820
ofF 75.860 75,860 83,465 83,465
67

cp-5 ~ Gl"Ht&t1 q;y Rffiffi ~ G..-1110 HI 'WX - 2001 A· 5 DISTRICT PRIMARY CENSUS ABSTRACT OF TOTAL POPULATION· 2001
'ZIG fWr 0004~-1I 0005 '(1'1'1'<1.'1<:-1 Item Sex Nalhatl ·11 Rampurhat • I
tI\1lI1' otal lIJ1ftVVRural "i1i&iUrban iiiiilTotal ilPliUi'Rural :;:;;;&Urban 2 3 6
1. ~ Cf1l f<I>.lft. If I Area in SQ. Kms. 109.15 109.15 287.63 287.63
2. WM ~ I Total households 20.627 20,627 31,040 31,040
3. W<'I' ~ (~ 3'tR ~otP 107,658 107,658 159,193 159,193 W~~l tM 54,976 54,976 81,349 81,349 Total population (including institutional olF 52,682 52,682 77,844 77,844 and houseless popUlation)
4. 0-6 :m<J ~ ql't ~ Ul'otP 20,0:;20 20,020 26,250 26,250 Population In the age group 0-6 tM 10,031 10,031 13.309 13,309
ofF 9,969 9,989 12,941 12,941
5.~~mt~ ~oIP 24,231 24,231 49,979 49,979 Scheduled Castes population tM 12,499 12,499 25,520 25,520
ofF 11,732 11,732 24,459 24,459
6. ~ VI'1\JlIRl41 <lit ~ <&iP 341 341 21,038 21,038 Scheduled Trioes population tM 158 158 10.461 10.461
olF 183 183 ' 10,577 10,577
7: 'fflm 7Z10/P 54,027 54.027 82,321 82,321 Literates tM 31.528 31,528 48,998 48,998
ofF 22,499 22,499 33,323 33,323
8. WC1 q;,:ff 7Z10/P 35.879 35,879 70,571 70,571 Total workers ~M 28.562 28.562 47,046 47,046
ofF 7,317 7,317 23,525 23,525
9. ..fltlqj I ~ Cf> ""* ~a/P 27,100 27,100 50,303 50,303 Main workers tM 24,643 24,643 40,040 40,040
ofF 2.457 2,457 10.263 10,263
(i)~ Cll'otP 7,319 7,319 14,393 14,393 Cultivators tM 7.188 7.188 12.538 12,538
ofF 131 131 1,855 1,855
(ii)~~ Cll'aR 11,467 11,467 15,276 15,276 Agricultural labourers tM 10,647 10,647 10,921 10,921
ofF 820 820 4,355 4,355
(iii) ql fh IR qj \ffiTtT C!>'ff ClioA' 1,634 1,634 1,853 1,853 Household if\dustry workers ~M 780 780 962 962
olF 854 854 891 891
(iv) 3Rl' <filft' Cll'O/P 6,680 6,680 18,781 18,781 Other workers ~M 6.028 6.028 15,619 15,619
ofF 652 652 3,162 3,162
10. 31C<1<"bIf<>iqj q;>ff Cll'oA' 8,779 8,779 20,268 20,268 Marginal workers ~M 3.919 3.919 7.006 7.006
ofF 4,860 4,860 13,262 13,262
(il ~ CljoR 1,094 1,094 3,879 3,879 Cultivators tM 935 935 1,695 1,695
ofF 159 159 2,184 2,184
(ii) ~~ GlfoIP 3,106 3,106 11,803 11,803 Agricultural labourers ~M 1,912 1.912 3,601 3,601
ofF 1,194 1,194 8,202 8,202
(iii) 41 R q I R Cf> \'lEl'trr CI7llT GlfolP 2,131 2,131 1,025 1,025 Household industry workers tM 143 143 155 155
ofF 1,988 1,988 870 870 (iv) 3Rl q;>ff 1"2l'oIP 2,448 2,448 3,561 3,561
Other workers tM 929 929 1,555 1,555 ofF 1,519 1,519 2,006 2,006
11.~~ 'l2tofP 71,779 71,779 88,622 88,622 Non-WOrkers tM 26,414 26,414 34,303 34,303
ofF 45,365 45,365 54,319 54,319
68

Cfi'-5 WCJ GI"'=tt&11 Cfi'T ftm;rr ur.a~Cb GI",-.OI"'1 ~ - 2001 A- 5 DISTRICT PRIMARY CENSUS ABSTRACT OF TOTAL POPULATION - 2001
~ fWT 0OO6~-1I 0007~-1 Item Sex
1IFJi'Totai 3
,. ~ Cf't ~.-.fi. -q I Area in Sq. Kms. 181.55 181,55 224.83 224.83
2. ~ ~ I Total households 30,325 30,325 28,376 28,376
3.~~(~3tR O!loiP 158,742 158,742 139,733 139,733 ~~~) tM 81,919 81,919 71,650 71,650 Total populallon (inCluding Institutional ofF 76,823 76,823 68,083 68,083 and house less populatlon)
4. 0-6 am.! ~ <t>'t ~ O!lOlP 26,455 26,455 21,647 21,647 Population in the age group 0-6 ~ 13,632 13,632 11,035 11,035
ofF 12,823 12,823 10,612 10,612
5.~~ctt~ O!lolP 52,405 52,405 45,553 45,553 Scheduled Castes population ~M 27,244 27,244 23,339 23,339
elF 25,161 25,161 22,214 22,214
6. ~ ","\GIIR!,i1 ~ ~ O!lotP 665 665 9,065 9,065 Scheduled Tribes populallon ~M 325 325 4,589 4.589
elF 340 340 4,476 4,476
7. m&R O!lo/p 84,042 84,042 77,198 77,198 Literates tM 49,993 49,993 45,856 45,856
elF 34.049 34,049 31.342 31.342
8. WC'f <I>1ff O!lo/p 55,568 55,568 53,701 53,701 Total workers tM 43,821 43,821 39,028 39,028
elF 11,747 11,747 14,673 14.673
9. <fltlCf>IR;tCf> ~ O!lo/p 41,793 41,793 37,417 37,417 Main workers tM 37.049 37.049 31.334 31.334
o/F 4.744 4.744 6.083 6.083
(i)~ O!loiP 10,577 10,577 12,633 12,633 Cultivators ~F 10.267 10.267 11.907 11.907
310 310 - 726 726
(ii)~~ <2l'o/p 15,440 15,440 13.665 13.665 Agricultural labourers tM 14.108 14,108 10,488 10,488
oIF 1,332 1,332 3,177 3,177
(iii)~~~ O!lo/p 4.625 4.625 2.072 2.072 Household industry workers tM 3.340 3.340 1,017 1.017
elF 1,285 1,285 1.055 1,055
(iv) 3RI' 'Cf>1ff O!loiP 11.151 11.151 9.047 9.047 Other workers tM 9,334 9,334 7,922 7,922
elF 1,817 1,817 1,125 1,125
10. 31(il1Cj)I~Cf> ri O!loiP 13.775 13.775 16.284 16.284 Marginal workers tM 6.772 6,772 7,694 7,694
elF 7,003 7,003 8,590 8,590
(i) ~ O!loiP 1,656 1,656 2,752 2.752 Cultlvators tM 1,253 1,253 1,747 1.747
elF 403 403 1,005 1,005
(ii) ~~ O!loiP 6.468 6.468 9.934 9,934 Agricullurallabourers tM 4,137 4,137 4,827 4.827
elF 2,331 2,331 5,107 5.107
(iii) ~~'Cf>IlT ~O/P 2,624 2,624 1.843 1,843 Household industry workers tM 282 282 214 214
elF 2,342 2,342 1,629 1,629
(iv).3RI' 'Cf>1ff ~ 3,027 3,027 1,755 1.755 Other workers tM 1,100 1,100 906 906
elF 1,927 1,927 849 849
11. tR ~ 0!l0lP 103,174 103,174 86,032 86,032 Non-workers tM 38,098 38,098 32,622 32,622
elF 65,076 65,076 53,410 53,410
69

Cf)-5 ~ \iI .... 'fiil.cOQl Q)]' fGwrr ~\i1'1'IOI"1I ~ - 2001 A- 5 DISTRICT PRIMARY CENSUS ABSTRACT OF TOTAL POPULATION - 2001
~ tWT 0008~-1I 0009 ~ iI"IUIT'l
Item Sex Mohammad Bazar 'iI)ii/f olal WtiTolal 1ii1ft1iIIRurai ~rban
1. ~ err! ~.;ft. 'ill Area in Sq. Kms. 156.57 156.57 315.64 315.64
2. !f<'I 1:Iftcrff I Total households 23,246 23,246 27.805 27,805
3.!f<'I~~~ 1:ZfolP 113,031 113,031 139,465 139,465 W~~) ~M 58,185 58,185 71,384 71,384 Total population (including Institutional Q/F 54,846 54,846 68,081 68,081 and house less population)
4. 0-6 31Fl "'lil" qlt ~ 1:ZfolP 17,297 17,297 24,625 24,625 Population In the age group 0-6 ~M 8,970 8,970 12,540 12,540
ofF 8,327 8,327 12,085 12,085
5.~~qlt~ 1:ZfofP 34,625 34,625 37,368 37,368 Scheduled Castes population ~M 17,744 17,744 19,179 19,179
olF 16,881 16,881 18,189 18,189
6. ~ \i1.,\i1IR!<i'i ctt ~ <lIolP 7,553 7,553 26,800 26.800 Scheduled Tribes population ~M 3,847 3,847 13.380 13.380
ofF 3,706 3,706 13,420 13.420
7. ml\R 1:ZfolP 60,089 60,089 63,310 63,310 Literates ~M 35,972 35,972 38,554 38,554
ofF 24,117 24,117 24.756 24,756
8, !f<'I <l>lff <lIo/P 43,097 43,097 52,446 52,446 Total workers ~M 33,711 33,711 38,302 38,302
ofF 9,386 9,386 14,144 14.144
9. <fl0<t>1R1<t> "Cf>1i 1:ZfO/P 35,243 35,243 37,872 37,872 Main workers tM 30,602 30.602 32.228 32.228
ofF 4,641 4,641 5,644 5,644
(i)~ CZTO/P 12,916 12.916 9.067 9.067 Cultivators tM 12,465 12,465 8,306 8,306
ofF 451 451 761 761
(i~~~ CZToIP 12,926 12,926 11,631 11.631 Agricultural labourers ~
10,376 10,376 8,861 8,861
ofF 2.550 2.550 2.770 2,770
(iii) 4IRqIR<t> \3EI)Tr ~ Oll"OJP 1,278 1,278 977 977 Household industry workers tM 676 676 630 630
ofF 602 602 347 347
(iv) 3Rt~ CZTO/P 8,123 8.123 16,197 16.197 Other workers f:' 7,085 7,085 14.431 14,431
ofF 1.038 1.038 1,766 1,766
10. 31t"l<t>If(;j<t> <l>lff Oll"oJP 7.854 7,854 14,574 14,574 Marginal workers ;tM 3,109 3,109 6,074 6,074
ofF 4,745 4,745 B,500 8,500
(i) ~ CZJO/P 1,813 1,813 1,769 1,769 Cultivators ;tM 1,049 1,049 1,048 1,048
ofF 764 764 721 721
(iO ~~ CZJO/P 3,986 3,986 9,680 9,680 .Agrlculturallabourers
~F 1,211 1,211 3,456 3,456 2,775 2,775 6,224 6,224
(iii) ql~qIR<t> ~ "Cf>1i CZJotP 595 595 773 773 Household industry workers tM 98 98 112 112
ofF 497 497 661 661
(iv) 3Rt <I>lff O1IotP 1.460 1,460 2,352 2,352 Other workers tM 751 751 1,458 1,458
ofF 709 709 894 894
11. 1R" ~ "&fotP 69,934 69,934 /;17,019 87,019 Non-workers tM 24.474 24,474 33,082 33,082
olF 45.460 45,460 53,937 53,937
70

Cfi-5 ¥ Gt ... 'ti@u CfiT ~ UMfitCb Gt .... IOHI ':fiR - 2001 A- 5 DISTRICT PRIMARY CENSUS ABSTRACT OF TOTAL POPULATION - 2001
'If<:' fWr 0010~ 0011 ~-I Item Sex RaJnagar Surl-I
lI1iftUIIR ural :::r:rifuIU rban il)Tfjfotal iiJift1JTIRural ~rban 1
1. ~ 1f't ~.1lT. ~ J Area in Sq. Kmli. 221.47 221.47 154.65 154.65
2. ~ ~ J Total househOlds 14,470 14,470 20,047 20,047
3.~~~3l'R" CZ!otP 69.692 69,692. 96,476 96.476 ~~~) ~M 35,512 35,512 49,939 49,939 Total population (including Institutional ofF 34,180 34,180 46,537 46,537 and house less population)
4.0-6~~c6t~ CZ!otP 11,073 11,073 15,248 15,248 Population in the age group 0-6 r:' 5,672 5,672 7,752 7,752
ofF 5.401 5.401 7,496 7,496
5.~~ctft~ CZ!o/p 23,598 23,598 34,998 34,998 Scheduled Castes population ~M 12,073 12,073 18,005 18,005
olF 11,525 11,525 16,993 16,993
6, ~ VJ'1\JJIRilll ctft ~ CZ!OfP 10,524 10,524 8,174 8,174 Scheduled Tribes population ~M 5,213 5,213 4,082 4,082
olF 5,311 5,311 4,092 4,092
7,~ CZ!otP 34,153 34,153 50,799 50,799 Literates 9;ofM 21,006 21,006 30,512 30,512
l'ao/F 13,147 13,147 20,287 20,287
8.~~ CZ!OfP 31,918 31,918 41,309 41,309 Total workers ~M 20,247 20,247 28,080 28,080
ofF 11,671 11,671 13,229 13,229
g. GI t\iI> I R:iil> '(j)'Ijl CZ!orP 19,348 19,348 29,402 29,402 Main workers llofM 15,587 15,587 24,087 24,087
l'ao/F 3,761 3,761 5,315 5,315
(i)~ «lo/p 5,732 5,732 5,523 5,523 Cultivatorli ~M 5,156 5,156 5,005 5,005
ofF 576 576 518 518
(ii)~~ C2TorP 3,856 3,856 4,894 4,894 Agricultural labourers
tM 2,745 2,745 3,859 3,859
ofF 1,111 1,111 1,035 1,035
(iii) ql~ql~iI> ~ Cjj1ff C2TotP 1,750 1,750 1,254 1,254 Household industry workers
r;zF 981 981 556 556 769 769 698 698
(iv) 3Rl' ~ C2TO/P 8,010 8,010 17.731 17,731
Other workers tM
6,705 6,705 14,667 14,867 o/F 1,305 1,305 3,064 3,064
10, 31<'QiI>l~iI> '(j)1j1 C2JO/P 12,570 12,570 11,907 11,907 Marginal workers
tM 4,660 4,660 3,993 3,993
ofF 7.910 7,910 7,914 7,914
(i) ~ CZ!O/P 1.558 1,558 822 822 Cultivators
tM 884 884 424 424
ofF 674 614 398 398
(ii) ~~ CZ!O/P 6.982 6,982 6,657 6,657 Agricultural labourers
tM 2.641 2,641 1.906 1,906
ofF 4.341 4,341 4,751 4,751
(iii) ql~ql~iI> \3ETm '(j)1j1 C2TotP 2.053 2,053 1.423 1,423 Household industry workers
tM 159 159 140 140
ofF 1.894 1.894 1.283 1,283
(iv) 3Rl' tf51ff CZ!otP 1,977 1,977 3,005 3,005 Other workers tM 976 976 1,523 1,523
ofF 1.001 1,001 1,482 1,482
i 1. fR <I>Iff C2TO/P 37.774 37,774 55,167 55,167 Non-wor1<ers
tM 15,265 15,265 21.859 21,859
ofF 22,509 22,509 33,308 33,308
71

CJi-5 ~ \I1"1-HiB'Q1 QiJ ~ lrl~~Cb \11"'1'1 0 1"11 'flR - 2001 A~ 5 DISTRICT PRIMARY CENSUS ABSTRACT OF TOTAL POPULATION - 2001
'If<:" fWr 0012 iff-II 0013ih
Item Sex Surl-II u,lllurlRural
2
1, ~ '<fl1 fcf;,>ft, 'I'i I Area in Sq. Kms. 135.81 135.81 304.39 302.78 1.61
2, sn" ~ / Total households 15,870 15,870 36,014 34,239 1,775
3. '¥1 ~ (~3lR 'CZIotP 77,001 77,001 175,645 187,234 8,411 ~~~) ~M 39,590 39,590 90,048 85,748 4,300 Total population (inclUding institutional OfF 37,411 37,411 85,597 81,486 4,111 and houseless population)
4. 0-6 3lTIj ~ qft ~ 'CZIotP 12,703 12,703 26,825 25,693 1,132 population in the age group 0-6 ~M 6,456 6,456 13,596 13,014 582
o/F 6,247 6,247 13,229 12,679 550
5.~~qft~ molp 25,417 25,417 60,300 57,903 2,397 Scheduled Castes population tM 13,027 13,027 30,971 29,786 1,185
ofF 12,390 12,390 29,329 28,117 1,212
6, ~ "1'1"1IR1<l'i qft ~ ClToIP 9,753 9,753 21,197 21,172 25 Scheduled Tribes population tM 4,941 4,941 10,539 10,535 4
ofF 4,812 4,812 10,658 10,637 21
7. WIlR CZTotP 41,052 41,052 96,608 91,187 5,421 Literates ~M 24,304 24,304 56,884 53,835 3,049
ofF 16,748 16,748 39,724 37,352 2,372
8. rr"<l>lfi CliolP 38,045 38,045 67,463 64,742 2,721 Tolal workers tM 22,926 22,926 49,724 47,539 2,185
ofF 15,119 15,119 17,739 17,203 536
9. ~EiifilR:tq; ~ CllotP 20,593 20,593 47,026 44,768 2,258 Main workers r:' 17,513 17,513 40,895 38,973 1,922
ofF 3,080 3,080 6,131 5,795 336
(i)~ CllO/P 6,699 6,699 15,477 15,395 82 Cultivators
~ 6,041 6,041 14,666 14,587 79 ofF 658 658 811 808 3
(ii)~~ tl:fo/P 6,707 6,707 16,330 16,282 48 Agricultural tabourers tM 5,299 5,299 13,304 13,260 44
ofF 1,408 1,408 3,026 3,022 4
(iii) QIf'lcIlR", ~ ~ '&fo/P 501 501 1,784 1,686 98 Household industry workers ~M 305 305 1,158 1,100 58
ofF 196 196 626 586 40
(iv)~~ '&fo/P 6,686 6.686 13,435 11,405 2,030 Other workers tM 5,868 5,868 11,767 10,026 1,741
ofF 818 818 1,668 1,379 289
10, 3T<"lifilR:iifi <n4T 'tl:fotP 17,452 17,452 20,437 19.974 463 Marginal workers tM 5,413 5,413 8,829 8,566 263
ofF 12,039 12,039 11,608 11,408 200
(il ~ '&folP 3,855 3,855 2,556 2,531 25 Cultivators tM 1,235 1,235 1,724 1,715 9
ofF 2,620 2,620 832 816 16 (ii) ~~ ~olP 8,641 8,841 15,264 15.121 143
Agricultural labourers tM 2,929 2,929 5,881 5,830 51 ofF 5,712 5,712 9,383 9,291 92
(iii) ql~ql~"'~~ ~olP 1,190 1,190 823 789 34 Household industry workers tM 84 84 187 174 13
ofF 1,106 1,106 636 615 21 (iv) ~ CI>'1l ~O/P 3,766 3,766 1,794 1,533 261
Other workers tM 1.165 1,165 1,037 847 190 ofF 2,601 2,601 757 686 71
11. i'R q;;ff GlTolP 38,956 38,956 108.182 102,492 5,690 Non-workers' ~M 16,664 16,664 40,324 38,209 2,115
ofF 22,292 22.292 67,858 64,283 3,575
72 '
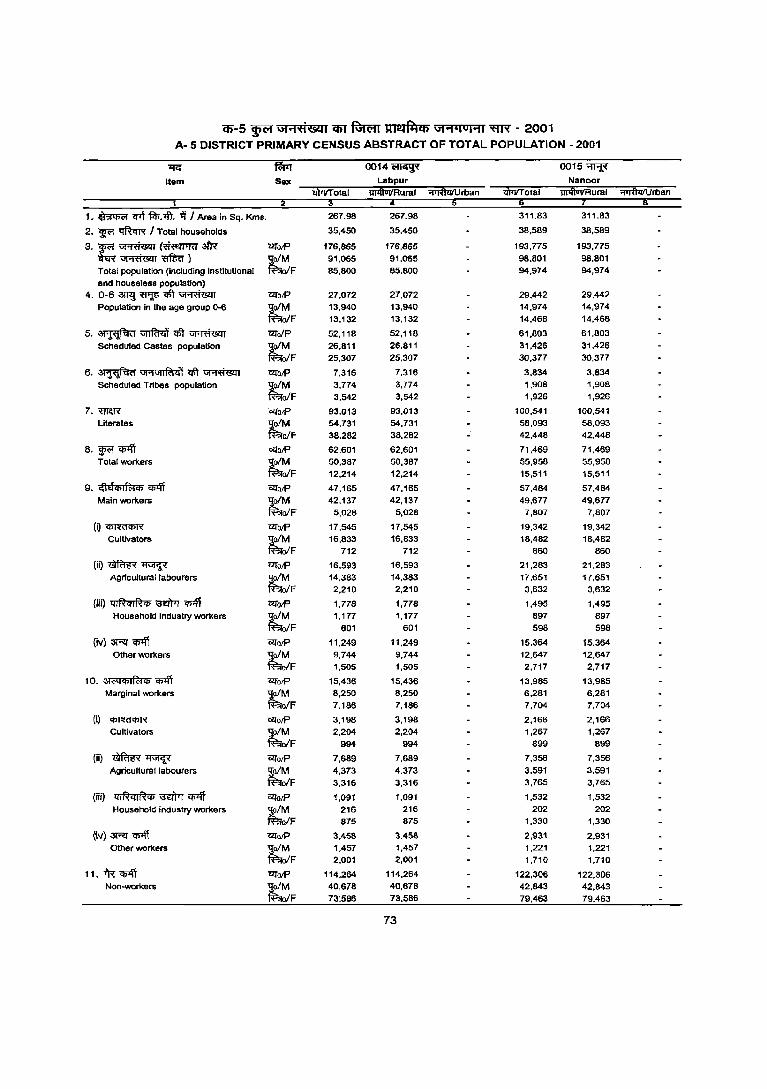
cn-5 !R" \1I"1fl'@tl cnr Rffi;rr ~ \11"1"101"11 "fJ'N - 2001 A- 5 DISTRICT PRIMARY CENSUS ABSTRACT OF TOTAL POPULATION - 2001
1fi: f*Pl 0014~ 0015~
Item Sex Nanoor
tWrITotal ,"41uilRural 'l'RlWUrban
1. ~ 'lJ'T11$,lft. l't I Area In Sq. Kms. 267.98 267.98 311.83 311.83
2, ~ ~ I Total households 35.450 35.450 38.589 38.589
3.~~(~3fI< C2l'otP 176.865 176.865 193.775 193.775
teR~~) tM 91.065 91.065 98.801 98.801
Total population (including institutional ofF 85.800 85.800 94.974 94.974
and houseless population) 4.0-6~~c6\~ C2l'otP 27.072 27.072 29.442 29.442
PopulaUon in the age 9roup 0-6 ~F 13.940 13.940 14.974 14.974
13.132 13.132 14,468 14,468
5.~~~~ C2l'oIP 52.118 52.118 61.803 61.803
Scheduled Castes population tM 26.811 26.811 31,426 31,426
ofF 25.307 25.307 30.377 30.377
6. ~ Vj"jlj1l1'?l41 ~ ~ C2l'otP 7.316 7.316 3.834 3.834
Scheduled Tribes population tM 3.774 3.774 1.908 1.908
ofF 3.542 3,542 1,926 1.926
7.mm C2l'otP 93.013 93.013 10Cl.541 1C10.541 Literates
~ 54.731 54.731 58.093 58.093
olF 38.282 38.282 42,446 42,448
8. WR <IfIff C2l'0IP 62.601 62.601 71,469 71.469 Total workers tM 50.387 50,387 55.958 55.958
ofF 12.214 12.214 15.511 15.511
9. i{\ sol '" I fcl '" <IfIff OlfotP 47.165 47.165 57,484 57.494
Main workers
~ 42.137 42.137 49.677 49.677
ofF 5.028 5.028 7.807 7.807
(0 <PmfCI>R C2l'otP 17.545 17.545 19.342 19.342 Cultivators tM 16,833 16.833 18,482 18,482
ofF 712 712 860 860
(ii)~~ C2l'otP 16.593 16.593 21.283 21.283 Agricultural laoourers ~ 14.383 14.383 17.651 17.651
ofF 2.210 2.210 3.632 3.632
(iii) ql~ql~'" '\3"i!itTJ q;;ff C2l'otP 1.778 1,778 1,495 1,495 Household industry workers tM 1.177 1.177 897 897
ofF 601 601 598 598
(ivl~'<t>'ff C2l'otP 11.249 11.249 15.364 15.364 other workers ~M 9.744 9.744 12,647 12.647
olF 1,505 1,505 2,717 2,717
10. 31<"!"'II1t", '<t>'ff C2l'otP 15,436 15,436 13,985 13.985 Marginal workers tM 8.250 8.250 6,281 6.281
ofF 7.186 7.186 7,704 7.704
(I) <PmfCI>R OlfotP 3.198 3.198 2,166 2.166 Cultivators ~M 2,204 2.204 1,267 1.267
ofF 994 994 899 899
(ii) ~~ C2l'o/P 7.689 7.689 7,356 7.356
Agricultural labourers tM 4,373 4.373 3.591 3.591
ofF 3.316 3.316 3.765 3.765
(iii) ql~ql~'" '\3"i!itTJ q;-.ff C2l'otP 1.091 1.091 1,532 1.532 Household industry workers tM 216 216 202 202
ofF 875 875 1.330 1.330
~v)~'<t>'ff C2foJP 3.458 3,458 2.931 2.931 Other workers tM 1,457 1.457 1.221 1.221
ofF 2.001 2.001 1.710 1.710
11. fR <IfIff C2fotP 114.264 114.264 122.306 122.306 Non-workers tM 40.678 40.678 42.843 42.843
ofF 73;586 73.586 79,463 79.463
73
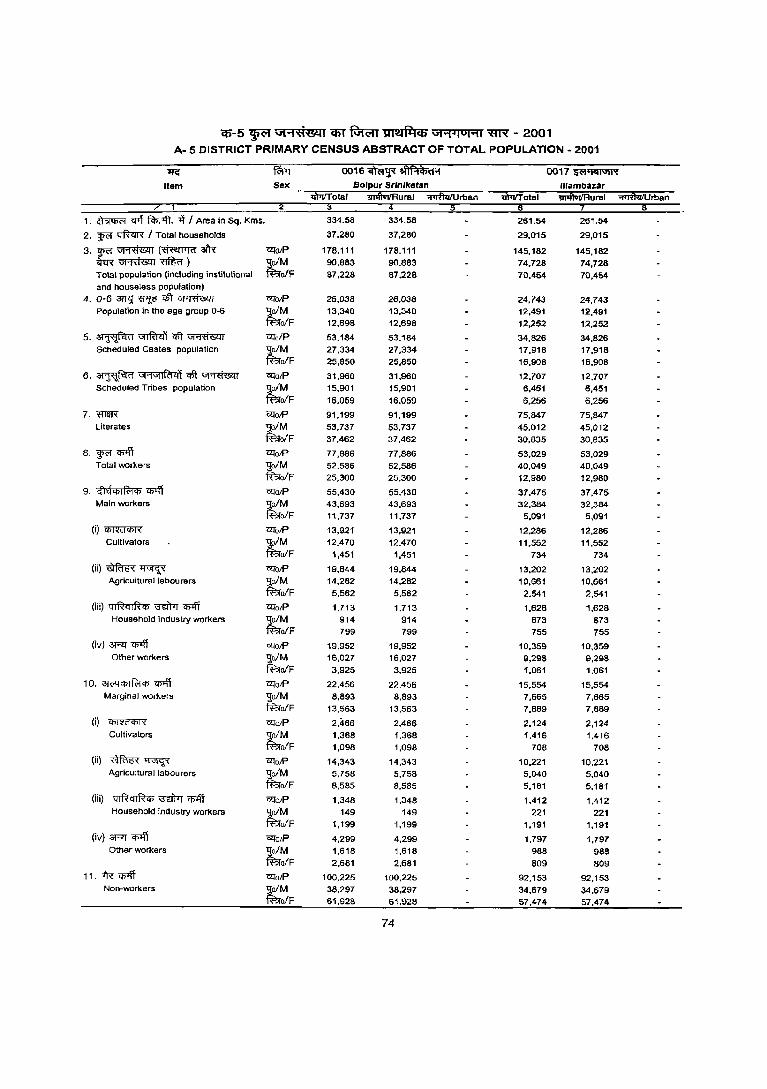
<5-5 ~ Gt""l::«@Ot1 COT ~ IllilfltCS "'""1.101""11 ~ - 2001 A.- 5 DISTRICT PRIMARY CENSUS A.BSTRACT OF TOTAL POPULATION - 2001
"If<:" ~ oo16~~ 0017 !<(iI'till\J1I't
Item Sex lIIamlla%lIr ~otal 1l'PiIvTIRurai '1' ,,!'I<J/Urban
1. ~ <JOt FcP.lfi. >1 / Area in sq. Kms. 334.56 334.56 261.54 261.54
2. w<'f ~ / Total households 37,280 37.260 29,015 29,015
3. w<'f ~ (~ atR- CllO/P 178,111 178.111 145,182 145,162 ~~~) tM 90,883 90,863 74,728 74,728 Total population (including instilutional ofF 87,228 87,228 70,454 70,454 and houseless population)
4. 0-6 3W1 ~ '!ft ~ CllO/P 26,036 26,038 24,743 24.743 Population in the age group 0-6 tM 13,340 13,340 12,491 12,491
olF 12.696 12.698 12,252 12,252
5. ~ 'i3!Tfcrdj <1ft ~ Cllo/P 53.184 53.184 34,826 34.826 Scheduled Castes population tM 27,334 27,334 17,918 17.918
olF 25,850 25,850 16,908 16.908
6. ~ Gf'1GfIR!<il qlt ~ ~O/P 31,960 31,960 12.707 12.707 Scheduled Tribes population
tM 15,901 15,901 6,451 6,451 olF 16.059 16.059 6,256 6.256
7. 'ID&R CllolP 91,199 91.199 75.847 75,847 Literates tM 53,737 53,737 45,012 45,012
ofF 37,462 37,462 30.835 30,835
8. w<'f cn>ft czrolP 77,886 77,886 53,029 53,029 Total workers ~o/M 52.586 52,586 40.049 40,049
fF.:ro/F 25,300 25.300 12,980 12,980
9. "Je!"'I~'" q;lff Cll'o/P 55,430 55,430 37,475 37.475 Main workers t;M 43.693 43,693 32,384 32,384
olF 11.737 11,737 5.091 5,091
(i)~ Cll'olP 13,921 13,921 12.286 12,286 Cultivators tM 12,470 12,470 11.552 11,552
ofF 1,451 1,451 734 734
(ii)~~ CllolP 19,844 19,844 13.202 13,202 A9ricultural labourers tM 14,282 14,282 10,661 10,661
ofF 5.562 5.562 2.541 2.541
(iii) 4IRqIR", ~ ~ ~O/P 1.713 1.713 1.626 1,628 Household industry workers tM 914 914 873 873
ofF 799 799 755 755 (iv) 3RT~ Cll'olP 19.952 19,952 10.359 10,359
Other workers ~o/M 16,027 16,027 9,298 9,298 fF.:rofF 3.925 3.925 1,061 1.061
10. »l<"l¢If<;j", q;lff Cll'olP 22,456 22.456 15.554 15.554 Mar9inal workers l_!o/M 8,893 8,893 7,665 7,665
fF.:ro/F 13,563 13,563 7,889 7,889
(i) ~ czro/p 2,466 2,466 2,124 2,124 Cultivators tM 1.368 1.368 1.416 1,416
o/F 1,098 1,098 708 708 (ii) ~~ CllolP 14,343 14,343 10,221 10,221
Agricultural labourers ~o/M 5.758 5.758 5,040 5.040 fF.:ro/F 8,585 8,585 5.181 5,181
(iii) 4IRqIRq; milT! ~ CllO/P 1.348 1.348 1.412 1,412 Household inClustry wor1<ers
~ 149 149 221 221 olF 1,199 1,199 1.191 1,191
(iv) 3RT~ CllO/P 4.299 4,299 1,797 1,797 Other workers
~ 1,618 1.618 988 988 olF 2,681 2.681 809 809
11. i"R ~ Cllo/P 100.225 100.225 92,153 92.153 Non-workers
~ 38,297 38,297 34.679 34,679 ofF 61,928 61,928 57,474 57,474
74
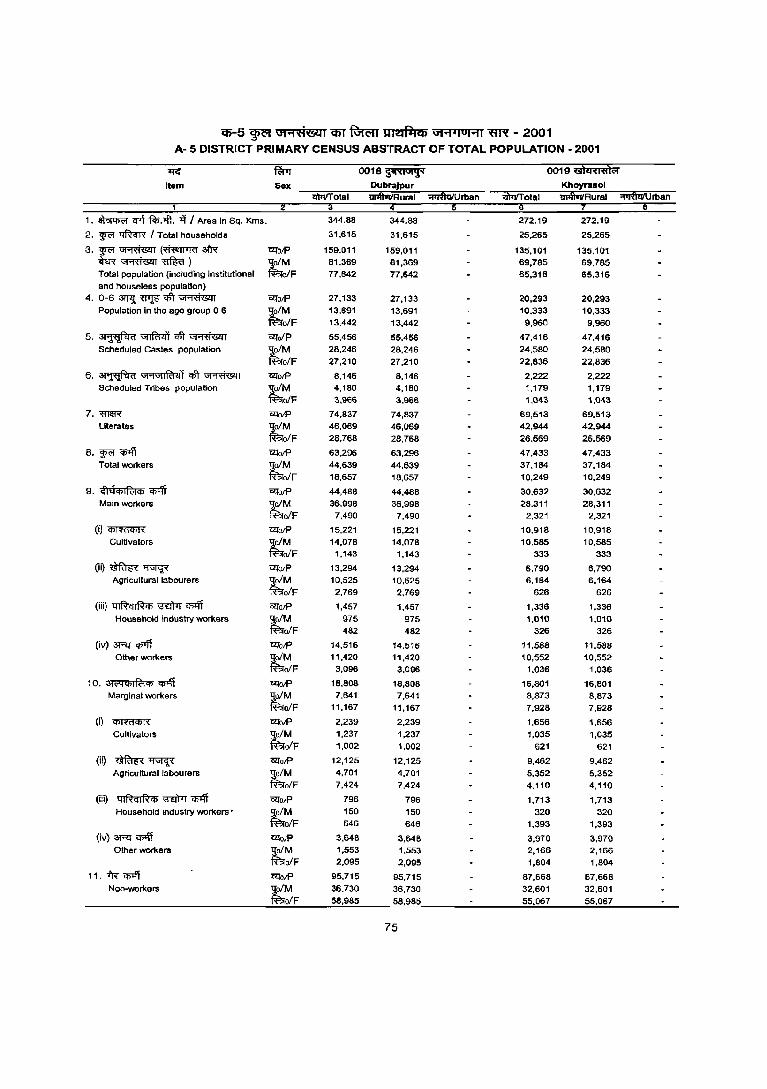
i6'-5 ~ \J'I"Ifl&Ol1 (ffi ~ Jrl~fi:lq) \J'I"I'IOI"l1 ~ - 2001 A- 5 DISTRICT PRIMARY CENSUS ABSTRACT OF TOTAL POPULATION - 2001
1'!Cl" fRrT 0018~ 0019 OiJi<l'!locd<'l
Item Sex Khoyrasol 'l/Ir(fT ota I l11410ilRural ~rban
1. ~ ~ f<l>.1ft. if I Area in Sq. Kms. 344.88 344.88 272.19 272.19
2. ~ ~ I Total households 31.615 31.615 25.265 25,265
3.~~(~~ l2iotP 159,011 159,011 135,101 135,101 ffi~~) ~F
81,369 81,369 69,785 69,785 Total population (including institutional 77,642 77,642 65,316 65,316 and houseless population)
4.0-6~~qft~ Cll'olP 27,133 27,133 20,293 20,293 Population In the age group 0-6 tM 13,691 13,691 10.333 10,333
oIF 13,442 13,442 9,960 9,960
5. ~ 'Vf'If<nif qft ~ ClfolP 55,456 55,456 47,416 47,416 Scheduled Castes population tM 28,246 28,246 24,580 24,580
olF 27,210 27,210 22,836 22,836
6. ~ \i1.,\i11R141 qft ~ l2iotP 8,146 8,146 2,222 2,222 Scheduled Tribes population tM 4,180 4,180 1,179 1,179
ofF 3,966 3,966 1,043 1,043
7. 'l'ITlfR ClIotP 74,837 74,837 69,513 69,513 Literates tM 46,069 46,069 42,944 42,944
ofF 28,768 28,768 26,569 26,569
8. ~ Cj;1ff ClfotP 63,296 63,296 47,433 47,433 Total workers tM 44,639 44,639 37,184 37,184
oIF 18,657 18,657 10,249 10,249
9.;fJEi<liIfc:t<li~ ClIotP 44,488 44,488 30,632 30,632 Main workers tM 36,998 36,998 28,311 28,311
oIF 7,490 7.490 2,321 2,321
(i)~ ClfotP 15,221 15,221 10,918 10,918 Cultivators tM 14,078 14.078 10,565 10,585
oIF 1,143 1,143 333 333
(ii)~~ ClfotP 13,294 13,294 6,790 6,790 Agricultural labourers tM 10,525 10,525 6,164 6,164
olF 2,769 2,769 626 626
(iii) ql~ql~ifi ~ ~ ClfotP 1,457 1,457 1,336 1,336 Household industry workers tM 975 975 1,010 1.010
oIF 482 482 326 326
(iv) 3R1 <I"ff ClfO/P 14,516 14.516 11,588 11,588 Other workers tM 11,420 11,420 10,552 10,552
olF 3,096 3,096 1,036 1,036
10. ~<"1<1iI~<Ii q;-.ff l2io/P 18,808 18,808 16,801 16,801 Marginal workers tM 7,641 7,641 8.873 8,873
olF 11,167 11,167 7,928 7,928
(i) ~ ClIotP 2,239 2,239 1.656 1,656 Cultivators tM 1,237 1,237 1,035 1,035
olF 1,002 1,002 621 621
(ii) ~~ ClfotP 12,125 12,125 9,462 9,462 Agricultural labourers tM 4,701 4,701 5,352 5,352
olF 7,424 7.424 4.110 4,110
(iii) qlRqlRifi ~ q;-.ff ClfO/P 796 796 1,713 1,713 Household industry workers • tM 150 150 320 320
oIF 646 646 1,393 1,393
(iv) 3Rt"<li'ft UlOIP 3,648 3,648 3,970 3,970 Other workers tM 1,553 1,553 2,166 2,166
ofF 2,095 2,095 1,804 1,804
11. 'l't.-~ 12folP 95,715 95,715 87,668 87,668 Non-workers
~ 36.730 36,730 32,601 32,601
ofF 58,985 58,985 55,067 55,067
75
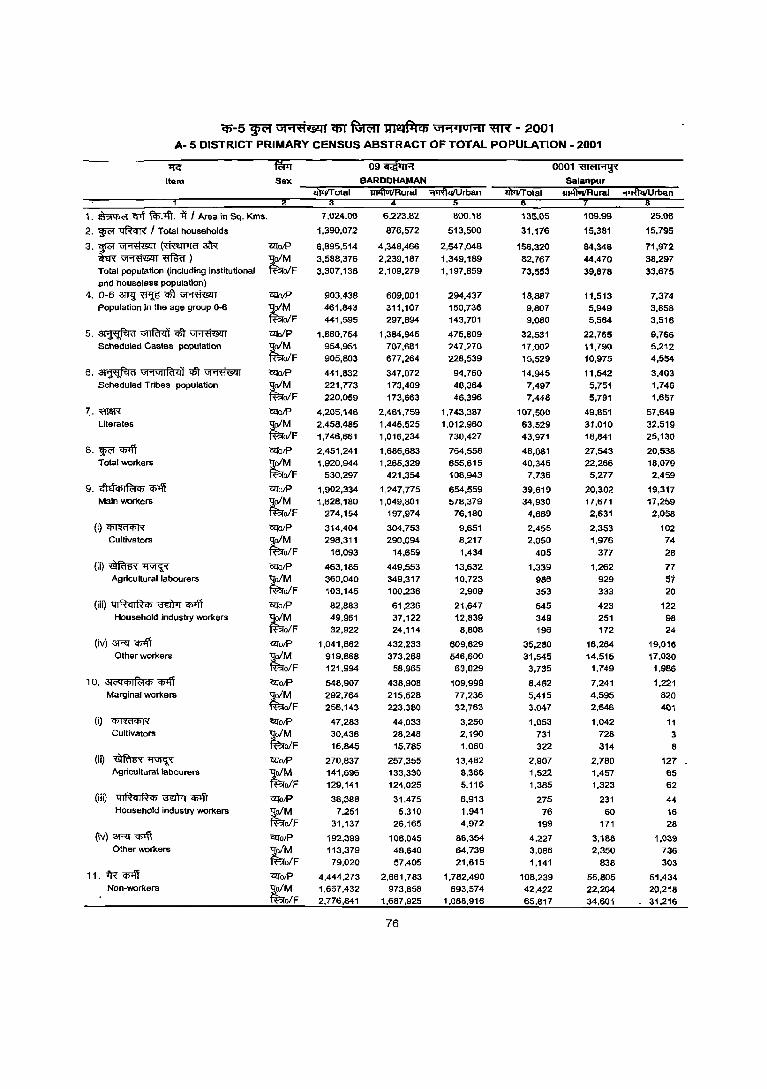
cp-5 'Wt>I Gi~'<'i~1 q;r ~ lWll¥lCf) Gi~'IUI"'1 'ffN - 2001 A.5 DISTRICT PRIMARY CENSUS ABSTRACT OF TOTAL POPULATION - 2001
~ fWT 09atiA 0001~
ltam Sax BARDDHAMAN Salanpur u,oIluilRural ~rban liPrITotal u,oIluilRural ~rban
1. ~ Cflt fif;:ift. ;'f I Area in Sq. Kms. 7,024.00 6,223.82 800.18 135.05 109.99 25.06
2. ~ ~ I TOIaI households 1,390,072 876,572 513,500 31,176 15,381 15,795
3.-rr~(~3fR C2totP 6,895,514 4,348,466 2,547,048 156,320 84,348 71,972 iIrR~~) tM 3,588,376 2,239,187 1,349,189 82,767 44,470 38,297 Total population (including institutional ofF 3,307,138 2,109,279 1,197,859 73,553 39,878 33,675 and houseless population)
4. 0-6 ~ "ff'I6 qfi \iffiffizn C2tDIP 903,438 609,001 294,437 18,887 11,513 7,374 Population In the age group 0-6 tM 461,843 311,107 150,736 9,807 5,949 3,858
ofF 441,595 297,894 143,701 9,080 5,564 3,516
5.~~ql)-~ C2tofP 1,860,754 1,384,945 475,809 32,531 22,765 9,766 Scheduled Castes population tM 954,951 707,681 247,270 11,002 11,790 5,212
olF 905,803 677,264 228,539 15,529 10,975 4,554
6. ~ \il.,GlII'a<i'i qfi ~ C2to/P 441,832 347,072 94,760 14,945 11,542 3,403 Schedu,ed Tribes population tM 221,773 173,409 48,364 7,491 5,751 1,746
ofF 220,059 173,663 46,396 7,448 5,791 1,657
7.. 'ffil\R C2totP 4,205,146 2,461,759 1,743,381 107,500 49,851 57,649 Literates tM 2,458,485 1,445,525 1,012,960 63.529 31,010 32,519
ofF 1,746,661 1,016,234 730,421 43,971 18,841 25,130
8. w<'f <I>1ff C2:IotP 2,451,241 1,686,683 764,558 48,081 27,543 20,538 Total workers tM 1,920,944 1,265,329 655,615 40,345 22,266 18,079
olF 530.297 421,354 108,943 7,736 5,277 2,459
9. <flEi<llIf<:i<ll CflI1T C2:Io/P 1,902,334 1,247,715 654,559 39,619 20,302 19,317 Main workers tM 1,628,180 1,049,801 578,379 34,930 17,671 17,259
ofF 274,154 197,974 76,180 4,689 2,631 2,058
(i)~ C2tOlP 314,404 304,753 9,651 2,455 2,353 102 Cultivators
t~F 298,311 290,094 8,217 2,050 1,976 74 16,093 14,659 1,434 405 377 28
(ii)~~ C2:IotP 463,185 449,553 13,632 1,339 1,262 77 Agricultural labourers ~ofM 360,040 349,317 10,723 986 929 57
fi:?rofF 103,145 100,236 2,909 353 333 20
(iii) qlRq,RC'tl \R:I)-.r q»ff C2:IotP 82,883 61,236 21,647 545 423 122 Household industry workers tM 49,961 37,122 12,839 349 251 98
olF 32,922 24,114 8,808 196 172 24
(iv)~~ C2:IotP 1,041,862 432,233 609,629 35,280 16,264 19,016 Other workers tM 919,868 373,268 546,600 31,545 14,515 17,030
olF 121,994 58,965 63,029 3,735 1,749 1.986
, O. ilI<iQ<IlIf<;jq; <I>1ff C2:IotP 548,907 438,908 109,999 8,462 7,241 1,221 Marginal workers tM 292,764 215,528 77,236 5,415 4,595 820
ofF 256,143 223,380 32,763 3,047 2,646 401
(i) ~ C2:IotP 47,283 44,033 3,250 1,053 1,042 11 Cultivators tM 30,438 28,248 2,190 731 728 3
olF 16,845 15,785 1,060 322 314 8
(iO ~~ cz<otP 270,837 257,355 13,482 2,907 2,780 127 Agricultural labourers tM 141,696 133,330 8,366 1,522 1,457 65
olF 129,141 124,025 5,116 1,385 1,323 62
(iii) qIRqIR<Il~"C'tl1ff C2:1O/P 38,388 31,475 6,913 275 231 44 Household industry workers tM 7.251 5.310 1.941 76 60 16
ofF 31,137 26,165 4,972 199 171 28
(iv)~~ <lfo/P 192,399 106,045 86,354 4,227 3,188 1,039 Other workers tM 113,379 48,640 64,739 3,086 2,350 736
olF 79,020 57,405 21,615 1,141 838 303
11. 1'R CflI1T C2:Io/P 4,444,273 2,661,783 1.782,490 108,239 56,805 51,434 Non-workers S;o/M 1,667,432 973,858 693,574 42,422 22,204 20,218
~o/F 2,776,841 1,687,925 1,088,916 65,817 34,601 31,216
76
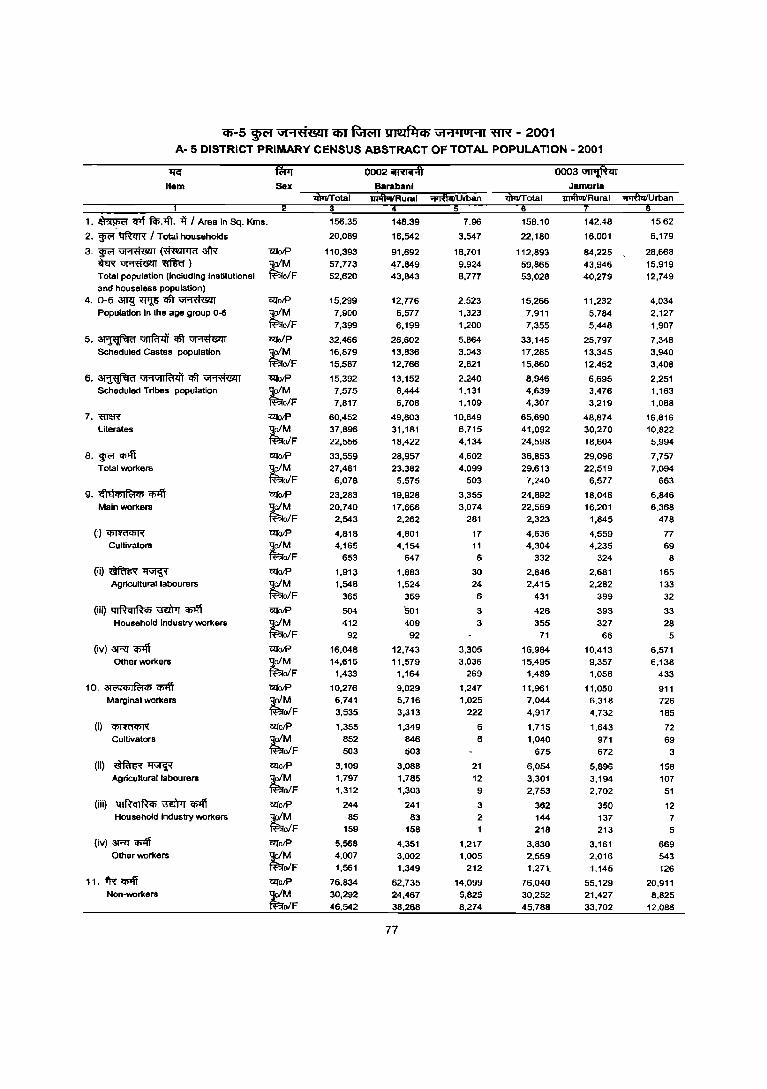
Cfi"-5 wc-r vt ... i('j&u C5T ~ lmIft1Cfi \iI ..... u ..... ~ - 2001 A- 5 DISTRICT PRIMARY CENSUS ABSTRACT OF TOTAL POPULATION - 2001
~
Item
1. ~ ~ fci;.-.:fi. -ij I Area in Sq. Kms.
2. ~ ~ I Total households
3.~~(~atR ~~~) Total population (including Institutional and houseless population)
4. 0-6 3ml ~ <1ft ~ Population In the age group 0-6
5.~~~~ Scheduled Casles population
6. ~ Gt'lGtI RllI'j ~ ~ Scheduled Tribes population
7. 'ffi1lR Literates
8.~~ Total workers
9 .• ~\flililf<:t<i> ~ Main workers
(0 '<i>mf<i>R Cultivators
(ii)~~ Agricultural labourers
(iii) qlRcuRiIi \Rl»r ~ Household industry workers
(iv)~~ Other workers
10. ::>J<'lIilill'clili ~ Marginal workers
(il '<i>mf<i>R Cultivators
(ii)~~ Agricultural labourers
(iii) ql~qlRiIi ~ ~ Household Industry workers
(iv)~~ Other workers
11. i'R" tl'fIff Non-workers
Sex
CZlotP ljolM ~o/F
CZlotP ljolM ~o/F
?2folP "!j;oIM ~oIF
?2fotP "!j;oIM ~oIF
:c<:rOIP "!j;oIM ffl;rolF
ezrotP "!j;oIM ~oIF
?1lotP ljolM ~o/F
ezrOlP 1jolM ~o/F
CZlOIP ljolM ~o/F
CZlOIP ljoiM ~oIF
CZlotP "!j;oIM ~oIF
C2JOlP ljolM ffl;ro/F
ezrolF' ljolM ffl;rolF
CZlolF' ljolM ffl;ro/F
CZlotP ljolM ffl;rolF
C1folF'
~~F ezrolF'
~~F
156.35
20,089
110,393
57,773 52,620
15,299
7,900 7,399
32,466 16,879
15,587
15,392 7,575 7,817
60,452 37,896 22,556
33,559 27,481 6,078
23,283 20,740
2,543
4,818 4,165
653
1,913 1,548
365
504
412 92
16,048 14,615
1,433
10,276 6,741 3,535
1,355 852
503
3,109 1,797 1,312
244
65 159
5,568 4,007 1,561
76,634 30,292 46,542
148.39
16,542
91,692
47,649 43,843
12,776
6,577 6,199
26,602 13,836
12,766
13,152 6,444 6,708
49,603 31,181 16,422
28,957 23,382
5,575
19,928 17,666
2,262
4,801 4,154
647
1,883 1,524
359
'SOl
409
92
12,743 11,579
1,164
9,029 5,716
3,313
1,349
846
503
3,088
1,785 1,303
241
83 156
4,351 3,002
1,349
62,735 24,467 36,268
77
7.96
3,547
18,701
9,924 8,777
2,523
1,323 1,200
5,864 3,043
2,821
2,240 1,131 1,109
10,849 6,715
4,134
4,602 4,099
503
3,355 3,074
281
17 11 6
30 24
6
3
3
3,305 3,036
269
1,247 1,025
222
6 6
21 12
9
3 2
1,217 1,005
212
14,099 5,825 8,274
158.10
22,180
112,893 59,865 53,028
15,266
7,911 7,355
33,145 17,265 15,860
8,946 4,639 4,307
65,690 41,092
24,598
36,853 29,613
7,240
24,892 22,569
2,323
4,636 4,304
332
2,846 2,415
431
426
355 71
16,984 15,495
1,489
11,961 7,044
4,917
1,715 1,040
675
6,054 3,301 2,753
362 144 218
3,630 2,559 1,271.
76,040
30,252 45,788
0003~ Jamurla
1II1ftlIIIRurai "itli6iiUrban
142.48
16,001
84,225 43,946 40,279
11,232
5,784 5,448
25,797 13,345
12,452
6,695 3,476 3,219
48,874 30,270 18,604
29,096
22,519 6,577
18,046 16,201
1,845
4,559 4,235
324
2,681 2,282
399
393 327
66
10,413 9,357 1,056
11,050 6,318
4,732
1,643
971
672
5,896
3,194 2,702
350 137 213
3,161 2,016 1,145
55,129 21,427 33,702
15.62
6,179
28,668
15,919 12,749
4,034
2,127 1,907
7,348 3,940
3,408
2,251
1,163 1,088
16,816 10,822
5,994
7,757 7,094
663
6,846 6,368
478
77 69
8
165 133
32
33
28 5
6,571 6,138
433
911 726
185
72 69
3
158
107 51
12 7
5
669 543 126
20,911 8,825
12,086
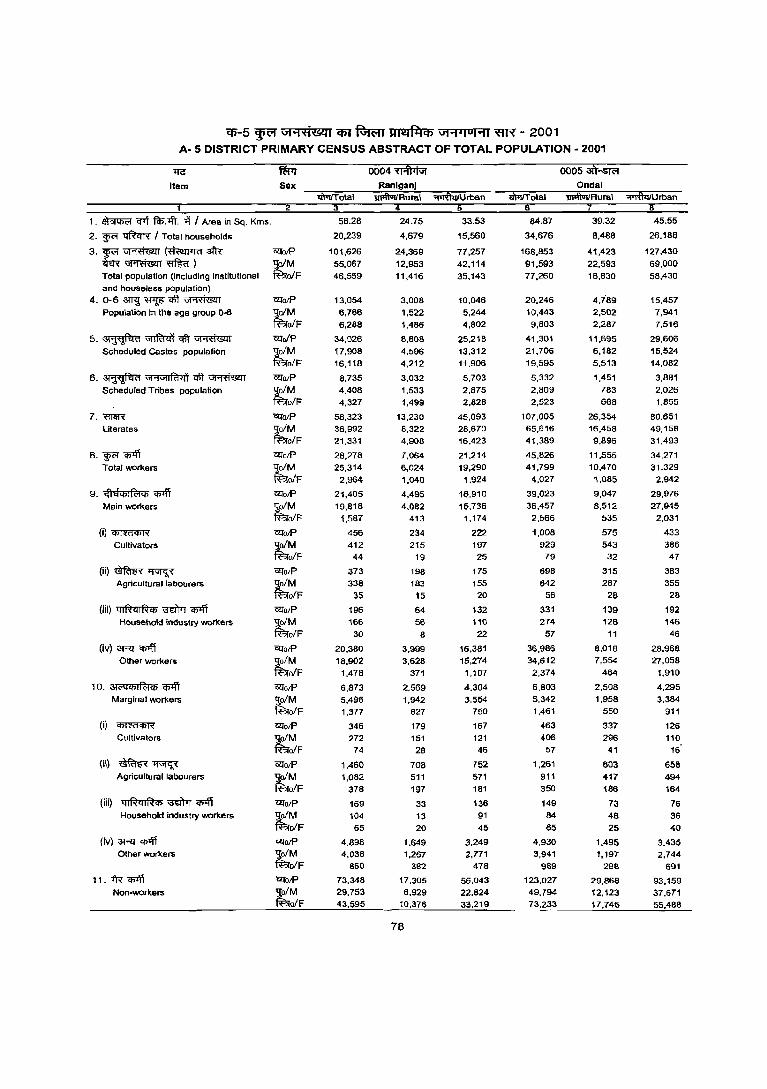
(fi'-5 ~ V1"'!t1MI Cfi'I ~ ~ V1"'!'loHI ~ - 2001 A- 5 DISTRICT PRIMARY CENSUS ABSTRACT OF TOTAL POPULATION - 2001
+re Item
1. ~ <rTf fcI>:4't. if I Area in Sq. Kms.
2. ~ ~ I Total households
3.~~~a:IR" ~~~) Total population (Including Institutional and houseless population)
4. 0-6 3Tl<;!; ~ <fit ~ Population in the age group 0-6
5.~~<Ift~ Scheduled Castes population
6. ~ Gt"1GtII?i<if q\T ~ Scheduled Tribes population
7. W&R Literates
B.~~ Total workers
9. G1eiq;I~q; ~ Main workers
(i)~
Cultillators
(ii)~~ Agricultural labourers
(iii) ql~ql~q; mWr q;zff Household industry workers
(iv) 3Rf~ Other workers
10. 61<"lcblPc:iCl> ~ Marginal workers
(i)~
Cultivators
(ii)~~ Agricultural labourers
(iii) ql~ql~CI> ~ "CI>'ff Household industry workers
(iv) aoR:I Cl>lft Other workers
11.i'R~ Non-workers
Sex
"&fotP ~O/M tao/F
O!:IotP
~o/M tao/F
O!:IoiP
';!o/M tao/F O!:IotP ljo/M tao/F
<ZfotP ';!oIM fi".;ro/F
Cl:!otP
~alM tao/F
O!:IotP
~o/M fa-o/F
O!:IotP
'.lolM fa-oIF <ZfO/P
"!!o/M faolF CZfO/P
~o/M tao/F
CZfotP
~o/M faolF CZfO/P
"!!o/M tF-ro/F CZfO/P
1jo/M fa-oIF CZfO/P
~oIM faolF <7l"o/p 1jolM fao/F GlfotP
1jolM faolF C2l0/P
1jo/M taolF
58.28
20,239
101,626
55,067 46,559
13,054
6,766
6,288
34,026
17,908 16,118
8,735
4,408
4,327
58,323 36,992
21.331
28,278
25,314
2,964
21,405-
19,818 1,587
456
412 44
373 338
35
196
166
30
20,380
18,902
1,478
6,873
5,496 1,377
346
272 74
1,460
1,082
378
169
104
65
4,898
4,038 860
73,348
29,753
43,595
0004~ RanlganJ
24.75
4,679
24,369
12,953
11,416
3,008
1,522
1,486
8,808
4,596 4,212
3,032
1.533
1,499
13,230 8,322
4.908
7,064
6,024 1,040
4,495
4,082 413
234
215 19
198 183
15
64
56
8
3,999
3,628
371
2,569
1,942
627
179
151
28
708 511
197
33
13
20
1,649 1,267
382
17,305
6,929 10,376
78
33.53
15,560
77,257
42,114
35,143
10.046 5,244
4,802
25,218
13,312
11.906
5,703
2,875
2,826
45,093
28,670
16.423
21,214
19,290
1,924
16,910
15,736
1.174
222
197 25
175 155
20
132 110
22
16,381
15,274
1,107
4.304
3,554 750
167 121
46
752
571 181
136
91
45
3,249
2,771 478
56,043 22,824
33,219
84.87
34,676
166,853
91,593
77,260
20,246
10,443
9,603
41,301
21,706 19,595
5,332
2,809
2,523
107,005 65,616
41.389
45,826
41,799
4,027
39,023 36,457
2.566
1,008
929 79
696 642
56
331 274
57
36,986
34,612
2,374
6.803 5,342
1,461
463
406
57
1,261
911 350
149 84
65
4,930 3,941
989
123,027
49,794 73,233
0005~ Ondal
'!I11I\vTIRural
39.32
8,488
41,423
22,593
18,830
4.189 2,502
2,287
11,695
6,182 5,513
1,451
783
666
26,354 16,458
9.896
11,555
10,470
1,085
9,047
8,512
535
575
543 32
315
287
28
139 126
11
8,018
7,554 464
2,506
1,958
550
337
296 41
603 417
186
73
48
25
1,495 1,197
298
29,868
12,123 17,745
'f'lfuiiUrban
45.55
26.188
127,430
69,000
58,430
15,457
7,941
7,516
29,606
15,524 14,082
3,881
2,026
1,855
60.651 49,158
31,493
34,271
31,329
2,942
29,976
27,945 2,031
433
386 47
363
355
28
192 146
46
28,968 27,058
1,910
4,295
3,384 911
126
110 16'
658
494
164
76
36
40
3.435 2,744
691
93,159 37,671
55,488
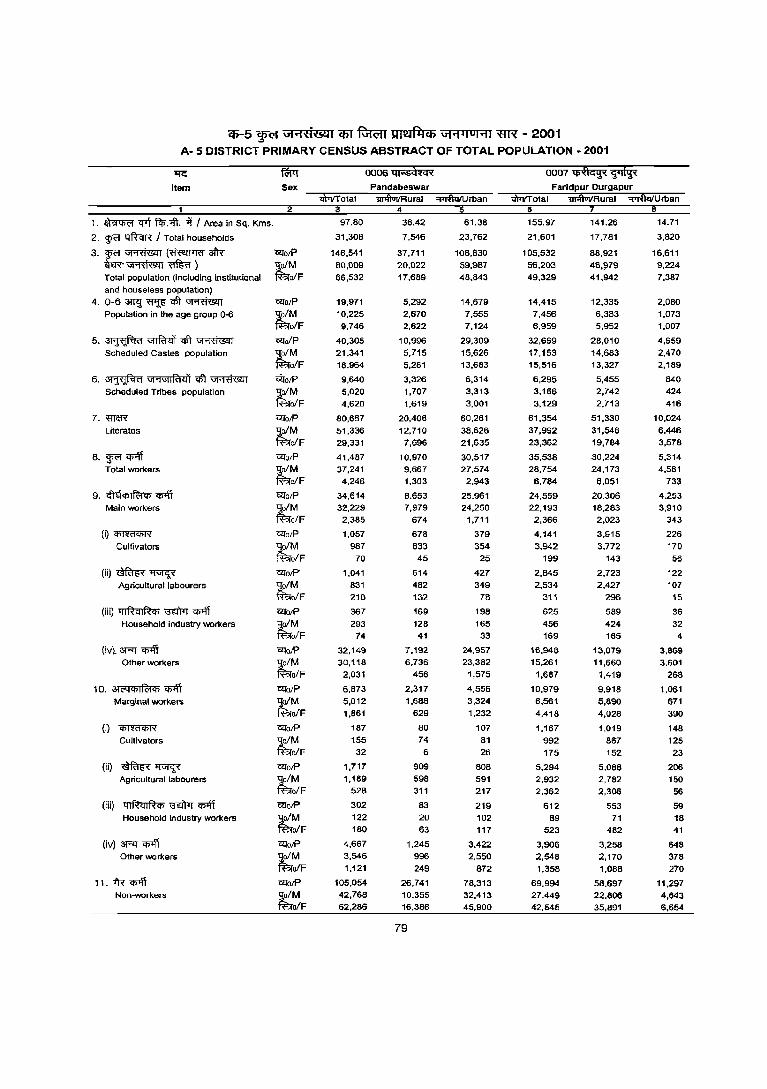
cp-5 w<'f ,i .... I-«&l1 em ~ ~ 'i1""I.lol .... 1 XTR - 2001 A· 5 DISTRICT PRIMARY CENSUS ABSTRACT OF TOTAL POPULATION· 2001
'If<:'
Item
0006 QI;;;SJi't<N
Pandabeswar
0007 'IiRfci1ii ~ Farlclpur Durgapur
"iiI1liVTIRural ~rban 4
~otal "iiI1liVTIRural ~Urban
1. ~ crt fcI>. '1ft. >t I Area In Sq. Kms.
2. w<'f IlftcrR I Total households
3. w<'f ~ (~ 3i'R ~~~) Total population (including Institutional and house less population)
4. 0-6 3lfS: ~ qft ~ Population in the age group 0-6
5.~~qft~ Scheduled Castes population
6. ~ "1'1"1IR1ll'i <1ft ~ Scheduled Tribes population
7.m~
Literates
8. w<'f <P'ff T olal workers
9. "l€lililfc:tct> <P'ff Main workers
(i) Cf\mfCI>R
Cultivators
(ii)~~ Agricultural labourers
(iii) 4IRqIRct> ~ q;1'ft Household industry workers
(iv). 3'f"'Q <P'ff Other workers
10. 31<"'1ct>I~ct> <P'ff Marginal workers
(i) Cf\mfCI>R
Cultivators
(ii)~~ Agricultural labourers
(iii) 4IRqIR<t> ~ Cf5'Iff HousehOld industry workers
(iv) 3R1" Cf5'Iff Other workers
11. fR <P'ff Non-workers
czro/P 'loiM ~Q/F
czro/P 'l0/M ~oiF
czro/p llo/M ~oiF <2ro/P
llo/M ~o/F
czro/P 'lo/M ~o/F
czro/P '!j;o/M ~o/F
czro/P '!j;o/M ~o/F
czro/P
'9oiM ~o/F czrOlf> 'l0/M ~o/F
czro/P 'loiM ~oIF
~O/P
'lo/M ~o/F
ezra/P
:iolM ~oIF
czrotP 'loiM ~oIF
"UfotP '!j;o/M ~o/F
czrotP 'loiM fBfo/F
"Ufo/P
'loiM ~oIF
czrotP 'lu/M ~oIF
97.80
31,308
146,541 80,009
66,532
19,971 10,225
9,746
40,305 21,341
18,964
9,640 5,020 4,620
80,667
51,336 29,331
41,487 37,241
4,246
34.614 32,229
2,385
1,057
987 70
1,041
831 21n
367
293 74
32,149 30,118
2,031
6.B73 5,012
1,B61
187
155 32
1,717 1,189
528
302 122 180
4,667 3,546
1,121
105.054 42,768 62,286
36.42
7.546
37,711 20,022
17.689
5.292 2.670 2.622
10.996 5,715
5.281
3.326 1.707 1,619
20.406 12,710
7,696
10,970 9,667
1.303
8,653 7.979
674
678
633 45
614 482 132
169
128 41
7,192 6,736
456
2.317 1,688
629
80 74
6
909 598 311
83 20 63
1,245 996 249
26,741 10,355 16,386
79
61,38
23,762
108,830
59.987 48.843
14,679 7.555 7.124
29,309 15,626 13,683
6,314 3,313 3,001
60,261 38,626
21,635
30,517 27,574
2,943
25,961 24,250
1,711
379
354 25
427
349 78
198
165 33
24,957 23,382
1,575
4,556 3,324
1,232
107
81 26
808 591 217
219 102 117
3,422 2,550
872
78,313 32,413 45,900
6
155.97
21,601
105,532
56,203 49,329
14,415 7,456 6,959
32,669 17,153 15,516
6,295 3,166 3,129
61,354
37,992 23,362
35,538 28,754
6,784
24,559 22,193
2,366
4,141
3,942
199
2,845 2,534
311
625 456 169
16,948 15,261
1,687
10.979 6,561 4,418
1,167
992 175
5,294 2,932 2,362
612 89
523
3,906 2,548
1,358
69,994 27,449 42,545
141.26
17,781
88,921
46,1:179 41,942
12,335 6,383 5,952
28,010 14,683 13,327
5,455 2,742 2,713
51,330
31,546 19,784
30,224 24,173
6,051
20,306 18,283 2,023
3,915
3.772 143
2,723 2,427
296
589
424 165
13,079 11,660
1,419
9.918 5,890 4,028
1,019
867 152
5,088 2,782 2,306
553 71
482
3,258 2,170
1.088
58,697 22,806 35,891
14.71
3,820
16,611 9,224
7,387
2,080 1,073
1.007
4,659 2,470 2,189
840 424 416
10,024
6,446 3,578
5,314 4,581
733
4,253 3,910
343
226
170 56
122 107
15
36 32
4
3,869 3,601
268
1,061
671 390
148
125 23
206 150
56
59 18 41
648 378
270
11,297 4,643 6,654
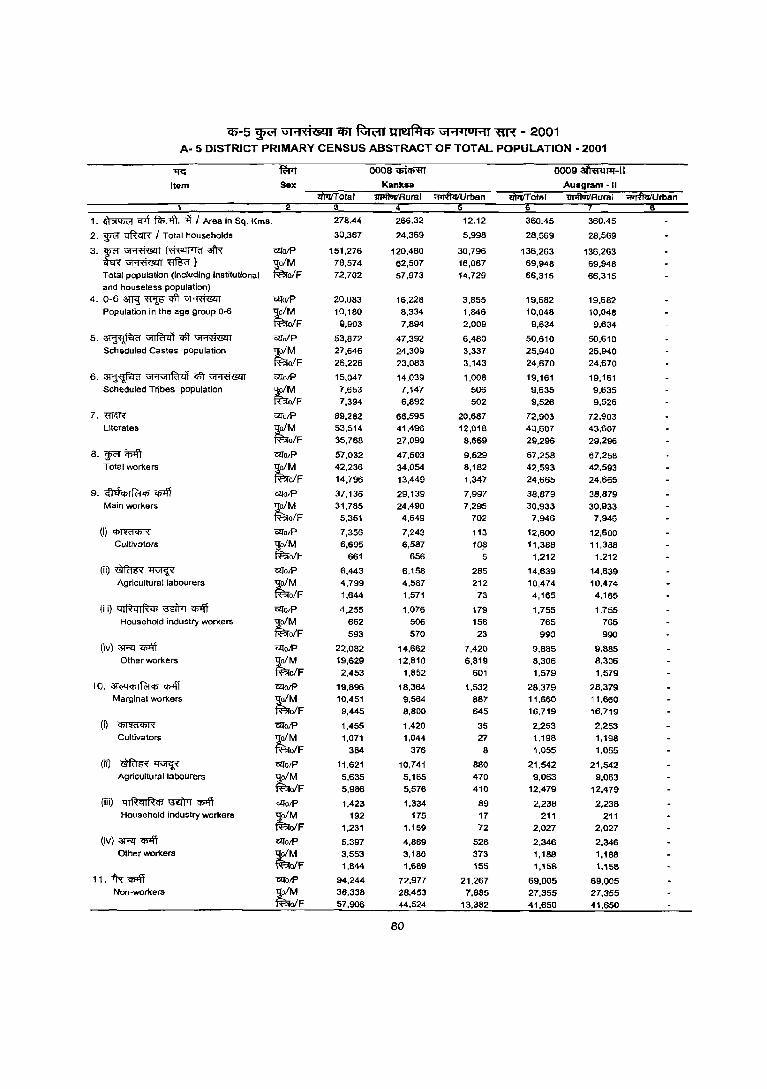
C1l-5 ~ \iHxkcO!1l q;y ~ UleJ~Cf) Gt .... jUl"1j ~ - 2001 A- 5 DISTRICT PRIMARY CENSUS ABSTRACT OF TOTAL POPULATION - 2001
11<:' ~ 0008~ 0009 ai'tmrPr-1I
Item Sex Kanksa Ausgram -II liI>rITotal ~Rural 1mflurIRurai ~rban
1 3 4
1. ~ crrT f$.~. "i I Area in Sq. Kms. 278.44 266.32 12.12 360.45 360.45
2. F ~ I Total households 30,367 24,369 5,998 28,569 28,569
3. ~c;r ~ (~ 3fR CZlotP 151,276 120,480 30,796 136,263 136,263 ~~~) tM 78,574 62,507 16,067 69,948 69,948 Total population (Including institutional olF 72.702 57,973 14.729 66,315 66,315 and houseless population)
4. 0-6 arr<l ~ qlt ~ CZlorP 20,083 16,228 3,855 19,682 19,682 Population in the age group 0-6 tM 10,180 8,334 1,846 10,048 10,048
ofF 9,903 7,894 2,009 9,634 9.634
5.~~qft~ woIP 53,872 47,392 6,480 50,610 SO,610 Scheduled Castes population tM 27,646 24,309 3,337 25,940 25,940
ofF 26.226 23,083 3,143 24,670 24,670
6. ~ Gi"lV1lR1di <Ct ~ WorP 15,047 14,039 1,008 19,161 19,161 Scheduled Tribes population tM 7,653 7,147 506 9,635 9,635
ofF 7,394 6,892 502 9,526 9,526
7. miff< WarP 89,282 68,595 20,687 72,903 72,903 Literates tM 53,514 41,496 12,018 43,607 43,607
ofF 35,768 27,099 8,669 29,296 29,296
8. ~ inoff CZlo;P 57,032 47,503 9,529 67,258 67,258 Total workers tM 42,236 34,054 8,182 42,593 42,593
ofF 14,796 13,449 1,347 24,665 24,665
9. ~qi <I>'ff WoJP 37.136 29,139 7,997 38,879 38,879 Main workers ~M 31,785 24,490 7,295 30,933 30,933
olF 5,351 4,649 702 7.946 7,946
(i)~ CZlO/P 7,356 7,243 113 12,600 12,600 Cultivators ~M 6,695 6,587 1 Oil 11,388 11,388
ofF 661 656 5 1,212 1,212
(ii)~~ CZToJP 6,443 6,158 285 14,639 14,639 Agricultural labourers ~M 4,799 4,587 212 10,474 10,474
ofF 1,644 1,571 73 4,165 4,165
(iii) q,RqlRtp -mr-r q;-.ff WO/P '1,255 1,076 179 1,755 1,755 Household industry workers tM 662 506 156 765 765
ofF 593 570 23 990 990
(iv)~~ ClIotP 22,082 14,662 7,420 9,885 9,885 Other workers tM 19,629 12,810 6,819 8,306 8,306
ofF 2,453 1,852 601 1,579 1,579
10. 3\('q<tlI~<I) ~ CZlotP 19,896 18,364 1,532 28.379 28,379 Marginal workers ~M 10,451 9,564 887 11,660 11,660
ofF 9,445 8,800 645 16,719 16,719
(i) Cf>ffif<tlR CZTO/P 1,455 1,420 35 2,253 2,253 CUltivators tM 1,071 1,044 27 1,198 1,198
ofF 384 376 8 1,055 1,055
(ii) ~~ WarP 11,621 10,741 880 21,542 21,542 Agricultural labourers tM 5,635 5,165 470 9,063 9,063
ofF 5,966 5,576 410 12,479 12.479
(iii) qlRqlRCfl ~ 'P'ff CZlotP 1,423 1,334 89 2,238 2,238 Household industry workers
~F 192 175 17 211 211 1,231 1,159 72 2,027 2,027
(iv)~~ CZlO/P 5,397 4,869 528 2,346 2,346 Other workers ~M 3,553 3,180 373 1,168 1,168
ofF 1,844 1,689 155 1,158 1,158
11.""R-q;oft CZlorP 94,244 72,977 21,267 69,005 69,005 Non-workers tM 36,338 28,453 7,885 27,355 27,355
ofF 57,906 44,524 13,382 41,650 41,650
80

Cff-5 ~ "" ... 'l'i&ll q;y ~ lfIet~q) "" .... ,01"'11 "'«R - 2001 A· 5 DISTRICT PRIMARY CENSUS ABSTRACT OF TOTAL POPULATION· 2001
~ fWr 00 1 a 3IfuilTil-J 0011 oj. ~('j",lc Item Sex Mangolkote
",>\lui/Rural ~rban 8
1. ~ -q-.f ~:;fi. 1{ / Area In Sq. Kms. 222.34 222.34 365.44 365.44
2. ~ ~ / Total households 22,265 22,265 46,245 46,245
3.~~~afR- OQ'OIP 106,850 106,850 233.958 233,958 ~~~) ~ 54,675 54,675 120,535 120,535 Total population (including institutional ofF 52,175 52,175 113,423 113,423 and houseless population)
4.0-63mJ~~~ TllotP 14,408 14,408 34,493 34,493 Population in the age group 0-6
~ 7,380 7,380 17,620 17,620 ofF 7,028 7.028 16,873 16,873
5.~~<!ft~ TllolP 35,388 35.388 72,175 72,175 Scheduled Castes population ~F 18,102 18,102 36,949 36,949'
17,286 17,286 35,226 35,226
6. ~ \iI'1\i1IR1<ll qfi ~ C<l'0IP 13,845 13,645 6,079 6,079 Scheduled Tribes population ~M 7,001 7,001 3,046 3,046
ofF 6.844 6,644 3.033 3,033
7.~ OQ'o/P 57,804 57,804 118,425 118,425 Literates ~M 33,982 33,982 69,759 69,759
olF 23,822 23,B22 48,666 4B,666
8. w<'I ~ 'OqOlP 45,008 45,008 80,56B 80,568 Total workers ~ 31,645 31,645 68,520 6B,520
ofF 13,163 13,163 12,048 12,048
9. ~El"'If<;J",~ 'OqOlP 32,325 32,325 70,558 70,558 Mainwol1<ers tM 25,491 25,491 62,481 62,481
olF 6,834 6,834 8,077 8,077
(i)~ 'OqotP 9,858 9,B58 21,211 21,211 Cultivators ~M 9,115 9,115 20,685 20,685
ofF 743 743 526 526
(ii)~~ 0!f0lP 15,338 15,338 30,494 30,494 Agricultural labourers tM 10,225 10,225 26,299 26,299
ofF 5,113 5,113 4,195 4,195
(iii) qlRqlR", \ffi'rrr ~ 0!f0lP B54 B54 2,B05 2,B05 Household industry workers tM 491 491 1,729 1,729
ofF 363 363 1,076 1,076
(iv) 3Rl ri 0Q'0/P 6,275 6.275 16,046 16,048 Other workers tM 5,660 5,660 13,768 13,768
olF 615 615 2,280 2,280
10. (li<ACjlIR1", Cf>Ifi Oll'otP 12,683 12,683 10,010 10,010 Marginal workers tM 6,354 6,354 6,039 6,039
ofF 6,329 6,329 3,971 3,971
(i) ~ 0ll'0IP 1,013 1,013 1,426 1,426 Cultivators t~F 641 641 1,162 1,162
172 172 264 264
(ii) ~~ Oll'o/P 10,716 10,716 5,609 5,609 Agricultural labourers tM 5,023 5,023 3,403 3,403
ofF 5,693 5,693 2,206 2,206
(iiij ql~qIR", ~ <PIff 'l2totP 242 242 764 764 Household Industry workers tM 64 64 190 190
ofF 178 178 574 574
(iv) 3Rl~ 'l2totP 712 712 2,211 2,211 Other workers tM 426 426 1,284 1,284
ofF 286 286 927 927
11. i'R q;>ft OQ'otP 61,842 61,642 153,390 153,390 Non-workers ~M 22,830 22.830 52,015 52,015
ofF 39,012 39,012 101,375 101,375
81

i5-5 ~ Ui"1;R&l1 i5I ~ ~ \7I .... lul .... 1 ~ - 2001 A- 5 DISTRICT PRIMARY CENSUS ABSTRACT OF TOTAL POPULATION - 2001
~ fWr 0012~-1 0013~-1I Item Sex
iI»liTotal
1. ~ <flf f~AT. it I Area in Sq. Kms. 193.98 193.98 160.03 160.03
2. w<'f ~ I Total households 27,842 27,842 21,123 21,123
3.~~(~~ WO/P 145,859 145,859 107,054 107,054 ~~) tM 74,339 74,339 55,255 55,255
Total population (including institutional olF 71,520 71,520 51,799 51,799 and houseless population)
4. 0-6 arrg ~ ql't ~ WO/P 23,903 23,903 15,092 15,092 Population In the age group 0-6 tM 12,099 12,099 7,817 7,817
ofF 11,804 11,804 7,275 7,275
5.~~~~ waiP 39,011 39,011 36,954 36,954 Scheduled Castes population tM 19,921 19,921 19,010 19,010
ofF 19,090 19,090 17,944 17,944
6. ~ Gt'1GtIRl<i'i c6t ~ G!TatP 582 582 576 576 Scheduled Tribes population ;tM 287 287 303 303
ofF 295 295 273 273
7. "ffim" G!Toif> 73,022 73,022 56,155 56,155 Literates tM 42,188 42,188 32,612 32,612
ofF 30,834 30,834 23,543 23,543
8. $R'f'1l'>lff Waif> 44,041 44,041 41,538 41,538 Total workers ;tM 38,966 38,966 31,779 31,779
alF 5,075 5,075 9,759 9,759
9. <fhh" I f(;I<t> CI>lff WO/P 37,734 37,734 30,972 30,972 Main workers ~F 35,079 35,079 28,281 28,281
2,655 2,655 2,691' 2,691
(i)~ G!Ta/P 11,754 11,754 10,657 10,657 Cultivators tM 11,642 11,642 10,335 10,335
ofF 112 112 322 322
(ii)~~ G!To/P 15,358 15.358 10,448 10,448 Agricultural labourers tM 14,573 14,573 10,038 10,038
ofF 785 785 410 410
(iii) qlRqlR<t> \3EI)Tr Cf>lff G!To/P 1,648 1,648 1,499 1,499 Household industry workers tM 858 858 1,018 1,018
alF 790 790 481 481 (iv) 3T"lI Cf>lff G!TatP 8,974 8,974 8,368 8,366
Other workers tM 8,006 8,006 6,890 6,890 alF 968 968 1,478 1,478
10, ~C'<l<t>I~'" Cf>lff WotP 6,307 6,307 10,566 10,566 Marginal workers tM 3,687 3,887 3,498 3.498
alF 2,420 2,420 7,068 7,068 (0 ~ Waif> 934 934 1,600 1,600
Cultivators tM 776 776 732 732 ofF 158 158 868 866
(ii) ~~ Waif> 3,650 3,650 2,312 2,312 Agricultural labourers tM 2,442 2,442 1,376 1,376
ofF 1,208 1,206 934 934 (iii) qlRqlR", ~ Cf>lff Waif> 776 776 1,673 1,673
Household industry workers tM 93 93 219 219 ofF 683 663 1,454 1,454
(iv) 3T"lI <!llff G!TotP 947 947 4,981 4,981 Other workers tM 576 576 1,169 1,169
ofF 371 371 3,812 3,812 11.1R~ Waif> 101,818 101,818 65,516 65,516
Non-workers tM 35,373 35,373 23,476 23,476 ofF 66,445 66,445 42,040 42.040
82

(f)-5 ~ Gi"i't1&011 (fi1 'R1wrr W"'IilICb Gi"i'IOI"1I "fl'R - 2001
A- 5 DISTRICT PRIMARY CENSUS ABSTRACT OF TOTAL POpULATION - 2001
ITa" ~ 0014~-1 0015~-1I
Item Sex Kalwa -I Katwa -II lI,oIIuii'Rural ., •• fl4lUrban ~otal lI,oIIoi1Rural ~rban
8
1. ~ C<'t fci>:4t -q I Area in Sq. Kms. 168.94 167.91 1.03 163.20 163.20
2. ~ ~ I Total households 29,483 28,343 1,140 24,591 24,591
3'k~(~3fR l2l'o!? 152,101 146,435 5,666 120,318 120,318 ~~) ~M 78,669 75,770 2,899 61,716 61,716
Total population (Including In6t1tutlonal ofF 73,432 70,665 2,767 58,600 58,600 and houseless population)
4. 0-6~~r.ffI'~ 12lo/P 22,956 22,260 698 18,121 18.121 Population in the age group 0-6 tM 11,763 11,420 343 9,127 9,127 ofF 11,195 10,840 355 8,994 8,994
5,~~·r.ffI'~ 12lolp 48,328 47,093 1,235 34,656 34,656 Scheduled Castes population tM 24,813 24,188 625 17,669 17,669
olF 23,515 22,900 610 16,987 16,987
6. ~ \i1'i\i1IRi<l1 <1ft ~ 12lolP 1,734 1,734 1,041 1.041 Scheduled Tribes population tM 876 876 500 500 ofF 858 858 541 541
7.~ <lTo!? 79,504 76,118 3,386 60,639 60,639 Literates tM 46,727 44,801 1,926 35,422 35,422 oIF 32,777 31,317 1,460 25,217 25,217
8.~~ 12lo!? 60,341 57,916 2,425 44,216 44,216 Total workQrs tM 46,291 44,585 1,706 36,112 36,112 oIF 14.050 13,331 719 8,104 8,104
9. GlE\<fllf\;.q, 'II>'4't 'UfO/P 48,030 46,160 1.870 36.203 36,203 Main workers
~F 42,246 40,696 1,550 32,822 32,622
5,784 5,464 320 3,381 3,381
(i)~ 'Ufo!? 13,104 13,064 40 11,089 11,OB9 Cultivators tM 12,411 12,371 40 10,842 10,842 oIF 693 693 247 247
(ii)~~ l2l'o!? 14,367 14,196 171 11.898 11.898 Agricultural labourers tM 13,523 13,352 171 11,251 11,251
olF 844 844 647 647
(iii) QIRqlfh, ~ <I)1ff l2l'olP 2,625 2,274 351 3,051 3,051 Household industry workers tM 1,553 1,368 185 2,361 2,361
olF 1,072 906 166 690 690
(iv) 3R!"iIf'fi l2l'o/P 17,934 16,626 1,308 10,165 10,165 Other workers tM 14,759 13,605 1,154 8,368 8,368
olF 3.175 3,021 154 1.797 1.797
10. ¢l6lI<t>1R:t<t> ~ 'Ufo!? 12,311 11,756 555 8,013 8,013 Marginal workers tM 4,045 3,889 156 3,290 3,290 ofF 8,266 7,867 399 4,723 4,723
(i) ~ 12loiP 1,308 1,304 4 949 949 Cultivators
~ 689 685 4 502 502 olF 619 619 447 447
(ii) ~~ l2l'oiP 2,056 2,020 36 2,282 2.282 Agricultural labourers tM 1,267 1,240 27 1,535 1,535
o/F 789 780 9 747 747
(iii) QIRqIR",~"iIf'fi C<iO/P 1,480 1,238 242 1,100 1,100 Household industry workers tM 159 133 26 160 160
ofF 1,321 1,105 216 940 940
(lV)31~~ 12lQIP 7,467 7,194 273 3,682 3,682 Other workers tM 1,930 1,831 99 1,093 1,093 ofF 5,537 5,363 174 2,589 2,589
11. fR~ czro!? 91.760 88,519 3,241 76,102 76,102 Non-workers t~F 32.378 31.185 1,193 25,606 25.606
59,382 57,334 2,046 50,496 50,496
83
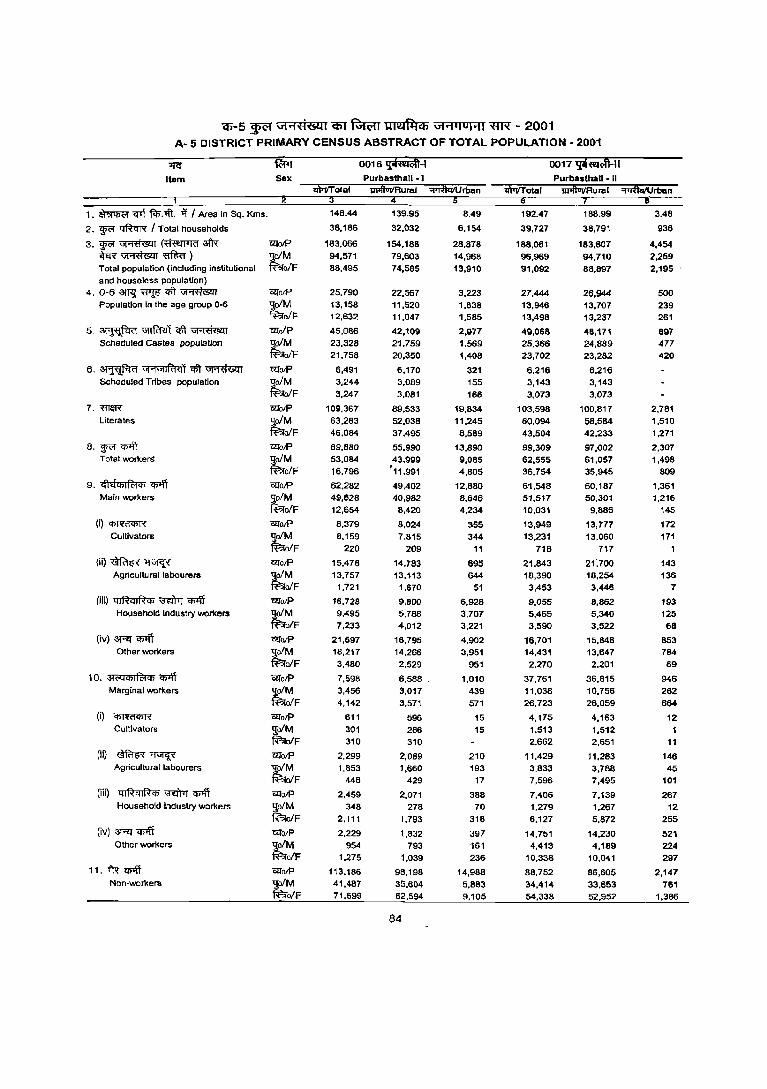
(I}-5 ~ ut+tt<!41 q;y ~ m~c.n ut ..... IO .... 1 ~ - 2001 A- 5 DISTRICT PRIMARY CENSUS ABSTRACT OF TOTAL POPULATION - 2001
~
Item Sax
00161f.fu!i*-1
Purbasthall - I
0017~-1I Purbasthall - II
1ii1ftViIRurai ~rba.n
1. ~ crrt fcP.-.fi. ~ I Area in SQ. Kms.
2. ~ ~ I Total hOuseholds
3.~~(~afR -.hR~~) Total population (including institutional and houseless population)
4. 0-6 arr<j ~ qlT ~ Population in the age group 0-6
5.~~<lft~ Scheduled Castes population
6. ~ Uj.,UjIRlq1 qft ~ Scheduilld Tribes population
7. maR Literates
8. ~ 'q>Jft Total workers
9. clhiCbI f(1 Cb CJ>1fi Main workers
(i)~ Cultivators
(ii)~~ Agricultural labourers
(iii) 41R41RiP ;;clTr "iF4t HousehOld Industry workers
(iv) 3Flr <f>IiT Other workers
1 O. ~ ('q Cb I R:I Cb (fj1ff Marginal workers
(i)~
Cultivators
(ii)~~ Agricultural labourers
(iii) 41R41RiP;;clTr (fj1ff Household industry workers
(iv) 3Rl""i'f>Iff Other workers
11. i'R (fj1ff Non-workers
~OIP
t.!oIM ~oIF
CllolP
t.!oIM ~o/F
Cl!oiP
-golM ~o;F
Cl!olP
"!:;oIM fF-iolF
ClfolP ~oIM ~oIF
CZfolP qolM ~o/F
ClfolP "!:;oIM ~oIF CZfOlP t.!o/M ~oIF ClfolP t.!oIM ~oIF
1'lI'o/P
~F 1'lI'0IP qolM ~oIF
GIlolP qolM ~oIF motP qolM ~oIF
mOlP "9;oIM ~oIF
i2fotP ~o/M ~oIF i2fo/P ,!!o/M ~o/F
motP ~o/M ~o/F
148.44
38,186
183.066 94,571 88,495
25.790 13,158 12,632
45,086
23.328 21,758
6,491 3,244 3.247
109.367
63.283 46.084
69.880 53,084
16.796
62.282 49,628 12,654
8.379 8.159
220
15,478 13.757
1,721
16,728 9.495 7,233
21.697 18,217
3,480
7,598
3.456 4,142
611
301 310
2,299 1,853
446
2,459 348
2,111
2.229 954
1,275
113.186 41,487
71.699
139.95
32,032
154,188 79,603 74,585
22,567 11,520 11,047
42,109 21.759 20,350
6,170
3.089 3.081
89,533
52,038
37.495
55,990 43,999
'11.991
49.402 40,982
8.420
8.024 7,815
209
14,783 13.113
1.670
9,800
5.788 4,012
16,795 14,266
2.529
6.588 . 3,017 3,571
596 286 310
2,089 1,660
429
2,071 278
1,793
1.832 793
1,039
98,198 35.604 62,594
84
8.49
6,154
28,878 14,968 13,910
3,223 1.638 1,585
2,977 1,569 1,408
321 155 166
19,834 11,245 8,589
13,890 9,085 4.805
12.880 8,646 4,234
355 344
11
695 644
51
6.928 3.707 3,221
4,902 3,951
951
1,010
439 571
15 15
210 193
17
388 70
318
397 161
236
14,988 5,883 9,105
192.47
39,727
188,061
96.969 91,092
27,444 13.946 13,498
49,068 25.366 23,702
6,216 3,143 3,073
103,598
60,094 43,504
99,309 62,555 36.754
61.548 51,517 10.031
13,949 13,231
718
21.843 18.390 3,453
9.055 5,465 3,590
16.701 14,431
2.270
37,761
11,038 26,723
4,175 1.513 2,662
11,429 3,833
7,596
7,406 1.279 6,127
14.751 4,413
10,338
88,752 34,414 54,338
188.99
38,791
183,607
94,710 88,897
26.944 13,707 13,237
48,171 24,889 23,282
6,216 3,143 3,073
100.817
58,584 42,233
97,002 61,057 35,945
60.187 50.301
9.886
13,777 13,060
717
2000 18,254
3,446
8,862 5,340 3,522
15,848 13,647
2.201
36,815
10,756 26,059
4,163 1,512 2,651
11,283 3,788 7,495
7,139 1,267
5,872
14,230
4,189 10,041
86,605 33,653 52.952
3.48
936
4,454 2,259 2,195
500 239 261
897 477 420
2.781 1,510 1,271
2,307 1,498
809
1,361 1,216
145
172 171
143 136
7
193 125 68
853 784 69
946
282 664
12
11
146 45
101
267 12
255
521 224 297
2,147 761
1,386
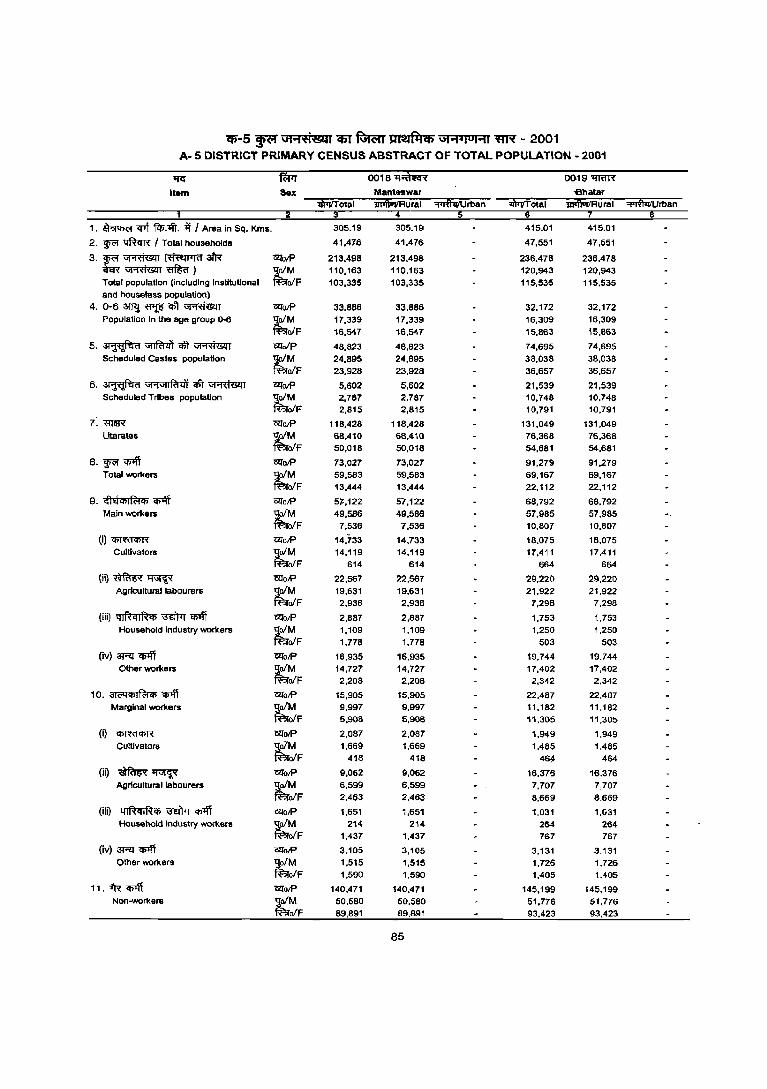
q;-5 ~ iJii"'l'C1'L<41 C6T ~ JmJ~Cfi \01t'1'l ol'1l ~ - 2001 A- 5 DISTRICT PRIMARY CENSUS ABSTRACT OF TOTAL POPULATION - 2001
If<:' hlPT 0018"1~ 0019 m<ITf
Item Sex Manteswar '€Ihatar 1I»JfTotal u,41uilRural ~rtlan >it'llTotal .. Mlui/Rural 'NIl<llUrban
1. ~ <r'l j1l;:~. -ij I Area in Sq. Kms. 305.19 305.19 415.01 415.01
2. !R'f ~ I Tota, hOuseholds 41.41-6 41,416 41.551 47.551
3.W<'~~31R <2lolP 213.498 213.498 236.478 236.418 tER Vffiffizrr ~ ) tM 110.163 110,163 120,943 120,943 Total population (including Instltutlonal o/F 103.335 103,335 115,535 115.535 and houseless population)
4. 0-6 3ff1i ~ ql\ ~ <2lolP 33,886 33,886 32,172 32.112 Population In the age group 0-6 tM 17.339 11,339 16,309 16,309
o/F 16.541 16,541 15,863 i5.863
5.~~qlt~ <2lo/P 48.823 48,823 74,695 74,695 Scheduled Castes population
~~F 24.895 24,895 38,038 38,038
23.928 23,928 36,657 36,657
6. ~ G11G11R1.ii crft ~ <2lolP 5.602 5,602 21,539 21,539 Scheduled Tribes population tM 2.787 2,781 10,148 10,748
o/F 2,815 2,815 10.791 10,791
7. mllR <2lolP 118.428 118,428 131,049 131,049 Literates ~M 68,410 68,410 76,368 76,368
o/F 50,018 50,018 54,681 54,681
8. ~ <!>Iff <2lolP 13,021 73,027 91,279 91,279 Total workers ~M 59.563 59,583 69,167 69.167
o/F 13.444 13,444 22,112 22,112
9. (!ltf"'I~<t> ri <2lolP 57-.122 57,122 6B,792 6B,792 Main workers ~M 49,586 49,586 57.9B5 57.985
o/F 7,536 7.536 10.807 10,807
(il '<t>'1T<l<I>R <z<olP 14.733 14.733 lB.075 18.075 Cultivators tM 14.119 14.119 17,411 11,411
ofF 614 614 664 664
(iQ~~ <Z<oJP 22.567 22,567 29,220 29,220 Agricultural labourers tM 19,631 19,631 21.922 21,922
ofF 2.936 2,936 7,298 7,298
(iii) ql~ql~<t> ~ ~ CZfO/P 2,887 2,887 1,753 1,753 Household Industry workers tM 1.109 1.109 1,250 1,250
o/F 1,778 1.178 503 503
Ov) 3l"'Q' cp1fj l:ZfolP 16,935 16.935 19,744 19.744 Olherworkers tM 14.727 14,727 17,402 17,402
o/F 2,208 2,20B 2,342 2,342
10. 31('q<t>I~<t> <!>Iff l:Z!olP 15,905 15,905 22,487 22,487 Marginal workers ;tM 9,997 9,997 11,182 11,182
ofF 5.908 5,908 11,305 11,305
(i) ~ l:ZfolP 2,087 2,OB7 1,949 1,949 Cultivators ~M 1,669 1,669 1,485 1,485
o/F 418 418 46~ 464
(ii) ~~ ClfotP 9,062 9,062 16.376 16,376 Agricultural labourers ~M 6,599 6,599 7,707 7,707
iJlF 2,463 2,463 B,669 B,669
(iiO 41~qIR<t> ~ q;>ff l:ZfotP 1,651 1,651 1,031 l,G31 Household industry workers ;tM 214 214 264 264
ofF 1,437 1,437 767 767
(iv) 3l"'Q' cp1fj l:Z!olP 3.105 3,105 3,131 3,131 Other workers ~M 1.515 1,515 1,726 1,726
o/F 1,590 1,590 1,405 1,405
11. -IR q;>ff <ZIolP 140,471 140,471 145.199 145.199 Non-workeTS ~M 50,580 50,5BO 51.776 51,776
o/F 69,891 69,891 93,423 93,423
85
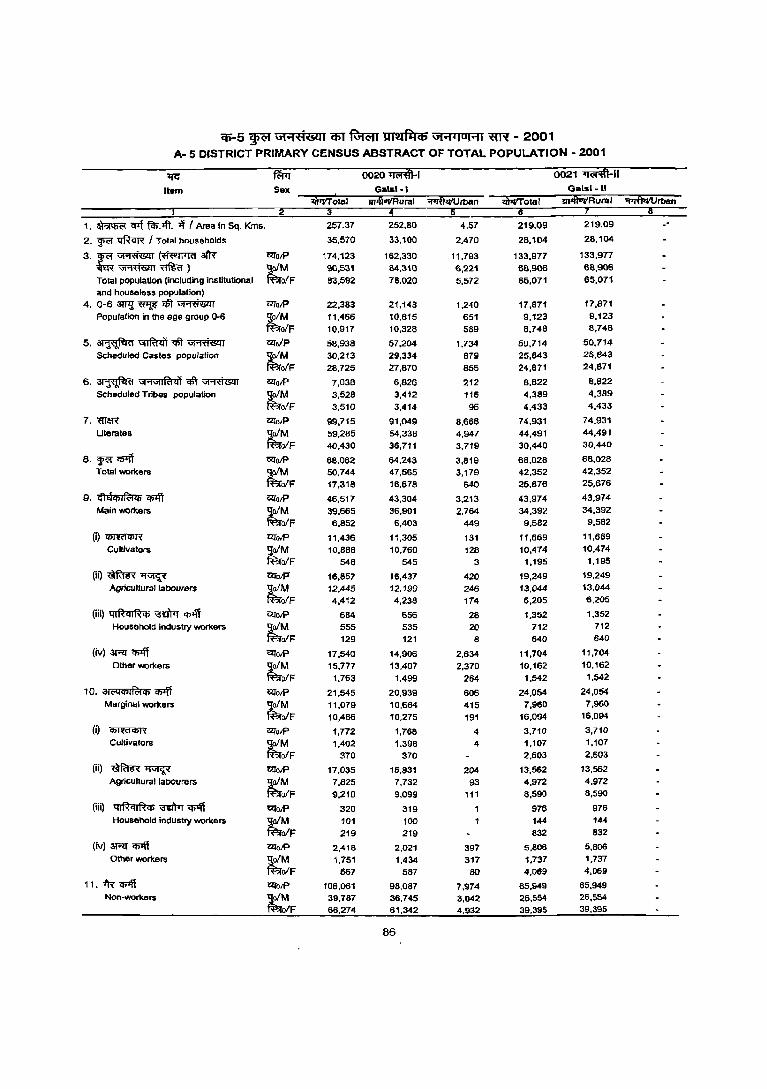
cp-5 wcr ut""l't1&11 q;r ~ 'm'l1tfl\q; ut""lJIUHI ~ - 2001 A- 5 OISTRICT PRIMARY CENSUS ABSTRACT OF TOTAL POPULATION - 2001
lJl:' ~ 0020~-1 0021 "iliiRft-1l
Item Sex Galsl·1 Galsl.1I
'IWT~1a1 IlI41uvRural ~rbBn
~. ~ lI'f ~:;ft. if { Area in Sq. Kms. 257.37 252.80 4.57 219.09 219.09 . -2. ~ lfftcrR / Total households 35,570 33,100 2.470 28,104 28,104
3'l! ~ (~atff l':lfolf' 174,123 162,330 11,793 133,977 133,977
~~) ~M go,531 B4,3i0 6,221 66,906 66,906
TOlal population (including institutional ofF 63,592 78,020 5.572 65.071 65.071
and houseless populatlon)
4. 0-6aw.I~~~ UTaif' 22,383 21,143 1,240 17,871 17,871
Population in 1M age group 0-6 ;tM 11,466 10,815 651 9.123 9,123
ofF 10,917 10,328 589 8,748 8,748
5,~~~~ 'lZlolP 58,938 57,204 1,734 50,714 50,714
Scheduled Castes population tM 30,213 29,334 879 25,843 25,843
ofF 28,725 27,870 855 24,871 24,871
S. ~ \iI'1\i1Ir.t<l1 ~ ~ <Z!otP 7,038 6,826 212 8,822 8.822
Scheduled Tribes population t,M 3.528 3.412 116 4.389 4.389
ofF 3,510 3,414 96 4,433 4,433
7.m~ UTolP 99,715 91,049 8,666 74,931 74.931
Uterates tM 59,285 54,338 4,947 44,491 44,491
ofF 40,430 36,711 3.719 30,440 30,440
8. ~ q;Jjf CZlolP 68.062 64.243 3.819 66.028 68,028
Total workers tM 50,744 47,565 3,179 42,352 42,352
OfF 17,318 16,676 640 25,676 25,676
9. <!hiCj)I~Cj) 'Cj)lff CZlolf' 46,517 43,304 3,213 43,974 43,974
Main WOrkers tM 39,665 36,901 2.764 34,392 34,392
ofF 6,852 6,403 449 9,582 9,582
(i)~ CZlolP 11,436 11,305 131 11,669 11,669
Cultivators tM 10,68a 10,760 128 10,474 10,474
OfF 546 545 3 1,195 1.195
(iO~~ l':lfOJP 16,657 16,437 420 19,249 19.249
Agricultural labourers ;tM 12,445 12,199 246 13,044 13,044
OfF 4,412 4,238 174 6,205 6,205
OiQ ql~ql~q; ~ if>lff CZl'olP 684 656 28 1,352 1,352
Household induslly worken; tM 555 535 20 712 712
OfF 129 121 8 640 640
(iv) aR 4i'ff CZlO/P 17,540 14.906 2.634 11,704 11,704
Olh.er workers tM 15,777 13.407 2,370 10,162 10.162
ofF 1,763 1.499 264 1,542 1,542
la, a1@OjCj)I~'" ~ WotP 21,545 20.939 606 24,054 24,054
Marginal worken; ;tM 11,079 10.664 415 7,960 7,960
OfF 10,466 10.275 191 16,094 16,094
(i) ~ i2folP 1,772 1,768 4 3,710 3,710 Cultivators ;tM 1,402 1.398 4 1,107 1,107
OfF 370 370 2,603 2,603
(ii) ~~ l':lfolP 17,035 16,631 204 13,562 13.562 Agricultural labOUrers ~M 7,825 7.732 93 4,972 4,972
OfF 9,210 9,099 111 8,590 6,590
(iii) ql~ql~<t> ~ <I>'ff l':lfolP 320 319 976 976 Household industry worken;
~F 101 100 144 144
219 219 632 832
(iv) aRt q;Iff l':lfolP 2,416 2.021 397 5,806 5,606 Other worken; ~M 1.751 1.434 317 1,737 1,737
OfF 667 567 80 4,069 4,069
11, "'R q;>ff WolP 106,061 98,067 7,974 65,949 65,949 Non-workers ~M 39,767 36,745 3,042 26,554 26,554
ofF 66.274 61.342 4,932 39.395 39,395
86

'CP-5 ~ U'i"'l:09'\1Sll1 q;r fGn;n 'UM~Cb \J1"'1.IOI"'II ~ - 2001 A· 5 DISTRICT PRIMARY CENSU.S ABSTRACT OF TOTAL POPULATION· 2001
lfG f<!pr 0022 ii"if.iA.J 0023 ii"if.iA·1I Item Sex Burdwan ·1 Burdwan -II
'tiIt!IT Ola I III410VRural 4'18UfUrbIln 'tiIt!IT ola I ~Rural 4TifuVUrban 3 6
1. ~ q-.f f<I>.1ft. '011 Area in Sq. Kms. 250.41 250.41 189.57 189.57
2. ~ ~ 1 Total households 36,148 36,148 29,443 29,443
3:~~(~afR Ul'O/P 179,828 179,828 138,897 138,897 J~~~) tM 92,650 92,650 70,837 70,837 Total populallon (including inslltWional 'oIF 87,178 87,178 68,060 68,060 and houseless population) 4,O-6~~~~ Ul'oiP 24,443 24,443 18,068 18,068
Population in the age group 0-6 tM 12,584 12,584 9,141 9,141 elF 11,859 11,859 8,927 8,927
S. ~ VJl'lm11 ~ ~ tlTo/P 55,807 55,807 51,397 51,397
Scheduled Casles population tM 28.448 28.448 25,982 25,982 elF 27,359 27,359 25,415 25,415
6. ~ GJ"GJI~1l1 cit ~ 12l'oiP 11,137 11,137 17,772 17,772 Scheduled Tribes population tM 5,535 5,535 8,774 8,774
o/F 5,602 5,602 8,998 8,998
7. ~ffi' il!ToiP 106,951 106,951 82,300 82,300 Literates ~F 62,199 62,199 47,990 47,990
44,752 44,752 34,310 34,310
8,~~ il!To/P 66,853 66,853 56,759 56,759 Total workers ~F 51,676 51,676 40,304 40,304
15,177 15,177 16.455 16.455
9. cflaClllittlb w1'i il!To/P 52.623 52,623 40,428 40,428 Main workers tM 43,960 43,960 31,974 31,974
o/F 8,663 8,663 8,454 8,454
(i)~ il!To/P 9,828 9,828 6,815 6,815 Cultivators tM 9,434 9,434 6,529 6,529
o/F 394 394 286 286
(ii)~~ ClJDiP 14,758 14,758 14,073 14,073 Agricultural labourers tM 10,525 10,525 9,313 9,313
o/F 4,233 4,233 4,760 4,760
(iii) ql~ql~<i> ~ '1b'ff ClJDIP 1,505 1,505 733 733 Household industry workers ~M 903 903 565 565
elF 602 602 166 168
(Iv) ~ CJ>Iff GlJOIP 26,532 26,532 18,807 16,807 Other workers ~M 23,098 23,098 15,567 15,567
olF 3,434 3,434 3,240 3,240
10. 3t;;;qCllIf<;tCll~ ClIoR 14,230 14,230 16,331 16,331 Marginal workers ~ 7,716 7.716 8,330 8.330
elF 6,514 6,514 8,001 8,001
(i) ~ ClJO/P 990 990 508 508 Cultivators tM 786 786 394 394
elF 204 204 114 114
(ii) ~~ WoiP 10,432 10,432 12,823 12,823 Agricultural labourers tM 5,296 5,296 6,347 6,347
elF 5,136 5,136 ,6,476 6,476
(iii) ql~qlRCIl ~ CJ>Iff WotP 430 430 368 368 Household indulllry workers ;tM 130 130 76 76
ofF 300 300 292 292
(iv)~<I>'Iff WoiP 2,378 2,378 2,632 2,632 Other workers ~ 1,504 1,504 1,513 1,513
ofF 874 874 1,119 1,119
11. 1'1< ~ WaR 112,975 112,975 82,138 82,138 Nbn-workers ;tM 40,974 40,974 30,533 30,533
ofF 72,001 72,001 51,605 51,605
87
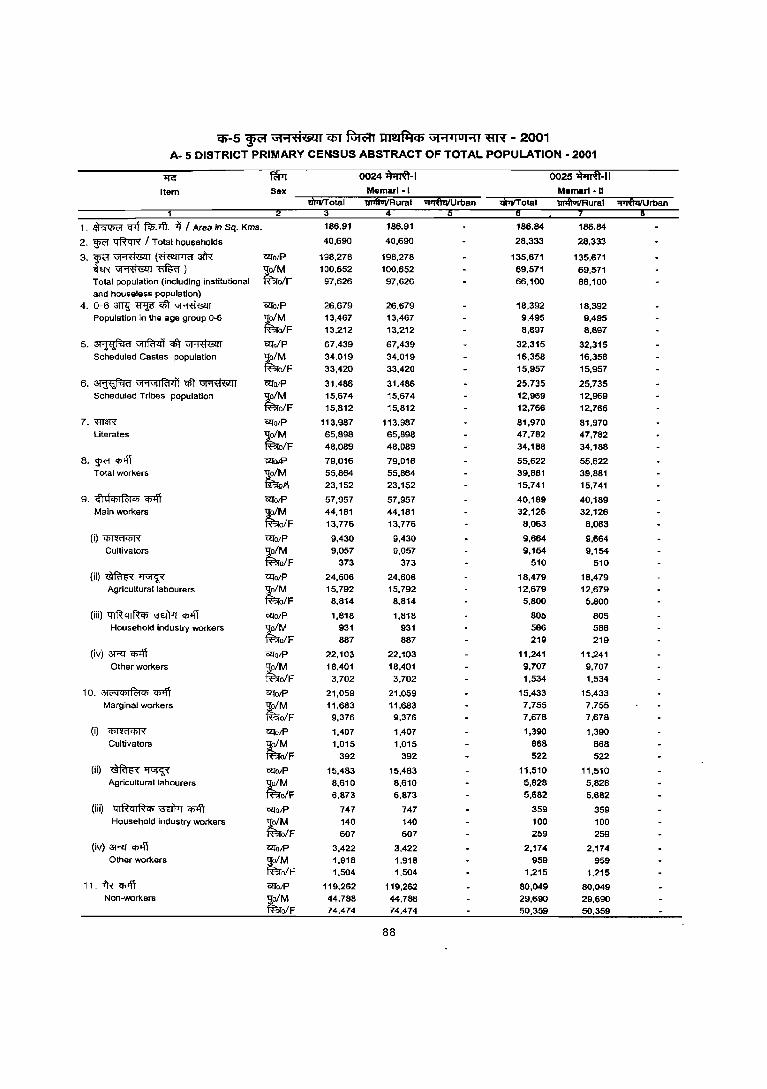
<6'-5 ~ "'1""1'fi'lSll1 em f.m:n tlll!tfi:lCb \J1""1 4IUHI ~ - 2001 A- 5 DISTRICT PRIMARY CENSUS ABSTRACT OF TOTAL POPULATION - 2001
"I{G fWT 0024 i)i!rif-I 0025 ¥irii-II
Item Sex Memarl-I Memarl-II iitITIT otal iiJifiiITI'Rural ~rban itt1ri'otal liTIftOTIRural "iiRiiifUrban
1, ~ Cf'f foP, If}, ii I Area in Sq, Kms. 186.91 186.91 186,84 186.84
2, 'WR ~ I Total households 40,690 40,690 28,333 28,333
3. ~ ~ (~3i'R" CZfoJP 198.278 198,278 135,671 135,671 ~~~) tM 100,652 100,652 69,571 69,571 Total population (including institutional oIF 97,626 97,626 66,100 66,100 and houseles5 population)
4, 0-6 ~ 'fflI6 ~ ~ CZfoJP 26,679 26,679 18,392 18,392 Population in tile age group 0-6 tM 13,467 13,467 9,495 9,495
oIF 13,212 13,212 8,897 8,897
5.~~qft~ <2loiP 67,439 67,439 32,315 32,315 Scheduled Castes population tM 34,019 34,019 16,358 16,358
oIF 33,420 33,420 15,957 15,957
6, ~ Gt·1GIIRI.i'i ~ ~ <2lotP 31,486 31,486 25,735 25,735 Scheduled Tribes population tM 15,674 15,674 12,969 12,969
o/F 15,812 15.812 12,766 12,766
7. 'ffi&R <lJotP 113,987 113,987 81,970 81,970 Literates tM 65,898 65,898 47,782 47,782
o/F 48,089 48,089 34,188 34.188
8.~~ CZfG.<P 79,016 79,016 55,622 55,622 Total workers tZ 55,864 55,864 39,881 39,881
}\ 23,152 23,152 15,741 15,741
9. Gle!CliIfc:!CIi ~ <2lO/P 57,957 57,957 40.189 40,189 Main workers tM 44,181 44,181 32,126 32.126
o/F 13,776 13,776 8,063 8,063
(i)~ <2lo/P 9,430 9,430 9,664 9,664 Cultivators tM 9,057 9,057 9,154 9,154
o/F 373 373 510 510
(ii)~~ <2lo/P 24,606 24,606 18,479 18,479 Agricultural labourers tM 15.792 15,792 12,679 12,679
o/F 8,814 8,814 5,800 5.800
(iii) qlfhl~q; ~ ~ CZloJP 1,818 1,B18 805 805 Household industry workers tM 931 931 586 586
o/F 887 887 219 219
(iv) 3R!~ CZlO/P 22,103 22.103 11,241 11,;241 Other workers :!o/M 18,401 18.401 9,707 9,707
ff:5ro/F 3,702 3,702 1,534 1,534
10. 3ic;qCliI~CIi ~ CZlotP 21,059 21,059 15,433 15,433 Marginal workers tM 11,683 11,683 7,755 7.755
olF 9,376 9,376 7,678 7,678
(i) ~ UTolP 1,407 1,407 1,390 1,390 Cultivators tM 1,015 1,015 868 868
oIF 392 392 522 522
(ii) ~~ CZlO/P 15,483 15,483 11,510 11,510 Agricultural labourers tM 8,610 8,610 5,828 5,828
olF 6,873 6,873 5,682 5,682
(iii) ql~ClI~CIi~~ CZfolP 747 747 359 359 Household industry workers tM 140 140 100 100
olF 607 607 259 259
(iv)~~ 'l7<olP 3,422 3,422 2,174 2,174 Other workers tM 1,918 1,918 959 959
oIF 1.504 1,504 1.215 1,215
11. 7R~ <2l0JP 119,262 119,262 80,049 80,049 Non-workers tM 44,788 44.788 29.690 29.690
o/F 74,474 74,474 50,359 50,359
88

C6'-5 ~ Gt""l'<1'L<41 em Riron ~ Gt"'l'IUI"'I1 ~ - 2001 A- 5 DISTRICT PRIMARY CENSUS ABSTRACT OF TOTAL POPULATION - 2001
'Ire
Item
1. ~ C!l\ fcl>.>ft. it I Area in Sq. Kms.
2. w<" ~ / Total households
3. w<" ~ (~3fR W~~) Total population (including Institutional
and houselsss population)
4. 0-6 an<! ~ qft ~ Population In the age group 0-6
5.~~qft~ Scheduled Castes population
6. ~ "I'1"1Ir-m'i qft ~ Scheduled Tribes population
7. miff'{ Literates
8. w<" CJ>11l T olal workers
9. ,M4l 1f<:14l CJ>11l Main workers
(i)~
Cullivalors
(ii)~~ Agricultural labourers
(iii) qlRqlR<t> ~ ~ Household industry workers
(iv) ;3f'XI 'I1'ff Other workers
10. 31('Q<t>I~<t> CJ>11l Marginal workers
(i)~
Cultillators
(ii)~~ Agricultural labourers
(iii) qlRqlR<t> ~ CJ>11l Household Industry workers
(iv) ;3f'XI Cf;lfi Other workers
11. 1'R q;>ff Non-workers
Sex
ClIotP
'loiM ff?ro/F
ClIO/P
'lo/M ff?ro/F ClIo/P
'lo/M ~o/F
ClIO/P
'l0/M ~o/F
ClIO/P
'lo/M ~o/F
Cl:IO/P
~oiM ~o/F
ClIO/P
'loiM fBloiF Cl:IotP
'lo/M ff?ro/F WO/P
'lo/M fF?ro/F
WO/P
'lo/M fBlo/F WO/P
'l0/M fBlo/F
WO/P
IJo/M fF?ro/F
Cl:Io/P
IJo/M ~o/F
GIlo/P
1Jo/M ff?ro/F
ClIotP
,!o/M fF?ro/F ClIO/P
,:!o/M ~o/F <Z[o/P
,!oiM fF?ro/F
"lI'tliITotal
169.08
40.105
190,741
97,839
92,902
26,453
13,396 13,057
54,546 27,673
26.873
21,048
10,451 10,597
109,167 63,524
45,643
74,752 55,334 19.418
59.609 47,154
12.455
11,021
10,650
371
19,912
14,942 4,970
8,064
4,702 3,362
20,612 16,860
3,752
15,143
8,180
6,963
1,023
841
182
9.591
5,838 3,753
2,132
306
1,826
2,397 1,195
1,202
115,989 42,505
73.484
0026. <Iffi'RT-1 Kalna -I
lIJlftVi/Rural ;r;:ra;;;Urban
164.87
36,681
174,140
89,229 84,911
24,491
12,393 12,098
49,935
25,335
24,600
20,429 10,140
10,289
98,320 57,243
41,077
67,263 50,359
16.904
53,260 42,503
10,757
10,868
10,501
367
19,230
14,439 4,791
5,577 3,177
2,400
17,585 14,386
3,199
14,003
7.856 6,147
1,013 833
180
9.393
5,758 3,635
1,510
208
1,302
2,087
1,057
1,030
106,877 38,870
68,007
89
4.21
3,424
16,601
8,610
7,991
1,962
1,003 959
4,611
2,338
2,273
619 311
308
10,847 6,281
4,566
7.489 4,975
2,514
6,349
4,651
1,698
153
149
4
682
503 179
2,487
1,525
962
3,027 2,474
553
1,140
324
816
10
8 2
198
80 118
622
98 524
310
138
172
9,112
3,635
5.477
0027 "CfiTW'IT-1i Kalna -II
"1l\TiITotal
172,17
31,781
153,680
78,464 75,216
20,848
10,603
10,245
54,889
27,978
26,911
26,839
13,291 13,548
89,292 51.840
37,452
61,548 44,941
16,607
47,855
37,576
10,279
10,424
9,991
433
20,138
13,869 6,269
3,363
2.058 1,305
13,930
11,658 2,272
13,693
7,365
6,328
966
813
153
9,360
5,174 4,186
780
191
589
2,587
1,187
1,400
92,132 33,523
58,609
"llJ1l\VIIRural iiTTfuiIUrban
172.17
31,781
153,680
78,464
75,216
20,848
10,603
10,245
54,889
27,978
26,911
26,839
13,291 13,548
89,292 51,840
37,452
61,548 44,941
16.607
47.855 37,576
10,279
10,424
9,991
433
20,138
13,869 6,269
3,363 2,058
1,305
13,930 11,658
2,272
13,693
7,365
6,328
966
813
153
9,360
5,174 4,186
780
191 589
2.587
1,187
1,400
92,132
33,523
58,609
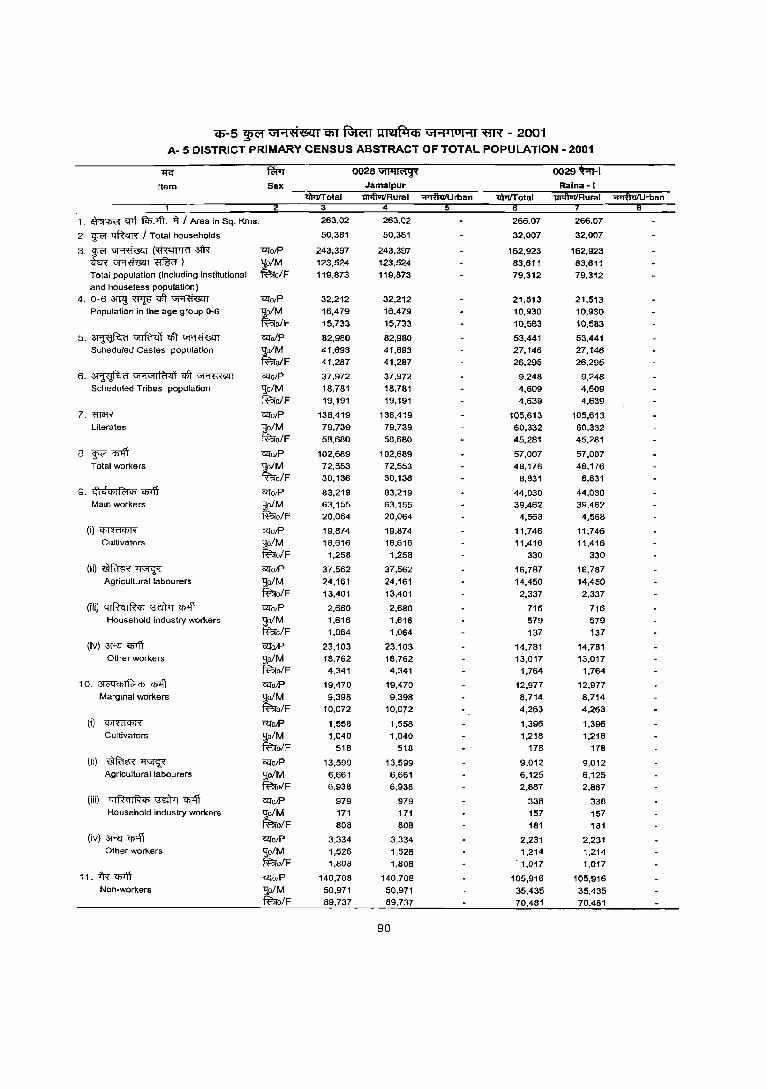
cp-5 ~ Gi"'i;H'l.GtlI q;y Rffi;rr UM144i Gi""l'IOHI ~ - 2001 A- 5 DISTRICT PRIMARY CENSUS ABSTRACT OF TOTAL POPULATION - 2001
lfG' ~ 0028~ 0029~-1 Item Sex Raina -I
tlPtiTotal tlPtiTotal llJ1'ftuTIRural ~rban 1 :3
1. ~ <Pt f<n.-.ft. it I Area in Sq. Kms. 263.02 263.02 266.07 266.07
2 ~ ~ I Total households 50.381 50.361 32,007 32,007
3.~~(~~ ClfO/P 243,397 243,397 162,923 162,923 W~~) ~o/M 123,524 123,524 83,611 83,611 Total population (including institutional ~o/F 119,873 119,873 79,312 79,312 and houseless populatiOn)
4, 0-6 ~~qlT~ '&fO/P 32,212 32,212 21,513 21,513 Population in the age group 0-6 ~ 16,479 16,479 10,930 10,930
o/F 15,733 15,733 10.583 10.583
5.~~qlT~ GIl"o/P 82,980 82,980 53,441 53,441 Scheduled Castes population tM 41,693 41,693 27,146 27,146
olF 41,287 41,287 26.295 26,295
6, ~ Vi'1ViIR'l<ll qlT ~ GIl"o/p 37,972 37,972 9.248 9,248 Scheduled Tribes population 'go/M 18.781 18,781 4,609 4,609
ff?ro/F 19,191 19,191 4,639 4,639
7. 'RT1ff'< GIl"o/P 138,419 138,419 105,613 105,613 Literatss 'Jo/M 79,739 79,739 60.332 60,332
ff?rolF 58,680 58,680 45.281 45,281
8. ~~ GIl"oJP 102,689 102,689 57,007 57,007 Total workers
~ 72,553 72,553 48,176 4B,176 o/F 30,136 30,136 8,831 8,831
9. <l)E\<t>IRi<t> ~ GIl"o/p 83,219 83,219 44,030 44,030 Main workers lJo/M 63,155 63,155 39,462 39.462
ff?ro/F 20,064 20,064 4,568 4,568
(i)~ GIl"o/p 19,874 19,874 11,746 11,746 Cultivators lJo/M 18,616 18,616 11,416 11,416
ff?ro/F 1,258 1,258 330 330
(Ii)~~ GIl"o/P 37,562 37,562 16,787 16,787 Agricultural labourers lJo/M 24,161 24,161 14,450 14,450
ff?ro/F 13,401 13,401 2,337 2,337
(iiI) qlRqlR<t> ~ <t»\T GIl"o/p 2,680 2,680 716 716 Household industry workers 'Jo/M 1,616 1,616 579 579
ff?ro/F 1.064 1,064 137 137
(iv) 3RT ¢lii GIl"o/p 23,103 23.103 14,781 14,781 Other workers ,:!o/M 18,762 18,762 13,017 13.017
ff?ro/F 4.341 4,341 1,764 1,764
10. 3lC'Q<t>1f<>i<f) ~ mo!p 19,470 19,470 12,977 12,977 Marginal workers 'go/M 9,398 9,398 8,714 8,714
ff?ro/F 10,072 10,072 4,263 4,263
(i) ~ GIl"o!P 1,558 1,558 1,396 1,396 Cultivators
~ 1,040 1,040 1,218 1,218 o/F 518 518 178 178
(ii) ~~ GIl"o/P 13.599 13,599 9,012 9,012 Agricultural labourers So/M 6,661 6,661 6,125 6,125
ff?ro/F 6,938 6,938 2,887 2,887
(iii) qlRqiR<t> ;::rdM ~ GIl"o!P 979 979 338 338 Household industry workers
~ 171 171 157 157 o/F 808 B08 181 181
(iv) 3RT ¢lii GIl"o/P 3,334 3,334 2.231 2,231 Other workers ~o/M 1,526 1.526 1,214 1.214
ff?ro/F 1,808 1,B08 . 1,017 1,017
11.i'R~ GIl"o/P 140,708 140,708 105,916 105,916 Non-workers ~o/M 50,971 50,971 35,435 35,435
fBro/F 89,737 89,737 70,481 70,481
90
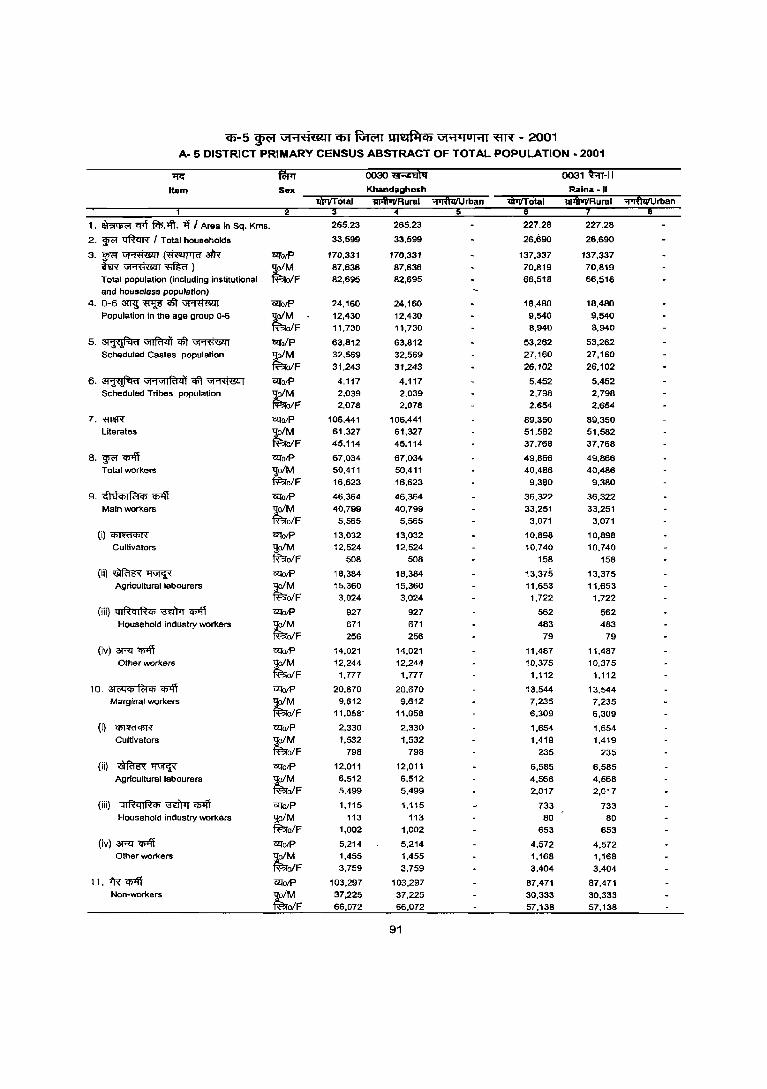
cn-5 ~ Gt ... ti6U1 iIIT ~ UII!Ol~Cb Gt .... lu .... 1 'fIN - 2001 A- 5 DISTRICT PRIMARY CENSUS ABSTRACT OF TOTAL POPULATION - 2001
-q;: fWr 0030~ 0031 ~-II Item Sex Raina -II
11141utlRural ~rban
1, ~ '1f't ~:4t -q I Area In Sq, Kms, 265.23 265.23 227.28 227.28
2, W<" ll"ftcIR I Total households 33,599 33,599 26,690 26,690
3, W<" ~ (~3h< c:lTotP 170,331 170,331 137,337 137,337 ~~~)
tM 87,636 87,636 70,819 70,819
Total population (including institutional ofF 82,695 82,695 66,518 66,518 and houselass population)
4. 0-6~~qft~ C2lotP 24,160 24,160 18,480 18,480
Population In the age group O~ tM
12,430 12,430 9,540 9,540
ofF 11,730 11,730 8,940 8,940
5.~~~~ c:lToIP 63,812 63,812 53,262 53,262 Scheduled Castes population
~F 32,569 32,569 27,160 27,160
31,243 31,243 26,102 26,102
6, ~ Gt1GtI~4) ctt ~ C2lo/P 4,117 4,117 5,452 5,452 Scheduled Tribes population ~M 2,039 2,039 2,798 2,798
elF 2,078 2,078 2,654 2,654
7. mllR "&Io/p 106,441 106,441 89,350 89,350 Literates ~IM 61,327 61,327 51,582 51,582
o/F 45,114 45,114 37,768 37,768
8, W<" ~ "&IotP 67,034 67,034 49,866 49,866 Total workers ;tM
50,411 50,411 40,486 40,486
ofF 16,623 16,623 9,380 9,380
9. ,,"j\l<t>IR:tCll ~ C2lotP 46,364 46,364 36,322 36,322
Main workers tM
40,799 40,799 33,251 33,251 olF 5,565 5,565 3,071 3,071
(i)~ <ZiotP 13,032 13,032 10,898 10,898 Cultivators ';!ofM 12,524 12,524 10,740 10,740
ff?rofF 508 508 158 158
(ii)~~ <ZiotP 18,384 18,384 13,375 13,375 Agricultural labourers
tM 15,360 15,360 11,653 11,653
ofF 3,024 3,024 1,722 1,722
(iii) QI~ql~Cll ~ "1I51ff C2lotP 927 927 562 562 Household industry workers ~M 671 571 483 483
olF 256 256 79 79
(iv)~~ <ZiotP 14,021 14,021 11,487 11,487 Other workers ~ofM 12,244 12,244 10,375 10,375
ff?ro/F 1,777 1,777 1,112 1,112
10. 3t&G<t>lfcoiCll "<ll'ff GIlotP 20,670 20,670 13,544 13,544 Marginal workers
tM 9,612 9,612 7,235 7,235
ofF 11,058' 11,058 6,309 6,309
(i) ~ C2l0/P 2,330 2,330 1.,654 1,654 Cultivators ~M 1,532 1,532 1,419 1,419
olF 798 798 235 235
(ii) ~~ GIlotP 12,011 12,011 6,585 6,585 Agricultural labourers
tM 6,512 6,512 4,568 4,568
ofF 5,499 5,499 2,017 2,017
(iii) QI~ql~Cll~"<I>1ff CLJo/p 1,115 1,115 733 733 Household industry workers ';!o/M 113 113 80 80
ff?rofF 1,002 1,002 653 653
(iv)~~ <ZiotP 5,214 5,214 4,572 4,572 Other workers
tM 1,455 1,455 1,168 1,168
ofF 3,759 3,759 3,404 3.404
11.-fRCfllff CLJo/P 103,297 103,297 87,471 87,471 Non-workers
~ 37,225 37,225 30,333 30,333
ofF 66,072 66,072 57,138 57,138
91

cp-s ~ \if"ifl'L«q1 (6J Rffi;u wafilCb \if"1 i IOI'11 ~ - 2001 A- 5 DISTRICT PRIMARY CENSUS ABSTRACT OF TOTAL POPULATION - 2001
+J<:
Item
1. ~ l:fIi fct;.1fI. ~ I Area in Sq. Kms.
2. WH ~ I Total households
3·WH~(~~ ~~~) Total population (including institutional
and houseless populatlon) 4. 0-6 3{1<j ~ qft ~
Population in the age group Q-6
5.~~qft~ Scheduled Castes population
6. ~ V1'1GjI~q'i ~ ~ Scheduled Tribes population
7.mm Literates
8. WH q;;ff Total workers
9. <fl4ct>I~ifi q;;ff Main workers
(i)~ Cultivators
(ii)~~ Agricultural labourers
(iii) 4IR<lIR", \RWr q;lfr Household industry workers
(iv) 3Rr~ Other work",s
1 O. 31 (iqifil~'" q;iff Marginal workers
(i)~
Cultivators
(ii)~~ A9riculturallabourers
(iii) ~ \3'dtrr q;;ff Household industry workers
(iv) 3RI' 'CffIff Other workers
11. -Iff q;;ff Non-workers
1'2lotP llolM ~alF
G!l'otP '!{oIM ~o/F 1'2lolp '!{oIM ~o/F 1'2lo,P ~D/M ~alF G!l'otP
'!101M ~o/F "Q10tP
'!101M ~o/F ~o,p
qo/M ~o/F ~o,P
qolM ~o/F "Q1o,P '!IoIM ~o/F "Q1otP
ljo/M ~oIF ~O/P
~o/M ~oIF "Q1O/P
-golM ~o/F "Q1otP
1J;o/M tao/F ~O/P
ljo/M tao/F ~olP
1_lo/M tao/F
molP 1J;o/M ~o/F "Q1otP
qo/M tao/F
3,927.00
959,987
4,604,827 2,366,853 2,237,974
606,395 307,580 298,815
1,365,985 700,622 665,363
113,891 57,475 56.416
2,644,461 1,489,038 1,155,423
1,615,705 1,300,759
314,946
1,405.724 1,214.530
191.194
287.652 279.298
8,354
328,464 308,121
20,343
144,576 62,272 62,304
645,032 544,839 100,193
209,981 86,229
123,752
32,812 11,944 ::0,868
47,077 32,591 14,486
39,835 5,564
34,271
90,257 36,130 54.127
2,989,122 1,066,094 1,923,028
1 0 ;;t£iii NADIA
3,716.83
747,109
3,625,308 1,867,682 1,757,626
508,780 257,950 250,830
1,128.190 579,378 548.812
101,911 51.486 50,425
1,926,538 1,098,418
828,120
1,259,869 1,028,372
231,497
1.081,B71 956.242 125.629
282,574 274,521
8.053
320,807 301,163
19,644
92,787 52,736 40,051
385.703 327,822
57.881
177,998 72.130
105.868
32,510 11.778 20,732
45,622 31,561 14,061
30.063 4,228
25,835
69,803 24.563 45,240
2,365,439 839.310
1,526,129
92
210.17
212,878
979,519 499,171 480,348
97,615 49,630 47,985
237.795 121,244 116,551
11,980 5,989 5,991
717,923 390,620 327,303
355,836 272,387
83,449
323.853 258,288
65,565
5,078 4,777
301
7,657 6,958
699
51,789 29,536 22,253
259.329 217,017
42.312
31,983 14,099 17,884
302 166 136
1,455
1.030 425
9.772 1,336 8.436
20,454 11,567 8,887
623,683 226,784 396,899
215.78
37,061
166,725 86,274 80;451
22,420 11,514 10,906
30,656 15.781 14,875
4,530 2,305 2,225
83,731 46,482 37,249
57,127 49.797
7.330
48.276 45.006
3.270
14,483 14,240
243
18,653 18,058
595
1,767 1,036
731
13.373 11,672
1.701
8,851 4,791 4,060
1,344 814 530
3.554 2.704
850
813 98
715
3,140 1,175 1,965
109,598 36,477
73,121.
0001 ~-I Karlmpur • I 'iii4iUi/Rural
214.16
34,940
157,655 81,601 76.054
21.517 11,049 10,468
28.926 14,903 14.023
4,488 2,2B8
2,200
76,934 42,800 34,134
53,944 47,125
6,819
45.356 42,464'
2,892
14,326 14,087
239
18,515 17,922
593
1,595 928 667
10.920 9,527 1.393
8,588 4,661 3,927
1,331
811 520
3.544 2,696
648
760 87
673
2,953 1,067 1,886
103,711 34,476 69,235
"liTfuiIUrban
1.62
2,121
9,070 4,673 4,397
903
465 438
1,730 878 852
42 17 25
6,797 3,682 3,115
3.183
2.672 511
2,920 2,542
378
157 153
4
138 136
2
172
108 64
2,453 2,145
308
263 130
133
13 3
10
10 8
2
53 11 42
187 108
79
5,887 2,001 3,686
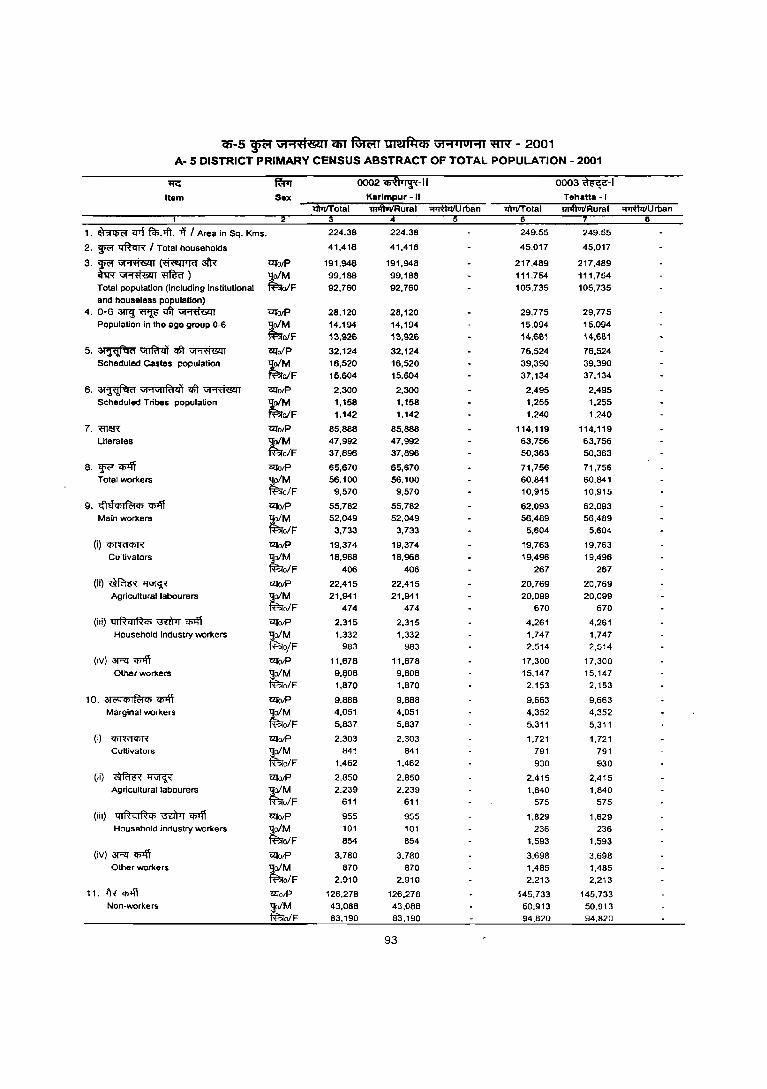
ai-5 ~ \iI ... 'ti&l1 ifiT R;rc;rr ~ \iI .... IOI ... 1 ';fIN - 2001 A- 5 DISTRICT PRIMARV CENSUS ABSTRACT OF TOTAL POPULATION - 2001
11'<:' ~ 0002~-1I 0003 "ifi¥-I Item Sex Karlmpur-II Tehatta -I
~otal il11IiViIRural ;:;;r&iiu rban WTlTolal "!ITai1JiIRural ~Urban
1
1. ~ qr\ f<I;.'Jft. 'fi / Area in Sq. Kms. 224.38 224.38 249.55 249.55
2. ~ ~ / Total households 41,418 41,418 45,017 45,017
3.~~(~3l'R 17fotP 191,948 191,948 217,489 217,489
~~~) tM 99,188 99,188 111,754 111,754 Total population (including institutional ofF 92,760 92,760 105,735 105,735
aM Mus_less population)
4. 0-6amJ~~~ 17fotP 28,120 28,120 29,775 29,775 Population in the age group 0-6 tM 14,194 14,194 15,094 15,094
ofF 13,92£ 13,926 14,681 14,6&1
5,~~~~ 'l:!iolP 32.124 32,124 76,524 76,524
Scheduled Castes population tM 16,520 16,520 39,390 39,390
ofF 15,604 15,604 37,134 37,134
6. ~ "1.1\iIIRl.i'i qft ~ UlotP 2,300 2,300 2,495 2,495
Scheduled Tribes population tM 1,158 1,158 1,255 1,255
ofF 1,142 1,142 1,240 1.240
7. "ffi1lR 17fo/P 85,888 85.888 114.119 114.119 Literates tM 47,992 47,992 63,756 63,756
ofF 37,896 37,896 50,363 50,363
8.¥i~ 17fo/P 65,670 65,670 71,756 71,756 Total workers t~F 56,100 56,100 60.841 60.841
9,570 9,570 10,915 10,915
9. 4)tlCf>I~Cf> q;off 1'<l'O/P 55,782 55,782 62,093 62,093 Main workers tM 52,049 52,049 56,489 56,489
ofF 3,733 3,733 5,604 5,604
(i)~ UlO/P 19,374 19,374 19,763 19,763 Cultivators
t~F 18,968 18,968 19,496 19,496
406 406 267 267
(ii)~~ 1'<l'otP 22,415 22,415 20,769 20,769 Agricultural labourers tM 21,941 21,941 20,099 20,099
olF 474 474 670 670
(iii) QIRilIRCf> ~ cpq'j mO/P 2,315 2,315 4,261 4,261
Household Industry workers tM 1.332 1,332 1.747 1,747
o!F 983 983 2.514 2.514
(iv) 3RI~ 1'<l'O/P 11,678 11,678 17,300 17,300 Other workers tM 9,l}08 9,808 15.147 15,147
olF 1.870 1,870 2.153 2,153
10. ~C'Qq;IR:1Cf> q;off 'l:!iotP 9.888 9.888 9.663 9.663 Marginal workers tM 4,051 4,051 4,352 4,352
olF 5,837 5,837 5,311 5,311
(i) ~ motP 2.303 2,303 1.721 1.721 Cultivators tM 841 841 791 791
o/F 1.462 1,462 930 930
(Ii) ~~ mOlP 2.850 2.850 2,415 2.415 Agricultural labourers tM 2.239 2,239 1.840 1.840
olF 611 611 575 575
(iii) 4IRqIR<t> ~ q;>ff 1'<l'O/P 955 955 1,629 1,829 Household industry workers tM 101 101 236 236
ofF 854 854 1.593 1.593
(iv) 3RI <I>'fi 1'<l'O/P 3,780 3.780 3.698 3.698 Other workers tM 870 670 1,485 1,485
olF 2,910 2,910 2.213 2,213
11. Irr <I>'fi ClI'O/P 126.278 126,276 145.733 145.733 Non-workers tM 43.088 43,088 50,913 50.913
olF 83,190 83.190 94,820 94.820
93
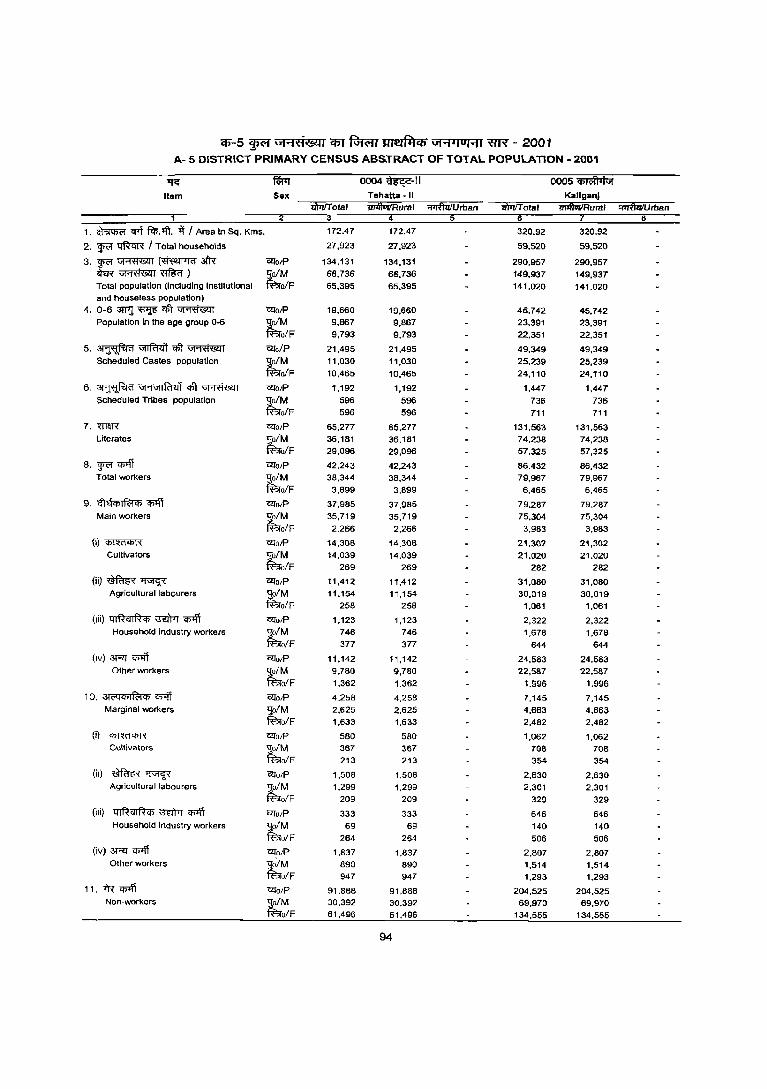
q)"-5 ~ "'Flti'L<lI1 q;-r fGR;u TlIl!4fTJC6 "'1""1"1 0 1"'11 Xffi" - 2001 A- 5 DISTRICT PRIMARY CENSUS ABS.TRACT OF TOTAL POPULATION - 2001
~ ~ 0OO4~-11 0005 'ifiTiift'Itijf Item Sex KaliganJ
ihii'Total ii)iiff otal "!Iiifli>iIRuml OIiTfuiIUrban 2 3 8
1. ~ crrt ~.>fi. ~ I Area In Sq. Kms. 17:2.47 172.47 320.92 320.92
2. ~ ~ I Total households 27,923 27,923 59,520 59,520
3.~~(~3fR CZloiP 134,131 134,131 290,957 290,957 <hR~~)
tM 6B,736 68,736 149,937 149,937
Total population (IncludIng InsUlutional o/F 65,395 65,395 141,020 141,020 and house less population)
4, 0-6~~<t't~ CZloJP 19,660 19,660 45,742 45,742 Population in the age group 0-6
tM 9,867 9,867 23,391 23,391
olF 9,793 9,793 22,351 22,351
5.~~ctlt~ CZlo/P 21,495 21,495 49,349 49,349 Scheduled Castes population S;o/M 11,030 11,030 25,239 25,239
R?rolF 10,465 10,465 24,110 24,110
6. ~V!.,~ql\~ CZlO/P 1,192 1,192 1,447 1,447 Scheduled Tribes population
tM 596 596 736 736
o/F 596 596 711 711
7. mm CZlO/P 65,277 65,277 131,563 131,563 Literates
tM 36,181 36,181 74,238 74,238
olF 29,096 29,096 57,325 57,325
8. ~ q;>ff CZlO/P 42,243 42,243 86,432 86,432 Total workers S;o/M 38,344 38,344 79,967 79,967
R?ro/F 3,899 3,899 6,465 6,465
9. <;"IelCf5I~Cf5 'q5'<j'i G!lo/P 37,985 37,985 79,287 79,287 Main workers S;o/M 35,719 35,719 75,304 75,304
R?ro/F 2,266 2,266 3,983 3,983
(i)~ CZlO/P 14,30B 14,30B 21,302 21,302 Cultivators
tM 14,039 14,039 21,020 21,020
olF 269 269 282 282
(ii)~~ CZlO/P 11,412 11,412 31,080 31,080 Agricultural labourers :,{o/M 11,154 11,154 30,019 30,019
~o/F 258 258 1,061 1,061
(Iii) QIRcllfh, ~ 'Cf51\T G!lotP 1,123 1,123 2,322 2,322 Household industry workers
tM 746 746 1,678 1,678
o/F 377 377 644 644
(IV) 3RT <I>1ff G!lo/P 11,142 11,142 24,583 24,583 Other workers
tM 9.780 9,780 22,587 22.587
ofF 1,362 1.362 1,996 1,996
10. 3l<"GCf5IRoiCf5 <I>1ff CZlO/P 4,258 4.25B 7,145 7,145 Marginal workers S;o/M 2,625 2,625 4,663 4,663
R?ro/F 1,633 1,633 2,482 2,482
(i) ~ CZlO/P 580 580 1,062 1,062 Cultivators 'Jo/M 367 367 708 708
~o/F 213 213 354 354
(ill ~~ 'C2l'O/P 1,506 l,50B 2,630 2,630 Agriculturallabourers ~M 1,299 1,299 2,301 2.301
ofF 209 209 329 329
(iii) Q I R <II R Cf5 mTI"rI <I>1ff UTO/P 333 333 646 646 Household industry workers ,:!o/M 69 69 140 140
R?rufF 264 264 506 506 (iv) ~ q;>ff G!lo/P 1,837 1,837 2,B07 2.807
Other workers tM 890 890 1,514 1.514 ofF 947 947 1,293 1.293
11. fR q;>ff G!lo/P 91,888 91,888 204,525 204,525 Non-workers ,:!o/M 30,392 30,392 69,970 69,970
R?rofF 61,496 61,496 134,555 134,555
94
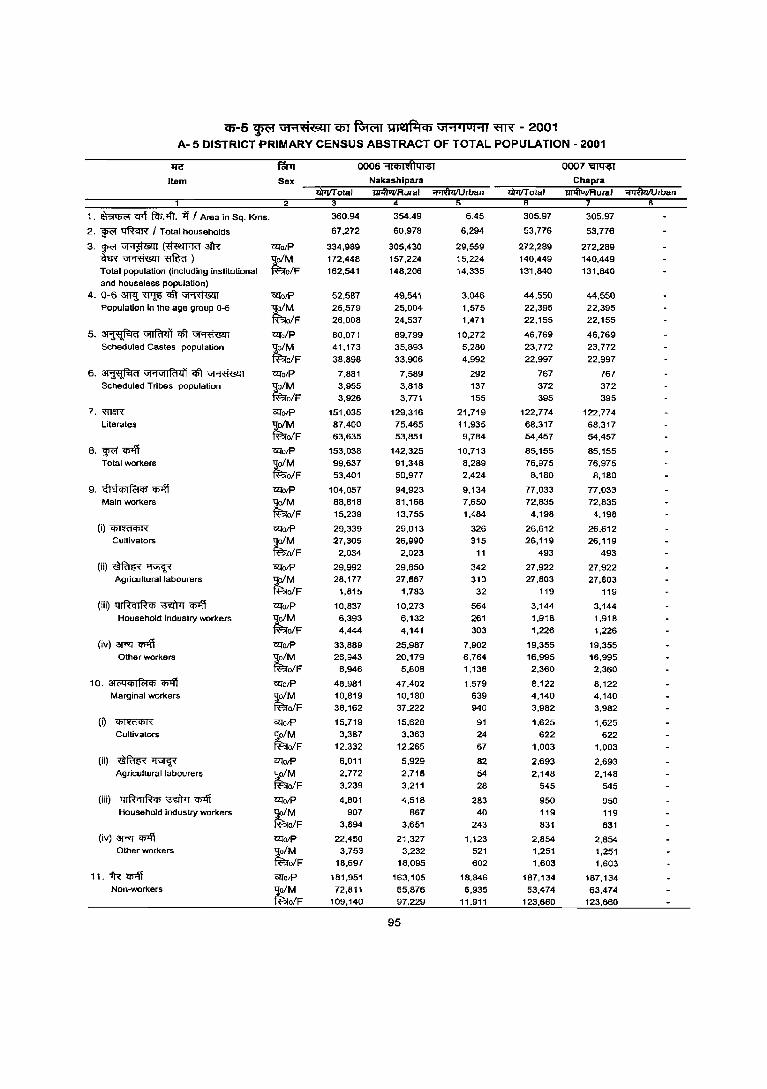
cp-5 ~ V1"1ti'L~( em'Rmwrr tI(~f4<b V1"1-(01"1( ~ - 2001 A- 5 DISTRICT PRIMARY CENSUS ABSTRACT OF TOTAL POPULATION - 2001
~
Item
1. ~ '1TIt FcP.1'fI. 'ii' Area in Sq. Kms.
2. ~ '!l'ftcrR' I Total households
3.~~(~3lR ~~~) Total population (including institutional and houseless population)
4. 0-6 ?TI<l ~ qft ~ Population in the age group ()-6
5.~~<tt~ Scheduled Castes population
6. ~ \iI'1\i1IR1<1~ qft ~ Scheduled Tribes population
7. "ID&R
Literates
8.~~ Total workers
9. i!hl<l>I~<I> ~ Main workers
(i)~
Cultivators
(ii)~~ Agricultural labourers
(iii) QIRqlR<I> ~ cplff Household industry workers
(iv) 3Rl 7I>'ff Other workers
10. 31('4<1>1 ~<I> 7I>'ff Marginal workers
(i)~
Cultivators
(ii)~~ Agricultural labourers
(iii) qlRqlR<I> ~ q;'Jfi Household industry workers
(iv) 3Rl q;off Other workers
11. iR 7I>'ff Non-workers
Sex
CllotP
~o/M ~o/F
ezro/P
~o/M ~o/F Gllo/P 'jo/M ~o/F
'&Io/P
t~F <ZiO/P 'jo/M ~o/F
<Zio/P 'joiM ~o/F <ZiOlP 'joiM R?ro/F GllOlP 'joiM ~oIF
Gllo/P 'joiM R?rolF
<ZiotP 'jo/M R?ro/F
ezrotP 'jo/M ~oIF <ZiO/P 'jo/M ff:::ro/F
Cl/o/P 'jo/M ff:::rolF
12!o/P
'jolM ff:::ro/F '&Io/P
'jo/M ff:::ro/F 12!O/P
'jo/M ff:::ro/F
0006 "'IiCbiiiflQi'$i
Nakashlpara liITiITotaJ lIPllvVAuraJ ;;TI6liIUrban
360.94
67,272
334,989 172,448 162,541
52,587 26,579
26,008
80,071 41,173
38.898
7.881 3,955 3,926
151,035 87,400 63,635
153,038 99,637 53,401
104,057
88,818 15,239
29,339 27,305
2,034
29,992 28,177
1,815
10,B37 6,393
4,444
33,889 26,943
6,946
48.981 10,819 36,162
15,719 3,387
12.332
6,011 2,772 3,239
4,801 907
3,694
22,450 3,753
18,697
181,951
72,811 109,140
4
354.49
60,978
305,430 157,224 148,206
49,541 25,004
24,537
69,799 35,a93
33,906
7,589 3,818 3,771
129,316 75,465 53,851
142,325 91,348 50,977
94,923
81,168 13,755
29,013 26,990
2,023
29,650 27,667
1,783
10,273 6,132
4,141
25,987 20,179 5,808
47,402 10,180 37,222
15.628 3,363
12,265
5,929
2,718 3,211
4,518 867
3,651
21,327 3,232
18,095
163,105
65,876 97,229
95
6.45
6,294
29,559 15,224 14,335
3,046
1,575 1,471
10,272 5,280
4,992
292 137 155
21,719 11,935
9,784
10,713 8,289 2,424
9,134
7.650 1,484
326 315
11
342 310
32
564
261 303
7,902 6,764 1,138
1.579 639 940
91 24
67
82 54 28
283 40
243
1,123 521 602
18,846
6,935 11,911
~otaJ 6
305.97
53,776
272,289
140,449 131,840
44,550
22,395 22,155
46,769 23,772
22,997
767 372 395
122,774 68,317 54,457
85,155 76,975
8,180
77,033 72,835
4,198
26,612 26,119
493
27,922 27,603
119
3,144
1.918 1,226
19,355 16,995
2,360
8.122 4,140 3,982
1,625
622 1,003
2,693 2,148
545
950 119
831
2.854 1,251 1,603
187,134
63,474 123,660
0007 "CI'TtRfI Chapra
lIfIfIuVAural ~lban
305.97
53,776
272,289 140,449 131,840
44,550 22,395 22,155
46,769 23,772
22,997
767 372 395
122,774 68,317 54,457
65,155 76,975
8,180
77,033 72,835
4,196
26,612 26,119
493
27,922 27,803
119
3,144 1,918
1,226
19,355 16,995
2,360
8,122
4,140 3,982
1,625 622
1.003
2,693
2,148
545
950 119
831
2,854 1,251 1,603
187,134
63,474 123,660

q;-5 P uFI;;H&l1 C6T ~ wafllq; GI"'Ialol"1l ~ - 2001 A· 5 DISTRICT PRIMARY CENSUS ABSTRACT OF TOTAL POPULATION - 2001
lfC:" ~ 0008~·11 0009 :;m\ti Item Sex Krlatlnagar - II Nabadwlp
1I'Pfl1rrIRu ral ~rban 1IlttITotai ~ural ~rban
1, ~ ~ fcI;:1fi, ~ I Area In Sq. Kms. 124.37 124.37 97.39 92.46 4,93
2, ~ l:lftcrR I Total households 25,642 25,642 25,610 21,749 3,861
3,~~{~3i'R CZl"otP 124,159 124,159 121,807 104,924 16,883 m~~) tM 64,128 64,128 62,751 54,163 8,588 Total population (including Institutional ofF 60,031 60,031 59,056 50,761 8,295 and house less population)
4, 0-6 3ITIl ~ <1ft ~ CZl"otP 17,854 17,854 16,682 14,956 1,726 PopUlation in the age group 0-6 ;tM 9,124 9,124 8,425 7,576 849
ofF 8,730 8,730 8,257 7,380 877
5,~~~~ 1'<lolP 22,301 22,301 16,686 14,125 2,561 Scheduled Castes population tM 11,399 11,399 8,557 7,233 1,324
oIF 10,902 10,902 8,129 6,892 1,237
6, ~ \iI"\"I'Rl41 <1ft ~ "tQ"otP 1,658 1,658 1,466 1,408 58 Scheduled Tribes popUlation tM 848 848 747 714 33
ofF 810 810 719 694 25
7.~ 1'<lotP 63,016 63,016 61,322 49,864 11,458 Literates t~F 36,788 36,788 36,423 29,925 6,498
26,228 26,228 24,899 19,939 4,960
8,~~ 12IotP 40,192 40,192 49,203 41,868 7,335 Total workers
t~F 34,478 34,478 35,828 30,861 4,967 5,714 5,714 13,375 11,007 2,368
9, c!lu"'I(Bqs 'Cj)'1fi 12IotP 36,706 36,706 43,993 37,176 6,817 Main workers tM 32,452 32.452 34,302 29,478 4,824
ofF 4,254 4,254 9,691 7,696 1,993
(i)~ 1'<lOlP 8,295 8,295 4,671 4,567 104 Cultivators tM 8,155 8,155 4,592 4,494 98
ofF 140 140 79 73 6
(ii)~~ 1'<lotP 10,957 10,957 6,121 5,942 179 Agricultural labourers
~ 10,666 10,666 5,828 5,677 151 oIF 291 291 293 265 28
(iii) qlfhl~qs ~ ~ '&fotP 3,972 3,972 6,646 5,536 1,106 Household industry workers tM 2,212 2,212 3,538 2,913 625
oIF 1,760 1,760 3,108 2,625 483
(iv) 3R!~ 1'<lo/P 13,482 13,482 26,555 21,129 5,426 Other workers tM 11,419 11,419 20,344 16,394 3,950
oIF 2,063 2,063 6,211 4,735 1,476
10, 3l('q<h1f<:i¢ ~ i2l'o/P 3,486 3,486 5,210 4,692 518 Marginal workers -g;ofM 2,026 2,026 1,526 1,383 143
~ofF 1,460 1.460 3,684 3,309 375
eil ~ 1'<lO/P 184 184 141 139 2 Cultivators -g;ofM 136 138 60 78 2
~o/F 46 46 61 61
{iil ~~ 1'<lolP 1,200 1,200 528 508 20 Agricultural labourers
tM 1,094 1,094 367 359 8 ofF 106 106 161 149 12
(iii) ql~ql~<h ~ qj1fi i2l'otP 960 960 1,529 1,376 153 Household induslry workers tM 200 200 ISO 136 14
ofF 760 760 1,379 1,240 139
(iv) 3RJ <tJlff i2l'olP 1,142 1,142 - 3,~12 2,669 343 Other worker&; tM 594 594 929 810 119
olF 548 548 2,083 1,859 224
1'.if<~ ClIolP 83,967 83,967 72,604 63,056 9,548 Non-workers tM 29,650 29,650 26,923 23,302 3,621
ofF 54,317 54,317 45,681 39,754 5,927
96
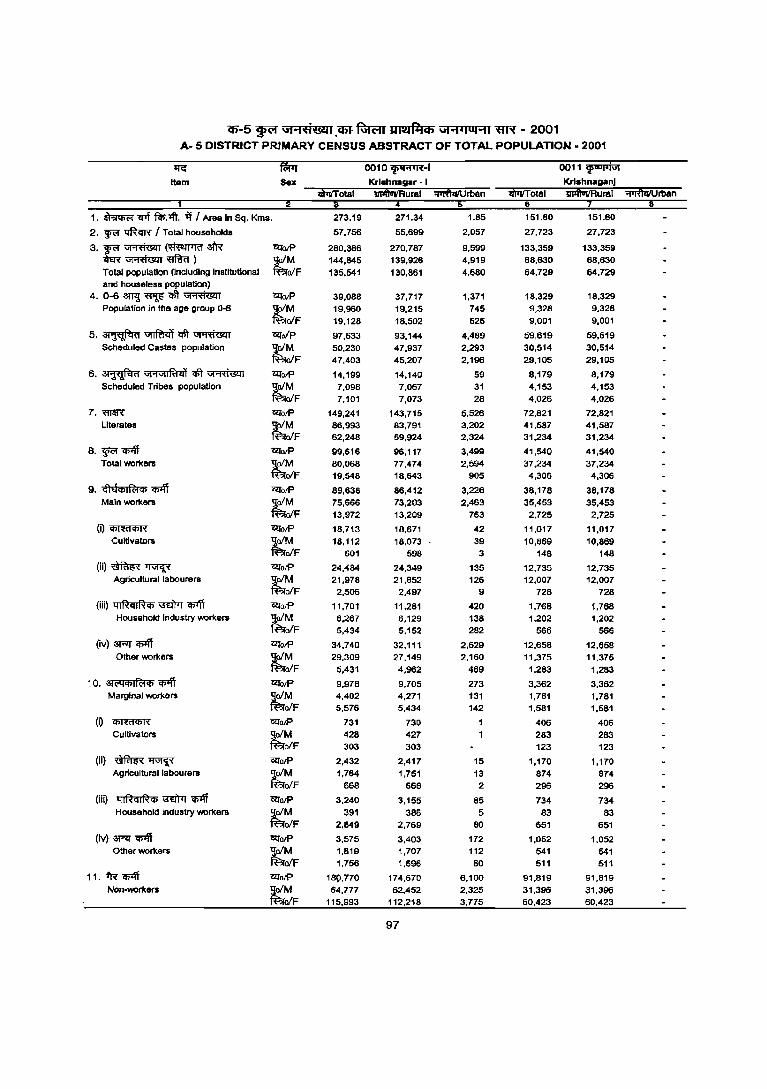
(6"-5 ~ Gt"ifliL<l!I.<6J. Rffi:;rr UI14fl1CfJ Gt"i'ltlI"i1 ~ - 2001 A- 5 DISTRICT PRIMARY CENSUS ABSTRACT OF TOTAL POPULATION - 2001
~ fWT 0010~-1 0011~ Item Sex Krlshnagar • I KrlshnaganJ
lh1i1'Total 1IiitlWiRurai "'I1i6iiIUrnan lh1i1'TOt81 iiPftIiiiRural ~rban
1, ~ If'f ~,1ft, if I Area In Sq, Kms, 273,19 271,34 1,85 151,60 151,60
2, ~ ~ I Total households 57.756 55,699 2,057 27,723 27.723
3'r;~(~afR 'l':!l'o/P 280.386 270,787 9,599 133,359 133,359 ~~) t~F 144.845 139,926 4,919 68,630 68,630
Total population (including Institutional 135.541 130,861 4,680 64,729 64,729 and houseless population)
4,O-6amj~~~ ~otP 39.088 37,717 1,371 18,329 18,329 Population in the age group 0-6 tM 19.960 19,215 745 9,328 9.328
ofF 19,128 18,502 626 9,001 9.001
5,~~~~ ~oIp 97,633 93,144 4,489 59,619 59,619 Scheduled Castes population
~F 50,230 47,937 2,293 30,514 30,5:14 47,403 45,207 2,196 29,105 29,105
6. ~ Vi'1ViIl'a41 ~ ~ ~olP 14,199 14,140 59 8,179 8,179 Scheduled Tribes populatlon
~F 7,098 7,067 31 4,153 4,153 7,101 7,073 28 4,026 4,026
7.~ ~olP 149,241 143,715 5,526 72,821 72,821 Literates tM 86,993 83,791 3,202 41,587 41,587
ofF 62,248 59,924 2,324 31,234 31,234
8. ~ q;1ff ~oIP 99,616 96,117 3,499 41,540 41,540 Total workers ~ 80,068 77,474 2,594 37,234 37,234
ofF 19,548 18,643 905 4,306 4,306
9, ,Mqll~ql q;;ff ~olP 89,638 86,412 3,226 38,178 38,178 Main workers tM 75,666 73,203 2.463 35,453 35,453
ofF 13,972 13,209 763 2,725 2.725
(ij~ ~olP 18,713 18,671 42 11,017 11.017 Cultivators tM 18,112 18.073 39 10,869 10,869
ofF 601 598 3 148 148
(ii)~~ OIiolP 24.484 24,349 135 12,735 12,735 Agricultural labourers tM 21,978 21,852 126 12,007 12,007
ofF 2,506 2,497 9 728 728
(iii) ~ '\RI)rr ~ OIiolP 11,701 11,281 420 1,768 1,768 Household Industry workers tM 6,267 6,129 138 1,202 1,202
ofF 5,434 5,152 282 566 566
(iv) ~ q;;ff C2folP 34,740 32,111 2,629 12,658 12,658 Other workers t~F 29,309 27,149 2,160 11,375 11.375
5,431 4,962 469 1,283 1,283
10, 31t'<lCfiI~ql q;>ff C2folP 9,978 9,705 273 3,362 3,362 Marginal workers tM 4,402 4,271 131 1,781 1,781
ofF 5,576 5,434 142 1,581 1,581
(ij ~ C2folP 731 730 406 406 Cultivators tM 428 427 283 283
ofF 303 303 123 123
(Ii) ~~ C2folP 2,432 2,417 15 1,170 1,170 Agricultural labourers tM 1,764 1,751 13 874 874
ofF 668 666 2 296 296
(iiQ ql~ql~Cfi ~ q;;ff CllolP 3,240 3,155 85 734 734 Household industry workers tM 391 386 5 83 83
'oIF 2,849 2,769 80 651 651
(iv) aRr q;;ff C2fotP 3,575 3,403 172 1.052 1,052 Other workers tM 1,819 1,707 112 541 541
ofF 1,756 1,696 60 511 511
11.fR'II>'ff CllnlP 189.770 174,670 6,100 91,819 91.819 Non-workers tM 64,777 62,452 2,325 31,396 31,396
ofF 115,993 112,218 3,775 60,423 60,423
97
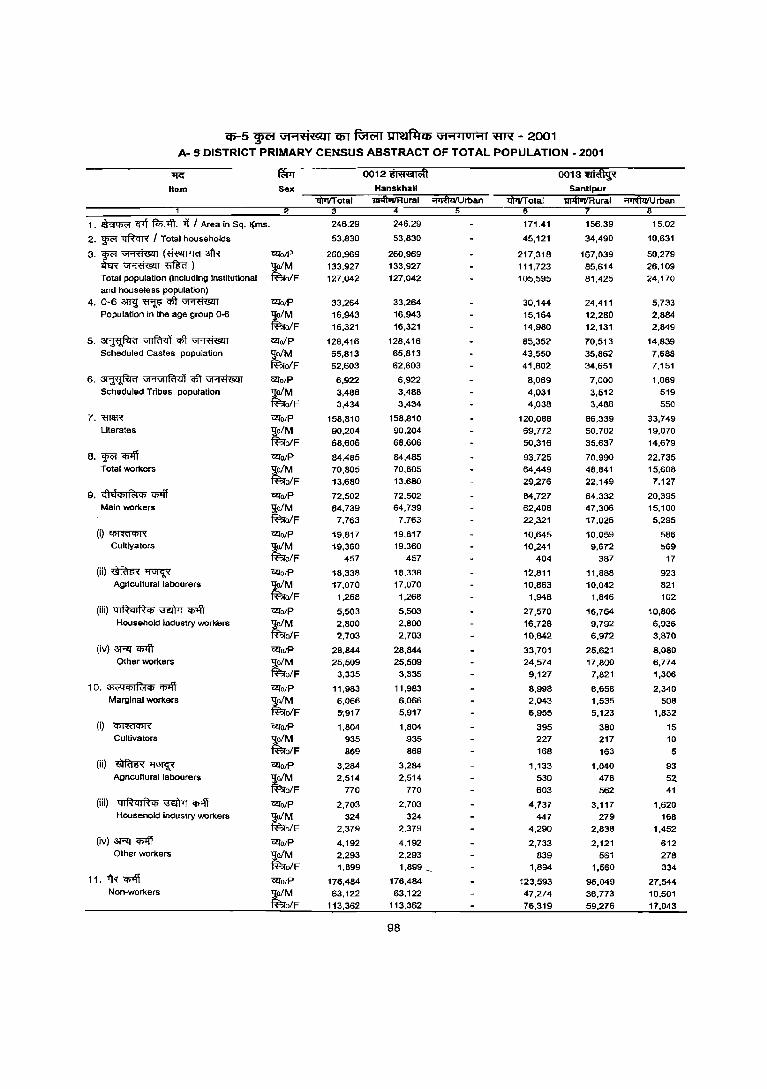
q;-5 WCiI U1"1fl&U C5T furt;rr ~ U1"1"luIPJI ~ - 2001
A- S DISTRICT PRIMARY CENSUS ABSTRACT OF TOTAL POPULATION - 2001
~ fWr 0012~ 0013 iIiifiiii Item Sex Hanskhall Santlpur
WrlTotal !l141UilRural ""~"'Urban 'lIFtrT otal '!I1'ftuTfRural ~rban 3 6 e
1. ~ Cflf f<n.-.fi. ~ I Area in Sq. ~ms. 246.29 246.29 171.41 156.39 15.02
2. ~ ~ I Total households 53.830 53.830 45,121 34,490 10,631
3.~~(~3l'R <2lolP 260,969 260,969 217,318 167,039 50,279 -Qm-~~)
tM 133.927 133,927 111.723 85.614 26.109
Total population (InCluding Institutional olF 127,042 127,042 105.595 81,425 24,170 and houseless population)
4. 0-6 .:m-g ~ q\t ~ "Z2tolP 33,264 33,264 30,144 24,411 5,733 Population in the age group 0-6
tM 16,943 16.943 15,164 12,280 2.884
a1F 16,321 16,321 14,980 12,131 2,849
5.~~q\t~ <2lolP 128,416 128,416 85,352 70,513 14.839 Scheduled Castes population
tM 65,813 65,813 43,550 35,862 7,688
ofF 62.603 62.603 41.802 34.651 7.151
6. ~ VI'1V1IR1lli <1ft ~ <2lo/P 6,922 6.922 8,069 7,000 1,069 Scheduled Tribes population
tM 3,488 3,488 4,031 3,512 519
olF 3,434 3,434 4,038 3,488 550
7. 'ffillf'{ Glfo/P 158,810 158,810 120,088 86,339 33,749 Literates ';!;o/M 90,204 90,204 69,772 50.702 19.070
faalF 68,606 68,606 50,316 35,637 14.679
8. ~ Cjj1ff 'i2forP 84,485 84.485 93.725 70.990 22.735 Total workers
tM 70.805 70,805 64,449 48,841 15,608
a1F 13,680 13,680 29.276 22,149 7,127
9. G"l>l<'PIR:t<l> Cjj1ff <2lorP 72,502 72.502 84,727 64,332 20,395 Main workers ';!;oIM 64,739 64,739 62,406 47,306 15,100
~a1F 7,763 7,763 22,321 17,026 5,295
(i)~ <2lorP 19,817 19,817 10,645 10,059 586 Cultlyators
~ 19,360 19,360 10,241 9,672 569 olF 457 457 404 387 17
(ii)~~ <2lolP 18,338 18,338 12,811 11,888 923 Agricultural labourers
tM 17,070 17,070 10,863 10,042 821
a1F 1,268 1,268 1,948 1,846 102
(iii) 4lRcllfh, ~ Cjj1ff <2lo/P 5,503 5,503 27,570 16,764 10,806 Household industry workers
tM 2,800 2,800 16,728 9,792 6,936
ofF 2.703 2,703 10,842 6,972 3,870
(iv) 3RT <I>'ff GlfolP 28,844 28,844 33,701 25,621 8,080 Other workers ~M 25,509 25,509 24,574 17,800 6,774
olF 3,335 3,335 9,127 7,821 1,306
10. ~('Cj<'PIfc:t", Cjj1ff 'i2fo/p 11,983 11,983 8,998 6,658 2,340 Marginal workers ~M 6,066 6,066 2,043 1,535 508
a1F 5',917 5,917 6,955 5,123 1,832
(i) ~ GlfolP 1,804 1,804 395 380 15 Cultivators ~M 935 935 227 217 10
a1F 869 869 168 163 5
(ii) ~~ <2lolP 3,284 3,284 1,133 1,040 93 Agricultural labourers
tM 2,514 2,514 530 478 5Z
a1F 770 770 603 562 41
(iii) 4IRqIR", ~ -q;-4t <2lorP 2,703 2,703 4,737 3,117 1,620 Household industry workers llolM 324 324 447 279 168
fao/F 2,379 2,379 4,290 2,838 1,452
(iv) 3RT -q;-4t <2lOlP 4,192 4,192 2,733 2,121 612 Other workers
tM 2,293 2,293 839 561 278
ofF 1,899 1,899 _ 1,894 1,560 334
11. 1R -q;-4t Glfo/p 176,484 176,484 123,593 96,049 27,544 Non-workers
tM 63,122 63,122 47,274 36,773 10,501
ofF 113,362 113,362 76,319 59,276 17,043
98
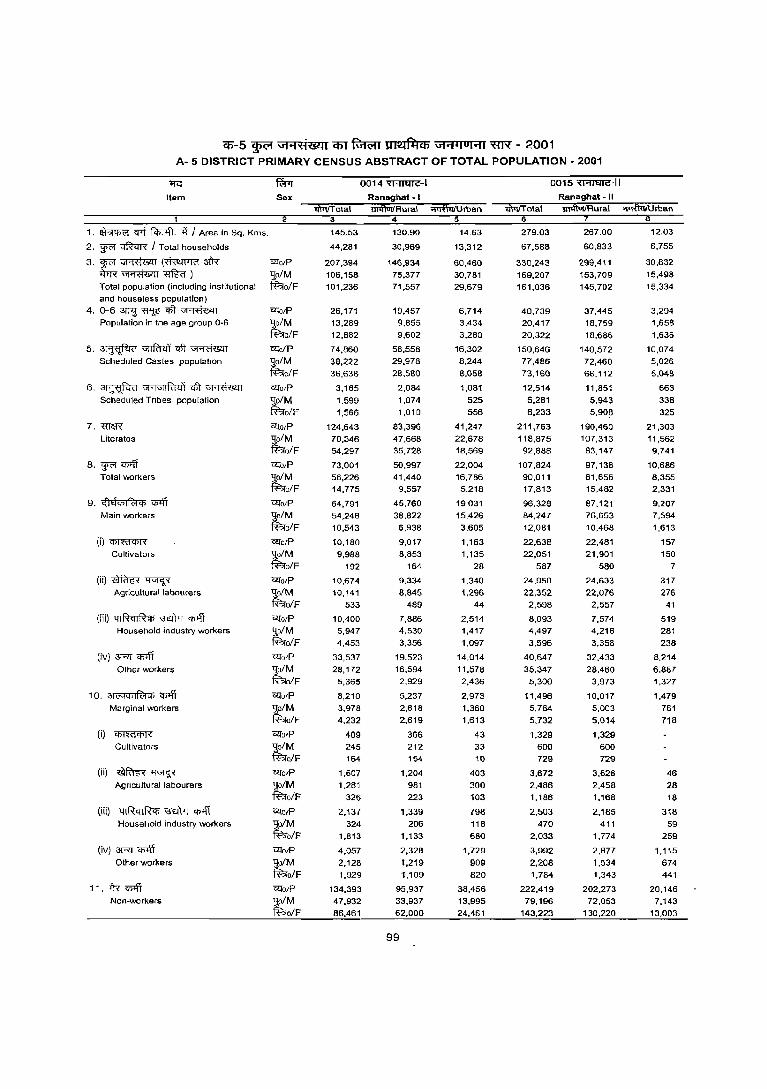
Cff-5 ~ U1"1ti@l1 CffT ~ ~ U1"1'IOI"11 ~ - 2001 A- 5 DISTRICT PRIMARY CENSUS ABSTRACT OF TOTAL POPULATION· 2001
Item
1. ~ <Pi f<l>.-.fi. if I Area in Sq. Kms.
2. ~ ~ I Total households
3.~~(~3tR <hR~~) Total population (including institutional
and hOllseless population)
4. 0-6 3rP;! ~ <tit ~ Population in the age group 0-6
5. ~ vrffi'I<.IT ctt ~ Scheduled Castes population
6. ~ "l'1UjiRidi C!iT ~ Scheduled Tribes population
7. "ffi1!'R Literates
8,~~ Total workers
9. <ihl<t> I ~ <t> 'l>'ff Main workers
(i)~
Cultivators
(ii)~~ Agricultural labourers
(iii) qIRql~'" '3WTf ~ Household industry workers
(iv) 3RJ Cf1Ift Other workers
10. 3\C'll"'Ifc;t$ ~ Marginal workers
(i)~
Cultivators
(ii)~~ Agricultural labourers
(iii) ql~ql~'" ~ Cf>'\T Household industry workers
(iv) 3RJ ~ Other workers
11.-tff~ Non-workers
Sex
C<:fOfP
~o/M fi'?ro/F
C<:fOfP
~o/M fi'?ro/F C<:foip
~o/M fi'?ro/F C<:fOIP
~o/M fBTo/F
C<:folP
~o/M fBTo/F
C<:fOIP
~o/M fBTo/F
C<:fofP
~o/M R'?ro/F
-aforP ~o/M 'fF.;ro/F
-afo/P
1_!o/M 'fF.;rolF
-afo/P
~o/M R'?ro/F C<:fo/P
,!o/M R'?rolF -afo/P
'jo/M 'fF.;ro/F
C<:fo/P 'jo/M fi'?ro/F TIlo/P
,-!o/M R'?ro/F
TIlolP
'jolM 'fF.;ro/F
C<:fo/P
ljoiM R'?ro/F C<:fOJp
ljo/M 'fF.;ro/F
0014~-1
Ransghat ·1
-.wvTotal 3
145.53
44,281
207,394
106,158 101,236
26,171
13,289
12,882
74,860
38,222
36,638
3,165
1.599 1,566
124,643 70,346
54,297
73.001 58,226 14,775
64,791 54,248
10,543
10.180
9,988 192
10,674
10,141
533
10.400 5,947
4.453
33,537
28,172
5,365
8,210 3,978
4,232
409 245
164
1,607
1,281
326
2,137
324 1,813
4,057
2,128 1,929
134,393
47,932 86,461
iiiiftUlIRurai 4
130.90
30,969
146,934
75,377
71.557
19,457 9,855
9,602
58,558
29,978
28,580
2,084
1,074
1,010
83,396 47,668 35,728
50,997
41,440 9,557
45,760 38,822
6,938
9,017 8,853
164
9,334
8,845
469
7,866 4,530
3.356
19.523
16,594
2,929
5,237
2,618
2,619
366 212
154
1,204
981
223
1,339
206
1,133
2,328
1,219
1,109
95,937 33,937
62.000
99
:;;TFft"iiiUrban
14.63
13,312
60,460
30,781 29,679
6,714 3,434
3,280
16,302
8,244
8,058
1,081
525 556
41,247
22,678 18,569
22,004
16,786
5,218
19,031 15,426
3,605
1,163
1,135
28
1,340
1,296
44
2,514 1,417
1.097
14.014
11,578 2,436
2,973
1,360
1,613
43 33
10
403 300
103
798 118
680
1,729
909 820
38,456 13,995 24,461
0015~-11
Ranaghat -II
li\l1iTotal 6
279.03
67,568
330,243 169,207
161.036
40,739
20,417
20,322
150,646
77,486 73,160
12,514
6,281
6,233
211,763
118,875 92,888
107,824
90,011 17,813
96,328 84,247
12,081
22,638
22,051
587
24,950
22,352
2,598
8,093 4,497
3.596
40,647
35,347
5,300
11,496
5,764
5,732
1,329 600
729
3,672 2,486
1,186
2,503
470
2,033
3,992
2,208 1,784
222,419 79,196
143,223
m>ftol/Rural
267.00
60,833
299,411
153,709 145.702
37,445
18,759
18,686
140,572 72,460 68,112
11,851
5.943 5,908
190,460
107,313 83,147
97,138
Bl,656 15,482
87,121 76,653
10,468
22,481 21,901
580
24,633
22,076
2,557
7,574
4,216
3.358
32,433
28,460
3,973
10,017
5,003
5,014
1,329 600
729
3,626 2,458
1,168
2,185
411
1,774
2,877
1,534 1,343
202,273
72,053 130,220
~roan 8
12.03
6,755
30,832
15,498
15,334
3,294 1,658
1,636
10,074
5,026 5,04B
663
338
325
21,303
11,562 9,741
10,686
8,355
2,331
9,207 7,594
1,613
157 150
7
317
276 41
519 281
238
8.214
6,887 1,327
1,479
761
718
46 28
18
318
59
259
1,115
674 441
20,146
7,143 13.003
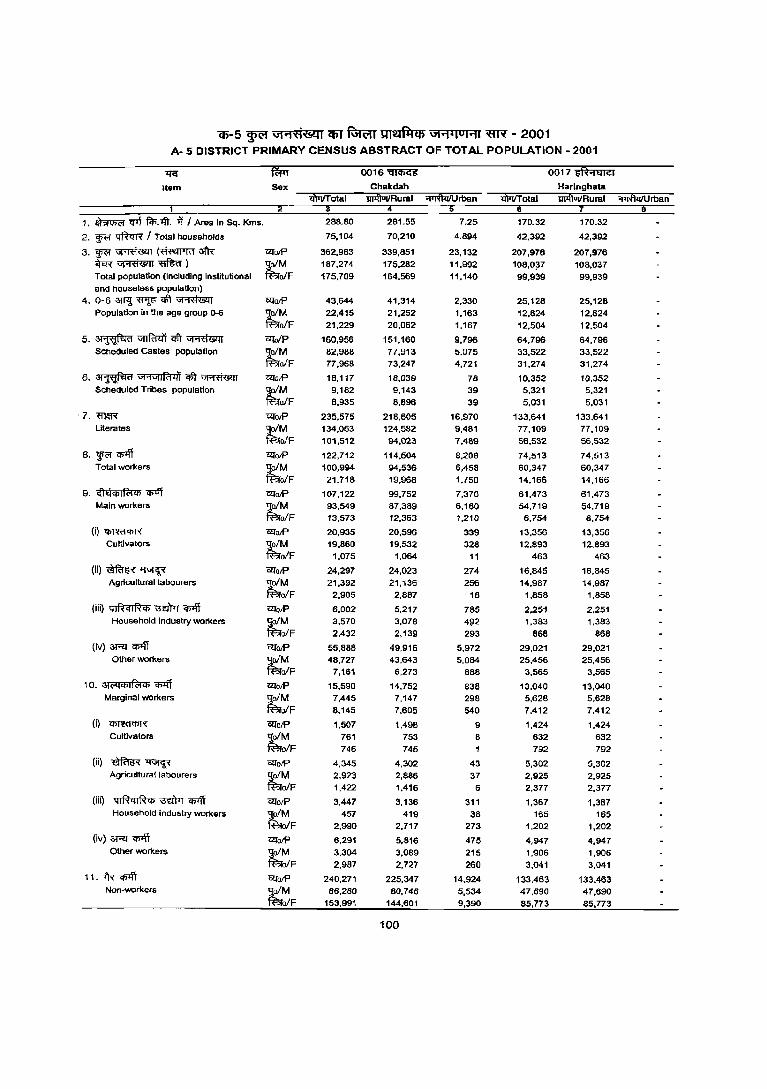
(1)-5 ~ "1'1'ti&l1 CfiT ~ QIe&~Cf) "1'1<101'11 "«R - 2001 A- 5 DISTRICT PRIMARY CENSUS ABSTRACT OF TOTAL POPULATION - 2001
~ ~ 0016~ 001 7 iff.iiiTiT Item Sax Chakdah Harlnghata
titTJlTotal lulj!uilRural ~rban titTJlTotal IIllj!ullRural 'fTRWiUrban 1
1, ~ 'lI"'t f<l>,1fi, Ti I Area in Sq, Kms, 288.80 281-55 7.25 170.32 170.32
2, ~ ~ I Total households 75,104 70,210 4.894 42,392 42,392
3,~~(~31'R Oll'otP 362,983 339,851 23,132 207,976 207,976 W~~) tM 187,274 175,282 11,992 108,0~7 108,037 Total population (including institutional ofF 175,709 164.569 11,140 99,939 99,939 and houseless populaUon)
4. 0'6W!~qft~ OlJotP 43,644 41,314 2,330 25,128 25,128 Population in the age group 0-6
~ 22,415 21,252 1,163 12,624 12,624 olF 21,229 20,062 1,167 12,504 12,504
5.~~ql'r~ C2tu/P 160,956 151,160 9,796 64,796 64,796 SCheduled Castes population tM 82,988 77,913 5,075 33,522 33,522
ofF 77,968 73,247 4,721 31,274 31,274
6, ~ vt'1vtlfcl<j'j c$t ~ OlJotP 18,117 18,039 78 10,352 to,352 SCheduled Tribes population
~ 9,182 9,143 39 5,321 5,321
ofF 8,935 8,896 39 5,031 5,031
7. ml5'< Oll'O/P 235,575 218,605 16,970 133,641 133,641 Literates
~ 134,063 124,582 9,481 77,109 77,109 ofF 101,512 94,023 7,489 56,532 56,532
8, ~ 'I>'ff OlJotP 122,712 114,504 8,208 74,513 74,513 Total workers tM 100,994 94,536 6,458 60,347 60,347
olF 21.718 19,968 1,750 14.166 14,166
9. <fltlCl>If(;(CI> Cf>lff Oll'otP 107,122 99,752 7,370 61,473 61,473 Main workers tM 93,549 87,389 6,160 54,719 54,719
olF 13,573 12,363 1,210 6,754 6,754
(i)~ OlJotP 20,935 20,596 339 13,356 13,356 Cultivators tM 19,860 19,532 328 12,893 12,893
olF 1,075 1,064 11 463 463
(II)~~ Oll'otP 24,297 24,023 274 16,845 16,845 Agricultural labourers tM 21,392 21,136 256 14,987 14,987
ofF 2,905 2,887 18 1,858 1,858
(iii) q I~ q Il'h, \'fdtrr Cf>lff Oll'oIP 6,002 5,217 785 2,251 2,251 Household industry workers tM 3,570 3,078 4\12 1,383 1,383
olF 2,432 2,139 293 868 868 (iV) 3Rl q>Jfl Oll'oIP 55,888 49,916 5,972 29,021 29,021
Other workers
~ 48,727 43,643 5,084 25,456 25,456 ofF 7,161 6,273 888 3,565 3,565
10. <>l«lCl>If(;(C/) q>Jfl Oll'oIP 15,590 14,752 838 13,040 13,040 Marginal workers tM 7,445 7,147 298 5,628 5,628
ofF 8,145 7,605 540 7,412 7,412
(i) ~ Oll'o/P 1,507 1,498 9 1,424 1,424 Cultivators t;:M 761 753 8 632 632
ofF 746 745 792 792
(ii) ~~ Oll'oIP 4,345 4,302 43 5,302 5,302 Agricultura! labourers tM 2,923 2,886 37 2,925 2,925
ofF 1,422 1,416 6 2,377 2,377
(iiQ ql~ql~CI> ~ <i>4l Oll'o/P 3,447 3,136 311 1,367 1,367 Household industry workers tM 457 419 38 165 165
ofF 2,990 2,717 273 1,202 1,202 (iv) 3Rl <i>1fi Oll'otP 6,291 5,816 475 4,947 4,947
Other workers tM 3,304 3,089 215 1,906 1,906 ofF 2,9B7 2,727 260 3,041 3,041
11. -."ff <I>lff Oll'otP 240,271 225,347 14,924 133.463 133,463 Non-workers tM 86,2BO 80,746 5,534 47,690 47,690
ofF 153,991 144,601 9,390 85,773 85,773
100
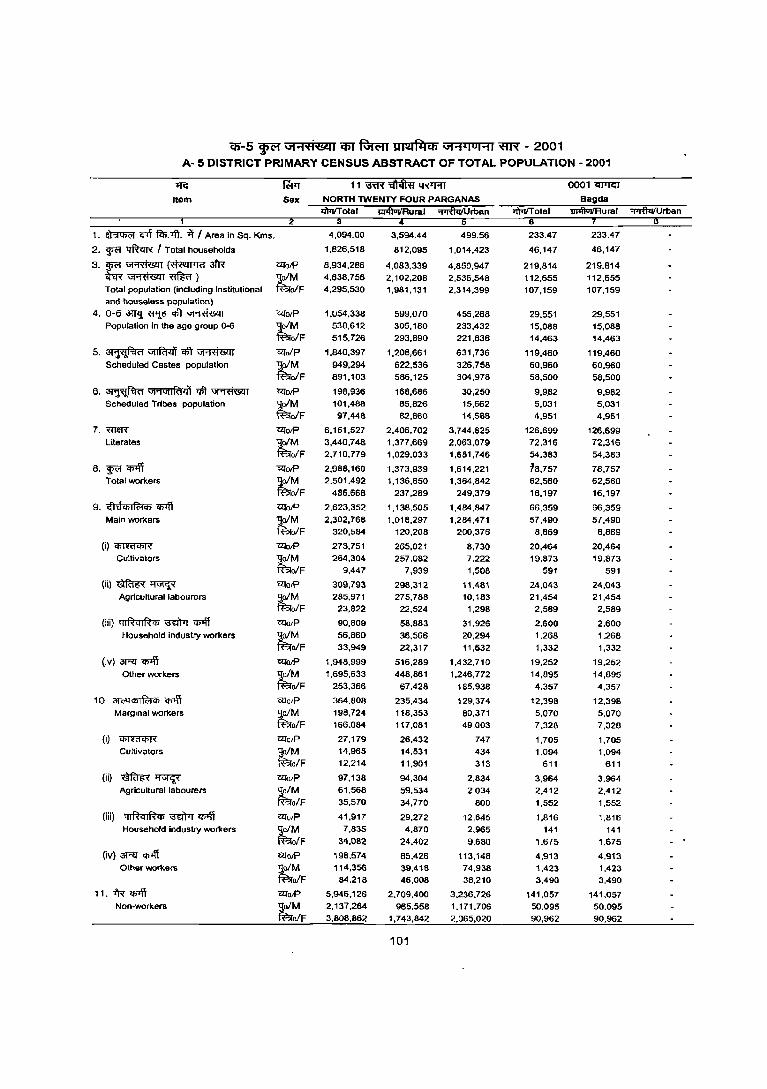
q:;-5 WR GFt'ti&l1 i6T RJR;rr ~ \11'1 010 1"11 ~ - 2001 A- 5 DISTRICT PRIMARY CENSUS ABSTRACT OF TOTAL POPULATION - 2001
m:Item
1. ~ Cflt F<I>.-.ft. ~ I Area in Sq. Kms.
2. ~ 'tIftcrR I Total households
3.~~(~afl< ir<R~~l Total population (including Institutional and houseless population)
4. 0-6 ~ <fIl:5 ql) ~ Population In the age group 0-6
5.~~ql)~ Scheduled Castes population
6. ~ "I'1iJ1lf<i<i! ~ ~ Scheduled Tribes population
7.mm Literates
8. Ff"1l'i'\T Total workers
9. <fI efChI~CI> cn-.ff Main workers
(il <PffifCI>R Cultivators
(iil~~ Agricultural labourers
(iii) 41f.!<'Ilfh ~ 1'f>Iff Household industry workers
(ivl~"1I'i'\T Other workers
10. 31('QChIf<:tCh ~ Marginal workers
(I)~
Cultivators
(ii)~~ Agricultural labourers
(iii) qlRqlRcp ~ q;>ff Household industry workers
Ov) -3f"!! q;ofi Other workers
11. "l't'l~ Non-workers
CZiotP 'JoIM f?;rolF
CZiotP 'Jo/M ~oIF CZiolP 'JoIM ~oIF CljOlP
~oIM ~oIF
CljO/P
llolM ~oIF Oll"otP 'JoIM ~o/F Oll"otP 'JoIM ~oIF
CZlotP 'JoIM ~o/F CZIotP ~oIM ~oIF CZfO/P
1]oIM ~oIF CZl"oiP
1]o/M ~o/F OQO/P
1]o/M ~o/F
Ul"O/P
1]o/M ~o/F Ul"O/P
1]o/M ~o/F
Ul"otP ~o/M ~o/F Ul"otP
golM ~oIF GlI"O/P
-golM ~oIF
4,094.00
1,826,516
8,934.286 4,638,756 4,295,530
1,054,338 538,612 515,726
1,840,397
949,294 891,103
196,936 101,488
97,448
6,151,527 3,440,748 2,710,779
2,988,160 2,501,492
486,668
2,623,352
2,302,768 320,584
273,751 264.304
9.447
309,793 285,971
23,822
90,809 56,860
33,949
1,948,999 1,695,633
253,366
364.B08 198,724 166,084
27,179 14,965
12.214
97,138 61,568
35,570
41,917 7,835
34,082
'98,574 114,356
84,218
5,946,126 2,137,264 3,808,862
3,594.44
612,095
4,083,339
2,102,208 1,981,131
599,070 305,160 293,690
1,206,661
622,536 586,125
168,686 85,826
82,660
2,406,702 1,377,669 1,029,033
1,373,939 1,136,650
237,289
1,138,505
1,018,297 120,208
265,021 257,082
7,939
298,312 275,788
22,524
58,883 36,566
22,317
516,289 448,661
67.428
235.434 116,353 117,081
26,432 14,531 11,901
94,304 59,534 34,770
29,272 4,870
24.402
65,426 39,418 46,008
2,709,400 965,558
1,743,842
101
499.56
1,014.423
4,850,947
2,536,548 2,314,399
455,266 233,432 221,836
631,736
326,758 304,978
30,250 15,662
14,568
3,744,825 2,063,079 1,661,746
1,614,221
1,364,842 249,379
1,484.847 1,284,471
200,376
8,730 7,222 1,508
11,481 10,183
1,298
31,926 20,294
11,632
1,432,710 1,246,772
185,936
129,374
80,371 49,003
747
434 313
2,834 2,034
800
12,6';5 2,965 9,680
113,148 74,938 38,210
3.236,726 1.171,706 2,065,020
233.47
46,147
219,814
112,655 107,159
29,551 15,088 14,463
119,460 60,960
58,500
9,9,82 5,031 4,951
126,699 72,316 54,383
78,757 62,560 16,197
66,359
57,490 8,669
20,464 19,873
591
24,043 21,454
2,589
2,600 1,268
1,332
19,252 14,695
4,357
12,398 5,070 7,328
1,705 1,094
611
3,964
2,412 1,552
1,816
141 1.675
4,913
1,423 3,490
141,057
50.095 90,962
0001~
Bagda ~Rural "I"I'fIWUrtlan
233.47
46,147
219,614
112,655 107,159
29,551 15,088 14,463
119,460 60,960
58,500
9,982 5,031 4,951
126,699 72,316 54,383
78,757 62,560 16,197
66,359
57,490 8,669
20,464 19,873
591
24,043 21.454
2,589
2,600 1.268 1,332
19,252
14,895 4,357
12,396
5.070 7,326
1,705 1,094
611
3.964 2,412 1,552
1,816
141 1.675
4.913 1,423 3,490
141,057 50.095 90,962

q)"-5 ~ "'''NiiLc<ll1 CflT ~ m\11~Cf) "''''~IO[''11 ~ - 2001 A- 5 DISTRICT PRIMARY CENSUS ABSTRACT OF TOTAL POPULATION - 2001
l{G
Item
1. ~ <Pi fi'p.~. >11 Area in Sq. Kms.
2. ~ ~ 1 Total households
3.~~(~afR ~~~) Total population (including institutional and houseless population)
4. 0-6 an<j ~ 'lit ~ Population in the age group 0-6
5.~~'Iit~ Scheduled Castes population
6. ~ \i\'1\i\IRI<ll qft ~ .Scheduled Tribes population
7.m~
Literates
'~. "¥I 'P'ff TotaLworkers
9. ~aq;lf<:I<r> Cfll1l Main WOrkers
(i)~ Cultivators
(ii)~~ Agricultural labourers
(iii) QlfhURq; \ffl'M ~ Household industry workers
(i v) 3Rl Cfilff Other workers
10. 3l~q;lf<:Iq> 'P'ff Marginal workers
(il 1'j)ffifIfjN
CullJVators
(ii)~~ Agricultural labourers
(iii) 1.j~<Il \ffl'M <I\lff Household industry workers
(i v) 3f'"lT Cfilff Other workers
1 L tR Cfl4T Non-workers
Sex
2
1Z!o/p
:!o/M fBfofF
1Z!otP :JoIM fBfofF 1Z!c/P "go/M re:rolF
u<otP ,:;ofM fBofF
ClTotP ,:;o/M re:rolF
1Z!otP ':;o/M fBoIF
U<O/P
~oIM fBfo/F
CllotP ~oIM fBofF
mO/P
'JofM fBofF
mutP 'Jo/M fF-foiF
motP '];o/M fF-fo/F
ClTO/P So/M fF-fofF
mO/P ~o/M !'BrolF
1Z!otP 'lolM !'BrafF
motP 'lo/M fF-fo/F
CZlotP SoIM !'BrofF
CZ[O/P 'l0/M fBofF
i/i1TIT otal
336.70
69,762
344,044 177,696
166,348
44,567 22,831 21,736
161,918
83,366 78,552
10,245
5,232
5,013
211,852
120.468 91,384
120,681 98,190 22.491
101,294
91,320
9,974
31,852
30,903 949
30,913
28,153 2,760
4,211
2,275 1,936
34.318
29.989 4.329
19,367
6.B70
12.517
5.173 1,379 3,794
6,792
3.188
3.604
1,989
248 1,741
5.433 2.055
3.378
223.363 79,506
143,857
0002 CA7Iiq
Bongaon 1I'1'fiuVRurai ~Urban
4
336.70
69,762
344,044
177,696
166,348
44.567 22,831
21,736
161,918
83,366
78.552
10.245 5,232 5,013
211,852
120.468 91,384
120,681 98.190 22,491
101.294
91.320 9,974
31,852
30,903 949
30.913 28,153
2,760
4,211 2,275 1,936
34,318
29,989
4,329
19.387
6.870
12.517
5,173
1,379 3,794
6,792
3,188 3.604
1,989
248 1,741
5,433
2,055
3.378
223.363 79,506
143,857
102
1I'iiiIT otal 6
243.30
63,938
300.588 154,404
146,184
34.983 17,921
17.062
144,293
73,B52 70,441
4,401
2,199 2,202
199,562
112,445
87.117
106,741 86,262
20,479
92,984
80,347 12,637
18,949
18,355
594
23,763
20.887 2,876
5,720 2,874
2,846
44.552
38.231 6,321
13,757
5.915
7.842
876
634 242
5,003 2,713
2,290
2,593
283
2,:310
5.285 2,285
3.000
193.847 68,142
125,705
0003~
Galghata 1Il'flvtIRurai ~Urban
8
240.17
60.509
285,122
146,511
138.611
33.280 17.017
16.263
138.571
70,975
67,596
4.342
2.169 2,173
188,499 106.392
82,107
101.333 81,921
19.412
88,071 76,209 11,862
18.888
16,300
588
23,575
20.715 2,860
5,372 2,719
2.653
40,236
34,475
5,761
13,262
5,712 7.550
867
627 240
4,967
2,690 2,277
2.454 268
2,186
4.974
2.127 2.847
183.789
64.590 119.199
3.13
3,429
15.466 7,893
7.573
1.703
904
799
5.722 2,877
2.845
59
30 29
11.063 6,053
5.010
5.408 4,341
1,067
4,913
4,138 775
61
55 6
188
172 16
348 155
193
4.316 3,756
560
495
203
292
9
7
2
36
23 13
139
15
124
311
158
153
10.058
3,552
6.506
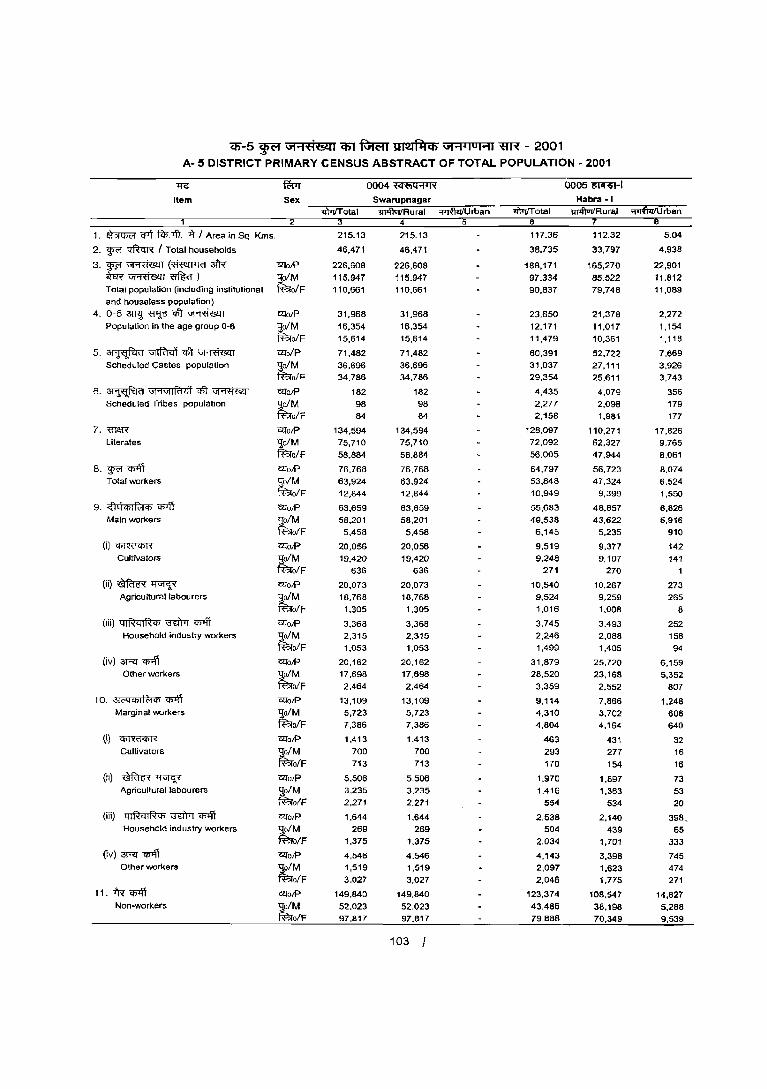
<ff-5 ~ Gi"'1'fiMI C5T fGrc;rr \IM~Cf) Gi"'1'lo l"'tl ~ - 2001
A- 5 DISTRICT PRIMARY CENSUS ABSTRACT OF TOTAL POPULATION - 2001
If<!
Item
1. ~ eM f<n.-.ft. 1'r I Area in Sq Kms.
2. W<'! ~ I Total households
3. WFl ~ (~3fR ~~~) Total population (including institutional
and houselsss population)
4. 0-6 3WJ ~ qft ~ Population in the age group 0-6
5.~~qft~ Scheduled Castes population
6. ~ "l'1"lIRt1l'i qft ~ Scheduled Tribes population
7. 'f!T1IR
Literates
8.¥CI>I'i'i Total workers
9. ~jE\<I>lfclq) CI>I'i'i
Main workers
(i)~
Cultivators
(ii)~~ Agricultural labourers
(Iii) ql~qlR<I> ~ ~ Household industry workers
(iv) 3R<~ Olt1er workers
10. 3lcqC!>lfclQ; CI>I'i'i
Mar9inal workers
(i)~
Cultivators
(il)~~ A9riculturallabourers
(iii) QIR4IR'h ~ ~ Household industry workers
(iv) 3RI~ Other workers
11. 1R q;-.ff Non-workers
Sex
2
ClIo/P
ljoiM fuo/F
ClIo/P
-goiM fuolF ClIo/P
-go/M fuo/F
ClIolP
-go/M mo/F
ClIolP
-go/M mo/F mO/P go/M f'?;;o/F
mO/P go/M mo/F
mO/P go/M fa"o/F
mO/P go/M mo/F
mO/P go/M fuo/F
mO/P go/M f'?;;o/F
mO/P go/M f'?;;o/F
mol? go/M f'?;;o/F
mO/P
'Jo/M fa"o!F mO/P go/M ~o/F molf> 'Jo/M mo/F molf> -go/M mo/F
0004 't<I+>q'1'I~
Swarupnagar lIFtITotal "lIl'l'MIRural ~Urban
3
215.13
46,471
226,608
115,947 110,661
31,968
16,354
15,614
71,482
36,696
34,786
182
98 84
134,594 75,710
58.884
76.768
63,924 12,844
63,659
58,201 5,458
20,056
19.420 636
20.073 18,768
1,305
3,368
2,315 1,053
20,162
17.698
2,464
13,109 5,723
7,386
1,413
700
713
5.506 3,235
2,271
1,644
269
1,375
4,546
1,519
3,027
149,840
52,023
97,817
4
215.13
46,471
226,608
115,947 110,661
31,968
16,354 15,614
71,482
36,696 34,786
182
98
84
134,594
75,710
58,884
76.768
63.924 12,844
63,659
58,201
5,458
20,056
19,420 636
20,073 18,768
1,305
3,368
2,315 1,053
20,162 17,698
2,464
13,109
5,723 7,386
1,413
700
713
5,506
3,235
2,271
1,644 269
1,375
4,546
1,519
3,027
149,840
52.023 97,817
103
lIFtITotal 6
117.36
38,735
188,171
97,334 90,837
23,650
12,171
11.479
60,391 31,037
29,354
4,435
2,277
2,158
128,097 72,092
56,005
64,797
53,848 10,949
55,683
49,538 6,145
9,519
9,248 271
10,540 9,524
1,016
3,745
2,246 1,499
31,879
28,520
3,359
9,114 4,310
4,804
463
293
170
1,970 1,416
554
2,538 504
2,034
4,143
2,097 2,046
123,374
43.486 79,888
0005~-1
Habra -I
112.32
33,797
165,270
85,522 79,748
21,378
11,017
10,361
52,722
27,111 25,611
4,079 2,098 1,981
110,271
62,327
47,944
56,723
47,324 9,399
48,857
43,622
5,235
9,377
9,107
270
10,267 9,259
1,008
3.493 2,088
1,405
25,720
23,168 2,552
7,866
3,702
4,164
431 277
154
1,897 1,363
534
2,140
439 1,701
3.398
1.623 1,775
108,547
38,198 70,349
5.04
4,938
22,901
11.812
11,089
2,272
1,154 1,118
7,669
3,926
3,743
356 179
177
17,826
9,765
8,061
8.074
6,524
1,550
6,826 5,916
910
142
141
1
273 265
8
252
158
94
6,159 5,352
807
1,248
606 640
32 16
16
73 53
20
398,
65
333
745
474 271
14,827
5,288
9,539
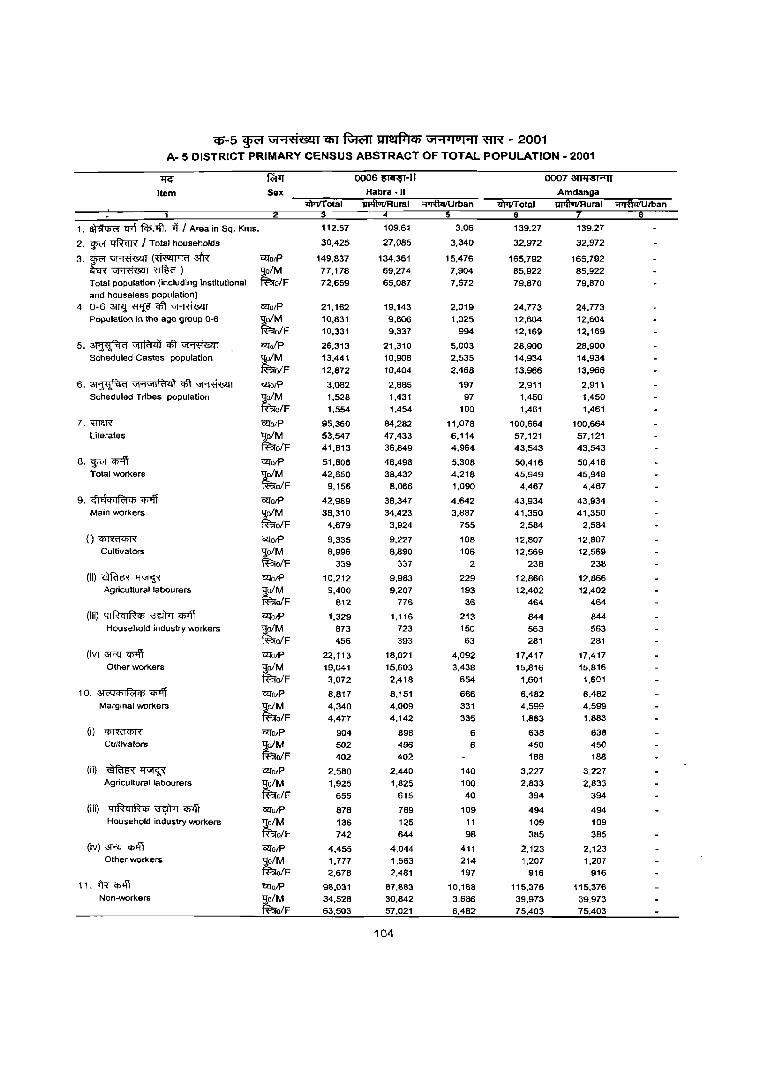
<6-5 ~ \i1"1'<1'(!l11 C6T ~ tmli4Cb \i1"1'IO("11 ~ - 2001 A- 5 DISTRICT PRIMARY CENSUS ABSTRACT OF TOTA.L POPULATION - 2001
~
Item
1. ~ crTi fcI>.>ft. '4 I A'ea in Sq. Kms.
2. ~ 'I!ftcm' J Total househOlds
3. g>R ~ (~3lR ~~~) Tolal population (including institutional
and houseless population)
4 0-63WlWJPCIl't~ Population in the age group 0-6
5.~~CIl't~ Scheduled Castes population
6. ~ "1'1"1 I RI<i'j qft ~ Scheduled Tribes population
7. ~1lR
Literates
8. g>R~ Total workers
9. G~I tl <PI R:t Cf) <iJ1fi Main workers
(i)~ Cu Itivators
(ii)~~ Agricultural labourers
(iii) 41RclJRCI> ~ Cfllff Household industry workers
(iv) 3f"ll' <I>'fi Other workers
10. ::It&4C1>IR:tCl> <I>'fi Marginal workers
(i)~
Cultivators
(ii)~~ Agricultural labourers
(iii) 41~q1R<Ii ~ <l>4T Household industry workers
(iv) 3T ~ <I>'fi Other workers
11. tR Cfllff Non-workers
Sex
ClfO/P
'lofM ~o/F
ClfO/P
'lofM ~oIF
ClfolP
'];ofM ~oIF
ClfoR
'lofM ~o/F
ClfO/P
'loiM ~oIF
ClforP
'loiM ~o/F
ClforP
'loiM ~o/F
ClforP
'lolM ~ofF ClforP
'lo/M ~oIF ClfolP
'loiM ~ofF
ClfolP
'loiM ~oIF ClfO/P
'loiM ~ofF
ClforP
'loiM ~o/F
ClforP
,:!ofM !'BrofF ClfurP
'l0/M !'BrofF ClforP
-go/M ~ofF
'i7lorP
-go/M !'BrofF
>WTrrolal
112.67
30,425
149.837
77,178
72,659
21,162
10,831
10,331
26,313
13.441
12,872
3,082
1,528
1.554
95,360
53.547 41,B13
51,B06
42,650 9,156
42,989
38,310
4,679
9,335
8,996
339
10,212
9,400
812
1,329
873
456
22,113 19,041
3,072
8,817
4,340
4,477
904
502 402
2.580
1,925
655
87B
136
742
4,455
1,777 2,678
98,031 34.528
63,503
0006~-11
Habra ·11
lii1ft1JiIRural ~Urban
109.61
27,085
134.361
69,274
65,087
19,143
9.806
9,337
21,310
10,906
10,404
2,B85
1,431 1,454
84,282
47.433 36,849
46,498
38,432 8,066
38,347
34.423
3,924
9,227
8,890
337
9,983
9,207
776
1,116
723
393
18,021
15,603
2,418
8,151
4,009
4,142
898 496 402
2,440
1,825
615
769
125
644
4,044
1,563 2.481
87,863 30,842
57.021
104
3.06
3,340
15,476
7,904
7,572
2,019 1,025
994
5,003
2,535
2,468
197
97 100
11,078
6,114
4,964
5,308
4,218 1,090
4,642
3,887
755
108
106
2
229
193 36
213
150
63
4,092 3,438
654
666
331
335
6 6
140
100
40
109
11
98
411
214 197
10,168 3,686
6,482
iI)iiI'f olal 6
139.27
32,972
165,792
85,922
79.870
24,773 12,604
12,169
28,900 14,934
13,966
2,911
1,450 1,461
100,664
57,121 43,543
50,416 45,949
4,467
43,934
41,350
2,584
12,807
12,569
238
12,866
12,402
464
844
563
281
17,417 15,816
1,601
6,482
4,599
1,883
638 450
188
3,227
2,833
394
494 109
385
2,123
1,207 916
115,376 39,973
75,403
0007~
Amdanga
i"iilIlViIRural '"iirt\"iifUrban
139.27
32,972
165.792
85,922
79,870
24,773 12,604
12,169
28,900 14,934
13,966
2,911
1,450 1,461
100,664
57,121
43,543
50,416
45,949 4,467
43,934
41,350
2,584
12,807
12,569
238
12,866 12,402
464
844 563
281
17,417
15,816
1.601
6,482
4,599
1,883
638 450
188
3,227
2,833
394
494
109
385
2,123
1,207 916
115,376
39.973
75,403

q;-5 ~ Gt .... 'ti'8ll1 CfiT fGR;:rr UIl!4~q) Gt ..... IUI .... 1 'm'{ - 2001 A· 5 DISTRICT PRIMARY CENSUS ABSTRACT OF TOTAL POPULATION· 2001
'If<:' Item
0008 iiiiiiF'-1 0009~-1I Barrackpur - 11
iiJiI'lVi!Rural ~rban
1. ~ <'flf tm":Ift. 1!i I Area in Sq. Kms.
2. ~ ~ / Total households
3.~~(~~ ~~~) Total population (including institutional and houseless population)
4. 0-6 3lT<j ~ qlT ~ Population in the age group 0-6
5. ~ vrrl'frzi'i crlt ~ Scheduled Castes population
6. ~ \iI'1"1IRi<l) ~~ Scheduled Tribes population
7. mlffi" Literates
8.¥f~ Total workers
9. <f1ej"'I~'" q;<ff Main workers
(i)~
Cultivators
(ii)~~ Agricultural labourers
(iii) qlRqlR", mWT ~ Household industry workers
(iv) 3Rl~ Other workers
10, ~eoq"'i~'" '<ii'ff Marginal workers
(i) CIlffiJCIlR
Cultivators
(ii)~~ Agricultural labourers
Qii) qlRqlR", ~ <!>Iff Household industry workers
(iv) ~ '<ii'ff Other workers
11. fR' q;;ff Non-workers
ClfOlP
~ofM ff;ro/F
ClfO/P
~ofM ff;ro/F Ufo/p ~o/M ff;ro/F
C2l'otP
~o/M ff;rolF
C2l'o/P
~oIM ff;ro/F 'C2fO/P
~o/M ff;ro/F
ClfotP
~ofM ff;rolF
UfOlP
'9;o/M ff;rolF
C2l'otP
~ofM ff;rolF
C2l'otP
'9;oIM ff;rolF
Cl:fotP
101M fi!:iolF
C2l'otP
'9;0/M fi!:iolF Cll'0IP
~oIM fi!:iolF
Cl:folP
~oIM fi!:iolF
12l'oIP qolM fi!:iolF Cll'otP
~oIM fBToIF moR '9;oIM fi!:iolF
89.45
32,846
157,047 81,139
75,906
17,025 8,726 8,299
43,847 22,614 21.233
6.278 3.237 3,041
112,079 62,403 49,676
53.341 44,739
8,602
44,034 38,884
5.150
4,561 4,324
237
6,273 5,618
655
1,355 810 545
31.845 28,132
3,713
9,307
5.855 3,452
459
228 231
2,426 1,840
586
829 196 633
5,593 3,591 2.002
103,706 36,400 67,306
77.84
23,373
112,882 58,510
54,372
13,047 6,664 6,383
35,676 18,417 17.259
4.905 2,502 2,403
77,571 43,770 33.801
38,797 32,714
6,083
32,558 28,841
3.717
4,431 4,203
226
6,018 5.372
646
920 584 336
21,189 18,682 2,507
6,239 3,873 2,366
442 214 228
2,242 1,712
530
420 96
324
3,135 1,851 1,284
74,085
25,796 48,289
105
11.61
9,473
44,165 22,629 21,536
3,978 2,062 1,916
8,171 4,197 3,974
1,373 735 638
34,508 18.633 15,B75
14.544 12,025
2,519
11,476 10,043
1.433
130 121
9
255 246
9
435 226 209
10,656 9,450 1,206
3,068 1,9B2 1.0B6
17
14 3
184 128
56
409 100 309
2,458 1,740
718
29,621 10,604 19,017
40.74
33,684
158,827 82,557
76,270
17,401 8,930 8,471
41,044 21,112 19,932
2,392 1,309 1,083
113,220 63,216 50.004
52,373 44,379
7,994
45,318 40,024
5,294
1,846 1,730
116
1,094 1,026
68
1,325 758 567
41,053 36,510 4,543
7,055 4,355 2,700
441 236 205
441 343
98
701 128 573
5,472 3,648 1,824
106,454 38,178 68,276
32.02
16,922
80,716 42,160 36,556
8,858 4,507 4,351
15,969 8,324 7,645
1,023
588 435
57,374 32,231 25,143
26,199 22,642
3,557
22,513 20,321
2,192
1.737 1,647
90
981 942
39
692 410 282
19,103 17,322
1,781
3,686 2,321 1,365
431
229 202
348 289
59
298 56
242
2,609 1,747
862
54,517 19,518 34,999
8.72
16,762
78,111 40,397 37,714
8,543 4,423 4,120
25,075 12,788 12,287
1,369
721 648
55,846 30.985 24,861
26,174 21,737
4,437
22,805 19,703 3,102
109 83 26
113 84 29
633 348 285
21,950 19,188 2,762
3,369 2,034 1.335
10 7 3
93 54 39
403 72
331
2,863 1,901
962
51,937 18,660 33,277

q:;-5 wc;r ""<::!fl'L411 q;r ~ 1m!OI~Cb """1'lloHI ~ - 2001 A- 5 DISTRICT PRIMARY CENSUS ABSTRACT OF TOTAL POPULATION - 2001
11<:"
Item
1. ~ -errt fc!>.-.fi. i'i / Area in Sq. Kms.
2. ~ ~ I Total households
3. ~ ~ (~~l'T<! 3i'R W~~) Total population (including institutional and houseless population)
4. 0-6 awj ~ qft ~ Population in the age group 0-6
5.~~~~ Scheduled Castes population
6. ~ vl'l;;;JIRlll'i '1ft ~ Scheduled Tribes population
7. if!T~ literates
8. ~ q;;ff Total workers
9. cf1Qq;I~<I> q;;ff Main workers
(i) cnmJ<I>l'<'
CUltivators
(ij)~~ Agricultural labourers
(iii) 41RqlR<I> ~ <I>""'fi Household industry workers
(iv) ~. q;;ff
Other workers
10. 3l('qQ;1f{;jq; q;;ff Marginal workers
(i)~
Cultlvalors
(ii)~~ Agricultural labourers
(iiO 41RqlR<I> ~ cp>ff Household industry worKers
(iv) 3Rf cp>ff Other workers
1 1. i'R cp>ff Non-workers
Sex
2
C;UaiP
llo/ M fF-<o/F
C;UO/P
llo/ M fF-<o/F c;uolP
llo/ M fF-<o/F CllO/P
'Jo/ M fF-<o/F C;UotP
,:!o/M fF-<o/F C;UotP
llo/M fF-<o/F CllO/P
'Jo/M IF..oIF
CllotP
';!o/M "fF.<o/F
CllO/P
'J0 / M "fF.<o/F
C;UO/P
llo/M "fF.<o/F C;UotP
llo/M IF..o/F C<TotP ,:!o/M IF..oIF
C<TotP
101M "fF.<o/F
C<TotP "9;o/M "fF.<o/F C;UOIP
'9;o/M "fF.<o/F C<TotP ,:!o/M "fF.<o/F C<TO/P
,:!o/M "fF.<o/F
'lITrvTotal 3
104.97
48,478
236,075 122,762 115,313
32,354 16,290
16.064
37,075
18,980 18,095
3,079 1,515
1,564
150,805 B3,949 66,856
79,160
65,925 13,235
67,920 59,810
8,110
8,460 8,224
236
7,560 7,427
133
3,302 2,203
1,099
48,598 41.956
6,642
11,240 6,115 5,125
473 304 169
2,159
1,964 195
2,025
311 1,714
6,583
3.536 3,047
158,915 56,837
102,078
00 1 0 iI'I'mmr-1 Barasat -I ~Rural "I'l'futIUrban
101.68
43,907
21B,199 112,640 105,559
30,523 15,344
15,179
33,812
17,349 16,463
3,029 1,488
1,541
135,620 75,773 59,847
72,522
60,404 12,118
61,666 54,495
7,171
8,391 8,162
229
7,446 7,321
125
3.009 2,014
995
42,B20
36.998 5,822
10,856 5,909 4,947
467
299 168
2,137
1,944 193
1,963
302 1,661
6,289 3.364 2,925
145,677 52,236 93,441
106
3.29
4,571
19,876 10,122
9,754
1,831 946
a85
3,263
1,631 1,632
50 27
23
15.185 B,176 7,009
6,638
5,521 1,117
6,254 5,315
939
69
62 7
114 106
8
293
189 104
5.778 4.958
820
384 206 178
6
5
22 20
2
62
9 53
294 172
122
13,238 4,601 8,637
'lITrvT otal
114.04
30,597
169,098 88,290 80,808
28,474
14,567 13,907
17,755 9,319
6,436
2,926 1,497
1,429
96.984 55,947 41,037
52,067
45.036 7,031
43,425 39,561
3,864
9,112 8,913
199
9,949 9,776
173
945 576 369
23,419 20,296
3,123
8,642 5,475 3,167
589 506
83
3,108
2,833 275
1,227
104 1,123
3,718 2,032
1,686
117,031 43,254 73,777
0011 "ilRffiffl-1i Barasat -II 1IJ1ltvrIRurai 'l"'RlttIUrban
114.04
30,597
169,098 88,290 80,808
28,474 14,567 13,907
17,755 9,319 8,436
2,926 1,497
1,429
96,984
55,947 41,037
52,067
45.036 7,031
43,425 39,561
3,864
9,112 8,913
199
9,949 9,776
173
945
576 369
23,419 20,296
3,123
8,642 5,475 3,167
589
506
83
3,108 2,833
275
1,227
104 1,123
3,718 2,032 1,686
117,031 43,254 73,777
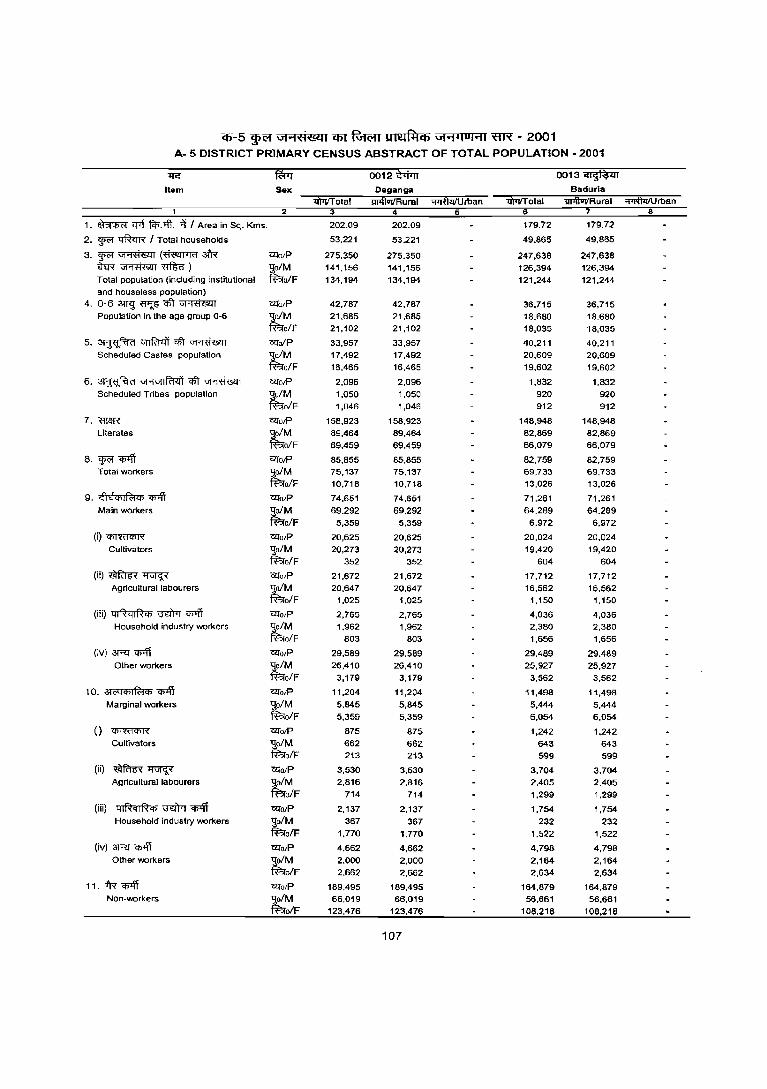
cp-5 WN U1"1-H'L"ll1 i6T ~ UI~~CIl UF1~lol""l 'ffR - 2001 A- 5 DISTRICT PR1MARY CENSUS ABSTRACT OF TOTAL POPULATION - 2001
'IlG fWT 0012 fIii1T 0013~ Item Sex Oeganga Baduria
lWTrTotal iIi1fiVIfRural "'Ilrl'i1i/U rban ihiTIi'otal "!ii1l\VT/Rural ~rban , 2 3 4 6 8
1. ~ l'fli tlP.lfi. l'i I Area in Sq. Kms. 202.09 202.09 179.72 179.72
2. g><'f ~ I Total households 53,221 53,221 49,865 49,865
3. g><'f ~ (~ 3i'R C2l0/P 275,350 275,350 247,638 247,638 ihR~~) tM 141,156 141,156 126,394 126,394
Total population (including institutional olF 134,194 134,194 121,244 121,244 and houseless population)
4. 0-6 3ll<J ~ qft ~ C2l0/P 42,787 42,787 36,715 36,715 Population in the age group 0-6 tM 21,685 21,685 18,680 18,680
olF 21,102 21,102 18,035 18,035
5.~~qft~ C2lo/P 33,957 33,957 40,211 40,211 Scheduled Castes population tM 17,492 17,492 20,609 20,609
olF 16,465 16.465 19,602 19,602
6. ~ VI'1'JII i7F.l'i qft ~ C2l0/P 2,096 2,096 1,832 1,832
Scheduled Tribes population tM 1,050 1,050 920 920 olF 1,046 1,046 912 912
7. mllR C2lolP 158,923 158,923 148,948 148,948
Literates tM 89,464 89.464 82,869 82,869
olF 69,459 69.459 66,079 66,079
8.~~ C2lolP 85,855 85,855 82,759 82,759 Total workers ~M 75,137 75,137 69,733 69,733
olF 10,718 10,718 13,026 13,026
9, i~h:!c"'IR:tCf) ~ C2l01P 74,651 74,651 71,261 71,261
Main workers tM 69,292 69,292 64,289 64,289
olF 5,359 5,359 6,972 6,972
(~~ C2l0/P 20,625 20,625 20,024 20,024 Cultivators ~o/M 20,273 20,273 19,420 19,420
fBl"o/F 352 352 604 604
(ii)~~ mOIP 21,672 21,672 17,712 17,712
Agricultural labourers tM 20,647 20,647 16,562 16,562 olF 1,025 1,025 1,150 1,150
(iii) 4IRcHR4i ~ ~ mOIP 2,765 2,765 4,036 4,036 Household industry workers tM 1,962 1,962 2,380 2,380
olF 803 803 1,656 1,656
(iv)~ct>-.ff mOIP 29,589 29,589 29,469 29,489 Other workers tM 26,410 26,410 25,927 25,927
olF 3,179 3,179 3,562 3,562
10, al",",4iIR:t4i <I>4T molP 11,204 11,204 11,498 11,498
Marginal workers tM 5,845 5,845 5,444 5,444 olF 5,359 5,359 6,054 6,054
(i) ~ mO/P 875 875 1,242 1,242 Cultivators
~ 662 662 643 643 ofF 213 213 599 599
(ii) ~~ mO/P 3,530 3,530 3,704 3,704 Agricultural labourers tM 2,816 2,816 2,405 2.405
olF 714 714 1,299 1,299
(iii) q IR q IRq; \3"Wrr <I>4T C2l0/P 2,137 2,137 1,754 1,754 Household industry workers tM 367 367 232 232
olF 1,770 1,770 1,522 1,522
(iv)~ct>-.ff molP 4,662 4,662 4,798 4,798 Other workers tM 2,000 2,000 2,164 2,164
ofF 2,662 2,662 2,634 2,634
11.fR~ mO/P 189,495 189,495 164,879 164,879 Non-workers tM 66,019 66,019 56,661 56,661
ofF 123,476 123,476 108,218 108,218
107
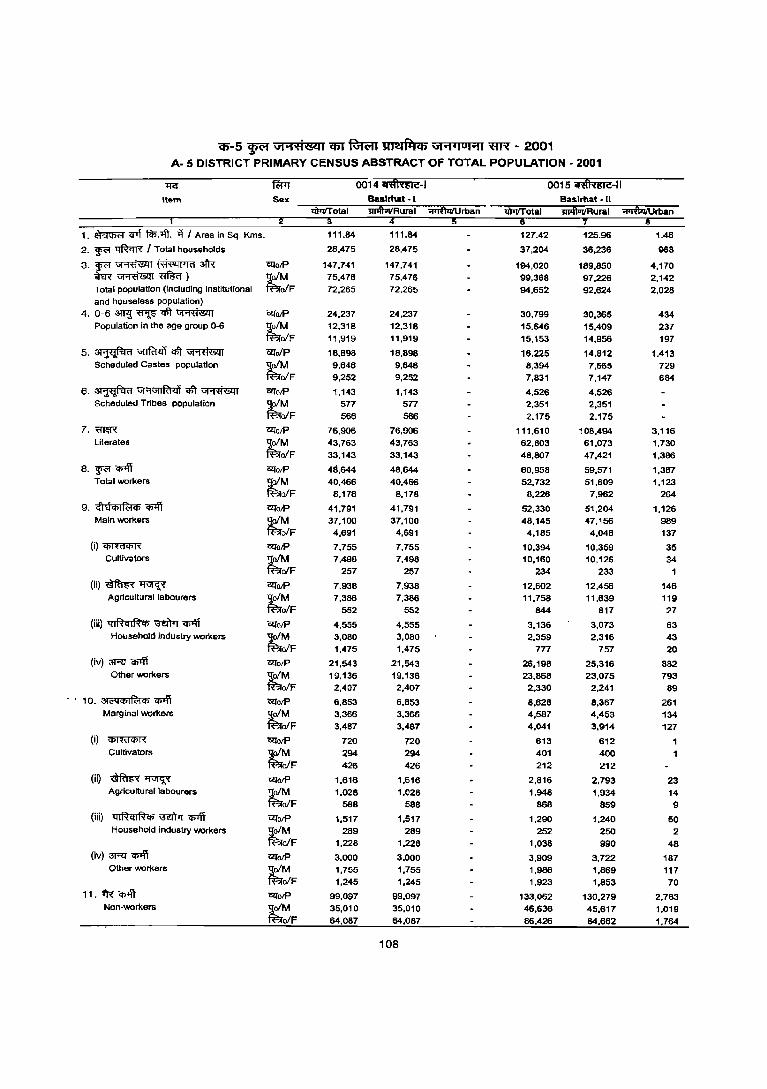
en-5 ~ Gt"'~~1 C6T ~ JlI"Ifq<b Gt .... IUHI ~ - 2001 A- 5 DISTRICT PRIMARY CENSUS ABSTRACT OF TOTAL POPULATION - 2001
llC{ fWJ oo14~-1 001 IS ii'lff.iiii-il Item Sex Baslrtlat - I Baslmat-Il
ul4IOIIRural lu41ou'Rural ~rban
1. ~ crrt ftl>.1fi. i\ I Area in Sq. Kms. 111.84 111.84 127.42 125.96 1.46
2. ~ '!Jft<rR I Total households 28.475 28,475 37,204 36,236 968
3.~~(~m CZJolP 147,741 147,741 194,020 189,850 4,170 m~~) tM 75,476 75,476 99,368 97,226 2,142 Total population (Including institutional ofF 72.265 72,265 94,652 92.624 2,028 and houseless population)
4. 0-6 an<J; ~ qIl ~ CZJOIP 24,237 24,237 30,799 30,365 434 Population in the age group 0-6 tM 12.318 12,318 15.646 15,409 237
ofF 11,919 11,919 15.153 14.956 197
5.~~<fit~ CZJoIP 18.898 18,898 16,225 14,812 1,413 Scheduled Castes population tM 9,646 9,646 8,394 7,665 729
ofF 9,252 9,252 7,831 7,147 684
6. ~ vl'l"1If<'1<it qft ~ CZJoiP 1,143 1,143 4,526 4,526 Scheduled Tribes population tM 577 577 2,351 2,351
ofF 566 566 2,175 2,175
7,~ CZJoiP 76,906 76,906 111.610 108,494 3.116 Literates tM 43,763 43,763 62,803 61,073 1,730
ofF 33,143 33.143 48,807 47,421 1,386
8. ~ q;<ff CZJo/P 48,644 48.644 60,958 59,571 1,367 Total workers tM 40,466 40.466 52,732 51,609 1,123
ofF 8.178 8.178 8,226 7,962 264
9. <;1 el4>I~4> q;<ff CZJoiP 41.791 41,791 52,330 51.204 1.126 Main workers
t~F 37.100 37,100 48,145 47,156 989 4,691 4,691 4,185 4,046 137
(i)~ illJoiP 7.755 7.755 10,394 10,359 35 Cultivators tM 7,498 7,498 10,160 10,126 34
ofF 257 257 234 233
(ii)~~ 'al0lP 7.938 7.938 12.602 12.456 146 Agricultural labourers tM 7,386 7,386 11,758 11,639 119
oIF 552 552 844 817 27
(iii) 41~qIR4> ~ Cf>1\T illJoiP 4.555 4,555 3,136 3,073 63 Household industry workers tM 3,060 3,080 2,359 2.316 43
ofF 1.475 1,475 777 757 20 (iv) 3R1 q;<ff mO/P 21,543 21,543 26,198 25,316 882
Other workers ;tM 19.136 19.136 23.868 23.075 793 oIF 2,407 2,407 2,330 2.241 89
1 O. 31 <'4 4>1 fa 4> <I>Iff illJoiP 6.853 6.653 8.628 8,367 261 Marginal workers tM 3,366 3.366 4,587 4,453 134
oIF 3.487 3,487 4,041 3,914 127
(i) ~ 'alolP 720 720 613 612 Cultivators
~F 294 294 401 400 426 426 212 212
(iQ ~~ CZJolP 1,616 1,616 2,816 2,793 23 Agricultu rallabourers tM 1,028 1,028 1.948 1,934 14
ofF 588 588 868 859 9 (iii) 41RqlR<I> \JffiTr q,4J molP 1,517 1,517 1.290 1.240 50
Household industry workers tM 289 289 252 250 2 oIF 1.228 1,228 1,038 990 48
(iv) 3R1 <I>Iff illJolP 3.000 3,000 3.909 3.722 187 Other workers tM 1,755 1,755 1.986 1,869 117
oIF 1,245 1,245 1,923 1.853 70 11. ~ '(j)1ff 'alolP 99.097 99,097 133,062 130,279 2.783
Non-workers ~M 35,010 35,010 46,636 45,617 1.019 oIF 64,087 64,087 86.426 84,662 1,764
108

CIi"-5 ~ ut ... ti&ll iIiT R;wrr 1Il".!lIliCh ut .... IUI ... 1 ~ - 2001 A- 5 DISTRICT PRIMARY CENSUS ABSTRACT OF TOTAL POPULATION - 2001
11<:" ~ oo16~ 0017 ,(1V1I'<i'le
Item Sex Haroa RaJarhat il)Ilff otal 1"ITIftUl/Rurai ~rban il)Ilffotal liJifilIiIRural ::t1iiIli/IJ rban
1
1. ~ "i:f'f fIp.~. t!i / Area In Sq. Kms. 152.73 152.73 72.90 71.33 1.57
2. ~ ~ I Total households 33,891 33,891 28,766 27,563 1,203
3.~~(~afR CllolP 182,522 182,522 145.381 138,652 6,729 ffi~~) ~ 94,270 94,270 75,218 71,782 3,436 Total popUlation (including institutional ofF 88,252 88,252 70,163 66,870 3,293 and houseless population)
4.0-6~~*t~ CllolP 30,596 30,596 20,711 19,615 1,096 Population in the age group 0-6
~ 15,641 15,641 10,554 9,988 566
ofF 14,955 14,955 10,157 9,627 530
5.~~cnt~ <!I"oIP 45,332 45,332 52,233 52,213 20 SCheduled Castes population
~ 23,500 23,500 26,882 26,877 5 ofF 21,832 21,832 25,351 25,336 15
6. ~ \if'1\ifIRt<li qlt ~ CllolP 10,962 10,962 938 938 SCheduled Tribes population tM 5,612 5,612 550 550
ofF 5,350 5,350 388 388
7.~ "l':!:I"olP 95,441 95,441 92,733 89,075 3,658 Literates tM 56,348 56,348 52,546 50,569 1,977
elF 39,093 39,093 40,187 38,506 1,681
8. ~ q;1ff <!I"olP 58,074 58,074 43.918 42.054 1,864 Total workers r 49,091 49,091 39,112 37,358 1,754
elF 8,983 8,983 4,806 4,696 110
9. ctle!<t>IRt<t> <I>"'ff OllalP 47,379 47,379 38,362 36,583 1,779 Main workers tM 43,442 43,442 34,924 33,241 1,683
ofF 3,937 3,937 3,438 3,342 96
(i)~ OllolP 10,700 10,700 3,890 3,875 15 Cultivators tM 10,348 10,348 3,730 3,717 13
ofF 352 352 160 158 2
(ii)~~ <!I"alP 14,267 1'\,267 5,623 5,562 61 Agricultural labourers ;tM 13,452 13,452 5,435 5,378 57
ofF 815 ~15 188 184 4
(iii) QIRqIR<t> ~ Cfi1ff OlloJP 1,792 1,792 2,004 1,949 55 Household Industry workers
~F 1,184 1,164 1,712 1,666 46 608 608 292 283 9
(iv) 3Ft! ~ "l':!:I"olP 20,620 20,620 26,645 25,197 1,648 Other workers ;tM 18,458 18,458 24,047 22,4BO 1,567
ofF 2,162 2,162 2,798 2,717 81
10. 0It'<l<t>1~<t> <I>"'ff OlloJP 10,695 10,695 5,556 5,471 85 Marginal workers tM 5,649 5,649 4,188 4,117 71
elF 5,046 5,046 1,368 1,354 14
(i) ~ tzrolP 824 824 371 371 Cultivators
t~F 497 497 262 262 327 327 109 109
(ii) ~~ "l2folP 4,778 4,778 1,594 1,591 3 Agricultural labourers ;tM 3,033 3,033 1,373 1,370 3
ofF 1,745 1,745 221 221
(iii) QI~ql~<t> ~ <Ii1ff tzroJP 1,389 1,389 515 510 5 Household industry work~rs ;tM 275 275 249 248
ofF 1,114 1,114 266 262 4
(iv) 3Ft! ~ tzroJP 3,704 3,704 3,076 2,999 77 Other workers ~M 1,644 1,644 2,304 2,237 67
ofF 1,860 1,860 172 762 10
1 1. i'R" <Il'ff tzr6lP 124,448 124.448 101,463 96,598 4.865 Non-workers tM 45,179 45,179 36,106 34,424 1,682
ofF 79,269 79,269 65,357 62,174 3,183
109

q;:..5 ~ Ui .... 'l"iOBaI cor ~ ~ Gl"'1 l loHI 'RR - 2001 A- 5 DISTRICT PRIMARY CENSUS ABSTRACT OF TOTAL POPULATION - 2001
1J<:" IW1 0018~ 0019 <i~{,''I!l,Ji-1 Item Sex Mlnakhan 5andeshkhall - I
lITrlfTotal ~Rural ~Urban iiiiiIT otal m>ftuIfRural ~rban 1
1. ~ Cflt fq;A'l. -q I Area in Sq. Kms. 158.82 158.82 182.30 182.30
2. W<" ~ I Total households 30,956 30,956 26,192 26,192
3.W<"~(~~ CIliJJP 168,965 168,965 140,476 140,476 W~~)
~ 87,199 87,199 71,961 71,961 Tolal population (including institutional o/F 81,766 81,766 68,515 68,515 and houseless population)
4. 0-6 3m_! ~ qfi ~ C210JP 31,682 31,682 24,156 24,156 Population in the age group 0-6
~ 15,984 15,984 12,208 12,208 ofF 15,698 15,698 11,948 11,948
5. ~~cf,t~ 12JofP 52,857 52.857 45,308 45,308 Scheduled Castes population r;: 27.586 27.586 23,462 23,462
olF 25,271 25,271 21,846 21,846
6. ~ VI'1GtIRl<if qfi ~ 12Jo/P 17,547 17.547 36,488 36,488 Scheduled Tribes population
~ 8,969 8.969 18,552 18,552
olF 8,578 8.578 1'7,936 17,936
7. W!W[ C210/P 80,518 80,518 67,992 67,992 Literates
~ 49,314 49.314 41,888 41,888 ofF 31,204 31.204 26,104 26,104
8. W<"~ 12JoiP 51,866 51,866 47,040 47,040 Total workers tM 44,110 44,110 37.132 37.132
olF 7,756 7.756 9.908 9,908
9. <flt1cllJ~CP ~ 12JaiP 42.271 42,271 35.606 35.606 Main workers
~ 38.000 38.000 31.587 31,587 olF 4,271 4.271 4,019 4,019
(O~ 12JoiP 8.964 8,964 6,638 6.638 Cultivators
~ 8.683 8.683 6.375 6.375 ofF 281 281 263 263
(ii)~~ CZTolP 14,695 14,695 12,368 12,368 Agricultural labourers
~ 13,728 13,728 10,713 10.713 ofF 967 967 1,655 1,655
(iii) 41f'l:qlf'l:cp ~ CJ5lfi 12JoiP 810 810 789 789 Household industry workers
~ 589 589 389 389
ofF 221 221 400 400
(iv)~~ C2!o/P 17,802 17,802 15,al1 15.811 Other workers tM 15,000 15,000 14,110 14,110
olF 2,802 2,802 1.701 1.701
10. ¢I('q<t>lfclcp ~ C210iP 9.595 9,595 11.434 11,434 Marginal workers
~ 6.110 6.110 5.545 5.545 ofF 3,485 3,485 5.689 5,669
(i) mmfCIiR 'C21'o/P 1.143 1.143 1,192 1.192 Cultivators r:: 848 846 674 674
ofF 295 295 518 518 (ii) ~~ 12JoiP 6.445 6.445 6.613 6,813
Agricultural labourers
~ 4,018 4.018 3.475 3.475
ofF 2,427 2.427 3,338 3,338
(iii) qlRqlRcp ~<I>'l"i C210/P 304 304 449 449 Household industry WQrkers
~ 57 57 64 64 ofF 247 247 385 385
(iv)~~ 12JoiP 1,703 1.703 2.980 2,980 Other workers ~M 1.187 1.187 1.332 1.332
ofF 516 516 1,648 1.648 11.i'R"~ 12JoiP 117.099 117.099 93.436 93.436
Non-workers ~M 43,089 43,089 34,829 34.829 ofF 74.010 74,010 58,607 58,607
110
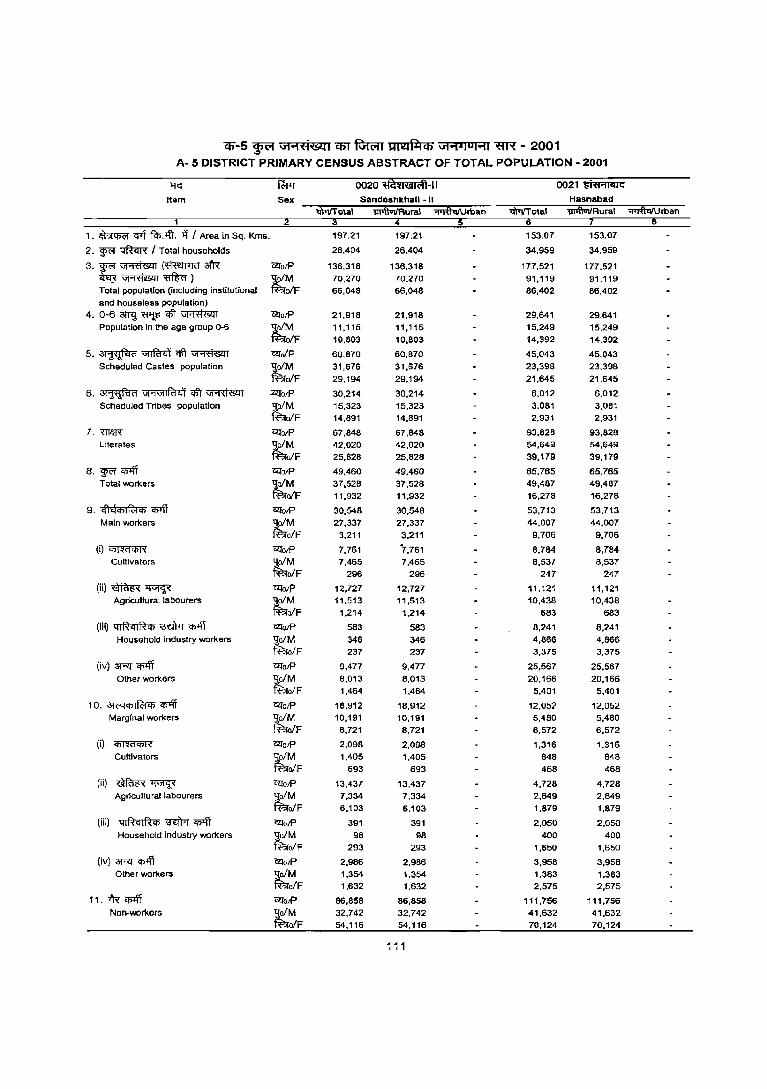
Cil-5 ~ \iI...,'fi®1 C6T'R;rc;rr IOI11l1fliCb \iI"i'lul...,1 ~ - 2001 A- 5 DISTRICT PRIMARY CENSUS ABSTRACT OF TOTAL POPULATION - 2001
11<: fAA 0020 i('j~'I!I(!jIC'tl-11 0021 iii,"" lillG
Item Sex Sandeshkhall • II Hasnabad
1l1~.IiRural ....rthINroan m'lITotal 1l14lUi/Rural ... ·,-t\Q/Urban
1. ~ qrf fcp,-.fr. l'i I Area in Sq, Kms. 197.21 197,21 153,07 153,07
2. g;c;r ~ I Total households 26,404 26,404 34,959 34,959
3. g;c;r ~ (~ atR ~otP 136,318 136,318 177,521 177,521
~~~) tM 70,270 70,270 91,119 91,119 Total population (includin9 institutional oIF 66,048 66,048 86,402 86,402 and house less population)
4. O·5Wj~ctr~ ~otP 21,918 21,918 29,641 29,641 Population In the age group ()-6 tM 11,115 11,115 15,249 15,249
oIF 10,803 10,603 14,392 14,392
5,~~ct\~ ~oIP 60,670 60,670 45,043 45,043 Scheduled Castes population ;tM 31,676 31,676 23,396 23,398
oIF 29,194 29,194 21,645 21,645
5, ~ vt'ivtIRld! ctr ~ ~otP 30,214 30,214 6,012 6,012 Scheduled Tribes population tM 15,323 15,323 3,081 3,061
ofF 14,691 14,891 2,931 2,931
1, <1Ie.R ~OfP 67,848 67,648 93,828 93,628 Literates tM 42,020 42,020 54,649 54,649
ofF 25,828 25,828 39,179 39,179
8, g;c;r q;>ff 'l2<o/p 49,460 49,460 65,765 65,765 Total workers tM 37,528 37,528 49,487 49,487
oiF 11,932 11,932 16,278 16,278
9, cihlcpl R;r <I> CI>'lT O!I'otP 30,548 30,548 53,713 53,713 Main workers
~ 27,337 27,337 44,007 44,007 o/F 3,211 3,211 9,706 9,706
(i)~ O!I'ofP 7,761 "7,761 8,784 8,784 Cultivators ~M 7,465 7,465 8,537 8,537
o/F 296 296 247 247
(ii)~~ O!I'oIP 12,727 12,727 11,121 11,121 Agricultural labourers ~M 11,513 11,513 10,438 10,438
oiF 1,214 1,214 683 683
(III) 41RqlR<I> ~I ~ CZl"otP 583 583 8,241 8,241 Household industry workers ~M 346 346 4,866 4,866
oiF 237 237 3,375 3,375
(iv) ~ <Plff CliotP 9,477 9,477 25,567 25,567 Other workers ~M 8,013 8,013 20,166 20,166
oiF 1,464 1,464 5,401 5,401
10. ;*"l<l>IRI<I> <IJlff CZl"otP 18,912 18,912 12,05:? 12,052 Marginal workers t;M 10,191 10,191 5,480 5,480
oiF 6,721 8,721 6,572 6,572
(i) ~ CZl"oJP 2,098 2,098 1,316 1,316 Cultivators tM 1,405 1,405 848 848
oiF 693 693 468 468
(ii) ~~ CliO/P 13,437 13,437 4,728 4,728 Agricultural labourers tM 7,334 7,334 2,649 2,849
oiF 6,103 6,103 1,879 1,879
(iii) 41RqlRCfl ~ <Plff «IotP 391 391 2,050 2,050 Household indusby workers ~M 98 98 400 400
o/F 293 293 1,650 1,650
(iv)~~ CliO/P 2,986 2,986 3,958 3,958 Other workers ~M 1,354 1,354 1,383 1,383
ofF 1,632 1,632 2,575 2,575
f 1. fR' <!>iff ClToJP 86,858 86,858 111,756 111,756 Non·workers ~M 32.742 32,742 41,632 41,632
oiF 54,116 54,116 70,124 70,124
111
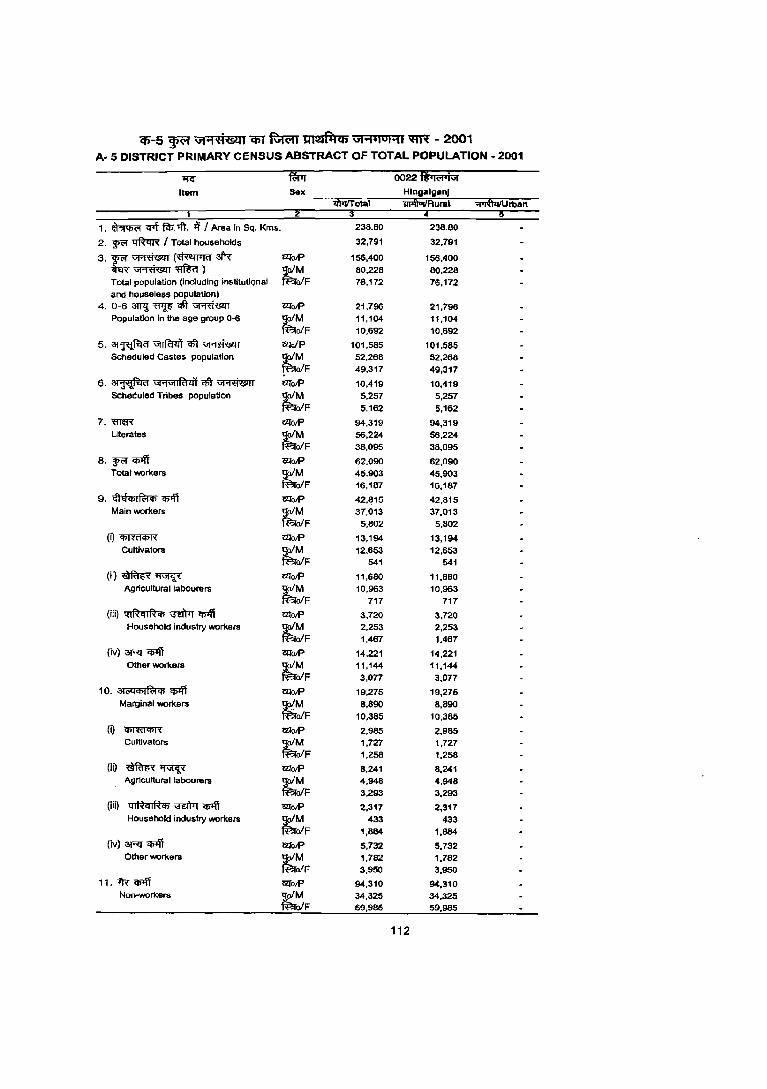
cp-5 ~ "'.'Hi&:lJ q;y ~ m14fll<& Ui"1'IUHI ~ - 2001 A· 5 DISTRICT PRIMARY CENSUS ABSTRACT OF TOTAL POPULATION· 2001
~ ~ 0022~ It am Sex Hln~llIanl
1l)Itfl'otai liiift1IiIRural ~rban
1. ~ 'flf ~. '!ft'. it I Area in Sq. Kms. 238.80 238.80
2. ~ ~ I Total households 32,791 32,791
3.~~(~afR 'tZl'olF' 156,400 156,400 ~~~) tM 80,228 60,228 Total population (Including inslltutiQnal ofF 76,172 76,172 and houseless population)
4. 0-6 3JT'lj ~ c6t ~ 'tZl'olF' 21,796 21,796 Population In the age group 0-6 tM 11,104 11,104
ofF 10,692 10,692
5.~~<A~ 'tZl'oIP 101,585 101,585 Scheduled Castes population tM 52,268 52,268
ofF 49,317 49,317
6. ~ GJ'1GJIP-J41 ~ ~ ViolF' 10,419 10,419 Scheduled Tribes population ~M 5,257 5,257
ofF 5,162 5,162
7,m~ CZJoIP 94,319 94,319 Literates tM 56,224 56,224
ofF 38,095 38,095
8. ~ C51fi CZJolF' 62,090 62,090 Total worXers tM 45,903 45,903
ofF 16,187 16,167
9. <lhfililfi:!iIi 'CJj1ff OQ'olF' 42,815 42,815 MainworXers ~M 37,013 37,013
ofF 5,802 5,802
(i)~ OQ'oIP 13,194 13,194 Cultivators tM 12,653 12,653
ofF 541 541
(ii)~~ ClioIF' 11,660 11,680 Agricultural labourers tM 10.963 10,963
ofF 717 717
(iii) ql~qlRiIi ~ ~ ClioIF' 3,720 3,720 Household industry worXers tM 2,253 2,253
ofF 1,467 1,467
(iV) 3Rr 'CJj1ff <2l'olF' 14,221 14,221 Other worXers ~M 11,144 11,144
ofF 3,077 3,077
10. :O!<"'1q;I~<t> '1f>1ff <2l'olF' 19,275 19,275 Marginal worXers tM 8,890 8,890
ofF 10,385 10,385
(il ~ 'Wolf' 2,985 2,965 Cultivators ~M 1,727 1,727
ofF 1,258 1,258 (ii) ~~ Wolf' 8,241 8,241
Agricultural labourers ~M 4,948 4,948 ofF 3,293 3,293
(iii) ql~ql~Cb ~ 'CJj1ff <2l'oIP 2,317 2,317 Household industry worXers tM 433 433
ofF 1,884 1,884
(iv) 3Rr 'I>'ff l21olF' 5,732 5,732 Other worXers tM 1,782 1,782
ofF 3,950 3,950 , 1. >'R <I>'ff l21olF' 94,310 94,310
Non-WOrXers ~M 34,325 34,325 ofF 59,985 59,985
112

(1)-5 Wtwr G1",,\fi&l1 q;y ~ ~ G1""'I OI'1I ~ - 2001 A- 5 DISTRICT PRIMARY CENSUS ABSTRACT OF TOTAL POPULATION - 2001
~ ~ 12~ 0001 1lfQTi-1 Itam Sax HUGLI Gogh_t -I
:o&tIl'otai lil>\'IViIRurai ~rban l¥iTotai ~Rural ~rban
1. ~ cpf ~A'r. .,!j I Area in Sq. Kms. 3,149.00 2,950.19 198.81 186.32 186.32
2. ~ ~ I Total households 1,043,895 679.061 364,834 24.244 24.244
3.~~~3fR' ClfOlP 5,041,976 3,354,227 1,687.749 125,280 125,280 ~~~)
~ 2,589,625 1,699,831 889,794 64,172 64,172 Total population (including institutional ofF 2,452,351 1,654,396 797,955 61,108 61,108 8nd houseless population)
4. 0-63ml~mt~ ClfotP 603.258 438,352 164.906 17,427 17,427 Population in the age group 0-6
~ 309,141 223,958 85,183 8,922 8,922 olF 294,117 214,394 79,723 8,505 8,505
5.~~rtt~ Cll"oIP 1,188,881 981,740 207,141 46,968 46,968 Scheduled Castes population
~ 601,232 493,762 107,470 23,774 23,774 olF 587,649 487,978 99,671 23,194 23,194
6. ~ vt'1G1IR'1<fi c6t ~ ClfotP 212.062 198.486 13,576 7,356 7,356 Scheduled Trioes population "9;ofM 105,453 98.673 6,780 3,755· 3.755
~o/F 106,609 99,813 6,796 3,601 3,601
7.m~ ClfotP 3,333,988 2,070,854 1,263.134 75.636 75,636 Literates ~M 1,883,474 1,176,702 706,772 44,605 44,605
o/F 1,450.514 894.152 556.362 31,031 31.031
8. ~ <I>'fi Cll"otP 1.859,487 1,294,359 565.128 54.516 54.516 Total vrorken; r 1,463.210 981.585 481,625 38,395 38.395
olF 396,277 312.774 83,503 16,121 16,121
9. <f\E\"'If<;!i'jl~ ClforP 1,528,040 1,011,873 516,167 42,177 42,177 Main vrorkers
~ 1.309,037 656,704 450,333 35,046 35,046 ofF 219,003 153,169 65,834 7,131 7,131
(i)~ Clfoil;' 237,068 232,896 4,172 15,457 15,457 Cultivators
~ 225,261 221,547 3.714 13.413 13,413 olF 11,807 11,349 458 2.044 2,044
(ii)~~ <:l[otP 302,286 295,176 7,110 13,634 13,634 Agricultural labourers 'lo/M 231,429 225,977 5,452 10,986 10,986
taofF 70,857 69,199 1.658 2.648 2,648
(iii) QIRqlF-l", ~ cn+ff ClfotP 64,072 51,929 12,143 1,397 1,397 Household industry workers r 41,838 34.266 7.572 958 958
ofF 22,234 17,663 4,571 439 439
(iv) 3Rl~ 'ClfotP 924,614 431,672 492,742 11,669 11,689 Other, workers tM 810,509 376,914 433,595 9,689 9,689
ofF 114,105 54,958 59,147 2,000 2,000
10. 3l~"'1R:i", CI51ff Cll"o/P 331,447 262,486 48,961 12,339 12,339 Marginal workers lIofM 154,173 122,681 31,292 3,349 3,349
fBiofF 177,274 159,605 17,669 8.990 8,990
(i) ~ GZl'otP 40,833 40,421 412 4,525 4,525 Cultivators ~ 15,295 15,045 250 1,101 1,101
olF 25,538 25,376 162 3,424 3,424
(ii) ~~ 'ClfotP 149,828 146,806 3,022 4,510 4,510 Agricultural labourers r 77.311 75.322 1,989 1.372 1.372
ofF 72,517 71,484 1,033 3,138 3,138
(iii) 41F-l q I R Qj \ffi'tTT CI51ff GZl'otP 32,132 26.676 5,456 403 403 Household industry vrorkers r· 4,716 3,636 1,078 63 63
bIF 27,416 23,038 4,378 340 340
(iv) 3Rl~ 'ClfotP 106,654 68,583 40,071 2,901 2,901 Other workers r 56,651 28.876 27.975 813 813
ofF 51,803 39,707 12,096 2,088 2,068
11.1R"<ii1lT GZl'0IP 3,182.489 2,059.868 1,122,621 70.764 70.764 Non-workers r 1,126,415 718,246 408,169 25,777 25,777
ofF 2,056,074 1,341,622 714,452 44,987 44,987
113

cp-5 ~ ut"'1't1il!41 CfiT ~ ~ \jH~IOHI ~ - 2001 A- 5 DISTRICT PRIMARY CENSUS ABSTRACT OF TOTAL POPULATION - 2001
-.,.: fWr 0002 'ilh"iii-il 0003 3I'ffil!<WT
Item Sex Arambag <Wr!Total ID'ftuvRural ~rban
6 8
1. ~ c:pt fcI,. >ft. if I Area in Sq. Kms. 190.03 190.03 269.31 26931
2. T<'f 1:IftcrR I Total households 27.593 27.593 48.183 48,183
3. T<'f ~ (~ 31'R ClJ'OIP 143,359 143.359 253,579 253,579 ~~~) tM 73,538 73,538 130.058 130,058 Total population (including Institutional olF 69,821 69.821 123.521 123,521 and houseless population)
4. 0-6 3Wj ~ q\'t ~ '1<IofP 20,234 20.234 35,139 35.139 Population in the age group 0-6 tM to,386 10.386 18,001 18,001
olF 9,848 9,848 17,138 17.138
5. ~~q\'t~ '1<Io/p 51,122 51,122 92,477 92,477 Scheduled Castes population ;tM 25,887 25,887 47,047 47,047
olF 25,235 25,235 45,430 45,430
6. ~ vt'1VlIRl41 q\'t ~ '1<IotP 6,477 6,477 2,916 2,916 Scheduled Tribes population tM 3,258 3,258 1,455 1,455
olF 3,219 3,219 1,461 1,461
7. mlW< CLfotP 84,690 84,690 155,164 155,164 Literates tM 49,997 49,997 90.546 90.546
olF 34,693 34,693 64,618 64,618
8. g><1' <Ii'ff ClJ'otP 70,538 70,538 80,908 80,908 Total workers tM 45,290 45,290 72,203 72,203
olF 25,248 25,248 8,705 8,705
9.c;"J1O\c/)1fc;jC/)~ ClJ'ofP 47,108 47,108 64,778 64,778 Main workers ;tM 39,750 39,750 59,962 59-,962
ofF 7,358 7,358 4,816 4,816
(i)~ ClJ'otP 16,711 16,711 16,647 16,647 Cultivators ;tM 15,511 15,511 16,294 16.294
oiF 1,200 1.200 353 353
(ii)~~ CLforP 13.672 13.672 19,154 19,154 Agricultural labourers tM 11,545 11,545 17.272 17,272
olF 2,127 2,127 1,882 1,882
(iii) ql~ql~C/) m:ftrT ~ ClJ'OIP 2,427 2,427 2,928 2,928 Household industry workers tM 1,642 1,642 2,512 2,512
olF 785 785 416 416
(iv) 3Rf q;;ft CLfOfP 14,298 14.298 26,049 26,049 Olher workers tM 11,052 11,052 23,884 23,884
olF 3,246 3,246 2,165 2,165
10. ¢I<"GC/)If'R<t> ~ ClJ'olP 23.430 23,430 16,130 16,130 Marginal workers tM 5,540 5.540 12,241 12,241
oIF 17,890 17,890 3.889 3,889
(i) C/)'JTcfC/)R' CLfotP 8,827 8,827 1,528 1,528 Cultivators ~ 2.326 2.326 1.232 1,232
IF 6.501 6,501 296 296
(ii) ~~ ClJ'OIP 8.655 8.655 10.073 10,073 Agricultural labourers
~F 2,173 2,173 8,681 8,681 6,482 6,482 1.392 1,392
(iii) q I ~ q I ~ q; \RITrr q;;ff ClJ'olP 1,314 1,314 714 714 Household industry workers tM 146 146 206 206
oIF 1.168 1.168 508 508
(iv) 3Rf q;;ft i2TotP 4,634 4,634 3,815 3,615 Other workers tM 895 895 2,122 2,122
oiF 3.739 3.739 1.693 1,693
11- 1'R~ CLfotP 72,821 72.821 172,671 172,671 Non-workers tM 28;248 28.248 57.855 57,855
oiF 44,573 44,573 114.816 114,816
114

Cff-5 Wt'J \J1"1'<1<:"<'lU QiT ~ ~ \J1"1'l ul"ll "'«R - 2001 A- 5 DISTRICT PRIMARY CENSUS ABSTRACT OF TOTAL POPULATION - 2001
'If<:" ~ 0OO4~ 0OO5~ Item Sex Pursura Tarakeswar
"li\ilIT otal UTlftVT/Rural ~rban lIFflotal UTlftVT/Rural :;;:T[fuj/Urban 1 2 3 4 6
1. ~ wt fcp.1'ft. if f Area in Sq. Kms. 100.42 100.42 119.93 119.93
2. WM ~ I Total households 30.616 30.616 33.426 33,426
3·WM~(~~ Ul'otP 156.322 156.322 162.371 162,371
w~'fIf6fr) tM
80.082 80,082 83.174 83.174 Tolal population (including institutional oIF 76,240 76.240 79,197 79,197 and houseless population)
4. 0-6 3Wl ~ qft ~ Ul'otP 19,450 19,450 19,356 19,356 Population in the age group 0-6
tM 9,938 9,938 9,956 9,956
oIF 9.512 9,512 9,400 9,400
5.~~qft~ Ul'o/P 33,073 33,073 37,098 37,098 Scheduled Castes population
tM 16,694 16,694 18,571 18,571
olF 16,379 16.379 18,527 18.527
6. ~ "1'i\ilIRi!l1 qft ~ C2:!otP 851 851 8,045 8,045 Scheduled Tribes population ~oIM 452 452 3,997 3,997
fF-Io/F 399 399 4,048 4,048
7. 'ffT1R' <llOIP 102,776 102,776 105,907 105,907 Literates tM 59,461 59,461 60,942 60,942
olF 43,315 43,315 44,965 44,965
8. WM'P"'fi C2:!O/P 51.380 51,380 59,316 59.316 Total workers
tM 46,500 46,500 49,443 49,443
ofF 4,880 4,880 9,873 9,873
9. <fldCllI!?i'1> 'P"'fi <llo/P 45,093 45.093 50,320 50,320
Main workers ~o/M 42,137 42,137 44,378 44,378
N?ro/F 2.956 2,956 5,942 5,942
(i)~ C2:!o/P 15,931 15,931 15,040 15,040 Cultivators ~ 15,724 15,724 14,712 14,712
ofF 207 207 328 328
(ii)~~ «!atP 10,871 10,871 14,610 14,610
Agricultural labourers ~M 9,977 9,977 11,184 11.184 olF 894 8£'4 3,426 3,426
(iii) ql~ql~Cf> ~ 'P"'fi <llotP 1.266 1,266 1,777 1,777 Household industry workers
tM 772 772 1,437 1.437
olF 494 494 340 340
(iv) 3l"'i'1 'P"'fi C2:!o/P 17,025 17,025 18,893 18,893
Othe r workers tM
15,664 15,664 17,045 17,045
olF 1,361 1,361 1,848 1,848
10. 31C'4C1lI~c/) 'P"'fi <llO/P 6,287 6,287 8,996 8,996 Marginal workers
tM 4,363 4,363 5,065 5,065 oIF 1,924 1,924 3.931 3,931
(i) ~ C2:!otP 662 662 894 894 Cultivators
tM 546 546 487 487
oIF 116 116 407 407
(ii) ~~ C2:!otP 3,319 3,319 5,947 5,947 A9riculturallabourers
tM 2,626 2,626 3,328 3.328
ofF 693 693 2,619 2,619
(iii) QIRcJlRCh 'll'iI<T 'P"'fi C2:!otP 548 548 437 437
Household industry workers ~M 105 105 97 97 olF 443 443 340 340
(iv) 3R! 'P"'fi C2:!otP 1,758 1,758 1,718 1,718 Other workers
tM 1,086 1,086 1,153 1,153
olF 672 672 565 565
11. ~q;1ff C2:!O/P 104.942 104,942 103,055 103,055 Non-workers
tM 33,582 33,582 33,731 33,731
olF 71,360 71,360 69,324 69,324
115

'CQ-5 ~ Ui .... oHi@l1 COl f.';wrr ~ Ui .... 41 0 ..... 1 ~ - 2001 A.5 DISTRICT PRIMARY CENSUS ABSTRACT OF TOTAL POPULATION· 2001
------------~--------------~~~--------~O~~~~~~~£4~1~~I~~----------------rO~Ofl077tiQ~li;ann----------
Item Sex Dhaniakhali Pandua
1, ~ Cf'f ~ '1ft, if / Area in Sq, Km5,
2, ~ "I:lftqR I Total households
3,~~(~3fR ~~"fIf%fr) Total population (including institutional
and houseless population)
4, 0-6 PI1<J ~ cGt ~ Population in the ag7 group 0-6
5,~~'Ift~ Scheduled Castes population
6, ~ G1'1G1II'?1<11 ~ ~ Scheduled Tribes population
7,mm Literates
8, WO' q;1ff Total workers
9. <MCflI~Cj) q;1ff Main workers
(i)~
Cultivators
(ii)~~ AgriCultural labourers
(iii) QIRi'lIRCfl \JEl't>r <PIlT Household industry workers
(iv) 3Rt~ Other workers
10 3i<'<lCflt~Cfl Cj51ff Marginal workers
(Q~ Cultivators
(ii)~~ Agricultural labourers
(iii) ql~ql~Cfl ~ Cfl'ff Household industry workers
(iv) 3Rt ~ Other workers
11, i'R" <Il'ff Non-workers
1'2lotP ~o(M ~o/F
1'2lo/P "9;0(M ~oIF <2I'oIP "9;ofM ~o/F C2l'OIP
llo/ M ~Q/F
C2l'o/P
-go/M ~o/F 1'2lo/P
~ofM ~o/F
C2l'o/P
,:!o/M ~oIF C2l'OIP
t,lolM ~o/F
C2l'o/P
-golM ~o/F
C2l'otP
So/M ~o/F C2l'O/P
,:!oIM ftl;;o/F
C2l'o/P
So/M ~o/F
C2l'olP
'joiM ~o/F C2l'otP
~o/M ~oIF C2l'olP 'jo/M ~o/F
C2l'olP
,:!o/M ~o/F C2l'o/P
'jo/M ~o/F
275.68
62,181
293,345
148,365
144,980
37,213 18,984 18,229
92,914 46,533
46,381
40,798
20,254 20,544
172,063 98,918 73.145
123,636
87.763 35,873
93,752 74,342 19,410
21,847
20,880 967
38,615
25,136 13,479
3,691 2,388
1,303
29,599 25,938
3,661
29,884 13,421
16,463
2,488 1,540
948
20,762 9,635
11,127
1,900 207
1,693
4,734 2,039
2,695
169,709 60,602
109,107
iii4Ji'Rural ~rban lIPTiTotal 1il1&TiiRural ;rfrt\iijUrban 4
275.68
62.181
293.345 148,365
144,980
37,213 18,984 18,229
92,914 46,533 46,381
40,798
20,254 20,544
172,063 98,918 73,145
123,636 87,763 35,873
93,752 74,342 19,410
21,847
20,880 967
38,615 25,136 13,479
3,691 2,388
1,303
29,599 25,938
3,661
29,884 13,421
16,463
2,488 1,540
948
20,762 9,635
11,127
1,900
207 1,693
4,734 2,039 2,695
169,709 60,602
109,107
116
276.43
59,135
284.231 143,179 141,052
37,969 19,400
18,569
89,017 45,019
43.998
46,526
22,978 23,548
165,428 93,708 71,720
113.378 79,722 33,656
84,943 65,365 19,578
14,356
13,284 1,072
34,989 21,804 13,185
2,275 1,283
992
33,323 28,994 4,329
28,435 14,357 14,078
1,436 1,004
432
21,587 10,680
10,907
1,217
208 1,009
4,195 2,465 1,730
170,853 63,457
107,396
272,68
53,526
257,070 129,421
127,649
34,819 17,768
17,051
86,253 43,606 42,647
45,163
22,338 22,825
147,355 83,900 63,455
103,624 72,179 31,445
76,601 58,456 18,145
14,241
13,177 1,064
34,482 21,535 12,947
1,864 1,124
740
26,014 22,620
3,394
27,023 13,723
13,300
1,429 1,000
429
21,013 10,371
10,642
990 192
798
3,591 2,160 1,431
153.446 57,242 96,204
3.75
5,609
27,161
13,758
13,403
3,150 1,632
1,518
2,764 1,413
1.351
1,363
640 723
18,073 9,808 8,265
9,754 7,543
2,211
B,342 6,909 1,433
115
107
8
507 269 238
411 159
252
7,309 6,374
935
1,412
634
778
7 4
3
574 309
265
227
16 211
604
305 299
17.407 6,215
11,192
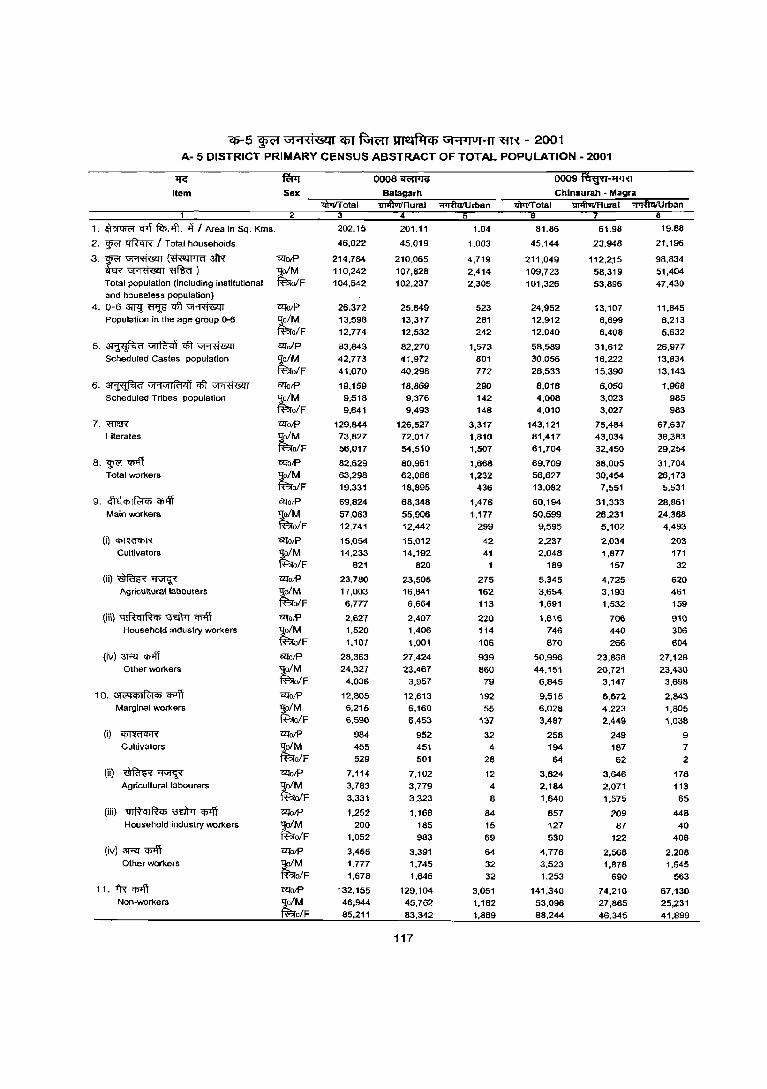
cp-5 WR \J1 .... 't1'8.l11 cpr ~ ~ "' ..... 1° ..... 1 "ffi'{ - 2001 A- 5 DISTRICT PRIMARY CENSUS ABSTRACT OF TOTAL POPULATION - 2001
1fG
Item
1. ~ q-.f 17!;-. -.ft. ill Area in Sq. Kms.
2. g><'l' ll"ftcrR I Total hOuseholds
3. g><'l' ~ (~ ~ ~~~) Total populatlon (including Institutional
and houseless population)
4. 0-63ll'l..!:~qlt~ Population in the age group 0-6
5.~~qlt~ Scheduled Castes population
6. ~ Gf'1VfIRr4'j qlt ~ Scheduled Tribes population
7. miff< Literates
8.~~ Total workers
g. ,,] E!ell I Fcl CIl "CIllfi Main workers
(i)~
Cultivators
(ii)~~ Agricultural labourers
(iii) ql~ql~CIl "3"'dM ~ Household industry workers
(iv) 3RT CIJlfi Other workers
10. 3l<"!CIllRoiCll ~ Marginal workers
(i)~
Cultivators
(ii)~~ Agricultural labourers
(iIJ) ~Cllft<n \3W>J CIJlfi Household industry workers
(iv) 3RT~ Other workers
11. fR' '151ft Non-workers
Sex
2
12I01P
-qolM fao/F
12Io/P '9;o/M fao/F Cll"o/p
~o/M ff?ro/F
Cll"otP ~o/M ff?ro/F Cll"o/P I];o/M ff?ro/F
Cll"o/P 1jo/M l'F:rolF Cll"o/P I];o/M fao/F
12Io/P
,!!o/M ff?ro/F 12Io/P
'lo/M l'F:rolF <1{O/P
I];o/M faoIF mO/P
'9;o/M l'F:ro/F mO/P '9;o/M ~o/F
molP 'lo/M fao/F
mO/P
:JoIM ~o/F motP 1jo/M ff?ro/F
molP -golM ~o/F
Cll"olP -go/M ~o/F
202.15
46,022
214.784
110,242
104,542
26,372
13.598
12,774
83,843
42,773
41,070
19,159
9,518
9,641
129,644 73.827
56,017
82,629
63,298
19,331
69.824
57,083
12.741
15.054
14.233 821
23,780
17,003
6,777
2,627 1,520
1.107
28.363
24,327
4,036
12.805
6,215
6,590
984 455
529
7,114
3,783
3,331
1.252
200 1,052
3,455
1.777
1,678
132.155 46,944
85,211
0008 ifffi1l<I Balagarh
201.11
45.019
210.065
107,828
102.237
25.849 13,317
12.532
82,270
41,972
40.298
18,869
9.376 9,493
126,527
72.017
54,510
80,961 62,066
18,895
68,348
55,906
12,442
15,012
14,192
820
23,505 16,841
6,664
2,407 1,406
1,001
27.424
23,467
3,957
12,613
6,160
6,453
952 451
501
7,102
3,779
3,323
1,168
185 983
3,391
1.745
1,646
129,104
45,762
83,342
117
1.04
1.003
4,719
2,414
2.305
523 281
242
1,573
801
772
290
142
148
3,317
1,810
1,507
1,668
1,232
436
1,476
1,177
299
42 41
1
275
162
113
220
114
106
939
860 79
192 55
137
32
4
28
12
4 8
84
15
69
64 32
32
3.051
1,182
1,869
0009 i%"ijii-lf1m Chlnsurah - Magra
81.86
45.144
211,049
109,723
101,326
24,952
12.912
12.040
58.589
30,056
28.533
8,018
4,008 4,010
143,121 81,417
61,704
69,709 56,627
13,082
60,194
50,599
9,595
2,237
2,048 189
5,345
3,654 1,691
1,616
746
870
50.996
44.151
6,645
9,515 6,028
3,487
258
194
64
3,824
2,184
1.640
657
127
530
4,776 3,523
1,253
141.340
53,096
88,244
61.98
23,948
112,2.15
58,319 53,896
13.107
6,699
6.408
31.612
16,222
15.390
6,050
3,023
3,027
75,484 43,034
32,450
38,005
30,454 7,551
31,333
26,231
5,102
2,034 1,877
157
4,725
3.193 1,532
706
440
266
23,868
20,721 3,147
6,672 4,223
2,449
249
187
62
3,646
2,071
1.575
209
87
122
2,568 1,878
690
74,210
27,865
46,345
19.88
21,196
98.834
51,404
47,430
11.845
6,213
5,632
26,977
13,834
13,143
1,968
985
983
67,637
38.383
29,254
31,704
26,173 5,531
28,861
24.368
4,493
203
171
32
620
461
159
910
306
604
27,128
23,430 3,698
2,843 1,805
1,038
9 7
2
178
113
65
448 40
408
2,208
1,645
563
67.130
25,231
41,899
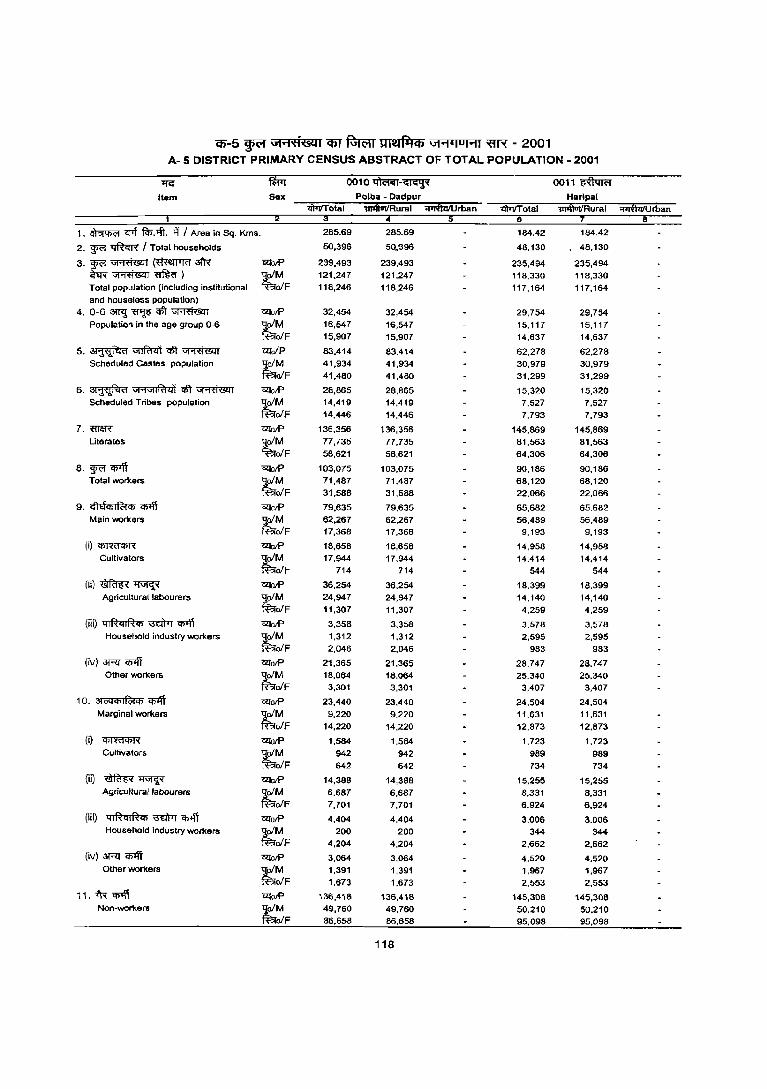
Cf)-5 ~ U1"'1'l1'Lclil em ~ ~ \11'1'1 0 1'11 'ffR - 2001 A- 5 DISTRICT PRIMARY CENSUS ABSTRACT OF TOTAL POPULATION - 2001
'IfCl' fuTJ 0010~-~ 0011~ Item Sex Harlpal
m.trTotal !lI>ll.tlRural ~rban 6
1. ~ Cflt f<I>.-.ft. -i'i I Area in Sq. Kms. 285.69 285.69 184.42 184.42
2. ~ ~ I Total households 50,396 50"~96 48,130 48,130
3. 'T<'I ~ (~ 3l'R CZfotP 239,493 239,493 235,494 235,494 W~~)
tM 121,247 121,247 118,330 118,330
Total population (including institutional ofF 118,246 118,246 117,164 117,164 and hOuseless population)
4. 0-6 3ml ~ ql't ~ CZfotP 32,454 32,454 29,754 29,754 Population in the age group 0-6
tM 16,547 16,547 15,117 15,117
ofF 15,907 15,907 14,637 14.637
5. ~ VIl'f<nit ~ ~ CZfolP 83,414 83,414 62,278 62.278 Scheduled Castes population
tM 41,934 41,934 30,979 3U,979
ofF 41,480 41,480 31,299 31,299
6. ~ VI"1V1IRi<l1 qlT ~ CZl'O/P 28,865 28,865 15,320 15,320 Scheduled Tribes population
tM 14,419 14,419 7,527 7,527
ofF 14.446 14,446 7,793 7,793
7. 'Wa'R' ClIotP 136,356 136,356 145,869 145,869 Literates
tM 77,735 77,735 81,563 81,563
ofF 58,621 58,621 64,306 64,306
8. 3><'1 <I>'ff CZl'otP 103,075 103,075 90.186 90,186 Total wor1<.ers
tM 71,487 71,487 68,120 68,120
ofF 31,588 31.588 22,066 22,061)
9. ehfct>I~ct> q;1ff CZfctP 79,635 79.635 65.682 65.682 Main wor1<.ers
tM 62,267 62,267 56,489 56,489
olF 17,368 17,368 9,193 9,193
(i)~ CZfotP 18,658 le,658 14,958 14,958 Cultivators
tM 17,944 17.944 14,414 14,414
ofF 714 714 544 544
(ii)~~ CZfotP 36,254 36,254 18.399 18.399 Agricultural labourers :!ofM 24,947 24,947 14,140 14,140
~ofF 11,307 11,307 4,259 4,259
(iii) ql~ql~<!> ~ ~ CZl'OIP 3,358 3,358 3,578 3,578 Hou sehold ind ustry workers
tM 1,312 1,312 2,595 2,595
ofF 2,046 2,046 983 983
(iv) 3RI' ct>-.ff l'2lOlP 21,365 21.365 28,747 28,747 Other wor1<.ers
tM lB,064 18.064 25.340 25,340
ofF 3,301 3,301 3,407 3,407
10. 3t<4"'I~ct> Cf>Iff CZfotP 23,440 23,440 24,504 24,504 Marginal wor1<.ers
tM 9.220 9,220 11,631 11.631
ofF 14,220 14,220 12,873 12,873
(i) ~ czwp 1.584 1,584 1,723 1,723 Cultivators
tM 942 942 989 989
ofF 642 642 734 734
(ii) ~~ CZfotP 14,388 14,388 15,255 15,255 Agriculture/labourers
tM 6.687 6.687 8,331 8,331
ofF 7,701 7,701 6,924 6,924 (iii) ql~qIRct>~"Cf>lff CZl'otP 4,404 4.404 3,006 3.006
Household Industry workers tM
200 200 344 344 ofF 4,204 4,204 2,662 2,662
(iv) 3RI' ct>-.ff ?lfuIP 3,064 3,064 4,520 4,520 Otller workers ~M 1,391 1,391 1,967 1,967
ofF 1,673 1.673 2,553 2,553
11. "R 'Il'ff CZl'otP 136,418 136,418 145,30B 145,308 Non-wor1<.ers
tM 49,760 49,760 50,210 50,210
ofF 86.658 86,658 95,098 95,098
118
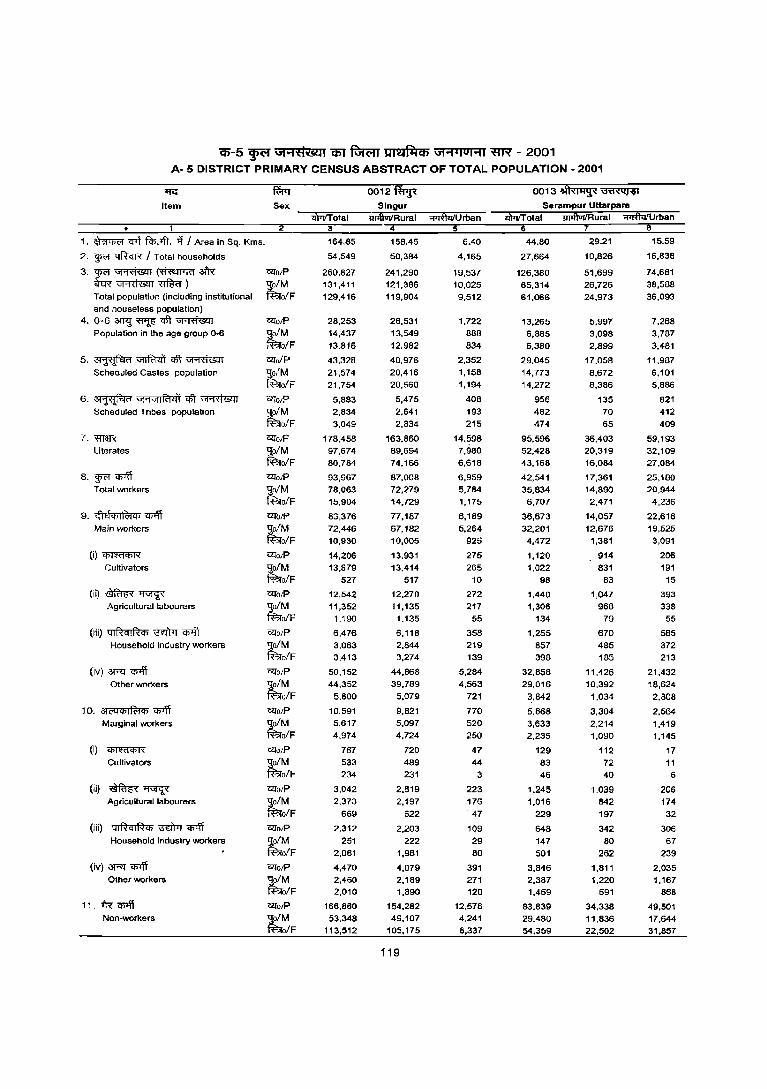
q;-5 ~ \iI'1'l"i'&Ol1 q;J fGR;rr llMlliCb \iI'1'IOI'1I ~ - 2001 A- 5 DISTRICT PRIMARY CENSUS ABSTRACT OF TOTAL POPULATION - 2001
~
Item Sex
0012 ftI1ji Singur
0013~~ Serampur Uttarpara
iltliI'Total llntfVTfRural :;;pffuiIUrban ------~~-----.1----------------~2----~~~~--~·
iltliI'Total "!IJIIl1JTiRural "'iiifui/Urban
1. ~ 'Cf'Ii ~.>ft. "ill Area in Sq. Kms.
2. ~ ~ I Total households
3.~~(~~ ~~~) Total population (including institutional
and houseless population)
4. 0-6 ~~<tt~ Population in the age group 0-6
5.~~<!lt~ Scheauled Castes populatior
6. ~ "1'iV'lIRl41 <!It ~ Scheduled Tribes population
7. marx Literates
8.~~ Total workers
9.~~ Main workers
(i)~
Cultivators
(ii)~~ ... gricultural labourers
(iii) QIRcll~'" \3EirrT C'F.Ifr Household inC:ustry workers
(iv) 3RT~ Other workers
10. 3!<'G"'IIcl", ~ Marginal workers
(i)~
Cultivators
(ii)~~ Agricultural labourers
(iii) 41RclllQ", ~ ~ Household industry workers
(iv) 3RT ~ Other workers
II.mq;;ff Non-workers
'IZl'O/p
~o/M ~oIF
~o/p
~o/M ~oIF moll" ~o/M fBIo/F
i'2io/p
~o/M f'ao/F
mo/p 9;o/M fBIo/F ~oIP
~o/M fBIo/F
i'llO/P
9;o/M fBIo/F ~o/p
g;oIM t'Bro/F ~O/P
,:!o/M ft:?lo/F «hIP
~o/M fa'o/F
~O/P
~o/M ft:?lo/F ClI'o/p
9;o/M fBIo/F
ClI'O/P
g;o/M ft:?lo/F ClI'o/p
9;o/M ft:?lo/F 'UlolP
~o/M ~o/F
'UlO/P
,:!o!M ~oIF mO/P 'lo!M fa'oIF
164.85
54.549
260,827 131,411
129,416
28,253
14,437
13.816
43,328
21,574
21,754
5,883
2,834
3,049
178,458
97,674 80,784
93,967
78,063
15,904
83,376
72,446
10,930
14,206
13,579
527
12,542
11,352
1.190
6,476
3,063 3,413
50,152
44,352
5,800
10.591
5,617
4,974
767
533
234
3,042
2,373
669
2,312
251
2,061
4,470
2,460 2,010
166,860
53,348
113,512
158.45
50,384
241,290
121,386 119,904
26,531
13,549
12,982
40.976
20,416
20,560
5,475
2,641
2,834
163.860 69,694
74,166
87,008
72,279
14,729
77,187
67,182
10,005
13,931
13.414
517
12,270
11,135
1.135
6,118
2,844
3,274
44,868
39,789
5,079
9.821
5,097
4,724
720
489
231
2,B19
2,197
622
2,203
222
1,981
4,079 2,189
1,890
154,282
49,107
105,175
119
6.40
4,165
19,537 10,025
9,512
1,722
888
834
2,352
1,158
1,194
408
193
215
14,598
7,980
6,618
6,959
5,784
1,175
6,189
5,264
925
275
265
10
272
217
55
358
219
139
5,284
4,563
721
770
520
250
47
44
3
223
176 . 47
109
29
80
391
271 120
12,578
4,241
6,337
44.60
27,664
126,380
65,314
61,066
13,265
6,885
6.380
29,045
14,773
14,272
956
482
474
95,596
52,428
43,168
42,541
35,834
6,707
36,673 32,201
4,472
1,120
1,022
98
1,440
1,306
134
1.255
857
398
32,656
29,016
3,842
5.868
3,633 2,235
129
83
46
1,245
1,016
229
646
147
501
3,846 2,387
1,459
83,839
29,480
54,359
29.21
10,826
51,699
26,726
24,973
5,997
3,098
2,899
17,058
8,672
8.366
135
70
65
36,403
20,319
16,064
17,361
14,890
2,471
14,057
12,676
1,381
914
831
83
1,047
968
79
670
485 165
11,426 10,392
1,034
3,304
2,214
1,090
112
72
40
1,039
842
197
342
80
262
1,811
1,220
591
34,338
11,836
22,502
15.59
16,836
74,661
38,586
36,093
7,266
3,787
3,481
11,987
6,101
5,886
821
412
409
59,193
32,109
27.084
25.180 20,944
4,236
22,616
19.525
3,091
206
191
15
393
338
55
585
372 213
21,432
18,624
2.808
2,564
1,419
1,145
17
11
6
206
174
32
306
67
239
2,035 1,167
858
49,501
17,644
31,851

iP-5 W<" GI"i'H'&ai C6T ~ Ui21fttCb GI"'ItloHI "il'lR - 2001
A- 5 DISTRICT PRIMARY CENSUS ABSTRACT OF TOTAL POPULATION - 2001
'qG fflfq 0014~-1 0015~-1I Item Sex Chandltala - II
lI'P1IT otal 1l1<1j.IIRuml ~Urban
1. ~ '1I'f f<l>. >l'I. if I Area in Sq. Kms. 93.45 93.45 70.34 52.08 18.26
2. W"f ~ I Total households 30,885 30,885 45,078 25,211 19,867
3'l:~(~~ 12I'otP 165,837 165,837 213,485 123,048 90,437 ~~) tM 81,635 81,635 108,953 62,396 46,557
Total population (Including institutional ofF 84,202 84,202 104,532 60.652 43,880 and houseless population)
4. 0-6~~qlt~ 12I'otP 23,102 23,102 24,587 14,769 9,81B Population in the age group 0-43 tM 11,694 11,694 12,564 7,588 4,976
ofF 11,408 11,408 12,023 7,181 4.842
5.~~qft~ 12I'oIP 32,521 32,521 28,310 20,041 8,269 Scheduled Castes population
~ 15,728 15,728 14,191 9,955 4,236
ofF 16,793 16,793 14,119 10,086 4,033
6. ~ UJ'1UJIRl4'i qlt ~ 12I'oiP 393 393 1,637 1,468 169 Scheduled Tribes population tM 191 191 813 725 88
olF 202 202 824 743 81
7. mllff G!:Io/p 108,100 108,100 149,061 83,327 65.734 Literates r 57,670 57,670 81,243 45,532 35.711
olF 50,430 50,430 67,818 37,795 30.023
8. 'W<'I <P4l 12I'otP 57,110 57.110 69,457 38,731 30.726 Total workers tM 44,794 44.794 60,639 34,484 26.155
olF 12,316 12.316 8,818 4,247 4.571
9. <flelq;I~q; ~ 12I'otP 45.588 45.588 60.923 34,106 26.817 Main workers tM 40,695 40.695 55,704 31.575 24.129
olF 4.893 4.893 5.219 2.531 2.688
(i)~ 12I'otP 5.331 5.331 1.951 1.705 246 Cultivators
~ 5,116 5.116 1,885 1,650 235
olF 215 215 66 55 11
(ii)~~ 12I'otP 7,422 7,422 3,813 3,428 385 Agricultural labourelll tM 6.606 6.606 3,594 3.232 362
ofF 816 816 219 196 23
(iii) QI~qIRq; ~ "if>Iff 12I'otP 3,485 3,485 4,931 1.750 3.181 Household industry workers
~ 2,225 2.225 3,976 1.426 2.550 olF 1,260 1.260 955 324 631
(iv)~"if>1ff 12fotP 29.350 29.350 50,228 27.223 23.005 Other workers
~ 26.748 26.748 46,249 25.267 20.982
olF 2.602 2,602 3,979 1,956 2,023
10. 3J('qq;I~q; ~ G!:IotP 11.522 11,522 8.534 4,625 3,909 Mar9inal workers
~ 4.099 4,099 4,935 2.909 2,026 olF 7.423 7,423 3,599 1,716 1,883
(i) ~ 12fotP 2,080 2,080 227 203 24 Cultivators
~ 438 438 103 91 12
olF 1,642 1,642 124 112 12
(ii) ~~ urotP 3.960 3.960 1,327 1.142 185 Agricultural labourers tM 1.670 1.670 994 847 147
olF 2.290 2.290 333 295 38
(iii) ql~ql~q; '\3l':I't1r ~ 12foR 1.840 1.840 1,869 728 1.141 Household industry workers
~ 268 268 336 153 183 olF 1.572 1.572 1,533 575 958
(iv)~~ 12foiP 3.642 3.642 5,111 2.552 2.559 Other workers
~ 1.723 1.723 3.502 1,818 1,684 olF 1.919 1.919 1,609 734 875
11. trr q;-iff ClJ'oJP 108.727 108,727 144.028 84,317 59,711 Non-workers tM 36.841 36.841 48.314 27,912 20,402
ofF 71.886 71,886 95,714 56,405 39,309
120

q;-5 ~ ","'I't1&t1 CfiT ~ UIl'l~C6 ","'1.1 0 1"'11 ~ - 2001 A- 5 DISTRICT PRIMARY CENSUS ABSTRACT OF TOTAL POPULATION - 2001
~ ~ 0016~ 0017~-1
Item Sex
1. ~ <ITt f<I>.1ft. if I Area In Sq. Kms. 164.23 164.23 171.92 171.92
2. W<'f ~ I Total households 39,567 39.567 43,195 43,195
3. l'l'f ~ (~ af'R CZlolP 201,001 201,001 221,871 221,871 W~~) tM 101,382 101,382 112,232 112,232 Total popUlation (including institutional ofF 99,619 99,619 109,639 109,639 and houseless population)
4. 0-6 3mj ~ <1ft ~ 12fo/P 27,494 27,494 32,879 32,879 Population in the age group 0-6 tM 14,049 14,049 16,630 16,630
o/F 13,445 13,445 16.249 16,249
5.~~<Ift~ C2folP 61,856 61,856 63,103 63,103 Scheduled Castes population tM 30,946 30,946 31,693 31,693
ofF 30,910 30,910 31,410 31,410
6. ~ "l'Nllfc'lJi qlt ~ C2folP 9,496 9,496 608 608 Scheduled Tribes population tM 4,768 4,768 423 423
ofF 4,728 4,728 385 385
7. <'lT~ C2fO/P 121,849 121,849 132,084 132,084 Literates tM 69,004 69,004 76,855 76,855
ofF 52,845 52,845 55,229 55,229
8. w<'I ~ CZlolP 93,325 93,325 61,856 81,858 Total workers tM 60,671 60,671 64,857 64,857
ofF 32,654 32,654 17,001 17,001
9. ,,"tI'f4JIft;JQ;"ijJ1ff 1'1l'o/P 68,693 66,693 63,414 63,414 Main workers
~F 53,462 53,462 58,257 58,257 15,231 15,231 5,157 5,157
(i)~ GqO/P 12,762 12,762 18,387 18,387 Cultivators "!);olM 11,959 11,959 17,896 17,896
~ofF 803 803 491 491
(ii)~~ 1'1l'OIP 18,945 18,945 14,258 14,258 Agricultural labourers 1jolM 14,250 14,250 13,515 13,515
~o/F 4,695 4,695 743 743
(iii) ql~ql~4J \'fri'rTr ~ GqOlP 6,687 6,687 5,343 5,343 Household industry workers ~M 4,598 4,598 4,386 4,386
ofF 2,089 2,089 957 957
(iv) ~ q;>\T 1'1l'O/P 30,299 30,299 25,426 25,426 Other workers
~ 22,655 22,655 22,460 22,460
ofF 7,644 7,644 2,966 2,966
10. 31<i<l4JIfc:tql q;-.ff CLfolP 24,632 24,632 lB,444 lB,444 Marginal workers ~M 7,209 7,209 6,600 6,600
ofF 17,423 17,423 11,844 11,844
(i) ~ Cll'olP 2,428 2,428 4,023 4,023 Cultivators tM 857 857 1.176 1,176
ofF 1,571 1,571 2,847 2,847
(iiJ ~~ CZlolP 8,867 8,867 6,261 6.261 Agricultural labourers tM 4,172 4,172 3,178 3,178
ofF 4,695 4,695 3,083 3,083
(iiQ ql~ql~Cf) \'fri'rTr Cj)1j'f ~olP 2,664 2,664 2,460 2,460 Household industry workers ~M 327 327 450 450
ofF 2,337 2,337 2,010 2,010
(iv) 3f"'1' Cff'li CZ<olP 10,673 10,673 5,700 5,700 Other workers ~M 1.853 1,853 1,796 1,796
olF 8,820 8,820 3,904 3,904
11. -fR q;>ff Cl70lP 107,676 107,676 140,013 140,013 Non-workers
~F 40,711 40,711 47,375 47,375 66,965 66,965 92,638 92,638
121

Q)-5 ¥ Gf'1'!1'@01i em fGJm llT~~Cfl Gt"'f'jOI'1I ~ - 2001 A· 5 DISTRICT PRiMARY CENSUS ABSTRACT OF TOTAL POPULATION· 2001
'Ife: fWr 0018~-1I
Item Se", Khanakul-II iiTi$\1I!IRuml ~rban
j. ~ ~ ~.>lI. '>'t I Area In Sq. Kms. 121.83 121.83
2. WR tlftcrR I Total households 31,731 31,731
3.~~(~~ l2TolP 160,888 160,888 ~~~) tM 79,540 79,540 Total population (including institutional ofF 81,346 81,348 and houseless population)
4. 0-6 3WJ ~ <!It ~ C2folP 22,778 22,778 Population in the age group 0-6 tM 11,715 11,715
oIF 11,063 11,063
5.~~qlt~ l2ToIP 46,706 46,706 Scheduled Castes population tM 23,133 23,133
ofF 23,573 23,573
6. ~ GJ·jGlIl'all1 ~ ~ l2TolP Scheduled Tribes population tM oIF
7. miff'[ C2folP 97,404 97,404 Uterates tM 54,910 54,910
oIF 42,494 42.494
8. ~ ct>4T G!loIP 62,821 62,821 Total workers tM 45,710 45,710
oIF 17,111 17,111
9. (t)€lcpl~ (j) ct>4T C2folP 44,001 44,001 Main workers tM 39,893 39,893
oIF 4,108 4,108
(il 'Cf>rnIi'l>R G!loIP 13,330 13,330 Cultivators ~F 12,543 12,543
787 787
(ii)~~ G!loIP 9,885 9,885 Agricultural labourers
~F 9,515 9,515 370 370
(iii) ql~qlRcp ~ ct>4T C2folP 2,477 2,477 Household industry workers tM 1,716 1,716
ofF 761 761
(iv) ~ Cf51ff G!loIP 18,309 18,309 Other workers
(;ZF 16,119 16,119
2,190 2,190
j O. 3i¢4cpl~cp ct>4T C2fotP 18,820 18,820 Marginal workers tM 5,B17 5,B17
ofF 13,003 13,003
(il ~ C2lotP 5,994 5,994 Cultivators tM 1,121 1,121
oIF 4,B73 4.873
(ii) ~~ G!lotP 8,048 B,048 Agricultural labourers tM 3,362 3,362
oIF 4,686 4,686
(iii) CII~ql~(j) \ffilrr ~ G!lotP 1,346 1,348 Household industry workers
t~F 306 306 1,040 1.040
(iv) 3RI' ct>4T l2TotP 3,432 3,432 Other workers tM 1,028 1,028
oIF 2.404 2,4M
11. l'R cn4'I G!lo/P 98,067 9B,067 Non-workers tM 33,830 33,830
oIF 64,237 64,237
122

Cfi-5 ~ 'I011"""I'<1'L<41 (6l R;rc;rr ~ \ij01.I01"'t1 ~ - 2001 A- 5 DISTRICT PRIMARY CENSUS ABSTRACT OF TOTAL POPULATION - 2001
Item
1. ~ <fll Fcc. >ft. ii / Area In Sq. Kms.
2. WC'f t!ftcrR / Total households
3. WC'I VI~Em (~ 3th W~~) Total population (including institutional and houseless population)
4. 0-6 3lnl ~ qft ~ Population in the age group 0-6
5. ~ ;::;nfui'i qft ~ Scheduled Castes population
6. ~ WIVlltam qlt ~ Scheduled Tribes population
7. mlW< Literates
8. "WR CI>4t Tolal workers
9. ,,"ie!ililf<:!ili ~ Main workers
(i)~
Cultivators
(ii)~~ Agricultural labourers
(iii) LIIRql~ili~~ Household industry workers
(iv) 3RT Cf>Iff Other workers
10. 3lC'Gililf<:!ili ~ Marginal work~rs
(i)~
Cultivators
(iQ~~ Agricultural labou rers
(Iii) QIRqlRCh ~ CI>4t Household industry workers
(iv) 3RI~ Other workers
11. 1R cpoff Non-workers
Sex
2
C2TO/P
lJoiM ~o/F
C2TO/P
lJo/M ~o/F C2ToIP
ljo/M fBroiF
CZTO/P 1jo/M ~o/F
C2TO/P 1jolM fBro/F
C2TO/P
:{o/M ~oIF C2TO/P
:{oIM ~oIF C2TO/P ljo/M ~oIF
C2TorP 1jo/M fBroiF
C2TO/P
'lo/M ff?loIF C2TO/P
ljo/M ~oIF '&I"oIP
~F C2TO/P
"lJoiM ~oIF C2TO/P :{o/M ~o/F C2TO/P
'Jo/M ~o/F
C2TolP
'loiM ~oIF C2TO/P 1jolM ~oIF
<QIi1T/T otal 3
6.882.00
606.020
3,192,695
1,636,002 1,556,693
458,882
235,006 223,876
997,408 506,868 490,540
330,783 166,732 164,051
1,734,222 1,075,401
658,821
1,427,272
928,436 498,836
944,216 759,045 185,171
316,593 283,045
33,548
265,339
180,253 85,086
46,950 29,408 17,542
315,334 266,339
4B,995
483,056 169,391 313,665
123,~64
4B,880
74,484
237.875 79.846
158.029
36,542
5.586 30,956
85,275 35,079
50,196
1,765,423 707,566
1,057,857
13~
BANKURA 1lT'fiuVRural ~Urban
4
6.820.51
559,295
2.957,447
1.515.450 1,441,997
433,850
222,291 211,559
943,745 479,898 463,847
329,080 165,843 163,237
1,565,581
980,384 585,197
1,347.945 864,500 483.445
873,592 699,340 174,252
315,680 282,176
33,504
264,167
179,329 84,838
40,536 £4,805 15,731
253,209
213,030 40,179
474,353 165,160
309,193
123,308
48,829 74,479
237,019
79,535 157,484
34,418 5,258
29,160
79,608 31,538
48,070
1,609,502
650,950 958,552
123
6149
46,725
235.248
120.552 114,696
25,032
12,715 12,317
53,663
26.970 26,693
1.703 889 814
168,641 95,017
73,624
79.327 63,936 15,391
70,624 59,705 10,919
913 869
44
1,172
924 248
6,414 4,603 1,811
62,125
53.309 8,816
8,703
4.231 4,472
56 51
5
856
311 545
2,124 328
1,796
5,667 3,541
2.126
155.921 56,616 99,305
..wvrutal 6
312.62
21.444
121,552
62,239 59,313
18,494
9,575 8,919
40,856
20,790 20,066
23,111 11,704 11,407
56,744 37,549
19,195
58.061 35,343 22,718
34,085 26,858
7,227
14,653 11,797
2,856
5.783
3,851 1,922
1,336 860 476
12,313
10,340 1,973
23,976 8,485
15,491
8,254
2,743 5,511
10,539
3.141 7,398
998 210 788
4,185 2,391
1,794
53,491
26,896 36,595
000l~ Saltora
1lT'fiuVRural "fITftWu rbar.
312.62
21,444
121,552
62.239 59,313
18,494
9,575 8.919
40,856 20,790 20,066
23,111 11.704 11,407
56,744 37,549
19,195
58,061 35,343 22,718
34,085 2'),858
7,227
14,653 11,797
2,856
5,783 3,861 1,922
1,336
860 476
12,313 10,340
1,973
23,976 8,485
15,491
8,254
2,743 5,511
10,539 3,141
7,398
998 210 788
4,185 2,391
1,794
63,491 26,896 36,595
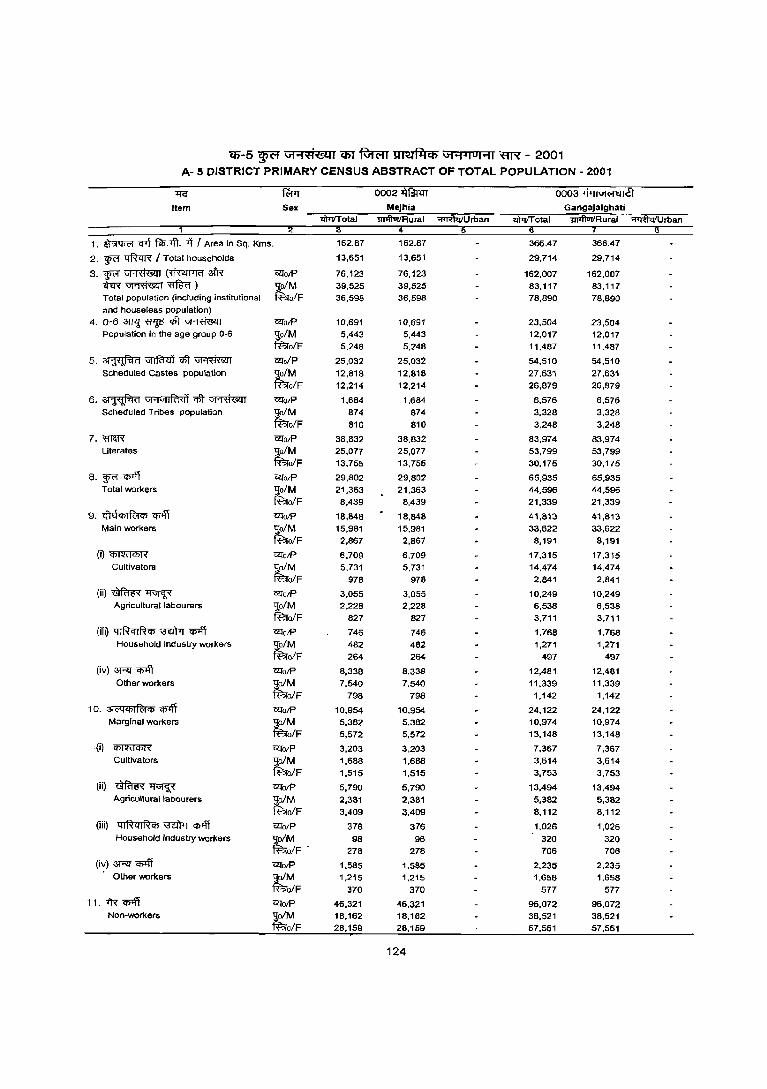
ca-5 ¥ G1"''Iti&l1 <5T ~ ~ GH'IOHI ~ - 2001 A- 5 DISTRICT PRIMARY CENSUS ABSTRACT OF TOTAL POPULATION - 2001
~ fWT 0002~ 0003 ·j'"\i1('1t1lal
Item Sex Mejhla Gangajalghatl tit'1IT otal rivtlRural lIPfluTIRural ~rban
1 4
" ~ cpt FcI>,-.ft, ->t I Area In Sq, Kms, 162,87 162,87 366.47 366,47
2, WC'f ~ / Total households 13,651 13,651 29,714 29,714
3, w<'" VFRi<lm (~afR <2lolP 76,123 76,123 162,007 162,007 .r<R~~) tM 39,525 39,525 83,117 83,117 Total population (including institutional ofF 36,598 36,598 78,890 78,890 and house less population)
4, 0-6 Jmj ~ qit ~ i2fo/P 10,691 10,691 23,504 23,504 Population in the age group 0-6 ~o/M 5,443 5,443 12,017 12,017
ff?ro/F 5,248 5,248 11,487 11,487
5, ~ \1Il'fR<lT qit ~ molp 25,032 25,032 54,510 54,510 Scheduled Castes population ~ofM 12,818 12,818 27,631 27,631
ff?ro/F 12,214 12,214 26,879 26,879
6, ~ GJ'i"1IR'1'l1 ~ ~ C21'o/P 1,684 1,684 6,576 6,576 Scheduled Tribes population ~ofM 874 874 3,328 3,328
ff?ro/F 810 810 3,248 3,248
7,m~ C21'o/P 38,832 38,832 83,974 83,974 Literates
tM 25,077 25,077 53,799 53,799 o/F 13,755 13,755 30,175 30,175
8, ¥f q)lj'i i2fo/P 29.802 29.802 65,935 65,935 Total workers tM 21,363 21,363 44,596 44,596
olF 8,439 8.439 21,339 21.339
9. G~II'\<f>IPc1<f> ~ CllolP 18,848 18.848 41.813 41.813 Main workers tM 15,981 15.981 33,622 33,622
olF 2,867 2.867 8,191 8.191
(Q~ 'EZl'O/P 6.709 6.709 17.315 17,315 Cultivators tM 5,731 5,731 14,474 14.474
olF 978 976 2,841 2,641
(ii)~~ 'EZl'o/P 3.055 3.055 10.249 10.249 Agricultural labourers
tM 2.228 2.228 6,538 6,538 olF 627 827 3,711 3,711
(iii) ql~ql~<f> ~ CJ>'Iff O!:fO/P 746 746 1,768 1,768 Household industry workers
tM 462 482 1.271 1.271 olF 264 264 497 497
(iv) 3'R< q)lj'i O!:folP 6,336 8,338 12,481 12,481 Other workers
tM 7,540 7,540 11,339 11.339
ofF 798 798 1.142 1.142
10. 0I<i<l<f>11"clij) ~ O!:folP 10,954 10.954 24,122 24,122 Marginal workers tM 5,382 5.382 10,974 10,974
olF 5,572 5,572 13.148 13,148
,(il ~ 'EZl'OIP 3.203 3,203 7.367 7.367 Cultivators ~M 1,688 1.688 3,614 3,614
ofF 1.515 1.515 3,753 3,753
(ii) ~~ O!:folP 5,790 5.790 13.494 13.494 Agricultural labourers
tM 2,381 2.381 5,382 5.382 ofF 3.409 3,409 8.112 8,112
(iii) QI~qIRCb ~ q;<ff 'EZl'oIP 376 376 1.026 1,026 Household industry workers
tM 98 98 320 320 olF . 278 278 706 706
(iv) 3'R<~ 'EZl'otP 1,565 1.585 2,235 2,235 Other workers ~M 1,215 1,215 1,658 1,658
ofF 370 370 577 577
11. fR <I>4l ClIolP 46,321 46,321 96,072 96,072 Non-workers
t~F 18.162 18.162 38.521 38.521 28,159 28.159 57.551 57.551
124
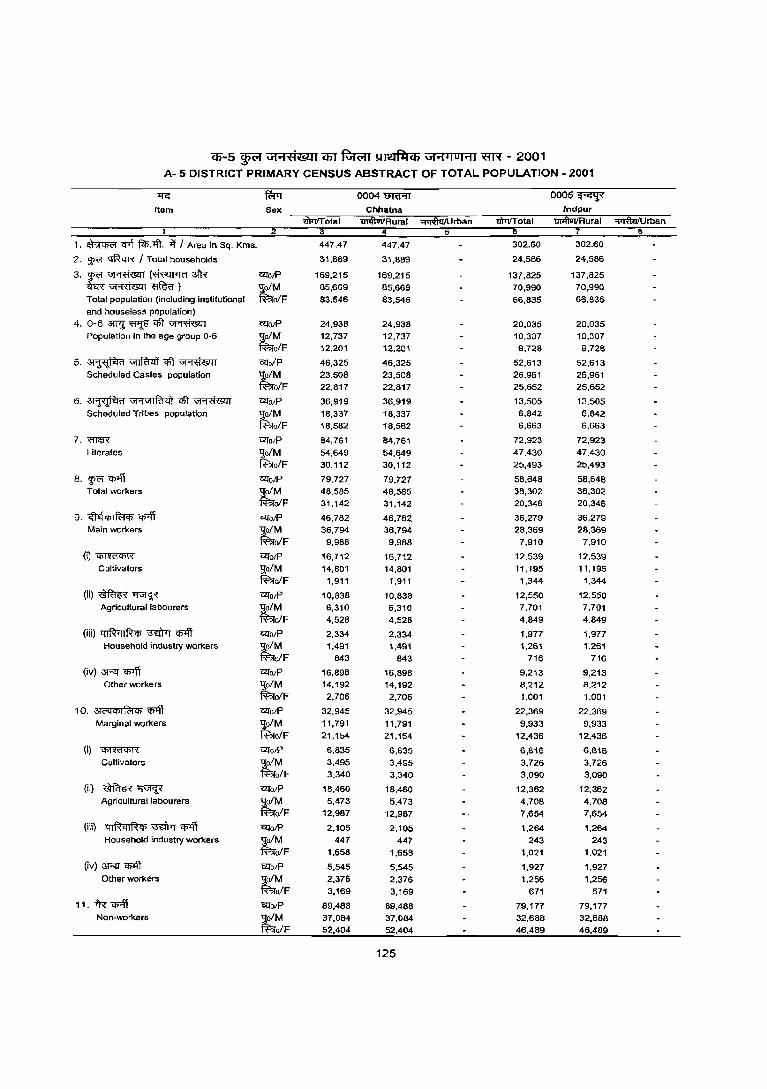
Cil-5 WR U1"i'fit_c:a1 Qi1 ~ ~ U1<i.I UI .... 1 ~ - 2001 A- 5 DISTRICT PRIMARY CENSUS ABSTRACT OF TOTAL POPULATION - 2001
l{<; fWT 0004 ma;rr 0005~
Item Sex Chhatna Indpur
iiiTTIT olal 1JT1ftvItRural lIiill"liHural ~Urban 1 2 4 8
1. ~ CfTI f<P.-.fi. if I Area in Sq. Kms. 447.47 447.47 302.60 302.60
2. w<'f ~ I Total households 31,889 31,889 24.586 24,586
3.~~~31R CZTotP 169,210 169,215 137,825 137,820
tER~~) ~ofM 85,669 85,669 70,990 70,990 Total population (including Institutional fao/F 83,546 83,546 66,835 66,835
and houseless population)
4. 0-6 ~~qlt~ CZTotP 24,938 24,938 20,035 20,035 Population in the age group 0-6 ~o/M 12,737 12,737 10,307 10,307
fao/F 12,201 12,201 9,728 9,728
5.~~qfi~ CZTo/p 46,325 46,325 52,613 52,613 Scheduled Castes population ~o/M 23.508 23,508 26.961 26.961
fao/F 22,817 22,817 25,602 20.652
6. ~ \iJ'1\iJIR1<i1 ~~ CZ[O/P 36,919 36,919 13,505 13.505 Scheduled Tribes population
~ 18,337 18,337 6,842 6,842
o/F 18,582 18,582 6,663 6,663
7.~ CZlO/P 84,761 84,761 72,923 72,923
Literates ~ofM 54,649 54,~49 47,430 47,430
fao/F 30,112 30,112 25,493 25,493
8. w<'f CJ>1fi CZlo/P 79,727 79.727 58.648 58.648 Total workers "9;ofM 48,585 48,585 38,302 38,302
faofF 31,142 31,142 20,346 20,346
g. ,('hi q, I fc:t q, <fflff CZlo/P 46,782 46,782 36,279 36,279 Main workers tM 36,794 36,794 28,369 28,369
ofF 9.988 9.988 7,910 7.910
(i)~ CZlolP 16,712 16,712 12.539 12.539 Cultivators "9;o/M 14,801 14,801 11,195 11,195
fuofF 1,911 1,911 1,344 1,344
(ii)~~ CZlo;P 10,838 10,638 12,550 12,550 Agricultural labourers tM 6,310 6,310 7,701 7,701
ofF 4,528 4,528 4.84g 4,849
(iii) 41~qIR4i ~ CJ>1fi CZlo;P 2,334 2,334 1,977 1,977 Household industry workers tM 1,491 1,491 1,261 1,261
ofF 843 843 716 716
(iv) 3f"q CJ>1fi CZlo;P 16,898 16,898 9,213 9,213 Other workers "9;o/M 14,192 14,192 8,212 8,212
R'?IoIF 2,706 2,706 1.001 1.001
10. ~ c;q q; I R1 q, Cj)lff C2lo;P 32,945 32,945 22,369 22,369
Marginal workers ~M 11,791 11,791 9,933 9,933 olF 21,154 21,154 12,436 12,436
(i) ~ CZlOiP 6,835 6,835 6,816 6,816 Cultivators tM 3,495 3,495 3,726 3,726
o/F 3,340 3,340 3,090 3,090
(ii) ~~ CZlo;P 18,460 18,460 12,362 12,362 Agricultural labourers y,ofM 5,473 5,473 4,708 4,708
~o/F 12,987 12,987 7,654 7,654
(iii) ql~qiR4i mm..-r ~ CZlotP 2.105 2,105 1,264 1,264 Household industry workers tM 447 447 243 243
ofF 1.658 1,658 1,021 1,021
(iv) 3RT C!>'lT CZlO/P 5,545 5,545 1,927 1,927 Other workers tM 2,376 2,376 1,256 1,256
olF 3,169 3,169 671 671
11, fR '4J1ff CZlOIP 89,488 89,488 79,177 79,177 Non-workers tM 37,084 37,084 32,688 32,688
o/F 52,404 52,404 46,489 46,489
125

en-5 ~ "1"'1':c:tot.c<Q1 C6T R;rcm ~ "1"'1 310 1"'11 ~ - 2001 A- 5 DISTRICT PRIMARY CENSUS ABSTRACT OF TOTAL POPULATION - 2001
1lG fWT 0006~-1 0OO7~-1I
Item Sex Bankura - I Bankura -II >WTrTotal lJI1lluIIRural ~rban >WTrTotal ~Aural ""'~Q/1.)rban
1. ~ crt fcIr.>fi. Ti / Area in Sq. Kms. 171.09 171.09 220.84 220.84
2. :fR ~ I Total households 17,62'
17,621 23,457 23.457
3.~~(~3l'R 'Ul'O/P 95,840 ~5,840 123,415 123,415 <hR~~) tM 49,083 49,083 63,330 63,330 Total population (including institutional o/F 46,757 46,757 60,OS5 60,085 and houseless popu lalion)
4. 0-5~~qft~ 'Ul'D/P 13,938 13,938 17,544 17,544 Populatior. in the age group 0-6 tM 7,189 7,189 9,061 9,061
o/F 6,749 6,749 8,483 8,483
5.~~ctt~ 'Ul'o/P 35,029 35,029 35,659 3S,659 Scheduled Casles population ~DIM 17,842 17,842 17.952 17.952
f60/F 17,187 17.187 17,707 17,707
5. ~ <Jt"j\iIIRtq~ ctt ~ 'Ul'DiP 6383 6,383 3,491 3,491 Scheduled Tribes population tM 3,283 3,283 1,786 1,786
olF 3,100 3,100 1.705 1,705
7. mw. 'Ul'o/P 51,796 51,796 67,757 67,757 Literates ;tM 32.544 32,544 42,202 42,202
o/F 19,252 19,252 25,555 L5,555
8. ~ <IT'ff 'C2l'oiP 39,656 39,656 60,460 60,460 Total wor1<.ers. tM 27,308 27,308 38,489 38,489
o/F 12,348 12,34B 21,971 21,971
9. <fIU¢Ifc:i¢ 'q)1ff 'C2l'OIP 26.102 26,102 36.642 36.642 Main workers tM 21,545 21,545 30,131 30,131
olF 4,557 4,557 6,511 6,511
(i)~ 'C2l'o/P 7,~44 7,244 10,909 10,909 Cultivators ~M 6,532 6,532 9,954 9,954
olF 712 712 955 955
(ii)~x~ 'Ul'o/p 5,261 5,261 6.418 6.418 Agricultural labourers ~M 3,295 3,295 4,198 4,198
0/.= 1,966 1,966 2,221) 2,220
(iii) 41R41R¢ ~ q;'4'i '1ZfotP 2,320 2,320 2.398 2,398 Household Industry wor1<.ers tM 1,721 1,721 1.419 1,419
olF 599 599 979 979
(iv) ~ 1IJ1ff C!l'o/p 11,277 11,277 16.917 16.917 Other workers tM 9,997 9,997 14,560 14,560
o/F 1,280 1,280 2.357 2,357
10. 3l<'4¢1f<;t¢ ~ '1ZfotP 13,554 13,554 23,818 23,818 Marginal workers -g;o/M 5,763 5,763 8,358 8,358
f60/F 7,791 7,791 15,460 15,460
(il ~ '1ZfotP 2,610 2,610 9,400 9,400 Cultivators
~ l,37B 1,378 3,277 3,277
o/F 1.232 1.232 6.123 6,123
(ii) ~~ '1Zfo/P 7,873 7,873 8,038 8,038 Agricultural labourers tM 2,697 2.697 2.694 2,694
olF 5.176 5.176 5,344 'j,34~
(iii) 4IRqlf,l¢ ~ q,1ff t2:Io/p 681 681 1.734 1,734 Household industry wor1<.ers tM 169 169 317 317
o/F 512 512 1,417 1,417
(ivJ 3l""Il' <f>Iff 'C2l'otP 2,390 2.390 4,646 4,646 Other workers tM 1,519 1,519 2,070 2,010
ofF 871 871 2,576 2.576
11, i'R C!14T CQ"O/P 56,184 56,184 62,955 62,955 Non-wor1<.ers ljo/M 21,775 21,775 24,841 24.841
f'F;ro/F 34.409 34,409 38.114 38,114
126
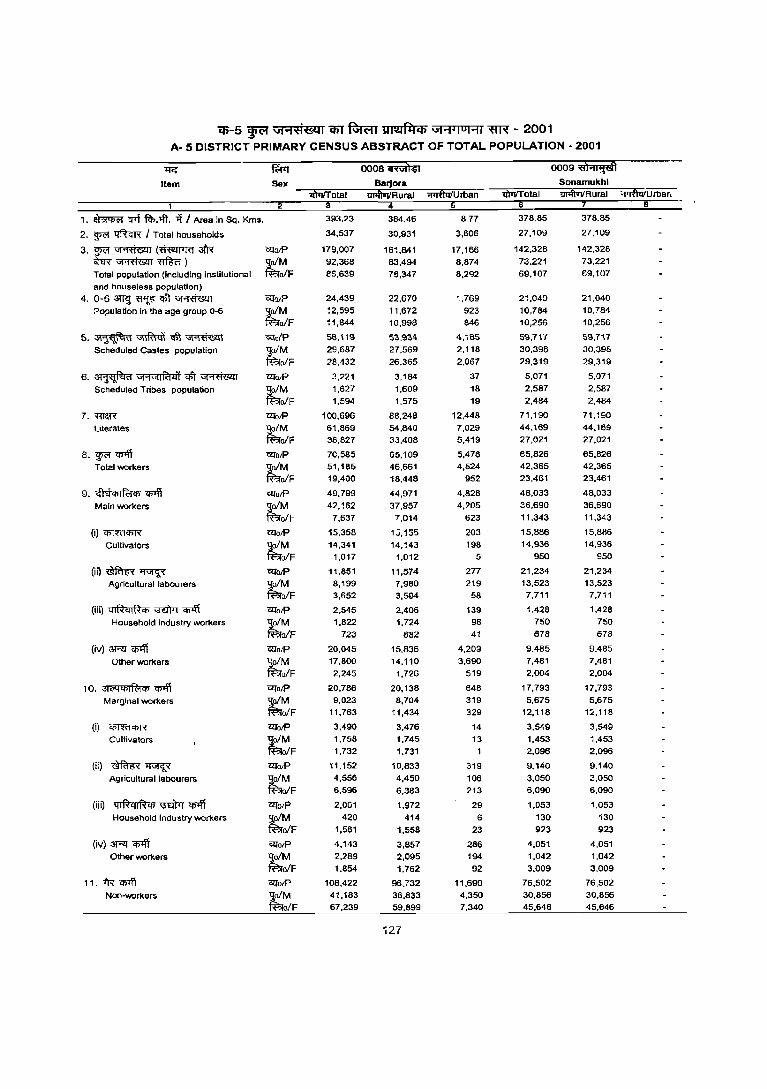
q;-5 ~ vt"'l-A'8lI1 <fiT ~ 1mQ~Cf) \>'1"1-1 0 1"'11 W'( - 2001 A- 5 DISTRICT PRIMARY CENSUS ABSTRACT OF TOTAL POPULATION - 2001
'IiG ~ 0008~ 0OO9~ Item Sex Sonamukhl
lIT'fiuTIRural ,,·I;!lQfUrbar. 1
1, ~ 'fIl1 f.t>,tft, Ti I Area in Sq, Kms, 393.23 384.46 8.77 378.85 378.85
2. W<'f 'I:!ftc:R I Total households 34,537 30,931 3,606 27,109 27,109
3, W\1 ~ (~3fR CZlOIP 179,007 16HWl 17,166 142,328 142,328
~~~) ~M 92,368 83,494 8,874 7:3,221 73,221
Total population (including institutional olF SS,639 76,347 8,292 69,107 S9,107
and houseless population) 4, 0-63tTq~~~ C<l0l? 24,439 22,670 1,769 21,040 21,040
Population In !he age group 0-6 ~M ~2,595 11,672 923 10,784 10,784
olF ~ 1,844 10,998 846 10,256 10,256
5.~~m\~ ~oIP 56,119 53,934 4,185 59,71'( 59.7~7
Scheduled Castes population lJofM 29,687 27,569 2,118 30,398 30,39S
~oJF 28,432 26.365 2,067 29.319 29,319
6. ~ "1'1"1IR14'f ~ ~ ~O/P 3,221 3,184 37 5,071 5,071
Scheduled Tribes population tM 1,627 1,609 18 2,587 2,587
ofF 1,594 1,575 19 2,484 2,484
7. mill' CZIO/P 100,696 88,248 12,448 71,190 7U90
literates tM 61.869 54,840 7,029 44,169 44,169
olF 38,827 33,408 5,419 27,021 27,021
8. w<'I 'I>'ff CZlO/P 7C,585 65,109 5,476 65,826 65,826
Tot.,1 workers tM 51,185 46,661 4,524 42,365 42,365
ofF 19,400 18,448 952 23,461 23,461
9. <ftel'hlfcl<t> m CZlotP 49,799 44,971 4,828 48,033 48,033
Main workers tM 42, ~62 37,957 4,205 36,690 36,690
ofF 7,637 7,014 623 11,343 11.343
(i)~ CZlO/P 15,358 13,135 203 15,886 15,B86
Cultivators tM 14,341 14,~43 198 14,936 14,936
ofF 1,017 1,012 5 950 950
(iO~~ '&IotP 11,851 11,574 277 21,234 21,234
Agricultural labourers tM 8,199 7,980 219 13,523 13,523
ofF 3,652 3,504 58 7,711 7,711
(iii) ql~qIR'h ~ ~ CZlO/P 2,545 2,406 139 1,428 1,428
Household industry workers ;tM 1,822 1,724 98 750 750
oIF 723 682 41 678 678
(iv) 3Fll' Cl>Iff ClIO/P 20,045 15,836 4,209 9.485 9.485
Other workers ~M 17,800 14,110 3,690 7,481 7,481
olF 2,245 1,726 519 2,004 2,004
10, ;,('Ilq;I~'h m C2fotP 20,786 20,138 648 17,793 17,793
Marginal workers tM 9,023 8,704 319 5,675 5,675
oIF 11,763 11,434 329 12,118 12,118
(i) ~ CZlotP 3,490 3,476 14 3,549 3,549
Cultivators tM 1,758 1,745 13 1.453 1.453
ofF 1,732 1,731 2,096 2,096
(ii) ~~ ClIO/P 11,152 10,B33 319 9,140 9,140
Agricultural labourers ~F 4,556 4.450 106 3,050 :3,050 6,596 6,383 213 6,090 6,090
(iii) ql~ql~q; '3"£itrr m '&IO/P 2,001 1.972 29 1,053 1,053
Household industry workers tM 420 414 6 130 130
ofF 1,581 1,558 23 923 923
(iV)3Rm CZlotP 4,143 3,857 286 4,051 4,051
Other workers tM 2,289 2,095 194 1,042 1,042
ofF 1,854 1,762 92 3,009 3,009
11. -fR Cl>lff ClIotP 10B.422 96.732 11.690 76.502 76.502
Non-workers tM 41,183 36,833 4,350 30,856 30,856
olF 67,239 59,899 7,340 45,646 45,646
.27
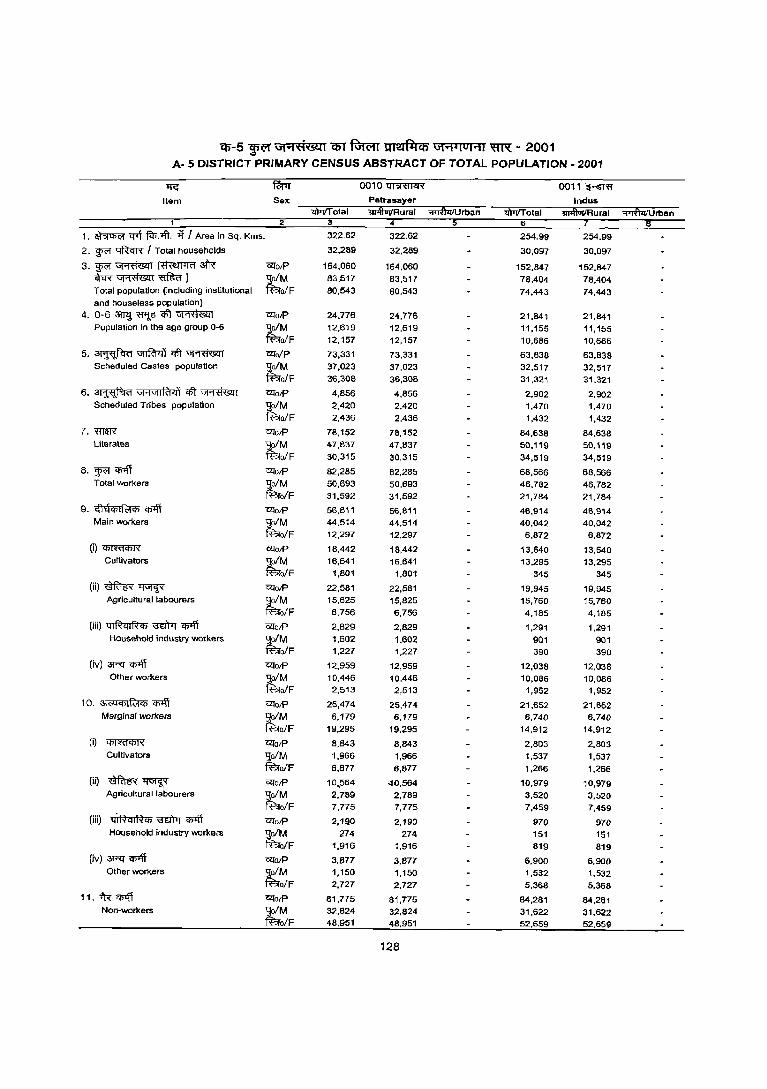
C6"-5 ~ \i1"1;8~.:a1 q)l"RMrr ~ \i1"1'IOI"1i ~ - 2001 A- 5 DISTRICT PRIMARY CENSUS ABSTRACT OF TOTAL POPULATION - 2001
lfi: ff;rrr 0010~ 0011~
Item Sex Indus "lI)T(/fotal JI11ftut.iRural :::r>TfuiIUrban
1 2 3
1, ~ "ifTf fcP,-.ft, it I Area in Sq, Kms, 322.62 322.62 254.99 254.99
2. WR 'IRcIR I Total households 32,289 32,289 30,097 30,097
3. ~ ~ (~3i'R' CllO/P 164,060 164,060 152,847 152,847 <hR'~~) '9;o/M 83,517 83,517 78.404 78.404 Total population (including institutional fBrofF 80,543 80,543 74,443 74,443 and house less population)
4. 0-6~~<tI~ CllO/P 24,776 24,776 21,841 21,841 population in the age group 0-6 '9;ofM 12,619 12,619 11,155 11,155
fBrofF 12,157 12,1:i7 10,686 10,686
5. ~ 'GIlf<'r<if <!It ~ Clfo/P 73,331 73,331 63,838 63,838 Scheduled Castes population
tM 37,023 37,023 32,517 32,517
ofF 36,308 36,308 31,321 31,321
6. ~ GF1"1IFct<ll <!It ~ ClfolP 4,856 4,856 2,902 2,902 Scheduled Tribes population
tM 2,420 2,420 1,470 1,470
ofF 2,436 2,436 1,432 1,432
7. mffi ClfO/P 78,152 78,152 84,638 84,638 Literates ~M 47,837 47,837 50,119 50,119
ofF 30,315 30,315 34,519 34,519
8, ~ 'Illff ClfolP 82,285 82,285 68,566 68,566 Total workers
;tM 50,693 50,693 46,782 46,782 olF 31,592 31,592 21,784 21,784
9. ~hl<t>I~Cl> ~ ClfolP 56,811 56,811 46,914 46,914 Main workers :Jo/M 44,514 44,514 40,042 40,042
fBrolF 12,297 12,297 6,872 6,872
(i)~ ClfolP 18,442 18,442 13,640 13,640 Cultivators
tM 16,641 16,641 13,295 13,295
ofF 1,801 1,801 345 345
(ii)~~ ClfolP 22,561 22,581 19,945 19,945 Agricultural labourers tM 15,825 15,825 15,760 15,760
ofF 6,756 6,756 4,185 4,185
(iii) QIRqIR<t> ~ 'Cl>1ff ClfO/P 2,829 2,829 1,291 1,291 Household industry workers ,:!oIM 1,602 1,602 901 901
fBrofF 1,227 1,227 390 390 (iv) 3Rl' '<f>llT ClfO/P 12,959 12,959 12,038 12,038
Other workers tM
10,446 10,446 10,086 10,086 ofF 2,513 2,513 1,952 1,952
10. 3l<"1CfiIR:\Cl> '<f>llT ClfolP 25,474 25,474 21,652 21,652 Marginal workers
t~F 6,179 6,179 6,740 6,74D 19,295 19,295 14,912 14,912
(il ~ ClfolP 8,643 8,843 2,803 2,803 Cultivators '101M 1,966 1,966 1,537 1,537
fBrolF 6,877 6,877 1,266 1,266 (ii) ~~ ClfolP 10,564 "iO,564 10,979 10,979
Agricultural labourers ~M 2,789 2,789 3,520 3,520 ofF 7,775 7,775 7,459 7,459
(iii) q'rRClIRCl> ~ ~ ClfO/P 2,IQO 2,190 970 97D Household industry workers ~M 274 274 151 151
ofF 1,916 1,916 819 819 (iv) 3RJ'<f>llT ClfO/P 3,877 3,877 6,900 6,900
Other workers ~M 1,150 1,150 1,532 1,532 ofF 2,727 2,727 5,368 5,368
11. -fR' q;..ff ~O/P 61,775 81,775 84,281 84,281 Non-workers tM 32,824 32,824 31,622 31,622
ofF 48,951 48,951 52,659 52,659
128
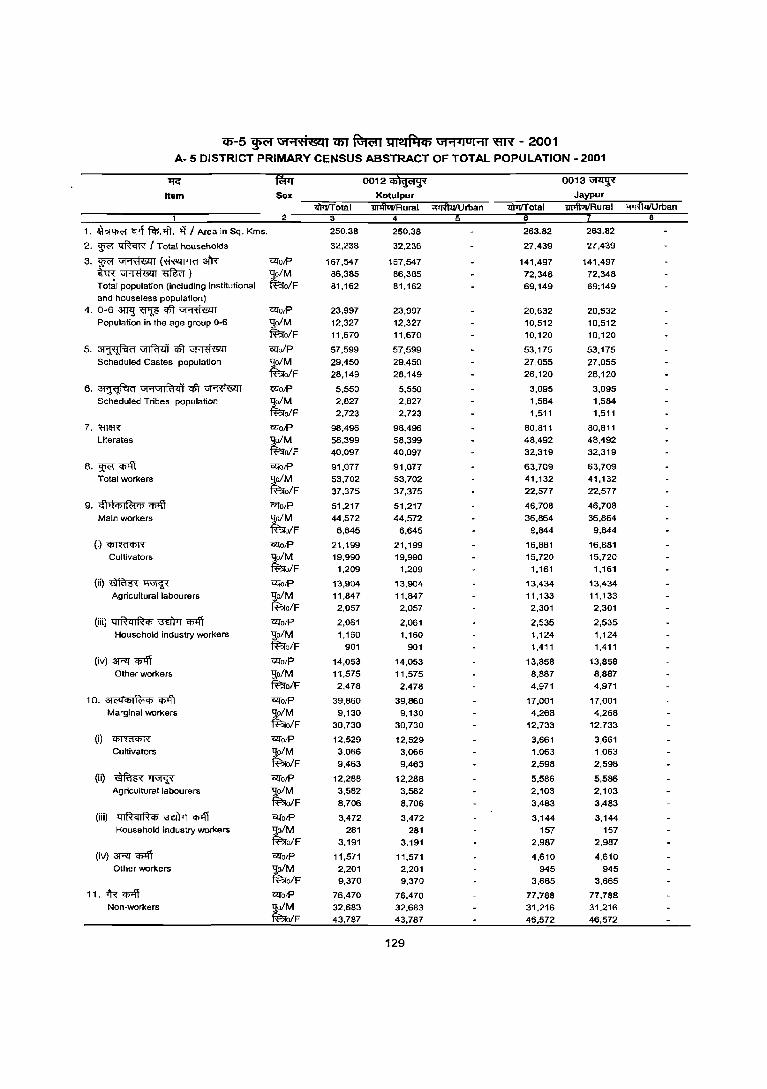
q;-5 ~ G1 ... ti'lWl em Rmffi lmIf'lCb G1 .... IUI ... 1 ~ - 2001 A- 5 DISTRICT PRIMARY CENSUS ABSTRACT OF TOTAL POPULATION - 2001
~ ~ 0012~ 0013~
Item Sex Kotulpur Jaypur
>ilt!rrota 1 '!IiiftVlIRural "I"iifuifU !ban 'iI\IiIT otal ~Rural ~rban 3 4
1. ~ qrf flf;.-.ft . .q / Area in Sq. Kms. 250.38 250.38 263.82 263.82
2. ~ ~ / Total households 32,238 32.236 27,439 27,439
3.~~(~al'R 'Ulo/P 167,547 167,547 141,497 141,497 ~~~)
tM 86,385 86,385 72,348 72,348 Total population (including institutional o/F 81,162 81,162 69,149 69;149 and houseless population)
4. 0-6~~qft~ 'UlotP 23,997 23,997 20,632 20,632 Population in the age group 0-6 So/M 12,327 12,327 10,512 10,512
fi?ro/F 11,670 11,670 10.120 10,120
5. ~~qft~ CI.Io/P 57,599 57,599 53,175 53,175
Scheduled Castes population -go/M 29.450 29.450 27.055 27,055 tao/F 28,149 28,149 26,120 26,120
6. ~ \i1.,\i1IR'1<ll qft ~ <;<l'O/P 5,550 5,550 3,095 3,095 Scheduled Tribes population
tM 2,827 2,827 1,584 1,584
o/F 2,723 2,723 1,511 1,511
7. miff'< czrO/P 98,496 98,496 80,811 80,811 Literates
tM 58,399 58,399 48,492 48,492
o/F 40,097 40,097 32,319 32,319
8.~~ czrO/P 91,077 91,077 63,709 63,709 Total workers -go/M 53,702 53,702 41,132 41,132
fi?ro/F 37,375 37,375 22,577 22,577
9. ~>lij)IR;Jij) ~ <'1lo/P 51,217 51,217 46,708 46,708
Main workers -go/M 44,572 44,572 36.864 36,864
fi?ro/F 6,645 6,645 9,844 9,644
(i)~ czrO/P 21,199 21,199 16,881 16,881 Cultivators
tM 19,990 19,990 15,720 15,720
o/F 1,209 1,209 1,161 1,161
(ii)~~ czro/P 13,904 13,904 13,434 13,434
Agricultural labourers tM 11,847 11,847 11,133 11,133
o/F 2,057 2,057 2,301 2,301
(iii) ql~ql~ij) \3"d)Tr Cf'llT <'1lo/P 2,061 2,061 2,535 2,535 Household industry workers So/M 1,160 1,160 1,124 1,124
fBl'o/F 901 901 1,411 1,411
(iv) '3R1' ~ <;!To/P 14,053 14,053 13,858 13,858 Other workers So/M 11,575 11,575 8,887 8,887
fi?ro/F 2,478 2,478 4,971 4,971
10. 3lt'<limR1<1> ~ 'i2fo/P 39,860 39,860 17,001 17,001 Mar9inal workers So/M 9,130 9,130 4,268 4,268
fBl'o/F 30,730 30,730 12,733 12,733
(i) ~ <2fO/P 12,529 12,529 3,661 3,661 Cultivators
tM 3,066 3,066 1,063 1,063
o/F 9,463 9,463 2,598 2,598
(iO ~~ <2fotP 12,288 12,288 5,586 5,586 Agricultural labourers So/M 3,582 3,582 2,103 2,103
fi?ro/F 8,706 8,706 3,483 3,483
(iii) q IIQ q I R <I> xmTrr Cf'llT <2foiP 3,472 3,472 3,144 3,144 Household industry workers
tM 281 281 157 157
o/F 3,191 3,191 2,987 2,987
(iv) 3RT '<I>lff <2fo/P 11,571 11,571 4,610 4,610 Othe r workers ~M 2,201 2,201 945 945
o/F 9,370 9,370 3,665 3,665
11. tR '<I>"ff <2fo/P 76,470 76,470 77,788 77,788 Non-workers
tM 32.683 32,683 31,216 31,216
o/F 43,787 43,787 46,572 46,572
129

C1)-5 ~ Gi"1ti(<;Q1 (fiJ ~ ~ \11"1'101"11 ~ - 2001 A- 5 DISTRICT PRIMARY CENSUS ABSTRACT OF TOTAL POPULATION - 2001
11c! fWr 0014~ 0015 if.iI Item Sex Vishnupur Ond ..
liltvTotal lll'ftarIRural ~Urban >!FT/Tolal iiTiftUiIRural ~Urban 2 4 6
1. ~~ Cflt fiP.lft. it I Area in Sq. Kms. 365.73 365.73 502.46 502.46
2. ~ 'I:fftclR I Total households 26,153 26,153 40,682 40,682
3. W"T ~ (~afix "fotP 138,768 138,768 220,572 220,572 W<~<;lff~) ~
71,200 71,200 112,875 112,875 Tolal population (including institutional ofF 67,568 67,568 107,697 107,697 arC! houseless population)
4. 0-6 3l1<J ~ qft ~9lT '&!U/P 22,726 22,726 35,175 35,175 Population in the age group 0-6 '9;o/M 11,682 11,682 17,865 17,865
~o/F 11,044 11,044 17,310 17,310
5. ~~q\'t~ (;((o/P 45,397 45.397 71,621 71,621 Scheduled Castes population
~ 22,911 22,911 36,119 36,119
o/F 22,486 22,486 35,502 35,502
6. ~ V1'1V1IRt41 ql1 ~ 'C<fo/p 10,678 10,678 10,553 10,553 Scheduled Tribes population
~ 5.468 5,468 5,328 5,328 olF 5,210 5,210 5,225 5,225
7. 'W1RX (;((o/P 67,678 67,678 110,875 110.875 Literates tM 42,482 42,482 69,570 69,570
olF 25,196 25,196 41,305 41,305
8. ~ <iJlff '&!o/p 61,739 61,739 111.905 111,905 Total workers ~ofM 39,787 39,787 68,379 68,379
ffi'o/F 21,952 21,952 43,526 43,526
9. Wq,;(c;{cp cn4T C!lo/P 45,270 45,270 70,189 70,189 MaIn workers ~M 35,160 3!;,160 56,497 56,497
Q/F 10,110 10,110 13,692 13,692
(i)~ '&!O/P 15,111 15,111 25,675 25,675 Cultivators ~M 14,126 14,126 23,045 23,045
olF 985 985 2,630 2,630
(ii)~~ Cll'O/P 14,940 14,940 20,970 20,970 Agric~Jtural labourers ~M 10,371 10,371 14,568 14,568
olF 4,569 4,569 6,402 6,402
(iii) 4IRCJIRCf> \3ET1'" "Cf>BT Cll'O)p 1,943 1,943 3,488 3,488 Hcusehold industry worl(ers lJo/M 845 845 2,158 2,158
fu;{o/F 1,Ol'B 1,098 1,330 1,330
(iv) ~ <I1'4T ~O/P 13,276 13,276 20,056 20,056 Other workers tM 9,818 9,818 16,726 16,726
olF 3,458 3,458 3,330 3,330
10. 31<><1Cf>IR:t1i <iJlff t:l:!o/P 16,469 16.469 41,716 41,716 Margir!al workers 9;o/M 4.627 4.627 11,882 11,882
~J/F 11,842 11,842 29,834 29,834
(i) ~ C!lclP 2,605 2,605 16,017 16,017 Cultivators ~M 1,067 1,067 4,175 4,175
olF 1,538 1,538 11,842 11,842
(ii) ~RtR~ mO/P 6,730 6,730 15,449 15,449 Agricultural labourers ~M 2,103 2,103 4,728 4.728
=;;rolF 4,627 4,627 10,721 10,721
(iii) qIRqIRiI.~~ mO/P 3,196 3,196 2,903 2,903 HO.Jsehoid industry workers tM 257 257 433 433
ofF 2,939 2,939 2,470 2,470
(iv) 31"1:! <iJlff molP 3,938 3,938 7,347 7,347 Other workers ~M 1,200 1,200 2,546 2,546
elF 2,738 2,738 4,801 4,801
i1. i'R ~ 'C<fO/P 77,029 77,029 108,667 108,667 Non-workers tM 31,413 31,413 44,496 44,496
o/F 45.616 45,616 64,171 64,171
130

Cff-5 ~ U1 .... t1OL<41 COT ~ ~ U1"1.IUHI ~ - 2001 A· 5 DISTRICT PRIMARY CENSUS ABSTRACT OF TOTAL POPULATION· 2001
"I'<:' ~ 0016 <1I<'I;Si'I~1 0017 Iil'f<'IlQl<'I
Item Sex Taldangra Simiapal ll)iTfTotal 1iiiIlViiRurai ;r1JffltIlJ rban <iI>'T!T otal ~Rural "'Illfui/u rban
1 2 4 6 8
1. ~ ~ fcl;:oft. ~ I Area in Sq. Kms. 349.74 349.74 310.15 310.15
2. ~ ~ ! Total households 24.256 24.256 23,826 23.826
3. "¥J ~ (~ afR' ~OfP 128,747 128,747 127,445 127,445 lhff~~) tM 65,713 65,713 65,297 65.297 Total population (including in&titutional ofF 63,O!4 63.034 62.148 62.148 and houseless population)
4. o-63Wl~<tft'~ ~OfP 19,465 19,465 18,167 18,167 Population in the age group 0-1; -qalM 9.B97 9.B97 9,376 9,376
~o/F 9,568 9,568 8,791 8.791
5.~~~~ C!:Io/p 30,556 30,556 31.831 31,831 Scheduled Castes population -qofM 15,568 15,568 16,116 16,116
~o/F 14.988 14,988 15,715 15,715
6. ~ "1'1"1IRt'li qlT ~ C!:IofP 17,848 17,848 18,890 18,890 Scheduled Tribes population tM 8,938 8,938 9,431 9.431
o/F B.910 8,910 9,459 9,459
7. W&R 12:!ofP 71,311 71,311 69,116 69,116 Literates tM 43,750 43.750 43,274 43,274
ofF 27,561 27,561 25,842 25,842
8. "¥J<IfIff 12:!OIP 51.979 51,979 53,850 53.850 T ota I workers '\IofM 36,258 36,258 35,824 35,824
~o/F 15,721 15.721 18,026 18,026
9. cfl Q<I>Ifc:t <Ii <1>"\1 12:!olP 32,887 32,887 39,843 39,843 Main workers "lo/M 28,082 28,082 29,895 29,~95
~o/F 4,805 4.805 9.948 9,948
(i)~ 12:!OfP 13,129 13,129 13.564 13,564 Cultivators tM 12,539 12,539 12,151 12,151
olF 590 590 1,413 1,413
(ii)~~ 12:!ofP 9,745 9,745 14,374 14,374
Agricultural labourers "lo/M 7,164 7,164 B.I84 8,184
~o/F 2,581 2,581 6,190 6,190
(iii) ql~ql~<I> i3t.ITrT <IMT C!:IofP 1,228 1,228 2,414 2,414 Household industry workers -qo/M 816 816 1,096 1,096
fBro/F 412 412 1,318 1,318
(iv) 3RT CIllff CZlOfP 8,7B5 B,785 9,491 9,491 Other workers ~ 7,563 7,563 8,464 8,464
o/F 1,222 1,222 1,027 1,027
10. 31('Q<I>Ifc:t<l> <1>"\1 12:!OIP 19,092 19,092 14,007 14,007 Marginal workers ;tM 8,176 8,176 5,929 5,929
olF 10,916 10,916 8,078 8,078
(i) ~ ~OfP 3,073 3.073 2,047 2,047 Cultivators
~F 2,065 2,065 1,355 1,355 1,008 1,008 692 692
(ii) ~~ CZlOfP 12,752 12,752 B,618 8,618 Agricultural labourers ;tM 4,820 4,820 2,971 2,971
ofF 7,932 7,932 5,647 5,647
(III) ql~ql~<I> ~ <Il'fi CZlOfP 1,376 1,376 1,469 1,469 Household industry workers tM 231 231 321 321
ofF 1,145 1,145 1,148 1,148
(iv) 3Rt Cf>Iff ~otP 1,891 1,891 1,873 1,873 Other workers ~M 1,060 1,060 1.282 1,282
olF 831 831 591 591
11. -.'R- 'I'>'ff CZlOIP 76,768 76,768 73,595 73,595 Non-workers tM 29,4.55 29,455 29,473 29,473
o/F 47,313 47,313 44,122 44,122
131
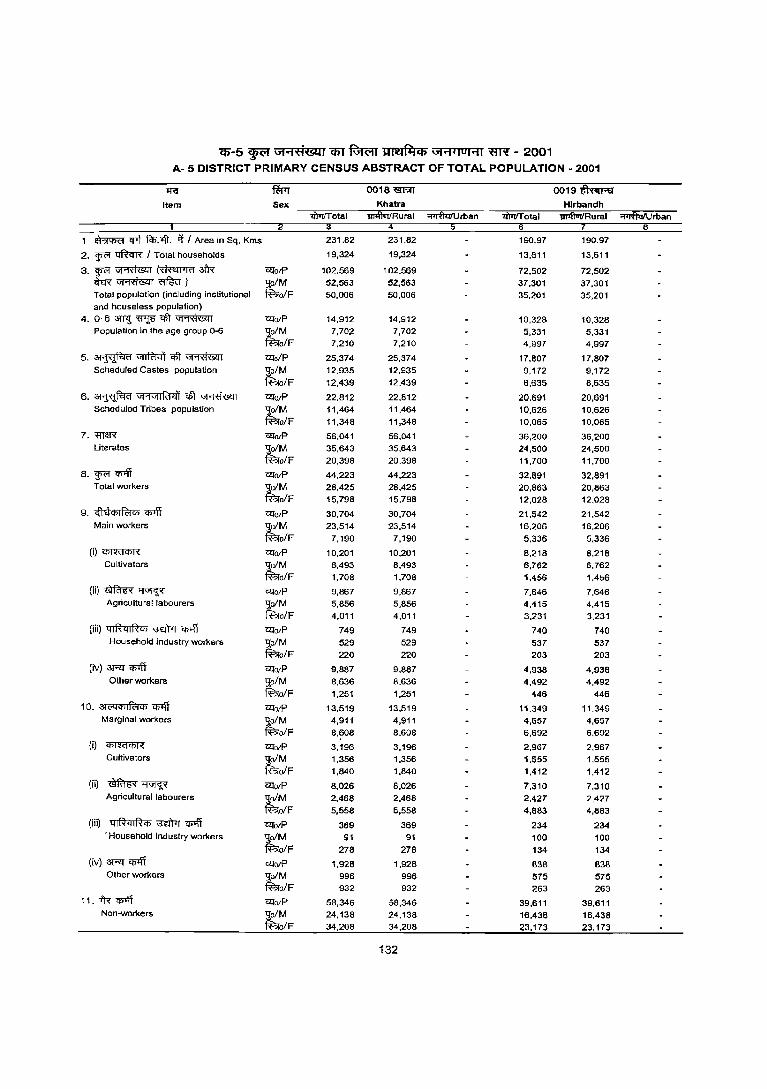
q;-5 ~ GI"iti&Ol1 em ~ ~ GI"iJIOI"i1 ~ - 2001 A- 5 DISTRICT PRIMARY CENSUS ABSTRACT OF TOTAL POPULATION - 2001
1fG fWy 0018~ 0019~ Item Sex Khatra Hlrbandh
'lI'PtIT otal 1IT'flnttR u ral "I"'TfuiIu rban >iPTlTotal '!n'fIuIIRural ~Urban 3 4 6 B
1 ~ crr\ f<li.-.fi. if I Area in Sq. Kms. 231.82 231.82 190.97 190.97
2. ~ ~ I Total households 19.324 19,324 .13,611 13,611
3.g;<'!~~~ ~olP 102,569 102.569 72,502 72,502 <hR~~) "9:o/ M 52,563 52,563 37,301 37,301 Total population (including institutional ~o/F 50,006 50,006 35,201 35,201 and houseless population)
4. 0-5 3'mJ ~ qft ~ ~O/P 14,912 14,912 10,328 10,328 Population in the age 9rouP 0-6 "9:oIM 7,702 7,702 5,331 5,331
~o/F 7,210 7,210 4,997 4,997
5.~~qlt~ ~o/P 25,374 25,374 17,807 17,807 Scheduled Castes population
~ 12.935 12,935 9,172 9,172
o/F 12,439 12,439 8,635 8,635
6. ~ Gj'l'il1Rl41 qft ~ ~otP 22.812 22.812 20.691 20.691 Scheduled Tribes population :J;oIM 11,464 11.464 10,626 10,626
~o/F 11,348 11,348 10,065 10,065
7. 'ffie.R ~olP 56,041 56,041 36,200 36,200 Literates r 35,643 35,643 24,500 24,500
o/F 20,398 20,398 11,700 11,700
8.~"CIf'ff ~O/P 44,223 44,223 32,891 32,891 Total workers :J;oIM 28,425 28,425 20,863 20,863
~o/F 15,798 15,798 12,028 12,028
9. eft tlChIfc;jCh CI>1\T <:!lo/P 30,704 30,704 21,542 21,542 Main workers :J;oIM 23,514 23,514 16,206 16,206
~o/F 7,190 7,190 5,336 5,336
(i)~ ~O/P 10.201 10,201 8,218 8,218 Cultivators
~ 8,493 8,493 6,762 6,762
o/F 1,708 1,708 1,456 1,456
(ii)~~ ~O/P 9,867 9,867 7,646 7,646 Agricultural labourers :J;oIM 5,856 5,856 4,415 4,415
~o/F 4,011 4,011 3,231 3,231
(iii) ql~qIRCf> \roM ~ ~O/P 749 749 740 740 Household industry workers r 529 529 537 537
o/F 220 220 203 203
(iv) 3T'XT 'fi1ff <:!lo/P 9,887 9,887 4,938 4,938 Other workers :J;o/M 8,636 8,636 4,492 4,492
~o/F 1,251 1,251 446 446
10. ;-jj<'4Cf>Ifc;jep CIJ1ff <:!lo/P 13,519 13,519 11,349 11,349 Marginal workers
~ 4,911 4,911 4,657 4,657 ofF 8,608 8,608 6,692 6,692
(i) ~ <:!lo/P 3,196 3,196 2,967 2,967 Cultivators
(tM 1,356 1,356 1,555 1,555 -P.:!o/F 1,840 1,840 1,412 1,412
(ii) ~~ <:!lorP 8,026 8,026 7,310 7,310 Agricultu ral labourers
tM 2,468 2,468 2,427 2,427
olF 5,558 5,558 4,883 4,883
(iii) 4tRqlRCh ~ CI>1\T <:!lo/P 369 369 234 234 , Household industry workers :J;oIM 91 91 100 100
~o/F 278 278 134 134
(iv) 3T'XT ~ ~OfP 1,928 1,928 1'.38 1'.38 Other workers
~ 996 996 575 575 o/F 932 932 263 263
11. fR 'I>'ff ~O/P 58,346 58,346 39,611 39,611 Non-workers
~ 24,138 24,138 16,438 16,438 olF 34,208 34,208 23,173 23,173
132
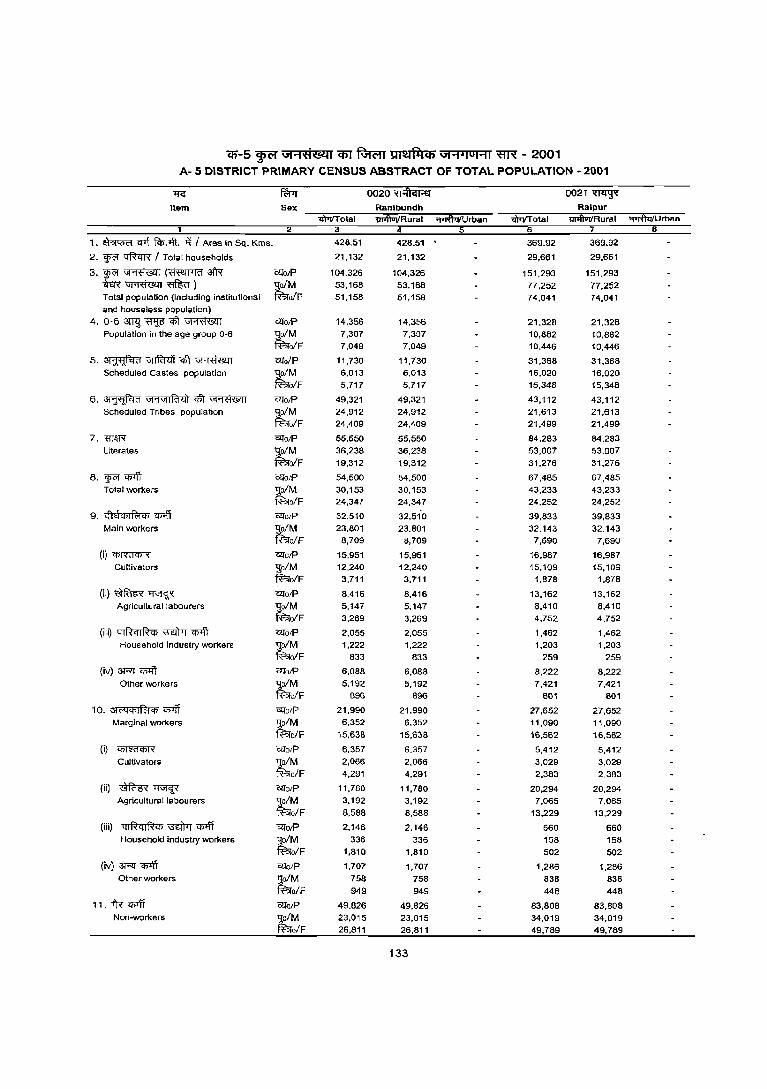
Cff-5 ~ \>1"'1;H'l.'lJ' q;y ~ ~ \>1"'1.,oH' ~ - 2001 A- 5 DISTRICT PRIMARY CENSUS ABSTRACT OF TOTAL POPULATION - 2001
~ fAA 0020~ 0021~
Item Sex Ranlbundh Ralpur 'tIlTtrT otal lIi41uilRural ~Urban m.vTotal IlI41UIIRural ~rban
1 2 3 4 6
1. ~ Cflt F<vAt it I Area in Sq. Kms. 423.51 '128.51 369.92 369.92
2. w<'f ~ I Total households 21,132 21,132 29,661 29,661
3, w<'f ~ (~ afR C1fO/P 104,326 104,326 151,293 151,293
~~~) ~M 53,168 53,168 77,252 77,252 Total population (including institutional ofF 51,158 51,158 74,041 74,041 and houseless population)
4, 0-6 3n<j ~ cGr ~ CZiolP 14,356 14,356 21,328 21,328 Population in the age group 0-6 lJo/M 7,307 7,307 10,882 10,882
fu;ro/F 7,049 7,049 10,446 10,446
5.~~qft~ CZiolP 11,730 11,730 31,368 31,368 Scheduled Castes population 301M 6,013 6,013 16,020 16,020
fu;ro/F 5,717 5,717 15,348 15,348
6. ~ "1'1"111<1<11 -$I ~ CZiO/P 49,321 49,321 43,112 43,112
Scheduled Tribes population ~M 24,912 24,912 21,613 21,613
o/F 24,409 24,409 21,499 21,499
7. mS:'R CZiO/P 55,550 55,550 84,283 84,283 Literates ~M 36,238 36,238 53,007 53,007
o/F 19,312 19,312 31,276 31,276
8. w<'f C!>'lT ClfO/P 54,500 54,500 67,485 67,485
Total workers lJo/M 30,153 30,153 43,233 43,233
fao/F 24,347 24,347 24,252 24,252
9. <;1£1"'1 f<;j iii '1Plfi CZiO/P 32,510 32,510 39,833 39,833
Main workers tM
23,801 23,801 32,143 32,143
o/F 8,709 8,709 7,690 7,690
(i)~ CZiorP 15,951 15,951 16,987 16,987 Cultivators '9;o/M 12,240 12,240 15,109 15,109
fu;ro/F 3,711 3,711 1,878 1,878
(ii)~~ CZiOIP 8,416 8,416 13,162 13,162
Agricultural labourers '9;o/M 5,147 5,147 8,410 8.410
~ofF 3,269 3.269 4.752 4,752
(iii) QIRqIR", ~ "C!14T CZiorP 2,055 2,055 1,462 1,462 Household industry workers lJo/M 1,222 1,222 1,203 1,203
fBlo/F 833 833 259 259
(iv) 3RI' '1Plfi CZiorP 6,088 6,088 B,222 8,222
Other workers ~M 5.192 5,192 7,421 7,421 olF 898 698 601 801
10. ~<"l"'IRtqi "C!14T '&To/P 21,990 21,990 27,652 27,652 Marginal workers '9;o/M 6,352 6,352 11,090 11,090
~o/F 15,638 15,638 16,562 16,562
(i) ~ ClforP 6,357 6.357 5,412 5,412
Cultivators 'jo/M 2,088 2,066 3,029 3,029 fBloJF 4,291 4,291 2,383 2,383
(ii) ~~ CZiorP 11,780 11,780 20,294 20,294 Agricultural labourers tM 3,192 3,192 7,065 7,065
olF 8,588 8,58B 13.229 13,229
(iii) q IRq I R '" \m'trT '1Plfi CZiO/P 2,146 2,146 660 660 Household industry workers
tM 336 336 158 158
o/F 1,810 1,810 502 502
(iv) 3Rl' '1Plfi CZiorP 1,707 1.707 1,286 1,286 Other workers 1JofM 758 758 838 838
fu;ro/F 949 949 448 448
11. tR C!>'lT C2l'o/P 49,B26 49,826 83,80B 83.B08 Non-workers '9;o/M 23,015 23,015 34,019 34,019
ff';;o/F 26,811 26,811 49,789 49,789
133

cp-5 ~ ijH;H<§ll1 1f)T ~ Ul2l~q; "1'1'101""11 ~ - 2001 /1.- 5 DISTRICT PRIMARY CENSUS ABSTRACT OF TOTAL POPULATION - 2001
1'Il;' ~ 0022'«lt1iT
Item Sex Sarenga 'iIiIl\V!IRural ~rban
1. ~ ~ F<P.>fi. if I Area In Sq. Kms. 223.78 223.78
2. ~ ~ I Total households 18.185 18,185
3.~~(~~ czrolP 95,128 95,128 ~~~) tM 48,759 48,759 Total population (including Institutional oIF 46,369 46,369 and houseles$ population)
4, 0-6 3WJ ~ '1ft ~ czrolP 13,293 13,293 population in the age group 0-6 tM 6,651 6,651
oIF 6,442 6,442
5. ~ ;:;ntm:if '1ft ~ GUoIp 26,443 26,443 Scheduled Castes population tM 13,530 13,530
oIF 12,913 12,913
6. ~ VI'NlIR'14'i ~ ~ GUoIP 18,648 16,648 Scheduled Tribes population
~ 9,412 9,412 oIF 9,436 9,436
7.~ GUolP 56,205 56,205 Literates tM 34,814 34,614
'ofF 21,391 21,391
8. ~ cp;ff GUotP 40,512 40,512 Total workers tM 26,257 26,257
'ofF 14,255 14,255
9. ctld"'I~Cj) <f-lff GUotP 25,609 25,609 Main workers tM 20,103 20,103
oIF 5,506 5,506
(i)~ GUO/P 9,560 9,560 Cultivators tM 8,502 8,502
oIF 1,058 1,058
(ii)~~ GUOIP 8,nl 8,221 Agricultural labourers ~M 5,015 5,015
oIF 3,206 3,206
(ilQ qIR,uR", ~ ~ CllotP 1,028 1,028 Household Industry workers ~M 633 633
oIF 395 395
(iv) 3R:! q;;ff CllOlP 6,800 6,800 Other WOJI(ers ~M 5,953 5,953
oIF 847 847
10. 31<44'>IR;j", cp;ff <2fotP 14,903 14,903 Marginal workers
t~F 6,154 6,154 8,749 8,749
(i) ~ ~otP 2.288 2.288 Cultivators
~F 1.410 1,410 878 878
(iQ ~~ CllotP 10,114 10,114 Agricultural labourers t;M 3,791 3,791
'ofF 6,323 6,323
(iii) qIRqIRCfj~~ czrotP 1.080 1,080 Household industry workers ~M 120 120
oIF 960 960
(iv) 3R:! ~ 'UTaIF' 1,421 1.421 Other workers ~M 833 833
o/F 588 588
11. 1R"Cfi"Iff urolF' 54,616 54,616 Non-workers tM 22,502 22.502
ofF 32,114 32.114
134

iJ)-5 ~ iJ'I"'1'<1®1 Cffi fGR;rr ~ iJ'I"'1'jOj"'1j 'ffi"{ - 2001 A- 5 DISTRICT PRIMARY CENSUS ABSTRACT OF TOTAL POPULATION - 2001
~
Item
1, ~ err! fcl>.>ft. it / Area in Sq, Kms,
2, ~ ~ f Tolal households
3,~~(~3tR ihR~~) Total population (including institutional and houseless population)
4, 0-6 ~ ~ <1ft ~ Population in the age group 0-6
5,~~~~ Scheduled Castes population
6, ~ GI'1G11RI'1l1 <tt ~ Scheduled Tribes population
7, "ffi1lN Literates
8, WC'I ~ Total workerll
9, GIQcplf<;jcp"Cj)lj1
Main workers
(i)~
Cultivators
(ii)~~ Agncullurallabourers
(iii) Qlf,)cllRcp \JritT[ ~
Household industry workers
(iv) 3RT <"1JIff Other workers
10. 3\('Clcplf<;jcp ~
Marginal workers
(i)~
Cultivators
(ii)~~ Agricultural labourers
(iii) ql~qIR4l 'i3ElPT <"1JIff Household industry workers
(IV) 3Rl~ Other workers
11. i'R <P'ff Non-workers
Sex
lSIlotP
1jolM fi=;To/F
lSIlotP
1jolM fi=;ToIF
lSIlo/P
'9;o/M fi=;To/F
lSIlO/P
-go/M ~o/F
UfO/P
lJo/M fa'o/F
lSIlOIP
llo/M fi=;To/F
'i2fo/P
-go/M fa'o/F
'i2fotP
~F lSIlO/P
lJo/M lBIo/F <UO/P
'Jo/M tB.o/F
'iZJo/P -go/M lBIo/F
orro/P -golM 1BI'o/F
<UotP
lJo/M tB.o/F
<UO/P
:lo/M tB.o/F
lSIlotP
'9;o/M f'F.;ro/F
<uotP 'Jo/M !'BrafF
ClTO/P
-gO/M ~O/F
tiPtlTotal a
6,259.00
449,895
2,536,516 1,298,078 1,238,438
408,803 208,105
200,698
463,956
237,724 226,232
463,452 235,097
228,355
1,182,284 803,494 378,790
1,127,488
679,022 448,466
645,506 497,262 148,244
243,043 187,885
55,158
121,357 76,728 44,629
51,547
30,639 20,908
229,559 202,010
27,549
481,982
181,760 300,222
109,669 43,451
66,218
284,866
96,283
188,583
32,919 8,588
24,331
54,528
33.438 21,090
1,409,028 619.056
789,972
14~ PURUUYA
6,179.63
403,601
2,281,090 1,165,054
1,116,036
376,446 191,353
185,093
408,706
209,575 199,131
456,573 231,508
225.065
1,014,101 704,628 309,473
1,054,271
616,816 437,455
581,447 440,972 140,475
242,174 187,091
55,083
120,915 76,360 44,555
50,127
29,473 20,654
168,231 148,048
20,183
472,824 175,844 298,980
109,210 43,230 65,980
283,646 95,784
187,862
32,491 8,387
24.104
47,477
28,443 19,034
1,226,819 548,238
678,581
135
79.37
46,294
255,426 133,024
122.402
32,357 16,752
15,605
55,250 28,149
27,101
6,879 3,589
3,290
168,183 98,866
69,317
73,217
62,206 11,011
64.059 56,290
7,769
869 794
75
442 368
74
1,420
1,166
254
61,328 53,962
7,366
9,158
5,916 3,242
459 221
238
1,220
499
721
428 201
227
7,051
4.995 2.056
182,209
70.818 111,391
230,47
17,956
111,768 58,186 53,582
20,847 10,592
10,255
15,216
7,844 7,372
11,063 5,747
5,316
45,564 33,929 11,635
53,831
30,260 23,571
26,809
21,037 5,772
13,340 10,833
2,507
2,697 1,915
782
3,323
1,569 1,754
7,449 6,720
729
27,022
9,223 17,799
5,507
1,972 3,535
17,689 5,713
11,976
2,226 543
1,683
1.600
995 605
57,937
27.926
30,011
0001~
230.47
17,956
111,768 58,186 53,582
20,847 10,592
10,255
15,216 7,844 7,372
11,063 5,747
5,316
45,564 33,929 11,635
53,831
30,260 23,571
26.809 21,037
5,772
13,340
10,833 2,507
2,697 1,915
782
3,323
1,569 1,754
7,449 6,720
729
27.022 9,223
17,799
5,507 1,972
3,535
17,689 5,713
11,976
2,226
543 1,683
1.600 995 605
57,937 27,926
30,011

q;-5 ~ \iI"1'<1'l.cql CfiT 'Riwrr ~ \i1'1'IOI'11 ~ - 2001 A- 5 DISTRICT PRIMARY CENSUS ABSTRACT OF TOTAL POPULATION -2001
~ ~ 0OO2~-11 0003 trm
Itom Sex Purulla -II Para >imlTotal 1IJ1llvVRurai ~Urban >imlTotal 1IJ1llvVRurai "I1'TfuItUrnan
2 4
1. ~ cpt fll;.>fi. if I Area in Sq. Kms. 310.10 310.10 312.59 304.77 7.82
2. ~ ~ I Total households 23,743 23,!.43 28,462 25,817 2,645
3.~~(~3lR C2Jolf' 142,707 142,707 174,620 162,696 11,924 ~~~) ~M 73,383 73,383 90,291 83,854 6,437 Total population (including institutional ofF 69,324 69,324 84,329 78,842 5,487 and houseless population)
4. 0-6 3Il<j ~ cit ~ C2Jolf' 24,767 24,767 29,711 28,541 1,170 Population in the age group 0-6 tM 12,698 12,698 15,250 14,646 604
ofF 12.069 12.069 14.461 13,895 566
5.~~~~ C2l'oIP 35,230 35,230 54,743 53,517 1,226 Scheduled Castes population tM 18,145 18,145 28,088 27,449 639
ofF 17,085 17,085 26,655 26,068 587
6. ~ VI'1V1IRi<ll cit ~ C2JOIP 6,156 6,156 8,004 7,470 534 Scheduled Tribes population tM 3,147 3,147 4,134 3,858 276
ofF 3,009 3,009 3.870 3,612 258
7. maR 'Cll0lP 66,250 66,250 84,181 74,576 9,605 Literates tM 45,805 45,805 57,297 51,707 5,590
ofF 20,445 20,445 26,884 22,869 4,015
8. '¥I cpoff '&IOIP 61,014 61,014 63,933 60,594 3,339 Total workers tM 37,514 37,514 43,885 40,818 3,067
ofF 23,500 23.500 20.048 19,776 272
9. 41'4C1"lIfc;t", <!>Iff '&IOIP 33,785 33.785 35,046 31.888 3,158 Main workers tM 27,255 27,255 30,528 27,600 2,928
ofF 6,530 6,530 4,518 4,288 230
(i)~ 'CllOlP 10,811 10,811 10,113 10,096 17 Cultivators tM 8,103 8,103 8,845 8,829 16
ofF 2,708 2,708 1,268 1,267 1
(ii)~~ ClIOIP 5,158 5.158 . 6.940 6,913 27 Agricultural labourers tM 3,488 3,488 5,337 5,316 21
ofF 1,670 1,670 1,603 1,597 6
(iii) 41RqlRCI"l ~ <l>'ff '&!alP 2,247 2,247 1,746 1,733 13 Household industry workers tM 1,515 1,515 1,414 1,403 11
ofF 732 732 332 330 2
(iv) 3RT~ 'Cllo/P 15,569 15,569 16,247 13,146 3,101 Other workers tM 14,149 14,149 14,932 12,052 2,880
ofF 1,420 1,420 1,315 1,094 221
10. 3t",",CI"lIR:!<t> cpoff ClIoif' 27,229 27,229 28,887 28,706 181 Marginal workers ;tM 10,259 10,259 13,357 13,218 139
ofF 16,970 16.970 15,530 15,488 42
(i) ~ ClIoif' 6,627 6,627 6.050 6.049 Cultivators tM 2,624 2,624 2,568 2,567
ofF 4,003 4,003 3,482 3,482
(ii) ~~ '&Iolf' 15,504 15,804 18,329 18,289 40 Agricultural labourers ~M 4,899 4,899 7,509 7,486 23
ofF 10,905 10.905 10,820 10,803 17
(iii) QIRqlRror; \ffi'pr '</)1fi ClIotP 1,068 1,068 705 698 7 Household industry workers t~F 253 253 297 292 5
815 815 408 406 2
(iv)~'<t>'ff ClIoif' 3,730 3,730 3,803 3,670 133 Other worken; ;tM 2.483 2,483 2,983 2,873 110
ofF 1,247 1,247 820 797 23
11. fR '</)1fi ClIoif' 81.693 81.693 110.687 102,102 8.585 Non-workers tM 35,869 35,869 46,406 43,036 3,370
ofF 45.824 45,824 64,281 59,066 5,215
136
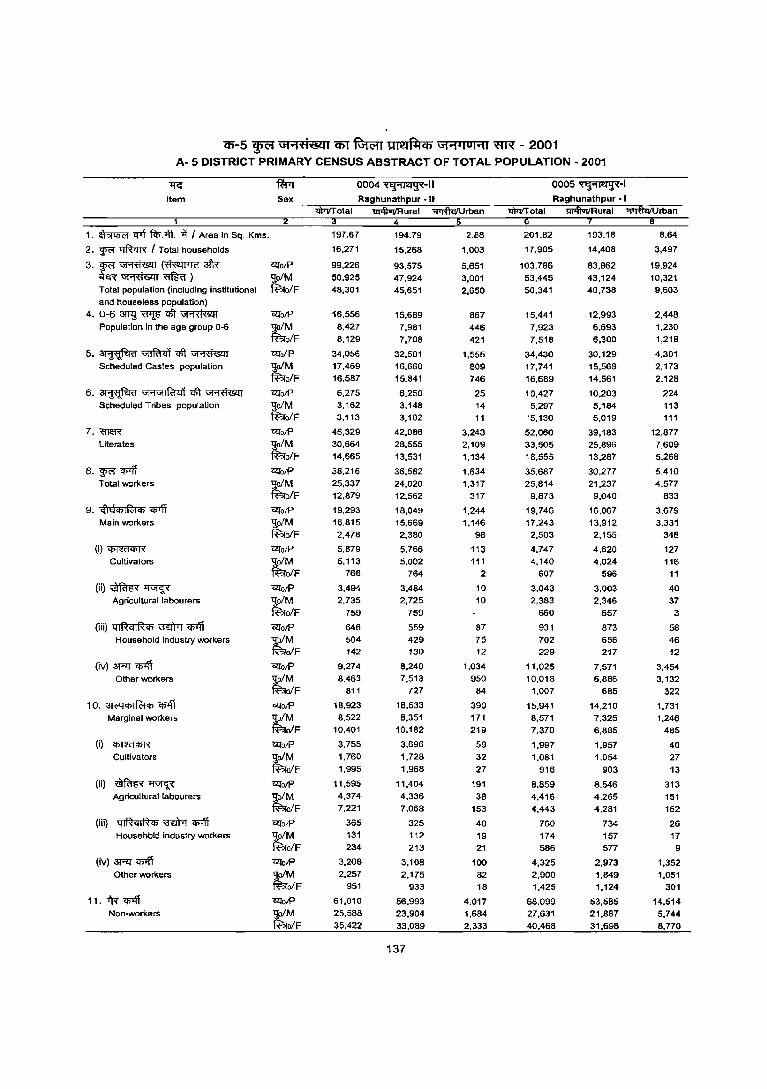
15'-5 ~ G1'1't1iLclIl em Rm>rr 1OI121Il1Cb "'1'1'10 1'11 mx - 2001 A· 5 DISTRICT PRIMARY CENSUS ABSTRACT OF TOTAL POPULATION - 2001
Item
1. ~ crrt f<l;At. -B I Area in Sq. Kms.
2. ~ 1:Jftcm" I Total households
3.~~(~3fR" <teR~~) Total population (including institutional
and houseless population)
4. 0-6 an<j ~ <Gr ~ Population in the age group 0-6
5.~~<tft~ Scheduled Castes population
6. ~ \ij"j\iIlRidi <Gr ~ Scheduled Tribes population
7. wm literates
8. ~ cp:ff Total workers
9. i~hl<l> I R:t <I> <I>'fi Main workers
(i)~
Cultivators
(ii)~~ Agricultural labourers
(iii) ql~ql~<f> Btirl <i>Ifi Household industry workers
(iv) 3f'"'!l" cp:ff Other workers
10. 31<"'l<l>IR:t<f> q»ff Marginal workers
(i)~
Cultivators
(ii)~~ Agricultural labourers
(iii) ql~qlR<I> ~ ~ Househbld industry workers
(iv) 3Rl"~ Other workers
11. 1R ~ Non-workers
~O/P
,:!o/M fBfo/F
~oiP
':101M fBfo/F
Gll"o/P
,:!oIM fBfo/F
Gll"oiP
':101M fBfo/F
Gll"oiP ,:!o/M fBfo/F
Gll"oiP
':101M fBfo/F
Gll"oiP ,:!oIM ~oIF Gll"o/P
~o/M ~oIF
Gll"otP ,:!o/M fBfoiF
Gll"otP
~o/M ~oIF
Gll"otP ,:!o/M ~oIF Gll"oiP
,:!oiM fBfoiF
Gll"O/P
,:!oIM fBfo/F
Gll"oiP ,:!o/M ~o/F
Gll"O/P
~o/M fBfo/F
ClJo/P
';!oiM ~oiF
UloiP
~oIM ~o/F
0004 '<tj'1I'4!!i(-1I
Raghunathpur - II
4
197.67 194.79 2.88
16,271
99,226 50,925 48,301
16,556
8.427 8,129
34,056 17,469
16,587
6,275 3,162 3,113
45,329 30,664
14,665
38,216 25,337
12,879
19,293 16,815
2,478
5,879 5,113
766
3,494 2,735
759
646 504 142
9,274 8,463
811
18,923 8,522
10,401
3,755
1,760
1,995
11,595 4,374 7,221
365 131
234
3,208 2,257
951
61,010 25,588
35,422
15,268
93,575
47,924 45,651
15,689 7,981
7,708
32,501 16,660 15,841
6,250 3,148 3,102
42,086 28,555
13,531
36,5B2 24,020
12,562
18,049 15,669
2,380
5,766 5,002
764
3,484 2,725
759
559 429 130
8,240 7,513
727
18,533 8,351
10,182
3,696 1,728
1,968
11,404 4,336
7,068
325 112
213
3,108 2,175
933
56,993 23,904
33,089
137
1,003
5,651
3,001
2,650
867 446
421
1,555
B09 746
25 14 11
3,243 2,109 1,134
1,634
1,317 317
1,244 1,146
98
113 111
2
10 10
87
75 12
1,034
950 84
390 171
219
59
32
27
191
38
153
40
19
21
100 82 18
4,017 1,684
2,333
0005 '(tj'1I~-1 Raghunathpur - I
1ll1l'IvtIRurai ;pyfuIjUrban
201.82
17,905
103,786
53,445 50,341
15,441
7,923 7,518
34,430 17,741
16,689
10,427 5,297
'5,130
52,060 33,505
18,555
35,6B7 25,814
9,873
19,746 17,243
2,503
4,747 4,140
607
3,043 2,383
660
931 702 229
11,025 10,018
1,007
15,941 B,571
7,370
1,997 1,081
916
8,859
4,416 4,443
760
174 586
4,325 2,900
1,425
68,099 27,631
40,468
193.18 8.64
14,408
83,862 43,124
40,738
12,993
6,693
6,300
30,129 15,568
14.561
10,203 5,184 5,019
39,183 25,896
13,287
30,277
21,237 9,040
16,067
13,912 2,155
4,620 4,024
596
3,003 2,346
657
873
656 217
7,571 6,886
685
14,210
7,325 6,885
1,957
1.054
903
8.546 4,265
4,281
734
157 577
2,973 1,849 1,124
53,585 21,8B7
31,698
3,497
19,924 10,321
9,603
2,448
1,230 1,218
4,301
2,173
2,128
224
113 111
12,877
7,609
5,26B
5,410
4,577 833
3,679
3,331 34B
127 116
11
40 37
3
58 46
12
3,454 3,132
322
1,731 1,246
485
40
27
13
313
151 162
26 17
9
1,352 1,051
301
14,514 5,744
8,770

"Cp-5 ~ \Ji ..... '('jiL<41 q)f ~ ~ \Ji ...... 101 ..... I ~ - 2001 A- 5 DISTRICT PRIMARY CENSUS ABSTRACT OF TOTAL POPULATION. 2001
'JIG
Item
1. ~ C!lT fcr>.-.fI. 111 Area in Sq. Kms.
2. 'W<'f ~ I Total households
3.~~(~3i'R ~~m%cl) Total population (inCluding institutional
and houseless population)
4. 0-6~~qft~ Population in the age group 0-6
5.~~<#t~ Scheduled Castes population
6. ~ "i'1V11R1<i'1 ~ ~ Scheduled Tribes population
7. <lT1l'f'< Literates
8.~~ Total workers
9. GlQcmf<:i'b ~ Main workers
(i)~
Cultivators
(ii)~~ Agricultural labourers
(iii) 41RcllR'b \3Eirl cwl1 Household industry workers
(i'/) ->T"'ll cwl1 Other workers
10. 3lC'll'bIf<:i'b cwl1 Marginal workers
(i)~
Cultivators
(ii)~~ Agricultural labourers
(iii) 4IRqIRCf> mWT cwl1 Household industry workers
(iv)~'Cf>lfr Other workers
11.fR~ Non-workers
Sex
2
"&lO/P
ljolM ~oIF
"&lO/P
ljo/M ~o/F
CZlo/P
ljo/M ~o/F CZlO/P
ljolM ~o/F
CZlO/P ljolM R?ro/F
CZlO/P
ljolM ~o/F
O<IotP
ljo/M ~o/F
CZlatP ljo/M ~o/F
O<Io/p
ljo/M ~o/F
CZlO/P
So/M ~o/F
CZlO/P
ljo/M ~o/F
CllO/P
ljo/M ~o/F
CZlO/P
So/M R?ro/F
-mP/P '9;o/M R?ro/F
CllO/P
'9:o/ M ~o/F "&lO/P
'9:o/M R?ro/F
GlTo/P
'];a/M ~a/F
"lI'mITotal 3
203.65
15,411
90,649
46,970
43,679
13,656
7,001
6,655
25,610
13,336
12,274
20,813
10,647
10,166
44,441
29,160
15,281
30,977
22,559
8,418
17,538
15,018
2,520
4,476 3,615
861
2,605 1,957
648
384
296
88
10,073
9,150
923
13,439
7,541
5,898
2,758
1.432 1,326
7,465
3,614
3,851
307
118
189
2,909
2,377
532
59,672
24,411 35,261
0006~ Nelurla
lIl1ilvrtRural 4
196.00
13,057
77,754
40,175
37,579
11,799
6,040
5,759
22,492 11,695
10,797
19,391
9,917
9,474
36,770
24,440
12,330
27,930
19,761
8,169
15,206
12,831
2,375
4,420
3,561
859
2,521 1,876
645
379
291
88
7,886
7,103
783
12,724
6,930
5,794
2,720
1,397
1,323
7,414 3,587
3,827
300
113
187
2,290
1,833
457
49,824
20,414 29,410
138
~Urban
7.65
2,354
12,895
6,795
6,100
1,857
961
896
3,118
1,641
1,477
1,422
730
692
7,671
4,720
2,951
3,047
2,798
249
2,332
2,187
145
56
54
2
84
81
3
5
5
2,187
2,047
140
715
611
104
38
35
3
51 27
24
7
5 2
619
544
75
9,848 3,997 5,851
<imrTotal 6
179.69
12,213
69,587
35,814
33,773
10,346
5,269
5,077
17,080
8,770
8,310
22,447
11,501
10,946
33,474 22,000
11,474
30,219
19,095
11,124
16,503
13,230
3,273
6,473
5,049
1,424
2,354
1,509
845
599
444
155
7,077
6,228
849
13,716
5,865 7,851
4,002
1,524
2,478
7,460
2,810
4,650
578
220
358
1,676
1,311
365
39,368
16,719
22,649
0007~ Sanlurl
1ll'fiuTIRurai
179.69
12,213
69,587
35,814
33,773
10,346
5,269 5,077
17,080
8,770
8,310
22,447
11,501
10,946
33,474
22,000
11,474
30,219
19,095 11,124
16,503
13,230
3,273
6,473
5,049
1,424
2,354
1,509
845
599
444
155
7,077
6,228
649
13,716
5,865
7,851
4,002
1,524
2,478
7,460
2,810
4,650
578
220 358
1,676
1,311
365
39,368
16,719
22,649
~Urban 8
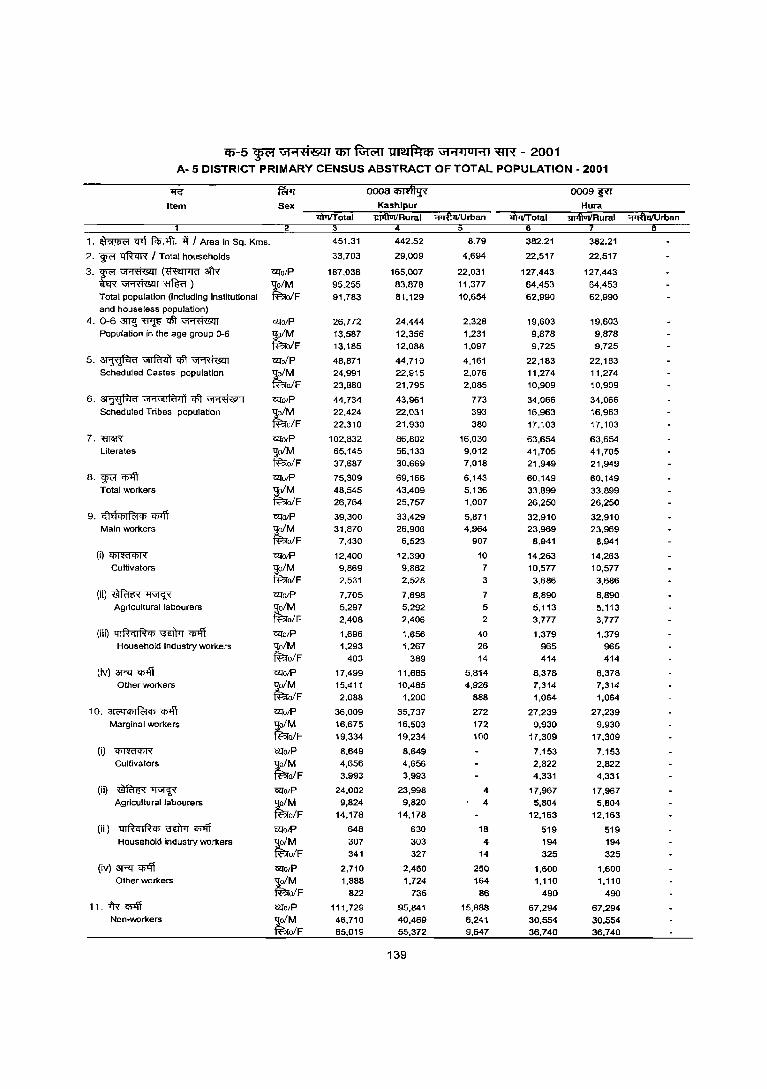
cp-5 ~ G"i"1'tfMI C5T R;wrr ~ G"i"1 410 1"11 ~ - 2001 A- 5 DISTRICT PRIMARY CENSUS ABSTRACT OF TOTAL POPULATION - 2001
11<:" fWr oooa~ 0009~
Item Sex Kashlpur Hura lWT/Total 1Il'lluIIRu ral ~Uroan >iPTlTotal 1ifII'\1JiIRurai :;p;fujfu roan
1 2 3 4 6
1. ~ Cflt fcp.lf.. if I Area in Sq. Kms. 451.31 442.52 8.79 382.21 382.21
2. W<'f ~ I Total households 33,703 29,009 4.694 22.517 22,517
3. W<'f ~ (~ 3f'R- Glfo/P 187,038 165,007 22.031 127,443 127,443
ffl VI"Ri~1 ~ ) -g;o/M 95,255 83,878 11.377 64,453 64,453
Total population (including institutional ~0/F 91,783 81.129 10,654 62,990 62,990 and house less population)
4.0-6~~~~ GIl'o/P 26,772 24,444 2,328 19.603 19,603 PopuCation in the age group 0-6 -g;o/M 13,587 12,356 1,231 9.878 9,878
~0/F 13,185 12,088 1,097 9,725 9,725
5.~~qft~ Glfo/P 48;871 44,710 4,161 22,183 22,163 Scheduled Castes population
tM 24,991 22,915 2,076 11,274 11,274
oJF 23,880 21.795 2,085 10,909 10,909
6. ~ Gl'1U1IR!lI1 qll-~ GIl'O/P 44,734 43,961 773 34,066 34,066 Scheduled Tribes population -g;o/M 22.424 22.031 393 16.963 16,963
~o/F 22,310 21,930 380 17,103 17,103
7. 'ffi1lR «Io/P 102,832 86,802 16,030 63,654 63,654 Literates 'loiM 65,145 56,133 9,012 41,705 41,705
~o/F 37,687 30,669 7,018 21,949 21,949
8. g;c;r ~ GIl'o/P 75,309 69,166 6,143 60,149 60,149 Total workers
tM 48,545 43,409 5,136 33,899 33,899
oJF 26,764 25,757 1,007 26,250 26,250
9. cilt'jqJl~qJ ~ «Io/p 39,300 33,429 5,871 32,910 32.910 Main workers 'loJM 31,870 26,906 4,964 23,969 23,969
fFl'oJF 7,430 6,523 907 8,941 8,941
(i)~ GIl'o/p 12,400 12,390 10 14,263 14,263 Cultivators -g;o/M 9,869 9,862 7 10,577 10,577
~o/F 2,531 2,528 3 3,686 3,686
(ii)~~ Cl:fotP 7,705 7,698 7 8,890 8,890 Agricultural labourers
tM 5,297 5,292 5 5,113 5,113
o/F 2,408 2,406 2 3,777 3,777
(iii) 41~ql~qJ -.:mTrr <'I>'ff Cl:fO/P 1,696 1,656 40 1,379 1,379 Household industry workers :l,o/M 1,293 1.267 26 965 965
~o/F 403 389 14 414 414
(iv) 3fi'<I <ff4t Cl:fotP 17,499 11,685 5.814 8,378 8,378 Other workers 'lo/M 15,411 10,485 4,926 7,314 7,314
~o/F 2,088 1,200 888 1,064 1,064
1 O. 31<'4 qJ I fcl qJ <ff4t Cl:fo/P 36,009 35,737 272 27,239 27,239 Marginal workers tM 16,675 16,503 172 9,930 9,930
o/F 19,334 19,234 100 17,309 17,309
(i) ~ Cl:f'o/p 8,649 8,649 7,153 7,153 Cultivators tM 4,656 4,656 2,822 2,822
olF 3,993 3,993 4,331 4,331
(ii) ~~ Cl:f'o/p 24,002 23,998 4 17,967 17,967 Agricultural labourers ~M 9,824 9,820 4 5,804 5,804
o/F 14,178 14,178 12.163 12,163
(iii) Q I R eli ~ Ch '3ElTrr q;1ff Cl:fo/P 648 630 18 519 519 Household industry WOrkers :l,o/M 307 303 4 194 194
~o/F 341 327 14 325 325
(iv) 3fi'<I <'I>'ff Glfo/p 2,710 2,460 250 1,600 1,600 Other workers
tM 1,888 1,724 164 1,110 1,110
o/F 822 736 86 490 490
11. fR~ motP 111,729 95,841 15,888 67,294 67,294 Non-workers
tM 46,710 40,469 6,241 30,554 30,554
o/F 65,019 55,372 9,647 36,740 36,740
139

CIi-5 ~ Gi"1ti'8al q;r ~ JlTl!lfl1q; \11"1"101'11 ~ - 2001 A· 5 DISTRICT PRIMARY CENSUS ABSTRACT OF TOTAL POPULATION· 2001
~ fWT 0010~·1 0011 '9(!fl
Item Sex Purulla -I Puncha 1II1ftIIiIRurai "I"if\iiIUrban '6IiTolal 1IiIftViIRurai ~rban
1. ~ CJ1f fcI>:>ft. ~ I Area in Sq. Kms. 281.50 281.50 330.11 330.11
2. ~ ~ I Total households 21,185 21,185 20,526 20,526
3.~~(~afR' ClfolP 125,318 125,318 108,129 10B,129 i)<R~~) tM 64,798 64,798 54,642 54,642 Total population (including Insliluiional ofF 60,520 60,520 53,487 53,487 and housele55 population)
4. 0-6 3fT1:I 'R'15 ~ ~ ClfoIP 21,5137 21,587 16,221 16,221 Population in the age group 0-6 tM 11,006 11,006 B,230 B,230
ofF 10,581 10.581 7,991 7,991
&.~~~~ ClfolP lB,864 18,864 13,591 13,591
Scheduled Castes population tM 9,753 9,753 6,B66 6,866
ofF 9,111 9,111 6,725 6,725
6. ~ Gt'1Gtlf<t<lf qft ~ ClfolP 9,680 9,680 25,547 25,547 Scheduled Tribes population tM 4,974 4,974 12,B81 12,881
ofF 4,706 4,706 12.666 12,666
7. mIIR Clf'O/P 56,434 56,434 52,697 52,697 Literates tM 39,719 39,719 34,926 34,926
ofF 16,715 16,715 17,771 17,771
8. !i<'I ~ ClfoIP 54,973 54,973 50,095 50,095 Total workers tM 32,915 32,915 28,841 2B,841
ofF 22.058 22,058 21.254 21,254
g. ,!'!>!q; I ~q; <I>'ff ClfOlP 32,046 32,046 27,976 27.976 Main workers tM 24,635 24,635 20,770 20,770
olF 7,411 7,411 7,206 7,206
(i)~ ClfotP 12,573 12,573 11,744 11,744 Cultivators ;tM 9,425 9,425 9,077 9,077
ofF 3,148 3,148 2,667 2,667
(ii)~~ ClfOlP 4,216 4,216 8,325 8,325 Agricultural labourers tM 2,380 2,380 4,941 4,941
ofF 1,836 1,836 3,384 3.384
(iii) qlRqlRiji ~ 'PIff ClfOlP 1,367 1,367 1,211 1,211 Household industry workers tM 957 957 792 792
ofF 410 410 419 419
(i\4) ~ Cf>'ff t:ZfotP 13,890 13,890 6,696 6,696 Other workers tM 11,873 11,873 5,960 5,960
ofF 2,017 2,017 736 736
10. 31o:qq;I~q; q;off ClfotP 22,927 22,927 22,119 22,119 Marginal workers ~F 8,280 8,280 8,071 8,071
14,647 14.647 14,048 14,048
(i) ~ ClfolP 5,694 5,694 6,085 6,085 Cultivators tM 2.220 2,220 2,576 2,576
ofF 3,474 3,474 3,509 3,509
(ii) ~~ Ci!l'olP 12,165 12,165 14,060 14.060 Agricultural labourers ;tM 3,546 3,546 4,364 4,364
ofF 8,619 8,619 9,696 9,696
(iii) qlRqlRCI> ~ q;;jl ClfolP 876 876 533 533 Household industry workers tM 281 281 197 197
OfF 595 595 336 336
(iv) ~ q;>ff ClfO/P 4,192 4,192 1,441 1,441 Other workers tM 2,233 2,233 934 934
ofF 1,959 1,959 507 507
11. ~'<I>'ff t:ZfolP 70,345 70,345 58,034 58,034 Non-workers tM 31,883 31,883 25.801 25,801
ofF 38,462 38,462 32,233 32,233
140

0-5 ~ Gi"1;H&U C6T ~ ur.afllCb Gi'1.IOI'11 m'l" - 2001 A- 5 DISTRICT PRIMARY CENSUS ABSTRACT OF TOTAL POPULATION - 2001
~ fWr 00123WnTT 0013~-1
Item Sex Al'sha Jhalda -I iii1l/Total 1ii1IiiIiIRurai i'iiNfuiUrban iii1l/T otal 1ii1IiiIiIRurai i'iiNfuiUrban
1, ~ q-.f f<l>,>fi, ~ I Area in Sq, Kms, 375,04 375,04 315,09 315,09
2, w<" ~ I Total households 22,311 22,311 22,454 22,454
3, w<" ~ (~ afR -all"otP 129,148 129,148 115,748 115,748
m~~) ;tM 65,917 65,917 58,793 58,793 Totai population (Including institutional ofF 63,231 63,231 56,955 56,955 and houseless population)
4, 0-6 &PI 'H'l6 qIt ~ GlfO/P 22,808 22,808 20,327 20,327
Population in the age group 0-6 tM 11,522 11,522 10,355 10,355
olF 11,266 11,286 9,972 9,972
5,~~qIt~ -all"o/P 13,453 13,453 12,792 12,792 Scheduled Castes population ;tM 6,961 6,961 6,603 6,603
ofF 6,502 6,502 6,189 6,189
6. ~ \i1'1\i1IR1<i'i c5r ~ -all"OIP 28,439 28,439 12,062 12,062
Scheduled Tribes population tM 14,479 14,479 6,166 6,166 olF 13,960 13,960 5,896 5,B96
7. 'fll1W< -all"otP 48,937 4B,937 51,297 51,297 Literates ~M 36,676 36,676 35,710 35,710
ofF 12,261 12,261 15,587 15,587
8. w<" CI>Ifi CZla/P 65,228 65,228 59,482 59,482
Total workers ~M 35,758 35,756 33,065 33,085 ofF 29,470 29,470 26,397 26,397
9, G"le!4>if<:t<t> ~ CllotP 35,477 35,477 38,903 38,903
Main workers tM 25,964 25,964 27,234 27,234
ofF 9,513 9,513 11,669 11,669
O)~ <2I"o/P 16,192 16,192 17,294 17,294
Cultivators tM 13,116 13,116 12,355 12,355
olF 3,076 3,076 4,939 4,939
OQ~~ -all"a/P 7,615 7,815 6,514 6,514
AgricultLlrallabourers tM 4,617 4,617 3,526 3,526
ofF 3,198 3,198 2,988 2,988
(iii) QIRGIRw ~ <I>'ft GlfO/P 3,659 3,859 5,284 5,284 Household industry workers "9;o/M 1,927 1,927 2,905 2,905
fBiofF 1,932 1,932 2,379 2,379
(iv) 3l""ll' <I>'ft WO/P 7,611 7,611 9,811 9,811
Other workers tM 6,304 6,304 8,448 8,448 olF 1,307 1,307 1,363 1,363
10. ~<NijjiR:t4> <I>'ft -all"otP 29,751 29,751 20,579 20,579
Marginal workers tM 9,794 9,794 5,851 5,851
ofF 19,957 19,957 14,728 14,728
(I) ~ CZlotP 6,151 6,151 5,629 5,629 Cultivators tM 2,010 2,010 l,B55 1,855
olF 4,141 4,141 3,774 3,774
(ii) ~~ -all"otP 16,263 16,263 10,628 10,628 Agricultural labourers tM 5,273 5,273 2,646 2,646
olF 10,990 10,990 7,982 7,982
(iii) ~ \3EI)rr CIf'ff WotP 3,787 3,787 2,539 2,539
Household industry workers ;tM 991 991 566 566 olF 2,796 2,796 1,973 1,973
(iv) 3l""ll' CJ>Ifi -all"o/P 3,550 3,550 1,783 1,783 Other workers tM 1,520 1,520 784 784
olF 2,030 2,030 999 999
11. ~ <I>'ft -all"olP 63,920 63,920 56,266 56,266 Non-workers tM 30,159 30,159 25,70B 25,708
olF 33,761 33,761 30,558 30,558
141

C5-5 wa ,iFt·(1;! ... clIl q;r ~ 1mif1:l<6 ",I"''I''IOHI ~ - 2001 A- 5 DISTRICT PRIMARY CENSUS ABSTRACT OF TOTAL POPULATION - 2001
l!G IWr 0014 iITffi:T·1I 0015~ Item Sex Jhalda ·11 Bagmundl
llFtITotal ;:r;:rftiiiU roan ~otal m>ftvvRural "i>ifiiiIu roan 2
1. ~ cpf fcI;.>ft. if I Area in SQ. Kms. 256.61 256.61 427.95 421.95
2. ~ -qftqr;( I Total households 21.931 21.931 21.629 21.629
3.~~(~3i'R CZJO/P 123.714 123.714 112.448 112.448 ~~~) ~M 63.235 63.235 57.599 57.599 Tolal population (including institutional oIF 60,479 60,479 54,849 54,849 and houseless population)
4. 0-6~~cBt~ '&JO/P 23,357 23,357 19,341 19,341
population in the age group 0-6 tM 11,910 11,910 9,770 9,770
ulF 11,447 11,447 9,571 9,571
5. ~ 'G!IiWif ~ ~ CZJo/P 12,097 12,097 11,181 11,181 Scheduled Castes population '_!o/M 6,214 6,214 5,666 5,666
~o/F 5,883 5,883 5.515 5,515
6. ~ GjijGlIR'l"i'i cBt ~ O!:folP 15,907 15,907 27,200 27,200 Scheduled Tribes population r;z 8,171 8,171 13,817 13,817
IF 7,7.36 7,736 13,383 13,383
7. W!ff'{ O!:fO/P 43,910 43,910 43,711 43,711 Literates ~M 34,904 34,904 32,338 32,338
olF 9.006 9.006 11,373 11.373
8.~~ O!:fo;P 66,100 66,100 58,548 58,548
Total workers ~M 34,943 34,943 32,577 32,577 olF 31,157 31,157 25,971 25,971
9. <ftEliPL~iP q;Ij'i CZiO/P 41,253 41,253 33,781 33,781 Main workers ~M 27,334 27,334 25,329 25,329
ofF 13,_919 13,919 8,452 8,452
(i)~ O!:fo/P 12,436 12,436 18,783 18,783
Cultivators tM 9,612 9,612 14,239 14,239
olF 2,824 2,824 4,544 4,544
(ii)~~ <Zio/P 4,669 4,689 6,877 6,877 Agric:ulturallabourers '_!oIM 2,985 2,985 4,401 4,401
tao/F 1,704 1,704 2,476 2,476
(iii) QI~ql~Cf) ~ ~ <Zio/P 17,545 17,545 1,061 1,061
Household industry workers !l;oIM 9,233 9,233 738 738
taolF 8,312 8,312 323 323
(iv) 3Rl~ <Zio/P 6,583 6,583 7,060 7,060 Other workers '_!oIM 5,504 5,504 5,951 5,951
ffl;ro/F 1,079 1.079 1,109 1,109
10. ;jJC'QCf)I~Cf) ~ WQ/P 24,847 24,847 24.767 24,767 Marginal workers :Jo/M 7,609 7,609 7,248 7,248
ff?ro/F 17,238 17,238 17,519 17,519
(i) ~ CZiotP 3,262 3,262 6,619 6,619 Cultivators ;(M 1,530 1,530 1,981 1,981
olF 1,732 1,732 4,638 4,638
{ii} ~~ CZiolP 7,460 7,460 14,579 14,579 Agricultural labourers
tM 2.459 2,459 3,986 3,986 olF 5,001 5,001 10,593 10,593
(iii) clLRcll~ iP mftq q;l\t <ZiO/P 11,479 11,479 394 394 Household industry Workers,
~ 2,622 2,622 97 97 olF 8,857 8,857 297 297
(iv) 3Rl q;1fi CZJolP 2,646 2,646 3,175 3,175 Other workers ~. 998 998 1,184 1,184
olF 1,648 1,648 1,991 1,991
11, ~-cp:ff <Zio/P 57,614 57,614 53,900 53,900 Non-workers r 28,292 28,292 25,022 25,022
olF 29.322 29,322 28,878 28.878
142

cp-5 ~ Gt"Ni'L<.lI1 q;y f.m;n mafliCb Gt"1 J IOHI ~ - 2001 A· 5 DISTRICT PRIMARY CENSUS ABSTRACT OF TOTAL POPULATION - 2001
"'IG
Item
0016~
Balarampur
0017~
Barabazar m>fturIRural m>fturIRural ;;i1fiiiIUrtlan
1. ~ <f'l fc!;.>fr. Ti I Area In SQ. Kms.
2. w<" ~ / Total households
3. w<'f ~ (~ afR ~~~) Total population (includin9 institutional
and houseless population) 4. 0-63Wj~~~
Population in the age group 0-6
5.~~~~ Scheduled Castes population
6. ~ "'''1'iIlR!lii ~ ~ Scheduled Tribes population
7.m~
Literates
8. w<'T ~ Total workers'
9. ~tlq>I~q> ~ Main workers
(i)~
Cultivators
(ii)~~ Agricultural labourers
(iii) lllRqlRq> ~ CI>'ff Household Industry workers
(iv) 3Rl~ Other workers
10. 31('4q>If<;jq> ~ Marginal workers
(i)~
Cultivators
(ii)~~ A9riculturallabourers
(iii) QIRqiR4> BEfrrr 4>"4T Household industry workers
(iv) 3Rl~ Other workers
11. fR q;lff Non-workers
C2TotP ~0/M tao/F
C2TO/P
lJo/M taoiF C2TofP
lJo/M taoiF u:{orP
'!j;oIM taofF "i'l:lO/P 'lo/M tao/F
'&tO/P
'loiM ~o/F
ClJotP lJoiM tao/F ClJo/P
lJo/M ~o/F u:{O/P
'9:o/M tao/F motP '9:o/ M tao/F
u:{oIP
lJoiM ~o/F mOIP lJo/M ~o/F
ClJolP lJo/ M ~o/F Clfo;P ~o/M tao/F
C2TotP
lJo/M ~0/F ClJOIP lJo/M tao/F
ClJotP
'lo/M ~o/F
300.88
20,844
118,102 60,446 57,656
20,157 10,140
10.017
11,975
6.157 5,816
37,426 19,131 18,295
48,773 34,371 14,402
50,241 31.433 18,808
30,618 24,622
5,996
10,827 8,814 2,013
5,442 3.522 1.920
1,236 923 313
13,113 11,363
1.750
19,623 6.811
12,812
4,408 1,572
2,836
12,371 3,657 8,714
375 118
257
2,469 1,464 1,005
67,861 29,013 38,848
4
291.37
17,083
96,275 49,152 47,123
17,018 8,552 8,466
9,645 4,954 4,691
36,155 18,449 17,706
36.276 26,558
9,718
43.712 25.849 17,863
25,159 19,606
5,553
10.549
8.568 1.981
5,371 3,482 1.889
1,003
729 274
8,236 6,827
1,409
18,553 6,243
12,310
4,226 1.522 2,704
12,106
3,606 8,500
323
106 217
1,898 1,009
889
52,563 23,303 29,260
143
9.51
3,761
21.827 11,294 10,533
3,139 1,588
1.551
2.330
1,203 1,127
1,271 682
589
12.497 7,813 4,684
6.529 5.584
945
5,459 5,016
443
278
246 32
71 40 31
233
194 39
4,877 4,536
341
1,070 568 502
182 50
132
265
51 214
52 12 40
671 455 116
15,298 6,710 9,688
418.06
26,402
146,927 74,208 72.719
23,928 12,092 11,836
9,948
5,076 4,873
27,008 13,624
13,384
64,673 46,189 19,484
75,017 40.583 34,434
37,834 28,127
9,707
21,512
15,695 5,817
7,343 4,487 2,856
1,332
996 336
7,647 6,949
698
37,183 12,456 24,727
10.559 3,588 6,971
24,015 7,328
16,687
743 228
515
1,866 1,312
554
71,910
33,625 38,285
414.71
25,021
139,363 70,205 69,158
22,906 11,540
11,366
8,248 4,179 4,069
26.767 13,504
13.263
59,684 42,227 17,457
72,987 38,789
34,198
36,133 26,556
9,577
21,484
15,667 5,817
7,279 4,437 2,842
1,203
871 332
6,167 5,581
586
36,854 12,233
24,621
10,523
3.566 6,967
23,923 7,271
16,652
721 211
510
1.687 1,185
502
66,376
31.416 34,960
3.35
1,381
7,564 4,003 3,561
1,022
552 470
1,700
696 804
241 120
121
4.989 2,962 2,027
2.030 1.794
236
1,701 1,571
130
28
28
64 50 14
129 125
4
1,480 1,368
112
329 223 106
36 22 14
92 57 35
22 17
5
179 127
52
5.534
2.209 3.325

i6"-5 ~ Gt .... 'EiiL<41 q;r ~ Jmjf?lCf) Gt ..... IOHI ~ - 2001 A.. 5 DISTRICT PRIMARY CENSUS ABSTRACT OF TOTAL POPULATION· 2001
IfCl' ~ 0016 +!1'1i1I\i1N-1 0019 41HilliJlI<-1I
Item Sex Manbazar -I Manbazar -II $VTotal !ll'ftvrlRural ~rban ..wvTotal '1I41·r'Rural ~rban
8
1. ~ "tflt f<I>."4't. -q I Area in SQ. Kms. 381.32 381.32 285.81 285.81
2. ~ qft1:rR J Total households 24.175 24.175 16,585 16,585
3.~~(~~ ClTolP 127.601 127.601 85.253 85,253 ~~~) tM 64,280 64,280 43,361 43,361 Total population (including institutional ofF 63,321 63.321 41.892 41,892 and houseless population)
4. 0-6 3!1<j ~ 11ft ~ ClTolP 19,194 19.194 11.825 11,825 Population in the age group 0-6 ~M 9,740 9.740 6,054 6,054
ofF 9,454 9.454 5.771 5,771'
5.~~q\'t~ 'Ul"oip 25,921 25.921 5.123 5,123 Scheduled Castes population tM 13,086 13.086 2,577 2,577
ofF 12,835 12,835 2.546 2,546
6. ~ \Jj·j\JIlRiJi q\'t~ 'Ul"olP 29,331 29.331 41.738 41,738 Scheduled Tribes population tM 14,846 14.846 21,211 21,211
ofF 14,485 14,485 20,527 20,527
7, "flT!!R ClIolP 59,720 59,720 39,299 39,299 Literates tM 40,361 40,361 27.250 27,250
ofF 19,359 19,359 12,049 12,049
8, ~ q;aff l2folP 60.405 60.405 44,819 44,819 Total workers tM 34,757 34.757 24,376 24,376
ofF 25,648 25,648 20,443 20,443
9. c~hi"'If<;tc/) 'C/)1fi ClIolP 30,634 30.634 24,944 24.944 Main workers tM 23,494 23,494 17.478 17,478
ofF 7.140 7.140 7,466 7,466
(i) 'C/)ffijqfR' ClIolf> 13,763 13,763 12,043 12,043 Cultivators ;tM 10,904 10,904 9,167 9,167
olF 2,859 2,859 2,876 2,876
(ii)~~ ClT<>1P 8.097 8,097 8,580 8,580 Agricultural labourers tM 4,972 4,972 4,829 4,829
ofF 3,125 3,125 3,751 3,751
(iii) QIRCJIRcp ~ ~ illfo/P 1,120 1,120 1,213 1,213 HousehOld industry workers
t~F 784 784 782 782 336 336 431 431
(iV) 3Rt ~ ClTolf> 7,654 7.654 3.108 3,108 Other workers ~M 6,834 6,834 2,700 2,700
ofF 820 820 408 408
10. 3(~&>(~'" q;>fi i2I<llf> 29,771 29,771 19,875 19,875 Marginal workers ;tM H.263 11,263 6,898 6,898
ofF 18.50B 18.508 12.977 12.977
(i) ~ Wolf> 6.443 6.443 5.474 5.474 Cultivators ;tM 2,757 2,757 1,989 1,989
ofF 3,686 3,686 3,485 3,485
(ii) ~~ illfolP 20,836 20,836 12,706 12,706 Agricultural labourers tM 7,016 7,016 4,213 4,213
ofF 13,820 13,820 8,493 8,493
(iiO ql~ql~c/) \ffiPT ~ ClTolP 616 616 789 789 Household industry WOrkers tM 183 183 213 213
oIF 433 433 576 576
(iv) 3Rr <I>1ff C2folf> 1,876 1,876 906 906 Other workers ~M 1,307 1,307 483 483
ofF 569 569 423 423
11. 'I'R cpJfi C2fOJP 67,196 67,196 40.434 40.434 Non-workers
~F 29,523 29,523 18,985 18,985 37.673 37,673 21,449 21,449
144
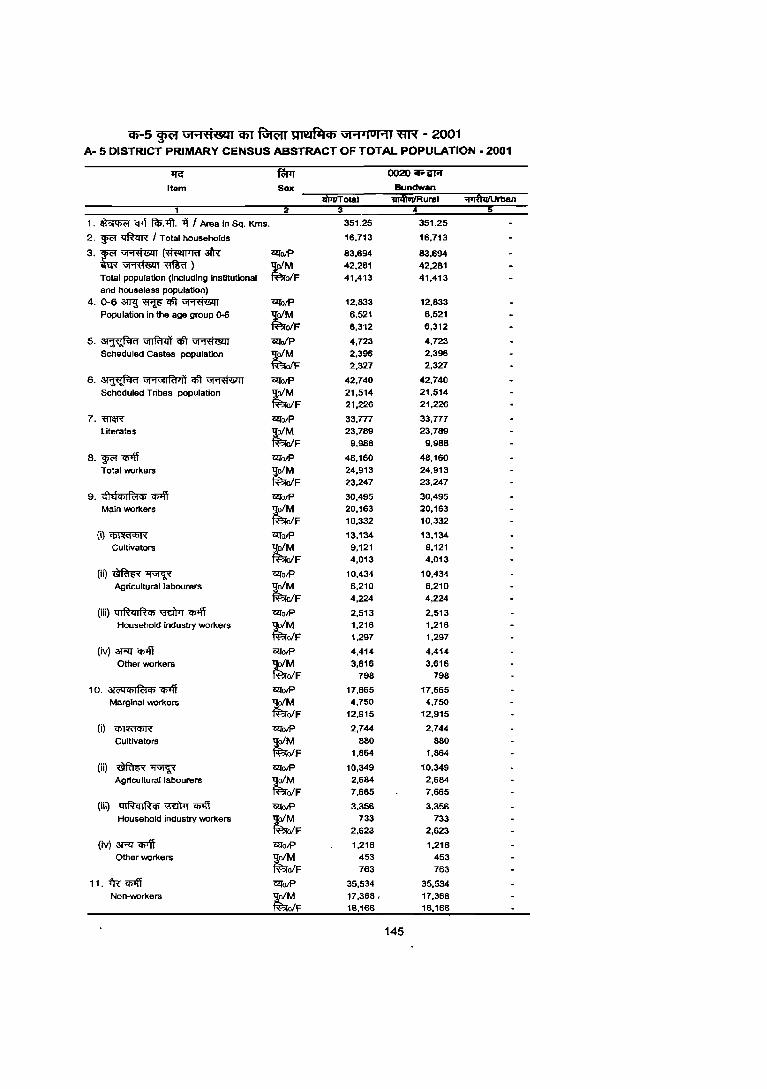
cp-5 ~ \J1"'1fl'SQ' em ~ ~ \J1"'1.,uH' ~ - 2001 A- 5 DISTRICT PRIMARY CENSUS ABSTRACT OF TOTAL POPULATION - 2001
lJ<:" fWI 0020~i:R
Item Sox Bundwan VilfiViIRural "'I'11fuiIUrban
1. ~ C!'t !$At >l I Area in Sq. Kms. 351.25 351.25
2. WCl" ~ I Total households 16.713 16.713
3.~~~afR 12f0lP 83.694 83.694 ~~~) tM 42.281 42.281 Total population (Including InsUtutional oIF 41,413 41,413 and houseless population)
4. 0-6 3lT1l ~ "$t ~ CZfolP 12,833 12.833 Population in the age group o-a tM 6.521 6,521
elF 6,312 6,312
5.~~"$t~ 12foiP 4,723 4,723
Scheduled Castes population ~M 2,396 2,396
ofF 2.327 2,327
6. ~ Uj"FilIR'l4'i "$t ~ CZfO/P 42,740 42,740
Scheduled Tribes population ;tM 21,514 21,514
oIF 21,226 21,226
7.m~ 12fo/P 33,777 33,777 literates ;tM 23,789 23,789
oIF 9.988 9,988
8. WCl" <lilff CZfolP 48.160 48.160
Total workers tM 24,913 24,913
oIF 23,247 23.247
9. <!'IQ<liIfc:I<il lI>'ff 12folP 30,495 30,495 Main workers tM 20,163 20,163
oIF 10.332 10.332
(i)~ CZfotP 13,134 13.134 Cultivators t~F 9,121 9,121
4,013 4,013
(iQ~~ c:11otP 10,434 10,434 Agricultural labourers tM 6.210 6.210
oIF 4,224 4,224
(iii) ql~qIR<il ~ <I>'fi OllotP 2,513 2,513 Household industry workers tM 1,216 1,216
ofF 1.297 1,297
(iv) 3l"1l" <lilff OllotP 4,414 4,414
Other workers ~F 3,616 3,616
798 798
10. 31zyqCjjI~q; <lilff OllotP 17,665 17,665
Marginal workers tM 4,750 4,750
ofF 12.915 12.915
(i) ~ OllotP 2,744 2.744
Cultivators tM 880 880
ofF 1.864 1,864
(ii) ~~ OllO/P 10,349 10,349 Agricultural labourers tM 2,684 2,684
ofF 7.665 7,665
(iii) qlRqlRq; ~ <I>'fi 0ll0lP 3.356 3.356 Household industry workers tM 733 733
ofF 2,623 2,623
(iv) 3Rr <lilff OllotP 1,216 1,216 Other workers tM 453 453
ofF 763 763
11. ~ "<PIff ClTotP 35,534 35,534 Non-workers tM 17,368, 17,368
ofF 18,166 18,166
145

cn-5 ~ Gi"1'fiiLclIl <liT ~ lIMfl'ICb Gi"1 410HI "fIR - 2001 A- 5 DISTRICT PRIMARY CENSUS ABSTRACT OF TOTAL POPULATION - 2001
llG fWr 15~ 0001 ~-II
Item Sex MEDINIPUR Blnpur -II >iFTlTotal 1ilil\liT!Rural "'P'lfutIu man
6
1. ~ 1'J1t fiI;.1ft. ~ I Araa in Sq. Kms. 14,081.00 13,695.78 385.22 583.50 583.50
2. ~ 'I:Jft<rN / Total households 1,827,721 1,632,430 195,291 29,666 29,666
3.~~(~3t'R ClIO/P 9,610.788 8,626,883 983,905 145,977 145,977
W~~) tM 4,916,370 4,407.920 508,450 73,624 73,624
Total population (including institutional olF 4,694,418 4,218,963 475,455 72,353 72,353 and houseless population)
4. 0-6 ~ ~ qft ~ <2tol? 1,380,497 1,267,951 112,546 20,802 20,802 Population in the age group 0-6 tM 707,559 650,044 57,515 10,609 10,609
oIF 672,938 617,907 55,031 10,193 10,193
5. ~ 'VfIfmit CIlt ~ -molP 1,576,337 1,453,133 123,204 21.388 21,388
Scheduled Castes population ~M 801,964 739,229 62,735 10,839 10,839
olF 774,373 713,904 60,469 10,549 10,549
6. ~ \i1'1VlIR'lll~ qfi ~ ClIO/P 798.684 774,315 24,369 61,469 61,469
Scheduled Tribes population tM 403,962 391,617 12,345 30,697 30,697
olF 394,722 382.698 12,024 30.772 30,772
7. maR CZl'o/P 6,164,316 5,441,838 722,478 77,083 77,083
Literates tM 3,573,623 3,170,453 403,170 48,075 48,075
olF 2,590,693 2,271.385 319,308 29,008 29,008
8. ~ <poft CZl'ol? 3,751,057 3,445,916 305,141 70,969 70,969 Total workers tM 2,679,571 2,422,379 257,192 41,477 41,477
olF 1,071,486 1,023,537 47,949 29,492 29,492
9. cflehlilR:tct> Cj)'Iff CZl'o/P 2,530,112 2.263,811 266,301 34.196 34.196
Main workers tM 2,143,813 1,912,729 231,084 26,808 26,808
olF 386,299 351,082 35,217 7,388 7,388
(i)~ ClIO/P 764.520 756,163 8,357 12,949 12,949
Cultivators tM 703,116 695,258 7,858 10,859 10,859
o/F 61.404 60,905 499 2,090 2,090
(ii)~~ CZlO/P 616.488 605,881 10,607 9,823 9,823
Agricultural labourers tM 469,252 479.960 9,292 6,936 6,936
olF 127,236 125,921 1,315 2,687 2,887
(iii)'4IR<lIRct> ~ '<t>1ff ClIotP 147,306 142,170 5,136 2,734 2,734 Household industl)/ workers tM 79.689 75,985 3,704 1.609 1,609
olF 67,617 66,185 1,432 1,125 1,125
(iv) 3RI q;>ff ClfO/P 1,001,796 759,597 242,201 8,690 6,690 Other workers tM 871,756 661,526 210,230 7,404 7,404
o/F 130,042 98,071 31,971 1,286 1,286
10. 31C'Qct>IR:tij) Cj)'Iff ClIol? 1,220,945 1,182,105 38,840 36,773 36,773 Marginal workers tM 535,756 509,650 26,108 14,669 14,669
o/F 685,187 672.455 12,732 22,104 22,104
(i) 'CIl'I'WfCj)'ff CZl'o/P 290,404 288,372 2,032 4,591 4,591 Cultivators tM 130,168 128,890 1,298 2,554 2,554
oIF 160,216 159.482 734 2.037 2,037
(ii) ~~ CZlotP 575,875 566,720 9,155 25,720 25,720 Agriculturallabourars tM 278,725 272,432 6,293 10,237 10,237
ofF 297,150 294,288 2,862 15,463 15,483
(iii) QIR<lIRct> ~ q;>ff CZlO/P 130,301 127,797 2.504 4,357 4,357 Household industl)/ workers tM 20,680 19,966 714 676 676
olF 109,621 107.831 1,790 3.661 3.681
(Iv) 3RI q;>ft ClIol? 224,365 199.216 25.149 2,105 2.105 Other workers tM 106,165 88,362 17,803 1,202 1,202
olF 118,200 110,854 7,346 903 903
11. iR"Cj)ljt C2lotP 5,859,731 5,180,967 678,764 75,008 75,008 Non-workers tM 2,236,799 1,985,541 251,258 32,147 32.147
alF 3.622,932 3,195,426 427,506 42,861 42,861
146

(5'-5 ~ GF"I'<1&U em ~ Jl1201f¥1Cb U1"1'IOFlI mx - 2001 A- 5 DISTRICT PRIMARY CENSUS ABSTRACT OF TOTAL POPULATION· 2001
lfc: ~ 0002~-1 0003 TFiiiful-11
Item Sex Garbeta -II
lI\liiTotal lI\liiT Olal 'iii1fIVlIRural ~rban 3 6 e
1. ~ Cflf fcI;.llT. if I Area in Sq. Kms. 357.62 357.62 392.55 392.55
2. ~ ~ I Total households 27.974 27,974 25,052 25,052
3.~~(~afR" ClIolP 139,148 139,148 131,103 131,103 am-~~) tM 71,097 71,097 66,940 66,940 Total population (including institutional ofF 68,051 68,051 64,163 64:163 and house less population)
4. 0-6 3WJ ~ <1ft ~ CZfO/P 21,032 21,032 19,674 19,674 Population in the age group 0-6 tM 10,778 10,778 10,012 10,012
ofF 10,254 10,254 9,662 9.662
5,~~qft~ ClIoiP 35.113 35,113 30.964 30.!l64 Scheduled Castes population tM 17,941 17,941 15,635 15,635
ofF 17.172 17,172 15.329 15,329
6. ~ VI'iViIRl!l1 qft ~ '<!l'o/P 40,808 40.808 27,055 at ,055 Scheduled Tribes population tM 20.398 20,398 13,480 13,480
ofF 20,410 20,410 13.575 13.575
7. WIff'{ ClIO/P 73,623 73,623 74,20B 74,208 Literates tM 46,132 46,132 44.784 44,784
elF 27,491 27,491 29,424 29,424
'3. '¥f '1P'ff ClIO/P 66,453 66,453 61,e07 61,807 Total workers tM 40,435 40,435 38,660 38,660
ofF 26,018 26,018 23,147 23,147
9. cfIdCf)If<:tCf) q;>ff ClIOIP 40.995 40,995 41,194 41.194 Main workers tM 31,798 31,798 31,903 31,903
ofF 9,197 9,197 9,291 9.291
(i)~ ClIO/P 15,431 15,431 17,648 17.648 Cultivators tM 13,470 13,470 15,679 15,679
elF 1.961 1.961 1.969 1,969
(ii)~~ <2Io/P 15,728 15.728 14.210 14,210 Agricultural labourers tM 10,368 10,368 8,980 8,980
elF 5.360 5,360 5,230 5,230
(iii) qiRqlRCf) ~ ~ ClfO/P 1,556 1,556 1,580 1,580 Household industry workers tM 1,017 1,017 740 740
ofF 539 539 840 840
(iv) 3RT "Cf>'ff ClIO/P 8,280 8.280 7.756 7.756 Other workers tM 6,943 6,943 6,504 6,504
ofF 1,337 1,337 1,252 1,252
10. ;){('Cj<nlf<:tcp "Cf>'ff ClfO/P 25,458 25,458 20,613 20.613 Marginal workers '9;oIM 8,637 8.637 6,757 6,757
~ofF 16.821 16.821 13.856 13,856
(i) ~ WolP 5,327 5.327 6,564 6,564 Cultivators tM 1.940 1,940 2.509 2,509
ofF 3,387 3,387 4,055 4,055
(ii) ~~ WolP 17,932 17,932 9,440 9,440 Agricultural labourers tM 5,837 5,837 3,239 3,239
ofF 12,095 12,095 6,201 6,201
(iii) qIRqIRCf)~"i'I>'lt ClfOlP 886 886 2,879 2,879 Household industry workers tM 140 140 173 173
ofF 746 746 2.706 2.706
(iv) ar-<:I "'I>'ff ~OIP 1,313 1.313 1,730 1,730 0ther workers tM 720 720 836 836
ofF 593 593 894 894
11. fR Cf>Jft WOIP 72,695 72,695 69,296 69,296 Non-worken; tM 30,662 30.662 28,280 28,280
o/F 42,033 42,033 41,016 41.016
147
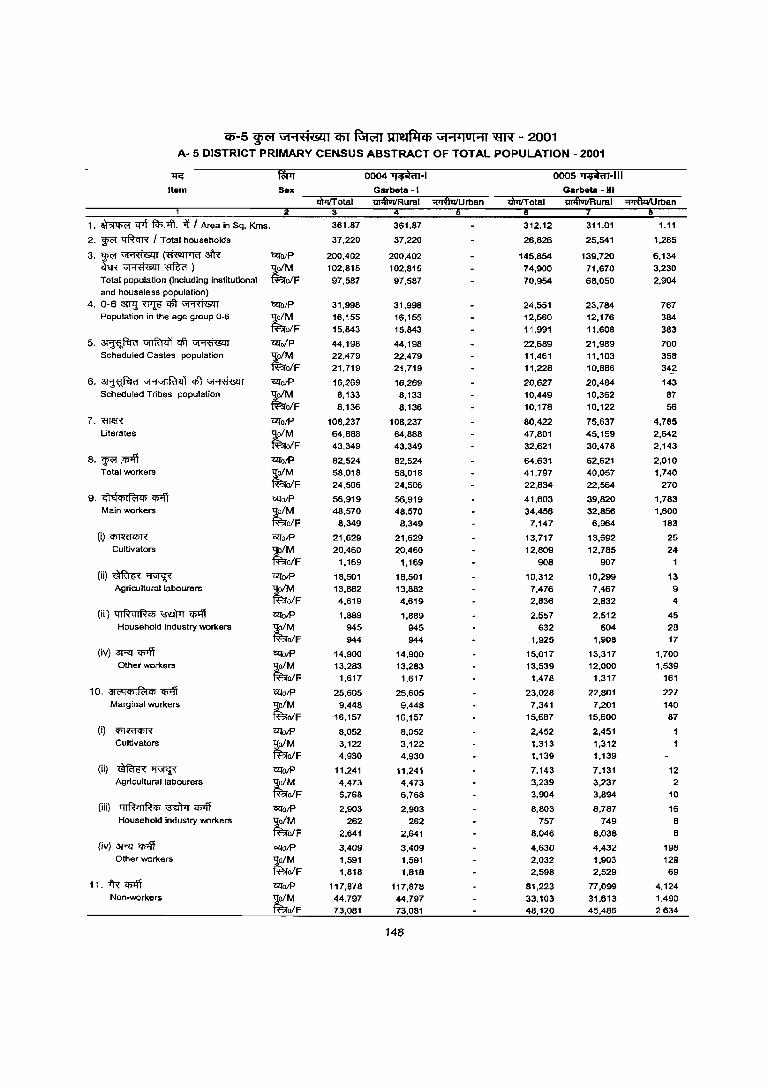
C6"-5 ~ \11"1't't&Ol1 C6"T fGwrr ~ \11"1 410 1"11 ~ - 2001 A- 5 DISTRICT PRIMARY CENSUS ABSTRACT OF TOTAL POPULATION - 2001
'II'G IWT 0004~-1 0OO5~-1II Item Sex G.rbeta -I Garbeta -III
lllrTIT otal ul410llRuml "'lfllllUrban mrrrrotal ul41uilRuml ~rban 3
1. ~ cpf f.f;."4t. Tf I Area in Sq. Kms. 361.87 361.87 312.12 311.01 1.11
2. ~ ~ I Total households 37.220 37.220 26.826 25,541 1,285
3.~~(~atR 12folP 200,402 200,402 145,854 139,720 6,134 ffi~~) tM 102,815 102,815 74,900 71,670 3,230 Total population (including institutional elF 97.587 97,587 70,954 68,050 2.904 and houseless populalionj
4. 0-6 3WJ ~ '1ft ~ 12folP 31,998 31,998 24,551 23,784 767 Population in the age group 0-6 tM 16,155 16,155 12,560 12,176 384
olF 15.843 15.843 11.991 11.608 383
5.~~'Ift~ 12fo/P 44.198 44.198 22.689 21.989 700 Scheduled Castes population tM 22,479 22,479 11,461 11,103 358
elF 21,719 21,719 11,228 10.886 342
6. ~ "l'1"1IRlll) qft ~ 12folP 16,269 16,269 20,627 20,484 143 Scheduled Tribes population tM 8,133 8,133 10,449 10,362 87
elF 8,136 8.136 10.178 10.122 56
7.~~ 12fotP 108.237 108.237 80.422 75.637 4,785 Literates tM 64,888 64,888 47,801 45,159 2,642
elF 43.349 43,349 32,621 30,478 2,143
8. ~ :<I>'ff 12folP 82,524 82,524 64,631 62,621 2,010 Total workers tM 58.018 58,018 41,797 40,057 1,740
elF 24.506 24,506 22,834 22,564 270
9. ~ q"'l~cp <I>'lT Gl.{o/P 56,919 56.919 41,603 39,820 1,783 Main workers ;tM 48,570 48,570 34,456 32,856 1,600
olF 8,349 8,349 7,147 6,964 183
(i)~ 12fo/P 21,629 21,629 13,717 13,692 25 Cultivators ;tM 20,460 20,460 12,809 12,785 24
olF 1,169 1,169 908 907 1
(ii)~~ 12fo/P 18,501 18,501 10,312 10,299 13 Agricultural labourers ;tM 13,882 13,882 7,476 7,467 9
elF 4,619 4,619 2,836 2,832 4
(iii) QIRalRCb ~ q;off 12folP 1,889 1,889 2,557 2,512 45 Household industry workers ;tM 945 945 632 604 28
olF 944 944 1,925 1,906 17
(iv) 3Rl' <!>'ff "&IolP 14,900 14,900 15,017 13,317 1,700 Other workers tM 13,283 13,283 13,539 12,000 1,539
ofF 1.617 1.617 1.478 1,317 161
10, aj('GcplR:lcp q;off C210IP 25,605 25,605 23.028 22.801 227 Marginal workers ~M 9,448 9,448 7,341 7,201 140
olF 16.157 16,157 15,687 15,600 87
(i) <I>f~ C2IotP 8,052 8,052 2,452 2,451 1 Cultivators tM 3.122 3,122 1.313 1,312
elF 4.930 4,930 1,139 1,139
(ii) ~~ CZloIP 11.241 11.241 7,143 7,131 12 Agricultural labourers ~M 4,473 4.473 3,239 3.237 2
ofF 6,768 6.768 3,904 3,894 10
(iii) 41RqlRiP ~ <!>'ff "&IolP 2,903 2.903 8,803 8,787 16 Household industry workers tM 262 262 757 749 8
ofF 2.641 2,641 6,046 8,036 8
(iv) 3Rl' 1l>'ff C210IP 3,409 3,409 4,630 4.432 198 Other workers tM 1,591 1.591 2,032 1,903 129
ofF 1,B1B 1.818 2,598 2,529 69
11. i'R 1l>'ff C2IotP 117.B7B 117,878 81,223 77.099 4,124 Non-workers ~M 44.797 44.797 33.103 31,613 1.490
olF 73,081 73,081 4B.120 45,486 2,634
148

Cfi-5 ~ \1I .... 'fi'M1 i6T R;rm tlletfilCb \11 ..... 101""11 ~ - 2001 A· 5 DISTRICT PRIMARY CENSUS ABSTRACT OF TOTAL POPULATION - 2001
-.:rc:- fWr 0006~-1 0007~-" Item Sex
1. ~ <flf fcp. ift. "i'i I Area In Sq. Kms. 193.54 193.54 150.44 150.44
2. ~ ~ / Total households 22,457 22,457 19,374 19,374
3'k~(~afR GlloiP 118,085 118,085 106,831 106,831
~~) r: 60,299 60,299 54,686 54,686 Total population (including institutional elF 57,786 57,786 52,145 52,145 and houseless population)
4.0-5~~qlt~ GllotP 16,978 16,978 17,243 17,243 Population In the age group 0-6 ~
8,686 8,686 8,789 8,789 elF 8,292 8,292 8,454 8,454
5.~~~~ Gllo/P 41,375 41,375 27.182 27,182
Scheduled Castes population r: 20,971 20,971 13,802 13,802
elF 20,404 20,404 13,380 13,380
5. ~ VI'1\i11R141 ~ ~ GlloiP 5,163 5,163 3,890 3,890
Scheduled Tribes population ~ 2,649 2,649 1,997 1,997
elF 2,514 2,514 1.893 1,893
7.m~ GlloiP 71,367 71,367 59,611 59.611
Literates tM 41,438 41,438 35,006 35,006
elF 29,929 29,929 24,605 24,605
6. ~"iP'ff C2fotP 43,548 43,548 36,886 36,886
Total workers ~F 34,271 34,271 30,697 30,697 9,277 9,277 6,169 6,169
9. <fJd<!llf?;jcp q;lfi GlloiP 31,630 31,630 31,260 31,260
Main workers r;zF
29,001 29,001 27,962 27,962 2,629 2,629 3,298 3,298
(i) "(jjffifCfjR" C2fotP 15,827 15,827 14,403 14,403
Cultivators ~M 15,339 15,339 14,021 14,021
OiF 488 488 382 382
(ii)~~ t2lo/p 9,248 9,248 11,065 11,065 Agricultural labourers ~M 8,222 8,222 9,420 9,420
OiF 1,026 1,026 1,645 1,645
(iii) qlRqlR<!l ~ <I>lff C2fo/P 665 665 670 670
Household industry workers ~M 419 419 422 422
OiF 246 246 248 248
(iv) 3RI Cfflll GlloiP 5,890 5,890 5,122 5,122
Other workers tM 5,021 5,021 4,099 4,099
elF 869 869 1,023 1.023
10. 31<'4cplfc:jcp q;lfi GllotP 11,918 11,918 5,626 5,626
Marginal workers tM 5,270 5,270 2,735 2,735 o/F 6,648 6,648 2,891 2,891
(i) "(jjffifCfjR" t2lotP 4,068 4,068 991 991
Cultivators tM 1,389 1,389 661 661 OiF 2.679 2.679 330 330
(ii) ~~ Uf()tP 5,358 5,358 2,883 2,883
Agricultural labourers ~F 2,906 2'.906 1,510 1,510 2,452 2,452 1,373 1,373
(iii) q IRq I ~ en '3"drrr <I>lff GllotP 658 658 - 557 557
Household industry workers ~ 214 214 37 37
OiF 444 444 520 520
(iv) 3RI~ t2lolP 1.834 1.834 1,195 1.195
Other workers tM 761 761 527 527
elF 1.073 1,073 666 668
11. i'R'"Cfl'I'i GllolP 74,537 74,537 69,945 69,945
Non-workers r 26,028 26,028 23,989 23,989
o/F 48.509 48,509 45,956 45.956
149

Cf)-5 ~ Gt"'l'l1i1.Sl1l cpr ~ 111eJllIC6 ",'H 4,0I"'l1 '«R - 2001 A- 5 DISTRICT PRIMARY CENSUS ABSTRACT OF TOTAL POPULATION - 2001
~ fBTr 0008 l:(reR'f 0009~-1
Item Sex Ghatal Caspur -I -.nwrotal lIJI!luJIRural ~rban 1II'ItoiIRurai ~r1:!an
1. ~ q>f f<I>. <ft. "ti I Area in Sq. Kms. 216.05 216.05 168.29 168.29
2. wc:r ~ I Total households 36,240 36,240 34.989 34,989
3. wc:r ~ (~ 3fR WolP 190,738 190,738 175,774 175,774 ~~~) tM 96,678 96,678 87.167 87,167 Total population (including Institutional ofF 94,060 94,060 88,607 88,607 and houseless population)
4. 0-6 3n1l ~ c6t ~ OUolP 27,180 27,180 23,633 23,633 Population in the age group 0-6 ~ 13,909 13,909 12,054 12,054
ofF 13,271 13,271 11,579 11,579
5.~~qft~ OUo/P 60,761 60,761 42,539 42,539 S<:heduled Castes popUlation tM 30,673 30,673 21,095 21,095
ofF 30,088 30,088 21,444 21,444
6. ~ ut'1UlIRl41 ctt ~ Wa/P 3,251 3,251 5,274 5,274 Scheduled Tribes population tM 1,639 1,639 2,621 2,621
ofF 1,612 1,612 2,653 2,653
7. <fr1lR Wa/P 120,236 120,236 113,604 113,604 Literates ~M 70,083 70,083 63,917 63,917
ofF 50,153 50,153 49,687 49,687
8. wc:r ~ WatP 67,073 67,073 72,114 72,114 Total workers tM 55,051 55,051 50,130 50,130
ofF 12,022 12,022 21,984 21,984
9, 4'i&cPl~'" <P'il OUolP 51,913 51,913 56,026 56,026 Main workers tM 48,359 48,359 45,889 45,889
ofF 3,554 3,554 10,137 10,137
(i)~ OUO/P 19,044 19,044 22,420 22,420 Cultivators tM 18,541 18,541 18,435 18,435
olF 503 503 3,985 3,985
(ii)~~ OUotP 12,840 12,840 11,030 11,030 Agricultural labourers tM 11,923 11,923 8,540 8,540
ofF 917 917 2,490 2,490
(iii) QIRqIR", ~ <P'il WalP 4,957 4,957 3,448 3,448 Household Industry workers tM 4,100 4,100 2,510 2.510
olF 857 857 938 938
(iv) 3Rf CIfIff CLl'atP 15,072 15,072 19,128 19.128 Other workers tM 13,795 13,795 16,404 16.404
ofF 1,277 1,277 2,724 2,724
10. ,"<"'lij)I~'" cp>ff CZfotP 15,160 15,160 16,088 16,088 Marginal workers tM 6,692 6,692 4,241 4,241
ofF 8,468 8,468 11,847 11,847
(i) ~ WO/P 3.251 3.251 7,492 7,492 Cultivators ~M 1,199 1,199 1,437 1,437
ofF 2,052 2,05'2 6,055 6.055
(ii) ~~ Wa/P 6,969 6,969 3,981 3,981 Agricultural labourers tM 3,674 3,674 1,236 1,236
ofF 3,295 3,295 2.745 2.745
(iii) QIRqlRCfi ~ <P'il Wa/P 2.260 2,260 1.228 1.228 Household industry workers tM 446 446 280· 280
ofF 1,814 1,814 948 948
(iv) 3Rl' CIfIff WoIP 2,680 2,680 3,387 3,387 Other workers tM 1,37:3 1,373 1.288 1,288
ofF 1.307 1,307 2.099 2,099
11. 1R ~ WolP 123,665 123,665 103.660 103,660 Non-workers tM 41,627 41.627 37.037 37.037
ofF 82,038 82,038 66,623 66,623
150

Cfi'-5 ~ Gto:j~'L<41 q;r ~ ~ vro:j'jUHI 'ffi'( - 2001 A- 5 DISTRICT PRIMARY CENSUS ABSTRACT OF TOTAL POPULATION - 2001
1fi':" fWr 0010~-1I 0011 ¥iJliii Item Sex Daspur -II Keshpur
u,41uilRural ~rban 1lPTITotai u,41oilRural ~rban
1. ~ "Q7f ~."4t. i'i I Area In Sq. Kms. 165.45 165.45 463.15 483.15
2. "W<' "I:Iftcrn" I Total households 39,750 39,750 52,142 52,142
3, "W<' ~ (~ 3fR- matP 206,067 206,067 286,489 268,489 ~~~) ~M 100,853 100,853 147,720 147,720 Total population (including institutional ofF 105,234 105,234 140,769 140,769 and houseless population)
4. 0-6 atJ"ll ~ <1ft ~ malP 26,882 26,882 48,571 48,571 Population in the age group 0-6 ;tM 13,752 13,752 25,000 25,000
ofF 13,130 13,130 23,571 23,571
5.~~ql)~ molp 26,146 26,146 72,536 72,536 Scheduled Castes .population ~M 12,754 12,754 36,979 36,979
ofF 13,392 13,392 35,557 35,557
6. ~ \iI.,\ilIRl4'i qfi ~ <Z:fotP 396 396 17,012 17,012 Scheduled Tribes population tM 191 191 8,526 8,526
ofF 205 205 8,486 8,486
7. <lT1!R <Z:f0lP 142,830 142,830 160,745 160,745 Literates tM 77,718 77,718 96,857 96,857
ofF 65,112 65,112 63,888 63,888
8. "W<'! 'l>'ff 1:ZTolP 66,322 66,322 99,636 99,636 Total worke", tM 54,127 54,127 79.298 79,298
ofF 12,195 12,195 20,338 20,338
9. C:I~ q;lff 1:ZTolP 55,909 55,909 73.797 73.797 Main workers ~M 49,956 49.956 66,527 66,527
ofF 5,953 5,953 7,270 7,270
(i)~ 12fotP 16,767 16,787 35,466 35,466 Cultivators tM 15,044 15,044 33,816 33,616
ofF 1,743 1,743 1,650 1,650
(ii)~~ <Z:fatP 10,529 10.529 20,743 20,743 Agricultural labourers tM 8,791 6,791 17,612 17,812
olF 1,738 1,738 2,931 2,931
(iii) ql~ql~<t> ~ <mi 12folP 3,457 3,457 2,118 2,118 Household Industry workers tM 2,863 2,883 1,328 1,328
alF 574 574 790 790
./ (iv) 3T"lI <'ll'fl CZ[otP 25,136 25,136 15,470 15,470
Other workers tM 23,236 23,238 13,571 13,571 olF 1,896 1,698 1,899 1,899
1 O. 3l<"4<t>1 R:i <t> 'l>'ff C2TolP 10,413 10,413 25,839 25,839 Marginal workers tM 4,171 4,171 12,771 12,771
alF 6,242 6,242 13,068 13,068
(i) ~ ClfolP 3,511 3,511 5,971 5,971 Cultivators tM 853 853 3,006 3,006
alF 2,658 2,658 2,965 2,985
(ii) ~~ 12fotP 4,169 4,169 14,276 14,276 AgriclJltural labourers tM 1,736 1,736 7,512 7,512
alP 2,433 2,433 6,764 6,764
(iiQ QI~qIRC!> \RITrT ~ CZ[otP 855 655 1,542 1,542 Household industry workers tM ·327 327 436 436
ofF 528 528 1,106 1,106
(Iv) 3T"lI <'ll'fl ClfotP 1,878 1,878 4,050 4,050 Other workers ~F
1,255 1,255 1.817 1,817 623 623 2,233 2,233
11.1R~ 12fotP 139,765 139,765 188,853 168,653 Non-workers ~F 46,726 46,726 68,422 68,422
93,039 93,039 120,431 120,431
151
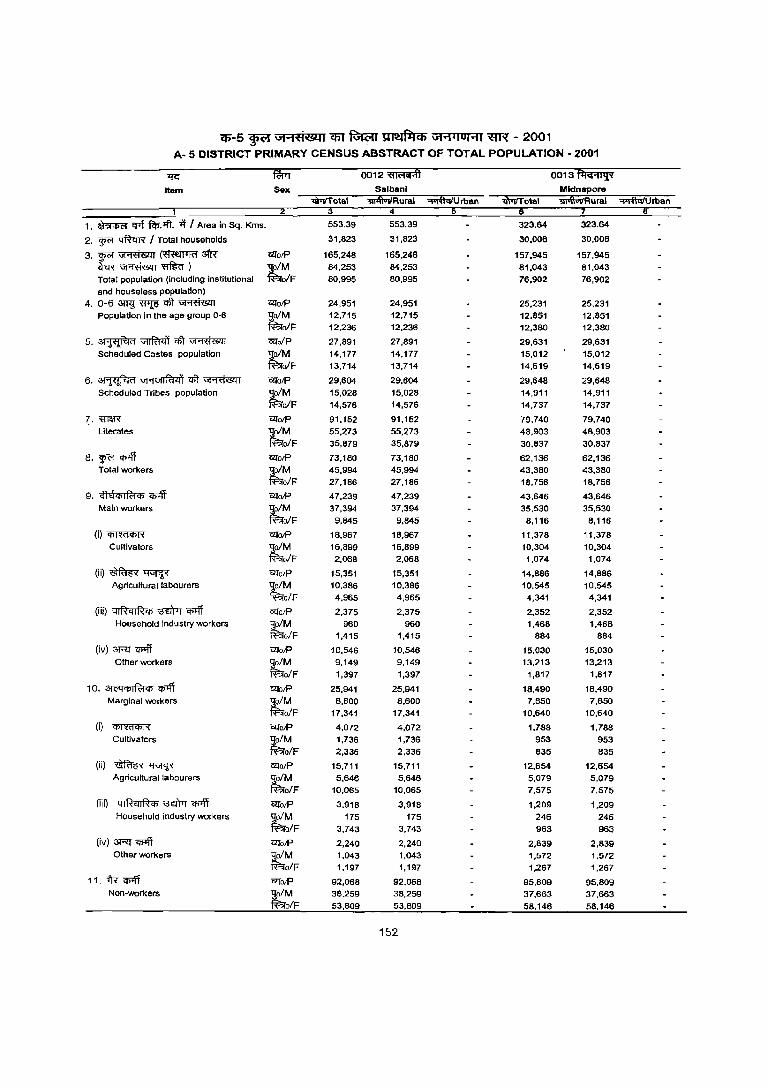
if)-5 ~ \J1"'1't'i'8ll1 Cffi ~ ~ \J1"1.IUI"11 ~ - 2001 A- 5 DISTRICT PRIMARY CENSUS ABSTRACT OF TOTAL POPULATION - 2001
~ ~ 0012~ 0013~ Item Sex MldnBpore
"liili\<i\iRural ~rban
1. ~ Cf'f fcI>. ·!t if / Area in Sq. Kms. 553.39 553.39 323.64 323.64
2. $'''' ~R / rotal households 31,823 31,823 30,006 30,006
3.~~(~31R C2TolP 165,248 165,248 157,945 157,945 ch:f<~~) tM 84,253 84,253 81,043 B1,043 Total population (including institutional o/F 80,995 80,995 76,902 76,902 and houseless population)
4, 0-6 ~ WJ:6 <Ill ~ (lfo/P 24,951 24,951 25,231 25,231 Population In the age group 0-6 tM 12,715 12,715 12,851 12,851
o/F 12,236 12,236 12,380 12,380
5.~~qft~ Clf'oIP 27,891 27,891 29,631 29,631 Scheduled Castes population tM 14,177 14.177 15,012 15.012
o/F 13,714 13,714 14,619 14,619
6. ~ Vl'1G1IRi'1l'i rtI ~ C2TO/P 29,604 29,604 29,648 29,648 Scheduled Tribes population tM 15,028 15,028 14,911 14,911
o/F 14,576 14,576 14,737 14,737
~. m&R Clf'o/P 91.152 91,152 79,740 79,740 Literates tM 55,273 55,273 48,903 48,903
olF 35,879 35,879 30,B37 30,B37
8. w<'f <I>'ff Clf'olP 73,180 73,180 62,136 62,136 Total worke rs ;tM 45,994 45,994 43,380 43,380
o/F 27,186 27,186 18,756 18,756
9. <!'1El<l>lfa<l> <i>4T cz:rO/P 47,239 47,239 43,646 43,646 Main workers tM 37,394 37,394 35,530 35,530
olF 9,845 9,845 8,116 8,116
(i)~ CZi'OIP 18,967 18,967 11,378 11,378 Cultivators ;tM 16,899 16,899 10,304 10,304
o/F 2,068 2,068 1,074 1,074
(ii)~~ CZi'o/P 15,351 15,351 14,886 14,886 Agricultural labourers t,M 10,386 10,386 10.545 10,545
o/F 4,965 4,965 4,341 4,341
(iii) ql~ql~<l> ~ q;>ff CZi'o/P 2,375 2,375 2,352 2,352 Household industry workers tM 960 960 1.468 1,468
ofF 1,415 1,415 884 884
(iv) 3RT q;>ff i'ZfolP 10,546 10,546 15,030 15,030 Other workers tM 9.149 9.149 13,213 13.213
o/F 1,397 1,397 l,B17 1,817
10. 31t'C1<l>lfa<l> <P'1l ClfO/P 25,941 25,941 18.490 18.490 Marginal workers tM 8,600 8,600 7,850 7,850
o/F 17,341 17,341 10,640 10,640
(0 ~ ClfotP 4,072 4,072 1,788 1,788 Cultivators tM 1,736 1,736 953 953
olF 2,336 2,336 835 835
(ii) ~~ CZi'olP 15,711 15,71 t 12,654 12,654 Agricultural labourers tM 5,646 5,646 5,079 5,079
olF 10,065 10,065 7,575 7,575
(iii) 41RcllRCb ~~ Clfo/P 3,918 3,918 1,209 1,209 Household industry workers tM 175 175 246 246
ofF 3.743 3,743 963 963
(iv) 3RT q;>ff CZi'otP 2,240 2,240 2,839 2,839 Other workers tM 1,043 1,043 1,572 1,572
ofF 1,197 1,197 1,267 1,267
11. fR~ i'Zfo/P 92,068 92,068 95,809 95,809 Non-workers tM 38,259 38,259 37,663 37,663
ofF 53,809 53,809 58,146 58,146
152

C5-5 ~ \i1'1'<1;SZU CIiJ ~ m~flICb \i1'1'IOHI m;r - 2001 A- 5 DISTRICT PRIMARY CENSUS ABSTRACT OF TOTAL POPULATION - 2001
'If<:' ~ 0014~ 00 15 ciil"ir.Mt Item Sex Jhargram Jambonl
iil1TITotal "lIT1ftGVRural m>ftvrfRural ~rban
1. ~ crrt ~.1fi. if I Area In Sq. Kms. 515.11 515.11 318.13 318.13
2. w<'I ~ I Total households 30,355 30,355 20,314 20.314
3,w<'I~(~~ l2fOJP 153,331 153,331 101,718 101.718 ~~mmr)
t~F 78,363 78,363 51.880 51,880
Total population (including Institutional 74,968 74,968 49,838 49.838 and hOuseless population)
4. 0·6~~CIft~ C2IotP 22,289 22,289 14,832 14,832 Population in the age group 0-6 t~F 11,419 11,419 7,574 7,574
10,870 10,870 7,258 7,258
5,~~~~ l2felP 20,192 20,192 15,703 15,703 Scheduled Castes population t~F 10,145 10,145 8,025 6,025
10,047 10,047 7,678 7,678
6. ~ "'''NlIR'l41 qft ~ l2fotP 35,341 35,341 30,285 30,285 Scheduled Tribes population
t~F 18,003 18,003 15,347 15,347 17,338 17,338 14,938 14,938
7.~ l2fOJP 84,615 84,615 58,232 58,232 litt,rates tM 51,462 51,462 35,533 35,533
elF 33,153 33,153 22,699 22,699
8. w<'I '1PIff l2fotP 71,568 71,568 48,096 48,096 Total worl<ers ~F 43,261 43,261 28,491 28.491
28,307 28,307 19,605 19,605
9, ~eiq>I~<n 'II'I"ff tlfotP 39,230 39,230 25,635 25,635 Main worl<ers tM 32,075 32,075 20,008 20,008
ofF 7,155 7,155 5,627 5,627
(i)~ i2l'olP 13,324 13,324 7,165 7,165 Cultivators tM 11,707 11,707 6,169 6,169
ofF 1,617 1,617 996 996
(ii) dfffiR 11GI'if< l2folP 11,793 11,793 9,217 9,217 Agric;ulturallabourers tM 8,205 8,205 6,189 6,189
ofF 3,588 3,588 3,028 3.028
(iii) ql~q I~'" 13'dIrr <I>1fi l2fotP 1,429 1,429 1,810 1,810 Household industry worl<ers tM f,j50 950 1,105 1,105
ofF 479 479 705 705
(iv) 3Rf '<f>1ff l2fo/P 12,684 12,684 7,443 7,443 Other workers tM 11,213 11,213 6,545 6,545
o/F 1,471 1,471 898 898
10. :.t(;qq>I~'" ~ l2fotP 32,338 32,338 22.461 22,461 Marginal worI<ers tM 11,186 11,186 8,483 8.483
ofF 21,152 21,152 13,978 13,978
(i) ~ l2fotP 5,944 5,944 3,794 3,794 Cultivators ;tM 2,243 2,243 1,776 1,776
ofF 3,701 3,701 2,018 2,018
Qij ~~ ClTotP 22,624 22,624 15,669 15,669 Agricultural labourers ~F 7,391 7,391 5,676 5.676
15,233 15,233 9,993 9,993
(iii) ql~ql~'" ~ ifi1ff tlfOJP 1,375 1,375 1,549 1,549 Household industry woticers tM 182 182 211 211
ofF 1,193 1,193 1,338 1,338
(iv) 3Rf '<f>1ff l2fOJP 2,395 2,395 1,449 1,449 OtllerlillOrkers
~F 1,370 1,370 820 820 1,025 1,025 629 629
1I,1R~ l2fotP 81,763 81,763 53,622 53,622 Non-workers
t~F 35,102 35,102 23,389 23,389 46,661 46,661 30,233 30,233
153
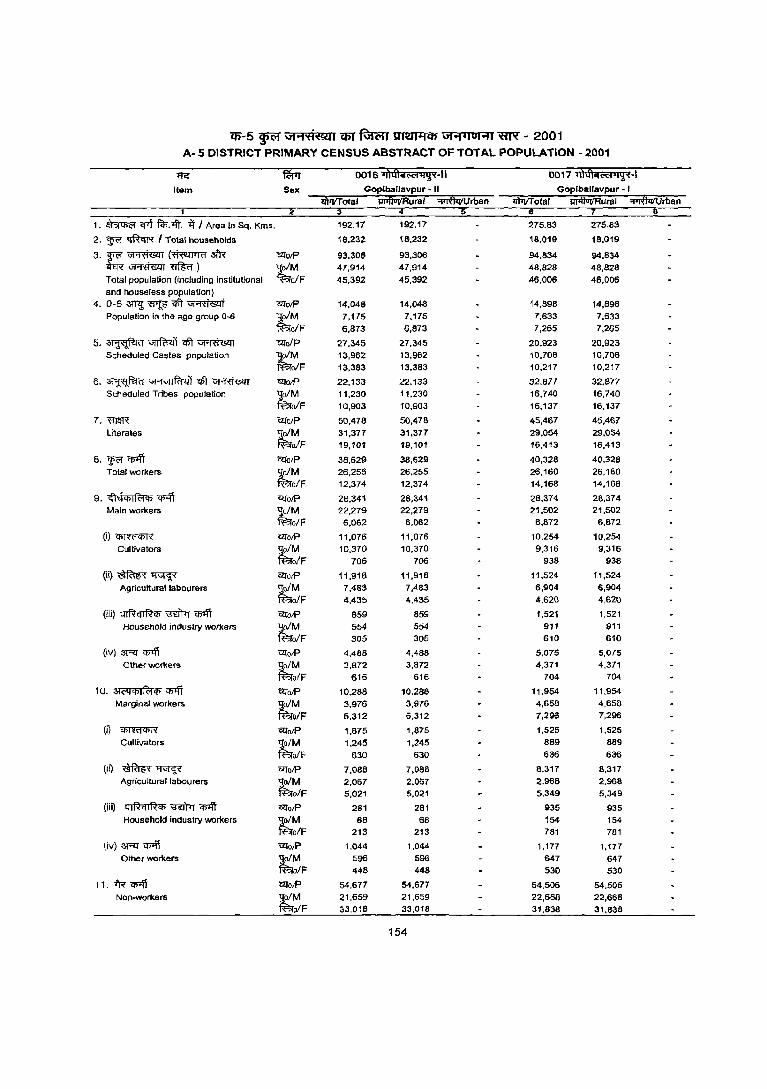
en-5 ~ \Jt'1't1'M1 C6T R;rc:;rr Jlml4iCh \11'1 4)01'11 '8N - 2001
A- 5 DISTRICT PRIMARY CENSUS ABSTRACT OF TOTAL POPULATION - 2001
ltG ~ 0016~-1I Item Sex Gopiballavpur - II Goplballavpur - I
iiPIIUP'Rural ~rban lIPrITotal iil'ffUiRural ~rban
1. ~ <f1f fcn.oft. ~ I Area in Sq. Kms. 192.11 192.17 215.63 275.83
2. ~ ~ f Total households 16,232 1&,232 18,019 18,019
3. ~ ~ (Wm af'R mot? 93,306 93,:306 .94,834 94,834 ~~mm;) tM 47,914 47,914 48,828 48,828 Total population (including institutional o/F 45,392 45,392 46,006 46,006
aM houseless population) 4. 0-6 mIJ; ~ qft ~ mot? 14,048 14,048 14,898 14,898
Population in the age group 0-6 ~M 7,175 7,175 7,633 7,633
olF 6,873 6,873 7.265 7.265
5.~~ctr~ O!lolP 27,345 27,345 20,923 20,923 Scheduled Castes population ~M 13.962 13,962 10,706 10,706
olF 13,383 13.383 10,217 10.217
6. ~ Vl"iVlIfi1111 <6t ~ c.a0lP 22,133 22.133 32,877 32,877 Scheduled Tribes population tM 11,230 11,230 16,740 16,740
o/F 10.903 10,903 16,137 16,137
7. 'ffiW O!lo/P 50.478 50,478 45,467 45,467
literates tM 31,377 31.377 29,054 29,054
o/F 19,101 19,101 16,413 16,413
8. 'f<'I '1J>1ff 'ElfO/P 38,629 38,629 40,328 40,328 Tota'l workers tM 26,255 26,255 26,160 26,160
olF 12,374 12,374 14,168 14,168
9. {'hlcj)I~'" ~ ~olP 26,341 26,341 26,374 26,374 Main worl<ers tM 22,279 22,279 21,502 21,502
ofF 6,062 6,062 6,872 6,872
(i)~ 'Elfo/P 11,076 11,076 10,254 10,254
Cultivators tM 10,370 10,370 9,316 9,316
olF 706 706 938 938
(ii)~~ 'ElfotP 11,918 11,916 11,524 11,524
A9riculturallabourers tM 7,483 7,483 6,904 6,904
ofF 4,435 4.435 4.620 4,620
(iii) QIR<1IR", ~ ~ 'ElfO/P 859 859 1,521 1,521
Household industry workers tM 554 554 911 911
o/F 305 305 610 610
(iv) 3Rl' qnff CllO/P 4,468 4,488 5.075 5,075 Other workers tM 3,872 3,872 4,371 4,371
ofF 616 616 704 704
10. 31('l1tj)I~q> cp;fi -el:l'o/P 10.286 10,286 11,954 11,954 Marginal workers ~M 3,976 3,976 4,656 4,658
ofF 6,312 6,312 7,296 7,296
(i) ~ Cllo/P 1,675 1,875 1,525 1,525 Cultivators
~ 1,245 1,245 889 869
ofF 630 630 636 636
(Ii) ~~ -el:l'otP 7,088 7,088 8,317 8,317 AgriculturallabourerG ~M 2,067 2,067 2,968 2,968
olF 5,021 5,021 5.349 5,349
(iii) QIRIlIR<'P mTrrr '1J>1ff i1lotP 281 281 935 935 Household industry workers
~ 68 66 154 154
o/F 213 213 781 761
(iv) 3Rl' ~ i1lo/P i,044 1,044 1,177 1,177 Other workers
~ 596 596 647 647
ofF 448 448 530 530
11. iR q;;ff i1lo/P 54,671 54,677 54.506 54,506 Non-workers ~
21,659 21,659 22,668 22,668 olF ~3,01e 33,018 31,838 31,838
154
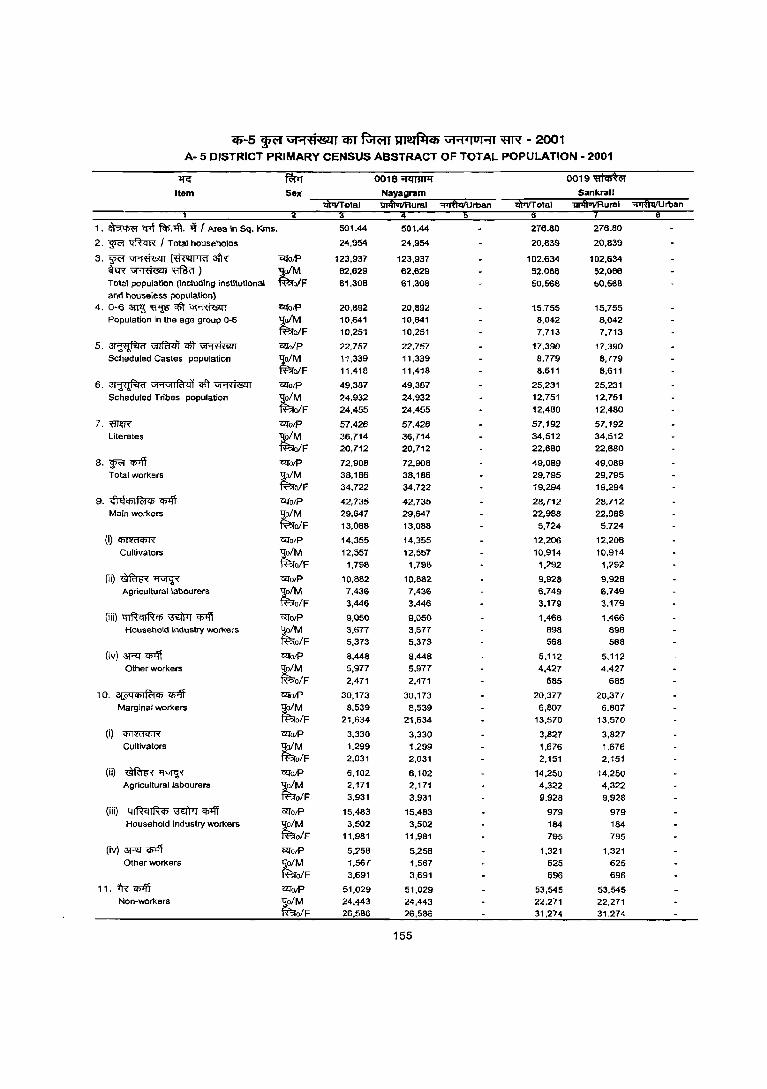
q;-5 ~ Ui"1't'i&H q;y ~ YNlfliCb \>,1"1'IOHI ~ - 2001 A· 5 DISTRICT PRIMARY CENSUS ABSTRACT OF TOTAL POPULATION· 2001
1IG ~ 0018 "Illl1IJlJ oo19~ Item Sex Sankrall
lIl'JI\1rrIR ural "'I1'i4\iiIUrban
1. ~ ~ f<I;.~. ~ f Area in Sq. KIlls. 501.44 501.44 276.80 276.80
2. ~ 1:fftcrR I Total households 24.954 24.954 20.839 20.839
3.~~(~afr{ c;!folP 123.937 123.937 102.634 102.634 ~~~) ~M 62,629 62,629 52,086 52,066 Total population (Including Institutional ofF 61,308 61,308 50,568 50,568 and houseless population)
4.0-6Wl~~~ <2folP 20,892 20.892 15.755 15,755 Population in the age group 0-6 tM 10,641 10.641 8,042 8,042
o/F 10.251 10.251 7,713 7.713
5. ~ VlJ'Fct<ij qlT ~ Cllo/P 22,757 22.757 17,390 17.390 SCheduled Castes population
tM 11,339 11,339 8.779 8,779
o/F 11,418 11,418 8.611 8,611
6. ~ UJ'1"1IRi'l1 q,'t ~ CllolP 49.387 49,367 25,231 25.231 Scheduled Tribes population
tM 24,932 24,932 12,751 12.751
ofF 24,455 24.455 12,480 12.480
7.mm CllotP 57.426 57.426 57,192 57.192 Literates ;J;o/M 36.714 36,714 34.512 34.512
fi:?JofF 20,712 20,712 22,680 22,680
8. ~ <I>'ff <2fotP 72,908 72.908 49,089 49.089 Total workers tM 38.186 38.186 29.795 29.795
o/F 34.722 34.722 19,294 19,294
9. c:fl QchlRi Cjj <I>'ff "UfotP 42.735 42,735 28,712 28.712 Main workers tM 29,647 29,647 22,988 22,988
ofF 13.088 13.088 5.724 5.724
(i)~ G[fO/P 14.355 14.355 12.206 12.206 Cultivators tM 12,557 12,557 10.914 10.914
olF 1.798 1.798 1.292 1.292
(ii)~~ Oll'OIP 10.882 10.882 9.928 9,928 Agricultural labourers tM 7.436 7,436 6.749 6.749
ofF 3,446 3,446 3.179 3.179
(iii) ql~q,~i'f} '3'dM 'i'f}lfi Oll'olP 9.050 9.050 1,466 1.466 Household industry workers tM 3,677 3.677 B9B 898
ofF 5,373 5.373 568 568
(iv)~~ G[fotP 8.448 8.448 5.112 5.112 Other workers ~ 5.977 5.977 4,427 4,427
o/F 2,471 2.471 685 685
10. 3Lc;q<t>IRiCjj ~ G[fo/P 30,173 30.173 20.377 20.377 Marginal workers ~ 8.539 8,539 6,807 6.807
ofF 21.634 21.634 13.570 13,570
(i) ~ G[folP 3.330 3,330 3,827 3,827 Cultivators ~ 1.299 1.299 1.676 1,676
ofF 2.031 2,031 2.151 2,151
(ii) ~~ 1ZfolP 6.102 6,102 14,250 14.250 A9ricultural labourers
~ 2,171 2.171 4.322 4,322
ofF 3.931 3.931 9.928 9,928
(iii) ql~qIRq; 'G'E:lTrr 'i'f}lfi G[fO/P 15.483 15.483 979 979 Household Industry workers tM 3,502 3,502 184 184
olF 11.981 11,981 795 795
(iv) 3RT"CI'f'ff G[fo/P 5.258 5,258 1.321 1,321 Oth sr workers
~ 1.567 1,567 625 625
ofF 3.691 3,691 696 696
11. 1'R- <I>'ff c.zrO/P 51,029 51,029 53,545 53.545 Non·workers ~M 24~43 24,443 22.271 22,271
ofF 26.586 26,586 31.274 31,274
155
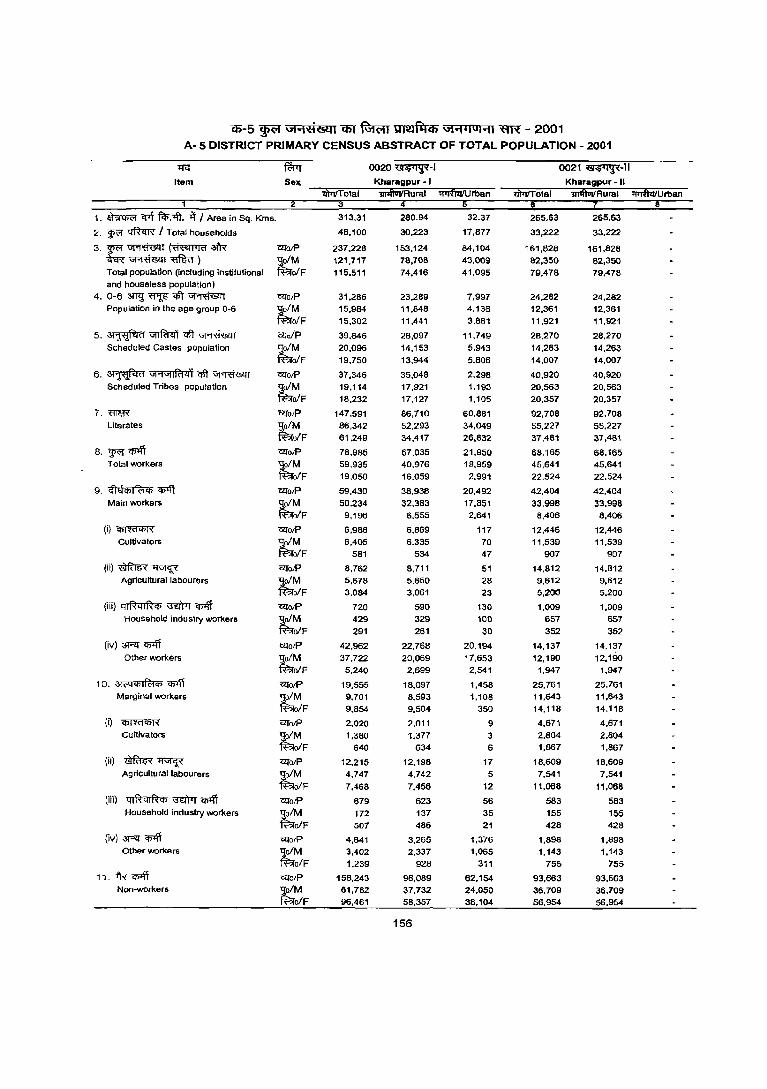
(6-5 ~ \i1'i>8'8lt1 Q)f ~ UlelfqCb \i1'i~IUI'i1 ~ - 2001 A· 5 DISTRICT PRIMARY CENSUS ABSTRACT OF TOTAL POPULATION· 2001
1lG ~ 0020~·1 0021~-1I
Item Sex Kharagpur • I Kharagpur - II '!IPTITolal U1>ftUilRural ~rban DI41.lfRural "'Iflu/Urban
1. ~ ?pf ~ . ..ft. >r/ Area in Sq. Kms. 313.31 280.94 32.37 265.63 265.63
2. ~ ~ I Total households 48.100 30,223 17.877 33.222 33.222
3.~~(~~ CliolP 237.228 153.124 84.104 161.828 161,828 ~~~} tM 121.717 78,708 43,009 82,350 82,350 Total population (including institutional ofF 115.511 74,416 41.095 79,478 79.478 and house less population)
4. 0-6 ~~qlt~~ CliOIP 31.286 23.289 7,997 24,282 24,282 Population in the age group 0-6 tM 15.984 11.848 4.136 12,361 12,361
ofF 15,302 11.441 3.861 11.921 11.921
5.~~ctt~ Clio/P 39,846 28,097 11.749 28.270 28.270 Scheduled Castes population tM 20,096 14.153 5,943 14.263 14,263
ofF 19,750 13,944 5,806 14,007 14,007
6. ~ \iI'1\i1IR!,li ctt ~ CliolP 37.346 35,048 2.298 40,920 40,920 Scheduled Tribes population ~M 19,114 17,921 1.193 20,563 20,563
ofF 18,232 17,127 1.105 20,357 20,357
7. m&R CliOIP 147,591 86,110 60,881 92,108 92,708 Literates
~ 86,342 52.293 34,049 55.227 55.227 ofF 61,249 34,411 26,832 37,481 37,481
8.~~ CliOIP 78,985 57.035 21,950 68,165 68,165 Total workers tM 59,935 40,976 18,959 45,641 45,641
ofF 19.050 16.059 2.991 22.524 22,524
9. <flehhlf?iCl> 'Cf>Iff CliotP 59.430 38,938 20,492 42,404 42.404 Main workers tM 50,234 32.383 17,851 33,998 33,998
ofF 9,196 6,555 2,641 8,406 8,406
(i) 'IilT<'flhR CliOIP 6,986 6,869 117 12,446 12,446 Cultivators ~M 6.405 6,335 70 11,539 11,539
ofF 581 534 47 907 907
(ii}~~ CliotP 8,762 8,711 51 14,812 14,812 Agricultural labourers ~M 5,678 5,650 28 9,612 9.612
ofF 3,084 3,061 23 5,200 5,200
(iii) qlRqlRCI> -;n:ITrr ~ CliOIP 720 590 130 1,009 1.009 Household industry workers tM 429 329 100 657 657
ofF 291 261 30 352 352
(ivJ 3RI' "CJ>lff CliotP 42.962 22.168 20.194 14,137 14.137 Other workers tM 37,722 20,069 11,653 12,190 12.190
ofF 5,240 2,699 2.541 1,947 1,947
10. 31<'4<f)I~CI> <I>4T CliOIP 19.555 18.097 1,458 25,761 25,761 Marginal workers tM 9,701 8.593 1.108 11,643 11,643
ofF 9.854 9.504 350 14.118 14,118
(0 ~ CliotP 2,020 2,011 9 4,671 4,671 Cultivators tM 1,380 1,371 3 2,8Q4 2.804
ofF 640 634 6 1,867 1,867
(ii} ~~ CliOIP 12.215 12,198 11 18,609 18,609 Agricultural labourers tM 4,747 4,142 5 7,541 7,541
ofF 7,468 7.456 12 11,068 11,068
(iii) QIRqlRCI> ~ Cfl1ff CliotP 679 623 56 583 583 Household industry workers tM 172 131 35 155 155
ofF 507 486 21 428 428
(iv) 3RI' "CJ>lff CliOIP 4,641 3,265 1,376 1,898 1,898 Other workers tM 3,402 2.331 1,065 1,143 1,143
ofF 1.239 928 311 755 755
11. ~~ CliOIP 158,243 96,089 62.154 93,663 93.663 Non-WOrkers tM 61,782 37,132 24,050 36,109 36,709
ofF 96,461 58,357 38,104 56,954 56,954
156

Qi-5 ~ \;1""1'<'1$11 CfiT ~ tJl~flICb \;"J'1'luHI ~ - 2001 A· 5 DISTRICT PRIMARY CENSUS ABSTRACT OF TOTAL POPULATION· 2001
~
Item
1. ~ ?fit f<n.1fl. -if I Area In Sq. Kms.
2. ~ ~ I Total households
3·F~~a1R tER-~~) Tolal population (including institutional and houseless population)
4. 0-6 3fRl ~ <1ft ~ Population in the age group Q-6
5.~~qlt~ Scheduled Castes population
6. ~ Gt"tGtIFa41 '1ft ~ Scheduled Tribes population
7.mm Literates
8. ~ <ff'ff T alai workers
9. ..1 tfCf>l~ II> CJ?Iff Main workers
(O~ Cultivators
{;;)~iR~ Agricultural labourers
(iii) 4IR<nRq; ~ ~ Household industry workers
(iv) ~ cmff Other workers
10. a!<"lCf>lf<:III> q;-.ff Marginal workers
(;)~
Culllvators
(ii)~~ Agricultural labourers
(iii) 41RqlRiI> ~ Cj'i'iff Household Industry workers
{iv) 3RI' cmff Other workers
11. i'R cpoff Non-workers
Sex
'l2l0tP '!{o1M fi!;:tolF
C21'otP ~oIM R?lolF C2JaiP
~F C21'otP ~oIM R?lolF C2JotP '!{oIM R?lo/F
'l2lotP ~o/M R?lolF C21'OJP '!{0/M ~0/F C21'otP ~o/M ~oIF
C21'atP ~o/M ~oIF
C2JotP "lolM R?lolF C2Jo/P ~o/M ~oIF
C2JolP ~/M ~oIF
'l2lolP
~oIM ~o/F C21'otP '!{oIM ~0/F C21'otP
~F
1h1iITotai
342.41
52.882
255.220 129,224
125,996
34.831
17,647 17,184
31,000
15.533 15,467
49.902 25,157
24,745
161,904
93.852
68.052
115,336 73,265
42,071
75,846
58,227 17,619
23,133
20,066
3.067
26,919
15.947 10,972
2,233
1.722 511
23,561
20,492
3,069
39.490 15,038
24,452
8.483 3,591
4,892
22,205
8,540 13,665
1.112
296 816
7,690
2,611
5,079
139.884 55.959 83,925
0022 fiii' Debra
riVliRural
337.75
50.166
243,013
123,122
119,891
33.413
16.957 16.456
29,473
14.783
14.690
49.403 24,912 24,491
153,303
89.102
64,201
110.908
69.880
41.028
72,271
55,280
16,991
23,035
19.977 3.058
26,659
15.799 10.860
2,165
1.682 483
20.412
17,822
2,590
38.637 14.600
24.037
8.454
3,568
4.886
21.745 8,3&
13,389
f.079
281 798
7,359
2,395
4,964
132.105 53,242 78,863
157
~rban
4.66
2.716
12,207
6.102 6,105
1.418
690 728
1,527
750
777
499 245
254
8.601 4.750
3,851
4.428
3.385 1.043
3.575
2.947
628
98
89
9
260
148 112
68 40
28
3,149
2.670 479
853 438
415
29
23 6
460
164
276
33
15
18
331
216
115
7.779 2.717
5,062
1h1iITotai
246.92
57.751
298,139
152.806
145,333
42.706 22,039 20,667
28,235 14.221
14,014
12,511
6,341 6,170
197,840 114.326
83,514
105,960 81,143 24,817
77,411
66,513
10,698
20.162 18,750
1,412
16.161
12,324 3.837
7.150
4.455
2.695
33.938
30,984
2,954
28.549 14.630
13,919
6.825 3,113 3,712
13.925 7,372
6,553
2.880
759 2,121
4,919
3.386 1,533
192.179 71,663
120,516
0023~-1 Panskura ·1 iPfiVifRural
245.33
56,093
289,851
148.622
141,229
41.518
21.466 20,052
27,309 13.756
13.553
12,446 6,305 6.141
192.678 111.416
81.262
103.420 79.048 24.372
75.402
64.749
10,653
20,138
18,726
1.412
16.096
12.267 3.82,,)
7,128
4.438
2.690
32,040
29,318
2,722
28,018 14.299
13,719
6.814 3,102
3.712
13.844 7,322
6.522
2.820 750
2.070
4,540
3.125 1,415
186.431 69,574
116,857
;:;T(fi<iilJ rban
1.59
1,658
8,288
4,184
4,104
1,188
573 615
926 465
461
6e' 36 29
5,162
2.910 2,252
2,540
2.095 445
2,009
1,764
245
24
24
65
57
8
22 17
5
1,898
1,666
232
531 331
200
11 11
81
50
31
60
9 51
379
261
118
5.748
2.089 3,659
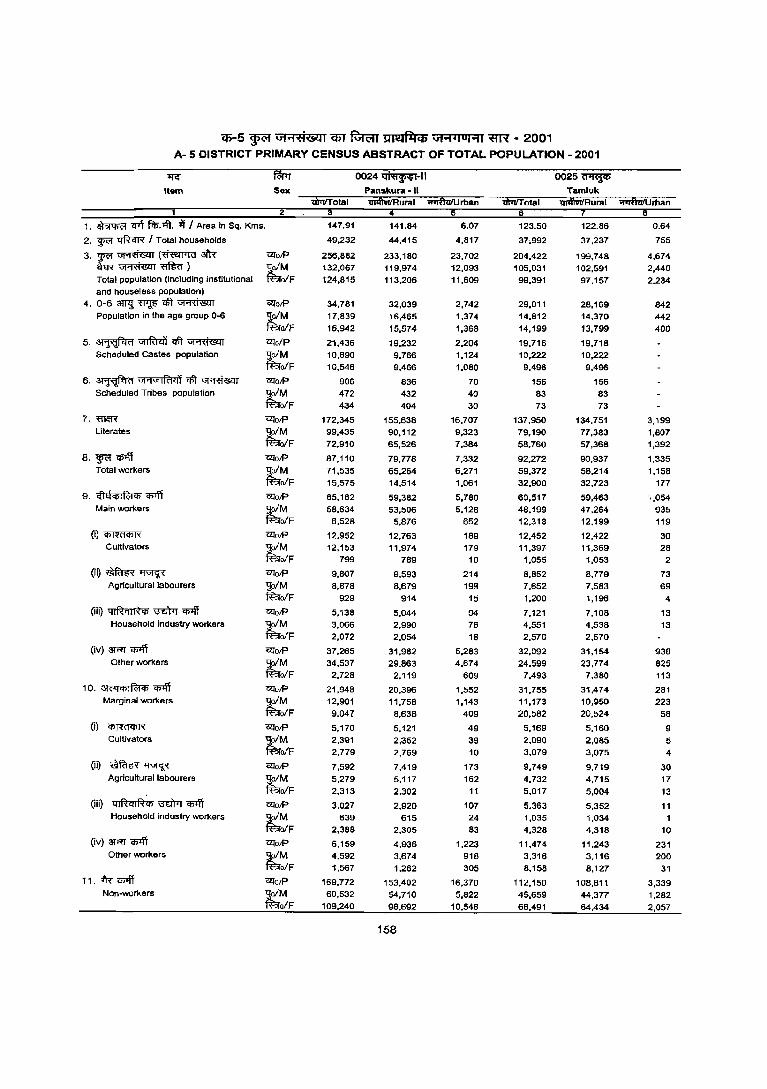
CJ)-5 ~ ut""l=t1<§lJ1 QIT ~ tlMfi:lCb \J1""1 41UI""l1 ~ - 2001 A- 5 DISTRICT PRIMARY CENSUS ABSTRACT OF TOTAL POPULATION - 2001
"IfG
Itilm SilX
1. ~ wt ~:ofi. it I Area in Sq. Kms.
2. wa trlt<IR' I Total households
3. ~ 'Gffii<;m (~ 3I'R W~~) Total population (including institutional and houseless population)
4.0-6~~c61~ Population in the age group 0-6
5.~~c61~ Scheduled Castes population
6. ~ UI"1U1IR14f ~ ~ Scheduled Tribes population
7.'ffi1ffi' Literates
8. WFr'1l>'ff Total workers
9. Gltj<l>IR:t<l> <J>1l'i Main workers
(il "<I>ffif<I>R Cultivators
(iQ~~ Agricultural labourers
(iii) 4IRqil~<l> \3'dITr ~ Household industry workers
(iv)~~ Other workers
10. 3lC'4Cf>IRt<l> <J>1l'i Marginal workers
(il "<I>ffif<I>R Cultivators
(ii)~~ Agricultural labourers
(iii) 4IRqIR<l> ~ <J>1l'i Household industry workers
(iv)~~ Olher workers
11. 'i"R-~ Non-workers
CZloiP 'JoIM ~oIF
CZloiP 'JoiM ~oIF CZlo/P 'JoiM ~o/F CZloiP 'JoiM ~o/F CZlolP 'Jo/M ~oIF CZlolP -go/M ~o/F
CZloiP -go/M ~o/F CZlolP 'JoiM fBro/F
CZlolP
'Jo/M ~oIF 'a/oiP 'Jo/M ~oIF
CZlolP 'JoiM fBro/F
CZloiP 'JoiM ft'l;ro/F
CZlolP -g;oIM ft'l;rolF
CZlolP -g;oIM ft'l;rolF
ClfolP -g;o/M ~oIF CZloiP 'Jo/ M ~o/F ClfolP
t~F
1-47.91
49,232
256,882 132,067 124,815
34,781 17,839
16,942
21,436 10,890 10,546
906 472 4J4
172,345 99,435 72,910
87,110
71,535 15,575
65,162 58,634
6,528
12,952 12,15J
799
9,807
8.878 929
5,138 3,066 2,072
37,265 34,537
2,728
21.948 12,901
9.047
5.170 2,391 2,779
7,592
5.279 2,313
3,027 6J9
2,388
6,159 4,592 1,567
169,772 60,532
109.240
0024~-1I
141.84
44,415
233,180 119,974 113,206
32,039 16,465
15,574
19,232 9,766 9,466
836 432
404
155,638 90,112 65,526
79,778
65,264 14.514
59,382 53,506
5.876
12.763 11,974
789
9,593 8,679
914
5,044 2,990 2,054
31,982 29,863
2,119
20,396 11,758 8,638
5,121
2,352 2,769
7,419 5,117
2,302
2,920 615
2,305
4,936 3.674 1,262
153,402 54,710 98.692
158
6.07
4,817
23,702 12,093 11,609
2,742 1.374
1,368
2,204 1,124 1,080
70 40
30
16,707 9,323 7,384
7,332
6,271 1,061
5,780 5,128
652
189 179
10
214 19f'!
15
94 76 18
5,283 4,674
609
1,552 1,143
409
49
39 10
173 162
11
107 24 83
1,223 91B 305
16,370 5,822
10.548
'ift1T/T otal
123.50
37",992
204,422 105,031 99,391
29,011 14,812
14,199
19.718 10,222
9,496
156 83
73
137,950 79,190 58.760
92,272
59.372 32.900
60,517 48.199 12,318
12,452 11,391'
1,055
8,B52 7,652 1,200
7,121 4,551 2,570
32,092
24,599 7.49J
Jl,755
1',17J 20,582
5,169
2,090 3,079
9,749 4,732 5,017
5.363 I,OJ5 4,328
11,474 3.316 8,158
112.150 45,659 66,491
0025~
Tamluk 1n1thIIfRurai "I'IiftiIfUrban
122.86
37,237
199,748 102,591
97,157
28.169 14,370 13,799
19,718 10,222 9,496
156 83 7J
134.751 77,383 57,368
90,937
58.214 32,723
59,463 47,264 12.199
12,422 11,J69
1,053
8,779 7.583
1,196
7.108 4,538 2,570
31,154 23,774 7,J80
31,474 10,950 20,524
5,160
2,085 3,075
9,719 4,715
5,004
5,352 1,034 4,318
11,243 3,116
8,127
108,811 44,377 64,434
0.64
755
4,674 2,440
2.234
842 442 400
3,199 1,807 1,392
1,335
1.158 177
1,054 935 119
30 26
2
73 69
4
13 13
938 825 113
261
223 58
9 5 4
30 17
13
11 1
10
231
200 31
3,J39 1,282 2,057
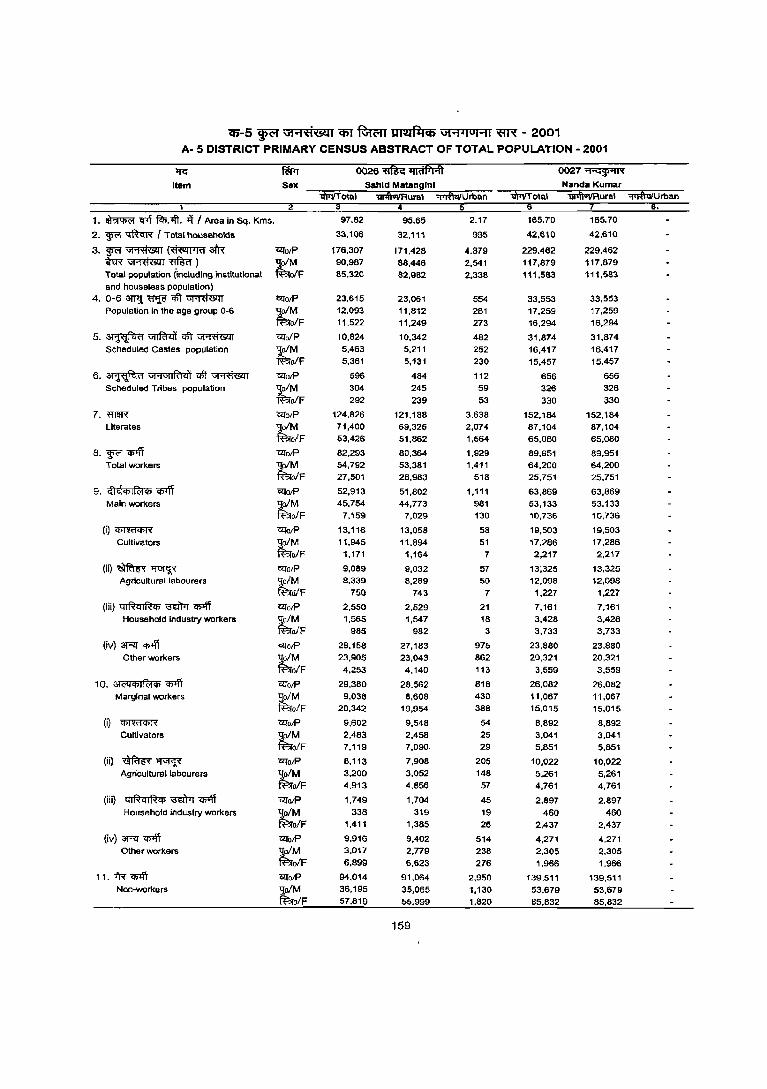
<6'-5 ~ \iI"'I'¢1~1 C6'T 'R;n;rr Jmlfi:lCb \iI"'IJIOI"'l1 ';fIR - 2001 A- 5 DISTRICT PRIMARY CENSUS ABSTRACT OF TOTAL POPULATION - 2001
~ fWr 0026.~ 0027~
Item Sax Nanda Kumar
1IlrIIT otal 'lPVTotal "1~.IIAural "'lofi""Urban
1. ~ ~ 1lP:<ft. -ij I Area in sq. Kms. 97.82 95.65 2.17 165.70 165.70
2. WtiI ~ I Total households 33,106 32,111 995 42,610 42,610
3·WtiI~(~~ <2I'o/P 176,307 171,428 4.879 229.462 229.462
~~~) ~F 90,987 88.446 2,541 117,879 117,879
Total populatiol\ (includln9 institutiol\al 85,320 82,982 2,338 111,583 111,583 and houseless population)
4. 0-6 ~~qft~ <2I'o/P 23,615 23,061 554 33,553 33,553 Population In the age group 0-6 tM 12.093 11,812 281 17,259 17,259
ofF 11,522 11.249 273 16,294 16,294
5.~~qft~ Cl:ToIP 10,824 10,342 482 31.874 31,874 Scheduled Castes population ~
5,463 5,211 252 16,417 16,417
ofF 5,361 5,131 230 15,457 15,457
6. ~ \i1'1\i11R'l41 <1ft ~ Cl:TotP 596 484 112 656 656 Scheduled Tribes population ~
304 245 59 326 326
ofF 292 239 53 330 330
7. "ffi1fR CUO/P 124,826 121.188 3.638 152.184 152.184 Literates r 71,400 69,326 2,074 67,104 87,104
olF 53,426 51,862 1,564 65,080 65,080
8·F~ Cl:TO/P 82,293 80,384 1,929 89,951 89,951 Total workers r 54,792 53.381 1,411 64,200 64,200
olF 27,501 26,983 518 25,751 25,751
9. <{jthlllf'clct> <Plff CUOlP 52,913 51,802 1,111 63,869 63,869 Main workers t~F
45,754 44,773 981 53,133 53,133 7.159 7,029 130 10,736 10,736
(i) "1/l'PRI'iPR CUotP 13,116 13,058 58 19,503 19,503 Cultivators ~ 11.945 11.894 51 17.286 17,286
olF 1,171 1,164 7 2,217 2,217
(iO~~ Cl:TO/P 9,089 9,032 57 13;325 13,325 Agricultural labourers r 8,339 8,289 50 12,098 12,098
ofF 750 743 7 1,227 1,227
(iii) ql~ql~ct> '3Ei'rrr 'CI>lff ClTotP 2,550 2,529 21 7.161 7,161 Household industry wor1<ers
~ 1,565 1,547 18 3,428 3,428
ofF 985 982 3 3,733 3,733
(iv) 3Rr "filif ClfO/P 2B,158 27,183 975 23,880 23,880 Other workers ~ 23.905 23,043 862 20.321 20.321
ofF 4,253 4.140 113 3.559 3.559
10. 3l<"lct>Ifc>ict> ~ ClTO/P 29,380 28.562 818 26,082 26.082 Marginal workers tM 9,038 8,608 430 11,067 11,067
olF 20,342 19,954 388 15,015 15,015
(i) C/lffifct>R ClTotP 9.602 9,548 54 8,892 8,892 Cullivators ~
2,483 2.458 25 3.041 3.041 olF 7,119 7,090. 29 5,851 5,851
(ii) ~~ CZlotP 8,113 7,908 205 10,022 10,022 Agricultural labourers ;tM 3,200 3,052 148 5,261 5,261
ofF 4.913 4.856 57 4,761 4,761
(iii) QI~ql~q> i3EWr <Plff Cl:TotP 1,749 1.704 45 2,897 2,897 Household industry workers
~ 338 319 19 460 460
ofF 1,411 1,385 26 2,437 2,437
(iv) 3Rr "filif Cl:TotP 9,916 9,402 514 4,271 4,271 Other workers
~ 3.017 2,779 238 2,305 2,305
olF 6,899 6,623 276 1,966 1.966
11. -iR ~ Cl:TotP 94.014 91.064 2.950 139.511 139,511 Non-wor1<ers ~
36,195 35,065 1,130 53,679 53,679 olF 57,819 55,999 1,820 85,832 85,832
159
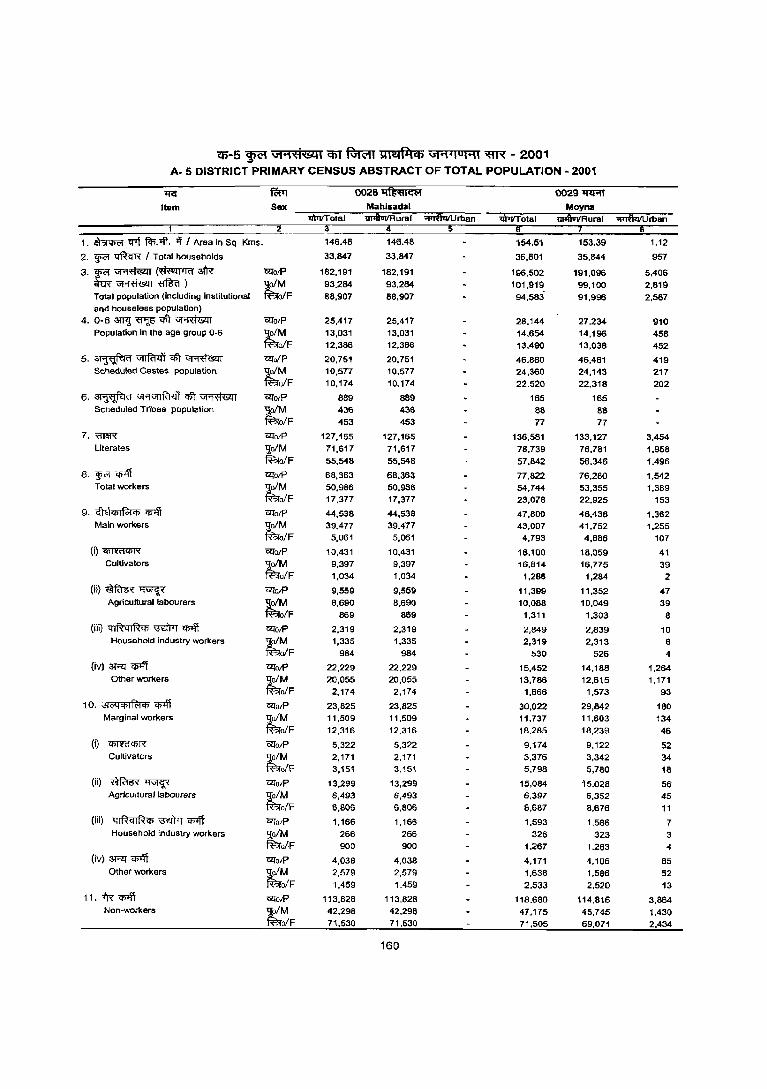
Qi-5 ~ Gt"'1'tt'841 C5T ~ lOI\tI{l{Cb Gt"'1.,oHI ;m;{ - 2001 A- 5 DISTRICT PRIMARY CENSUS ABSTRACT OF TOTAL POPULATION - 2001
11<: ~ 0028~ 0029~
Item Sex Mahlsadal tWvTotal lIT'fIvTrRural "I"'RltVU man
1
1. ~ -ert fcl;.-.:ft. >ll Area In Sq Kms. 146.46 146.48 154.51 153.39 1.12
2. w<'I tJftcrR I Total househOlds 33,847 33,847 36,801 35,844 957
3.w<'I~(~~ "IilToiP 182,191 182,191 196,502 191,096 5,406 ~~~) tM 93,284 93,284 101,919 99,100 2,819 Total population (including institutional o/F 88,907 88,907 94,583' 91,996 2,587 and houseless population)
4. 0-6 311<j ~ <1ft ~ "IilTorP 25,417 25,417 28,144 27,234 910 Population In the age group 0-6
~F 13,031 13,031 14,654 14,196 458 12,386 12,386 13,490 13,038 452
5.~~ctr~ "IilToIP 20,751 20,751 46,880 46,461 419 Scheduled Castes population tM 10,577 10,577 24,360 24,143 217
o/F 10,174 10,174 22,520 22,318 202
e, ~ Uj·NlIRI"lf ctr ~ "IilTorP S89 889 165 165 Scheduled Tribes popUlation tM 436 436 88 88
olF 453 453 77 77
7. m&N O!:[orP 127,165 127,165 136,581 133,127 3,454 Literates ljoiM 71,617 71,617 78,739 76,781 1,958
~o/F 55.548 55,548 57.842 56.346 1.496
8. w<'I q,.ff O!:[orP 68,363 68,363 77,822 76,280 1.542 Total workers ~M 50,986 50,986 54,744 53,355 1.389
olF 17,377 17,377 23.078 22.925 153
9. ,;ltlct> I Ri4> Ct>'Iff "&IolF' 44,538 44,538 47,800 46.438 1,362 Main workers ~M 39.477 39.477 43.007 41.752 1.255
olF 5.061 5,061 4,793 4,686 107
(i)~ "IilTotP 10,431 10,431 18,100 18,059 41 Cultivators ~M 9,397 9,397 16,814 16,775 39
olF 1,034 1,034 1,286 1,284 2
(ii)~~< "IilTcvP 9,559 9,559 11,399 11,352 47 Agricultural labourers ~M 8,690 8.690 10.088 10.049 39
olF 869 869 1,311 1,303 8
(iii) 4IR<lIR<n ~ q;>fi l2l"olF' 2,319 2,319 2,849 2,839 10 Household industry workers ~M 1,335 1,335 2,319 2,313 6
ofF 984 984 530 526 4
(iv) ~ <'P'ff "IilTorP 22,229 22.229 15,452 14,188 1,264 Other workers
tM 20,055 20,055 13,786 12,615 1,171 olF 2,174 2,174 1.666 1,573 93
10. ;)j('q<nl~<n "1l>'ff C2;fO/P 23,825 23,825 30,022 29,842 180 Marginal workers ~M 11,509 11,509 11,737 11,603 134
ofF 12,316 12.316 18.285 18.239 46
(i) ~ "IilToR 5,322 5,322 9,174 9,122 52 Cultivators ~M 2,171 2,171 3,376 3,342 34
ofF 3,151 3,151 5,798 5,780 18 (ii) ~~ "IilTo/P 13,299 13,299 15,084 15,028 56
Agrlcullurallabourers tM 6,493 6,493 6,397 6,352 45 ofF 6,806 6,806 8,687 8,676 11
(iii) q I ~ q I ~ <n i3El'rl <'P'ff "IilTolF' 1,166 1,166 1,593 1.586 7 Household industry workers "9,o/M 266 266 326 323 3
ff!.;rolF 900 900 1,267 1,263 4 (iv) ~ <'P'ff "IilTolF' 4,038 4,038 4,171 4,106 65
Other workers ~M 2,579 2,579 1,638 1,586 52 ofF 1,459 1,459 2,533 2,520 13
11.fl<~ O!:[olF' 113.828 113,828 118,680 114,816 3,864 Non-workers tM 42,298 42,296 47,175 45,745 1,430
ofF 71,530 71,530 71,505 69,071 2,434
160
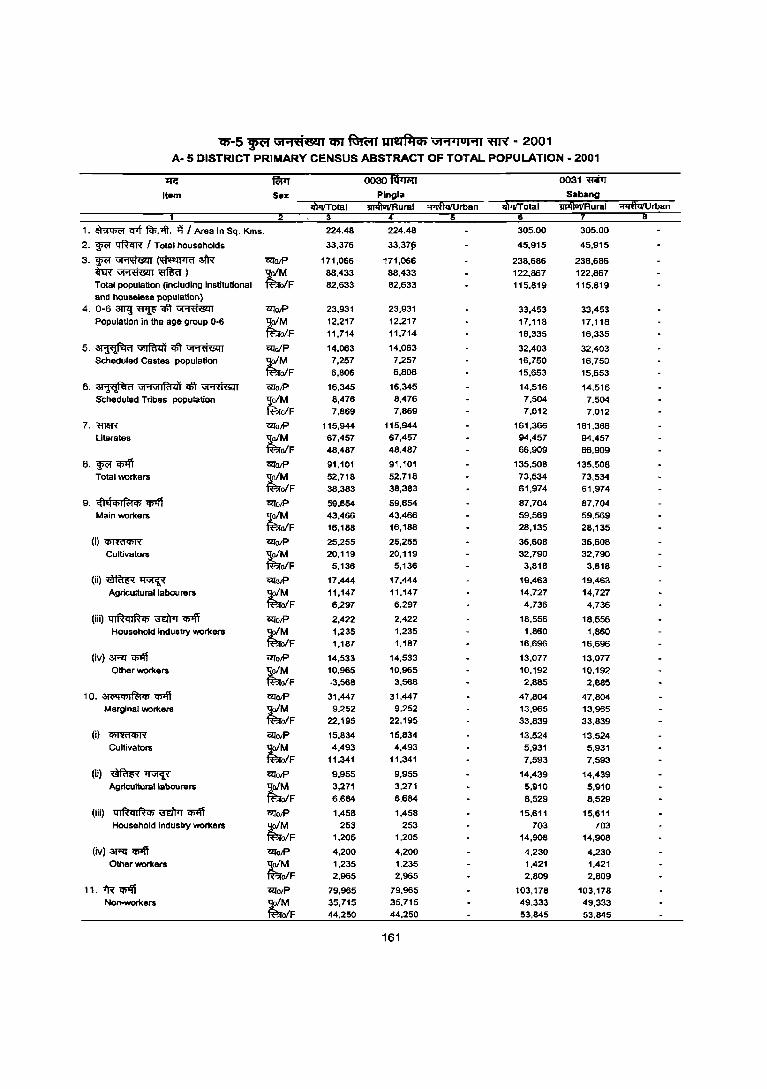
l5-5 ~ GHti&:l1 em ~ UI~f'lCf) Gt"'t.lul"'t1 ~ - 2001 A· 5 DISTRICT PRIMARY CENSUS ABSTRACT OF TOTAL POPULATION - 2001
'Ire ~ 0030taTTiiT 0031~
Item Sex
1. ~ ~ fcF:lft. "I'! I Area In Sq. Kms. 224.48 224.48 305.00 305.00
2. W<" qftCfR I Total households 33.376 33.37jS 45,915 45,915
3.W<"~~$ l2l'O!P 171,066 171,066 238,686 238,686 ~~~)
t~F 88,433 88.433 122,867 122.867
Total population (Including Institutional 82,633 82,633 115.819 115,819 and houseless population)
4. 0-6 3lTl] ~ q\l ~ 12!eR 23,931 23,931 33.453 33,453 Population in the age group ()-6
~ 12,217 12,217 17,118 17.118
ofF 11.714 11.714 16,335 16.335
5.~~"i'Ift~ 12!alP 14.063 14,063 32,403 32,403 Scheduled Castes population r 7,257 7,257 16,750 16,750
ofF 6.806 6,806 15.653 15.653
6. ~ GI'1G1IRi,j'j q\l ~ 12!oP 16.345 16.345 14.516 14.516 Scheduled Tribes population
~ 8,476 8,476 7,504 7,504
ofF 7,869 7,669 7,012 7,012
7. meR 12!aR 115,944 115,944 161,366 161,366 Literates
~ 67,457 67,457 94,457 94,457
ofF 48,487 46.487 66,909 66.909
8. wc;r ~ 12!O!P 91,101 91.101 135,508 135,508 Total workers ~
52,718 52,718 73,534 73,534
ofF 38,383 38,383 61,974 61,974
9, <ftEf<lilffl<li"<!>"'ff l2l'oP 59,654 59,654 87,704 87,704 Main workers r 43.466 43,466 59,569 59,569
ofF 16,188 16,186 28,135 26,135
(i)~ 12l"O!P 25,255 25,255 36,608 36,608 Cultivators tM 20,119 20,119 32,790 32,790
ofF 5,136 5,136 3,818 3,818
(ii)~~ 12l"oiP 17,444 11,444 19,463 19,463 Agricultural labou rers r 11,147 11,147 14,727 14,727
ofF 6,297 6,297 4,736 4,736
(iii) 41~ql~<Ii i3"dJ"q ~ 12l"aR 2,422 2,422 18,556 16,556 Household Industry workers r 1,235 1,235 1,860 1,860
ofF 1,187 1,187 16,696 16,696
(iv) 3RT q;1ff illoR 14,533 14,533 13,077 13,077 Other workers ~F 10,965 10,965 10,192 10,192
·3,568 3,566 2,885 2,685
1 O. ;)1<"1 <iiI ffl qs "1P'ff 12l"o!P 31,447 31,447 47,804 47,804 Marginal workers
~ 9,252 9,252 13,965 13,965
ofF 22,195 22,195 33,839 33,839
(i) ~ 12l"oR 15,834 15,834 13.524 13.524 Cultivators r 4,493 4,493 5,931 5,931
ofF 11,341 11,341 7,593 7,593
(ii) ~~ 12l"oR 9,955 9,955 14,439 14,439 Agricultural labourers r 3,271 3,271 5,910 5,910
ofF 6,684 6,684 8,529 8,529
(iiO 41~ql~<Ii .mm ~ 12l"O!P 1,458 1,458 15,611 15,611 Household industry workers r 253 253 703 703
ofF 1,205 1,205 14,908 14,908
(iv) 3RT"<I>'ff l2l'oR 4,200 4,200 4,230 4,230 Other workers r 1,235 1.235 1,421 1.421
ofF 2,965 2,965 2,809 2,809
11. 1R ~ 12l"oP 79,965 79,965 103,178 103,178 Non-workers
~ 35,715 35,715 49,333 49,333
elF 44,250 44,250 53,845 53,845
161
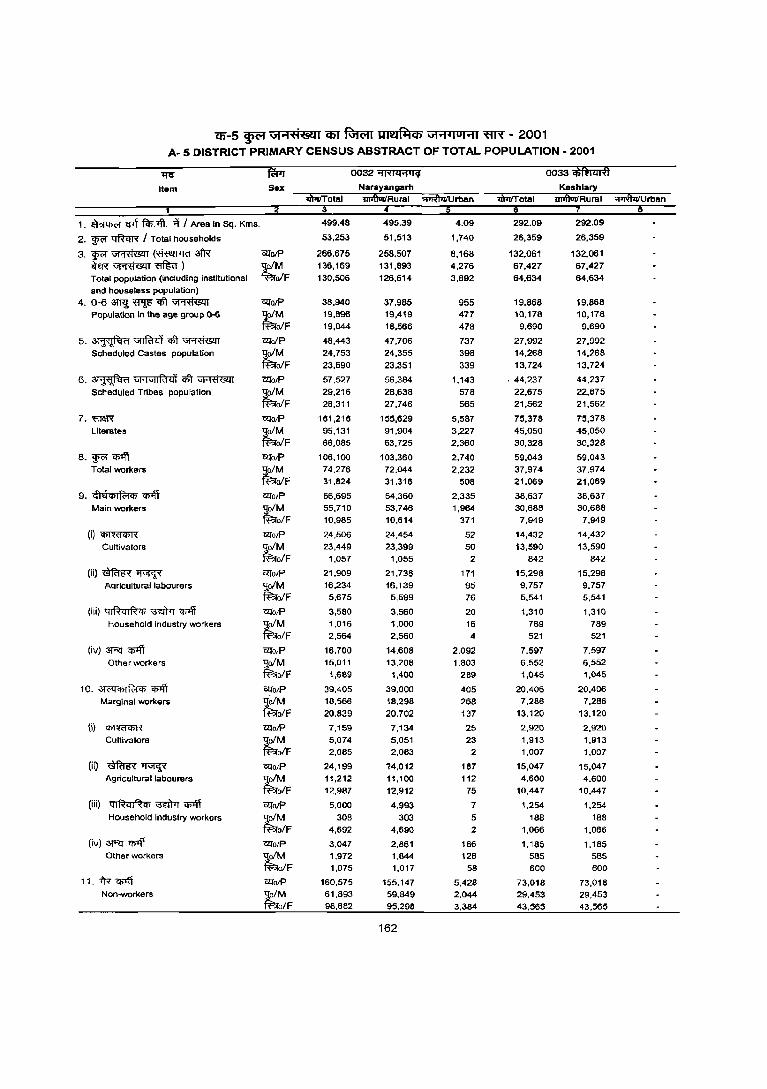
CIl-S ~ GI"'I;H&:II C6T ~ UI~flICb GI"'I4IUI"'l1 ~ - 2001 A- 5 DISTRICT PRIMARY CENSUS ABSTRACT OF TOTAL POPULATION - 2001
1l'If fWr 0032 '11"11<1'1114 0033~ Item Sex Narayangarh Keshlary
ih1iITotBI 11iiffiIIIRurai 11iiffiIIIRurBI "'IiTffiiIUrbBn
1. ~ <I7f ~:Jfi. -ij I Area In Sq. Kms. 499.48 495.39 4.09 292.09 292.09
2. ~ ~ I Total households 53,253 51,513 1,740 26,359 26,359
3.~~~3lR CUO/P 266,675 258,507 8,168 132,061 132,061
teff~mmr) tM 136,169 131,893 4,276 67,427 67,427
Total population (including institutional oIF 130,506 126,614 3,892 64,634 64,634 and houseless population)
4. 0-6 3m]; <'f1jp <1ft ~ CUotP 38.940 37.985 955 19.868 19.868 Population In the 8ge group 0-6 tM 19,896 19,419 477 10,178 10,178
olF 19,044 18,566 478 9,690 9,690
5.~~<Ift~ cuolP 48,443 47,706 737 27,992 27,992
Scheduled Castes population tM 24,753 24,355 398 14,268 14,268
olF 23.690 23,351 339 13,724 13,724
6. ~ Ul'1UlIR'l41 qft ~ ClfotP 57.527 56,384 1.143 . 44,237 44.237
Scheduled Tribes population tM 29,216 28,638 578 22,675 22.675
oIF 28,311 27,746 565 21,562 21.562
7. 1ffi~ 12lo/P 161.218 155.629 5.587 75.378 75.378 Literates tM 95.131 91,904 3,227 45.050 45.050
olF 66,085 63,725 2,360 30,328 30,328
8.~~ 12lo/P 106.100 103.360 2.740 59.043 59.043 Total workers tM 74.276 72.044 2.232 37,974 37,974
olF 31,624 31.316 508 21.069 21.069
9. i~hht>lR1Cjj ~ GQolP 66,695 64,360 2,335 38,637 38.637 Main workers tM 55.710 53,746 1,964 30.688 30,688
o/F 10.985 10,614 371 7,949 7,949
(i)~ 12lo/P 24.506 24,454 52 14.432 14,432
Cultivators ljo/M 23.449 23,399 50 13,590 13,590 ff:;Jo/F 1.057 1,055 2 842 842
(ii)~~ ClfolP 21,909 21.738 171 15.298 15.298 AQriculturallabourers 'loiM 16,234 16.139 95 9.757 9.757
fi"?rolF 5.675 5,599 76 5,641 5,541
(iii) ql~(jIRiji m:rrrr '1fi1ff 12lo/P 3,580 3,560 20 1,310 1,310
Household industry workers tM 1,016 1.000 16 789 789
ofF 2,564 2,560 4 521 521
(iv) 3RJ q;>ff ClfOIP 16,700 14.608 2,092 7,597 7.597 Other workers 'loiM 15,011 13,208 1,803 6,552 6,552
fi"?ro/F 1,689 1,400 289 1,045 1,045
10. ;)j('q'l7If<:!iji cn-.ft C2l'olP 39,405 39,000 405 20,406 20.406 Marginal workers ;tM 18,566 18,298 268 7,286 7,286
o/F 20,839 20,702 137 13,120 13,120
(i) ~ ClfolP 7,159 7,134 25 2,920 2,920
Cultivators ~
5,074 5,051 23 1,913 1,913 olF 2,085 2,083 2 1,007 1,007
(ii) ~~ ClfO/P 24,199 '24,012 187 15.047 15,047 Agricultural labourers tM 11,212 11,100 112 4,600 4,600
ofF 12,987 12,912 75 10,447 10.447
(iii) tllRqlfh, ;ro'trr ~ CZTotP 5,000 4,993 7 1,254 1.254 Household industry workers tM 308 303 5 188 188
ofF 4,692 4,690 2 1,066 1.066
(iv) 3RJ '1fi1ff CUOIP 3,047 2,861 186 1.185 1.185 Other workers tM 1,972 1,844 128 585 585
ofF 1,075 1,017 58 600 600
11. m C!>'ff 12lo/P 160,575 155.147 5.428 73.018 73,018 Non-workers tM 61.893 59.849 2.044 29.453 29,453
olF 98,682 95,298 3,384 43.565 43,565
162

'ij)-5 ~ GHtt&:l1 C5T ~ ~ Gt .... roHI ~ - 2001 A· 5 DISTRICT PRIMARY CENSUS ABSTRACT OF TOTAL POPULATION· 2001
1'11: fWT 0034 'iffiR ·r 0035 <!i<R.1I
Item Sex Dantan -I Oantan -II
1iiiftVi1Rural "I"T&iIUrban 1iWTotal 1iiiftVi1Rural ~Urban
1. ~ Qif f<I>:4t. it I Area In Sq. Kms. 257.07 257.07 185.56 185.56
2. ~ ~ I Total households 28,087 28,087 24,778 24,776
3.~~(~atR CZl'oiP 151,376 151,376 134,360 134,360 ~~~)
~ 77,203 77,203 68,823 68,1123 Total population (Including institutional olF 74,173 74,173 65,537 65,537 and house less population)
4, 0-6an<j~'III"r~ '&loiP 23,812 23,812 20,459 20,459 Population In the age group 0-6 tM 12,187 12,187 10,372 10,372
ofF 11,625 11,625 10,087 10,087
5. ~~qft~ «!o/P 24,444 24,444 11,998 11,998 Scheduled Castes population ~ 12,422 12,422 6,241 6,241
olF 12,022 12,022 5,757 5,757
6. ~ GI'1VJIRi4'i qft ~ «!o/p 24,388 24,388 8,893 8,893 Scheduled Tribes population ~ 12,320 12,320 4,476 4,476
ofF 12,068 12,068 4,417 4,417
7. <'118R Clfo/P 84,806 84,806 83,941 83,941 Literates tM 51,246 51,246 49,153 49,153
olF 33,560 33,560 34,788 34,788
8,~~ CZfo/P 53,438 53,438 47,211 47,211 Total workers r:: 41,682 41,682 37,165 37,165
olF 11,756 11,756 10,046 10,046
9. cflQq>If<;tq> ~ O!To/P 40,044 40,044 32,499 32,499 Main workers ~ 35,039 35,039 29,046 29,046
olF 5,005 5,005 3,453' 3,453
(i)~ ClfO/P 16,996 16,996 13,776 13,776 Cultlvators ~ 16,466 16,466 13,200 13,200
olF 530 530 576 576
(ii)~~ O!To/P' 12,725 12,725 9,682 9,682 Agricultural labourers 'lofM 9,895 9,895 8,634 8,634
~F 2,830 2,830 1,048 1,048
(iii) qt~ql~q> ~ ~ C<fo/P 1,471 1,471 1,007 1,007 Household industry workers
~ 933 933 727 727 ofF 538 538 280 280
(iv) 3RT <if'ff O!Tn/P 8,852 8,852 8,034 8.034 Other workers r 7,745 7,745 6,485 6,485
olF 1,107 1,107 1,549 1,549
10. 3ji'4q>If<;tq> cn4T ClfolP 13,394 13,394 14,712 14,712 Marginal workers ~ 6,643 6,643 8,119 8,119
ofF 6,751 6,751 6,593 6,593
(i) ~ ClfotP 3,356 3,356 4,704 4,704 Cultivators 'lofM 2,158 2,158 2,471 2,471
~ofF 1,198 1,198 2,233 2,233
(ii) ~~ «IotP 8,214 B,214 7,289 7,289 Agricultural labourers
~ 3,664 3,664 4,638 4,638 oiF 4,550 4,550 2,651 2,651
(iii) 4IRqIRq> \ffi'trr ~ C<:/otP 363 363 660 660 Household industry workers
~ 108 108 153 153
olF 255 255 507 507
(iv) ~ <!>4T O!To/p 1,461 1,461 2,059 2,059 Other workers tM 713 713 857 857
o/F 748 748 1,202 1,202
1 1. 1'R <!>Iff «IotP 97,938 97,938 87,149 87,149 Non-workers 'aoiM 35,521 35,521 31,658 31,658
fBroiF 62,417 62,417 55,491 55,491
163
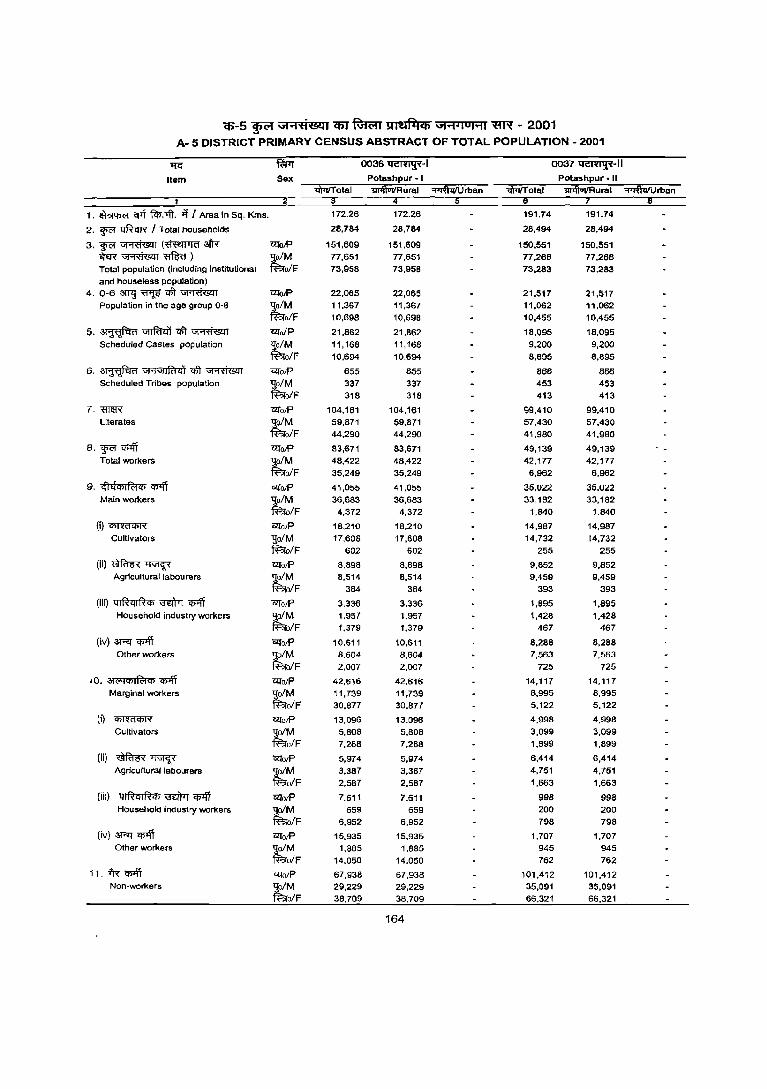
'CP-5 ~ GFi'ti&:n C6T ~ ~ "' ..... loHI ~ - 2001 A- 5 DISTRICT PRIMARY CENSUS ABSTRACT OF TOTAL POPULATION - 2001
1fG fWl 0036~-1 0037~-1I
Item Sex Potashpur • II
"IlPtiTotal "iIi4i1JiiRural "I"1fuVU rban 1 5
1. ~ 1fTi fci>.-4t. if I Area in Sq. Kms. 172.26 172.26 191.74 191.74
2. W<1 ~ I Total househOlds 28,784 28,784 28,494 28,494
3. W<1 ~ (~ .3I'R' ClIotP 151,609 151,609 150,551 150,551 i}m'~~) tM 77,651 77,651 77,268 77,268 Total population (including institutional olF. 73,958 73,958 73,283 73,283 and houseless population)
4. 0-6 3IT1..i ~ qfr ~ ClIO/P 22,065 22,065 21,517 21,517 Population in the age group 0-6 tM 11,367 11,367 11,062 11,062
olF 10.69S 10.698 10,455 10.455
5. ~ 'GfT1mif qfr ~ u:rolP 21,862 21.862 18,095 18.095 Scheduled Castes population tM 11.168 11,168 9,200 9,200
olF 10,694 10,694 8.895 8,895
6. ~ VI'iVJIR'!!l1 qfr ~ "To/P 655 655 866 866 Scheduled Tribes population tM 337 337 453 453
olF 318 318 413 413
7. 'ID1'iR ClIO/P 104.161 104,161 99,410 99,410 Literates ~ 59.871 59.871 57,430 57,430
olF 44.290 44,290 41.980 41,980
8. ~ Q>lj'\ ClIO/P 83,671 83.671 49,139 49,139 Total workers tM 48,422 48.422 42,171 42,177
olF 35,249 35,249 6,962 6,962
9. c;"lEfcpl~Cj) l'P'lT C4fotP 41,055 41,055 35.022 35.022 Main workers ,!!o/M 36,683 36,683 33.182 33,182
fBiofF 4,372 4,372 1,840 1,840
(i) 'Cj)ffifCj)ff C4fO/P 18,210 18,210 14,987 14,987 Cultivators 'So/M 17,608 17,608 14,732 14,732
fBiofF 602 602 255 255
(ii)~~ ClIo/P 8,898 8.898 9,852 9,852 A9ricultural labourers
~ 8,514 8.514 9,459 9,459
ofF 384 384 393 393
(iiO 41RcIIRcp \3ElTrr ~ ClIO/P 3,336 3.336 1.895 1,895 Household industry workers r 1,957 1,957 1,428 1,428
ofF 1,379 1.379 467 467
(iv) 3RT CJllff ClIO/P 10,611 10,611 8,288 8,288 Other workers
~ 8,604 8,604 7,563 7,563
olF 2,007 2,007 725 725
IO,"I<"lCPI~CP~ Ulo/P 42,616 42,616 14,117 14.117 Marginal workers
~ 11,739 11,739 8,995 8,995
olF 30,877 30,B77 5.122 5,122
(i) ~ UlotP 13,096 13,096 4,998 4,998
Cultivators r 5,808 5,B08 3,099 3,099 olF 7,288 7,288 1,899 1,899
(ii) ~~ ClIOIP 5,974 5,974 6,414 6,414 Agricultural labourers
~ 3.387 3,387 4,751 4,751
olF 2,587 2,587 1.663 1,663
(iii) QIRql~q; ~ q;>ff ClIOI? 7.611 7,611 998 998 Household industry workers
~ 659 659 200 200
olF 6,952 6,952 798 79B
(iv) 3RT CJllff '&IotP 15,935 15.935 1.707 1,707 Other workers
~ 1,885 1.885 945 945
olF 14.050 14.050 762 762
11. i'R '!f>'l1 Ulo/P 67.938 67.938 101,412 101,412 Non-workers
~ 29,229 29,229 35,091 35,091
olF 38.709 38.709 66.321 66,321
164
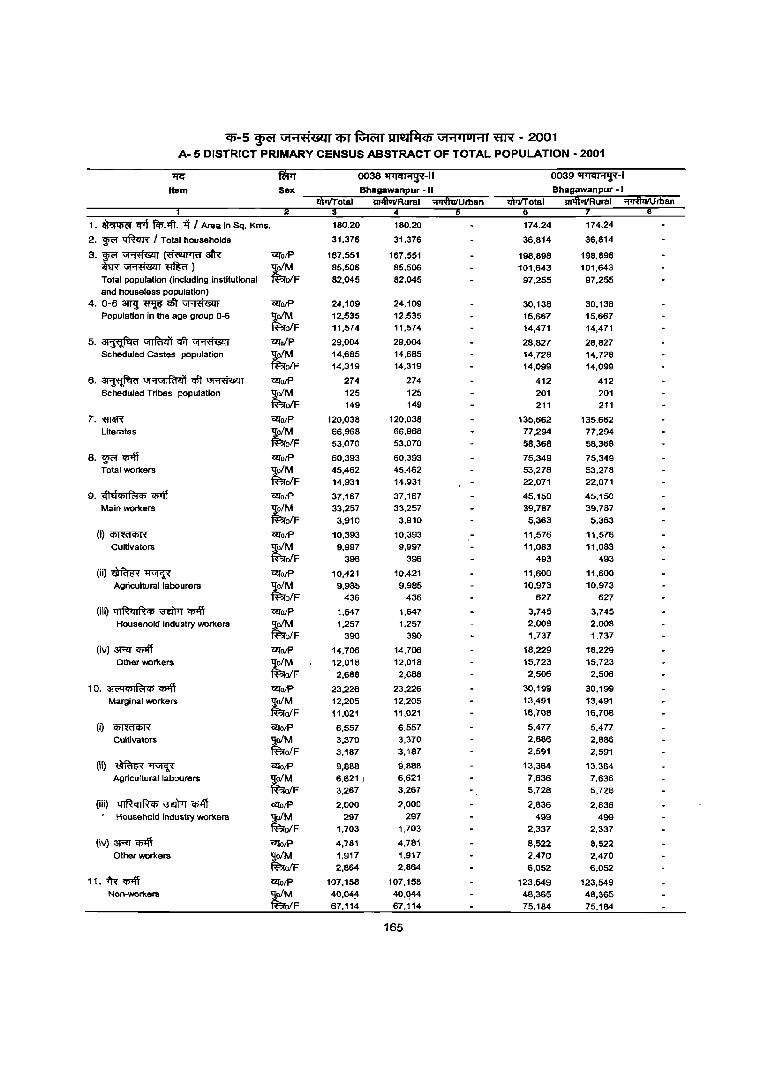
CJl-5 ~ Gi"'lfl<!41 cpr ~ UIl!4~4J Gi"'l'jUI"'I1 ~ - 2001 A- 5 DISTRICT PRIMARY CENSUS ABSTRACT OF TOTAL POPULATION - 2001
~ fWr 0038~-11 0039~-1
Item Sex Bhagawanpur-II Bhagawanpur -I ll\iTITotal 1iiiftViiRural :;r1Ifui/lJrban iI)liI'f otal WlfOifRural ~rban
1. ~ eM f.l;A't. it I Area In Sq. Kms. 180.20 180.20 174.24 174.24
2. W"R ~ I Total households 31,376 31.376 36,814 36,814
3. W"R ~ (~ afRo ClfotP 167,551 167,551 198,898 198,898 <hR~~) tM 85,506 85,506 101,643 101,643 Total population (including instituUonal ofF 82,045 82,045 97,255 97,255 and hOuseless population)
4. 0-6 3trg ~ qI't ~ ClfotP 24,109 24,109 30,138 30,138 Population In the age group 0-6 ~ 12,535 12,535 15,667 15,667
ofF 11,574 11,574 14,471 14,471
5.~~CJlT~ ClfolP 29,004 29,004 28,827 28,827 Scheduled Castes population ~ 14,685 14,685 14,728 14,728
ofF 14,319 14,319 14,099 14,099
6. ~ GI'1G1IRtll'l CJlT ~ ClfotP 274 274 412 412 Scheduled Tribes population
~ 125 125 201 201
ofF 149 149 211 211
7.~~ ClfO/P 120,038 120,038 135,662 135.662 Literates ~ 66,968 66,968 77,294 77,294
ofF 53,070 53,070 58.368 58,368
8. ~ <Iilff ClfO/P 60,393 60,393 75.349 75.349 Total workers tM 45,462 45,462 53,278 53,278
ofF 14,931 14,931 22,071 22,071
9. <!hfq;1 ~ qi <Iilff UlolP 37,167 37,167 45,150 45,150 Main workers ~M 33,257 33,257 39,787 39,787
ofF 3,910 3,910 5,363 5,363
(I)~ UlolP 10,393 10,393 11,576 11,576 Cultivators tM 9,997 9,997 11,083 11,083
ofF 396 396 493 493
(ii)~~ UlotP 10,421 10,421 11,600 11,600 Agricultural labourers ~M 9,985 9,985 10.973 10.973
olF 436 436 627 627
(iiQ ql~ql~q; m:frrT ~ UlO/P 1,647 1,647 3,745 3,745 Household industry workers tM 1,257 1,257 2,008 2,008
ofF 390 390 1,737 1.737
(iv) 3RT <nIff UlolP 14,706 14,706 18,229 18,229 Other workers tM 12,018 12,018 15,723 15.723
ofF 2,688 2,688 2,506 2,506
10. ~<"lq;I~Cj) 'I>'ff ~olP 23,226 23.226 30,199 30,199 Marginal workers tM 12,205 12,205 13.491 13,491
ofF 11.021 11,021 16,708 16,708
(i) Cj;ffif"q;ff UlolP 6,557 6,557 5.477 5,477 Cultivators tM 3,370 3,370 2.886 2,886
olF 3.187 3,187 2,591 2,591
(ii) ~~ UlolP 9,888 9,888 13,364 13,364 Agricultural labourers tM 6,621 I 6,621 7,636 7,636
ofF 3,267 3,267 5,728 5,728
(iii) Q I ~ q I ~ q; \ffl'rrr qnff ~otP 2,000 2,000 2,836 2,836 Household Industry workers tM 297 297 499 499
ofF 1,703 1,703 2,337 2,337
(iv) 3FT'1f>Iff UlolP 4,781 4,781 8,522 8,522 Other workers tM 1,917 1.917 2,470 2,470
ofF 2,864 2,664 6,052 6,052
11.'i'R'<i>'ff ~otP 107,158 107,158 123,549 123,549 Non-wor1<ers tM 40,O~ 40,q44 48,365 48,365
ofF 67,114 67,114 75,184 75.184
165

cp-5 ~ \11"1'<1&11 em R;rc;rr ~ Gi'1'jOj'1j ~ - 2001 A- 5 DISTRICT PRIMARY CENSUS ABSTRACT OF TOTAL POPULATION - 2001
lre fRq 0040 "'Rffiriii-Ill 0041~-1
Item Sax Nandlgram - III Sutahata -I tiP'rlTotal lu41uilAural ~rban $ilTotal ill4'1oilAural ~rban
1. ~"lf't f<Ir.>ft. if J Area in Sq. Kms. 137.58 137.58 79.54 79.54
2. w<" tIft<rR I Total households 29.247 29.247 19.69B 19.698
3. w<" ~ (~ 3l'R 12fotP 159.914 159.914 106.33B 106.338 ~~~) tM 82,191 82,191 54,543 54.543 Total population (including institutional alF 77.723 77.723 51,795 51,795 and houseless population)
4. 0-6~~qft~ 12fotP 24,131 24,131 16,462 16,462 Population in the age group 0-6 tM 12,521 12,521 8,367 8,367
alF 11,610 11,610 8,095 8,095
5.~~qft~ 12folP 16,119 16,119 32,647 32,647 Scheduled Castes population ~M 8,279 8,279 16,781 .16,781
ofF 7.840 7,840 15.866 15.866
6.~~qit~ C2fotP 309 309 28 28 Scheduled Tribes population
~F 141 141 14 14 16B 168 14 14
7.mm 12fo/P 107,732 107,732 71,869 71,869 Literates tM 61.238 61.238 40.703 40.703
alF 46,494 46,494 31,166 31,166
8. $'<'f Cfilff 12fotP 54.673 54.673 32.197 32,197 Total worKers ~M 43,195 43,195 27,025 27.025
alF 11,478 11,478 5,172 5,172
9. <!Id"'I~q; Cfilff 12fa/P 32,366 32,366 19,039 19,039 Main worKers tM 29,353 29.353 17.208 17,208
ofF 3,013 3,013 1,831 1,B31
(i)~ C<l"o/P 6,927 6,927 2,302 2,302 Cultivators r 6.462 6,462 2,028 2,028
ofF 465 465 274 274
(ii)~~ C<l"otP 7.841 7,841 3,680 3,6BO Agricullurallabourers tM 7,590 7,590 3.553 3,553
alF 251 251 127 127
(iii) ql~ql~q; ~ cpoff 12folP 2,131 2,131 509 509 Household industry workers r 1,305 1,305 416 416
alF 826 826 '- 93 93
(iv)~~ C2fDlP 15,467 15,467 12,548 12,548 Other worKers tM 13.996 13.996 11.211 11.211
ofF 1,471 1,471 1,337 1,337
10.:,j<"4"'If<:tiji~ 'QfoJP 22,307 22,307 13,158 13,158 Marginal 'NOrkers tM 13,~2 13,842 9,817 9,B17
ofF 8,465 8,465 3,341 3,341
(i) ~ 'QfotP 6.268 6.268 2.185 2,185 Cultivators tM 3,585 3,585 1,387 1.387
ofF 2,683 2,683 798 798
(ii) ~~ 12fotP 10,154 10,154 7,999 7,999 Agricultural labourers tM 7,625 7,625 6,517 6.517
ofF 2.529 2.529 1.482 1.482
(iii) ql~ql~'" ;a-drrr ~ "ilI1o/P 2,342 2.342 520 520 Household industry worKers
~ 405 405 155 155 ofF 1.937 1,937 365 365
(iv) '3RI <P4T 12folP 3,543 3,543 2,454 2.454 Other workers ;tM 2.227 2.227 1,758 1.758
ofF 1.316 1.316 696 696
11. i'r< <P4T C2loJP 105.241 105,241 74.141 74.141 Non-'NOrKers tM 38,996 38,996 27,518 27.518
ofF 66,245 66,245 46,623 46.623
166

(1)-5 ~ \iI"'1'C'i&l1 CfiT'RiIffi lwalllQj V1"'1.IUI"'11 ~ - 2001 A- 5 DISTRICT PRIMARY CENSUS ABSTRACT OF TOTAL POPULATION - 2001
~ far! 0042~-1I 0043~-1 Itam Sax Sutahata -II Nandlgram • I
1iI1'iiT otal 1iPfiVIiRurai ~rban 1iI1'iiTotai 'iiliftl'iIR ural ~rban
1. ~ trTt fcO.lft. if f Area In Sq. Kms. 65.44 65.44 181.84 181.84
2. ~ ~ I Total households 15.644 15.644 30.432 30.432
3.~~(~$ C1folP 81,619 81,619 174,691 174,691 ~~~) tM 41,886 41,886 89,053 89,053 Total population (Includln9 Institutional o/F 39,733 39,733 85,638 85,638 and houseless population)
4. 0-6~~qft~ C1fO/P 11,926 11,926 29.320 29,320 Populatlon In the age group 0-6 t~F 6,078 6,078 14,924 14,924
5,848 5,848 14,396 14,396
5.~~qft~ c:qolP 5,953 5,953 33,896 33,696 Scheduled Castes population tM 3,001 3.001 17,237 17,237
o/F 2,952 2,952 16,659 16,659
6. ~ \J1"\lIIR1<l~ ~ ~ c:qotP 210 210 197 197 Scheduled Tribes population tM 111 111 102 102
oJF 99 99 95 9~
7. mffi" c:qO/P 56,181 56,181 114,265 114,265 Literates tM 31,848 31,848 64,030 64,030
o/F 24,333 24,333 50,235 50,235
8. "¥f <V4t c:qotP 25,111 25,111 50,325 50,325 Total workers tM 22,051 22,051 43,084 43,084
o/F 3,060 3,060 7.241 7.241
9. ,th!q; I ~ q; q;1j'i C1fotP 15,046 15,046 30,286 30.286 Main wurken; tM 14,071 14,071 26,408 28,408
olF 975 975 1,878 1,878
(i) cmo<I>R c:qolP 3,101 3,101 6,437 6,437
Cultivators ~M 2,957 2,957 6.166 6.166 o/F 144 144 271 271
(ii)~~ c:qotP 4,268 4,268 9,204 9,204 Agricultural labourers ~M 4,064 4,064 8,777 8,777
oJF 204 204 427 427
(iii) ql~ql~q; ~ q;>ff "&IO/P 255 255 1,015 1,015 Household industry workers ~M 196 196 B91 891
Q/F 59 59 124 124
(iv) aR Cfi1ff "&IolP 7,422 7.422 13,630 13,630 Other workers ~M 6,854 6,854 12,574 12,574
oJF 568 568 1,056 1,056
10. aJ(iq"'I~q; <V4t OUotP 10,065 10,065 20,039 20,039
Marginal workers tM 7,980 7,980 14,676 14,676
olF 2,085 2,OB5 5,363 5,363
(i) ~ OUolP 2,233 2,233 4,161 4,161 Cultlvators tM 1.626 1.626 2,453 2,453
ofF 607 607 1,708 1,70B
(iQ ~~ c:qotP 5,749 5,749 10,587 10,587 Agricultural labourers tM 4,717 4,717 9,028 9,028
oJF 1,032 1,032 1,559 1.559
(iii) qIRql~q;~'i'fi1ff OUolP 309 309 892 892 Household Industry workers ~ 123 123 480 4BO
ofF 186 186 412 412
(iv) aR Cfi1ff OUO/P 1,774 1,774 4,399 4,399 Other workers tM 1,514 1,514 2,715 2,715
oJF 260 260 1,684 1,684
11. -tlnn>ff <2IotP 56,50B 56,508 124,366 124,366 Non-workers tM 19,835 19,835 45,969 45,969
ofF 36,673 36,673 78,397 78,397
167
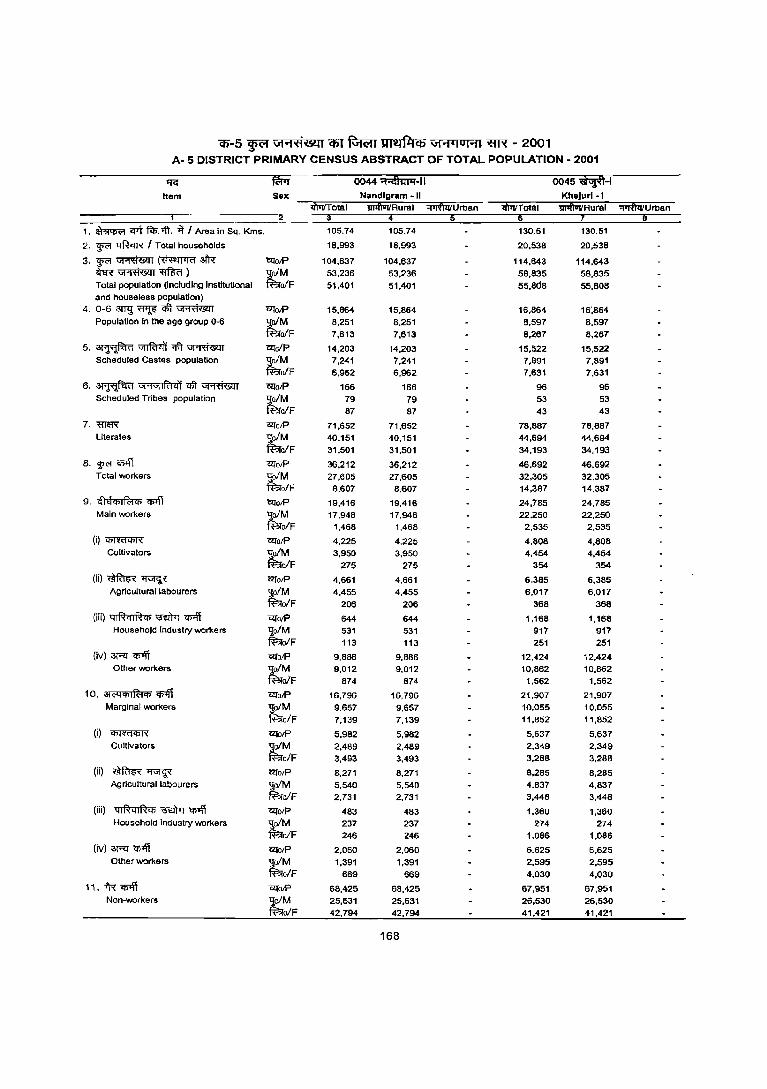
Cf)-S we" Vi'1'<1&:i1 Cf)J iGwrr J;U~~Cb Vi'1'IOHI ~ - 2001 A- 5 DISTRICT PRIMARY CENSUS ABSTRACT OF TOTAL POPULATION - 2001
l1<: ~ 0044~-11 0045~-1 Item Sex Khejurl -I
'!ilif\VIiRural "'IIIfuUUrban
1. ~ "iflt f$.lfi. it I Area in Sq. Kms. 105.74 105.74 130.51 130.51
2. "Wi" l:lftcrR I Total households lB.993 18.993 20,538 20.53B
3. "Wi" ~ (~ 3l'R' czrolP 104,637 104.637 114.643 114.643 "hR~~) tM 53.236 53.236 58.835 58.835 Total population (including institutional ofF 51,401 51.401 55.M8 55.BOB and houseless population)
4. 0-6 3tl<l ~ <1ft' ~ czrolP 15.864 15.864 16.864 16'.864 Population In the age group 0-6 tM 8.251 8.251 8.597 8.597
ofF 7,613 7,613 8,267 8,267
5.~~qft~ 12l'oIP 14,203 14.203 15.522 15.522 Scheduled Castes population tM 7.241 7.241 7.B91 7.891
olF 6.962 6.962 7.631 7.631
6. ~ G('1GiIRilj'i <1ft' ~ 12l'olP 166 166 96 96 Scheduled Tribes population tM 79 79 53 53
ofF 87 87 43 43
7. 'ffi&R G!l"olP 71.652 71.652 78.887 78.887 Literates tM 40,151 40.151 44.694 44.694
ofF 31.501 31.501 34.193 34.193
8. "Wi" CI5lfi CZ<OIP 36.212 36.212 46.692 46.692 Total workers tM 27.605 27.605 32.305 32.305
olF 8.607 8.607 14.387 14,387
9. "'hh,, I fc;t <Ii CJ>Ifi czrolP 19,416 19,416 24,785 24,785 Main workers tM 17.948 17.948 22,250 22.250
ofF 1,468 1,468 2,535 2,535
(i) CI>ffiI<IlR CZ<OIP 4,225 4.225 4,808 4,808 Cultivators tM 3,950 3,950 4,454 4.454
ofF 275 275 354 354
(ii)~~ czrolP 4,661 4,661 6,385 6,385 Agriculturallatlourers tM 4.455 4.455 6,017 6,017
olF 206 206 368 368
(iii) ql~qlfh, ~ '<I>"ff czrolP 644 644 1,168 1,168 HousehoJd industry workers 'lo/M 531 531 917 917
fBiolF 113 113 251 251
(iv) 3Rr Cfi1ff Wo/p 9,886 9.886 12,424 12.424 Other workers tM 9,012 9,012 10,862 10,862
oIF 874 874 1,562 1.562
10, 31<"l<lilfB<Ii '<I>"ff WalP 16,796 16,796 21.907 21.907 Marginal workers tM 9.657 9.657 10,055 10,055
ofF 7,139 7.139 11.852 11.852
(il ~ utotP 5,982 5.982 5.637 5.637 Cultivators tM 2.489 2,489 2.349 2.349
o/F 3.493 3,493 3,288 3.288
(ii) ~~ utalP 8.271 8,271 8.285 8.285 Agricultural labourers 'JoIM 5.540 5.540 4.837 4.837
fBio/F 2,731 2,731 3,448 3.448
(iii) qlrhlR<Ii~<!>'Iff ~OIP 483 483 1.360 1.360 Household Industry workers 'lolM 237 237 274 274
fBio/F 246 246 1.086 1.086
(ivj 3R1 q;>ff utolP 2.060 2.060 6.625 6.625 Other workers tM 1,391 1,391 2.595 2.595
o/F 669 669 4.030 4,030
11.~~ utolP 68,425 68,425 67.951 67.951 Non-workers tM 25.631 25.631 26.530 26,530
ofF 42.794 42.794 41.421 41,421
168
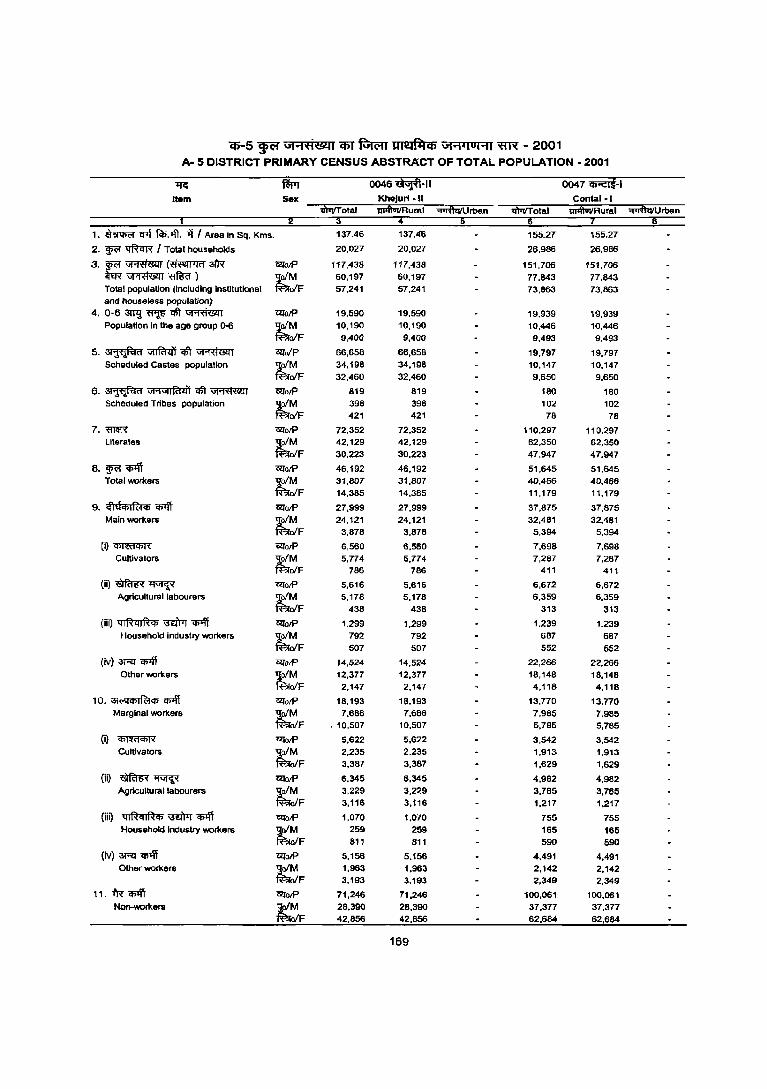
'CP-5 WCJ \i1"'1tt6ll1 C6T fGwu Ull!l~Cfj \i1"'1.loHI ~ - 2001 A- 5 DISTRICT PRIMARY CENSUS ABSTRACT OF TOTAL POPULATION· 2001
"IG lWT 0046~.1l 0047 "ifRii·1 Item Sex KheJurl ·11 Contal·1
1iIrtfT otal u,41oIlRural ~rban 1iIrtfTotai ,u41Oj/Rural ~rban
1. ~ ~ f<l>.4t. -it f Area In Sq. Kms. 137.46 137.46 155.27 155.27
2. ~ ~ I Total households 20,027 20,027 26.986 26.986
3.W<1"~(~~ "QIolf' 117,438 117.438 151,706 151.706 W~~) tM 60,197 60,197 77,843 77,843 Total populaUon (including InsUtuUonal o/F 57,241 57,241 73,863 73.863 and hooseless population)
4.0-6~~qft~ "QIolP 19.590 19.590 19.939 19.939 Population In the age group o-e tM 10,190 10,190 10,446 10,446
o/F 9,400 9,400 9,493 9,493
5.~~~~ "QIo/P 66,658 66,658 19,797 19,797 Scheduled Castes population ;tM 34,198 34,198 10,147 10,147
o/F 32,460 32.460 9,650 9.650
6. ~ GI'1G1lfa<l~ qft ~ "QIolP 819 819 180 180 Scheduled Tribes population tM 398 398 102 102
o/F 421 421 78 78
7.mm "QIolP 72.352 72,352 110,297 110.297 Literates ~M 42,129 42,129 62,350 62,350
o/F 30,223 30,223 47.947 47,947
8.~~ "QIolP 46.192 46,192 51,645 51.645 Total wor1<ers tM 31,807 31,807 40,466 40,466
o/F 14,385 14,385 11,179 11,179
9. ,1h!CfiIf<:tCfi~ C2l'alP 27,999 27,999 37,875 37.675 Main workers tM 24,121 24,121 32,481 32.481
ofF 3.878 3.878 5,394 5.394
(i)~ C2l'O!p 6,560 6.560 7,698 7,698 Cultivators tM 5,774 5,774 7,287 7,287
ofF 786 766 411 411
(ii)~~ C2l'O!p 5,616 5,616 6,672 6,672 Agricullural labourers tM 5.178 5,178 6.359 6,359
ofF 438 438 313 313
(iii) ql~ql~q> ~ ~ "QIolP 1.299 1.299 1.239 1.239 Household industry workers tM 792 792 687 687
ofF 507 507 552 552
(Iv) ~ q;>ff (;Il'o/p 14,524 14,524 22,266 22,266 Other workers tM 12,377 12,377 18.148 18,148
ofF 2,147 2.147 4,118 4,118
1 O. at <'4CfiIf'clq> Cjj1ff (;Il'O!p 18.193 18.193 13.770 13,770 Marginal WQrkers ~F 7,686 7.666 7,985 7,985
. 10.507 10.507 5,785 5,785
(Q 'Cfiffi!CnR' C2l'olP 5,622 5,622 3,542 3,542 Culilvators
t~F 2,235 2.235 1.913 1.913 3,387 3,387 1,629 1,629
(ii) ~~ t2lolP 6,345 6,345 4,982 4,982 Aijrlcutturallabourers
~F 3,229 3,229 3,765 3,765 3,116 3,116 1,217 1,217
(iii) ql(hl~q> ;;roPr ~ t2lolP 1,070 1,070 755 755 Household Industry workers ;tM 259 259 165 165
ofF 811 811 590 590
(Iv) 3RJ CIl4T 12l'oIP 5,156 5.156 4.491 4,491 Other worXers tM 1,963 1,963 2,142 2,142
ofF 3,193 3.193 2,349 2,349
11. fR ~ 12l'oIP 71,246 71,246 100,061 100,061 Non-workelll t~F 28.390 28.390 37,377 37.377
42,856 42,856 62,684 62,684
169

Cfj"-5 WR ut"'lti&ll em f.m;rr UII!Ji4Cb "H'lul"'Il ~ - 2001 A.5 DISTRICT PRIMARY CENSUS ABSTRACT OF TOTAL POPULATION - 2001
11<:' fWr 0048~·1I 0049~·1I1 Item Sex Contal·lI Contal-IIJ
~otal u,41uilAural ';JtTfuVu rban .:iPiITotal u,41uilRural '1·,:I'I<ilUrtlan
1. ~ 1M f<n.4T. ~ I Area in Sq. Kms. 170.30 170.30 160.52 160.52
2. "W<" ~ I Total households 26,770 26,770 25,116 25,116
3. "W<" ~ (~ 31'ff ~otP 153,065 153,065 137,349 137,349 W~~) ~M 78,868 7B,868 70,466 70,466 Total population (including Institutional ofF 74,197 74,197 66.883 66,883 and houseless population)
4.0-6~~ctI~ ~otP 21,332 21,332 18,462 18,462 Popu lation in the age group 0-6 ~M 11,004 11,004 9,475 9,475
olF 10,328 10,328 8,987 8,987
5.~~ctI~ ~oIP 15,241 15,241 17,126 17,126 Scheduled Castes population ~M 7,740 7,740 8,778 8,778
olF 7,501 7,501 8,348 8.348
6. ~ vl'lGJIRili'i qft ~ ~otP 71 71 114 114 Scheduled Tribes population ~M 34 34 59 59
ofF 37 37 55 55
7. miff'( C2JO/P 105,402 105,402 100,163 100,163 Literates tM 60,312 60,312 56,433 56,433
o/F 45.090 45.090 43.730 43.730
8."W<" ~ C2JO/P 54,969 54,969 55,482 55,482 Total workers tM 42,040 42,040 39,093 39,093
olF 12,929 12,929 16,389 16,389
9. ~e!""IR:t.." ~ C2Jo/P 34,759 34,759 33,788 33,788 Main workers ~M 31,261 31,261 29,152 29,152
olF 3.498 3,498 4,636 4,636
(i) CI> 1 '«f<IfR C2JOIP 8,684 8,684 8,119 8,119 Cultivators tM 8,050 6,050 7,516 7,516
olF 634 634 603 603
(ij)~~ ~OIP 7,603 7,603 7,080 7,080 Agricultural labourers tM 7,112 7,112 6,851 6,851
ofF 491 491 229 229
(iii) qlRqlR.." ~ Cf>'ff C1lotP 2.006 2.006 2,999 2,999 Household industry workers tM 1,281 1,281 1,432 1,432
ofF 725 725 1,567 1,567
(iv) 3f"<f ~ C1l0/P 16,466 16,466 15,590 15,590 Other workers tM 14,818 14,818 13,353 13,353
o/F 1,648 1,648 2,237 2,237
10. 31C'<lCfiIR:t.." ~ C2l"o/P 20,210 20,210 21,694 21,694 Marginal workers tM 10,779 10,779 9,941 9,941
ofF 9,431 9,431 11,753 11,753
(i) ~ ~O/P 5,430 5,430 7,520 7,520 Cultivators tM 2.583 2,583 3,167 3,167
ofF 2,847 2,847 4,353 4,353 (ii) ~~ ~otP 9,331 9,331 6,753 6,753
'A9ricultural labourers tM 5,669 5,669 4,108 4,108 ofF 3,662 3,662 2,645 2,645
(iii) 41 R ell R <Ii \TI'.lTrr q;lff 1'2lo/P 1,576 1,576 2,572 2,572 Household industry workers
t~F 357 357 324 324 1,219 1,219 2,248 2,248
(iv) 3f"<f ~ ~O/P 3,873 3,873 4,849 4,849 Other workers tM 2,170 2,170 2,342 2,342
ofF 1,703 1,703 2,507 2,507
11. +R~ C2l"OIP 98.096 98,096 81,867 81,867 Non-workers tM 36,828 36,828 31,373 31,373
olF 61,268 61,268 50,494 50,494
170

q;-5 ~ \J1'1«osql q;J f.ffi;rr Ultli'llC6 \J1'1.tOHI ~ - 2001 A- 5 DISTRICT PRIMARY CENSUS ABSTRACT OF TOTAL POPULATION - 2001
"If<: ~ 0050~-1 0051 ~-II
Item Sex Egra -I Egra -II
1¥Tfi'otal 1iIiI\ViI'Rural :::rtI'ftiiIUrban 1I)1iITotai i11ftOiIRural ;;;at;IIIJ rban
1. ~ qr\ fiP."4t. it I Area In Sq. Kms. 197.90 197.90 164.71 164.71
2. ~ ~ I Total househOlds 26,274 26,274 28,447 28,447
3,~~(~3fR cz<oIP 145,054 145,054 156,431 156,431 <hR~~) tM 74,036 74,036 80,120 80,120
Total population (Including institutional ofF 71,018 71,018 76,311 76,311 and houseless population)
4, 0-6 arr<j ~ mt ~ CZ<OIP 21,203 21,203 21,625 21,625 Population in the age group 0-6 tM 10,640 10,640 11,089 11,089
ofF 10,363 10,363 10,536 10,536
5,~~mt~ Clfo/P 13,798 13,798 32,115 32,115 Scheduled Castes population tM 7,066 7,066 16,440 16,440
o/F 6,732 6,732 15,675 15,675
6. ~ \JI·j\jIIRl~'i <el ~ ClIoR 2,038 2,038 500 500 Scheduled Tribes population tM 1,035 1,035 265 265
ofF 1,003 1,003 235 235
7. -mW ClIoiP 94,000 94,000 107,672 107,672
Literates tM 54,748 54,748 62,301 62,301
ofF 39,252 39,252 45,371 45,371
8. ~ q;-off 1ZIoiP 46,427 46,427 54,921 54,921 Total workers ~M 39,731 39,731 42,373 42,373
ofF 6,696 6,696 12,548 12,548
9, G~jdCf)IR:iCj) q;-off ClfOIP 34,498 34,498 34,304 34,304 Main workers tM 32,491 32,491 31,192 31,192
elF 2,007 2,007 3,112 3,112
(i)~ ClfO/P 16,935 16,935 11,243 11,243 Cultivators ;tM 16,437 16,437 10,702 10,702
o/F 498 498 541 541
(ii)~~ moiP 9.025 9,025 7,893 7,893
Agricultural labourers ~ 8,492 8,492 7,345 7,345
o/F 533 533 548 548
(iii) qlRqlRCf) '3El)rr ~ '&Io/P 1,319 1,319 2,016 2,016 Household industry workers ;tM 898 898 1,289 1,289
elF 421 421 727 727
(iv) 3l""<l' Cf>Iff mO/P 7.219 7,219 13,152 13,152 Other workers tM 6,664 6,664 11,856 11,856
elF 555 555 1,296 1,296
10, 31('t1Cf)IR:iCf) 'Cj)'1ft '&IoiP 11,929 11,929 20,617 20,617
Marginal \NOrkers ~o/M 7,240 7,240 11,181 11.181
~o/F 4,689 4,689 9,436 9,436
(i) ~ mO/P 3,062 3,062 5,242 5,242 Cultivators tM 1,612 1,812 2,706 2,706
elF 1,250 1,250 2,536 2,536
(ii) ~~ '&Io,P 5,723 5,723 8,596 8,596 Agricultural labourers ;tM 4,132 4,132 5,595 5,595
ofF 1,591 1,591 3,001 3,001
(iii) q IRq IR i'fl '3El)rr q;;ff "&IOtP 1,335 1,335 2,365 2,365 Household industry workers ;tM 242 242 445 445
olF 1,093 1,093 1,920 1,920
(iv) 3l""<l' Cf>Iff "&lOt? 1,809 1,809 4,414 4,414 Other workers ;tM 1,054 1,054 2,435 2,435
ofF 755 755 1,979 1,979
11, i'R Cfilff ClfotP 96,627 98,627 101,510 101,510 Non-workers tM 34,305 34,305 37,747 37,747
ofF 64,322 64,322 63,763 63,763
171

(5-5 WC' G'i .... 'tR .. «I1 q;y ~ 1iTtIflICb G'i'1 •• 0 ...... ~ - 2001 A- 5 DISTRICT PRIMARY CENSUS ABSTRACT OF TOTAL POPULATION. 2001
'IJG Item
1. ~ 'Ef"f f.'l;."4'I. Tf I Area in Sq. Kms.
2. ~ ~ I Total households
3.~~(~3fR ~~~) Total population (including institutional and houseless population)
4. 0-6 ~ "W!5 q\T ~ Population in the age group 0-6
5.~~qI't~ Scheduled Castes population
6. ~ Gj'NIIRlll'i qI't ~ Scheduled Tribes population
7. iffilff'!' Literates
8.~m Total workers
9. c!h.lCfilf<:lCfi i'P'\'t Main workers
(;}~
Cultivators
(ii)~~ Agricultural labourerJ
(iii) QIRqIRq> ~ Ci>Iff Household industry workers
(iv) 3f"IT Ci>Iff Other wol'1lers
10. 31~4iIR>14i ~ Marginal workers
(i)~
Cultivators
(ii)~~ Agricultural labourers
(iii) qlRqlRCfi \3El)lr Ci>Iff Household industry workers
(iv) '3P<! ~ Other workers
11.~cn41 Non-workers
Sex
CZlOIP
~0/M ~oIF
CZlo/P
~oIM ~oIF
CZloIP
~oIM ~o/F
CZlolP '9;o/M ~oIF CZlolP
~oIM ~oIF
CZlo/P
~o/M ~oIF
CZlo/P
~oIM ~oIF
CZlolP ~o/M ~oIF
CZlO/P
~oIM ~oIF CZlo/P ,!!o/M' ~oIF
CZlO/P
'jo/M ~o/F
CZlO/P
,!!o/M ~oIF CZlolP
'lo/M ~oIF
CZlolP ljo/M ~oIF CZlolP '9;o/M ~oIF CZlO/P ljolM fBioiF
CZlO/P
'jo/M ~oIF
137.49
17.520
96.323 49,147 47,116
14,10B
7,264 6,844
9,902 5,094 4,B08
4,807 2,451 2,356
61,715
35,969 25,806
29,615 25,774
3,841
22,305 20,874
1,431
11,558 11,233
325
5,698 5,098
600
590
496 94
4,459 4,047
412
7,310 4,900 2,410
2,632 1,594 1,038
3,479 2,627
852
370 104 266
829 575 254
66,108 23,373 43,335
0052~ Mohanpur
137.49
11,520
96,323 49,147 47,176
14,108 7,264 6,844
9,902 5,094 4,808
4,807 2,451 2,356
61,775 35,969 25,806
29,615 25,774
3,841
22.305 20,874
1.431
11,558 11,233
325
5,698 5,098
600
590 496
94
4,459 4.047
412
7,310 4.900 2,410
2.632 1.594 1,038
3.479 2,627
852
370 104 266
829 575 254
66.708 23.373 43.335
172
0053~-1
Ramnagar-I "ihTi/Total lififI1JiiRural::rrIfui/U rban
139.43
25.933
145,413 74.082 71.331
19,706 10,120
9,586
18,701 9.575 9.126
851 428 423
102.419 58,731 43,688
45,644 39,305
6.339
33,165 31,115
2,050
8.244 7,897
347
7,670 7,198
472
1,305 1.002
303
15,946 15,018
928
12,479 8,190 4,289
3,189 1.770 1.419
6.276 4,483 1,793
419 142 277
2,595 1,795
800
99.769 34.777 64,992
139.43
25,933
145,413 74,082 71,331
19,706 10.120
9,586
18,701 9,575 9,126
851 428 423
102,419 58.731 43,688
45,644 39,305
6,339
33,165 31,115
2.050
8,244 7,897
347
7,670 7,198
472
1,305 1.002
303
15,946 15,018
928
12,479 8,190 4.289
3.189 1.770 1,419
6,276 4,483 1,793
419 142 277
2,595 1.795
800
99,769 34,777 64.992

<0-5 ~ \if"1fl&:l1 ifiT ~ tlll4fi:1<b \if"1'IOI"11 ~ - 2001 A- 5 DISTRICT PRIMARY CENSUS ABSTRACT OF TOTAL POPULATION - 2001
"Ife' ~ 0054~-1I
Item Sex Ramnagar-II 1h1TiTotal 1lllftVifRural "'I'i'RlliIU man
1
1. ~ cr>f Fcl>.;ft. -q I Area in Sq. Kms. 163.27 163.27
2. ~ tlftcIR I Total households 24,594 24,594
3,¥~(~al'R ClI'oJP 137,369 137,369 <hR~~) tM 70,102 70,102 Total population (InCluding institutional ofF 67,267 67,267 and houseless population)
4, 0-6 3Wj ~ qft ~ ClI'o/P 17,434 17,434 Population in the age group Q-6 tM 9,021 9,021
ofF 8,413 8.413
5,~~qft~ ClI'oIp 17,511 17,511 Scheduled Castes population tM 8,980 8,980
olF 8,531 8,531
6. ~ Gt'1G11R't111 qft ~ ClI'o/P 379 379 Scheduled Tribes population ~M 194 194
ofF 185 185
7, 'fIT~ ClI'o/P 99,902 99,902 Literates tM 56,740 56,740
ofF 43,162 43,162
8, ¥ q;1ff ClI'o/P 46,510 46,510 Total workers ;tM 37,381 37,381
ofF 9,129 9,129
9. cthlcr>1 R;r cr> q;1ff ClI'o/P 30,810 30,810 Main workers ~M 28,974 28,974
ofF 1,836 1,836
(i)~ ClI'o/P 9,B90 9,890 Cultivators tM 9,404 9,404
ofF 486 4B6
(ii)~~ 1ZfOIP B,031 8,031 Agricultural labourers tM 7,687 7,687
ofF 344 344
(iii) ql~ql~cr> mWr CJ>Iff 1ZfOIP 386 386 Household industry workers tM 301 301
olF 85 85
(iv) 3f"<[ q;1ff C4iO/P 12,503 12,503 Other workers tM 11,582 11,582
ofF 921 921
10. 31(>QCI>IRicr> q;1ff CZl'o/P 15,700 15,700 Marginal workers tM 8,407 8,407
ofF 7,293 7,293
(i) ~ 1ZforP 4,528 4,528 Cultivators tM 1,942 1,942
ofF 2,586 2,586
(ii) ~~ C2tO/P 8,288 8,288 Agricultural labourers tM 5,114 5,114
olF 3,174 3,174
(iii) ql~ql~cr> ~ q;1ff C4iQ/P 274 274 Household Industry workers tM 89 89
ofF 185 185
(iv) 3f"<[ q)lff C4iorP 2,610 2,610 Other workers ~M 1,262 1,262
ofF 1,348 1,348
11. i'R q)lff C4iotP 90,859 90,859 Non-workers
~ 32,721 32,721
ofF' 58,138 58,138
173
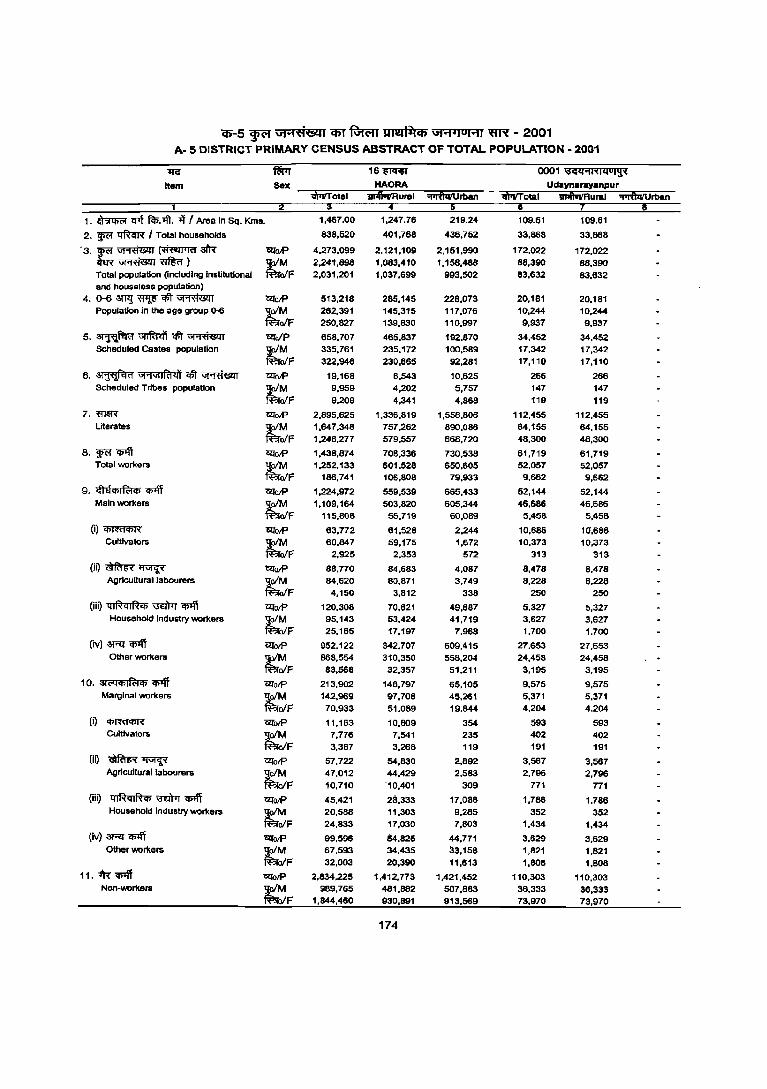
(fi'-5 ~ GHfl(§Q1 CfiT ~ suedilCb Gt ..... IUHI WR - 2001 A. 5 DISTRICT PRIMARY CENSUS ABSTRACT OF TOTAL POPULATION· 2001
lJC:' ~ 16~ 0001 13c;<iOfI'C14UI\l'(
Item Sex HAORA Udaynarayanpur 1IPV'Totai 1II'fivlIRurai ~rban ~otal DloIl ... Rural ~rban
1. ~ lflT ~:Ift. >l f Nea In Sq. Klns. 1.467.00 1,247.76 219.24 109.61 109.61
2. ~ ~ I Total households 838,520 401,768 436,752 33.868 33.868
'3'r;==3frv ~OIP 4.273.099 2.121.109 2.151.990 172.022 172.022
tM 2,241.898 1.083,410 1,158,488 88,390 88,390 Total populatlon (Including instltutlonal ofF 2,031,201 1,037,699 993,502 83,632 83,632 and houseless populatlon)
4. 0-6 3lTll ~ q!T ~ ~OIP 513,218 285,145 228,073 20,181 20,181 Population in Ihe age group <Hl tM 262,391 145,315 117,076 10,244 10,244
ofF 250,827 139,830 110,997 9,937 9,937
5.~~q!T~ ~oIP 658,707 465,837 192,870 34,452 34,452 Scheduled Castes population tM 335,761 235.172 100,589 17,342 17,342
ofF 322,946 230,665 92,281 17,110 17,110
6. ~ \iI'1G1IRt<if q!T ~ ~otP 19,168 8,543 10.625 266 266 Scheduled Tribes population t.,M 9,959 4,202 5,757 147 147
ofF 9,209 4,341 4,868 119 119
7. mWf ~olP 2,895,625 1,336,819 1,558,806 112,455 112,455 Literates tM 1,647,348 757,262 890.086 64,155 64.155
ofF 1,248,277 579,557 668,720 48,300 48,300
8. W<'f'll>'ff "!2l'0IP 1,438.874 70B.336 730.538 61.719 61,719 Total workers tM 1,252,133 601,528 650.605 52.057 52.057
ofF 186.741 106,808 79,933 9.662 9,662 9. <fiaChIfc;j", <i>'fi C2JotP 1,224.972 559,539 665,433 52.144 52.144
Main workers tM 1,109,164 503.820 605.344 46.686 46.686 ofF 115,808 55,719 60,089 5,458 5,458
(i) '<fiml'<I7R' ~otP 63,772 61,528 2,244 10.686 10'.686 Cultivators t.,M 60,847 59,175 1.672 10,373 10,373
ofF 2,925 2,353 572 313 313
(i0~~ ~oIP 88,770 84,683 4,087 8.478 8,478 Agricultural labourers tM 84.620 80.B71 3.749 8,22B 8.228
ofF 4,150 3,812 338 250 250 (iii) qlfhl~<t> ~ q;;ff ~otP 120,308 70,621 49,687 5,327 5,327
Household Industry workers ~M 95,143 53,424 41.719 3,627 3,627 OfF 25.165 17.197 7,968 1,700 1.700
(iv)~~ "!2l'otP 952.122 342,707 609.415 27.653 27.653 Olher workers ~M 868,554 310,350 558,204 24,458 24,458
ofF 83,568 32,357 51.211 3,195 3.195
10. ~<"l<t>I~<t>~ "!2l'otP 213,902 146,797 65.105 9.575 9,575 Marginal workers tM 142,969 97,708 45,261 5,371 5,371
ofF 70.933 51.089 19.844 4.204 4.204
(0 '<t>mfCI>R C2l'oIP 11.163 10.809 354 593 593 Cultlvatol'&
~F 7,776 7,541 235 402 402 3,387 3,268 119 191 191
OQ ~~ C2l'otP 57,722 54,830 2,892 3,567 3,587 Agricultural labourers
r;zF 47.012 44.429 2.583 2.796 2.796 10,710 10,401 309 771 771
(iiQ ql~QI~<t> ~ CI>'\Y C2l'oIP 45,421 28,333 17,088 1,786 1.786 Household Industry workers
~ 20,588 11,303 9,285 352 352
ofF 24,833 17,030 7,803 1,434 1,434 (iv) ~ CIlIlT ~olP 99,596 64,825 44,771 3,629 3,629
Olher workers ~M 67.593 34.435 33,158 1,821 1,821 ofF 32,003 20,390 11,613 1,808 1,808
11.1R''<t>1ff C2l'otP 2,834,225 1,412,773 1,421,452 110,303 110.303 Non-workel'll tM 989.765 481,882 507,883 36,333 36,333
ofF 1,844,460 930,891 913,569 73,970 73,970
174

C5-5 ~ ut"'l'ti&H C6T ~ UIl!li4Ch \11'1<101'11 ';ffR - 2001 A- 5 DISTRICT PRIMARY CENSUS ABSTRACT OF TOTAL POPULATION - 2001
11<: fWr 0002 3Tl'1ffiT-1i 0003 au+rnr-I Item Sax Ambo-II Amta -I
1I.IllUIIRul'IIl ~rban
1. ~ lJ>t ~:ofr. "it I Area In Sq. Kms. 137.45 137.45 118.54 118.54
2. W"I ~ I Total households 34,991 34,991 37,736 37.736
3.f:.~(~~ C2:[otP 189,259 189,259 200,164 200,164 ~~) ~ 97,511 97,511 102,167 102,167
Total population (Including In&titutlonal 'ofF 91,748 91,748 97,997 97,997 and hou&eJess population)
4.0-6~~<t\~ C2:[otP 24,703 24,703 25,491 25,491 Population In the age group 0-6 tM 12,521 12,521 13,102 13,102
biF 12,182 12,182 12,389 12,389
5.~~~~ C2:[0/p 41,934 41,934 59,515 59,515 Scheduled Castes population tM 21,387 21,387 30,037 30,037
'ofF 20,547 20,547 29,478 29,478
6. ~ ""1'iuRt41 ~ ~ C2:[oiP 230 230 484 484 Scheduled Tribes population tM 111 111 250 250
olF 119 119 234 234
7.'ffi1ffi" C2:[otP 121,901 121,901 129,903 129,903 Literates ~F 70,358 70,358 73,766 73,766
51,543 51,543 56,137 56,137
8. ~ <Plff C2t0lP 61,303 61,303 72,162 72,162 Total workers ~M 54,198 54,198 59,008 59,008
ofF 7,105 7.105 13,154 13,154
9. <f}ti<t>Ii'a<t> <Plff C2:[oiP 49,923 49,923 60,512 60,512 Main workars tM 46,299 46.299 53,756 53,756
ofF 3,624 3,624 6,756 6,756
W~ ClfoIP 8,294 8.294 6.955 6,955 Cultivators ~M 8,123 B.123 6,737 6,737
ofF 171 171 218 218
(ii)~~ C2JoIp 10,180 10.180 9,097 9,097 Agricultural labourers tM 9,568 9,568 8,598 8,598
'ofF 612 612 499 499
(iiQ ql~ql~<r> ~ "<t>1ff UloIP 2,937 2.937 3,920 3.920 Household industry workers t~F 2,082 2.082 2,472 2.472
855 855 1.448 1,448
(iv) 3Rl'ri C2t0lP 28.512 28.512 40,540 40,540 Other workers t~F 26.526 26.526 35.949 35.949
1,986 1.986 4,591 4,591
10, at<"l<t>Ii'a<t> ~ C2:[0IP 11.380 11.380 11,650 11,650 Marginal workers tM 7.899 7.899 5.252 5.252
ofF 3,481 3,481 6,396 6,398
0) ~ C2totP 829 829 820 820 Cultivators ~M 1547 547 443 443
biF 282 282 377 377
(ii) ~~ C2:[otP 5,246 5,246 2,870 2,870 Agricultural labourers tM 4,360 4,360 1,717 1,717
biF 886 886 1,153 1,153
(iii) ql~ql~<t> ~ <Plff ~otP 1,656 1,656 2,040 2,040 Household Industry workers tM 472 472 555 555
'ofF 1,184 1,184 1,485 1,485
(iv) 3Rl' ~ ~OIP 3,649 3,649 5,920 5,920 Other workers tM 2,520 2.520 2,537 2,537
ofF 1,129 1,129 3,383 3,383
11.1R~ ~otP 127,956 127,956 126,002 128,002 Non-workers ;t~F 43.313 43,313 43,159 43,159
84,643 84,643 84,843 84,843
175
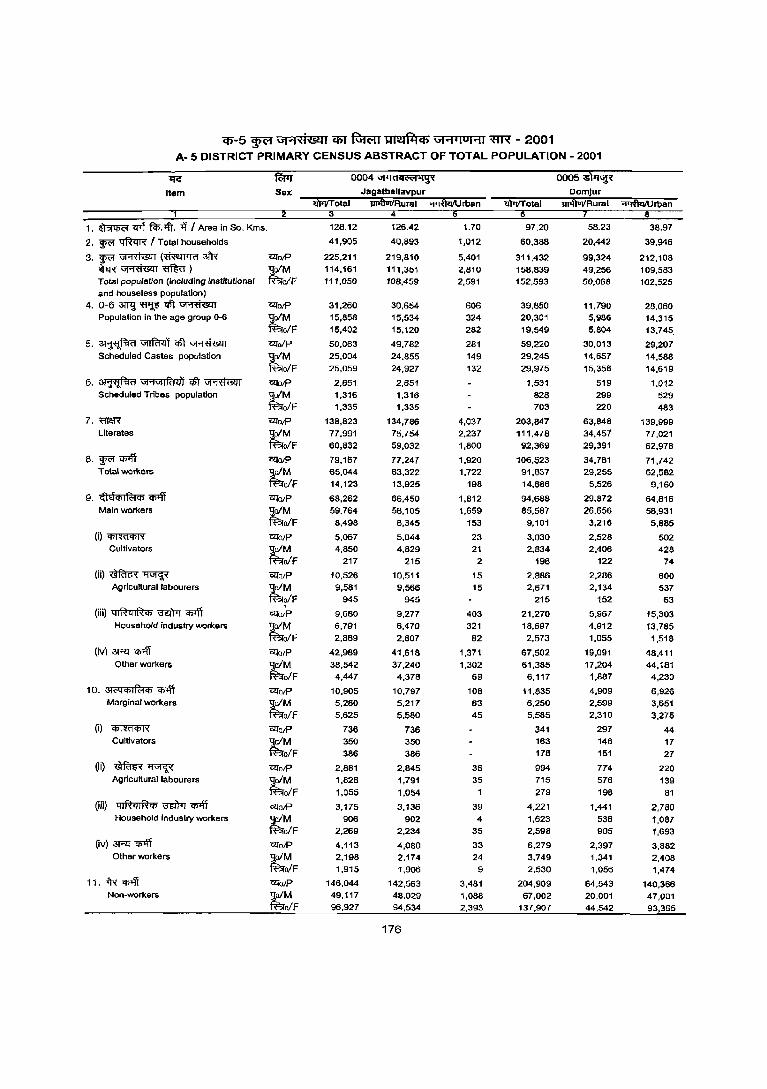
cp-s ~ \J'I"'I'I1'8Qi em ~ 'R'm~Cj') ",1" .. 1101"11 mx - 2001 A- 5 DISTRICT PRIMARY CENSUS ABSTRACT OF TOTAL POPULATION - 2001
~
Item
1, ~ eM fcI>,lfI', ~ I Area in Sq, Kms,
2, ~ ~ / Total households
3,~~~3fR ~~~) Total population (including Institutional and houseless population)
4, 0-6 3Wl ~ ql') ~ Population in the age group 0-6
5,~~ql')~ Scheduled Castes population
6, ~ \ij"MIR'I<1i ctt ~ Scheduled Tribes population
7,~
Literates
8,~~ Total workers
9, <!le!(/)I~(/) CflIff Main workers
(i)~ Cultivators
(ii)~~ Agricultural labourers
(iii) 4IRqIR(/) ~ "<!l"'ll Household industry workers
(iV)~~ Other workers
10, <iI<'Q(/)IR1(/) ~ Marginal workers
(i)~
Cultivators
(ii)~~ Agricultural labourers
(iii) 4,RqIR"l> ~ ~ Household industry workers
(iv)~'fl>l1T Other worke rs
11, 1R ~ Non-workers
<2!OIP S;alM ~o/F <2!oIp
S;alM ~oIF <2!o/P S;alM ~oIF <2!O/P S;o/M ~o/F OlI'O/P s:oIM ~oIF <2!O/P S;oIM ~o/F «iO/P S;oIM ~oIF «iO/P
lJoIM ~o/F , «iO/P S;o/M ~o/F czto/P S;oIM ~oIF «iO/P S;oIM ~o/F cztO/P S;oIM ~o/F <2!o/P S;oIM ~oIF «iolP S;oIM ~o/F cztotP S;o/M ~o/F «io/P S;o/M ~o/F
0004 \ij"(j"t><'t~
128,12
41,905
225,211 114,161 111,050
31,260 15,656 15,402
50,063 25,004
25,059
2,651 1,316 1,335
136,823 77,991
60,832
79,167 65,044 14,123
68,262 59,764
6,496
5,067 4,850
217
10,526 9,581
945
9,680 6,791 2,889
42,989 38,542
4,447
10,905 5,280 5,625
736 350 386
2,881 1,826 1,055
3,175
906 2,269
4,113 2,198 1,915
146,044 49,117 96,927
126.42
40,893
219,810
111,351 108,459
30,654 15,534 15,120
49,782 24,855
24,927
2,651 1,316 1,335
134,786 75,754 59,032
77,247 63,322 13,925
66,450 58,105
8,345
5,044
4,829 215
10,511
9,566 945
9,277 6,470
2,807
41,618 37,240
4,378
10,797 5,217
5,580
736 350 386
2,845 1,791
1,054
3,136
902 2,234
4,080 2,174
1,906
142,563 48,029 94,534
176
1,70
1,012
5,401
2,810 2,591
606 324
282
281 149
132
4,037 2,237
1,800
1,920 1,722
198
1,812 1,659
153
23 21
2
15
15
403 321
82
1,371 1,302
69
108 63 45
36 35
39 4
35
33 24
9
3,481 1,086 2,393
97.20
60,388
311,432
158,839 152,593
39,850 20,301 19,549
59,220 29,245 29,975
1,5J1 828 703
203,847 111,478
92,369
106,523 91,637 14,686
94,688 85,587
9,101
3,030 2,834
196
2,886
2,671 215
21,270 18,697
2,573
67,502
61,385 6,117
11,835 6,250 5,585
341 163 178
994 715
279
4,221 1,623 2,598
6,279
3,749 2,530
204,909 67,002
137,907
0005~ DomJur
iiTIliVIIRural ~rban
58.23
20,442
99,324
49,256 50,068
11,790 5,986 5,804
30,013 14,657
15,356
519 299 220
63,848 34,451
29,391
34,781 29,255
5,526
29,872 26,656
3,216
2,528 2,406
122
2,286 2,134
152
5,967 4,912
1,055
19,091 17,204
1,887
4,909 2,599 2,310
297 146 151
774 576
198
1,441
536 905
2,397 1,341
1,056
64,543 20,001 44,542
38.97
39,946
212,108 109,583 102,525
28,060 14,315 13,745,
29,207 14,588
14,619
1,012 529 483
139,999 77,021 62,978
71,742 62,582
9,160
64,816 58,931 5,885
502 428
74
600 537 63
15,303 13,785
1,518
48,411 44,181
4,230
6,926 3,651
3,275
44 17 27
220 139
81
2,780
1,087 1,693
3,882 2,408 1,474
140,366 47,001 93,365
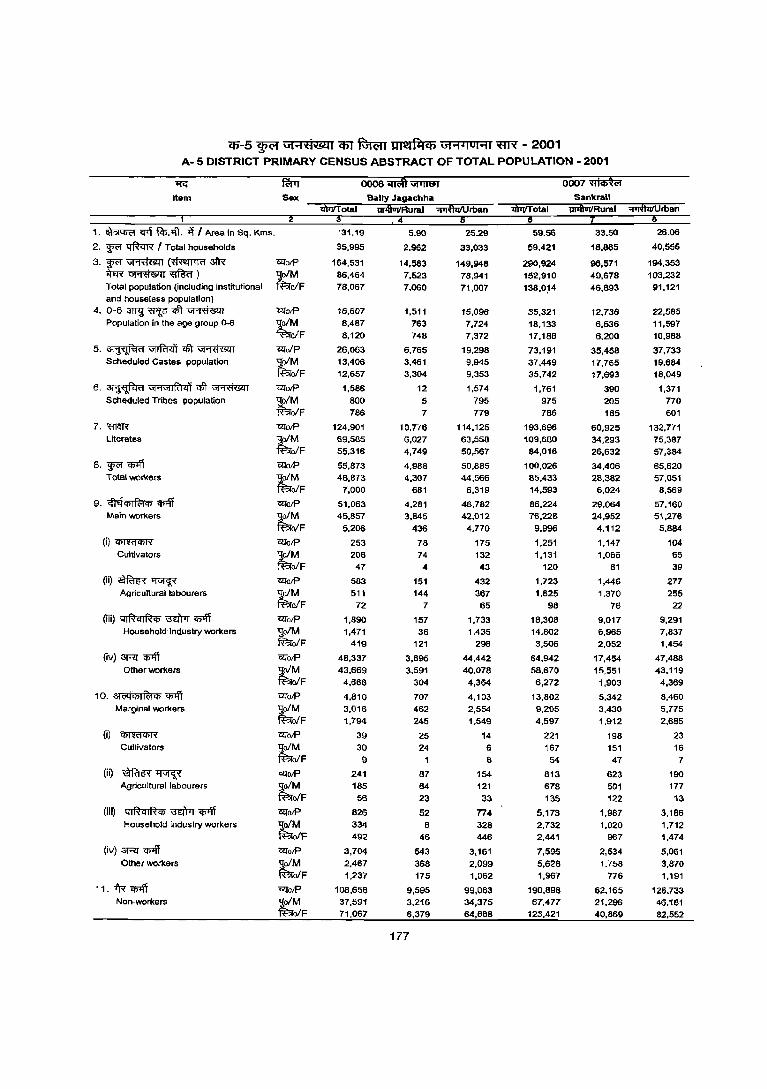
iP-5 ~ Gi""i'<Hi@ti 'ij)J fuR;rr Ult!lPiCh \jH.i01"11 ~ - 2001 A- 5 DISTRICT PRIMARY CENSUS ABSTRACT OF TOTAL POPULATION - 2001
~
Item
1. ~ <'f"i P<P. tft. ~ I Area In Sq. Kms.
2. ~ ttft<IR / Total households
3.~~(~afR ~~'8fur) Total population (including institutional and house less population)
4. 0-6 3lPj ~ <1ft ~ POpulation in the age group 0-6
5.~~cPT~ Scheduled Castes population
6. ~ G1"jGllR't4'j ctft ~ Scheduled Tribes population
7.m~
Literates
8. ~ Ci>Iff Total wonc.ers
9. <fttf"'IF.1", ~ Mainwonc.ers
(i)~
Cultivators
(iQ~~ Agricultural labourers
(iii) ql~ql~<I> ~ Q)'\'f Household·lnduslry workers
(iv) ~ q;;ff other workers
10. 31<"f<l>If{;)<I> Q)'\'f Marginal workers
(i)~
Cultivators
(ii)~~ Agricultural labourers
(iii) q IRq I fhl) \JEI'rrr <If'ff Household industry workers
(iv) aRT q;;ff Other workers
11. ~ <f>'ff Non-workers
Sex
c;Q"oIP 1]o/M R==sro/F
OIl'olP 1]oIM R==srolF OIl'oIP
'IoIM R==sroiF molP 'I0/M ~oIF mO/P 'IoiM ~oIF
motP
t~F ClfolP
'IoIM ~o/F molP 1]oIM ~oIF OlTolP 1]oIM ~oIF OlTolP
SoiM !F;;rolF
motP
SoiM !F;;rolF
OlTotP
SoiM lao/F OlTotP
'IoIM laolF OlTotP 1]oIM lao/F OlTotP
SoiM f?;{oIF
CZfotP 1]oIM f?;{oIF
CZfotP 'Io/M f?;{oIF
iri1TI1'otal
'31.19
35,995
164,531 86,464 78.067
16,607 8,487 8,120
26,063 13,406 12,657
1,586
800 786
124,901 69,585 55,316
55,873 48,873
7,000
51,063 45,857
5,206
253 206
47
583 511 72
1,890 1,471
419
48,337 43,669
4,668
4,810 3,016 1,794
39 30
9
241 185
56
826
334 492
3,704 2,467 1,237
108,658 37,591 71,067
5.90
2,962
14,583 7,523 7,060
1,511
763 748
6,765 3,461 3,304
12 5
7
10,776 6,027 4,749
4,1)88
4,307 681
4,281 3,845
436
78 74
4
151 144
7 157
36 121
3,895
3.591 304
707 462 245
25 24
1
87 64 23
52
6 46
543 368 175
9,595 3,216 6,379
177
25.29
33,033
149,948 78,941 71,007
15,096 7,724 7,372
19,298 9,945 9,353
1,574
795 779
114,125 63,558 50,567
50,885 44,566
6,319
46,782 42,012
4,770
175
132 43
432 367 65
1,733 1,435
298
44,442 40,078
4,364
4,103 2,554 1,549
14 6 8
154 121
33
774
328 446
3,161 2,099 1,062
99,063 34,375 64,688
59.56
59,421
290,924 152,910
138,O~4
35,321 18,133 17,188
73,191 37,449 35,742
1,761 975 786
193,696 109,680
84,016
100,026 85,433 14,593
86,224 76,228
9,996
1,251 1,131
120
1,723 1,625
98
16,308 14,802 3,506
64,942 56,670 6,272
13,802 9,205 4,591
221 167
54
613
676 135
5,173 2,732 2,441
7,595 5,628 1,967
190,696 67,477
123,421
0007~ Sankrall
liii!l1JJRural "iilfui/Urban
33.50
18,865
96,571 49,676 46,893
12,736 6,536 6.200
35,458 17,765 17,693
390 205
185
60,925 34,293 26,632
34,406
28,382 6,024
29,064 24,952
4,112
1,147
1,066 81
1,446 1,370
76
9,017 6,965 2,052
17,454 15,551
1,903
5,342 3,430 1,912
198
151 47
623
501 122
1,987 1,020
967
2,534 1.758
776
62,165 21,296 40,869
26.06
40,556
194,353 103,232
91,121
22,585 11,597 10,986
37,733 19,684 18,049
1,371 770
601
132,771 75,367 57,384
65,620 57,051
8,569
57,160 51,276
5,884
104 65 39
277 255
22
9,291 7,837 1,454
47,488 43,119
4,369
8,460 5,775
2.685
23 16
7
190 177 13
3,186 1,712 1,474
5,061 3,870 1,191
128.733 41M81 82,552
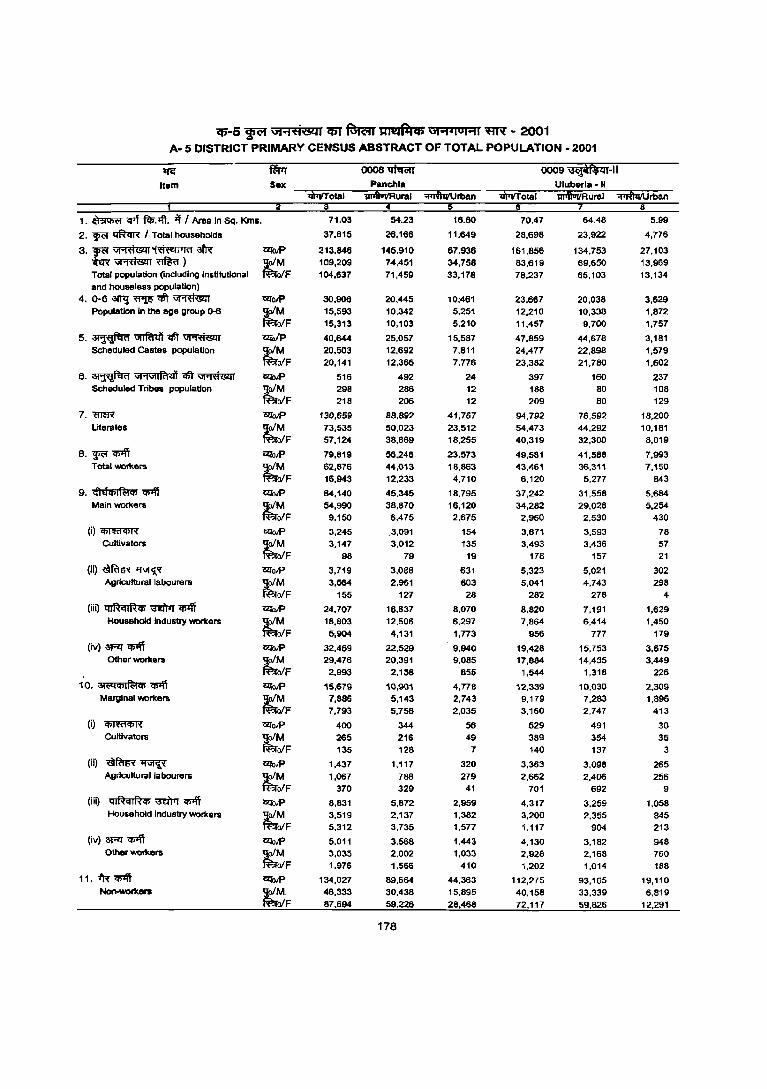
C6'-5 ~ \if"'l'l'i641 C6'f ~ JllI4~q; U1"'1'IUHI ~ - 2001 A- 5 DISTRICT PRIMARY CENSUS ABSTRACT OF TOTAL POPULATION - 2001
~
It8m Sex
0008~ Panchla
0009 idt3;if.$ tu-1I Uluberl. -II
m;(fTotal 1iiifl1I\IRurai ~rban m;(fTotal iii1fiViIRural "'Iiril1iIUrban
,. ~ trrf ~:oft. -ll Area In Sq. Klns.
2. ~ ~ I Total househOlds
3.~~i~~ W~~) Total population (Including Institutional and houseless population)
4. 0-6 3JT'I! ~ <1ft ~ Population in the age group ().{l
5.~~CIft~ Scheduled castes population
6. ~ VI'1V1IP<J<i! <1ft ~ Scheduled Tribes population
7.~
Literates
8.~~ Total workers
9. ~QCjjI~qs ~ Main workers
(i) <m<'I<m Cultivators
(ii)~~ Agricultural labourers
(iiQ ql~ql~q; ~ ~ Household Industry workers
(iv) 3R' <rnff Other workers
10. 3I('<Iq;I~q; ~ Marginal workers
(i) <m<'I<m Cultivators
(iQ~~ Agricultu ralla bourers
(iii) ql~ql~q; ~ ~ HousehOld industry workers
(iv) 3R' CIllff Other workers
1270lP
~oIM ~alF UlolP !101M ~oIF 12701P !101M ~oIF
UlOlP !101M ~oIF 1l!lolP 'loiM ~oIF Wolf>
t~F l2Iolf> ljoiM ~alF Wolf> 'loiM ta-alF
12I01P ljoiM ta-oiF 12l'o1P
~~F Clfulf>
~F Wolf> 'loiM ~alF l2Iolf> 'loiM ~oIF l2IolP 'lolM ~oIF Wolf> 'lolM ta-oIF
12I01P
~~F
71.03
37,815
213,846 109,209 104,637
30,906 15,593 15,313
40,644 20,503 20,141
516 298 218
130,659 73,535 57,124
79,819 62,876 16,943
64,140 54,990
9,150
3,245 3,147
98
3,719 3,564
155
24,707 18,803
5;904
32,469 29,476
2,993
15,679 7,886 7,793
400 265 135
1,437 1,067
370
8,831 3,519 5,312
5,011 3,035 1,976
134,027 46,333 87,694
54.23
26,166
145.910 74,451 71,459
20,445 10,342 10,103
25,057 12,692 12,365
492 286 206
88,892 50,023 38,869
56,246. 44,013 12,233
45.345 38.870
6,475
.3.091 3.012
79
3.088 2.961
127
16,637 12.506
4,131
22.529 20.391
2.138
10.901 5,143 5.758
344 216 128
1.117 788 329
5.872 2.137 3.735
3.568 2.002 1.566
89.664 30,438 59,226
178
16.80
11.649
67.936 34.758 33,178
10;461 5.251 5.210
15,587 7.811 7.776
24 12 12
41.767 23.512 18.255
23.573 18.863
4.710
18.795 16.120
2.675
154 135
19
631 603
28
8.070 6.297 1,773
9,940 9.085
855
4,778 2.743 2.035
56 49
7
320 279
41
2.959 1.382 1.577
1.443 1.033
410
44.363 15,895 28,468
70.47
28.698
161.856 83,619 78.237
23,667 12,210 11,457
47,859 24.477 23.382
397 188 209
94,792 54.473 40,319
49.581 43,461
6.120
37.242 34,282
2.960
3.671 3.493
178
5.323 5.041
282
8,820 7.864
956
19.428 17,884
1,544
12.339 9.179 3.160
529 389 140
3,363 2.662
701
4.317 3.200 1.117
4.130 2,928 1.202
112.275 40.158 72.117
64.48
23.922
134.753 69,650 65.103
20.038 10.338
9.700
44.678 22.898 21.780
160 80 80
76.592 44.292 32,300
41.588 36,311
5.277
31.558 29,028
2.530
3.593 3.436
157
5.021 4.743
278
7,191 6.414
777
15.753 14.435
1,318
10.030 7.283 2.747
491 354 137
3.098 2.406
692
3.259 2.355
904
3.182 2,168 1.014
93.165 33,339 59,826
5.99
4,776
27.103 13,969 13.134
3.629 1,872 1,757
3,181 1,579 1.602
237 108 129
18,200 10,181 8,019
7,993 7,150
843
5,684
5,254 430
78 57 21
302 296
4
1,629 1,450
179
3,675 3,449
226
2,309 1.896
413
38 35
3
265 256
9
1,056 845 213
948 760 188
19,110 6,819
12,291

iI)-5 ~ \i1"1't1&U q;y ~ ~ \i1"1"IOI"1I ~ - 2001 A- 5 DISTRICT PRIMARY CENSUS ABSTRACT OF TOTAL POPULATION - 2001
~
Item Sex
1. ~ q-.f fcI>.-.ft. >'i / Area in Sq. Kms .•
2. W<'I ~ I Total households
3. w<'f ~ (~3l'R ~~~) Total population (including institutional and house less population)
4. 0-6 amj ~ <1ft ~ Population in the age group 0-6.
5.~~qft~ Scheduled Castes populatiOn
6. ~ ;jj'1"1I~tj'i~~ Scheduled Tribes population
7, '8Te.R Literates
8. w<'f ~ Total workers
9. c:;laCbI~Cb ~ Main workers
(i) 'Cbffil"1I>R' Cultivators
(ii)~~ Agricultural labourers
(iii) 41~qIRq; ~ <Il"ff Household industry workers
(iv) 3RI~ Other workers
10. ",('qq;If<:\q; q;off Marginal workers
(i) 1'I>ITc!'Cb'R Cultivators
(ii)~~ Agricultural labourers
(iii) Q(RqIRCb ~ ~ Household industry workers
(iv) 3RI q;off Other workers
11. l'R q;off Non-workers
czrolP ljolM f'BrolF
czrolP ljolM f'Bro/F
~o/P
9;o/M f'Bro/F
~olP
ljolM f'Bro/F czro/p
9;o/M f'BrolF czro/p
ljo/M f'Bro/F ~o/p
ljolM f'Bro/F czro/p
ljolM f'Bro/F ~o/p
,!o/M f'Bro/F czro/p
,!o/M f'Bro/F
~olP
ljolM f'Bro/F 12l'o/p ';l;oIM tao/F
12l'olP -go/M ff';folF 12l'o/p 9;o/M f'Bro/F
~olP
ljo/M f'BrolF 12l'o/p ljolM f'BrolF
12l'OIP -go/M ff';fo/F
0010~-1
iI)iJfT otal
96.85
33,898
182.131 92,768 89,363
27,798 14,116 13,682
42,714 21.698
21,016
96 52 44
105,888 60,056 45,832
55,107 47,730
7,377
39,110 35,671
3,439
4,132 3,971
161
7.052 6,899
153
4,460 3,511
949
23,466
21.290 2,176
15,997 12,059
3,938
1,128 854 274
7,241
6,396 845
3,111
1.586 1,525
4,517 3,223 1,294
127.024 45,038 81,986
Uluberla -I
96.85
33,898
182,131 92,768 89,363
27,798 14,116 13,682
42,714
21,698 21,016
96 52 44
105,888 60,056
45,832
55,107 47,730
7,377
39,110 35,671
3,439
4,132 3,971
161
7,052 6,899
153
4,460 3,511
949
23,466
21,290 2,176
15,997 12,059
3,938
1,128
854 274
7,241 6,396
845
3,111
1,586 1,525
4,517 3,223 1,294
127,024
45.038 81,986
179
79,74
35,952
191,225 97,904 93,321
25,698 13,119 12,579
27.695 13.949
13.746
496 238 258
126,169 70,609
55,560
55,528 49,473
6,055
44,160 40,292
3,868
3,226 3,132
94
5,676
5,589 87
1,754 1,215
539
33,504 30,356
3,148
11,368 9,181 2,187
538 469
69
4,066
3,755 311
1,191 467
724
5,573 4,490 1,083
135,697 48,431 87,266
0011 'ifI1'Al""f-1
Bagnan -I riurlRural "l"JfuVUrban
6
76.42
32,287
173,786 89,019 84,767
23,865
12,211 11,654
26,607 13,395
13,212
447 212 235
113,172 63,527 49,645
50,402 45,115
5,287
39,472 36,257
3,215
3,208 3,117
91
5,570
5,495 75
1,701 1,181
520
28,993 26,464
2,529
10,930 8,858 2,072
534 465
69
4,026 3,718
308
1,155 450
705
5,215 4,225
990
123,384
43,904 79,480
3.32
3,665
17,439 8,885 8,554
1,833 908 925
1,088 554
534
49 26
23
12,997 7,082
5,915
5,126 4,358
768
4,688 4,035
653
18 15
3
106 94 12
53 34 19
4,511
3.892 619
438 323 115
4
4
40
37 3
36 17
19
358 265
93
12,313 4,527 7,786

if;-5 ~ \il9ft1t..cQl CfiT fGR;n QII!l~C6 \il9f.luHI ~ - 2001 A- 5 DISTRICT PRIMARY CENSUS ABSTRACT OF TOTAL POPULATION - 2001
1ft:' ~ 001"2 G(l'1'RR-1i 0013~-1
Item Sex Shyampur-I matUlIRural ~rban
1. ~ q>f ~.>ft. T{ , Area In Sq. Kms. 75.86 72.02 3.64 117.10 117.10
2. ~ ~ I Total households 27,683 26,298 1,365 36,211 36,211
3. ~ ~ (~3l'R' CZfotP 146,298 139,169 7.129 182,549 182,549 ~~~) ~ 75,390 71,594 3,796 93,091 93,091 Total population (including institutional ofF 70,908 67,575 3,333 89,458 89,458 and house less population)
4. 0-6~~<Ift~ 'aJOIP 19,044 18,108 936 24,309 24,309 Population In the age group ()-6 tM 9,687 9,203 464 12,444 12,444
ofF 9,357 8,905 452 11,865 11,865
5. ~ unfmit <1ft ~ 'aJoIP 15,620 ffi.,032 588 33,619 33,619 Scheduled Gastes population tM 7,956 7.674 282 17,064 17,064
ofF 7,664 7,358 306 16,555 16,555
6. ~ \J1"1\J11R14) <1ft ~ CZfO/P 1,629 876 753 1,552 1,552 Scheduled Tribes population ~M 846 407 439 664 664
ofF 783 469 314 868 888
7.~ C2fotP 95,694 91,409 4,285 114,963 114,963 literates tM 54.442 51.908 2,534 65,468 65.466
ofF 41,252 39,501 1,751 49,495 49,495
8.~m CZfotP 45,330 43,054 2,276 60,400 60,400 Total workers tM 39,449 37,548 1,901 52,587 52,587
ofF 5,881 5,506 375 7,813 7,813 9. ,!hlq;If(:r", q;>ff C2fotP 33,011 31.648 1,363 41,001 41,001
Main workers tM 30,454 29,244 1,210 38,076 38,076 ofF 2,557 2,404 153 2,925 2,925
(i)~ CZfotP 3,112 3,075 37 4,788 4,786 Cultivators tM 2,933 2,900 33 4,593 4,593
ofF 179 175 4 195 195
(ii)~~ C2fO/P 6,017 5,865 152 7.671 7,671 Agricultural labourers
~F 5,883 5,734 149 7,489 7,489 .134 131 3 182 182
(iii) qllhl~Cfi ~ ~ C2fotP 806 785 21 1,364 1,364 Household industry workers tM 614 594 20 1,09S 1,098
oIF 192 191 1 266 266
(iv) 3Rl q;1ff C2fO/P 23,076 21,923 1,153 27,178 27,178 Other workers tM 21,024 20,016 1,008 24,896 24,696
ofF 2,052 1,907 145 2,282 2,282
10. 31<'4CfiltaCfi m CZfotP 12,319 11,406 913 19,399 19,399 Marginal workers r 8,995 8,304 691 14,511 14,511
oIF 3,324 3.102 222 4,888 4,888
(i) ~ C2fotP 746 740 6 2,202 2.202 Cultivators
~F 551 546 5 1,700 1,700 195 194 502 502
(ii) ~~ CZfO/P 4,392 4,240 152 10,679 10,679 Agricultural labourers r 4,114 3,965 149 8,905 8,905
oIF 278 275 3 1,774 1,774
(III) QIRql~'" ;:rn'r1r ~ G!l'otP 1.126 1,087 39 777 777 Hou&ehold indu&try workers r 286 261 25 297 297
ofF 640 826 14 480 480
(iv) 3Rl~ ClI'otP 6.055 5,339 716 5,741 5,741 Other workers tM 4,044 3,532 512 3,609 3,609
elF 2.011 1,807 204 2.132 2,132
11. -fR ~ motP 100,968 96,115 4.853 122.149 122.149 Non-workers
~F 35,941 34,046 1,895 40,504 40,504 65,027 62,069 2,958 81,645 81.645
180
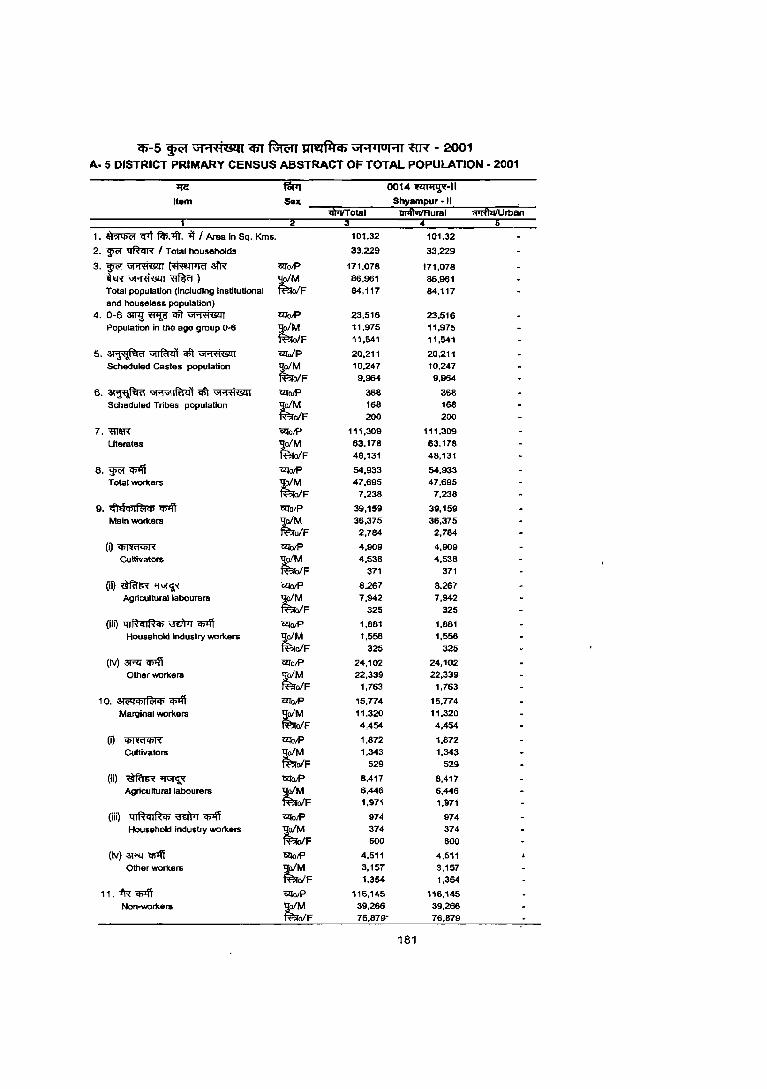
cp-5 ~ vH'fi&l1 em ~ S:Ue{('q(f) \i(.PloHI ~ - 2001 A· 5 DISTRICT PRIMARY CENSUS ABSTRACT OF TOTAL POPULATION· 2001
"Ii! ~ 0014~·11
Item Sex Shyampur-II 1iiiftViI'Rurai "'i1lfuiIUrban
1. ~ <f1f ~.1ft. if I Area In Sq. Kms. 101.32 101.32
2. ~ ~ I Total households 33.229 33.229
3.~~(~alR C2TolP 171.078 171,078 ffi~~) tM 86.961 86,961 Total population (Including Im;tituUonal ofF 84,117 84,117 and houseless population)
4. 0-6 3m} ~ ql't ~ C2TolP 23,516 23,516 Population in the age group 0-6 tM 11.975 11,975
aiF 11,541 11,541
5,~~qft~ G!lQ/p 20,211 ,0,211 Scheduled Castes population tM 10,247 10.247
ofF 9,964 9,964
6. ~ "'''''''IRI~1 qft ~ Cil[oiP 368 368 Scheduled Tribes population tM 168 168
elF 200 200
7. mm Cil[olP 111,309 111,309
Uterates tM 63,178 63,178
elF 48,131 48,131
8,~~ Cil[oiP 54,933 54,933 Total worKers tM 47.695 47,695
elF 7,238 7.238
9. ~Ejq;IItiq; ~ Cil[olP 39,159 39,159 Main worKers tM 36,375 36.375
ofF 2,784 2,784
(O~ <2io!P 4,909 4,909 Cultivators ~
4,538 4,538
ofF 371 371
(ii)~~ Gl:iolP 8.267 8.267 Agricultural labourers ~
7,942 7.942 elF 325 325
(iI~ ql RqIRq; "3dPT 'C!>Iff Gl:iotP 1,881 1,881 Household Industry worKers r 1,556 1,556
elF 325 325
(iv) 3l""ll'"lP'l'i Gl:iotP 24,102 24,102 Other workel'$ r 22,339 22,339
elF 1,763 1.763
10. OjCiQq;Ift;jq; ~ Gl:iotP 15,774 15,774
Marginal worKers ~M 11.320 11.320
elF 4,454 4,454
(il ~ CZfolP 1,872 1,872 Cultivators ~
1,343 1,343 aiF 529 529
(iiJ ~~ CZfolP 8.417 8.417 Agricultural labourers ~F
6,446 6,446 1,971 1,971
(iii) qlRqlR", "3dPT ~ C2loIP 974 974 Household industry workers ~F
374 374 600 600
(iv) ~ <fi1ff 12IOtP 4.511 4.511 Other workers ~
3,157 3,157 elF 1,354 1,354
1'.i'R:~ Cil[otP 116,145 116,145
Non-WOrKers ~F 39,266 39,266 76,879' 76.879
181
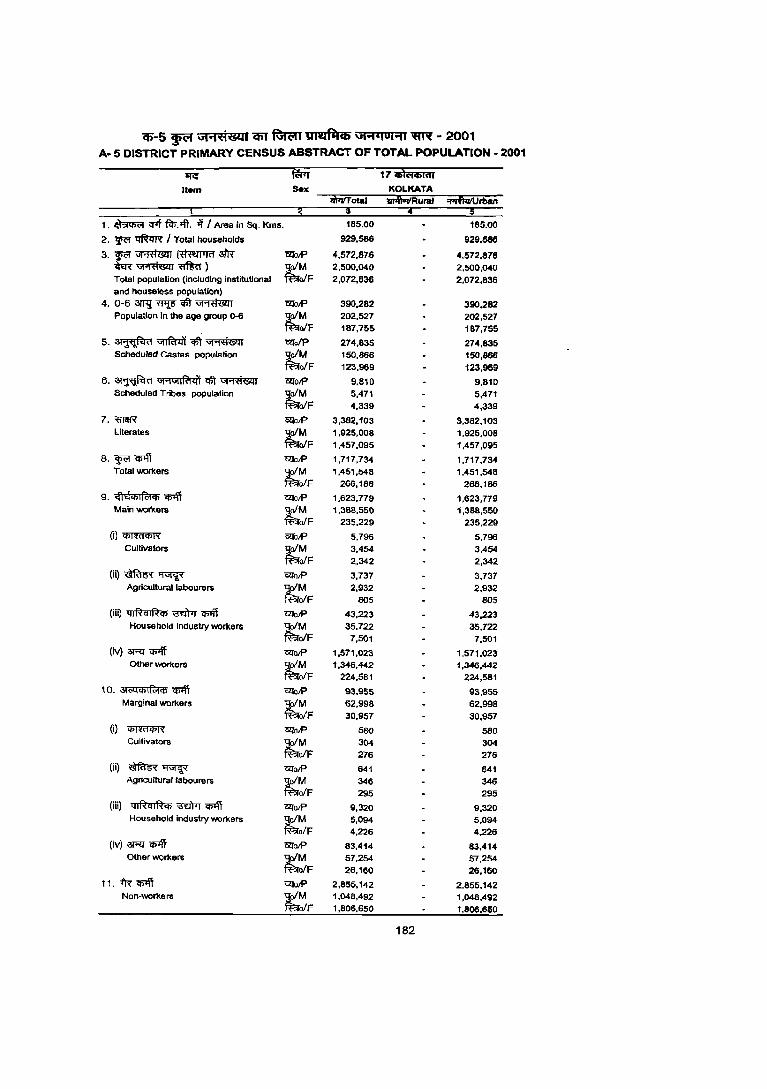
1i)-5 P ",..,.;c:iilSlll em ~ UltifliCti Gt..,iIUHI ~ - 2001 A· 5 DISTRICT PRIMARY CENSUS ABSTRACT OF TOTAL POPULATION. 2001
~ fWr 17~ Item Sex
1. ~ cpf f1r;.1fi. if I Area in Sq. Kms. 185.00 185.00
2. ~ ~ I Total households 929,586 929,586
3. ~ ~ (~3l"R ?lT0IP 4,572,876 4,572,878 tEff~~) tM 2,500,040 2,500,040 Total population (including Institutional ofF 2,072,836 2,072,836 and houseless population)
4. 0-6 3lT<J ~ ~ ~ ?lTolF' 390,282 390,282 Population In the age group 0-6 tM 202,527 202,527
ofF 187,755 187,755
5.~~~~ cqolP 274,835 274,835 Scheduled castes populaHon tM 150,866 150,866
ofF 123,969 123,969
6. ~ Gj.,\ij1~41 ~ ~ l2:folF' 9.810 9.810 Schedulell Tribes population ~M 5,471 5,471
ofF 4,339 4,339
7.mm QlfolF' 3,382,103 3,382,103 Literates tM 1,925,008 1,925,008
ofF 1,457.095 1,457,095
8. W<'I q;>ff 'I1fO/P 1,717,734 1,717,734 Total workers tM 1,451,548 1.451.548
oIF 266,188 266,186
9. <f\E'ii6lfe1", ~ l2:fotP 1,623,779 1,623,779 Main workers tM 1,388,550 l,38B,550
oIF 235,229 235.229
(i)~ QlfotP 5.796 5,796 Cultivators tM 3,454 3,454
ofF 2,342 2,342
(ii)~~ QlfOIP 3,737 3,737 Agricultural labourers
~~F 2,932 2,932 805 805
(iii) 41RcllR", ~ q;>ff C1Jo.tP 43,223 43,223 Hou se holll Inllustry workers tM 35.722 35,722
ofF 7,501 7,501 (iv) ~ q;>ff ClIOIP 1,571,023 1,571,023
Other workers
t~F 1,346,442 1,346,442 224,581 224,581
10. ali5Qi6lf<:1i6 q;;ff 'I1fotP 93,955 93,955 Marginal WOrkers ~M 62,998 62,99a
oIF 30,957 30,957 (i) ~ C1Jo.tP 580 580
Cultivators ;tM 304 304 oIF 276 276
(ii) ~~ ClIOIP 641 641 Agricultural labours rs tM 346 346
ofF 295 295 (iii) 4IRqIRi6 ~ q;>ff CZlOlP 9,320 9,320
Household industry workers tM 5,094 5,094 ofF 4,226 4,226
(iv) aRl~ QlfOlP 83,414 83,414 Other WOrkers tM 57.254 57,254
oIF 26,160 26,160
11. iR~ ClIOIP 2,855,142 2,855,142 Non-workers ~F 1,048,492 1,048,492
1,806.650 1,806,650
182
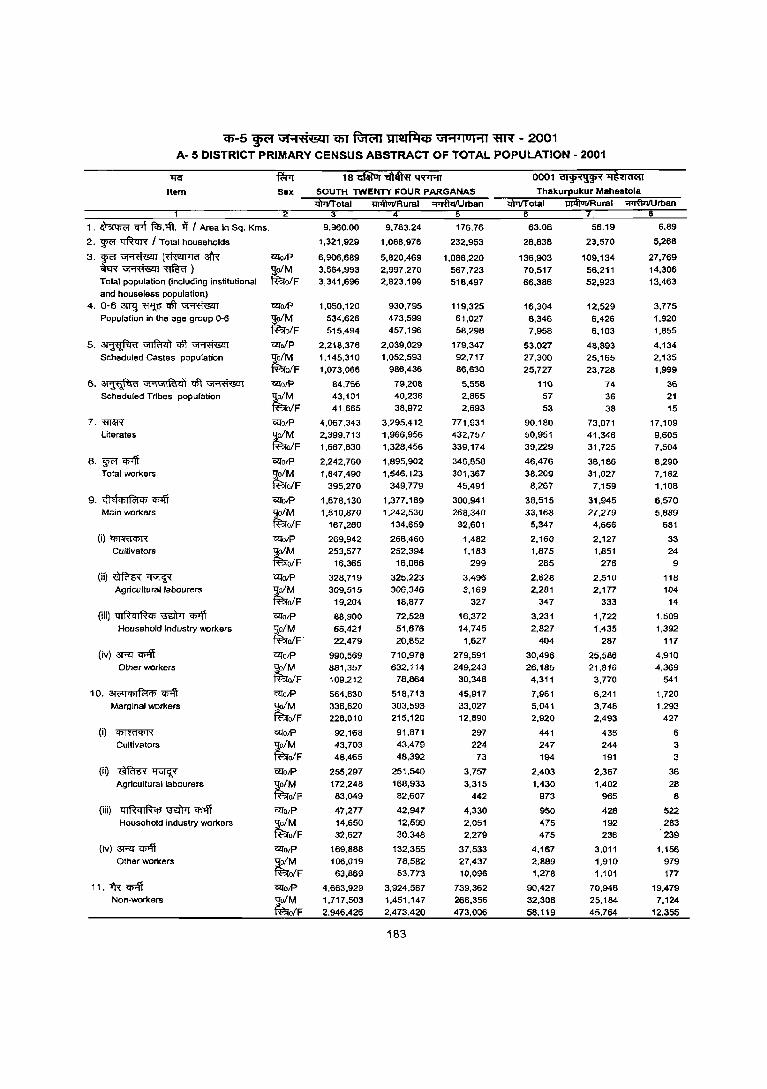
Cf)-5 ~ Gi'1'fi'l!A1 em Riwrr m~~Cb Gt""I.loHI ~ - 2001 A- 5 DISTRICT PRIMARY CENSUS ABSTRACT OF TOTAL POPULATION - 2001
..,-c:
Item Sex
18 lifilIJi ~ lfir'"A'T
SOUTH TWENTY IiOUR PARGANAS
0001 dl!p'('l!p't 'i'ihiiIi'i'l Thakurpukur Mahestola
iI\i1fTotal liiiftlJiIRural ~rban
1. ~ 'CJ"f f<I>.'I'ft. ii I Area In Sq. Kms.
2. ~ ~ I Total households
3.~~(~afR ~~~) Total population (including institutional
and houseless population)
4. 0-6 ~ 'Wll>cfft ~ Population in the age group Q-6
5.~~qlt~ Scheduled Castes population
6. ~ \l\1G\\R!tll qft ~ Scheduled Tribes population
7. m&N Literates
8.~'1I>'ff Total workers
9. <!1lOl</JIRt'" '1I>'ff Main workers
(i)~
CulHvators
(ii)~~ Agricu Itu rallabourers
(iii) QIRqIR", ~ ~ Household industry workers
(iv) 3R1' '1I>'ff Other workers
10. 3l<"l"'IRt", '1I>'ff Marginal workers
(i)~
Cultivators
(ii)~~ Agricullurallabourers
(iii) qlRqlRq; '3"dM q;;ff Household industry workers
(iv)~~ Other WOrkers
11.1R~ Non-workers
2
<lIot?
'loiM tao/F
<lIot?
'loiM tao/F
urolP 'lo/M ~o/F urolP 'Io/M ~oIF "Ufo/P
'IoiM ~o/F
"Ufo/P
,:!o/M ff';!o/F
"Ufo/P
~o/M ~o/F '&Io/P
~oIM ~o/F '&lot?
~oIM fmo/F "UfO/P
'9;o/M ~oIF "UfotP
~o/M taolF "UfotP
5lolM ~o/F <lIo/P
-golM ~oIF Cll'o/p
-golM tao/F <lIo/P
golM !'RolF
<lIO/P
golM !'Bro/F
"UfotP
~o/M f'ao/F
9.960.00
1,321,929
6,906,689 3,564,993 3,341,696
1,050,120 534,626 515,494
2,218,376 1,145.310 1,073,066
84,766 43,101 41.665
4,067,343 2,399,713 1,667,630
2,242,760 1,647,490
395,270
1,678,130 l,510,B70
167,260
269,942 253,577
16,365
328,719 309,515
19,204
88,900 66,421 22,479
990,569 881,357 109,212
564.630 336,620 228.010
92.168 43,703 48,465
255,297 172,248 83,049
47,277 14,650 32,627
169.888 106,019 63,869
4.663,929 1,717,503 2,946,426
9,783.24
1,088,976
5,820,469 2,997,270 2,823,199
930,795 473,599 457,196
2,039,029 1,052,593
986,436
79,208 40,236 38,972
3,295,412 1,966,956 1,328,456
1,895,902 1,546,123
349,779
1,377,189 1,242,530
134,659
268.460 252,394
16,066
325,223 306,346
18,877
72,528 51.676 20,852
710,978 632,114
78,864
518,713 303,593 215,120
91,871 43.479 48,392
251.540 166,933 82.607
42,947 12,599 30,348
132,355 78,582 53,773
3,924.567 1,451,147 2,473.420
183
176.76
232,953
1.086,220 567,723 518,497
119,325 61,027 58,298
179,347 92,717 86,630
5,558 2,865 2,693
771,931 432,757 339.174
346,658 301,367
45.491
300,941 268,340
32,601
1,482 1,183
299
3,496 3,169
327
16,372 14.745
1,627
279,591 249,243
30,348
45,917 33,027 12,890
297 224
73
3,757
3.315 442
4,330 2,051 2,279
37,533 27,437 10,096
739,362 266,356 473,006
6
63.08
28,836
136,903 70,517 66,386
16,304 8,346 7,958
53,027 27,300 25,727
110 57 53
90,180 50,951 39,229
46,476 38,209
8,267
38,515 33,168
5,347
2,160 1,875
285
2.628 2,281
347
3,231 2,827
404
30,496 26,185
4,311
7,961 5.041 2,920
441 247 194
2,403
1.430 973
950 475 475
4,167 2,889 1,278
90,427 32,308 56,119
56.19
23,570
109,134 56,211 52,923
12,529 6,426 6,103
48,893 25.165 23,728
74 36 38
73,071 41,346 31,725
38,186 31,027
7.159
31,945 27,279
4,666
2,127 1,B51
276
2,510 2,177
333
1,722 1,435
287
25,586 21,816
3,770
6.241 3,748 2,493
435 244 191
2,367
1.402 965
428 192 236
3,011 1,910 1,101
70,948 25,184 45,764
6.89
5,268
27,769 14,306 13,463
3,775 1,920 1,855
4,134
2.135 1,999
36 21 15
17,109 9,605 7,504
6,290 7,182 1,108
6,570 5,BB9
681
33 24
9
118 104
14
1,509 1,392
117
4,910 4,369
541
1,720 1,293
427
6 3 3
36
26 8
522 283 239
1,156 979 177
19,479 7,124
12,355

q;-5 ~ \1f"'ltiiBIQl ifiT R;n;n melf¥aC6 Gi"'l'luHI 'flR - 2001 A- 5 DISTRICT PRIMARY CENSUS ABSTRACT OF TOTAL POPULATION - 2001
-re Ltem Sax
1. ~ crrt fcl>:Ifi. ii I Area in Sq. Kms.
2. ~ tIftcrR I Total households
3. w<'I ~ (~ 3fR ~~~) Total population (Including Institutional and houseless population)
4. 0-6 3WJ ~ ctt ~ population in the age group 0-6
5.~~~~ Scheduled Castes population
6. ~ Vj'1\i[I~<i\ Ci1t ~ Scheduled Tribes population
7. 'fIT1S<"
Literates
8. w<'l ~ Total workers
9. tMCfiIfc:Jib "iblfi Main workers
(i)~
Cultivators
(ii)~~ Agricultural labourers
(iii) QjJilqjJilib ~ 'I>'ff Household industry workers
(iv) aRl" q;off Other workers
10. 31<"QCfi'[clCfi <rl1lT Marginal workers
(i)~ Cultivators
(ii)~~ Agricultural labourers
(iiO QIJilqlRib ~ q;"lff Household industry workers
(iv) aRl" q;off Other workers
11. fR q;"lff Non-workers
C2toiP
~oIM ffl;rolF
C2toiP ~oIM fBro/F
GlIo/P ~Q/M ffl;ro/F
C2toiP
~o/M ffl;rolF Clfo/P
~o/M ~oIF ClfolP
~oIM ~o/F
<2ToiP
~o/M fBro/F
<2To/P ';!oIM fBroiF ClfoiP "9;o/M ffl;rolF C2foiP l!0/M ffl;rolF Clfo/p
~oIM ~oIF G!ToiP
:!o/M ~oIF <2To/P -go/M ~o/F G!TolP
lJofM fBrolF G!To/P
:!ofM ffl;ro/F
Clfo/P lJofM ffl;rolF G!To/p
~o/M ~oIF
26.55
20.213
99,945
52,332 47,613
12,964 6,629 6,335
20,760 10,794
9,966
45
26 19
64,352 37,184 27,168
30,096 26,914
3.182
20,665 19,251
1,414
495 453
42
1,351 1,302
49
547 450
97
18,272
17,046 1,226
9,431
7,663 1,768
172 142 30
3,463 3,113
350
917 501
416
4,879 3,907
972
69,849 25,418 44,431
0002 iIur iIur-1
Budge Budge - I
13.09
9.B38
48,936
25.301 23.635
6,587 3,290 3,297
17.302 B,986 8,316
3B 21 17
31,021 17,896 13,125
15,123 13,416
1,707
10,199 9.392
807
415 382
33
1.019 973
46
237 171
66
8,528 7,866
662
4,924 4,024
900
143 115 28
2,20,9 1,916
293
248 104
144
2,324 1,889
435
33,813 11,885 21,928
184
13.46
10,375
51,009 27,031
23,978
6,377
3,339 3,038
3,458 l,B08 1,650
7
5
2
33,331 19,288 14,043
14,973 13,498
1,475
10,466 9,859
607
80 71
9
332 329
3
310 279
31
9,744 9,180
564
4,507 3,639
B68
29 27
2
1,254 1,197
57
669 397
272
2,555 2,018
537
36,036 13,533 22,503
78.00
34,995
173,446 89,998 83,448
22,288 11,270 11,018
35,551 18,232 17,319
369 189 180
109,529 63,169 46,360
55,289 48,321
6,968
38,618 35,973
2,645
2,727 2,582
145
6,825 6,571
254
2,949 2,410
539
26,117 24,410
1,707
16,671 12,348 4,323
798 568 230
7,298 6,494
804
1,973
955 1,018
6,602 4,331 2,271
118,157 41,677 76,480
0003 iIur iIur-11
72.79
30,622
152,086 78,493 73,593
19,887 10,044
9,843
34,413 17,627 16,786
363 184 179
94,722 54,411 40,311
48,876 42,344
6,532
33,823 31,411i
2,405
2,659 2,520
139
6,571 6,318
253
2,814 2,300
514
21,779 20,280
1,499
15,053 10,926 4,127
756 528 228
6,542 5,777
765
1,817 841
976
5,938 3,780 2,158
103,210 36,149 67,061
5.21
4,373
21,360 11,505
9,855
2,401 1,226 1,175
1,138 605
533
6
5
14,807 8,758
6,049
6,413 5,977
436
4,795 4,555
240
68 62
6
254
253
135 110
25
4,338 4,130
208
1,618 1,422
196
42 40
2
756 717 39
156 114
42
664
551 113
14,947 5,528 9,419
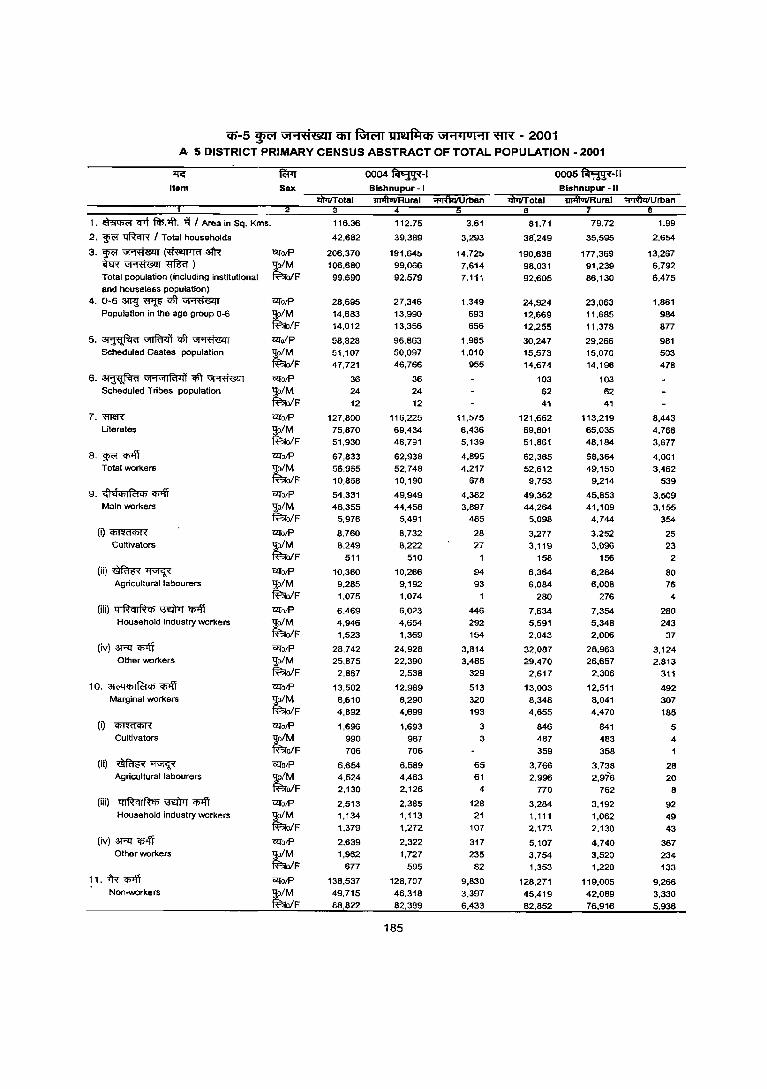
$-5 ~ \1I"'ItiMI CfiT fGrt>rr ~ \11'1'101'11 ~ - 2001 A- 5 DISTRICT PRIMARY CENSUS ABSTRACT OF TOTAL POPULATION - 2001
~
Item
1. ~ "!fit tm".lfi. 'it I Area In Sq. Kms.
2. ~<'f "!lftcrR I Total households
3.~~(~~ ~~~) Total population [including institutional and houseless population)
4.0-6~~qft~ Population in the age group 0-6
5.~~qft~ Scheduled Castes population
6. ~ Gt.,Gt11'?t41 qft ~ Scheduled Tribes population
7. W&l'{
Literates
8. F q)1jl Total workers
9. <fIE!iI'il~4> q)1jl Main workers
(O~
Cultivators
(ii)~~ Agricultural labourers
(iii) ql~ql~'" ~ "1f>1ff Household industry workers
(iv) aRl' ~ Other workers
10. 3t(i4q)I~(/j ~ Margina I workers
(i)~ Cultivators
(ii)~~ Agricultural labourers
(iii) ql~ql~cp ~ 4>"'ft Household industry workers
(iv) aRl'M Olher workers
11. tR 4>"'ft Non-worke rs
Sex
c:lfotP
"!);o/M ~oIF
c:lfotP
"!);o/M ~o/F c:lfo/P "!);o/M ~oIF c:lfo/P
"!);oIM ~oIF GIl"otP
"!);o/M ~oIF
c:lfotP "!);o/M fBToIF
c:lfo/P "!);o/M fBToIF c:lfo/P
~oIM ~oIF c:lfOfP
"!);o/M ~oIF G
'CP-5 ~ \JFI'<'i\!..GllI QiT R;rc;rr ~ \11"1'IUI"11 XlR - 2001
A- 5 DISTRICT PRIMARY CENSUS ABSTRACT OF TOTAL POPULATION - 2001
"'I<: Item
1. ~ "lfTI f<n:4't. ;!j I Area in Sq Kms.
2. F ~ I Total households
3. w<'f ~ (~afR m~~) Total population [including institutional and houseless population)
4. 0-63ll7;1;~qft~ Population in the age group 0-6
5. ~ vtTfu<IT ~ ~ Scheduled Castes population
6. ~ "1'1"1IRtIl1 ctt ~ Scheduled Tribes population
7. 'lim Literates
8. g>C'f C!>'1t Total workers
9. GlE)'CI>Ifc;JCI> ~ Main workers
(i)~
Cultivators
(ii)~~ Agricultural labourers
(iii) ql~i'H~<tl .mt-rr '11'11 Household industry workers
(iv) 3RT Cf>Ilf Other workers
10. ;JJ('<jCl>,fc1<tl ~ Marginal workers
(i)~
Cultivators
(ii)~~ Agricultural labourers
(iii) q I ~ q I ~ <tl \3EI'r>r '11'11 Household industry workers
(iv) 3RT Cf>Ilf Other workers
11. fIT 'f51ff Non-workers
Sex
CZfarP
-go/M ~oIF
C2l"a/P ,!!o/M ~oIF C2l"o/P ,!!o/M ~oIF
C2l"O/P ,!!o/M ff?ro/F
C2l"orP 'lo/M ~o/F C2l"orP ,!!o/M ff?ro/F
O!JorP
'loiM ff?ro/F
G110rP 'l0/M ff?ro/F
CZ/'orP
,!!oIM ~o/F
CZ/'OIP
'lolM ff?ro/F
CZ/'O/P
,!!oIM ff?rolF CZ/'O/P
':{o/M ff?ro/F O!JorP ':{oIM R'?ro/F
G110rP ,!!oIM ff?ro/F
G110lP ,:!oIM ~o/F
O!JorP ,:!oIM ff?ro/F "17fo/P
'loiM ff?ro/F
Wrrrotal
120.63
34,361
167,408 86,078
81,330
21,553
11.062 10,491
97,036 49,833 47,203
2,683 1,351 1,332
103,181 59,918
43.263
52.716
45,234 7,482
44,359
38.935 5,424
6,103 5.627
476
5.073 4,466
607
855 604 251
32,328 28,238
4,090
8,357 6,299 2.058
868
669 199
3,439 2,712
727
341 116 225
3,709 2,802
907
114,692 40,844 73,848
0006~ Sonarpur
120.63
34,361
167,408 86,078
81.330
21,553 11,062
10,491
97,036 49,833 47,203
2,683 1.351 1,332
103.181 59.918 43.263
52.716 45,234
7.482
44,359 38,935
5.424
6,103 5,627
476
5,073 4,466
607
855 604
251
32.328 28.238
4,090
8.357 6,299 2.058
B68
669 199
3,439 2,712
727
341 116 225
3.709 2,802
907
114,692 40,844 73,848
186
"lI)TTfT otal 6
153.62
36,642
204.380 104,584
99,796
37,857 19.138 18,719
46,360 23,927 22,433
3,124 1.560 1,564
100,834 59,447
41.387
63.489 53,201 10,288
51,792 46,873
4.919
12.795 12.230
565
13,033 11.703
1,330
2,582 1,795
787
23,382
21.145 2,237
11,697 6,328 5.369
1.647
992 655
5,773 3,199
2,574
1,059 235 824
3,218 1,902
1,316
140,891 51,383 89,508
0007~-1
Bhangar -I
'liJlliVlIRural 'fiifuIfUrban
152.11
35,681
199,369 102,024
97.345
37,070 18.729 18,341
45,985 23,733 22,252
3,123 1.559 1,564
97,938 57,819
40.119
61.754
51.817 9,937
50,484 45,719
4.765
12,761 12,204
557
12,962 11,644
1,318
2,377 1,644
733
22,384 20,227
2,157
11,270 6,098 5.172
1.638
986 652
5,699
3,148
2,551
993 222 771
2,940 1,742
1.198
137.615 50,207 87,408
1.51
961
5,011 2,560 2,451
787 409
378
375 194
181
2.B96 1,628
1.268
1,735
1.384 351
1,308 1,154
154
34 26
8
71 59 12
205 151 54
998 918
80
427 230 197
9
6 3
74 51
23
66 13 53
27B 160 l1B
3,276 1,176 2,100

CJ)-5 ~ u"'1'<1'641 CfiT ~ J4Ie:j~q; UiY1'loHI ~ - 2001 A- 5 DISTRICT PRIMARY CENSUS ABSTRACT OF TOTAL POPULATION. 2001
1fG ~ 0OO8~-11 0009 mTI-1 Item Sex Bhangar-It Canning -I
"<WlITotal u,41,.,Rural ~rban <fIl1rrotal u,41,.,Rural ~rban
1. ~ ~ frt>.l'fi. if f Area in Sq. Kms. 162.04 162.04 187.86 187.86
2. ~ trftcrR f Total households 36.445 36.445 46.686 46,686
3.~~(~afR ClTolP 207,580 207,580 244,627 244,627 ~~~) tM 107,683 107.683 125,097. 125,097 Total population (including institutional ofF 99,897 99,897 119,530 119,530 and houseless population)
4. 0-6 ~ ~ <1ft vmrnzrr ClTolP 36,861 36,861 42,653 42,653 Population In the age group 0-6 tM 18,802 18,802 21,545 21,545
ofF 18,059 18,059 21,108 21,108
5.~~<Ift~ ClToiP 46,004 46,004 123,936 123,936 Scheduled Castes population tM 23,623 23,623 63,868 63,868
olF 22,381 22,381 60,068 60,068
6. ~ Vj'1\J11R141 Cfl't ~ ClTotP 2,108 2,108 3.075 3,075 Scheduled Tribes population "9;o/M 1,044 1,044 1,536 1,536
~o/F 1,064 1,064 1,539 1,539
7. ~ c;qO/P 112,073 112,073 122,181 122,181 Literates tM 64,789 64,789 75,142 75,142
o/F 47,284 47,284 47,039 47,039
8. WR CI>'ff c;qO/P 58.870 58,870 79,075 79,075 Total workers ~M 53,453 53,453 63,970 63,970
olF 5,417 5,417 15,105 15,105
9. G"hlChlfc;tCh CI>'ff c;qO/P 49,512 49,512 58,752 58,752 Main workers ~M 46.570 46,570 50,766 50,766
olF 2,942 2,942 7,986 7,986
(i)~ c;qo/p 14,431 14,431 8,582 8,582 Cultivators tM 14,113 14,113 6,226 6,226
ofF 318 318 356 356
(iO~~ "i'1lotP 12,098 12,098 10,474 10,474 Agricultural labourers tM 11,503 11.503 9,969 9,969
ofF 595 595 505 505
(iii) ql~ql~Ch ~ "l'f>'ff "i'1l01P 2,040 2,040 2,604 2,604 Household industry workers tM 1,547 1,547 1,258 1,258
ofF 493 493 1,346 1,346
(iv) 3Rl"<li"'ff l2:!olP 20,943 20,943 37,092 37,092 Other workers 9;ofM 19,407 19.407 31,313 31,313
~o(F 1,536 1,536 0,779 0.779
10. 3h_;qChI~Ch CI>'ff c;qo;P 9,358 9,358 20,323 20,323 Marginal workers tM 6,883 6,883 13,204 13,204
olF 2,475 2,475 7.119 7,119
(i) ~ c;qo/p 912 912 1,704 1,704
Cultivators tM 716 716 1,062 1,062 ofF 196 196 642 642
(ii) ~~ "i'1lo/P 4,214 4,214 8,599 8,599 Agricultural labourers "9;o/M 3,518 3,518 7,220 7,220
f'Ro/F 696 696 1,379 1,379
(iii) ql~ql~Ch ~ Cj)Iff c;qo;P 793 793 3,422 3,422 Household industry workers tM 234 234 782 782
ofF 559 559 2,640 2.640
(iv) 3Rl"l'f>'ff c;qo;P 3,439 3,439 6,598 6,598 Other workers "9;o/M 2,415 2,415 4,140 4,140
~ofF 1.024 1.024 2,458 2.458
11. fR CI>'ff c;qotP 148,710 148,710 165,552 165,552 Non-workers tM 54,230 54,230 61,127 61,127
oiF 94,480 94,480 104,425 104,425
187
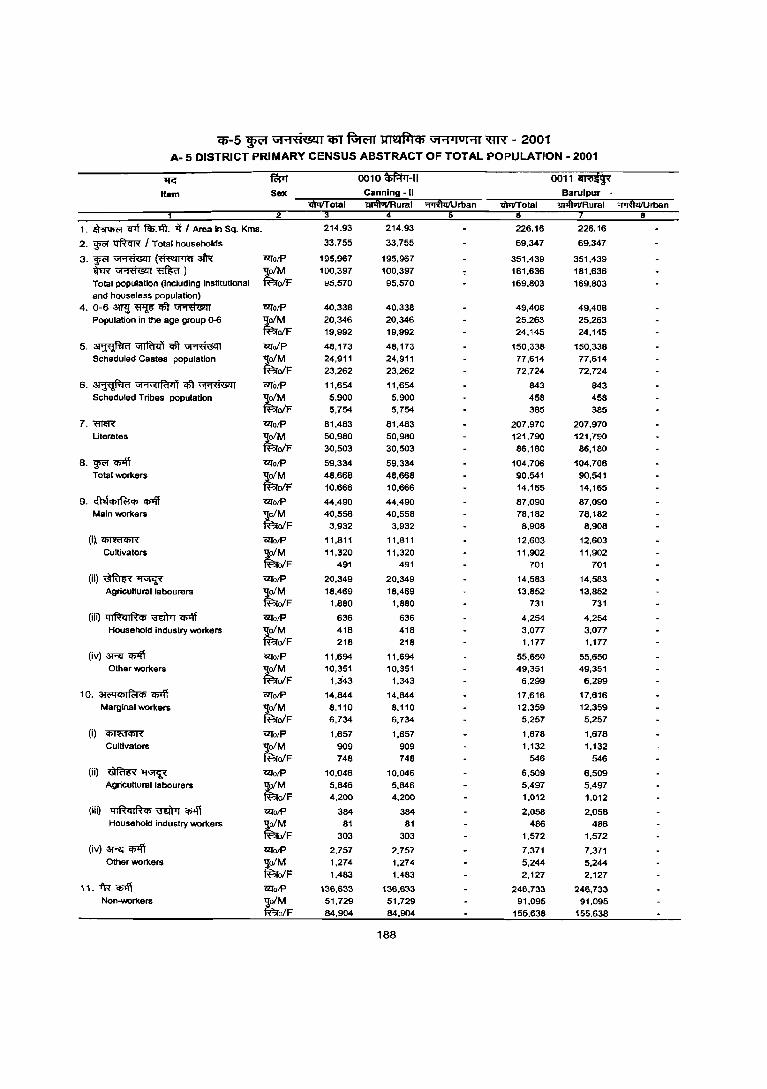
CIi-5 ~ \iF'I'<1i1S4l CIiT ~ l(l24~q; \iFl'lol"1l XfR' - 2001 A- 5 DISTRICT PRIMARY CENSUS ABSTRACT OF TOTAL POPULATION - 2001
lfC:' fRaT 0010 if.I1J-1I 0011 iiiRitiji Item Sex Canning ·11 Barulpur
tWrITotal !IIofluilRural lliofluilRural "'II!fuiIUrban
1. ~ CPt ~.~. -q I Area in Sq. Kms_ 214.93 214.93 226.16 226.16
2. F ~ I Total households 33,755 33,755 69,347 69,347
3. w<" ~ (~ 3l'r-! urolf' 195,967 195,967 351,439 351,439 i)'ER~~) ~M 100,397 100,397 181,636 181,636 Total population (InCluding Institutional o/F lI::1,570 95,570 169,803 169,803 and house less population)
4, 0-6~~"$t~ urolf' 40,338 40,338 49,408 49,408 Population in the age group 0-6 ~M 20,346 20,346 25,263 25.263
oIF 19,992 19,992 24,145 24,145
5.~~"$t~ uro/P 48,173 48,173 150,338 150,338 Scheduled Castes population tM 24,911 24,911 77,614 77,614
oIF 23,262 23,262 72,724 72,724
6. ~ \iI'1utIRllll qll ~ UTolf' 11,654 11,654 843 843 Scheduled Tribes population tM 5,900 5,900 458 458
oIF 5,754 5,754 385 385
7.m~ urolf' 81,483 81,483 207,970 207,970 Literates tM 50,980 50,980 121,790 121,790
oIF 30,503 30,503 86,180 86,180
8. -g;c;r ~ urolf' 59,334 59,334 104,706 104,706 Total wor1<.ers tM 48,668 48,668 90,541 90,541
o/F 10,666 10,666 14,165 14,165
9. G'hhbl~'" CI>1ff urolf' 44,490 44,490 87,090 87,090 Mainwor1<.ers tM 40,558 40,558 78,182 78,182
oIF 3,932 3,932 8,908 8,908
(i~~ UTO/P 11,811 11,811 12,603 12,603 Cultivators tM 11,320 11,320 11,902 11,902
oIF 491 491 701 701
(ii)~~ 12folf' 20,349 20,349 14,583 14,583 Agricultural labourers tM 18,469 18,469 13,852 13,852
oIF 1,880 1,880 731 731
(iii) ql~ql~'" \mTrr "<t>lff UTO/P 636 636 4,254 4,254 Household industry wor1<.ers ~ 418 418 3,077 3,077
oIF 218 218 1,177 1,177
(iv) 3Rr CI>'lT 12fo/P 11,694 11,694 55,650 55,650 Other wor1<.ers tM 10,351 10,351 49,351 49,351
oIF 1,343 1,343 6.299 6,299
10, ;)j(iqchlra", "<t>lff ClIoif' 14,844 14.844 17.616 17.616 Marginal wor1<.ers tM 8,110 8,110 12,359 12,359
oIF 6,734 6.734 5.257 5,257
(i) ~ UTO/P 1,657 1,657 1,678 1,678 Cultivators tM 909 909 1,132 1,132
oIF 748 748 546 546
(ii) ~~ ClIoif' 10.046 10.046 6.509 6.509 Agricultural labourers tM 5.846 5.846 5,497 5.497
oIF 4,200 4,200 1,012 1,012
(iii) q I ~ q I ~ CIS m:ITrr CI>'lT ClIoif' 384 384 2,058 2,058 Household industry wor1<.ers tM 81 81 486 486
oIF 303 303 1.572 1.572
(iv) aR'~ ClIoif' 2.757 2.757 7.371 7.371 Other wor1<.ers tM 1,274 1,274 5,244 5,244
oIF 1,483 1.483 2,127 2,127
1 1 _ -i'R """ ClIotP 136.633 136,633 246,733 246,733 Non-workers tM 51.729 51,729 91.095 91,095
olF 84.904 84.904 155.638 155.638
188

cn-5 ~ \iI""I'fi1&l1 CPT RJ:R;rr JlI2If4Cb \iI""I'lul""I1 "«R - 2001
A- 5 DISTRICT PRIMARY CENSUS ABSTRACT OF TOTAL POPULATION - 2001
11<:' 1Wr 0012~-1I 0013~-1
Item Sex Magrahat -II Magrahat -I
iI)lIffotal iiPfI1lIIRural ~rban il)7Jfi' ota I li11l\QTIRu ral ~rban 3
1. ~ <rtt f<I;.~. it { Area in SQ. Krns. 136.93 135.58 1.35 119.04 119.04
2. ~ ~ I Total households 48.028 46.175 1,853 40,603 40,603
3.~~(~3fR CZ<olf' 262,092 250,901 11,191 228,335 228,335
~~m'60) tM 135.194 129,467 5,727 117,870 117,870
Total population (including institutional ofF 126,898 121,434 5,464 110,465 110,465
and house less population) 4. 0-6 3!l"l] ~ q\1 ~ CiIl"olf' 42,455 40,268 2,187 38,514 38,514
Population in the age group 0-6 tM 21,712 20,588 1,124 19,568 19,568
ofF 20,743 19,680 1,063 18,946 18,946
5.~~<tl~ molp 94,748 94,517 231 49,704 49,704
Scheduled Castes population tM 49,015 48,881 134 25,772 25,772
o/F 45,733 45,636 97 23,932 23,932
6. ~ ",.,\il1f.!<l1 qft ~ CiIl"o/P 59 59 103 103
Scheduled Tribes population tM 31 31 57 57
olF 28 28 46 46
7. 'ffi&l'< CiIl"o/P 147,674 141,858 5,816 127,820 127,820
Literates ~A 88,387 85,051 3,336 76,076 76,076
olF 59,287 56,807 2,480 51,744 51,744
8. F<I?4T CiIl"o/P 75.291 72,196 3,095 66.695 66,695
Total workers 'Jo/M 65,488 62,962 2,526 58,198 58,198
l'F;;ro/F 9,803 9,234 569 8,497 8,497
9. <f1EjCj)If<;tCJ>~ CZ<O/P 61,186 58,627 2,559 51,101 51,101
Main workers tM 65,985 53,594 2,391 46,888 46,888
olF 5,201 5,033 168 4,213 4,213
(i)~ cz<olf' 8,363 8,291 72 5,487 5,487
Cultivators tM 7,999 7,927 72 5,198 5,198
olF 364 364 289 289
(ii)~~ CiIl"o/P 9.871 9.798 73 8,688 8,688
Agricultural labourers tM 9,272 9,204 68 8,197 8,197
olF 599 594 5 491 491
(iii) QIRqlRCI> ~ ~ CiIl"o/P 7,045 6,610 435 5,425 5,425
Household industry workers tM 5,718 5,361 357 4,010 4,010
ofF 1,327 1,249 78 1.415 1,415
(iv) 3RT <I?4T CZ<O/P 35,907 33,928 1.979 31,501 31,501
Other workers tM 32.996 31.102 1,894 29.483 29,483
ofF 2,911 2.826 85 2,018 2,018
10. 3!('llCl>II'&CJ> Cf>lft CiIl"o/P 14,105 13.569 536 15,594 15,594
Marginal workers tM 9,503 9,368 135 11,310 11,310
ofF 4,602 4,201 401 4,284 4,284
(i) ~ C2fO/P 1,368 1,362 6 1,580 1,580 Cultivators tM 892 886 6 1,093 1,093
oIF 476 476 487 487
(ii) ~~ l'ZIO/P 5,601 5,581 20 7,416 7.416
Agricullural labourers tM 4,118 4,109 9 6,036 6,036
ofF 1,483 1,472 11 1,380 1,380
(iii) qlRqlRCJ> \m'rTr q;tff cz<olf' 3,309 2,898 411 1,892 1,892
Household industry workers tM 1,441 1,386 55 700 700
ofF 1,868 1,512 356 1,192 1,192
(iv) 3RT Cf>lft CiIl"O/P 3,827 3,728 99 4,706 4,706
Other workers tM 3,052 2,987 65 3,481 3,481
ofF 775 741 34 1,225 1.225
11. 1'R"CJ>lfi CiIl"O/P 186,801 178,705 8,096 161,640 161,640 Non-workers tM 69,706 66,505 3.201 59,672 59,672
olF 117,095 112,200 4,895 101,9138 101,968
189

cp-5 ~ Gi ... ti€41 COT ~ ~ ;;;1"'1.1° .... 1 ~ - 2001 A· 5 DISTRICT PRIMARY CENSUS ABSTRACT OF TOTAL POPULATION· 2001
11G ~ 0014 lffi.iI(fJ 0015 ~ "iri*-I Item Sex Diamond Harbour .1
<WriTotal lIllflvlIRural "'iiRIiiiu rban 1 2
1. ~ Cf7T fcl>.>lt. if I Area in Sq. Kms. 130.68 130.68 68.43 68.43
2. WR ~ I Total households 44,300 44,300 25,038 25,038
3·WR~(~afR czrQIP 221,695 221,695 133,366 133,366 ~~~) tM 114.232 114,232 69,094 69,094 Total population (including institutional olF 107,'+03 107,463 64,272 64,272 and houseless population)
4. 0-6~~qjT~ czrolP 29,870 29,870 21,541 21,541 Population in the age group 0-6
~ 15,045 15,045 10,917 10,917 ofF 14,825 14,825 10,624 10,624
5.~~qft~ Cllo/P 54.897 54.897 27,048 27.048 Scheduled Castes population tM 28,275 28,275 13,990 13,990
ol_F 26,622 26,622 13,058 13,058
6. ~ "1'"1"111<141 qft ~ czro/P 73 73 133 133 Scheduled Tribes population tM 24 24 50 50
olF 49 49 83 83
7. WIffi( czro/P 137,896 137.896 75.069 75,069 Literates tM 80.588 80,588 44,525 44,525
olF 57,308 57,308 30,544 30,544
8. "¥f CI>lft czro/p 73,047 73,047 38,527 38,527 Total workers "9;o/M 62,463 62,463 34.560 34,560
fB"o/F 10,584 10.584 3,967 3.967
9. ,,"It\ililfC;jili Cf>lfi CllO/P 52,409 52,409 31,364' 31,364 Main workers tM 48,255 48,255 29,296 29,296
olF 4,154 4,154 2,068 2,068
(i)~ CZfO/P 5,931 5,931 2,904 2,904 Cultivators "9;o/M 5,630 5,630 2,762 2,762
fBo/F 301 301 142 142
(ii)~~ ClfO/P 10,725 10,725 6,385 6,385 Agricultural labourers. ~M 10.222 10,222 6,198 6,198
olF 503 503 187 187
(iii) Q IR ell R '" ifflTrr CI>lft Clf'olP 4,308 4,308 1,487 1,487 Household industry workers lJo/M 3,193 3,193 1,175 1,175
~ofF 1,115 1,115 312 312
(iv) ~ CI>lft Clf'olP 31,445 31,445 20,588 20,586 Other workers tM 29,210 29,210 19,161 19,161
olF 2,235 2,235 1,427 1,427
10, 3l;;;tlililfC;jili 'iji1ff «:roiP 20,638 20,638 7,163 7,163 Marginal workers tM 14,208 14,208 5,264 5,264
olF 6,430 6,430 1,899 1,899
(i) ~ ~olP 1,628 1,828 577 577 Cultivators tM 1,302 1,302 383 383
ofF 526 526 194 194
(ii) ~~ "QToiP 12,038 12,038 3,823 3,823 Agricultural labourers tM 6,839 6,839 3,097 3,097
ofF 3,199 3,199 726 726
(iii) qlRqlR<I> ~ CI>lft "QTo/P 2,089 2,089 607 607 Household industry workers tM 726 726 137 137
olF 1,363 1,363 470 470
(iv) ~ CI>lft 'CLfoiP 4,683 4,683 2,156 2,156 Other workers tM 3,341 3,341 1,647 1.647
olF 1,342 1,342 509 509
11. ~q;>jl 'CLfO/P 148,648 146,648 94,839 94,839 Non-worke rs tM 51,769 51,769 34,534 34,534
olF 96,879 96,679 60,305 60,305
190

cp-5 ~ Gt .... ti&ll <liT mr ~ Gt ..... lul ..... ~ - 2001 A· 5 DISTRICT PRIMARY CENSUS ABSTRACT OF TOTAL POPULATION· 2001
'11<:' ~ 0016 ~ iJf.i-1I 0017 Wiiift Item Sex
1 3
1. ~ cpt f<n.lfi. ij I Area In Sq. Kms. 95.59 95.59 210.83 210,83
2. w<'f "Q'ftcrff ! Total households 32.124 32.124 44.923 44.923
3. w<'f ~ (~ afR CllOlP 165.233 165.233 242.752 242.752 ~~~)
tM 84.722 84.722 124.836 124.836
Total population (Including institutional olF 80.511 80.511 117.916 117.916 and houseless population)
4. 0-5 3ml ~ ctT ~ CllotP 24.306 24.306 39.852 39.852 Population in the age group 0-6 '9;ofM 12.428 12,428 20,196 20,196
~ofF 11,878 11,878 19,656 19,656
5.~~~~ "&l"o/p 44,709 44,709 77,380 77,380 Scheduled Castes population ~M 22.776 22.776 39,915 39.915
ofF 21,933 21,933 37,465 37,465
6. ~ "I'i"lIRllll ctT ~ "&l"otP 267 267 141 141 Scheduled Tribes population
tM 122 122 88 88
ofF 145 145 53 53
7.~ "&l"otP 99,705 99,705 137,444 137,444 Literates
tM 57,499 57,499 82,823 82.823
ofF 42,206 42,206 54,621 54,621
8.~~ "&l"o/P 49,607 49,607 71,475 71,475 Total workers ;tM 43,761 43,761 63,473 63,473
olF 5,846 5,846 8,002 8,002
9. cflticlil~Cb ~ WotP 36,574 36,574 48,419 48,419 Main workers
tM 33,666 33,666 45,040 45,040
olF 2,908 2,908 3,379 3,379
(i)~ CZ1'o/P 3,322 3,322 5,972 5,972 Cultivators '9;ofM 3,150 3.150 5,759 5,759
fBrofF 172 172 213 213
(ii)~~ U[O/P 6,849 6,849 10,141 10,141 Agricultural labourers '9;ofM 6,674 6,674 10,051 10,051
fBro/F 175 175 90 90
(iii) ql~ql~Cb ~ ~ U[o/p 1,536 1,538 2,283 2,283 Household industry workers ;tM 1,167 1,167 1,662 1,662
olF 371 371 621 621
(iv) 3RI' "Cb"4'i U[O/P 24,865 24,865 30,023 30,023 Other workers
tM 22,675 22,675 27,568 27,568 ofF 2,190 2.190 2,455 2,455
10. <i{iiQCbIfc>iCb ~ U[O/P 13,033 13,033 23,056 23,056 Marginal workers
tM 10,095 10,095 18,433 18,433
ofF 2,938 2,938 4,623 4,623
(i) 'CbPffiCb'T'(' U[O/P 936 936 2,800 2,600 Cultivators
tM 723 723 2,137 2,137
oIF 213 213 663 663
(ii) ~~ (;QotP 7.362 7,362 13.068 13,068 Agricultural labourers
tM 6,237 6,237 11,987 11,987
oIF 1,125 1,125 1,061 1,081
(iiG qIRql~Cb~~ WotP 754 754 1,305 1,305 Household industry workers
tM 268 268 331 331
olF 4B6 486 974 974
(iv) 3RI' ~ WO/P 3,9Bl 3,981 5,883 5,883 Other workers ',!o/M 2,B67 2,867 3,978 3,978
fBIolF 1.114 1,114 1,905 1,905
11.1R~ (;QO/P 115,626 115,626 171,277 171,277 Non-workers
tM 40,961 40,961 61,363 61,363
olF 74,665 74,665 109,914 109,914
191

Cf)"-5 ~ \Jf"'1'<1'Lc2l1 em ~ ~121flli6 \Jf"'1~IUHI ~ - 2001 A- 5 DISTRICT PRIMARY CENSUS ABSTRACT OF TOTAL POPULATION· 2001
~ ~ 0018 'tRl'lilMI'I 0019~-1
Item Sex Mathurapur - I iII1ftUJjRural :;;p;;ftiiilJrban
1 , ~ <f'f f<t;,;ft, Tf I Nea in Sq, Kms. 118.07 118.07 147.30 147.30
2. g>"C'! ~ I Total households 33,640 33,640 30,166 30,166
3.~~(~aI'R ellaif' 183,131 183,131 164,650 164,650 <hR~~) tM 94.620 94,620 84,894 84,894 Total population (including institutional ofF 88.511 88.511 79.756 79.756 and houseless population)
4. 0-6 amj ~ <1ft ~ ellaif' 29,630 29,630 28,857 28,857 Population in the age group 0-6 t;M 15,193 15,193 14,511 14,511
ofF 14,437 14,437 14.346 14.346
5. ~ vrrfffifi c6'I ~ ellofP 79,504 79,504 60,904 60,904 Scheduled Castes population t;M 41,197 41,197 31,685 31,685
ofF 38,307 38,307 29,219 29.219
6. ~ VI'1VJlf<'I4'i qft ~ ella/P 274 274 589 589 Scheduled Tribes population t;M 143 143 317 317
ofF 131 131 272 272
7. W&R ellOlP 101,290 101,290 88.820 88,820 literates tM 61,818 61,818 54,461 54,461
ofF 39,472 39,472 34,359 34,359
8. W<'f q;zft '&fOlP 55,844 55.844 45.586 45,586 Total workers tM 46,466 46,466 41.123 41,123
olF 9,378 9.378 4,463 4,463
9. cn>iCflI~C(j <l>'ff 12Io/P 41.103 41,103 31,443 31.443 Main workers tM 36.904 36.904 29.082 29.082
olF 4.199 4.199 2,361 2.361
(i)~ 12IotP 4,080 4,080 4,430 4,430
Cultivators tM 3.753 3,753 4,324 4,324
ofF 327 327 106 106
(ii)~~ 12Io/P 6.522 6,522 7.459 7,459 A9ricultural labourers tM 6,363 6.363 7.341 7,341
olF 159 159 118 118
(iii) QI~cH~<b ~ cn4T <l101P 1,819 1,819 1,947 1,947 Household Ind ustry workers tM 1.163 1,163 1.427 1,427
ofF 656 656 520 520
(iv) 3Rl~ <ZIOIP 28,662 26,682 17,607 17,607 Other WOrkers tM 25,625 25.625 15,990 15,990
ofF 3,057 3,057 1,617 1,617
10. at<'llCflIi'cl<b q;zft <ZIo/P 14,74', 14.741 14,143 14,143
Marginal WOrkers l:!oIM 9.562 9,562 12,041 12,041
~o/F 5,179 5.179 2,102 2,102
(i) ~ <l1G1P 1,949 1,949 1,456 1.458 CultiVators tM 1,210 1,210 1.324 1,324
olF 739 739 134 134
(ii) ~~ i210/P 6.602 6.602 7.956 7.956 Agricultural labourers ;tM 5,118 5,118 7.552 7.552
ofF 1,484 1,484 404 404
(iii) 41~ql~¢~~ 12Io/P 2.024 2,024 1,036 1.036 Household industry workers tM 472 472 341 341
olF 1.552 1.552 695 695
(iv) 3fi'll <l>'ff ellotP 4,166 4,166 3,693 3,693 Other workers tM 2,762 2,762 2,824 2,824
ofF 1.404 1,404 869 869
11,-IR~ ellO/P 127.287 127.267 119,064 119,064 Non-workers tM 48.154 48.154 43,771 43.771
ofF 79,133 79,133 75,293 75,293
192

Cf)-5 ~ utOOJ'<1'Lc:tIl C6T ~ ~ ut ..... luIOOJI ~ - 2001
A- 5 DISTRICT PRIMARY CENSUS ABSTRACT OF TOTAL POPULATION - 2001
11'G ~ oo20~-1 0021 ~-II
Item Sex Jaynagar -I Jaynagar-Il riIillUIi'Rural "iililliITIRural 'iliTfui/Urban
1. ~ <f1f fII;. -.ft. ~ I Area In Sq. Kms. 131.01 129.91 1.10 186.25 186.25
2. ~ ~ I Total households 40.830 39,878 952 36,280 36,280
3. ~ ~ (~a1'R" C2lotP 219,090 214,026 p,064 209,145 209,145 W~~) tM 113,352 110,696 2,656 108,294 108,294 Total popLllation (including institutional ofF 105,738 103,330 2,408 100,851 100,851 and house less population)
4. 0-6 3!l<l ~ <1ft ~ C2WP 35,101 34,468 633 38,463 38,463 Population in the age group 0-6 tM 17,865 17,546 319 19,654 19,654
ofF 17,236 16,922 314 18,809 18,809
5. ~ iJfIfc1<il ql't ~ C2lo/P 89,739 89,256 483 76.761 76.761 Scheduled Casles population tM 46,773 46,518 255 39,849 39,849
ofF 42,966 42,738 228 36,912 36,912
6. ~ ""\GIIR\1I1 ~ ~ ~O/P 145 145 974 974 Scheduled Tribes population tM 74 74 537 537
ofF 71 71 437 437
7. WIff'{ OQO/P 121,005 117,653 3,352 101,098 101.098 literates ~M 73,592 71,655 1,937 63,888 63,688
ofF 47,413 45,998 1,415 37,210 37,210
8. ~ CJ>1ft OQotP 67,394 65,748 1,646 67,856 67,856 Total workers tM 55,917 54.512 1,405 53.337 53,337
ofF 11,477 11,236 241 14,519 14,519
9. c:tl eiCb I R:t41 CJ>1ft OQo/p 52,939 51,502 1,437 48,528 48,528 Main workers :Jo/M 46,469 45,173 1,296 43,38r. 43,386
fBro/F 6,470 6,329 141 5,142 5,142
(i)~ CLJOIP 6,625 6,620 5 9,175 9,175 Cultivators ~M 6,117 6,113 4 8,614 8,614
ofF 508 507 561 561
(ii)~~ CLJo/p 9,500 9,456 44 15,663 15,663 Agricultural labourers ~M 9,008 8,967 41 15,118 15,118
ofF 492 489 3 545 545
(iii) QI~ql~41 'i3EIrrr 'q)Jff C2lo/P 2,971 2,873 98 4,284 4,284 Household industry WOrkers ~M 1,814 1,758 56 2,253 2,253
ofF 1,157 1,115 42 2,031 2,031
(iv) aRr~ OQo/p 33,843 32,553 1.290 19,406 19,406 Other workers ~M 29,530 28,335 1,195 17,401 17,401
ofF 4.313 4,216 95 2.005 2,005
10. 3l@lCbIf<;tCf> 'q)Jff C2lotP 14.455 14,246 209 19,328 19,328 Marginal workers tM 9,448 9,339 109 9,951 9,951
ofF 5,007 4,907 100 9,377 9.377
(i) ~ CZ!o/p 1,020 1,014 6 2,512 2,512 Cultivators tM 711 706 5 1,271 1,271
ofF 309 308 1,241 1,241
(iQ ~~ CZ!oIP 5,138 5,119 19 9.348 9,348 Agricultural labourers tM 3,859 3,844 15 5,790 5,790
ofF 1,279 1,275 4 3,558 3,558
(iii) QI~ql~41 'i3EIrrr ~ ~oIP 2,139 2,084 55 3,535 3,535 Household industry workers ;(M 563 549 14 642 642
ofF 1,576 1,535 41 2,893 2.893
(iv) aRr ct>4T ~otP 6,158 6,029 129 3,933 3,933 Other workers ~M 4,315 4,240 75 2,248 2,248
ofF 1,843 1,789 54 1,685 1,685
11. "'r< ct>4T OQotP 151,696 148,278 3,418 141,289 141,289 Non-workers ~M 57,435 56.184 1,251 54,957 54,957
ofF 94,261 92,094 2,167 86,332 86,332
193
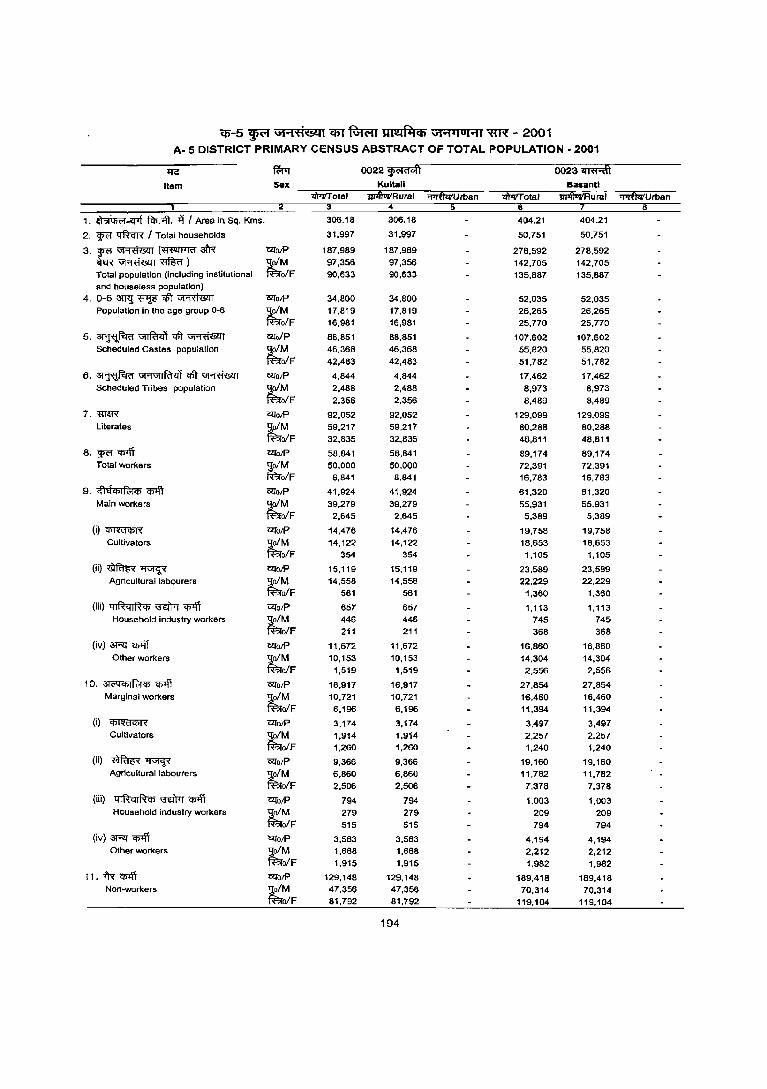
(1)-5 ~ \i1"'1fl'Lcql <liT ~ 1IM~Cf) \11.,4101"11 ~ - 2001 A- 5 DISTRICT PRIMARY CENSUS ABSTRACT OF TOTAL POPULATION - 2001
1N ~ oo22~ 0023 iffir.dt Item Sex Kultall Sasantl
>ir>V'Total ul410llRural "Pl'fIwUtban >iPllTotal lllolloilRural ~tb .. n 3 4 6
1. ~-CJ1t f<I>. -.fi. 1) / Area in SQ. Kms. 306.16 306.16 404.21 404.21
2. ¥ ~ I Total households 31,997 31,997 50,751 50,751
3. ~ ~ (~3ft:< tlTolP 187,989 187,989 278,592 278.592 ~~~) ~M 97,356 97,356 142,705 142,705 Total population (including institutional ofF 90,633 90,633 135,887 135,687 and houseless population)
4. 0-6 am]; ~ qfr ~ tlTolP 34,800 34,800 52,035 52,035 Population in the age group 0-6 ~M 17,819 17,819 26,265 26,265
ofF 16,981 16,981 25,770 25,770
5.~~qfr~ tlToiP 88,851 88,851 107,602 107,602 Scheduled Castes population
tM 46.368 46,368 55,820 55,820
ofF 42,483 42,483 51,782 51,782
6. ~ "I'1"1IRttff ~ ~ tlTo/P 4,844 4,844 17,462 17,462 Scheduled Tribes population ~M 2,488 2,488 8,973 8,973
ofF 2,356 2,356 8,489 8,489
7.mm G!lo/P 92,052 92,052 129,099 129,099 Literates
tM 59,217 59,217 80,288 80,288
ofF 32,835 32,835 48,811 48,811
8.¥<lJll'i G!lOJP 58,841 58,841 69,174 89,174 Total workers ~M 50,000 50,000 72,391 72,391
olF 8,841 8,841 16,763 16,783
9. c;"hiCf)l~iji '1P'ff t!To/P 41,924 41,924 61,320 61,320 Main workers
tM 39,279 39,279 55.931 55,931
ofF 2,645 2,645 5,369 5,389
(i)~ t!TOJP 14,476 14,476 19,756 19,758 Cultivators ~M 14,122 14,122 18,653 16,653
olF 354 354 1,105 1,105
(ii)~~ G!lolP 15,119 15,119 23,589 23,569 Agricultural labourers ~M 14,556 14,556 22,229 22,229
olF 561 561 1,360 1,360
(iii) ql~ql~iji ~ ~ <2!o/P 657 657 1,113 1,113 Household industry workers
tM 446 446 745 745
ofF 211 211 368 368
(iv) 3R[ cn4f t!TolP 11,672 11,672 16,860 16,860 Other worke rs t];ofM 10,153 10,153 14,304 14,304
fFAofF 1,519 1,519 2,556 2,556
10. aJ<"'ICf)Ifc:!iji Cfil\1 <2!o/P 16,917 16,917 27,854 27,854 Marginal workers
tM 10,721 10,721 16,460 16,460
ofF 6,196 6,196 11,394 11.394
(i) ~ t!TO/P 3,174 3,174 3,497 3,497 Cultivators
tM 1,914 1,914 2,257 2,257
ofF 1.260 1,260 1,240 1,240
(ii) ~~ <2!o/P 9,366 9,366 19,160 19,160 Agricultural labourers
tM 6,860 6,860 11,782 11,762
olF 2,506 2,506 7,378 7,378
(iii) ql~ql~iji ~ Cfilfi t!To/p 794 794 1,003 1,003 HOusehold industry workers
~ 279 279 209 209 ofF 515 515 794 794
(iv)~~ <2!oiP 3,583 3,583 4,194 4,194 Other workers ~M 1,668 1,668 2,212 2,212
ofF 1,915 1,915 1,982 1.982
11. <"R" '1l>lfi ~oiP 129,148 129,148 169,418 189,416 Non-workers tM 47,356 47,356 70,314 70,314
ofF 81,792 81,792 119,104 119 .. 104
194
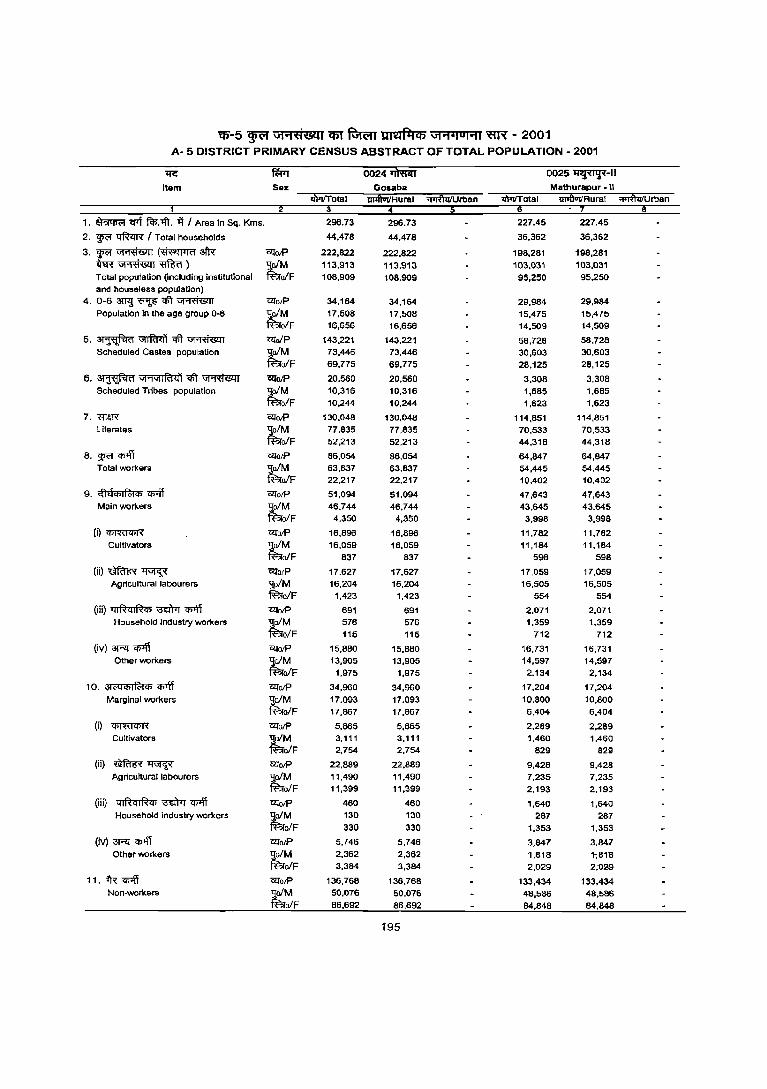
~-5 ~ \iI"'f't1'<!41 em Rm>rr U"r.IJIli<b \iI"'f'IOi"'fi "ffR - 2001 A- 5 DISTRICT PRIMARY CENSUS ABSTRACT OF TOTAL POPULATION - 2001
~ ~ 0024l'ftmj 0025~-1I
Itam Sax Gosaba Mathurapur • \I 1iiiiI'Totai 'IiJiIiViIRural :;r;JfuiflJrtlan >II'IfT otal 1iiiftUiIRurai "'ITifui/Urtlan
1. ~ crt fiV.lfi. if I Area in Sq. Kms. 296.73 296.73 227.45 227.45
2. ~ ~ I Total households 44,478 44,478 36,362 36,362
3.~~(~$ <lIoR 222,822 222,822 198,281 198,281 ~~~) ~
113,913 113,913 103,031 103,031 Tolal population (including institutional ofF 108,909 108,909 95,250 95,250 and houseless population)
4. 0-6~~c6'r~ <lIo/p 34,164 34,164 29.984 29.984 Population in the age group 0-6 ~M 17,SOa H,S08 15,47S lS,47S
olF 16,656 16,656 14,509 14,509
5.~~c6'r~ <lIoIP 143,221 143,221 58,728 58,728 Scheduled Castes population tM 73,446 73,446 30,603 30,603
ofF 69,775 69,775 28,125 28,125
6. ~ vt.,vtlftlll) c6'r ~ ~O/P 20,560 20,560 3,308 3,308 Scheduled Tribes population tM 10,316 10,316 1,685 1,685
olF 10,244 10,244 1,623 1,623
7. maR <lIoR 130,048 130,04B 114,B51 114,851 Literates tM 77,835 77.835 70,533 70,533
ofF 52,213 52.213 44,31B 44,318
8. ~ CfJIff OlTO/P 86,054 86,054 64,847 64,847 Total workers tM 63,837 63,837 54,445 54,445
ofF 22,217 22.2H 10,402 10,402
9. <fhIC!> I Ft:t Ifi CfJIff 12folP 51,094 51,094 47,643 47,643 Main workers tM 46.744 46,744 43.645 43.645
ofF 4,350 4,350 3,998 3,998
(O~ <lIo/p 16,896 16,896 11,782 11,782 Cultivators ~ofM 16,059 16,059 11,184 11,184
~ofF 837 837 598 598
(ii)~~ <lIo/P 17,627 17,627 17.059 17.059 Agricultural labourers ~ofM 16,204 16,204 16,505 16,505
~ofF 1,423 1,423 554 554
(iii) ql~"I~C!> m::frrr 'I>'ff c;qO/P 691 691 2,071 2,071 Household industry workers tM 576 576 1,359 1,359
ofF 115 115 712 712
(iv) 3f"!I <P'ff c;qolP 15,880 15,BBO 16,731 16,731 Other workers tM 13,905 13,905 14,597 14,597
ofF 1,975 1,975 2.134 2,134
10. 91<'4<l>IFt:tc!> CfJIff c;qolP 34,960 34,960 17,204 17,204 Marginal workers tM 17,093 17,093 10,800 10,800
ofF 17,867 17,867 6.404 6,404
(i) q;mrcpf{ c;qolP 5,865 5,865 2,289 2,289 Cultivators tM 3, 11 I 3,111 1,460 1,460
ofF 2,754 2,754 829 829
(ii) ~~ CIfO/P 22,889 22,889 9,428 9,428 Agricultural labourers tM 11,490 11,490 7,235 7.235
o/F 11,399 11,399 2,193 2,193
(iii) ql~ql~c!> ~ <P'ff 1:lIo/P 460 460 1,640 1,640 Household industry workers tM 130 130 287 287
ofF 330 330 1,353 1,353
(iv) 3Rl Cf>lff ClI0/P 5,746 5,746 3,847 3,84.7 Other workers tM 2,362 2,362 1,818 1~8"8
ofF 3,384 3,384 2,029 2,llgs
11. ~ CfJIff CIfolP 136,768 136,768 133,434 133,434 Non-workers tM 50,076 50,076 48,586 48,586
ofF 86,692 86.692 84,848 84,848
195

'(5-5 ~ \i1'1ti't.411 Cffi ~ Jrn@:rcp \i1'1 J I 01'11 ~ - 2001 A- 5 DISTRICT PRIMARY CENSUS ABSTRACT OF TOTAL POPULATION - 2001
'If<: ~ 0026 iIiTi5ift"q 0027 "IDTR
Item Sex Kakdwlp Sagar 'liItlITotal ~Rufal ~Rural 'I',fl""Urban
4 8
1. ~ cr>t f~At .,'f I Area in Sq. Kms. 252.74 252.74 282.11 282.11
2. ~ ~ I Total households 44,796 44,796 31,461 31,461
3. w<'I ~ (~ 3l'R" U/O/P 239,326 239,226 185.644 185,644 ~~~)
t;M 122,815 122,815 95,547 95,547
Total population (including institutional olF 116,511 116.511 90,097 90,097 and houseles5 population)
4. 0-6 3ITg~'1J!t~ U/o/P 37.424 37,424 28.987 28.987 Population in the age group 0-6
t;M 19,098 19,098 14,771 14,771
ofF 18,326 18.326 14,216 14.216
5. ~ \J!"rfu<ii qft ~ U/ofP 86,042 86,042 51,588 51,588 Scheduled Castes population
tM 44,404 44,404 26,543 26,543
ofF 41,638 41,638 25,045 25.045
6. ~v('1"'IRl4'jqft~ U/O/P 1,941 1,941 691 691 Scheduled Tribes population
tM 1,028 1.028 383 383
ofF 913 913 308 308
7. W&R i'21'O/P 142,393 142.393 121.982 121.982 Literates
tM 84,412 84.412 71.051 71.051
ofF 57.981 57,981 50,931 50,931
8.~~ Cll'otP 83,532 83.532 75.295 75.295 Total workers
tM 64,614 64,614 50,371 50,371
ofF 18,918 18,918 24,924 24,924
9. <ft1li'f>1~<t>"<t>"Il'i Cll'otP 56,103 56,103 43,099 43,099 Main workers 1];ofM 50,836 50.836 39,040 39,040
lBo/F 5,267 5.267 4,059 4,059
(i)~ Cll'o/P 11,737 11,737 15,656 15,656 Cultivators
tM 10,742 10.742 14.371 14,371
ofF 995 995 1.285 1,285
(ii)~~ i'21'O/P 14,684 14,684 13,238 13.238 Agricultural labourers
tM 14,057 14.057 12,174 12.174
ofF 627 627 1,064 1,064
(iii) 4IRqIRq; ~ ~ Cll'O/P 1,610 1,610 740 740 Household industry workers ~M 973 973 523 523
ofF 631 637 217 217
(iv) 3RT 'I>'ff Cll'o/P 28,072 28.072 13,465 13,465 Other workers
tM 25,064 25,064 11,972 11,972
ofF 3,008 3.008 1,493 1,493
10. 3!('qq;I~q; 'I>'ff Cll'otP 27,429 27.429 32,196 32.196 Ma rginal workers ~M 13,778 13.718 11,331 11.331
ofF 13,651 13,651 20,865 20.865
(i) ~ Cll'O/P 5,752 5.752 12,346 12.346 Cultivators ~M 2,557 2,557 3,577 3,577
ofF 3,195 3.195 8,769 8,769
(ii) ~~ '1Zl0/P 12,314 12,314 14,443 14.443 Agricultural labourers
tM 7,563 7.563 5.855 5.855
ofF 4,751 4,751 8,588 8,588 (iii) QIRqIRi'f> \ffiTtJ <Ii'Iff '1Zlo/P 2,691 2.691 697 697
Household industry workers ~M 481 481 114 114 ofF 2,210 2,210 583 583
(iv) 3RT 'I>'ff Cll'o/P 6,672 6.672 4,710 4,710 Other workers
tM 3,177 3.177 1,785 1,785
ofF 3,495 3.495 2.925 2,925
11,1'R~ 12tO/P 155,794 155,794 110,349 110.349 Non-workers
tM 58,201 58,201 45.176 45.176
ofF 97,593 97.593 65.173 65,173
196
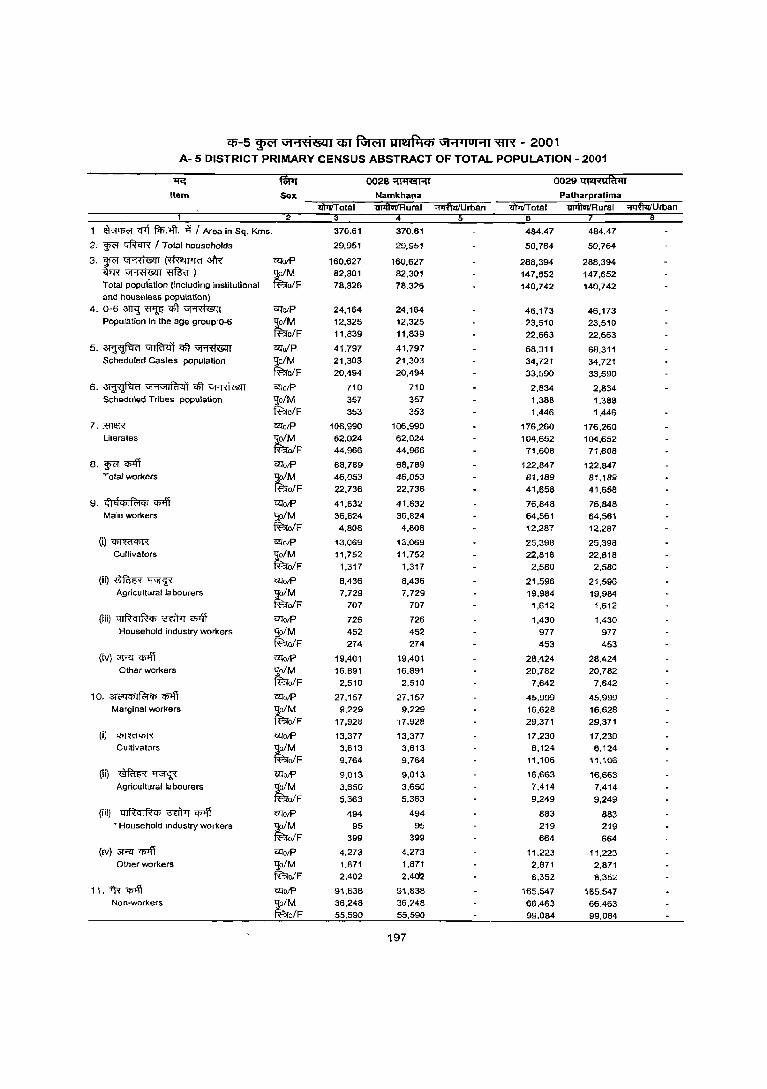
en-S ~ U1"i~iLc<ln em ~ ~ U1"i'IUI"i1 XJR - 2001 A- 5 DISTRICT PRIMARY CENSUS ABSTRACT OF TOTAL POPULATION - 2001
1'(G ~ 0028~ 0029 QI2(~aRiI{I Item Sex Namkhana Patharpratima
1JI1ftvTtRurai "1"l'fuIIU man m.vTotal 1JI1ftvTtRurai ~rban 1 4 6
~ Cf1f f$.4t. if I Area in Sq. Kms. 370.61 370.61 484.47 484.47
2. ~ ~ / Total households 29,951 29,951 50,764 50,764
3.~~~31'R" "lOlP 160,627 160,627 288,394 288,394 ~~~) 'lo/M 82,301 82,301 147,652 147,652 Total population (including institutional fF.;'ofF 78,326 78,326 140,742 140,742 and houseless population)
4. 0-6 3TTll ~ ~ ~ "lo/P 24,164 24,164 46,173 46,113 Population in the age group'O-6
tM 12,325 12,325 23,510 23,510
ofF 11,839 11,839 22,663 22,663
5,~~<il1~ "lolP 41,797 41,797 68,311 68,311 Scheduled Castes population jtM 21,303 21,303 34,721 34,721
ofF 20,494 20,494 33,590 33,590
6. ~~ V1'1V1IRi<l'i ~ ~ <;qo/P 710 710 2,834 2,834 Scheduled Tribes popUlation 'lo/M 357 357 1,388 1,388
fF.;'ofF 353 353 1,446 1,446
7. :m1lR "lo/P 106,990 106,990 176,260 176,260 Literates
~ 62,024 62,024 104,652 104,652 o/F 44,966 44,966 71,608 71,608
8. ~ q;<fi <;qotP 68,789 68,789 122,847 122,847 Total workers
tM 46,053 46.053 81,189 81,189
ofF 22,736 22,736 41,658 41,658
9. ~ ,.jiOPlf{;tC/l q;<fi "lotP 41,632 41,632 76,848 76,848 Main workers ~o/M 36,824 36,824 64,561 64,561
fB!o/F 4,808 4,808 12,287 12,287
(i)~ <;qO/P 13,069 13,069 25,398 25,398 Cultivators
~ 11,752 11,752 22,818 22,818 olF 1,317 1,317 2,580 2,580
(Ii) ~1O'f q\if~ <;qotP 8,436 8,436 21,596 21,596 A9ricultural labourers
tM 7,729 7,729 19,984 19,984
ofF 707 707 1,612 1,612
(iii) QIRcIiRC/l ~ <I>4T <;qO/P 726 726 1,430 1,430 Household industry workers ~o/M 452 452 977 977
~o/F 274 274 453 453
(ivl 3Rf <i>'11 ajoR 19.401 19,401 28.424 28.424 Other workers ~M 16,891 16,891 20,782 20,782
ofF 2,510 2,510 7,642 7,642
10. <Il<"l1'f)IR:i4> q;<fi <;qO/P 27,157 27,157 45,999 45,999 Marginal workers ~M 9,229 9,229 16,628 16,628
ofF 17,928 17,928 29,371 29,371
(il ~ <;qO/P 13,377 13,377 17,230 17,230 Cultivators
;tM 3,613 3,613 6,124 6,124 ofF 9,764 9,764 11,106 11,106
(iil ~~ mO/P 9,013 9,013 16,663 16,663 Agricultural labourers
tM 3,650 3,650 7.414 7,414
olF 5,363 5,363 9,249 9,249
(iii) QIRqlRiOP \3El"r1 ~ motP 494 494 883 883 • Household Industry workers
tM 95 95 219 219
olF 399 399 664 664
(IV)~'1J>lff <;qotP 4.273 4,273 11,223 11,223 Other workers -go/M 1.871 1.871 2,871 2,871
~ofF 2,402 2,40'2 8,352 8,352
11.TR~ <;qO/P 91,838 91,838 165,547 165,547 Non-workers ~M 36,248 36,248 66,463 66,463
olF 55,590 55,590 99,084 99,084
197
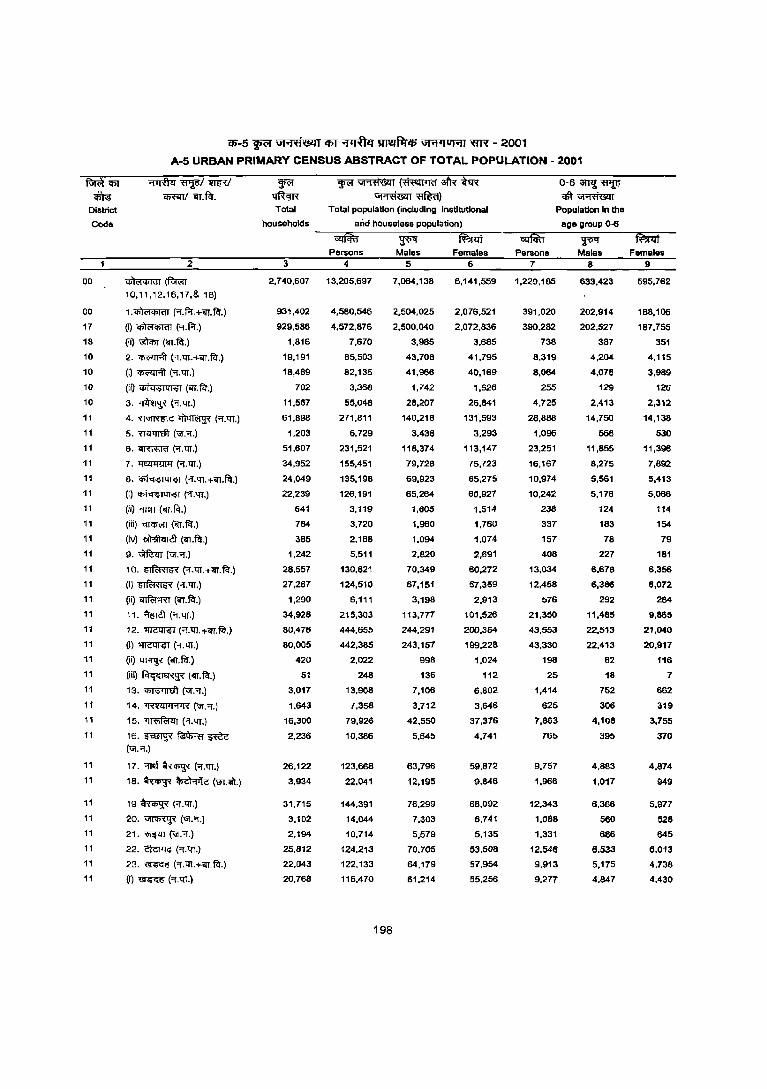
Rii"itQ>l
• District
Code
00
00
17
18
10
10
10
10
11
11
11
11
11
11
11
11
11
11
11
11
11
11
11
11
11
11
11
11
11
11
11
11
11
11
11
11
11
11
'15-5 wc;r \Jl"1tiiBilll <m ~ ~ W"IUJ"1t "ffR - 2001
A-5 URBAN PRIMARY CENSUS ABSTRACT OF TOTAL POPULATION - 2001
2
~(~ 10,11,12,16,17,& 18)
1.~ (or.f.J.HT.flt)
(~ ~ (Of.F-r.)
~i)~(~.~.)
2. ~ ("'I.1:ll.+"i!l.~.)
(i) ~ ("'{.tIT.]
(ii) i'liiq;;;IQI<$1 (;;rr.~.)
3.~("'I.'ll.)
4. ~ ~ ("'{.tIT.)
5. m!1JT9t ('iJ."'f.)
6. iI"T<ffiRf (or.'lT.)
7. ~("'f.tIT.)
8. Q;lq'$141'$1 ('l.'IT.+<Il.FcI.)
(I) ",i'<l'\lIQ I;;; 1 ("'{.'IT.)
(ii) 'llm (iIT. t<r.) (iii)~«U.f.'I'.)
(Iv) ~ (qr.ftn
9. ~(Ur."'f.)
10. ~ (1.'IT.+qr.~.)
(ll~("'{.tIT.)
Qi)~(~.~.)
11. ~ (or.tIT.]
12. ~ (or.tn.+"ifT.~.)
(I) ~ (Of.1:ll.)
(ii)~{~.~.)
(iii) FcI"C:I>Ng'< (<II.ftl.)
13'~{'Vr.)
14. '1~~'"'1'1'I~ (Ur."'f.)
15. ~ ("'I.tIT.)
16.~~~ (\iI."'I.)
17. ~ ~ (Of.tIT.)
18. ~ ~ (m.iIr.)
19 ~ (Of.lIT.)
20. ~ ("GI.or.)
21.~('iJ3.)
22. ~ (or. tn.)
23. ~ (Of.1lT.+qr.~.)
(I) ~ (or. tIT.)
'¥I ~ Total
households
3
2,740,607
931,402
929,586
1,816
19,191
18,489
702
11,567
61,898
1,203
51,607
34,952
24,049
22,239
641
764
385
1,242
28,557
27,267
1,290
34,928
80,476
80,005
420
51
3,017
1,643
16,300
2,236
26,122
3,934
31,715
3,102
2,194
25,B12
22.043
20,768
'¥I~~£f£R ~~
Total population (Including Institutional
and houseless population)
Persons 4
13,205,697
4,580,546
4,572,876
7,670
85,503
82,135
3,368
55,048
271,811
6,729
231,521
155,451
135,198
126,191
3,119
3,720
2.168
5,511
130,621
124,510
6,111
215,303
444,655
442,385
2,022
248
13,908
7,358
79,926
10,386
123,668
22,041
144,391
14,044
10,714
124,213
122.133
116,470
198
~ Males
5
7,064,138
2,504,025
2,500.040
3,985
43.708
41,966
1,742
28.207
140.218
3.436
118.374
79.728
69.923
65,264
1,605
1.960
1.094
2,820
70.349
67,151
3,198
113,777
244,291
243.157
998
136
7,106
3,712
42,550
5,645
63,796
12,195
76,299
7,303
5,579
70.705
64.179
61.214
Females 6
6,141,559
2,076,521
2.072.836
3.685
41,795
40,169
1,626
26,841
131,593
3,293
113,147
75.723
65,275
60,927
1,514
1,760
1,074
2,691
60,272
57,359
2,913
101,526
200,364
199,228
1,024
112
6,802
3,646
31,376
4,741
59.872
9,846
68.092
6,741
5.135
53.508
57.964
55.256
0-6~~ qft~
Population in the
age group Q..6
Persons 7
1,229,185
391,020
390.282
738
8.319
8,064
255
4.725
28,888
1.096
23.251
16.167
10,974
10,242
238
337
157
408
13,034
12,458
576
21,350
43,553
43.330
198
25
1,414
625
7,863
765
9.757
1,966
12,343
1,088
1,331
12.546
9.913
9.277
~ Males
8
633,423
202,914
202.527
387
4,204
4,075
129
2,413
14,750
566
11,855
8,275
5.561
5.176
124
183
78
227
6,678
6,386
292
11,485
22,513
22.413
B2
18
752
306
4,108
395
4,883
1,017
6,366
560
686
6.533
5,175
4.847
Female. 9
595,762
188,106
187,755
351
4,115
3,989
126
2,312
14,138
530
11,396
7,892
5,413
5,066
114
164
79
181
6,356
6,072
284
9,865
21,040
20.917
116
7
662
319
3,755
370
4,874
949
5,977
528
645
6.013
4.738
4.430
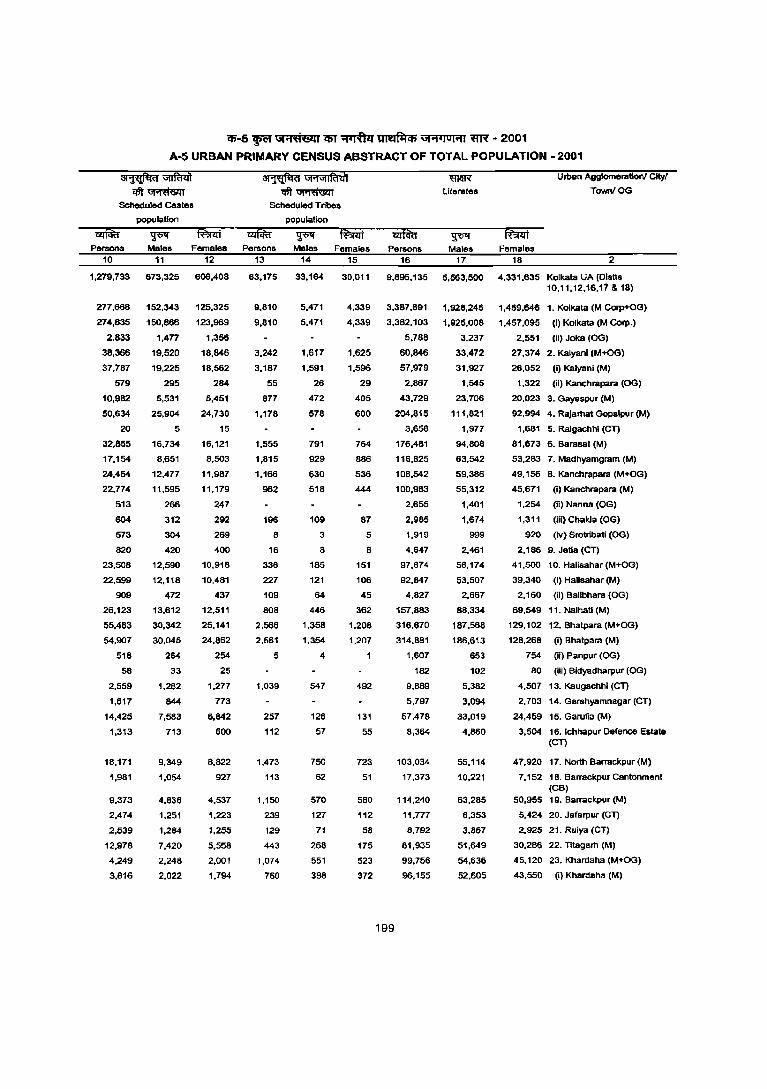
cp-s ~ Gi"1;ft6111 'CPT ~ ~ Gi'1 4IUI"11 WR" - 2001
A-5 URBAN PRIMARY CENSUS ABSTRACT OF TOTAL POPULATION - 2001
~ "Giiffiiit Cflt~
Scheduled castes
population
~
~\iI'1\ijI~zi1 Cflt~
Scheduled Tribes
population
Pel'llOllS Meles Females Persons Males Females Persons 10
1,279,733
277,668
274,835
2,833
38,366
37,787
579
10,982
50,634
20
32,855
17,154
;M,464
22,774
513
604
573
820
23,508
22,599
909
26,123
55,483
54.907
518
58
2.559
1.617
14.425
1,313
18.171
1.981
9.373
2.474
2.539
12.978
4.249
3.816
11
673,325
152,343
150,866
1,477
19.520
19,225
295
5,531
25,904
5
16,734
8.651
12,477
11,595
266
312
304
420
12,590
12,118
472
13,612
30.342
30,045
264
33
1,282
844
7,583
713
9,349
1,054
4,836
1,251
1,284
7,420
2,248
2,022
12 13 14 15 16
606,408
125,325
123,969
1,356
18.846
18,562
284
5,451
24,730
15
16,121
8,503
11,987
11,179
247
292
269
400
10,918
10,481
437
12.511
25.141
24,862
254
25
1,277
773
6,842
600
8.822
927
4,537
1,223
1.255
5,558
2,001
1,794
63,175
9,810
9,810
3,242
3,187
55
877
1,178
1,555
1,815
1.166
962
196
8
16
336
227
109
808
2,566
2,561
5
1,039
257
112
1,473
113
1,150
239
129
443
1,074
760
33,164
5,471
5,471
1,617
1,591
26
472
578
791
929
630
518
109
3
8
185
121
64
446
1,358
1.354
4
547
126
57
750
62
570
127
71
268
551
388
30,011
4,339
4,339
1.625
1.596
29
405
600
764
886
536
444
87
5
8
151
106
45
362
1.208
1.207
1
492
131
55
723
51
580
112
58
175
523
372
9,895,135
3,387,891
3,382,103
5,788
60,846
57.979
2,867
199
43,729
204,815
3,658
176,481
116,825
108,542
100.983
2.655
2,985
1,919
4,647
97,674
92,847
4.827
157.883
316,670
314.881
1,607
182
9,889
5,797
57,478
8,364
103,034
17,373
114,240
11.777
6,792
81,935
99.756
96,155
~
Literates
~ Males
17
5,563,500
1.928.245
1,925,008
3,237
33,472
31.927
1.545
23.706
111,821
1,977
94.808
63,542
59,386
55,312
1.401
1,674
999
2,461
56,174
53,507
2,667
88.334
187,568
186,613
853
102
5,382
3,094
33,019
4,860
55.114
10.221
63,285
6,353
3,867
51,649
54,636
52.605
U!ban Agglomeration! CIty!
TowniOG
Females 18 2
4,331,635 Kolkata UA (Oislts 10,11,12,16,17 If, 18)
1,459.646 1. Kolkata (M Corp+OG)
1.457,095 (I) Koikata (M Corp.)
2.551 (ii) Joka (OG)
27.374 2. Kalyani (M+OG)
26,052 (i) Kalyani (M)
1,322 (II) Kanchrapara (OG)
20,023 3. Gayespur (M)
92,994 4. RaJamat Gopalpur (M)
1,681 5. Ralgachhl (CT)
81,673 6. Barasat (M)
53,283 7. Madhyamgram (M)
49,156 8. Kancllrapara (M+OG)
45,671 (i) Kanchrapara (M)
1,254 (ii) Nanna (OG)
1,311 (iii) Chakla (OG)
920 (iv) Srotribatl (00)
2,186 9. Jolla (CT)
41,SOO 10. Halisahar (M+OG)
39,340 (I) Hansahar (M)
2,160 Iii) Balibhara (OG)
69,549 11. Naihati (M)
129,102 12. Bhatpara (M+OG)
128,268 (i) Bhatpara (M)
754 (ii) Panpur (OG)
80 (iii) Bldyadharpur (OG)
4,507 13. Kaugachhi (CT)
2,703 14. Garshyamnagar (eT)
24,459 15. Garulla (M)
3,504 16. Ichhapur Defence Estate (CT)
47,920 17. North Barrackpur (M)
7,152 1 B. Barrackpur cantonment (CB)
50,955 19. Barrackpur (M)
5.424 20. Jafarpur (CT)
2,925 21. Ruiya (CT)
30.286 22. Tltagam (M)
45.120 23. Khardaha (M+OG)
43.550 (i) Khardaha (M)
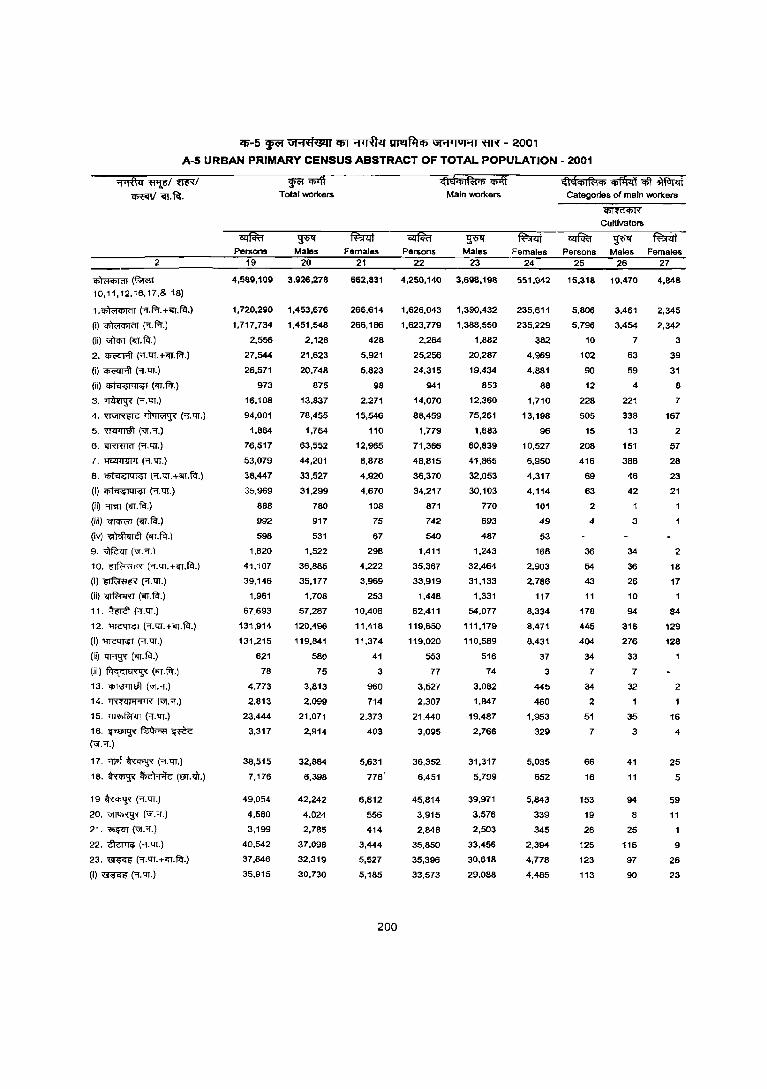
(1)-5 ~ \1I'1.a@l1 <I>T 0flTfuJ ~ \1I'1'I UI"'11 "flN - 2001
A-5 URBAN PRIMARY CENSUS ABSTRACT OF TOTAL POPULATION - 2001
2
~(~ 10,11,12,16,17,& 18)
1.~ ("'I.f.r.+<IT.fi'I.)
(i)~("'I.r.r.)
(ii) uftq)j (<IT. fi'I.)
2. ~ ('1.trT.+<IT.fct.)
(i)~("'I.trT.)
(ii) qiiilO$I410$1 (iIT.fct.)
3. ~ ("'I.'ll.)
4. ~ ~ ("'f. 'IT.)
5. ~(,"."'I.)
6. iIRffiI(f ('"'f. 'IT.)
7. ~ (Of. 'IT.)
8. qiiil&lql&1 ("I.'IT.+-.n.fct.)
(I) qilil"iIQIO$i ("'I. tIT.)
<ii) "Iffll (iIT.fi'I.)
(iiil <mPm (iIT.f<n (iv) ~ (<rr.fi'I.)
9.~(\if."'f.)
10. ~'" ("'I.'ll.+<IT.f<l.)
(I) ~~ ("I.'IT.)
(ii)~(m.fi'I.)
11. ~ ("I.'IT.)
12. ~ (Of.tIT.+CJ1.fi'I.)
(1)~("l.tIT.)
(ii)~(iIT.fi'I.)
(iii) fi'l'i."la~~ (iIT.fi'I.)
13. ~ (\if".Of.)
14. 'iH!lJI"l'1'I' (,".Of.)
15. ~ ("'I. 'IT.)
16.~~~ ("1."1.)
17. 'Wt ~ ("l.tIT.)
18.~~(m..rr.)
19~("'I.'IT.)
20. ~ ("I.0f.)
21.~("I."'I.)
22.~(1.1:jJ.)
23. ~ ('1.tIT.+iIT.fi'I.)
(1)~('1.1:jJ.)
Persons 19
4,539,109
1,720,290
1,717,734
2,556
27,544
26,571
973
16,108
94,001
1,864
76,517
53,079
38,447
3;'.969
888
992
598
1,820
41,107
39,146
1,961
67.693
131,914
131,215
621
78
4,773
2.813
23.444
3,317
38,515
7,176
49,054
4.580
3,199
40,542
37,846
35.915
¥l'iliiff Total workers
~ Males
20
3,926,278
1,453,676
1,451,548
2,128
21,623
20,748
875
13,837
78,455
1,754
63,552
44,201
33,527
31.299
780
917
531
1,522
36,885
35,177
1,708
57,287
120.496
119,841
580
75
3,813
2,099
21,071
2,914
32,884
6,398
42,242
4,024
2,785
37,098
32,319
30,730
Females 21
662,831
266,614
266,186
428
5.921
5.823
98
2,271
15,546
110
12,965
8,878
4,920
4,670
108
75
67
298
4,222
3,969
253
10,406
11,418
11,374
41
3
960
714
2,373
403
5,631
778
6,812
556
414
3,444
5,527
5,185
200
Persons 22
4,250,140
1,626,043
1,623,779
2,264
25,256
24,315
941
14,070
88,459
1,779
71,366
48,815
36,370
34.217
871
742
540
1,411
35,367
33.919
1.448
62.411
119,650
119,020
553
77
3,527
2,307
21.440
3,095
36,352
6,451
45,814
3,915
2,848
35,850
35,396
33,573
Main workers
~ Males
23
3,698,198
1,390,432
1,388,550
1,882
20,287
19,434
853
12,360
75,261
1,683
60,839
41,865
32.053
30,103
770
693
487
1,243
32,464
31,133
1,331
54,077
111,179
110,589
516
74
3,082
1,847
19,487
2,766
31,317
5,799
39,971
3,576
2,503
33,456
30,618
29,088
cMq>I~q> "ii#iii'! qft ~ Categories of main workers
Females Persons 24 25
551,942 15,318
235,611 5,806
235,229 5,796
382 10
4,969 102
4,881 90
88 12
1,710 228
13,198 505
96 15
10,527 208
6,950 416
4,317 69
4,114 63
101 2
49 4
53
168 36
2,903 54
2,786 43
117 11
8,334 178
8,471 445
8,431 404
37 34
3 7
445 34
460 2
1,953 51
329 7
5,035 66
652 16
5,843 153
339 19
345 26
2,394 125
4,778 123
4,485 113
~
Cultlvatol'$
Males Females 26 27
10,470 4,848
3,461 2.345
3,454 2,342
7 3
63 39
59 31
4 8
221 7
338 167
13 2
151 57
388 28
46 23
42 21
3
34 2
36 18
26 17
10
94 84
316 129
276 128
33
7
32 2
35 16
3 4
41 25
11 5
94 59
8 11
25
116 9
97 26
90 23
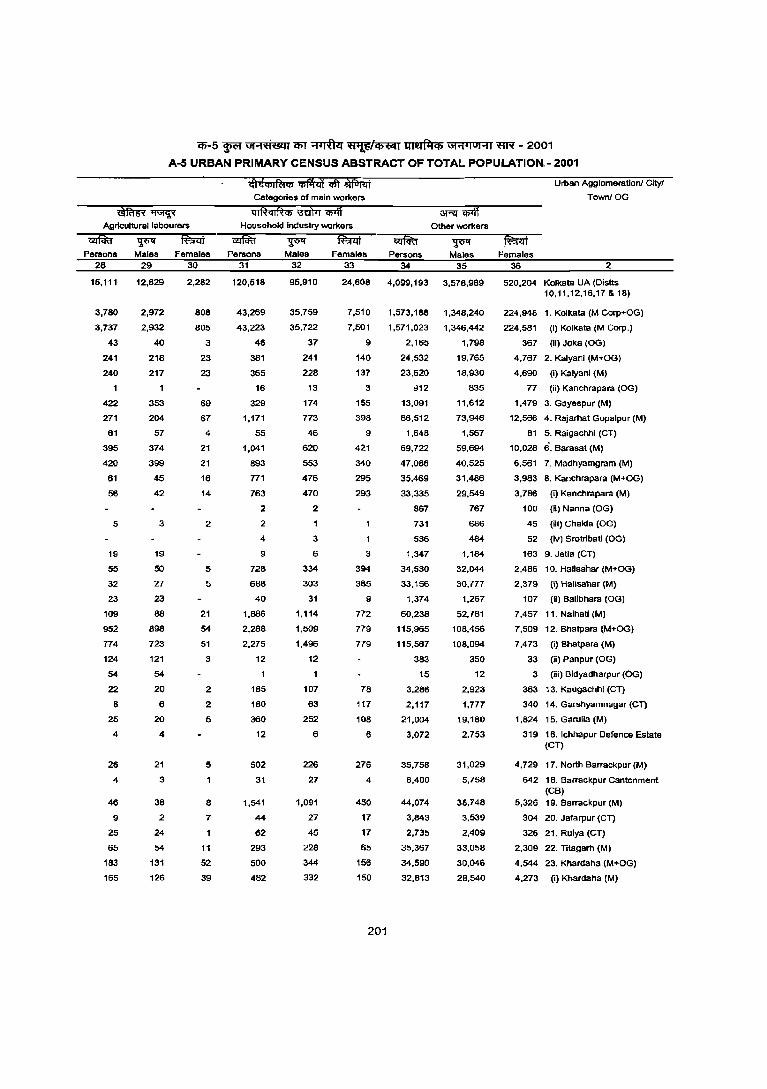
if;-5 ~ ut"t;H(§Q1 i$T ~ ~ ~ \J!'"I'juHI ~ - 2001
A-5 URBAN PRIMARY CENSUS ABSTRACT OF TOTAL POPULATION.- 2001
Agricultural labourers
Categories of main workers
ql~ql~Ct> ~ ;;;:Iff Household industry workers
~
3T"'lI"i'ft Other workers
1.JV" Persons Males Females Persons Males Females Persons Males
28 29 30 31
15,111
3,780
3,737
43
241
240
422
271
61
395
420
61
56
5
19
55
32
23
109
952
774
124
54
22
8
25
4
26
4
46
9
25
65
183
165
12,829
2,972
2,932
40
218
217
353
204
57
374
399
45
42
3
19
50
27
23
88
898
723
121
54
20
6
20
4
21
3
38
2
24
54
131
126
2,282
808
805
3
23
23
69
67
4
21
21
16
14
2
5
5
21
54
51
3
2
2
5
5
8
7
11
52
39
120,518
43,269
43,223
46
381
365
16
329
1,171
55
1,041
893
771
763
2
2
4
9
728
688
40
1.886
2.288
2,275
12
165
180
360
12
502
31
1,541
44
62
293
500
482
32
95,910
35,759
35,722
37
241
228
13
174
773
46
620
553
476
470
2
3
6
334
303
31
1.114
1.509
1.496
12
107
63
252
6
226
27
1,091
27
45
228
344
332
33 34 35
24,608 4,099,193 3,578,989
7,510 1,573,188 1,348,240
7,501
9
140
137
3
155
398
9
421
340
295
293
3
394
385
9
772
779
779
78
117
108
6
276
4
450
17
17
65
156
150
201
1,571,023
2,165
24.532
23.620
;112
13,091
66,512
1,648
69,722
47,086
35,469
33,335
867
731
536
1,347
34,530
33,156
1.374
60.238
115.965
115.567
383
15
3,286
2,117
21,004
3,072
35,758
6,400
44,074
3,843
2,735
35,367
34.590
32.813
1,346,442
1,798
19.765
18.930
835
11,612
73,946
1,567
59,694
40,525
31,486
29.549
767
686
484
1,184
32,044
30,777
1,267
52.781
108,456
108,094
350
12
2,923
1,777
19,180
2,753
31.029
5,758
38,748
3.539
2,409
33,058
30.046
2B.540
Urban Agglomerationl City!
TownlOG
~ Females
36 2
520.204 Kolkala UA (Distts 10,11,12.16.17 & 18)
224,948 1. Kolkata (M Corp+OG)
224,581
367
(i) Kolkata (M Corp.)
(iI) Joka (OG)
4.767 2. Kalyani (M+OG)
4.690 (i) Kalyani (M)
77 (ii) Kanchrapara (OG)
1,479 3. Gayespur (M)
12,566 4. Rajarhat Gopalpur (M)
81 5. Raigachhi (CT)
10,028 6. Barasal (M)
6,561 7. Madhyamgram (M)
3,983 8. Kanchrapara (M+OG)
3.786 (i) Kanchrapara (M)
100 (ii) Nanna (OG)
45 (iii) Chakla (OG)
52 (iv) Srotribatl (OG)
163 9. Jelia (CT)
2,486 10. Halisahar (M+OG)
2,379
107
(i) Halisahar (M)
(iI) Balibhara (OG)
7.457 11. Naihati (M)
7,509 12. Bhatpara (M+OG)
7,473 (i) Bhatpara (M)
33 (ii) Pan pur lOG)
3 (iii) Bidyadharpur (OG)
363 13. Kaugachhi (eT)
340 14. Garshyamnagar (CT)
1,824 15. Garulia (M)
319 16. Ichhapur Defence Estate (eT)
4.729 17. North Barrackpur (M)
642 18. Barrackpur Cantonment (CB)
5,326 19. Barrackpur (M)
304 20. Jafarpur (CT)
326 21. Ruiya (eT)
2.309 22. ntagarh (M)
4.544 23. Khardaha (M+OG)
4.273 (i) Khardaha (M)
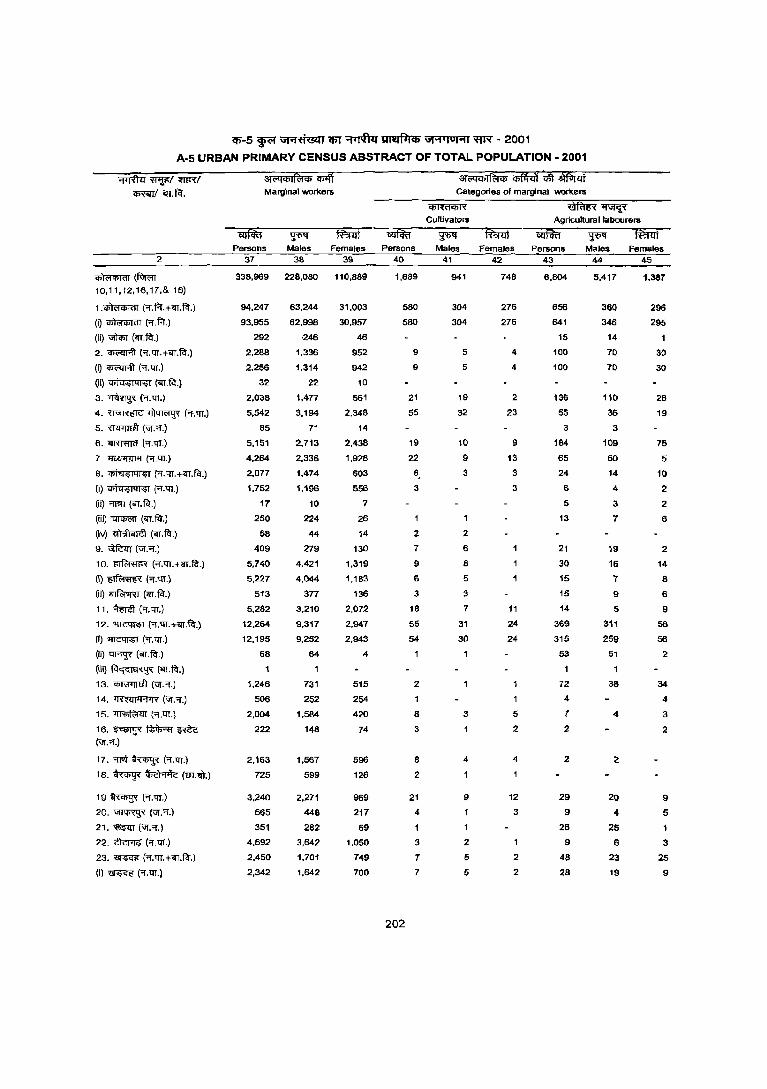
<1>-5 ~ Gt;:Hiil!4i q;y ~ ~ \J1"1'I OI"11 ~ - 2001
A-5 URBAN PRIMARY CENSUS ABSTRACT OF TOTAL POPULATION - 2001
2
~(R;rro
10,11,12,16,17,& 16)
1.~ (-r.f.f.+ilT.flt.)
(i) ~ (Of.f.f.)
(il)~(Elr.flt.)
2. ~ ("l.'11.+EIT.fct.)
(i) ~ (-r.m.)
(ii) ,.>ii'l;;;14['$1 (EIT.flt.)
3.~{"'1.m.)
<I. ~ ~ ('t.m.)
5.~("ijf."'f.)
6. <IRm1<I ("'1.1lT.)
7. mz!lIUl'l ("'f.m.)
8. ij)j'€j<;141'$1 (Of.m.+EIT.flt.)
(I) ij)ji':!<;JQI'$1 ("I.m.)
(ii) "lmT (ifI.~.)
(iii) ~ (Elr.f1t.)
Ov) ~ ('IT.fcq 9.~("ijf.Of.)
10. ~ (.,.tIT.HIT.flt.)
(I) ~ (Of.m.l
(ii) onPo:r>:m (EIT. fl'r.)
11. ~ ("'l.m.)
12. ~ ("T.'Il.+'OIT.f<t)
(I) ~ ("'l.tIT.)
(II) ~ (CfI.fl'r.)
(iii) fltq<;IEl'<,);'< (CfI.fct.)
13.~("ijf."'l.)
14. '1'<~'Wl'ljl~ ('G'I."f.)
15. ~ ("T.m.)
16.~~~ ('\;I . .,.)
17. ~ ~ ("l:.tIT.)
18. ~ ~ (m.;IT.)
19 ~ ("'l.tIT.)
20.~("ijf . .,.)
21. ~ ('\;1.'1.)
22. ~ (Of.m.)
23. ~ ("f.m.+<IT.fl'r.)
(I) ~ ("'l.tfT.)
31(i<lq;I~q; iiff Marginal worl<ers
~ Persons Males Females
37
338,969
94,247
93.955
292
2,288
2,256
32
2,038
5,542
85
5,151
4,264
2,077
1,752
17
250
58
409
5,740
5,227
513
5,282
12,264
12,195
68
1,246
506
2,004
222
2,163
725
3,240
665
351
4,692
2,450
2,342
38
228,000
63,244
62.998
·246
1,336
1,314
22
1,477
3,194
71
2.713
2,336
1,474
1,196
10
224
44
279
4.421
4,044
377
3,210
9,317
9,252
64
731
252
1,584
148
1,567
599
2,271
448
282
3,642
1,701
1,642
39
110,889
31,003
30.957
46
952
942
10
561
2,348
14
2,438
1.928
603
556
7
26
14
130
1,319
1.183
136
2,072
2,941
2,943
4
515
254
420
74
596
126
969
217
69
1,050
749
700
Persons 40
1,689
580
580
202
9
9
21
55
19
22
6.
3
2
7
9
6
3
18
55
54
2
1
8
3
8
2
21
4
3
7
7
Categories of marginal worl<ers
<Iimfq;R
CultivatQr8
Males Females 41 42
941 748
304 276
304 276
5 4
5 4
19 2
32 23
10 9
9 13
3 3
2
6
8
5
3
3
7 11
31 24
30 24
3 5
1 2
4 4
9 12
3
2
5 2 5 2
~~ Agricultural labourers
Persons 43
6,804
656
641
15
100
100
136
55
3
184
65
24
6
5
13
21
30
15
15
14
369
315
53
1
72
4
7
2
2
29
9
26 9
48
28
Males Females 44 45
5,417 1,381
360 296
346 295
14
70 30
70 30
110 26
36 19
3
109 75
60 5
14 10
4 2
3 2
7 6
19 2
16 14
7 8
9 6
5 9
311 56
259 56
51 2
38 34
4
4 3
2
20 9
4 5
25
6 3
23 25
19 9
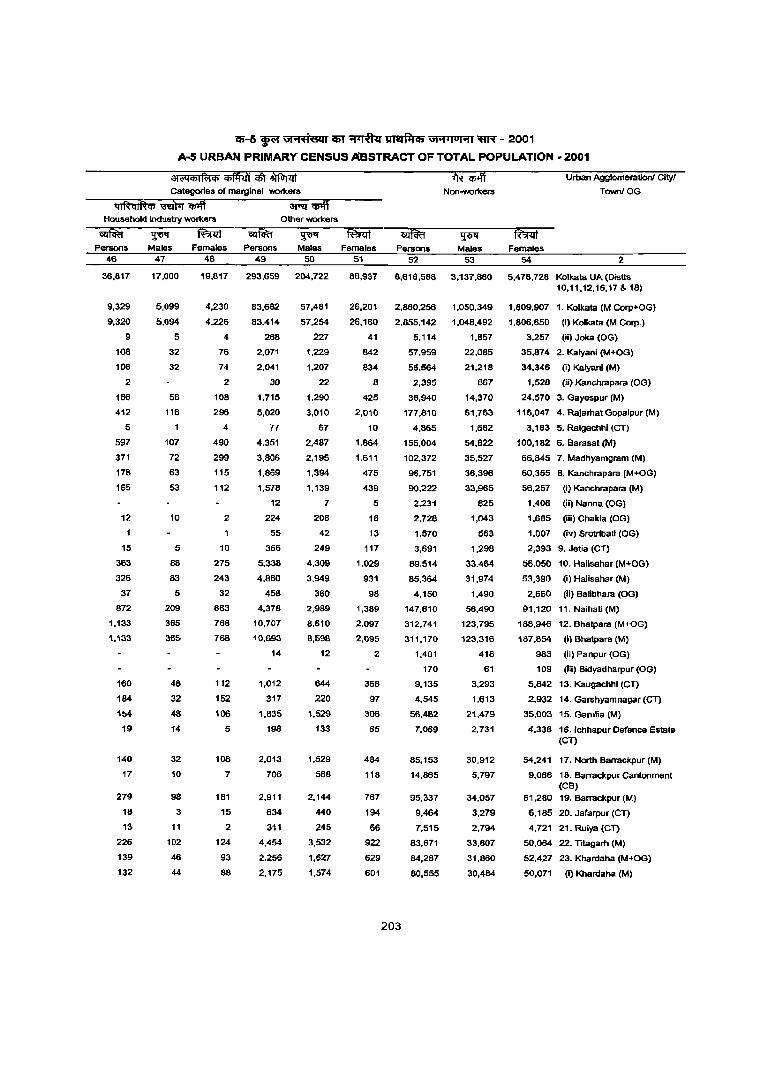
$-5 ~ GI"'I't1&1I CIiT ~ ~ GI"'I'lol'1llWf - 2001
A-5 URBAN PRIMARY CENSUS ABSTRACT OF TOTAL POPULATION· 2001
at<"l<l>IR:iQ> ~ ~ ~ "Iii iiff Urban Agglomeratlonl Cltyl
Categories of marginal workers Non-workers TownJ OG
ql~ql~'" :m'i1T'iIiiff 3R 'iIff Household indusby workers Other "WOrkers
Persons 46
36,817
9,329
9,320
9
108
106
2
166
412
5
597
311
118
165
12
15
363
326
37
872
1,133
1,133
160
184
154
19
140
17
219
1S
13
226
139
132
~ Males
47
17,000
5,099
5,094
5
32
32
58
116
107
72
63
53
10
5
88
83
5
209
365
365
48
32
48
14
32
10
98
3
11
102
46
44
~ Females Persons Males
48 49 50
19,817 293,659 204,722
4,230 83,682 57,481
4,226
4
76
74
2
108
296
4
490
299
115
112
2
10
275
243
32
663
768
768
112
152
106
5
108
7
t81
15
2
124
93
88
83,414
268
2,071
2,041
30
1,715
5,020
n 4,351
3,806
1,869
1,578
12
224
55
366
5,338
4,880
458
4,378
10,707
10,693
14
1,012
317
1,835
198
2,013
706
2,911
634
311
4,454
2,256
2,175
57,254
227
1,229
1,207
22
1,290
3,010
67
2,487
2,195
1,394
1,139
1
206
42
249
4,309
3,949
360
2,989
8,610
8,598
12
644
220
1,529
133
1,529
588
2,144
440
245
3,532
1,627
1,574
~ Females Persons Males Females
51 52 53 54 2
88,937 8,616,586 3,137,860 5,478,728 Kolkata UA(Distts 10,11,12,16,17 & 18)
26,201 2,860,256 1,050,349 1,809,907 1, Kolkata (M Corp+OG)
26,160 2,855,142 1,048,492 1,806,650 (I) Kolkata (M Corp.)
41 5,114 1,857 3,257 (ii) Joka (OG)
842
834
8
425
2,010
10
1,864
1,611
475
439
5
18
13
117
1,029
931
98
1,389
2,097
2,095
2
368
91
306
65
484
118
767
194
66
922
629
601
203
51,959
55,564
2,395
38,940
117,810
4,865
155,004
102,372
96,751
90,222
2,231
2,728
1,570
3,691
89,514
85,364
4,150
147,610
312,741
311,170
1,401
170
9,135
4,545
56,482
7,069
85,153
14,865
95,337
9,464
7,515
83,611
84,281
80,555
22,085
21,218
867
14,370
61,763
1,682
54,622
35,527
36,396
33,965
825
1,043
563
1,298
33,464
31,974
1,490
56,490
123,795
123,316
418
61
3,293
1,613
21,479
2,731
30,912
5,791
34,057
3,219
2,794
33,607
31,860
30,484
35,874 2. Kalyani (M+OG)
34,346 (i) Kalyani (M)
1,528 (ii) Kanchrapara (OG)
24,570 3, Gayespur (M)
116,047 4. RaJarhat Gopalpur (M)
3,183 5, Raigachhl (CT)
100,182 6. Barasat (M)
66,845 7. Madhyamgram (M)
60,355 8. Kanchrapara (M+OG)
56,257 (i) Kanchrapara (M)
1,406 (ii) Nanna (OG)
1,685 (iii) Chakla (OG)
1,007 (iv) Srotrlbatl (OG)
2,393 9. Jetia (CT)
56,050 10, Hallsahar (M+OG)
53,390 (i) Halisahar (M)
2,660 Qi} Balibhara (OG)
91,120 11. Naihati (M)
188,946 12, Bhatpara (M+OG)
187,854 (i) Bhatpara (M)
983 (ii) Panpur (OG)
109 (iii) Bidyadharpur (OG)
5,842 13. Kaugachhi (CT)
2,932 14, Garshyamnagar (Cn
35,003 15. Garulia (M)
4,338 16, ichhapur Defence Estate (eT)
54,241 17, North Barrackpur (M)
9,068 18, Barrackpur Cantonment (CS)
61,280 19, Barrackpur (M)
6,185 20. Jafarpur (CT)
4,721 21. Ruiya (Cn
50,064 22. Titagam (M)
52,427 23, Khardaha (M+OG)
50,071 (I) Khardaha (M)
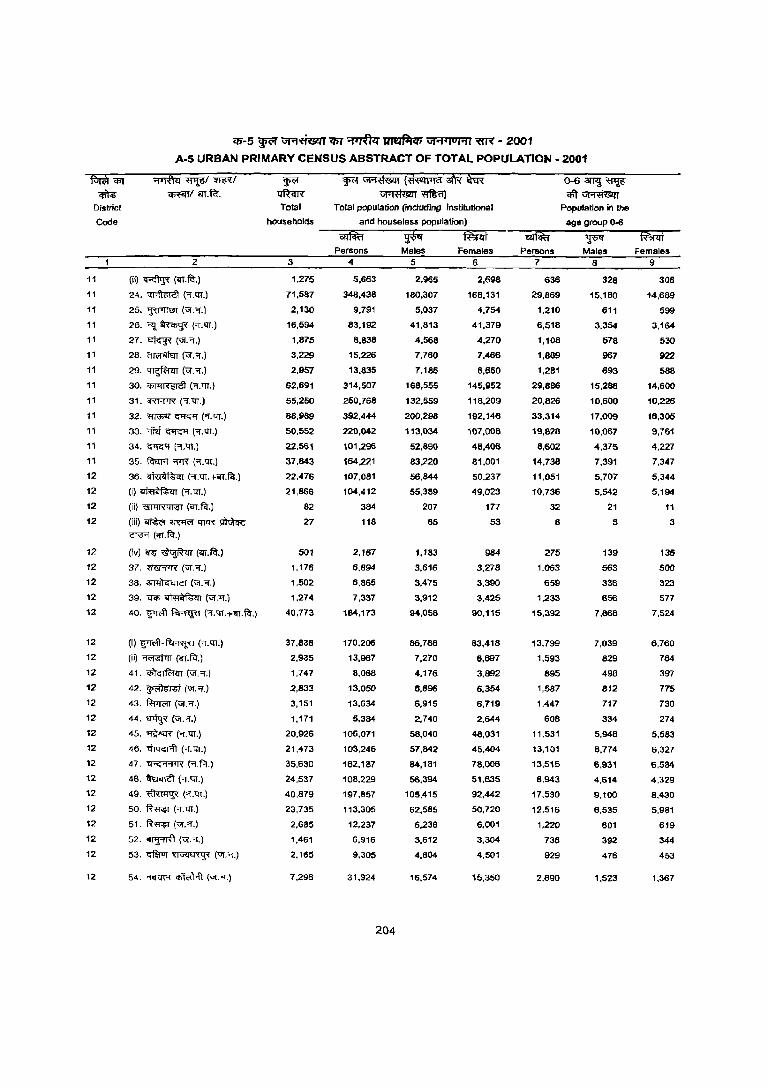
~<!l1
• District
Code
11
11
11
11
11
11
11
11
11
11
11
11
11
12
12
12
12
12
12
12
12
12
12
12
12
12
12
12
12
12
12
12
12
12
12
12
12
12
cr;-5 ~ GfOl<'i'6Z4i em ~ ~ iJf"i.,o'"l' ~ -2001
A-5 URBAN PR'MARY CENSUS ABSTRACT OF TOTAL POPULATION - 2001
2
(ii)~(<lT.f,>;.)
24. ~ (Of.1:!l.)
25. ~ (-;;r.Of.)
26. ~~ (Of.1:!l.)
27. ~ (VI. Of.)
28. ~ (ur."Of.)
29. ~ (ur.Of.)
30. ~ ("Of.'lT.)
31. <RFI'R ('1."Q1.)
32. ~ G'iG'f (or.'lT.)
33. -;fM ~ ('1.-.n.)
34. ~ ("'!.<n.)
35. fcrur-l "'f'1< (Of. "CIT .)
36. ~ (Of.-.n.H"T.FcI.)
(i)~(or.trr.)
(il) ~ (orr.fct.)
(iii)~~lWR~ Cl'>-! (orr. fit.)
(iv) ~ ~ (~.~,)
37. ~ (Ul'."Of.)
38. ~ ("I. Of.)
39. qq; ~ (Uf."t.)
40. S'T<'fi-~ ("I.'IT,i-'iff.fct.)
(I) ~-~ (-;;-.'IT.)
(ii) ~ ~.fct.)
41.~(Uf."t.)
42. ~ (VI. Of.)
43. fWr<;;r (ur.'1.)
44.~(ur."'I.)
45. ~"'" ("f. 'IT.)
46. ~ ("'I.'iI.)
47. ~ ("f.f.!.)
48. ~ (-;;-.<n.)
49. ~ ("!.trr.)
50. ~ ("'f. QT.)
51. ~ (Uf."!.)
52. ~(ur."'f.)
53. ~ ~ (VI . .,,)
W<" ~ Tolal
households
3
1,275
71,587
2,130
16,594
1,875
3,229
2,957
62,691
65,250
68,989
60,552
22,561
37,843
22,476
21,866
82
27
501
1.176
1,502
1,274
40,773
37,838
2,935
1,747
2,833
3,151
1,171
20,926
21,473
35,630
24,537
40,879
23,735
2,685
1,461
2,165
7,298
~ ~ (~al'R ifu'i ~~
Total population (including institutional
and houselsss population)
Persons 4
5,663
348,438
9,791
83,192
8,838
15,226
13,835
314,507
250,768
392,444
220,042
101,296
164,221
107,081
104,412
384
118
2,167
6,894
6,865
7,337
184,173
110,206
13,961
8,068
13,050
13,634
5,384
106,071
103,246
162,187
108,229
197,857
113,305
12,237
6,916
9,305
31,924
204
~ Males
5
2,965
180,307
5.037
41,813
4.568
7,760
7,185
168,555
132,559
200,298
113,034
52,890
83,220
56,844
55,389
207
65
1,183
3,616
3,475
3,912
94,058
86,788
7.270
4,176
6,696
6,915
2,740
58,040
57,842
84,181
56,394
105,415
62,585
6,236
3,612
4,804
16,574
fmt Females
6
2,698
168,131
4,754
41,379
4,270
7,466
6,650
145,952
118,209
192,146
107,008
48,406
81,001
50,237
49,023
177
53
984
3,278
3,390
3,425
90,115
83,418
6,697
3,892
6,354
6,719
2,644
48,031
45,404
78,006
51,835
92,442
50,720
6,001
3,304
4,501
15,350
Persons 7
636
29,869
1,210
6,518
1,108
1,889
1,281
29,886
20,826
33,314
19,828
8,602
14,738
11,051
10,736
32
8
275
1,063
659
1,233
15,392
13,799
1,593
895
1,587
1.447
608
11,531
13,101
13,515
8,943
17,530
12,516
1,220
736
929
2.890
0-6 am.l~ qft~
Population irJ the
age group 0-6
~ Males
8
328
15,180
611
3,354
578
967
693
15,286
10,600
17,009
10,067
4,375
7,391
5,707
5,542
21
5
139
563
336
656
7,668
7,039
829
498
812
717
334
5,948
6,774
6,931
4,614
9,100
6,535
601
392
476
1,523
Females 9
308
14,689
599
3,164
530
922
588
14,600
10,225
16,305
9,761
4,227
7,347
5,344
5,194
11
3
136
500
323
577
7,524
6,760
764
397
775
730
274
5,583
6,327
6,584
4,329
8.430
5,981
619
344
453
1.367
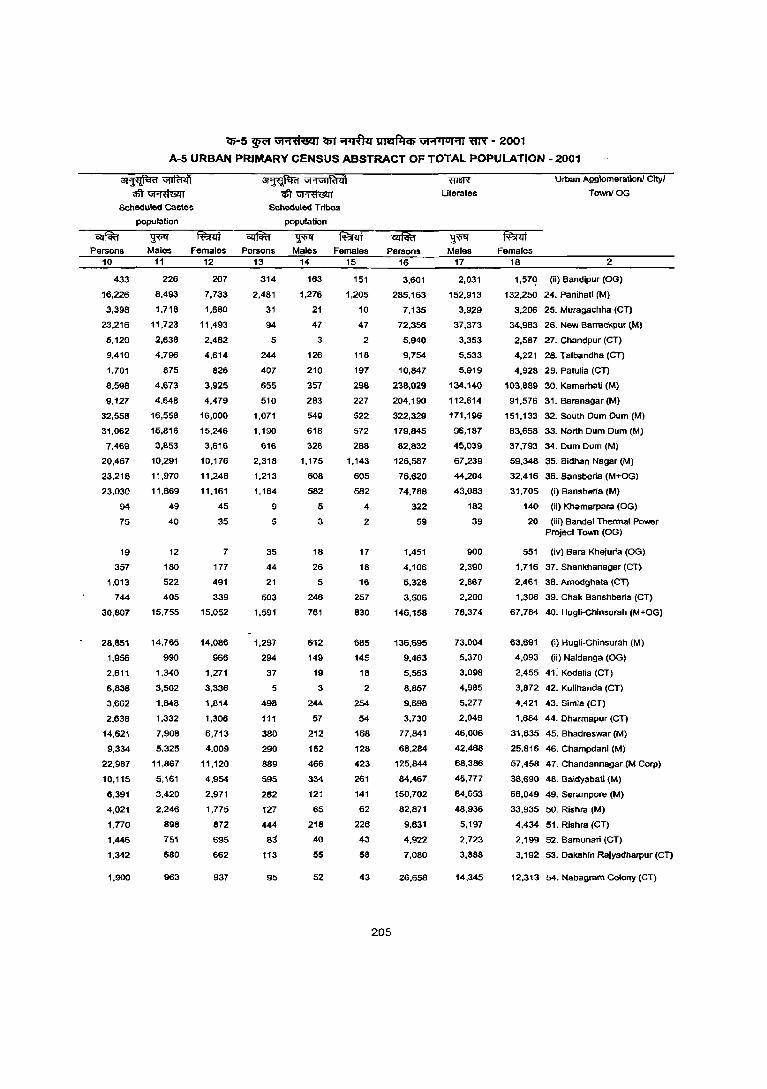
<ti'-5 !ffi \JI.,ifi'6llj ~ ~ ~ W'I'jUj.,j 'flN - 2001
A-S URBAN PRIMARY CENSUS ABSTRACT OF TOTAL POPULATION - 2001
~~
Scheduled Castes
population
~
~ \iI'1\i1lftl<l1
<tT~ Scheduled Tribes
population
Persons Males females Persons Males females 10
433
16,226
3,398
23,216
5,120
9,410
1.701
8,598
!iI.127
32,558
31,062
7,469
20,467
23,218
23,030
94
75
19
357
1,013
744
30,807
26,851
1,956
2,611
6,838
3,662
2,638
14,621
9,334
22,987
10,115
6,391
4,021
1,770
1,446
1,342
1,900
11
226
8,493
1,718
11,723
2,638
4,796
875
4.673
4,648
16,558
15,816
3,853
10,291
11,970
11,869
49
40
12
180
522
405
15,755
14,765
990
1,340
3,502
1,848
1,332
7,908
5,325
11,867
5,161
3,420
2,246
898
751
680
963
12 13
207
7,733
1,680
11,493
2,482
4,614
826
3,925
4,479
16,000
15,246
3,616
10,176
11.248
11,161
45
35
7
177
491
339
15,052
14,086
966
1,271
3,336
1,814
1.306
6.713
4,009
11,120
4,954
2,971
1,775
872
695
662
937
314
2,481
31
94
5
244
407
655
510
1,071
1,190
616
2,318
1.213
1,164
9
5
35
44
21
503
1.591
1.297
294
37
5
498
111
380
290
889
595
262
127
444
83
113
95
14 15
163
1,276
21
47
3
126
210
357
283
549
618
328
1.175
608
582
5
3
18
26
5
246
761
612
149
19
3
244
57
212
162
466
334
121
65
218
40
55
52
151
1,205
10
47
2
118
197
298
227
522
572
288
1.143
605
582
4
2
17
18
16
257
830
685
145
18
2
254
54
168
128
423
261
141
62
226
43
58
43
Persons
205
16
3,601
285,163
7,135
72.356
5,940
9,754
10,847
238,029
204,190
322,329
179,845
82,832
126.587
76,620
74,788
322
59
1,451
4,106
5,328
3,506
146,158
136,695
9,463
5,553
8,857
9,698
3.730
77,841
68.284
125,844
84.467
150,702
82,871
9,631
4,922
7.080
26,658
Literates
~ Males
17
2,031
152,913
3,929
37,373
3,353
5,533
5.919
134.140
112,614
171,196
96,187
45,039
67.239
44,204
43,083
182
39
900
2,390
2.867
2.200
78.374
73,004
5,370
3,098
4.985
5,277
2.046
46,006
42,468
68,386
45,777
64,653
46,936
5,197
2,723
3.688
14,345
females 18
Urban AgglomeraUoni Cltyl
TownJOG
2
1,57~ (ii) Bandipur (OG)
132,250 24. Panihatl (M)
3,206 25. Muragachha ICT)
34,983 26. New Bamilckpur (M)
2,587 27. Chandpur (CT)
4,221 28. Talbandha (CT)
4,928 29, Patulia ICT)
103,889 30. Kamamati (M)
91,576 31. Baranagar(M)
151,133 32. South Dum Dum (M)
83,658 33. North Dum Dum (M)
37,793 34, Dum Dum (M)
59.348 35. Bidhan Nagar (M)
32.416 36. Bansberia (M+OG)
31,705
140
20
551
(i) Bansberia (M)
(II) Khamarpara (OG)
(iii) Bandel Thermal Power Project Town (OG)
(iv) Sara Khejuria (OG)
1,716 37. Shankhanagar (CT)
2,461 38. Amodghata (CT)
1,306 39. Chak Banshberia (CT)
67.764 40. HU91i-Chinsurah (M+OG)
63,691
4,093
(i) Hugli-Chinsurah (M)
(ii) Naldanga (OG)
2,455 41: Kodalia (CT)
3.872 42. Kulihanda (CT)
4,421 43. Simla (CT)
1.684 44. Dharmapur (eT)
31,835 45. Bhadreswar (M)
25,816 46. Champdanl 1M)
57,458 47. Chandannagar (M Corp)
38,690 48. Baidyabati (M)
66,049 49. Serampore 1M)
33.935 50. Rishra 1M)
4,434 51. Rishra (eT)
2,199 52. Bamunari (CT)
3,192 53. DaKshin Rajyadharpur (CT)
12,313 54. Nabagram Colony leT)
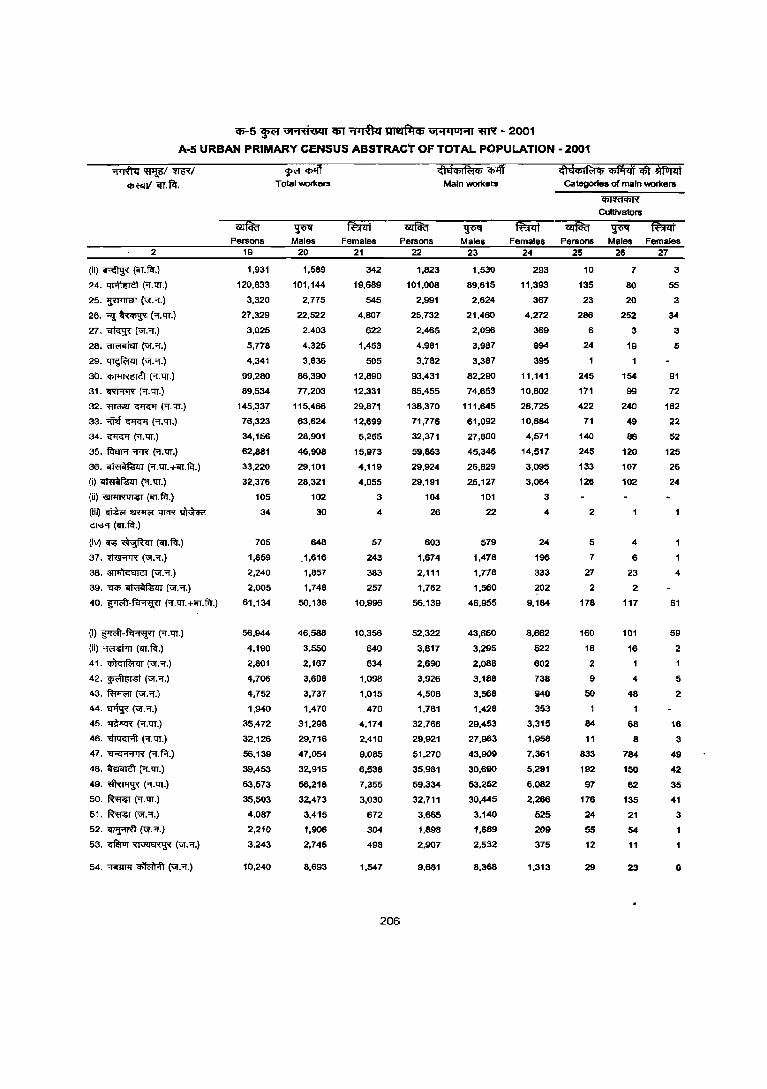
CIi-5 ~ \iI"i't1<!IQ1 'lfiT ~ ~ 6Hi lol"'ll 'ffN - 2001
A-5 URBAN PRIMARY CENSUS ABSTRACT OF TOTAL POPUL.ATION - 2001
2
(ii) ~ (lfl.f<t.j
24. ~ (or.'fI.)
25. ~ (VI'.or.)
26. ~ ~ ('{.'fI.)
27. ~ (ur."J.)
28. ~ (vI:'f.)
29. ~ (vI:'f.)
30. ~ ("I. lIT.)
31. 'if'!'R1R ('OJ. 'fl.)
32. ~ ~ (or.lIT.)
33. "'IN ~ (or.lIT.)
34. ~ ('T.lIT.)
35. ~ "f'R ('T.'fI.)
36. ~ ("I.'fI.+ilT.fctj
(i)~(or.lIT.)
(ii) i(lj1>iI~ql~1 (ilT.fit)
(iii)~~1:f'ICR'~
CI\R (lfl.1'4.)
(Iv) ~ ~ (al.fcr.)
37.~("GI.,{.)
38. ~ (VI'.or.)
39. 'q'Cf) ~ ("GI."'f.)
40. ~-~ ("J.lIT.HT.fcr.)
(I) ~-~ ('OJ.'fI.)
(ii) ~ (ilT.fcr.)
41.~("GI."".)
42. ~ (VI'.,{.)
43. ~(ur . ..,..)
44.~("GI.,{.)
45. ~-"<R (Of.lIT.)
46. ~ (Of.lIT.)
47. ~ R.F-r.} 48. ~ ('T.'fI.)
49. ~ ("I.QT.)
50. ~ (Of.lIT.)
51. ~ (ur.Of.)
52. ilT>j"IRl (VI'. '{.}
53. ~ ~ (VI'.Of.)
54. ~ ~ (vI.Of.)
Persons 19
1,931
120,833
3,320
27,329
3,025
5,778
4,341
99,280
89,534
145,337
76,323
34,156
62,881
33,220
32,376
105
34
705
1,859
2,240
2,005
61,134
56,944
4,190
2,801
4,706
4,752
1,940
35,472
32,126
56,139
39,453
63,573
35,503
4,087
2,210
3,243
10,240
w<'f~ Total workers
~ Males
20
1,589
101,144
2,775
22,522
2,403
4,325
3,836
86,390
77,203
115,466
63,624
28,901
46,908
29,101
28,321
102
30
648
.1,616
1,857
1,748
50,138
46,5B8
3,550
2,167
3,608
3,737
1,470
31,298
29.716
47,054
32,915
56,218
32,473
3,415
1.906
2.745
8,693
Females 21
342
19,689
545
4,B07
622
1,453
505
12,890
12,331
29,871
12,899
5,255
15,973
4,119
4,055
3
4
57
243
383
257
10,996
10,356
640
634
1,098
1,015
470
4,174
2,410
9,085
6,538
7,355
3,030
672
304
498
1,547
206
Persons 22
1,823
101,008
2,991
25,732
2,465
4,981
3,782
93,431
85,455
138,370
71,776
32,371
59,863
29,924
29,191
104
26
603
1,674
2,111
1,762
56,139
52,322
3,817
2,690
3,926
4,508
1,781
32,768
29,921
51,270
35,981
59,334
32,711
3,665
1,89B
2,907
9,681
Main workers
~ Males
23
1,530
89,615
2,624
21,460
2,096
3,987
3,387
82,290
74,653
111,645
61,092
27,800
45,346
26,829
26,127
101
22
519
1,418
1,778
1,560
46,955
43,660
3,295
2,088
3,188
3,568
1,428
29,453
27,963
43,909
30,690
53,252
30,445
3,140
1,689
2,532
8,388
cfI€lqilft:l4i ~ ~ ~ categories of main workers
Females Persons 24 25
293 10
11,393 135
367 23
4,272 286
369 6
994 24
395
11,141 245
10,802 171
26,725 422
10,684 71
4,571 140
14,517 245
3,095 133
3,064 126
3
4
24
196
333
202
9,184
8,662
522
602
738
940
353
3,315
1,958
7,361
5,291
6,082
2,266
525
209
375
1,313
2
5
7
27
2
178
160
18
2
9
50
1
84
11
833
192
97
176
24
55
12
29
~
Cultivators
Males Females 26 27
7 3
80 55
20 3
252 34
3 3
19 5
154 91
99 72
240 182
49 22
88 52
120 125
107 26
102 24
4
6
23
2
117
101
16
1
4
48
1
68
8
784
150
62
135
21
54
11
23
4
61
59
2
5
2
18
3
49
42
35
41
3
1
6
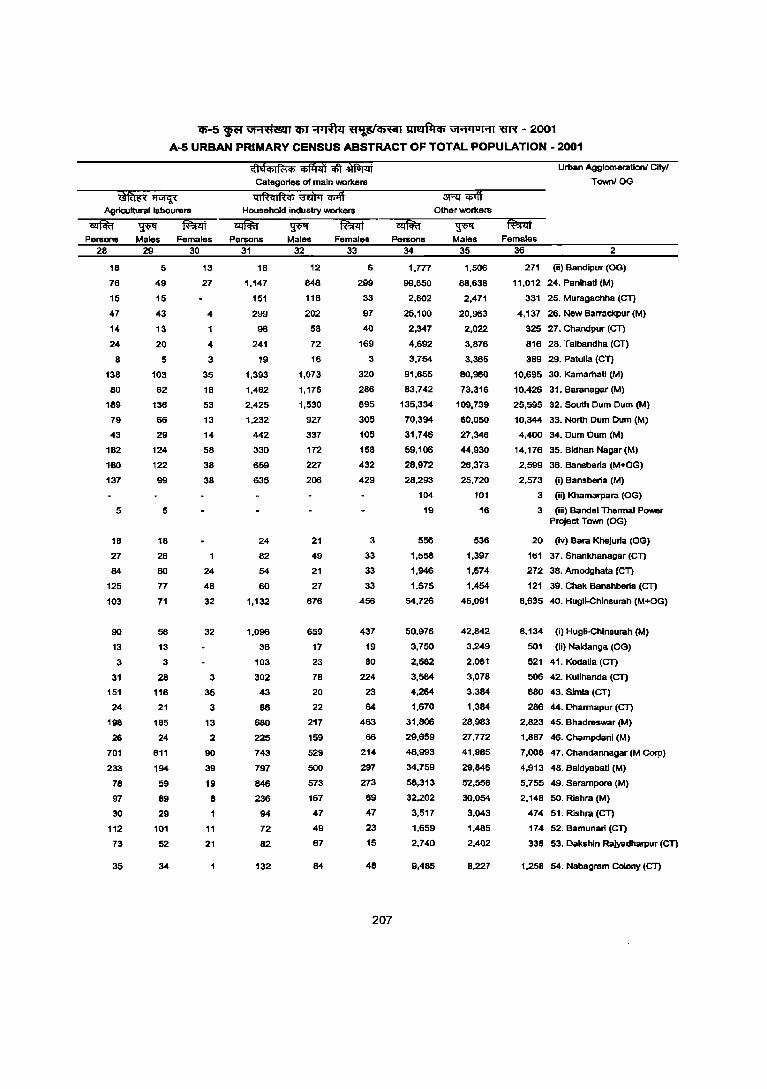
(1)-5 ~ GI"1fl6tl1 CIiJ "'1"lI& ~ ~ GI .... IUI"II ~ - 2001
A-5 URBAN PRIMARY CENSUS ABSTRACT OF TOTAL POPULATION - 2001
CategoriK of main workers
~~ ql~ql~q; ml)TT'lfi1\i Agricultural labourers Household Industry lNOlkers
~ Persons Males Females Pervons Males Females
28 29 30 31
18
76
15
47
14
24
8
138
80
189
79
43
182
160
137
5
18
27
84
125
103
90
13
3
31
151
24
198
26
701
233
78
97
30
112
73
35
5
49
15
43
13
20
5
103
62
136
66
29
124
122
99
5
18
26
60
77
71
58
13
3
28
116
21
185
24
611
194
59
89
29
101
52
34
13
27
4
1
4
3
35
18
53
13
14
58
38
38
24
48
32
32
3
35
3
13
2
90
39
19
8
11
21
18
1,147
151
299
98
241
19
1,393
1,462
2,425
1,232
442
330
659
635
24
82
54
60
1,132
1,096
36
103
302
43
86
680
225
743
797
846
236
94
72
82
132
32
12
848
118
202
58
72
16
1,073
1,176
1,530
927
337
172
227
206
21
49
21
27
676
659
17
23
78
20
22
217
159
529
500
573
167
47
49
67
84
33
6
299
33
97
40
169
3
320
286
895
305
105
158
432
429
3
33
33
33
456
437
19
80
224
23
64
463
66
214
297
273
69
47
23
15
48
Other workers
Persons 34
1,777
99,650
2.802
25.100
2,347
4,692
3,754
91,655
83,742
135,334
70,394
31,746
59,106
28,972
28,293
104
19
556
1,556
1,946
1.575
54,726
50,976
3,750
2,582
3,584
4,264
1.670
31.806
29,659
48,993
34,759
58,313
32,202
3,517
1,659
2,740
9,485
Males 35
1,506
88,638
2,471
20,963
2,022
3,876
3,365
80.960
73.316
109.739
60.050
27.346
44,930
26,373
25,720
101
16
53.6
1,397
1,674
1,454
46.091
42,842
3,249
2,061
3,078
3,384
1,384
28,983
27,772
41,985
29,846
52,558
30,054
3,043
1,485
2,402
8,227
207
Urban Agglomerationl Cityl
TownIOG
Females 36 2
271 (ii) Bandlpur (OG)
11,012 24. Panlhatl (M)
331 25. Muragachha (eT)
4,137 26. New BarraCkpur (M)
325 27. Chandpur (CT)
816 28. Talbandha (CT)
389 29. Patulia (CT)
10,695 30. Kamamati (M)
10,426 31. Baranagar (M)
25,595 32. South Dum Dum (M)
10,344 33. North Dum Dum (M)
4,400 34. Dum Dum (M)
14,176 35. Bidhan Nagar (M)
2,599 36. Bansberia (M+OG)
2,573 (i) Bansberia (M)
3 (ii) Khamarpara (OG)
3 (iii) Bandel Thermal Power Project Town (OG)
20 (iv) Bara Khejuria (OG)
161 37. Shankhanagar (Cn
272 38. Amodghata (CT)
121 39. Chak Banshberia (CT)
8,635 40. Hugli-Chinsurah (M+OG)
8,134 (i) HugU-Chinsurah (M)
501 (ii) Naldanga (OG)
521 41. Kodalia (CT)
506 42. Kulihanda (CT)
880 43. Simla (CT)
286 44. Oharmapur (CT)
2.823 45. Bhadreswar (M)
1,887 46. Champdani (M)
7,008 47. Chandannagar(M Corp)
4,913 48. Baidyabati (M)
5,755 49. Serampore (M)
2,148 SO. Rishra (M)
474 51. Rishra (CT)
174 52. Bamunari (Cn
338 53. Oakshin Rajyadharpur (CT)
1,258 54. Nabagram Colony (CT)
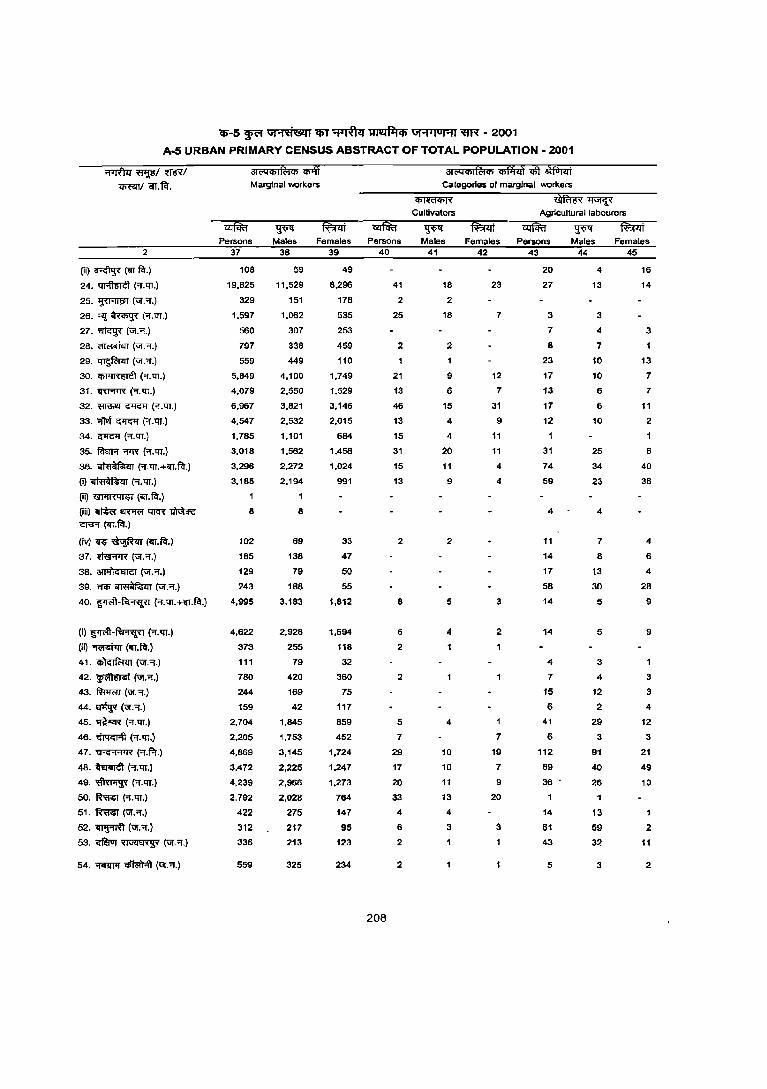
'$-5 ~ GI"'l<ti@i' <liT ~ ~ GI"'I"OHllI'R - 2001
A-5 URBAN PRIMARY CENSUS ABSTRACT OF TOTAL POPULATION· 2001
"'l7tfur ~/ ~I ~/ iIl.fIr.
2
(ii)~("iIT.~.)
24. ~ ("r:'11.)
25. ~ (Uf.'f.)
26. ~ ~ ('f. tIT.)
27. ~ (Uf • .,.)
28. ~ (Uf . .,.)
29. ~ (Uf.'f.)
30. ~ ("i.tIT.)
31. ~('f.'lT.)
32. ~ G'IG'f ("i.tIT.)
33. >Wf G'IG'f ('f. tIT.)
34. G'IG'f ('f. tIT.)
35. film;; "ITR ('f. tIT.)
36. ~ l-f.ll1.+"iIT.~.)
(i) ~ ('f.tIT.)
(ii)~("iIT.~.)
(iii)~~~~ cwr("iIT.~.)
(iv) ~ ~ ("iIT:~.)
37. ~ (Uf.'!".)
38. ~ (Uf.'f.)
39. oqq; ~ (Uf.".)
40. ~-~ ("r.1:JI.+"iIT.flI".)
(I) S'J<'ft-~ ("i.lIT.)
(ii)~("iIT.~.)
41. ~(Uf.'f.)
42. ~ (Ui • .,.)
43. ~ (Uf.'1.)
44. ~ (Uf:'!.)
45. ~-'<R \-'I.lIT.)
46. ~ ("'I. lIT.)
47. ~ (.,.f.r.)
48.~\-'I.1:JI.)
49. ~ ("'I.tIT.)
50. ~ ("i.lIT.)
51.~(\iI'."'I.)
52. ~ (Ui."'I.)
53. ~ ~ (Uf.'1.)
54. "fiRIl1f ~ (Uf.".)
<it C"I <Ii I R:I q; 1iilff Marginal workers
¥'I ~ Persons Males Females
37
108
19,825
329
1.597
560
797
559
5,849
4,079
6.967
4,547
1.785
3,018
3,296
3,185
8
102
185
129
243
4,995
4,622
373
111
780
244
159
2,704
2,205
4,869
3,472
4,239
2,792
422
312
336
559
38
59
11,529
151
1,062
307
338
449
4,100
2,550
3,821
2,532
1,101
1,562
2,272
2,194
8
69
138
79
188
3,183
2,928
255
79
420
169
42
1.845
1,753
3,145
2,225
2,966
2,028
275
217
213
325
39
49
8,296
178
535
253
459
110
1,749
1,529
3,146
2,015
684
1,456
1,024
991
33
47
50
55
1,812
1,694
118
32
360
75
117
859
452
1,724
1,247
1.273
764
147
95
123
234
Persons 40
208
41
2
25
2
21
13
46
13
15
31
15
13
2
8
6
2
2
5
7
29
17
20
33
4
6
2
2
31C"1q;Ifc;jq; ~ qft ~ Categories 01 marginal workers
~
Cultivators
Males Females 41 42
18 23
2
18 7
2
9 12
6 7
15 31
4 9
4 11
20 11
11 4
9 4
2
5 3
4 2
4
10
10
11
13
4
3
7
19
7
9
20
3
~~ Agricultural labourers
~ Persons
43
20
27
3
7
8
23
17
13
17
12
1
31
74
59
4
11
14
17
58
14
14
4
7
15
6
41
6
112
B9 36 .
14
61
43
5
Males Females 44 45
4 16
13 14
3
4 3
7
10 13
10 7
6 7
6 11
10 2
25 6
34 40
23 36
4
7 4
8 6
13 4
30 28
5 9
5 9
3
4
12
2
29
3
91
40
26
1
13
59
32
3
3
3
4
12
3
21
49
10
2
11
2
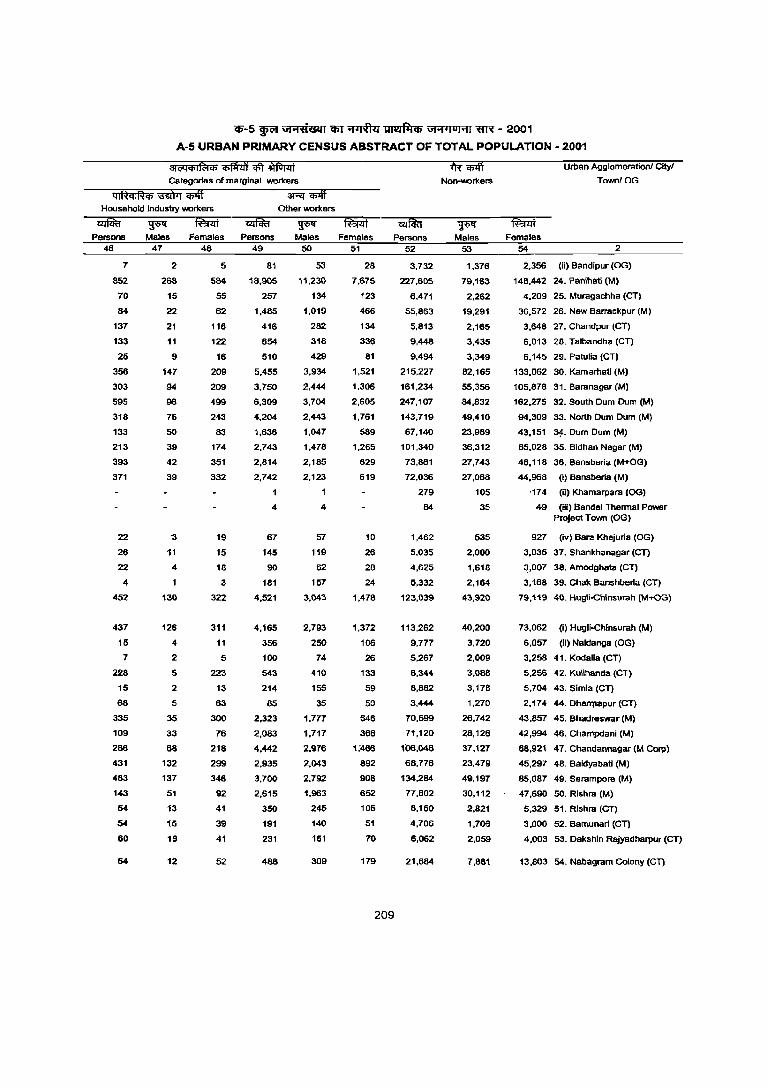
(1)-5 Wt" \iJ'1fl&l1 'iI)l ~ ~ ,,1'1-101'11 ~ - 2001
A-5 URBAN PRIMARY CENSUS ABSTRACT OF TOTAL POPULATION - 2001
Categories of marginal woricers
q I~q I ~ <t> 1iifi1T ij;iff 3!""<f ij;iff Household Industry woricers
Persons 46
7
852
70
84
137
133
25
356
303
595
318
133
213
393
371
22
26
22
4
452
437
15
7
228
15
68
335
109
286
431
483
143
54
54
60
64
Males 47
2
268
15
22
21
11
9
147
94
96
75
50
39
42
39
"3
11
4
130
126
4
2
5
2
5
35
33
68
132
137
51
13
15
19
12
Females Persons 48 49
5
584
55
62
116
122
16
209
209
499
243
63
174
351
332
19
15
18
3
322
311
11
5
223
13
63
300
76
218
299
346
92
41
39
41
52
81
18,905
257
1,485
416
654
510
5,455
3.750
6,309
4,204
1,636
2,743
2,814
2,742
1
4
67
145
90
181
4,521
4,165
356
100
543
214
85
2,323
2,083
4,442
2,935
3.700
2,615
350
191
231
488
Other woricers
Males 50
53
11,230
134
1,019
282
318
429
3.934
2.444
3,704
2,443
1,047
1.478
2,185
2,123
1
4
57
119
62
157
3.043
2.793
250
74
410
155
35
1.771
1,717
2,976
2,043
2,792
1,963
245
140
161
309
Females 51
28
7,675
123
466
134
336
81
1,521
1,306
2,605
1,761
589
1,265
629
619
10
26
28
24
1,478
1,372
106
26
133
59
50
546
366
1;466
892
908
652
105
51
70
179
Persons 52
3,732
227,605
6,471
55,863
5,813
9,448
9,494
215,227
161.234
247,107
143,719
67,140
101,340
73,861
72,036
279
84
1,462
5,035
4,625
5,332
123,039
113,262
9,777
5,267
8,344
8,882
3,444
70,599
71,120
1'06,048
68,776
134,284
77,802
8,150
4,706
6,062
21,684
209
Non-workers
~ Males
53
1,376
79,163
2,262
19,291
2,165
3,435
3,349
82,165
55,356
84,832
49,410
23,989
36,312
27,743
27,068
105
35
535
2,000
1,618
2,164
43,920
40,200
3,720
2,009
3,088
3,178
1,270
26,742
28,126
37,127
23,479
49,197
30,112
2,821
1,706
2,059
7,881
fa1lt
Urban Agglomeration! Cltyl
TownIOG
Females 54 2
2,356 (Ii) Bandipur (OG)
148,442 24. Panlhati (M)
4,209 25. Muragachha (CT)
36,572 26. New Barrackpur (M)
3,648 27, Chandpur (CT)
6,013 28. Talbandha (CT)
6,145 29. Parulia (CT)
133,062 30. Kamarhatl (M)
105,878 31. Baranagar (M)
162,275 32. South Dum Dum (M)
94,309 33. North Dum Dum (M)
43,151 34. Dum Dum (M)
65,028 35. Bidhan Nagar (M)
46,118 36, Bansberia (M+OG)
44,968 (I) Bansberia (M)
'174 (Ii) Khamarpara (OG)
49 (iii) Bandel Thermal Power Project Town (OG)
927 (iv) Bara Khejurla (OG)
3,035 37. Shankhanagar (CT)
3,007 38. Amodghata (CT)
3,168 39. Chak Banshberia (eT)
79,119 40. Hugli-Ghlnsurah (M+OG)
73,062 (i) Hugli-Ghinsurah (M)
6,057 (ii) Naldanga (OG)
3,258 41. Kodalia (Cn
5,256 42. Kulihanda (CT)
5,704 43. Simla (CT)
2,174 44. Dhaf11lapur (eT)
43,857 45. Bhadreswar (M)
42,994 46. Champdani (M)
68,921 47, Chandannagar (M Corp)
45,297 48. Baldyabatl (M)
85,087 49. Serampore (M)
47,690 SO. Rishra (M)
5,329 51, Rlshra (CT)
3,000 52. Bamunarl (CT)
4,003 53. Dakshln Rajyadharpur (CT)
13,803 54. Nabagram Colony (CT)
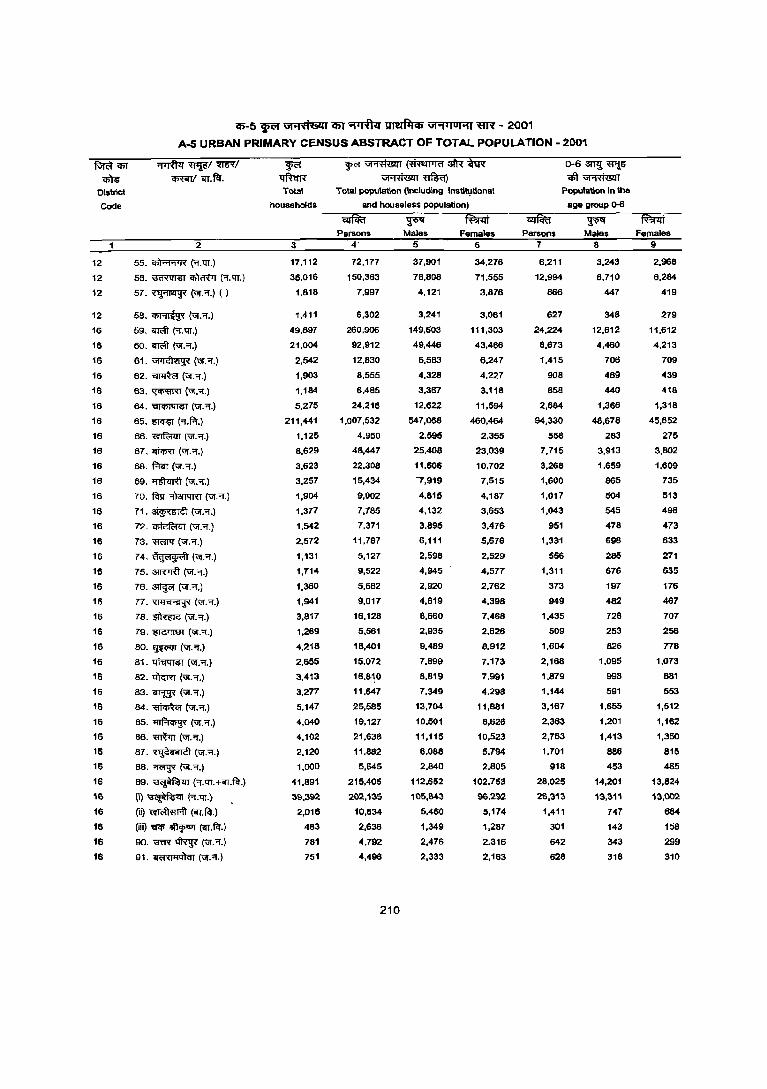
f&i¥cm ~
District
Code
12
12
12
12
16
16
16
16
16
16
16
16
16
16
16
16
16
16
16
16
16
16
16
16
16
16
16
16
16
16
16
16
16
16
16
16
16
16
16
16
~-5 ~ ut"1fl641 i5T ~ ~ ut.,'lul"1l 'ffiIl- 2001
A-5 URBAN PRIMARY CENSUS ABSTRACT OF TOTAL POPULATION - 2001
~~/~/ W<'I ~~~3tRiER 0-6~~ ~ ifT.~. ~ VFRffizn ~ <1ft ~
2
55. ~ (".tIT.)
56. ~ ~ ("9".111.)
57. ~ (';1".".) ()
58.~("<:iI"".) 59. ~ ("'I".lU.)
60. ~ ("<:iI."I.)
61. ~ (\if."Of.)
62. ~(ur.".)
63. ~ (,"."Of.)
64.~(';I"."Of.)
65. m<n M.f.'t.) 66. -mf(;rm fur. "Of.)
67. "ifi<Im (ur."1".)
68. f.r.rr (';1".'1.)
69. ~ (,"."'1".)
70. f®" ;flanqm (,"."'T.)
71. ~ (ur."'T.)
72. ~ (ur."Of.)
73. ~ (ur."'T.)
74.~(ur."1".)
75.~(';I"."'f.)
76. ~ (ur."Of.)
77. ~ ('".".)
78. ~ (,".'1.)
79. "im!'mJl ,,".'1.)
80. ~ (,".or.)
81.~("ur.":J.)
82.~(';I".":J.)
83. iII1.W (,".'1.)
64.~(ur.or.)
85. ~ (ur."'I".)
86. 1!'IWrr (ur. "1".)
87. ~(ur."Of.)
88.~(';I"."'I".)
89. ~ ('1.lU.HT.fctj
II) ~ ("'l."qJ.)
Oi)~("ij"f.~.)
(iii) '!I<P ~ c--r.~.)
90. mR ~ (ur."Of.)
91. i1ii1 w'!G)<t I (ur:".)
Total Tolal population (Including Instltl;lllonal
households and house less POPUlation)
3
17,112
35,016
1,818
1,411
49,897
21,004
2,542
1,903
1,184
5,275
211,441
1,125
8,629
3,623
3,257
1,904
1,377
1,542
2,572
1,131
1,714
1,360
1,941
3,817
1,269
4,218
2,555
3,413
3,277
5,147
4,040
4,102
2,120
1,000
41,891
~~,392
2,016
483
781
751
Persons 4'
72,177
150,363
7,997
6,302
260,906
92,912
12,830
8,555
6,485
24,216
1,007,532
4,950
48,447
22,308
15,434
9,002
7,785
7,371
11,787
5,127
9,522
5,682
9,017
16,128
5,561
18,401
15,072
16,810
11,647
25,585
19,127
21,638
11,882
5,845
215,405
202,1~5
10,634
2,636
4,792
4,496
210
~ Males
5
37,901
78,808
4,121
3,241
149,603
49,446
6,583
4,328
3,367
12,622
547,068
2,595
25,408
11,606
r,919
4,81.5
4,132
3,895
6,111
2,598
4,945
2,920
4,619
8,660
2,935
9,489
7,899
6,619
7,349
13.704
10.501
11,115
6.088
2.840
112.652
105,&43
5,460
1,349
2,476
2.333
Females 6
34,276
71,555
3,876
3,061
111,303
43,466
6,247
4,227
3,118
11,594
460,464
2,355
23.039
10,702
7,515
4,187
3,653
3,476
5,676
2.529
4,577
2,762
4,398
7,468
2,626
8,912
7,173
7.991
4,298
11,881
8,626
10,523
5,794
2,805
102,753
96,292
5,174
1,267
2,316
2,163
Population In the
age group ()-6
Persons 7
6,211
12,994
866
627
24,224
8,673
1,415
908
658
2,664
94,330
558
7,715
3,268
1,600
1,017
1,043
951
1,331
556
1,311
373
949
1,435
509
1,604
2,168
1,879
1,144
3,167
2,363
2,763
1,701
918
28,025
2S,31~
1,411
301
642
628
~ Males
8
3,243
8,710
447
348
12,612
4,460
706
469
440
1,366
48,678
283
3,913
1,659
865
504
545
478
69B
285
676
197
482
728
253
826
1,095
998
591
1,655
1,201
1,413
886
453
14,201
13,311
747
143
343
31B
~ Females
9
2,968
6,284
419
279
11,612
4,213
709
439
416
1,318
45,652
275
3,802
1,609
735
513
498
473
633
271
635
176
467
707
256
778
1,073
881
553
1,512
1,162
1,350
815
465
13,824
13,002
664
158
299
310
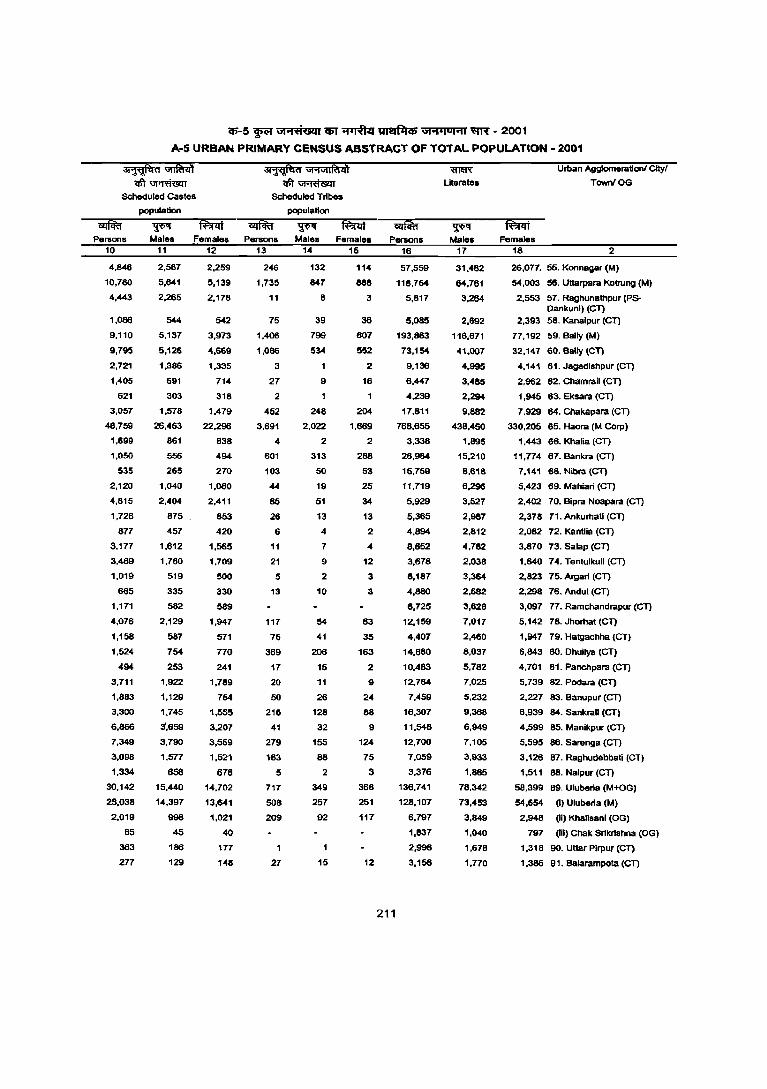
cp-s p "'"1'ti&1I ~ ~ ~ "'''.10 1"11 ~ - 2001
A-5 URBAN PRIMARY CENSUS ABSTRACT OF TOTAL POPULATION - 2001
~~ qft~
Scheduled Castes
population
~
~\iI'1\i1I~;Jj qft~
Scheduled Tribes
population
P8~S Males Femalae Persons Males Females Personl 10
4,846
10,780
4,443
1,086
9,110
9,795
2,721
1,405
621
3,057
48,759
1,699
1,050
535
2,120
4,815
1,728
877
3,177
3,469
1,019
665
1,171
4,076
1,158
1,524
494
3,711
1,883
3,300
6,866
7,349
3,098
1,334
30,142
28,038
2,019
85
363
277
11
2,587
5,641
2,265
544
5,137
5,126
1,386
691
303
1,578
26,463
861
556
265
1,040
2,404
875
457
1,612
1,760
519
335
582
2,129
587
754
253
1,922
1,129
1,745
3,659
3,790
1,577
658
15,440
14,397
998
45
186
129
12 13 14 15 16
2,259
5,139
2,178
542
3,973
4,669
1,335
714
318
1,479
22,296
838
494
270
1,080
2,411
853
420
1,585
1,709
500
330
589
1,947
571
770
241
1,789
754
1,555
3,207
3,559
1,521
676
14,702
13,641
1,021
40
177
148
246
1,735
11
75
1,406
1,086
3
27
2
452
3,691
4
601
103
44
85
26
6
11
21
5
13
117
76
369
17
20
50
216
41
279
'163
5
717
508
209
27
132
847
B
39
799
534
9
1
248
2,022
2
313
50
19
51
13
4
7
9
2
10
54
41
206
15
11
26
128
32
155
88
2
349
257
92
15
114
888
3
36
607
552
2
18
204
1,669
2
288
53
25
34
13
2
4
12
3
3
63
35
163
2
9
24
88
9
124
75
3
368
251
117
12
211
57,559
118,764
5,817
5,085
193,863
73,154
9,136
6,447
4,239
17,811
768,655
3,338
26,984
15,759
11,719
5,929
5,365
4,894
8,652
3,678
6,187
4,880
6,725
12,159
4,407
14,880
10,483
12,764
7,459
16,307
11,548
12,700
7,059
3,376
136,741
128,107
6,797
1,837
2,996
3,156
Uteratea
~ Males
17
31,482
64,761
3,264
2,692
116,671
41,007
4,995
3,485
2,294
9,882
438,450
1,895
15,210
8,618
6,296
3,527
2,987
2,812
4,782
2,038
3,364
2,582
3,628
7,017
2,460
8,037
5,782
7,025
5,232
9,368
6,949
7,105
3,933
1,865
78,342
73,453
3,849
1,040
1,678
1,770
Urban Agglomeratlonl CltyJ
TaNnIOG
Females 18 2
26,077. 55. Konnagar (M)
54,003 56. Uttarpara Kotrung (M)
2,553 57. Raghunathpur (PSDankunl) (CT)
2,393 58. Kanalpur (Cn
77,192 59. Bally (M)
32,147 60. Bally (CT)
4,141 61. Jagadishpur (CT)
2,962 62. Chamrall (Cn
1,945 63. Eksara (CT)
7,929 64. Chakapara (Cn
330,205 65. Haora (M Corp)
1,443 66. Khalia (CT)
11,774 67. Bankra (CT)
7,141 68. Nibra (CT)
5,423 69. Mahiari (CT)
2,402 70. Bipra Noapara (CT)
2,378 71. Ankurhati (CT)
2,082 72. Kantlia (CT)
3,870 73. Salap (Cn
1,640 74. Tentulkull (en 2,823 75. Algari (CT)
2,298 16. Andul (CT)
3,097 77. Ramchandrapur (Cn
5,142 78. Jhorhat (CT)
1,941 79. Hatgachha (en 6,843 80. Dhuilya (CT)
4,701 81. Panchpara (CT)
5,739 82. Podara (CT)
2,227 83. Banupur (en 6,939 84. Sankrail (CT)
4,599 85. Manikpur (en 5,595 86. Sarenga (CT)
3,126 87. Raghudebbati (CT)
1,511 88. Nalpur (CT)
58,399 89. Uluberla (M+OG)
54,654 (i) Uluberia (M)
2,948 (iI) Khalisani (OG)
197 (iii) Chak Srikrishna (OG)
1,318 90. Uttar Plrpur (CT)
1,386 91. Balarampota (Cn

1$-5 ~ G1"i:d&l1 Cf)f ~ ~ Gl"fIIDHI ;m"l - 2001
A-5 URBAN PRIMARY CENSUS ABSTRACT OF TOTAL POPULATION - 2001
2
55. ~ ('T.m.)
56. ~ ~ ('1.'11.)
57. ~ (Uf.'T.) ()
58. ~ ("GI.'f.)
59. ~ (""1.'11.)
60. ~ ("GI.""I.)
61.~("GI.'1.)
62. ~ ("GI.""I.)
63. ~ ("GI.'f.)
64. ~ ("GI.-=r.)
65. ~ ("'f.r.r.)
66.~("GI.'f,)
67. iIi<Iffi ("GI. "'.)
68. f.li!r ("GI."'f.)
69. ~ (\lI.'f.)
70, lim ~ ("GI."!.)
71. ~ ("GI.'T,)
72.~("GI.'f.)
73.~("GI,'f.)
74. ~ ("GI."f.)
75. ~ (Uf."!.)
76. ~ ("GI,""I.)
77.~("GI.'f.)
78, -m-wc (\lI.'f,)
79,~("GI."I.)
80. ~ (\lI,"'f,)
81, ~ (Uf."'f.)
82. tirc:m (Uf,'f,)
63. ~ (\lI.'1,)
84,~("GI,"'f,)
85. ~ ("GI.'f,)
86.~("GI.'f.)
87. ~ ("GI."!.)
88. ~ ("GI.'f.)
89. ~ (-=r.'11.+iIT.~.)
(I) ~ ('f.'11.)
(ii)~(iIT.f<I',)
(iii)'ef<Ii~~.f<I'.)
90, \N'{ ~ (\lI,""I.)
91. ""'~I"Q'<1I (\lI.-=r.)
Persons 19
24.749
53,339
3,202
2,198
93,552
31,459
4,373
2,983
2,113
8,330
346,984
1,627
15,444
7,167
5,003
3,B54
2,533
2,454
3,940
1,866
2,961
1,826
2,989
5,407
1,871
6,324
4,773
5,466
4,415
8,611
6,484
7,858
3,763
1,793
65,205
60,867
3,259
1,079
1,325
1,321
Total workers
~ Males
20
20,793
44,051
2,405
1,780
84,955
27,650
3,799
2,564
1,933
7,125
313,413
1,495
13,597
6,491
4.455
3,188
2.376
2,236
3.600
1,603
2,693
1,569
2,564
4,783
1,679
5,441
4,380
4,846
4,219
7,475
5,814
6.116
3,143
1,525
57,736
54,044
2,888
804
1.220
1,178
Females 21
3,956
9,288
797
418
8,597
3,809
574
419
180
1,205
33,571
132
1,847
B76
548
466
157
218
340
263
268
257
425
624
192
883
393
620
196
1,136
670
1,742
620
268
7,469
6,823
371
275
105
143
212
Persons 22
22,572
49,904
2,566
1,899
86,489
29,766
3,511
2,813
1,922
7,224
330,646
1,546
13,805
6,495
4.740
3,336
2,488
2,303
3,782
1,529
2,897
1,772
2,632
5,034
1,754
6,059
4,346
5,046
4,195
7,400
5,237
5,460
3,114
1,545
50,147
47,196
2,282
669
745
1,172
Malnworl<:ers
~ Males
23
19,253
42,058
2,170
1,626
80,122
26,456
3,250
2,486
1,833
6,541
301,836
1,446
12,578
6,183
4,300
3,053
2,350
2,144
3,524
1,395
2,648
1,529
2,311
4,517
1,590
5,262
4,101
4,566
4,025
6,591
4,869
4.653
2,699
1,346
45,595
42,889
2,137
569
701
1,067
Categories of main workers
~
Cultivators
Females Persons 24 25
3,319 48
7,846 121
396 76
273 10
6,367 254
3,310 49
261 24
327 14
89 3
683 70
28,812 686
100 15
1,227 39
312 28
440 4
283 26
138 21
159 2
258 9
134 97
249 3
243 3
321 10
517 11
164
797
245 3
480 11
170 3
809 17
368 12
807 14
415 3
199 10
4,552 255
4,307 213
145 40
100 2
44 9
105 8
Males Females 26 27
29 19
71 50
73 3
9
175 79
29 20
22 2
11 3
3
52 18
413 273
15
23 16
21 7
1 3
24 2
13 8
4 5
88 9
2
2
8 2
6 5
1
3
6 5
2
8 9
3 9
13
1 2
9
238 17
198 15
38 2
2
7 2
6 2
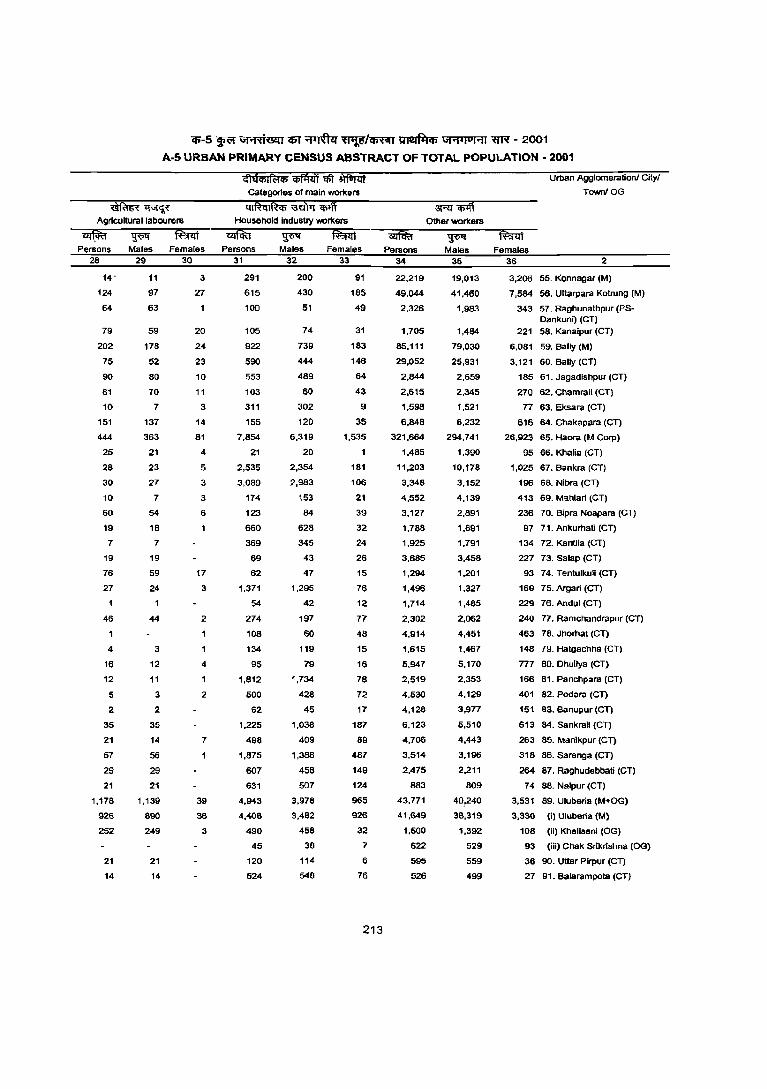
Qi-5 ~ \iI'1'fii6!l1 CI)T ~ ~/q;ffi ~ \iI'1'IOI'11 m;l - 2001
A-5 URBAN PRIMARY CENSUS ABSTRACT OF TOTAL POPULATION - 2001
~~ Agricultural labourers
<{IEtct>I~ct> ~ '1I!t ~ Categories of main workers
4IRqIRct> ~ iiff HousehOld Industty workers
Persons Males Females Persons Males Females 28 29 30 31
79
202
75
90
81
10
151
444
25
28
30
10
60
19
7
19
76
27
46
4
16
12
5
2
35
21
57
29
21
1,178
926
252
21
14
11
97
63
59
178
52
80
70
7
137
363
21
23
27
7
54
18
7
19
59
24
44
3
12
11
3
2
35
14
56
29
21
1,139
890
249
21
14
3
27
20
24
23
10
11
3
14
81
4
5
3
3
6
1
17
3
2
4
1
2
7
39
36
3
291
615
100
105
922
590
553
103
311
155
7,854
21
2,535
3,089
174
123
660
369
69
62
1,371
54
274
108
134
95
1,812
500
62
1,225
498
1,875
607
631
4,943
4,408
490
45
120
624
32
200
430
51
74
739
444
489
60
302
120
6,319
20
2,354
2,983
153
84
628
345
43
47
1,295
42
197
60
119
79
1,734
428
45
1,038
409
1,388
458
507
3,978
3,482
458
38
114
548
33
91
185
49
31
183
146
64
43
9
35
1,535
1
181
106
21
39
32
24
26
15
76
12
77
48
15
16
78
72
17
187
89
487
149
124
965
926
32
7
6
76
213
Persons 34
22,219
49,044
2,326
1,705
85,111
29,052
2,844
2,615
1,598
6,848
321,664
1,485
11,203
3,348
4,552
3,127
1,788
1,925
3,685
1,294
1,496
1,714
2,302
4,914
1,615
5,947
2,519
4,530
4,128
6,123
4,706
3,514
2,475
883
43,771
41,649
1,500
622
595
526
~ "iift Other workers
Male& 35
19,013
41,460
1,983
1,484
79,030
25,931
2,659
2,345
1,521
6,232
294,741
1,390
10,178
3,152
4,139
2,891
1,691
1,791
3,458
1,201
1,327
1,485
2,062
4,451
1,467
5,170
2,353
4,129
3,977
5,510
4,443
3,196
2,211
809
40,240
38,319
1,392
529
559
499
Urban Agglomeration! Cityl
TownIOG
Females 36 2
3,206 55. Konnagar (M)
7,584 56. Uttarpara Kotrung (M)
343 57. Raghunathpur (PSDankuni) (eT)
221 58, Kanaipur (eT)
6,081 59. Bally (M)
3,121 60. Bally (CT)
185 61. Jagadlshpur (eT)
270 62. Chamrail (eT)
77 63. Eksara (eT)
616 64. Chakapara (CT)
26,923 65. Haora (M Corp)
95 66. Khalia (eT)
1,025 67. Bankra (eT)
196 68. Nibra (eT)
413 69. Mahlarl (eT)
236 70. Bipra Noapara (eT)
97 71. Ankurhali (CT)
134 72. KantJia (CT)
227 73. Salap (eT)
93 74. Tentulkuli (eT)
169 75. Argari (CT)
229 76. Andul (eT)
240 77. Ramchandrapur (eT)
463 7B. Jhorhat (eT)
148 79. Hatgachha (CT)
n7 80. Dhuilya (eT)
166 81. Panchpara (CT)
401 82. Podara (eT)
151 83. Banupur (eT)
613 84. Sankrail (eT)
263 85. lIIIanlkpur (eT)
318 86. Sarenga (CT)
264 87. Raghudebbati (CT)
74 88. Nalpur (eT)
3,531 B9. Uluberla (M"'OG)
3,330 (i) Uluberia (M)
108 (ii) Khalisani (OG)
93 (iii) Chak Srikrishna (OG)
36 90. Uttar Pirpur (CT)
27 91. Balarampota (eT)
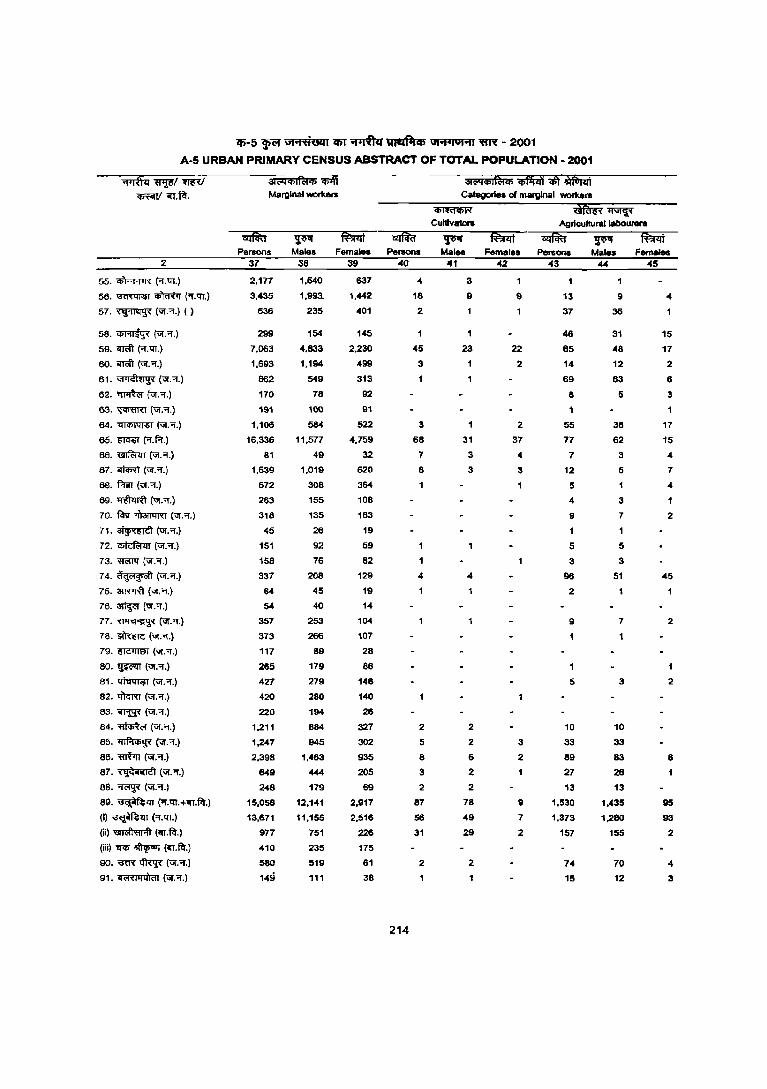
iIi-5 ~ \JI'1~&lI1fiT "'fTT& ~ \11'14101'11 ~ - 2001
A-5 URBAN PRIMARY CENSUS ABSTRACT OF TOTAL POPULATION - 2001
~Wf!5I-mV 31(iQ"'I~'" 'iiiiff 31 (iQ "'1ft.", 'iIifijifI '*i I$iirt ~~.~. Marginal '\NOr1(ers Categories 01 marginal workers
~ ~ lIVI<f' Cultlvatcn Agrlculturallaboul"8l1l
~ ~ ~ '&iMi ~ fi!!Jiirt iIfiffl ~ ~ Persons Males Females Pel'SOllS Mal .. Females Pel1lOll8 Males Fern ....
2 37 38 39 40 '" 42 43 4-4 45
55.~('f.tn.) 2.177 1,640 637 4 3 1
56.~~("I'.tn.) 3,435 1,993. 1,4-42 18 9 9 13 9 4 57. ~ (VI."f.) ( ) 636 235 401 2 37 36
58.~(Uf ..... ) 299 164 145 1 1 48 31 15
59."iIT<'fi (Of.tn.) 7.063 4.833 2.230 45 23 22 65 48 17
60. "iIT<'fi (Uf. 'i.) 1,693 1,194 499 3 2 14 12 2
61. ~ (VI.'i.) 862 649 313 69 63 6
62. ~ (Uf."I'.) 170 78 92 IS 5 3
63. ~ (UI."f.) 191 100 91
64.~(\if . .,.) 1,106 584 522 3 2 55 38 17
65. ~ \-f.f.t.) 16,336 11,577 4,759 68 31 37 77 62 15
66. ~(\iI."!.) 81 49 32 7 3 4 7 3 4
67. ~(VI ..... ) 1,639 1.019 620 6 3 3 12 5 7
68. f.r.rr (VI. "f.) 672 308 354 5 4
69. ~ (UI:'f.) 283 155 108 4 3
70. f® ~ (ilr . ..,..) 318 135 183 9 7 2
71. ~ (vl."f.) 45 26 19 1 1
72. q;fcft;m (Uf."".) 151 92 59 5 5
73. ~ (Uf:'f.) 158 76 82 3 3
74. ~ (VI.'i.) 337 208 129 4 4 96 51 45
75. ~ (VI."".) 54 45 19 1 2
76. art¥r (Uf."".) 54 40 14
77. ~ (vl:'l'.) 357 253 104 9 7 2
78. ~("<i! . .,.) 373 266 107 1
79. ~ (VI."!.) 117 89 28
80.~("<i!."f.) 265 179 86
81.~{;:;r."I.) 427 279 148 5 3 2
82. tiI<mT (vl . ..,..) 420 280 140
83. ~ (VI."".) 220 194 26
84. ~ (Uf • ..,..) 1,211 884 327 2 2 10 10
85. ~ (VI."f.) 1,247 945 302 5 2 3 33 33
86. 'ffWn (VI."f.) 2,398 1,463 935 8 6 2 89 83 6
87. ~ lUf."".) 649 444 205 3 2 1 27 26
88. ~ (VI. "f.) 248 179 69 2 2 13 13
89. ~ \-f.'lI'.HT.flI'.) 15,058 12,141 2,917 87 78 9 1,530 1,435 95
(I) ~ \-f.'IT.) 13,671 11,155 2,516 56 49 7 1,373 1,280 93
(ii)~(lff.flI'.) 977 751 226 31 29 2 157 155 2
(iii)~~~.flI'.) 410 235 175
00. ~ ~ tur . ..,..) 580 519 61 2 2 74 70 4
91. "<ii~I'Ill'I<1I (\;f. "f.) 149 111 38 15 12 3
214
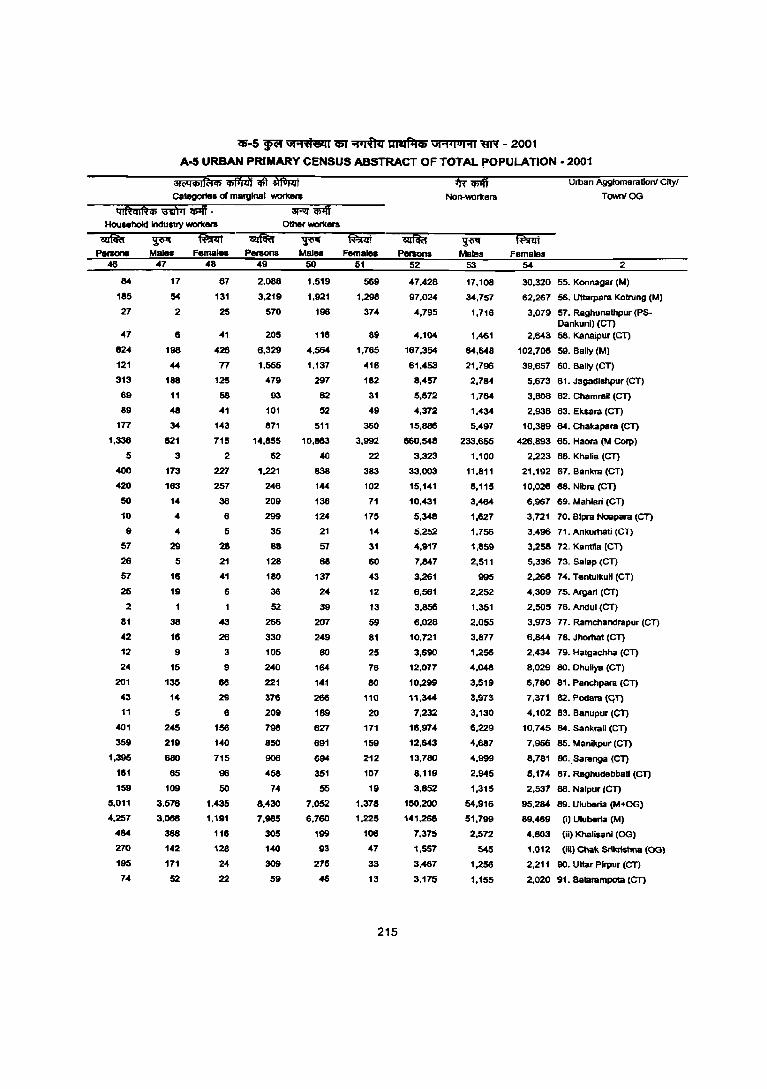
<$-5 ~ Gj.,'fii81i1 i5T ~ ~ G100jal0..,1 lIR - 2001
A-5 URBAN PRIMARY CENSUS ABSTRACT OF TOTAL POPULATION. 2001
Gategor1M of marginal Vo'OfQI1I
q ,j\q ,Ihi 13'ih1T ii5iif . ~ "iiff Houael1Okl Industry WIX1ters
84
185
27
47 624
121
313
69
89
177
1,336
5
400
420
50
10
9
57
26
57
25
2
81
42
12
24
201
43
11
401
359
1,395
181
159
5,011
4.257
484
270
195
74
17
54
2
6
198
44
188
11
48
:)4
621
3
173
163
14
4
4
29
5
16
19
1
38
115
9
15
135
14
5
245
219
680
65
109
3.576
3.066
368
142
171
52
67
131
25
41
426
77
125
58
41
143
715
2
227
257
36
6
5
28
21
41
6
1
43
26
3
9
66
29
6
156
140
715
96
50
1.435
1.191
116
128
24
22
~ ~ 1$iit Persons Males Femal ..
49 50 51
2,088
3.219
570
205
6,329
1,555
479
93
101
871
14.855
62
1,221
246
209
299
35
88
128
180
38
52
266
330
105
240
221
376
209
798
850
906
458
74
8,430
7,985
305
140
309
59
1.519
1.921
196
116
4.564
1.137
297
62
52
511
10,863
40
838
144
138
124
21
57
68
137
24
39
207
249
80
164
14~
266
189
627
691
694
351
55
7,052
6,760
199
93
276
46
569
1.298
374
89
1,765
418
182
31
49
380
3,992
22
383
102
71
175
14
31
60
43
12
13
59
81
25
76
80
110
20
171
159
212
107
19
1,378
1,225
106
47
33
13
215
iiifid PerSons
52
47,428
97.024
4,795
4,104
167,354
61.453
8,457
5.572
4,372
15.886
660.548
3,323
33.003
15.141
10,431
5,348
5.252
4,917
7,847
3,261
6,561
3,856
6,028
10.721
3,690
12.077
10,299
11,344
7,232
16,97'"
12.843
13.780
8,119
3.852
150,200
141,268
7.375
1,557
3.467
3.175
~ Males
53
17,108
34.757
1,716
1,461
64,646
21,796
2,784
1,784
1.434
5.497
233.655
1,100
11.811
5,115
3,484
1.627
1.756
1.659
2,511
995
2,252
1,351
2.055
3.877
1,256
4,048
3.519
3.973
3.130
6,229
4.687
4.999
2,945
1.315
54,916
51.799
2.572
545
1.256
1.155
Urban Agglomeration! City/
TowniOO
fuilif Females
2
30,320 55. Konnagar (M)
62,267 56. Uttarpara Kotrung (M)
3.079 57. Ra9hunalhpur (PSDankunl) (CT)
2,643 58. Kanaipur (CT)
102.706 59. Bally (M)
39,657 60. Bally (CT)
5,673 61. Jagadlshpur (Cn
3,808 62. Chamrall (Cn
2,938 63. Eksara (CT)
10,389 64. Chakapara (CT)
426,893 65. Haora (M Corp)
2,223 66. Khalis (Cn
21,192 67. Bsnkra (CT)
10,026 68. Nibra (Cn
6,967 69. Mahiari (CT)
3.721 70. Blpra Noapsra (CT)
3.496 71. Ankumati (CT)
3,258 72. Kantlla (Cn
5,336 73. Salap (CT)
2.268 74. Tentulkuli (Cn
4,309 75. Algari (CT)
2,505 76. Andul (CT)
3,973 77. Ramchandrapur (CT)
6,844 78. Jhorhat (Cn
2,434 79. Hatgachha (Cn
8,029 80. Dhuilya (CT)
6,780 81. Panchpara (CT)
7,371 62. Podara (GT)
4.102 83. Banupur (CT)
10,745 84. Sankrail (Cn
7,956 85. Manikpur (CT)
8,781 OO .. Sarenga (Cn
5,174 87. Raghudebbali (CT)
2,537 68. Nalpur ICT)
95,284 89. Uluberia (M+OG)
89.469 (i) Uluberia (M)
4,803 (ii) Khalisanl (OG)
1,012 (IH) Chak Srikrishna (00)
2,211 90. Uttar Plrpur (CT)
2.020 91. Balarampota (CT)
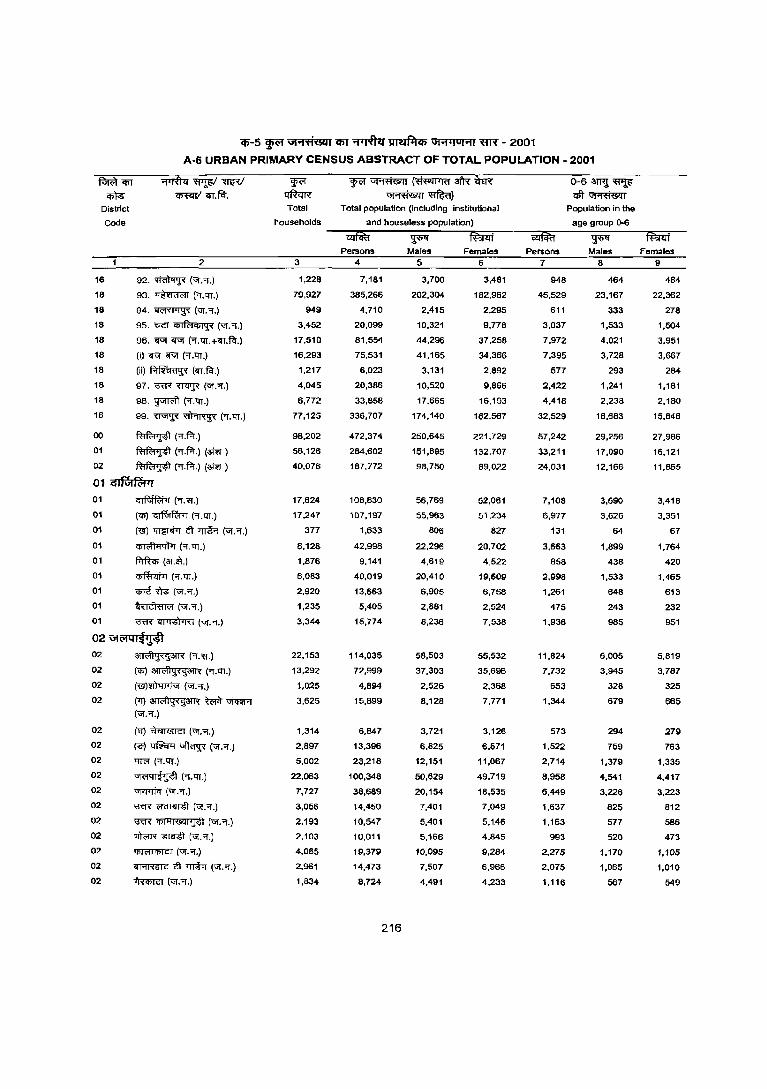
(1)-5 ~ \iI'1'fi&l1 Cfi1 ~ ~ Gi'1'lul'1l "flff - 2001
A-5 URBAN PRIMARY CENSUS ABSTRACT OF TOTAL POPULATION - 2001
~q;r
~ District
Code
2
16 92. ~ (Uf."'I".)
18 93. ~ ('l.trI.)
18 94. ~ (VI. OJ.)
18 95. l:fCT ~ (VI."'I".)
18 96. <f'iI <f'iI ("'I". 'IT. +'IT. fcl.)
18 (I) "ifUf <f'iI ("'1".111.)
18 (ii) ~ (<n.~.)
18 97. ~ <T1I'P ("G!.'f.)
18 98. ~ ("'1".111.)
18 99. TI'iflF ~ (OJ. 'IT.)
00 ~("'I".~.)
01 ~ C'f.~.) (~)
02 ~ ("'f.~.) (arn )
01 GIFutrc;,'1 01 ~("'f.'ff.)
01 (q;) ~ ('i.'IT.)
01 (<<) ~ Cl ~ (VI."'f.)
01 ~("'I".111.)
01 ~ (aT.Iff.)
01 ~ (.,.'IT.)
01 <PTi m (VI."'f.)
01 ~ (VI.'i.)
01 ~~(VI.OJ.)
02 \iI(.iIQI~'}$'l
02 ~(OJ.'ff.)
02 (<15) ~ C'f.<n.)
02 (<lI)Wwtvr ("<if. "'1".)
02 ('1) ~ t<;rit ~ (<if."'I".)
02 (<I) ~ (VI. "'f.)
02 ~ 1:JWqq ~ (VI. "'i.)
02 ""I1<'r ("'f.111.)
02
02
02
02
02
02
02
02
\ij<'NI~1otl (OJ. lIT.)
'Uf<TlJi<r ("G!. '1.)
\'ft'R <'!CIr<mt\ (\if. "'i.)
~ ifillll&ll1'ift ("G!.'1.)
~~(\if."'f.)
~("G!.-r.)
iIT'l'R6lC i\ 'ffih (VI. '1.)
~ ("G!.'1.)
Total
households
3
1,228
79,927
949
3,452
17,510
16,293
1,217
4,045
6,772
77,125
98,202
58,126
40,076
17,624
17,247
377
6.128
1.876
6,083
2.920
1,235
3,344
22,153
13,292
1,025
3,625
1.314
2,897
5,002
22,063
7.727
3,056
2,193
2,103
4,065
2,961
1,834
'W<' ~ (~ afR fEii ~~
Tolal popUlation (induding institutional
and houseless population)
Persons 4
7,181
385,266
4.710
20,099
81,554
75,531
6,023
20,386
33,858
336,707
472,374
284,602
187,772
108,830
107,197
1,633
42.998
9,141
40,019
13,663
5,405
15,774
114,035
72,999
4,894
15,899
6,847
13,396
23,218
100,348
38,689
14,450
10,547
10.011
19,379
14,473
8,724
216
~ Males
5
3,700
202,304
2,415
10,321
44,296
41.165
3.131
10,520
17.665
174,140
250.645
151,895
98,750
56,769
55,963
806
22,296
4.619
20,410
6,905
2,881
8,236
58,503
37,303
2,526
8.128
3.721
6,825
12,151
50,629
20,154
7,401
5,401
5,166
10,095
7,507
4,491
Females
6
3,481
182,962
2,295
9,778
37,258
34.366
2,892
9,866
16,193
162,567
221,729
132,707
89,022
52,061
51,234-
827
20,702
4,522
19,609
6,758
2,524
7,538
55,532
35,696
2,368
7,771
3,126
6,571
11,067
49,719
18,535
7,049
5,146
4,845
9,284
6,966
4,233
Persons 7
948
45,529
611
3,037
7,972
7.395
577
2,422
4,418
32,529
57,242
33,211
24,031
7,108
6,977
131
3,663
858
2,998
1,261
475
1,936
11,B24
7,732
653
1,344
573
1,522
2,714
8,95B
6,449
1,637
1,163
993
2,275
2,075
1,116
0-6 3Wj~
CJft~ Population in the
age group 0-6
~ Males
8
464
23,167
333
1,533
4,021
3,728
293
1,241
2.238
16,683
29,256
17,090
12,166
3,690
3,626
64
l,B99
438
1,533
648
243
985
6,005
3.945
328
679
294
759
1,379
4,541
3.226
825
577
520
1,170
1,065
567
Females 9
484
22,362
278
1,504
3,951
3,667
284
1,181
2,180
15,846
27,986
16,121
11,865
3,418
3,351
67
1.764
420
1,465
613
232
951
5,B19
3,787
325
665
279
763
1,335
4,417
3,223
812
586
473
1,105
1,010
549
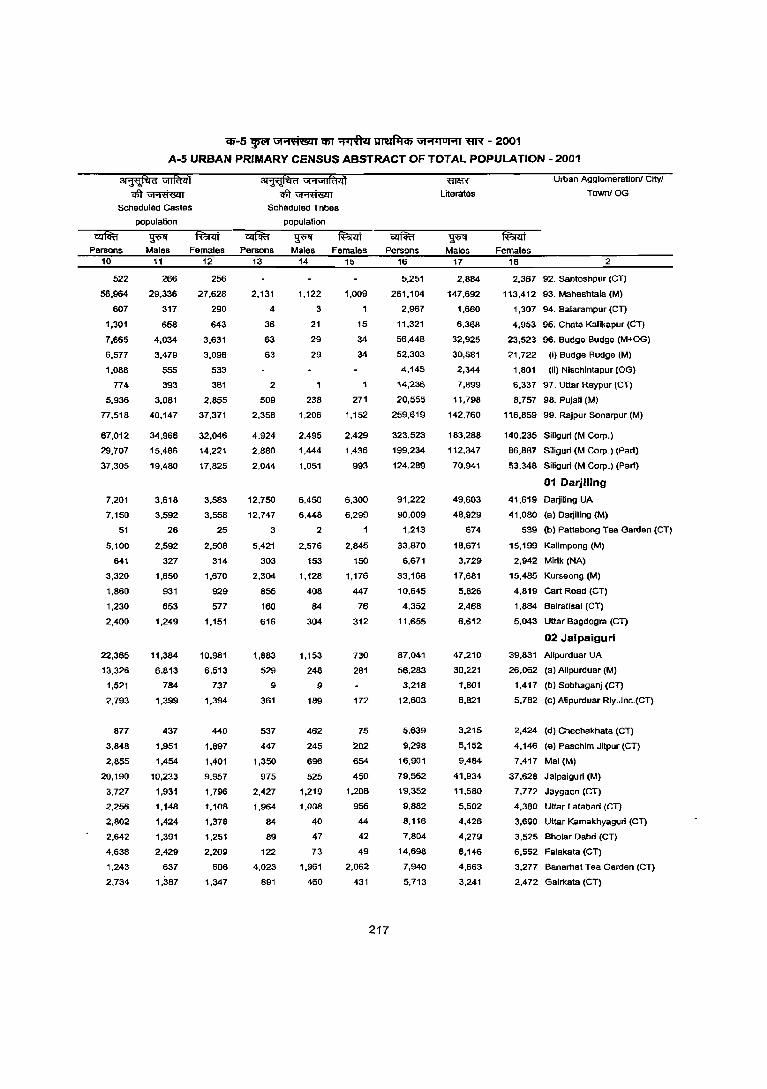
Qi-5 ~ Gt.,'fi'lllQ1 cr;r ~ ~ Gt.,'jOI.,j m;r - 2001
A-5 URBAN PRIMARY CENSUS ABSTRACT OF TOTAL POPULATION - 2001
SCheduled Castes
population
i2ififu ~
~"H\i1Iff14'1 Cfit~
Scheduled Tribes
population
Persons Males Females Persons Males Females 10
522
56.964
607
1.301
7,665
6.577
1.088
774
5.936
77.518
67.012
29,707
37,305
7,201
7.150
51
5,100
641
3,320
1,860
1,230
2,400
22,365
13,326
1,521
2.793
877
3,848
2,855
20,190
3,727
2.256
2,802
2,642
4,638
1,243
2,734
11
266
29.336
317
658
4,034
3,479
555
393
3.081
40,147
34,966
15,486
19,480
3,618
3,592
26
2,592
327
1,650
931
653
1,249
11,384
6,813
784
1,399
437
1,951
1,454
10,233
1,931
1,148
1,424
1,391
2,429
637
1,387
12 13 14 15
256
27,628
290
643
3,631
3,098
533
381
2.855
37,371
32.046
14,221
17,825
3,583
3,558
25
2,508
314
1,670
929
577
1.151
10.981
6.513
737
1.394
440
1,897
1,401
9.957
1.796
1.108
1.378
1.251
2.209
606
1.347
2.131
4
36
63
63
2
509
2.358
4,924
2.880
2,044
12.750
12,747
3
5.421
303
2.304
855
160
616
1,883
529
9
361
537
447
1,350
975
2.427
1,964
B4
89
122
4,023
891
1.122
3
21
29
29
238
1,206
2,495
1.444
1.051
6,450
6,448
2
2.576
153
1,128
408
84
304
1,153
248
9
189
462
245
696
525
1,219
1,008
40
47
73
1,961
460
1.009
15
34
34
1
271
1,152
2,429
1,436
993
6,300
6,299
2,845
150
1,176
447
76
312
730
281
172
75
202
654
450
1,208
956
44
42
49
2,062
431
Persons
217
16
5,251
261.104
2.967
11.321
56,448
52,303
4,145
14,236
20.555
259,619
323,523
199,234
124,289
91,222
90,009
1,213
33,870
6.671
33,166
10,645
4,352
11,655
87,041
56,283
3,218
12,603
5,639
9,298
16,901
79,562
19,352
9,882
8,116
7,8Q4
14,698
7,940
5.713
Literates
~ Males
17
2,884
147.692
1.660
6,368
32,925
30,581
2.344
7,899
11,798
142.760
183,288
112,347
70,941
49,603
48.929
674
18,671
3,729
17,681
5.B26
2,468
6.612
47.210
30.221
1.801
6,821
3.215
5,152
9,484
41,934
11.580
5,502
4,426
4,279
8,146
4,663
3.241
Urban Agglomeration! Cityl
TownIOG
Females 18 2
2.367 92. Santoshpur (eT)
113.412 93. Maheshtala (M)
1,307 94. Balarampur (CT)
4.953 95. Chata Kalikapur (eT)
23,523 96. Budge Budge (M+OG)
21,722 (i) Budge Budge (M)
1,801 (ii) Nisehintapur (OG)
6.337 97. Uttar Raypur leT)
8.757 98. Pujali (M)
116.859 99. Rajpur Sonarpur 1M)
140.235 Sillgurl (M Corp.)
86,887 SUiguri (M Corp.) (Part)
53.348 Siligurl (M Corp.) (Part)
01 Darjiling
41.619 Darjiling UA
41,080 (a) Darjillng (M)
539 (b) Pattabong Tea Garden (CT)
15,199 Kalimpong (M)
2,942 Mirik (NA)
15,485 Kurseong (M)
4,819 Cart Road (CT)
1,884 Bairatisal (CT)
5,043 Uttar Bagdogra (CT)
02 Jalpaiguri
39,831 Alipurduar UA
26,062 (a) Alipurduar (M)
1,417 (b) Sobhaganj(CT)
5,782 (c) Alipurduar Rly.Jnc.(CT)
2,424 (d) Chechakhata (CT)
4,146 (e) Pasehlm Jltpur (CT)
7.417 Mal (M)
37,628 Jalpaigurl (M)
7,772 Jaygaon (CT)
4,380 Uttar Latabar! (CT)
3,690 Uttar Kamakhyaguri (eT)
3.525 Bholar Dabri (CT)
6,552 Falakata (CT)
3.277 Banarhat Tea Garden (eT)
2,472 Galrkata (CT)
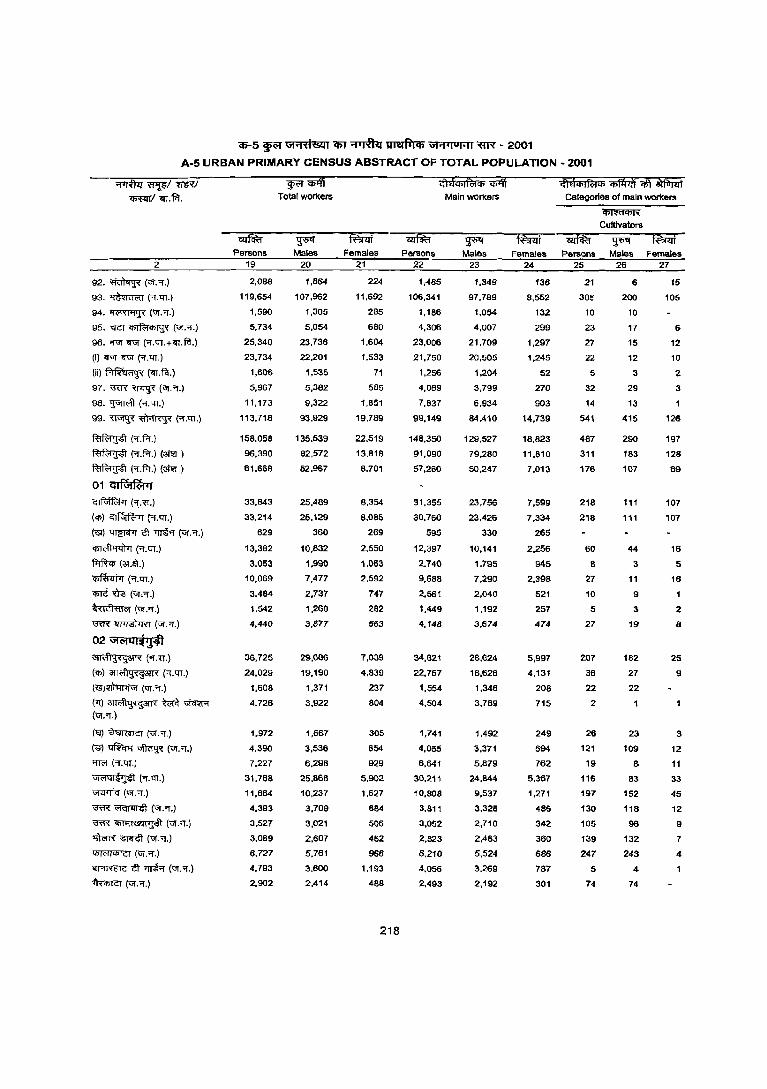
<6-5 ~ GHti&l1 <liT ~ ~ ","1'luHI -mx - 2001
A-5 URBAN PRIMARY CENSUS ABSTRACT OF TOTAL POPULATION - 2001
2
92. ~ (Gf.'1.)
93. ~ ('1.rrr.)
94. ~ (~.'1.)
95. "ICT ~ ('if . .,.)
96. <ro! <ro! ("'f.rrr.+<rr.fit.)
(I) <ro! <ro! ('T.tlT.)
(ii)~("!IT.f<I.)
97. \'ffi'{ ~ (~.9.)
98. ~ (.,.tlT.)
99. ~ ~ ~.rrr.)
~('f.f.r.)
~ ('1.f.r.) (3t1H )
~ ('1.f.r.) (3t1H )
01 <;lfGJr~1'1 ~('T.~.)
(q;) ~ (1.rrr.)
(':;i) t:fIID<ttT tt ~ (VI."'"!.)
~("'"!.rrr.)
~(~.a).)
~('f.rrr.)
q,Jt m (iOT,'1.)
~(Uj.""I.)
\lffi" ~ (ur.<f.)
02 UI(>t q I ~'J'fl
~3fR ("if.'6.)
(q,) afl~ (.,.rrr.)
(<SI)~ (ur.'1.)
('T)~m~ (~.'l.)
("1) ~ (vr.-r.)
(~ ~ ~ (ur."l.)
'!TO! (Of. rrr.)
,;n'lql~~ (""I.tlT.)
\iJWliq (\31. 'T.)
i3TR: ~ ("Gf."'1".)
'fffi" 'Il1"l1®1>ffi\ ("\3[."if.)
~~(vr,"l.)
~(vr."l'.)
~ tt >rrt"l ("\3[.'1.)
~ (<;[."'1".)
Persons 19
2,088
119,654
1,590
5,734
25,340
23.734
1,606
5,967
11,173
113,718
158,058
96,390
61,668
33.843
33,214
629
13,382
3.053
10,069
3.484
1,542
4,440
36,725
24,029
1,608
4.726
1,972
4,390
7.227
31,768
11,864
4,393
3,527
3,069
6.727
4,793
2,902
~ilri Total workers
~ Males
20
1,864
107,962
1,305
5,054
23,736
22.201
1,535
5,382
9,322
93.929
135,539
82.572
52,967
25,489
25,129
360
10,832
1,990
7,477
2,737
1,260
3,877
29,686
19,190
1,371
3,922
1,667
3,536
6,298
25.866
10,237
3,709
3,021
2,607
5.761
3,600
2,414
Females 21
224
11,692
285
680
1,604
1.533
71
585
1.851
19.789
22.519
13.818
8,701
8.354
8,085
269
2.550
1.GS3
2.592
747
282
563
7,039
4.839
237
804
305
854
929
5,902
1.627
684
506
462
966
1.193
488
218
Pel'llons 22
1,485
106.341
1,186
4.306
23.006
21.750
1,256
4,069
7.837
99,149
148.350
91.090
57,260
31.355
30.760
595
12,397
2.740
9.688
2,561
1.449
4,148
34,621
22,757
1,554
4.504
1,741
4,065
6,641
30.211
10,808
3,811
3.052
2.823
6,210
4,056
2,493
Mainwor1<ers
~ Males
23
1,349
97,789
1.054
4,007
21,709
20,505
1,204
3,799
6,934
8.4.410
129.527
79,280
50.247
23.756
23,426
330
10,141
1.795
7.290
2,040
1,192
3,674
28,624
18,626
1,346
3,789
1,492
3,371
5.879
24,844
9.537
3.325
2,710
2,463
5.524
3.269
2,192
~dq;I~q; ~ q\) ~ Categories of main wort<ers
Females Persons 24 25
136 21
8,552 30S
132 10
299 23
1,297 27
1,245 22
52 5
270 32
903 14
14,739 541
18.823 487
11,810 311
7,013 176
7,599 218
7,334 218
265
2,256 60
945 8
2,398 27
521 10
257 5
474 27
5.997 207
4,131 36
208 22
715 2
249 26
694 121
762 19
5,367 116
1,271 197
486 130
342 105
360 139
686 247
787 5
301 74
~
Cultivators
Malea Females 26 27
6 15
200 105
10
17 6
15 12
12 10
3 2
29 3
13
415 126
290 197
183 128
107 69
111 107
111 107
44 16
3 5
11 16
9
3 2
19 8
162 25
27 9
22
23 3
109 12
8 11
83 33
152 45
118 12
96 9
132 7
243 4
4
74
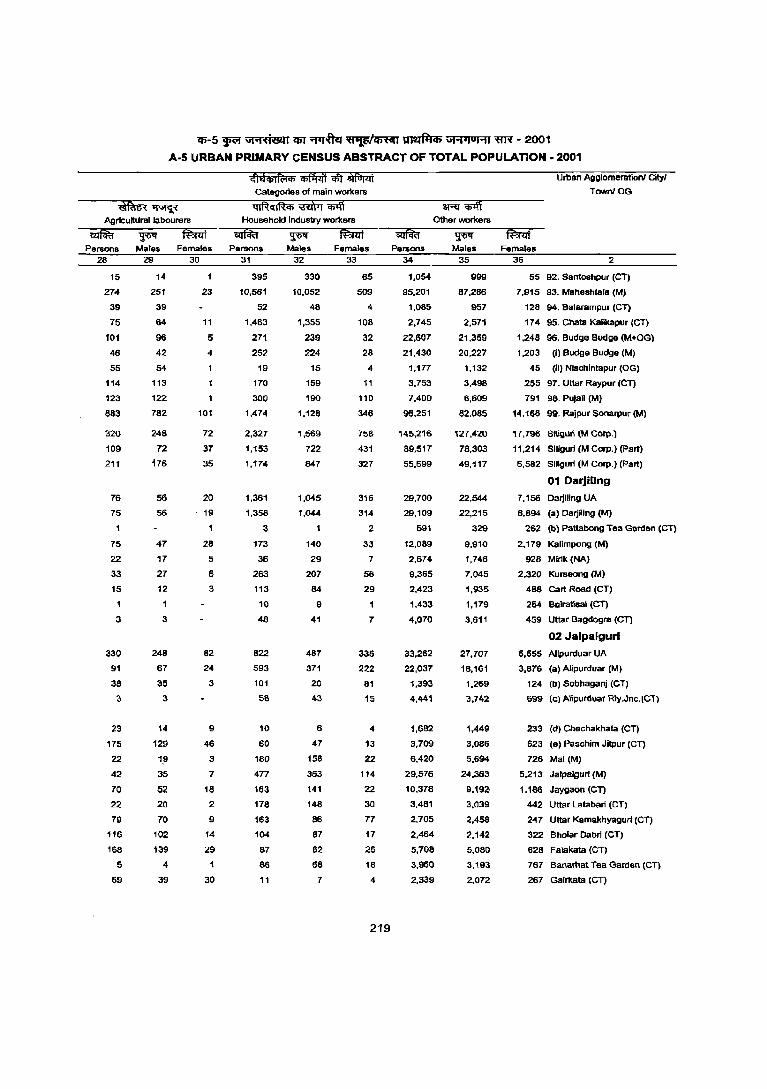
'li>-5 ~ \jj"1~'6lI1 em ~ ~ ~ \J1"1ijUI"11 WR - 2001
A-S URBAN PRIMARY CENSUS ABSTRACT OF TOTAL POPULATION - 2001
~dll>ln;;<t> iiiflI'iif ~ ~ Categories of main workers
~~ QIf.hIlR<t> 'iiI)T[ ~ Agr1cultllrallabourers Household industry workers
Persons Males Females Persons Males Females 28 29 30 31
15
274
39
75
101
46
55
114
123
883
320
109
211
76
75
75
22
33
15
3
330
91
38
3
23
175
22
42
70
22
79
116
168
5
69
14
251
39
64
96
42
64
113
122
782
248
72
176
56
56
47
17
27
12
3
248
67
35
3
14
129
1,9
35
52
20
70
102
139
4
39
23
11
5
4
101
72
37
35
20
19
28
5
6
3
82
24
3
9
46
3
7
18
2
9
14
29
30
395
10,561
52
1,463
271
252
19
170
300
1,474
2,327
1,153
1,174
1,361
1,358
3
173
36
263
113
10
48
822
593
101
58
10
60
180
477
163
178
163
104
87
86
11
32
330
10,052
48
1,355
239
224
15
159
190
1,128
1,569
722
847
1,045
1,044
1
140
29
207
84
9
41
487
371
20
43
6
47
158
363
141
148
86
87
62
68
7
33
65
509
4
108
32
28
4
11
110
346
758
431
327
316
314
2
33
7
66
29
7
335
222
81
15
4
13
22
114
22
30
77
17
25
18
4
219
Other workers
Persons 34
1,064
95,201
1,085
2,745
22,607
21,430
1,177
3,753
7,400
96,251
145,216
89,517
55,699
29,700
29,109
591
12,089
2,674
9,365
2,423
1,433
4,070
33,262
22,037
1,393
4,441
1,682
3,709
6,420
29,576
10,378
3,481
2,705
2,464
5,708
3,960
2,339
Males 35
999
87,286
957
2,571
21,359
20,227
1,132
3,498
6,609
82,085
127,420
78,303
49,117
22,544
22,215
329
9,910
1,746
7,045
1,935
1,179
3,611
27,707
18,161
1,269
3,742
1,449
3,086
5,694
24,363
9,192
3,039
2,458
2,142
5,080
3,193
2,072
Urban Agglomerationl City/
TrnNnlOG
Females 36 2
55 92, Santoshpur (CT)
7,915 93. Maheshtala (M)
128 94, Balarampur (CT)
174 95. Chata Kalikapur leT)
1,248 96. Budge Budge (M+OG)
1,203 (i) Budge Budge (M)
45 (ii) Nischlntapur (OG)
255 97. Uttar Raypur (Cn
791 98. Pu)ali 1M)
14,166 99, Rajpur Sonarpur (M)
17,796 Siliguri (M Corp.)
11,214 SiJiguri (M Corp.) (Part)
6,582 Siliguri (M Corp.) (Part)
01 DarJillng
7,156 Darjiling UA
6,894 (a) Darjiling (M)
262 (b) Pattabong Tea Garden (CT)
2,179 Kalimpong (M)
928 Mink (NA)
2.320 Kurseong (M)
488 Cart Road (eT)
254 Balratisal (CT)
459 Uttar Bagdogra (en 02 Jalpalgurl
5,555 A1ipurduar UA
3,876 (a) Alipurduar (M)
124 (b) Sobhaganj (CT)
699 (e) Alipurduar RIy.Jnc.(CT)
233 (d) Chechakhata (Cn
623 (e) Paschim Jitpur (en
726 Mal (M)
5,213 Jalpalgurl (M)
1,186 Jaygaon (en
442 Uttar Latabari (en
247 Uttar Kamakhyagurl leT)
322 Sholar Dabri (CT)
628 Falakata (CT)
767 Banamat Tea Garden (CT}
267 Gairkata ICn
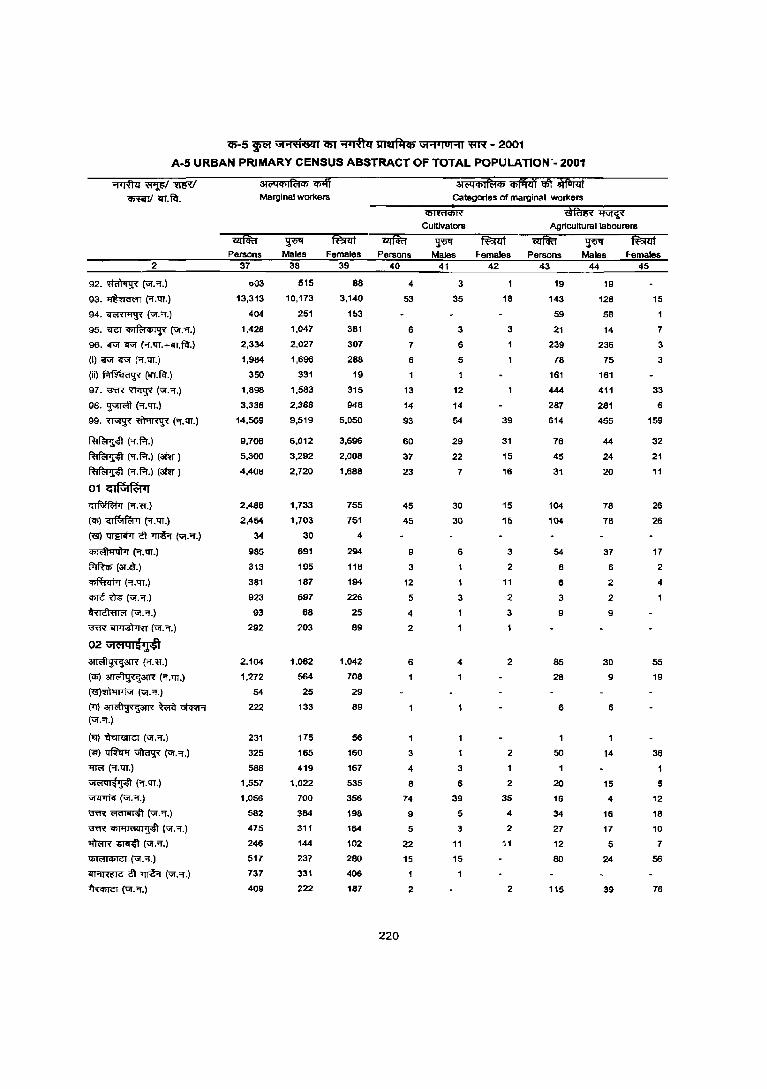
Cfi'-5 ~ Gi'1;A&lll51 "'f'1Tfur ~ Gi'1 l lol'1l ';fIR - 2001
A-5 URBAN PRIMARY CENSUS ABSTRACT OF TOTAL POPULATION'· 2001
2
92,~("Gr."[.)
93. ~ ("'f.lfT.)
94. ~ ("~:'f,)
95. '<re1 ifil~"'I'i" (';1:>1.)
96. ifVI ifVI M.lfT.+i'ff,~.)
(I) lfUI lfUI ("'f.lfT.)
(ii) ~ (iI1.~.)
97. ;re< ~ (VI."'f.)
98.~M.qr.)
99. ~ ~ ("'f."<IT.)
~("'f,f-r.)
~ ("'f.f-r.) (am)
~ (Of.f-r.) (am )
01 C:iFul~11 ~(Of."«,)
(<I»~("'f.lIT.)
(.s) ~ tl ~ ("Gr."'f.)
~("'f,tfT.)
~(3l'.~.)
~('!.lIT.)
CI>Jt ~ (ur."'f.)
~(ur,'!.)
~~(ur.'!.)
02 Giclql~~ ~3!R (<1."«.)
(<I» ~3!R ("I.lIT.)
(.s)~(;;;j."I.)
(ll) ~ ~ ;:;f<m;f (;;;j."I.)
(~~(ur."'f.)
(e) ~ ~ (UI."I.)
~ ("I.tfT.)
Gt",ql:f'J4l ("'f.Q1.)
~ (ur:'f.)
~~(ur."I.)
\'I'TR ifil'1I6Q1 ~ (Uf. 'f.)
~~(1;!."'f.)
1IiT<"I"T15TCT (UI.".)
~ tl >ntoJ (ur,"'f.)
~(VI."'I.)
Marginal workers Gategor1es of margInal workers
Cultlvators Agricultural labourers
Persons Males Females Persons Males Females Persons Males Females 37 38 39 40 41 42 43 44 45
003 515 88 4 3 19 19
13,313 10,173 3,140 53 35 18 143 128 15
404
1,428
2,334
1,984
350
1,898
3,336
14,569
9,708
5,300
4,408
2,488
2,454
34
985
313
381
923
93
292
2.104
1.272
54
222
231
325
586
1,557
1,056
582
475
246
517
737
409
251
1,047
2,027
1,696
331
1,583
2,388
9,519
6,012
3,292
2,720
1,733
1,103
30
691
195
187
697
68
203
1.062
564
25
133
175
165
419
1,022
700
384
311
144
237
331
222
153
381
307
288
19
315
948
5,050
3,696
2,008
1,688
755
751
4
294
118
194
226
25
89
1.042
708
29
89
56
160
167
535
356
198
164
102
280
406
187
220
6
7
6
13
14
93
60
37
23
45
45
9
3
12
5
4
2
6
1
3
4
8
74
9
5
22
15
2
3
6
5
12
14
54
29
22
7
30
30
6
3
1
4
3
6
39
5
3
11
15
3
39
31
15
16
15
15
3
2
11
2
3
2
2
2
35
4
2
11
2
59
21
239
78
161
444
287
614
76
45
31
104
104
54
8
6
3
9
85
28
6
1
50
1
20
16
34
27
12
80
115
58
14
236
75
161
411
281
455
44
24
20
78
18
37
6
2
2
9
30
9
6
1
14
15
4
16
17
5
24
39
7
3
3
33
6
159
32
21
11
26
26
17
2
4
55
19
36
5
12
18
10
7
56
76
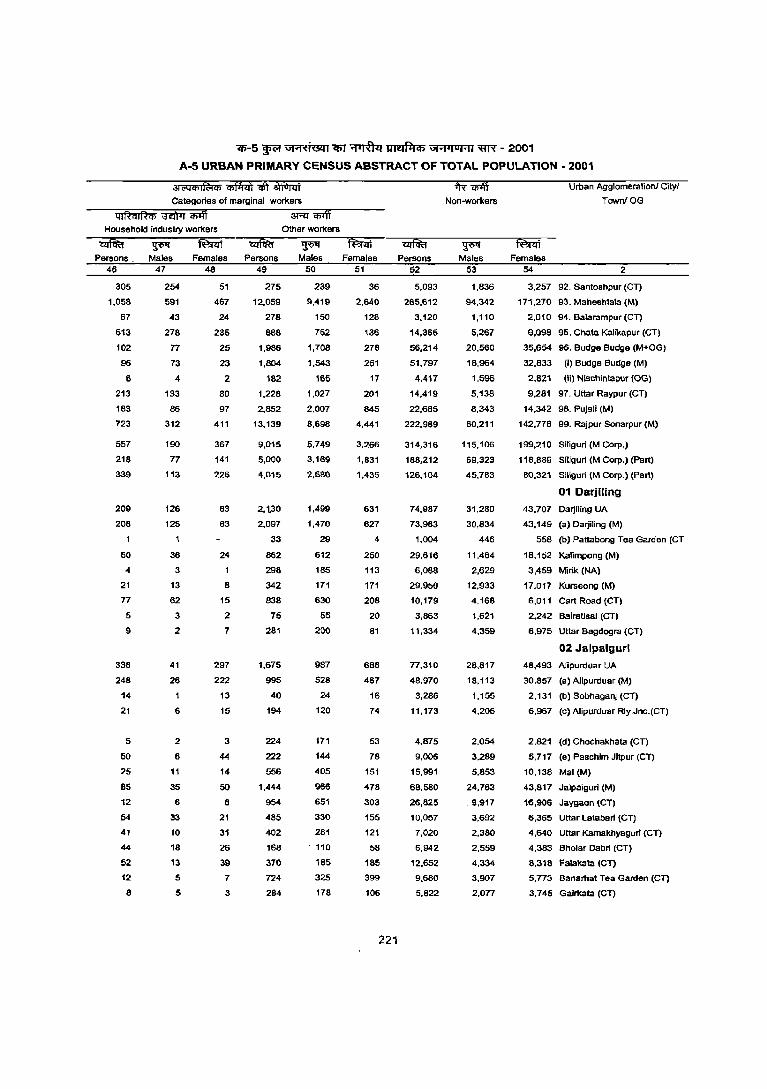
(1)-5 ~ Gl"1't1(!1q1 'i5T ~ ~ UI"1'luHI ~ - 200"1
A-5 URBAN PRIMARY CENSUS ABSTRACT OF TOTAL POPULATION - 2001
Categories of marginal workers
41 fh I~Cfi '3EI)7y i1ff 3RI i1ff Household industry workers
Pen;ons . Males 46 47
305
1,058
67
513
102
96
6
213
183
723
557
218
339
209
208
60
4
21
77
5
9
338
248
14
21
5
50
25
85
12
54
41
44
52
12
8
254
591
43
278
77
73
4
133
86
312
190
77
113
126
125
36
3
13
62
3
2
41
26
6
2
6
11
35
6
33
10
18
13
5
5
Females Persons 48 49
51
467
24
235
25
23
2
80
97
411
367
141
226
83
83
24
8
15
2
7
297
222
13
15
3
44
14
50
6
21
31
26
39
7
3
275
12,059
278
888
1,986
1,804
182
1,228
2,852
13,139
9,015
5,000
4,015
2,1.30
2,097
33
862
298
342
838
75
281
1,675
995
40
194
224
222
556
1,444
954
485
402
168
370
724
284
Other workers
~ Males
50
239
9,419
150
752
1,708
1,543
165
1,027
2,007
8,698
5,749
3,169
2,580
1,499
1,470
29
612
185
171
630
55
200
987
528
24
120
171
144
405
966
651
330
281
. 110
185
325
178
~ Females
51
36
2,640
128
136
278
261
17
201
845
4,441
3,266
1,831
1,435
631
627
4
250
113
171
208
20
81
688
467
16
74
53
78
151
478
303
155
121
58
185
399
106
221
Persons 52
5,093
265,612
3.120
14,365
56,214
51.797
4.417
14.419
22.685
222.989
314.316
188.212
126,104
74.987
73.983
1,004
29.616
6,088
29,950
10.179
3.863
11,334
77,310
48.970
3.286
11.173
4,875
9.006
15.991
68.580
26.825
10,057
7.020
6,942
12.652
9,680
5,822
Non-workers
~ Males
53
1.836
94.342
1,110
5,267
20.560
18.964
1,596
5.138
8.343
80.211
115,106
69,323
45.783
31,280
30,834
446
11,464
2,629
12,933
4,168
1,621
4.359
28,817
18,113
1,155
4,206
2,054
3,289
5,853
24,763
,9.917
3,692
2.380
2,559
4,334
3,907
2,077
Urban Agglomeration/ City!
TownIOG
Females 54 2
3,257 92. Santoshpur (CT)
171,270 93. Maheshtala (M)
2.010 94. Balarampur (CT)
9.098 95, Chats Kalikapur (CT)
35,654 96. Budge Budge (M+OG)
32.833 (I) Budge Budge (M)
2.821 (ii) Nischintapur (OG)
9,281 97. Uttar Raypur (CT)
14,342 98. Puj31i (M)
142,778 99. RaJpur Sonarpur (M)
199.210 Siligurl (M Corp.)
118.889 Siligurl (M Corp,) (Part)
80.321 Siliguri (M Corp.) (Part)
01 Darjlling
43,707 Oarjillng UA
43.149 (a) Oarjilin9 (M)
558 (b) Pattabong Tea Garden (CT
18.152 Kalimpong (M)
3,459 Mirik (NA)
17.017 Kurseong (M)
6.011 Cart Road (CT)
2.242 Bairatisal (CT)
6,975 Uttar Bagdogra (CT)
02 Jalpaiguri
48.493 Alipurduar UA
30,857 (a) Alipurduar (M)
2.131 (b) SobhaganJ (CT)
6,967 (c) Alipurduar R1y.Jnc.(CT)
2,821 (d) Chechakhata (CT)
5,717 (e) Paschim Jitpur (CT)
10,138 Mal (M)
43,817 Jalpaiguri (M)
16,908 Jaygaon (CT)
6,365 Uttar latsbarl (CT)
4.640 Uttar Kamakhyaguri (eT)
4,383 Bholar Dabrl (CT)
8,318 Falakata (CT)
5,773 Banarha! Tea Garden (eT)
3,745 Galrkata (CT)
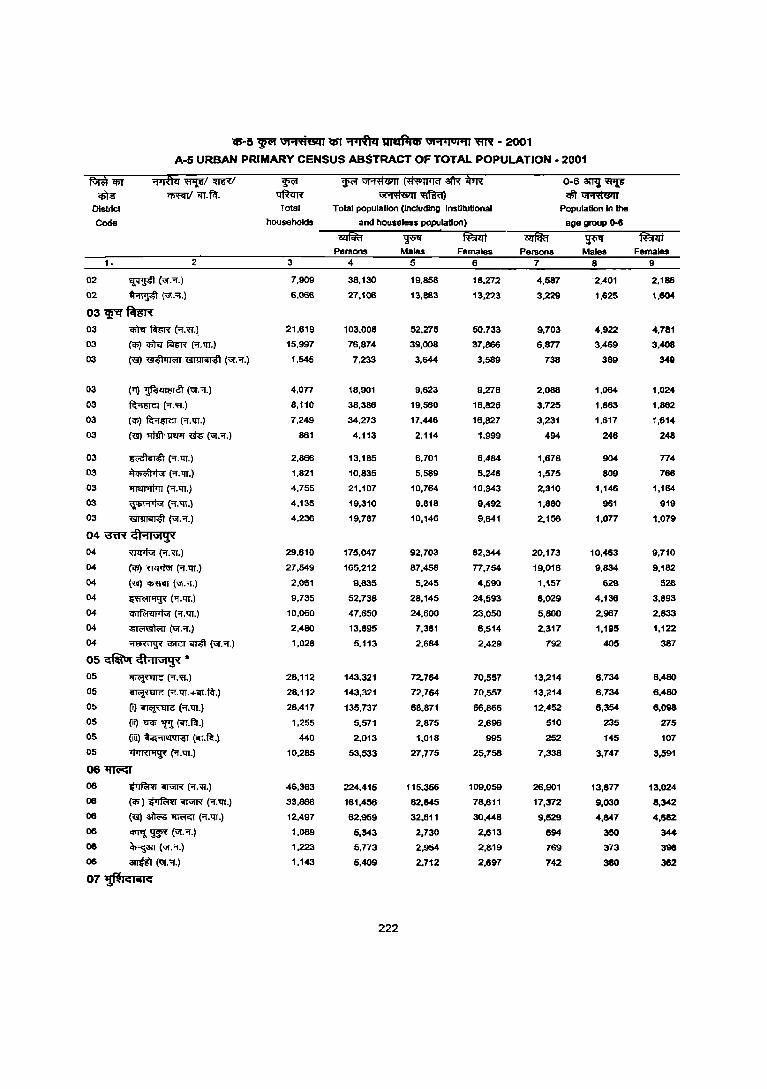
-q;-5 ~ \11 ... ,"&11 Cfi1 ~ ~ \11 .... ,°'.,' ~ -2001
A-5 URBAN PRIMARY CENSUS ABSTRACT OF TOTAL POPULATION - 2001
~ipf ~~/mv ~ ~~~~hi 0-6 3ml~ ~ ~ iIl.fit "IIft<m" ~~ ~~
District Total Total population (Including Instilutlonal Populallon In the
Code households and houseless population) age group ()..6
~ ~ ,
f¥ilit ~ ~ taiIi Persons Males Females Persons Males Females
1· 2 3 4 5 6 7 8 9
02 ~(Uf."i.) 7,909 38,130 19,858 18.272 4,587 '2.401 2,186
02 ~(-;;o;."i.l 6,066 27,106 13.883 13.223 3,229 1,625 1.604
03~~ 03 q;r.J~("i.R) 21,619 103.008 52.275 50.733 9,703 4.922 4.781
03 «I;) <fflTI ~ (Of. lIT.) 15,997 76,874 39.008 37.966 6,877 3,469 3,408
03 (~~~f"l'·"!·) 1,545 7,233 3.644 3.589 738 389 349
03 ('1) ~ (Uf."!.) 4,077 18,901 9,623 9,278 2,088 1,064 1,024
03 ~("f.'H.) 8,110 38,388 19,560 18,826 3,725 1,863 1,862
03 (q;) ~~ ("i.lIT.) 7,249 34,273 17,446 16,827 3,231 1,617 1,614
03 (<§) '!ffifi''!I'IPI' m (Uf.Of.) 861 4,113 2.114 1,999 494 246 248
03 ~("i.lIT.) 2.866 13.185 6,701 6,484 1,678 904 774
03 ~("i.lIT.) 1,821 10,835 5,589 5,246 1,575 809 766
03 1!1m'lf1TI ("I. lIT.) 4,755 21,107 10,764 10,343 2,310 1,146 1,164
03 ~("i.'IT.) 4,135 19,310 9,818 9,492 1,880 961 919
03 ~(Uf.Of.) 4,236 19,787 10,146 9,641 2,156 1,077 1,079
04 ~ <!i"lIGiTC 04 ~(Of.'ff.) 29,610 175,047 92,703 82,344 20,173 10,463 9,710
04 (q;) 'U1l"tUf ("i. tiT.) 27,549 165,212 87,458 77,754 19,016 9,834 9,182
04 (~~(';>l·"!·l 2,061 9,835 5.245 4,590 1,157 629 528
04 ~(Of.lIT.) 9,735 52,738 28,145 24,593 8,029 4,136 3,893
04 "'1~<lI'IVJ (Of. tIT.) 10,060 47,650 24,600 23,050 5,800 2,967 2,833
04 ~(Uf.Of.) 2,480 13,895 7,381 6,514 2,317 1,195 1,122
04 ~ 'CflTCI;;r.ft (Uf."l.) 1,028 5.113 2.684 2,429 792 405 387
05 ~ ~"1I\ij'j'< * 05 ~(Of.'ff.) 28,112 143,321 72.764 70,557 13,214 6,734 6,480
05 ~ (Of.tiT.+~.~.) 28.112 143,321 72.764 70,557 13.214 6.734 6.480
05 (i) ~ (Of. lIT.) 26.417 135,737 68.871 66,866 12.452 6,354 6,098
05 (ii) 't'IQr "r.l «IT. ~.) 1,255 5,571 2.875 2,696 510 235 275
05 (iii) "4'11'441'1)1 «U.~.) 440 2,013 1.018 995 252 145 107
05 ~("i.lIT.) 10,285 53,533 27.775 25,758 7,338 3,147 3.591
06~
06 ~~("!.'ff.) 46,363 224,415 115.356 109,059 26,901 13.877 13,024
06 (Cfl) ~ ~ ("l.tiT.) 33,866 161,456 82.845 18,611 17,372 9,030 8,342
06 (<I) ~ 1Il<'IGI (Of.lIT.) 12,497 62,959 32.511 30,448 9,529 4,847 4,682
06 iIl11l ~ (Uf.Of.) 1,089 5,343 2.730 2,613 694 350 l4" 06 ~(\j(' . ..,.) 1,223 5,773 2,954 2,819 769 373 396
06 ants) (Uf. "'.) 1,143 5,409 2.712 2,697 742 380 362
07 ~Ic:li"<=
222
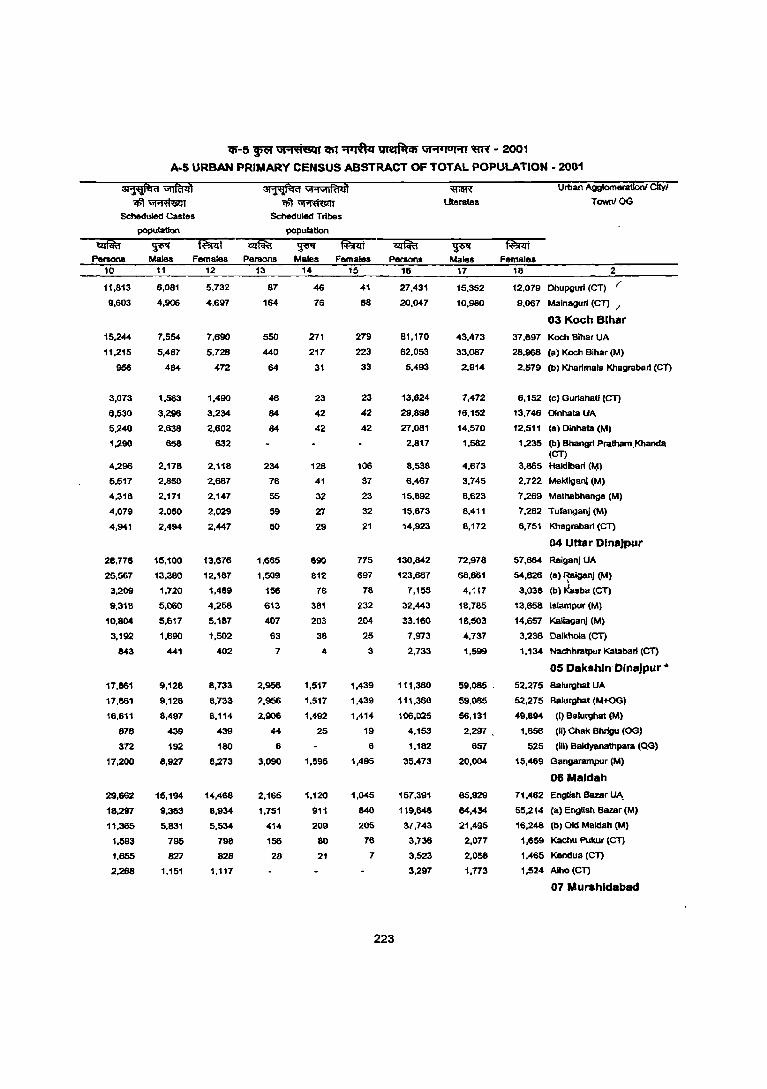
?li-5 ~ GI",iiEi6Q1 ~ ~ ~ ",1'1_1°1.,1 ~ - 2001
A-5 URBAN PRIMARY CENSUS ABSTRACT OF TOTAL POPULATION - 2001
~ "GitFciili *'~
Scheduled Castes
population
taiIt Females
10
11,813
9,603
15,244
11,215
956
3,073
6,530
5,240
1,290
4,296
5,511
4,318
4,079
4,941
28,176
25,567
3,209
9,318
10.804
3.192
843
17.861
11.861
16.611
878
372
17,200
29,662
18,297
11.365
1,593
1,655
2,268
11
6.081
4.906
7,554
5.487
484
1.583
3,296
2,638
658
2.178
2,B5()
2.171
2.050
2.494
15,100
13,380
1.720
5,060
5.611
1.690
441
9,128
9,128
8.497
439
192
8.921
15.194
9.363
5,831
795
827
1,151
12
5,732
4,697
7,690
5,728
472
1,490
3,234
2.602
632
2.118
2,687
2,147
2.029
2.447
13,676
12,187
1,489
4.258
5.187
1,502
402
8.733
8.733
8.114
439
180
8,273
14,468
8,934
5.534
798
828
1.117
~ "1'1U1IFti4'l
*'~ Scheduled Tribes
~ Persons
13
81
164
55()
440
64
46
84
84
234
78
55
59
50
1.665
1,509
156
613
407
63
7
2.956
2.956
2,906
44
6
3,090
2.165
1,751
4'4
156
28
population
~ f$l(if Males Females
14 15
46 41
76 88
271 279
217 223
31 33
23 23
42 42
42 42
128 106
41 31
32 23
27 32
29 21
890
812
78
381
203
38
4
1.517
1,517
1,492
25
1,595
1,120
911
209
80
21
715
697
78
232
204
25
3
1,439
1,439
1,414
19
6
1,495
1.045
840
205
76
1
~ Persons
16
27,431
20,047
B1.170
62.053
5.493
13,624
29,898
27,081
2.817
8,538
6,467
15,892
15,673
14,923
130,842
123,687
7.155
32,443
33,160
7,973
2,733
111.360
111.360
106.025
4,153
1.182
35,473
157,391
119,848
37.743
3.736
3,523
3,297
223
~
Uteratss
~ Males
17
15,352
10,980
43.413
33,087
2.914
7.472
16,152
14,570
1,582
4,673
3.745
8.623
8.411
8,172
72,978
68.861
4,117
18.7a5
18.503
4,731
1.599
59.085
59,085
56,131
2.297.
651
20,004
85,929
64,434
21,495
2.077
2,058
1,773
f.£it Females
Urban Agglomeration! Cltyl
TownIOG
18 2
12,079 Dhupgurl (CT) f
9,067 Malnagurl (CT) I
03 Koch Bthar
37,691 Koch Bihar UA
28,966 (a) Koch Bihar (M)
2,579 (b) Kharimala J<hagrabarl (CT)
6,152 (c) Guriahali (CT)
13,746 Dlnhata UA
12.511 (a) Dlnhata (M)
1,235 (b) Bhangri PrathamKhanda (CT)
3,865 Haldlbari ( ... )
2,722 Mekllganj (M)
1,269 Matl\sbhanga (M)
7.262 TufangaoJ (M)
6,751 Khagrabari (CT)
04 Uttar OlnaJpur
51,864 Raiganj UA
54.826 (a) ~lganj (M)
3.038 (b) Ka&ba (CT)
13.658 Islampur (M)
14,651 KaiiaganJ (M)
3,236 Dalkhola (CT)
1,134 Nachhratpur Katabarl (eT)
05 Oakshln OlnaJpur'"
52,275 Balurghat UA
52,215 Balurghat (M+OG)
49,894 (I) Balurghat (M)
1,856 (Ii) Chak Bhrigu (OG)
525 (III) Baldyanathpara (QG)
15,469 Gangarampur (M)
06 Maldah
71,462 English Bazar U~
55.214 (a) English Bazar (M)
16.248 (b) Old Maldah (M)
1,659 Kachu Pultur (CT)
1.465 Kar\clua (Cl)
1,524 AIho (CT)
07 Murshldabad
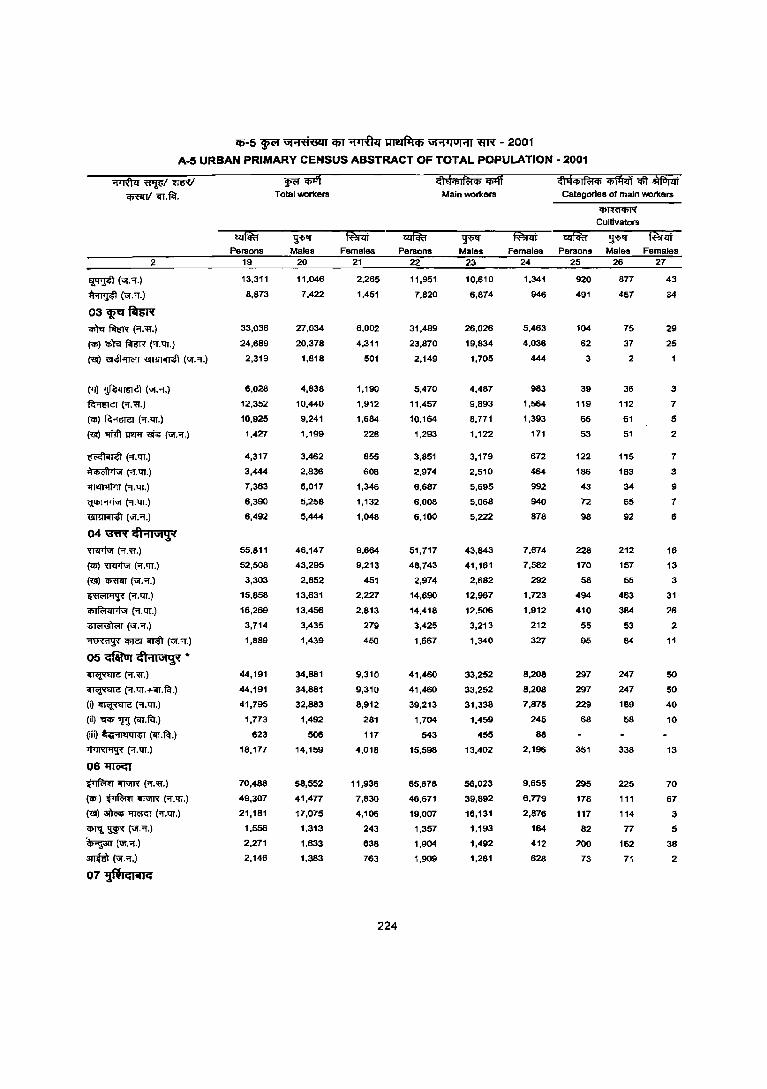
"'-5 ~ ut"lti6ZlllPl 'flTfuI ~ \iI'1.,ul"llllR - 2001
A-5 URBAN PRIMARY CENSUS ABSTRACT OF TOTAL POPULATION - 2001
~(",."I.)
~(ur."1".)
2
03<r'~ m~("I.'H.)
(q;) ~ ~ ("'f.QT.)
~ ~ ~ ("'."1".)
(>1) ~t;Jti (", . .,.)
~("I.'H.)
(1fi)~("I.QT.)
(<ill 1'!t!fI tJ2I1r m ('Gf.'i.)
~('i.tIT.)
~("'1".QT.)
~("I.'lT.)
~("I.tIT.)
~(\;I.'i.)
04 ~ <!I"lIut~ ~("'i".'R.)
(q;) 'mI'tiir ("if. 'IT.)
(<iI) ~ (\;1."'1".)
~('i.tIT.)
(j)1~<JI'I'" ("I.'lT.)
~(",.'i.)
'itffillF q;rer ~ {VI. 'i.)
05 ~ cft"1lutcji( * ~("if.'H.)
~ ("I.'lT.+4IT.~.)
(i) ~ (""I.'lT.)
(ii) 'qq; "'P.I ~.f4.) (iii) ~~"I"Iltm (111.1'4.)
~(""I.QT.)
06 liTQi;J
l'Tftm ;m;rR (..,..'R.)
{<r>l ~ 1ITIlIR ("".tIT.)
~ ~ 'l'R'IGf (""I.tIT.)
<I>fll ~ (\lI . ..,..) ~ (1lf.'i.)
~ (1lf.'f.)
07 ijlllCiliClCi
iiiMf Persons
19
13.311
8,873
33,036
24,689
2,319
6,028
12,352
10.925
1.427
4,317
3,444
7,363
6,390
6,492
55,811
52,508
3,303
15,858
16,269
3,714
1,889
44,191
44,191
41,795
1,713
623
18,177
70,488
49,307
21,181
1,556
2,211
2,146
~iiff T olal workers
~ Males
20
11,046
7,422
27,034
20,378
1,818
4,838
10,440
9,241
1.199
3,462
2,836
6,017
5,258
5,444
46,147
43,295
2,852
13,631
13.456
3,435
1,439
34,881
34,881
32,883
1,492
506
14,159
58,552
41,477
17,075
1.313
1,633
1,383
~ Females
21
2.265
1,451
6,002
4,311
501
1,190
1,912
1,684
228
855
608
1,346
1,132
1,048
9,664
9,213
451
2,227
2,813
279
450
9,310
9,310
8,912
281
117
4,018
11,936
7,830
4,106
243
638
763
224
Persons 22
11,951
7,820
31,489
23,870
2,149
5,470
11,457
10.164
1,293
3,851
2,974
6,687
6,008
6,100
51,717
48,743
2,974
14,690
14,418
3,425
1,667
41,460
41,460
39,213
1,704
543
15,598
65,678
46,671
19,007
1,357
1,904
1,909
Main workers
~ Males
23
10,610
6,874
26,026
19,834
1,705
4,487
9,893
8,771
1,122
3,119
2,510
5,695
5,068
5,222
43,843
41,161
2,682
12,967
12,506
3,213
1,340
33,252
33,252
31,338
1,459
455
13,402
56,023
39,892
16,131
1,193
1,492
1,281
Categories of main workers
~
Cultivators
Females Persons Males Females 24 25 26 27
1.341 920 877 43
946 491 457 34
5.463 104 75 29
4,036 62 37 25
444 3 2
983 39 36 3
1,564 119 112 7
1,393 66 61 5
171 53 51 2
672 122 115 1
464 186 183 3
992 43 34 9
940 72 65 7
878 '38 92 6
7,874 228 212 16
7,582 170 157 13
292 58 55 3
1.723 494 463 31
1.912 410 384 26
212 55 53 2
327 95 84 11
8,208 297 247 50
8,208 297 247 50
7,875 229 189 40
245 68 58 10
88
2,196 351 338 13
9,655 295 225 70
6,179 178 111 67
2,B76 117 114 3
164 82 77 5
412 200 162 38
628 73 71 2
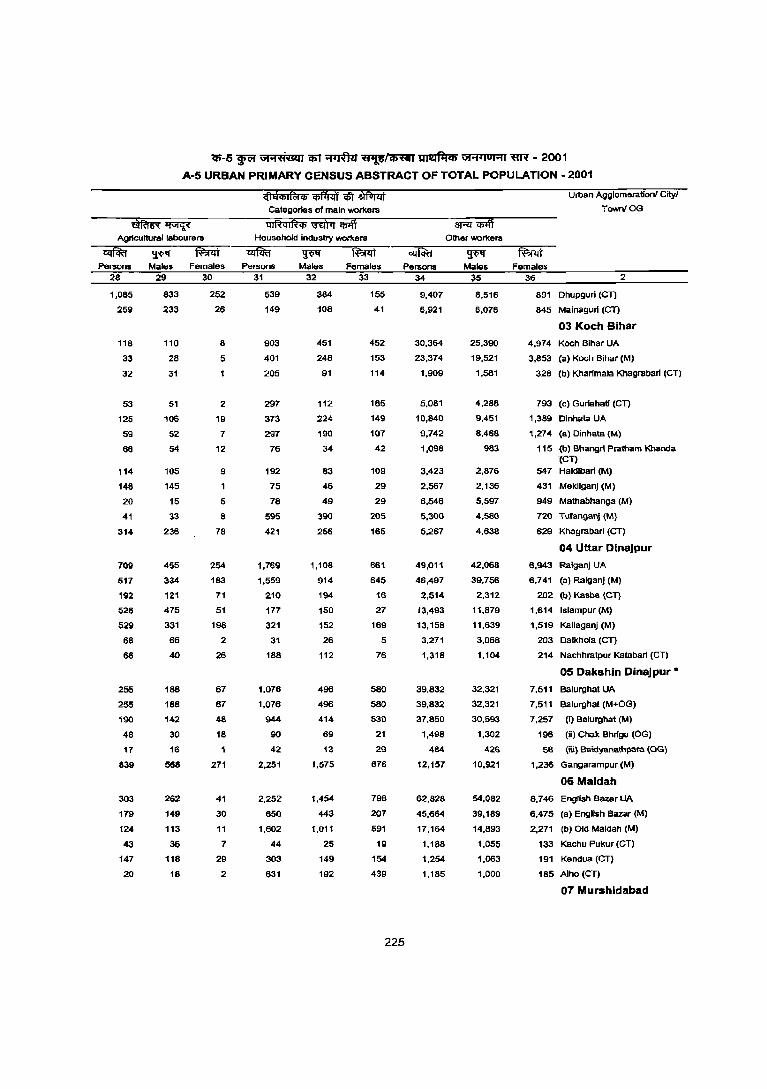
<5-5 ~ ", ... d&ll q;r "'1'1l'fur ~~ ~ "' .... 101'11 ~ - 2001
A-5 URBAN PRIMARY CENSUS ABSTRACT OF TOTAL POPULATION - 2001
Agricultural labourers
~ Q"ilR>I '" "iI#fm ~ :;mrlli categories of main workers
ql~ql~"''G'l'I'i1T~ HousehOld indusb'y workers
~ Pel1lons Males Females Pel1lons Males Females
28 29 30 31
1,085
259
118
33
32
53
125
59
66
114
146
20
41
314
709
517
192
526
529
68
66
255
255
190
48
17
839
303
179
124
43
147
20
833
233
110
28
31
51
106
52
54
105
145
15
33
236
455
334
121
475
331
66
40
188
188
142
30
16
568
262
149
113
36
118
18
252
26
8
5
2
19
7
12
9
1
5
8
78
254
183
71
51
198
2
26
67
67
48
18
271
41
30
11
7
29
2.
539
149
903
401
205
297
373
297
76
192
75
78
595
421
1,769
1,559
210
177
321
31
188
1,076
1,076
944
90
42.
2,251
2,252
650
1,602
44
303
631
32
384
108
451
248
91
112
224
190
34
83
46
49
390
256
1,108
914
194
150
152
26
112
496
496
414
69
13
1,575
1,454
443
1,011
25
149
192
33
155
41
452
153
114
185
149
107
42
109
29
29
205
165
661
645
16
27
169
5
76
580
580
530
21
29
676
79B
207
591
19
154
439
Persons 34
9,407
6,921
30,364
23,374
1,909
5,081
10,840
9,742
1,098
3,423
2,567
6,546
5,300
5,267
49,011
46,497
2,514
13,493
13,158
3,271
1,318
39,832
39,832
37,850
1,498
484
12,157
62,828
45,664
17,164
1.188
1,254
1,185
225
Other workers
~ Males
35
8,516
6,076
25,390
19,521
1,581
4,288
9,451
8,468
983
2,876
2,136
5,597
4,580
4,638
42,068
39,756
2,312
11,879
11,639
3,068
1,104
32,321
32,321
30,593
1,302
426
10,921
54,082
39,189
14,893
1,055
1,063
1,000
Urban Agglomeration! City/
TawniOG
Females 36
891 Dhupguri (CTI
845 Mainaguri (CT)
2
03 Koch Bihar
4,974 Koch Bihar UA
3,853 (a) Koch Bihar (M)
328 (b) Kharimala Khagrabari (CT)
793 (cl Gurlahatl (Cn
1,389 Dlnhata UA
1,274 (al Dinhata (M)
115 (b) Bhangri Pratham Khanda '(CT)
547 Haldlbarl (M)
431 Mekliganj (M)
949 Mathabhanga (M)
720 Tufanganj {M}
629 Khagrabari (CT)
04 Uttar Olnajpur
6,943 Ralganj UA
6,741 (a) Raiganj (M)
202 (b) Kasba {CT}
1,614 Islampur (M)
1,519 Kallaganj (M)
203 Dalkhola (CT)
214 Nachhratpur Katabari (Cn
05 Oakshln DinaJpur ..
7,511 Balurghat UA
7,511 Balurghat (M+OG)
7,257 (i) Balurghat (M)
196 (ii) Chak Bhrigu (OG)
58 (iii) Baidyanathpam lOG)
1,236 Gangarampur (M)
06 Maldah
8,746 English Bazar UA
6,475 (a) English Bazar (M)
2,271 (b) Old Maldah (M)
133 Kachu Pukur (en 191 Kendua (CT)
185 AihO (Cn
07 Murshldabad
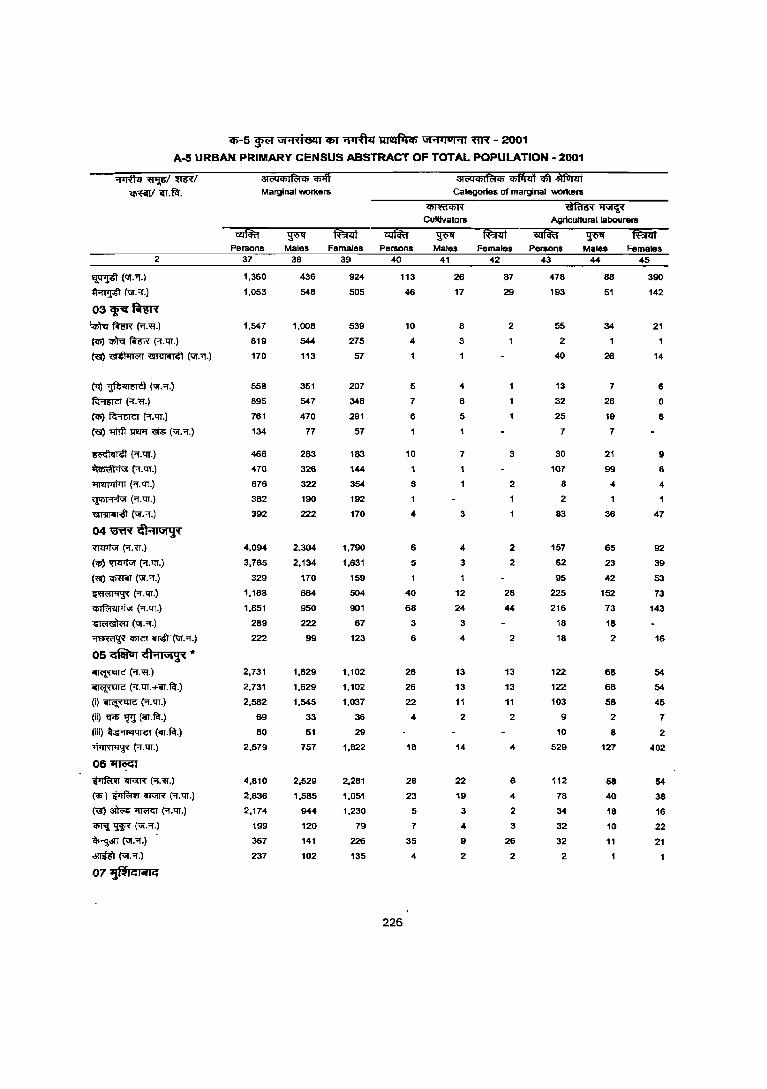
'if;'-5 ~ Vi'1ti6!l1 i6T ~ ~ GI'1',UH' ~ - 2001
A-5 URBAN PR'MARY CENSUS ABSTRACT OF TOTAL POPULATION - 2001
~("G!.'f.)
~(\;T."'f.)
2
03<Jfit~ iq;'fq ~ R.'H.)
(iii) iP'reI ~ ("I."tIT.)
~~~(\if.'f.)
('l) ~ (-.;r."I.)
~("'f.'H.)
(q;) ~ ('f."tIT.)
~ 'It!fi 1I¥lli fi (UI. "I.)
~(.,..tIT.)
~R·"tIT·)
~("'."tIT.)
~("'f."tIT.)
~(UI."I.)
04 mf{ lfI ... ,Vi'j't
'lflrlfvr ("I. 'H.)
('Ii)~R.tIT.)
(~ <IRm (-.;r."'l'.)
~("I."tIT.)
<l>1f<:i41 I j"l ("I.tIT.)
~(-.;r . .,..)
~"iI>TCI ~ (,"."1.)
05 <:fiIur <fl '1M!f< ..
~R.'H.)
~ ("I.tIT.+ilT.f<r.)
(i)~("I.ltT.)
(ii) <Til> 'm (~.f<r.) (iii) ~ (iIT.f<r.)
~("I."tIT.)
06~
~ iIT\iIR (Of.-q:[.)
(q» ~ iIT\iIR ("'l'.ltT.)
~~~("I."tIT.)
"iI>1'iI'HR (\if."I.)
~('lr:'f.)
~(\iI."I.)
07~c:;'''''C:;
Marginal worl<ers categories of marginal WOrI<ers
Cultivators AgrIcultural labourers
Persons Males Females Persons Males Females Persons MaleS Females 37 38 39 40 41 42 43 44 45
1,360 436 924 113 26 87 478 88 390
1.053 548 505 46 17 29 193 51 142
1,547 1,008 539 10 8 2 55 34 21
819
170
558
895
761
134
466
470
676
382
392
4,094
3,765
329
1,168
1,851
289
222
2,731
2,731
2,582
69
80
2,579
4,810
2,636
2,174
199
367
237
544
113
351
547
470
77
283
326
322
190
222
2,304
2,134
170
664
950
222
99
1,629
1,629
1,545
33
51
757
2,529
1,585
944
120
141
102
275
57
207
348
291
57
183
144
354
192
170
1,790
1,631
159
504
901
67
123
1,102
1,102
1,037
36
29
1,822
2,281
1,051
1,230
79
226
135
226
4
5
7
6
10
4
6
5
40
68
3
6
26
26
22
4
18
28
23
5
7
35
4
3
4
6
5
7
3
4
3
12
24
3
4
13
13
11
2
14
22
19
3
4
9
2
3
2
2
2
28
44
2
13
13
11
2
4
6
4
2
3
26
2
2
40
13
32
25
7
30
107
8
2
83
157
62
95
225
216
18
18
122
122
103
9
10
529
112
78
34
32
32
2
26
7
26
19
7
21
99
4
36
65
23
42
152
73
18
2
68
68
58
2
8
127
58
40
18
10
11
1
14
6
6
6
9
8
4
47
92
39
53
73
143
16
54
54
45
7
2
402
54
38
16
22
21
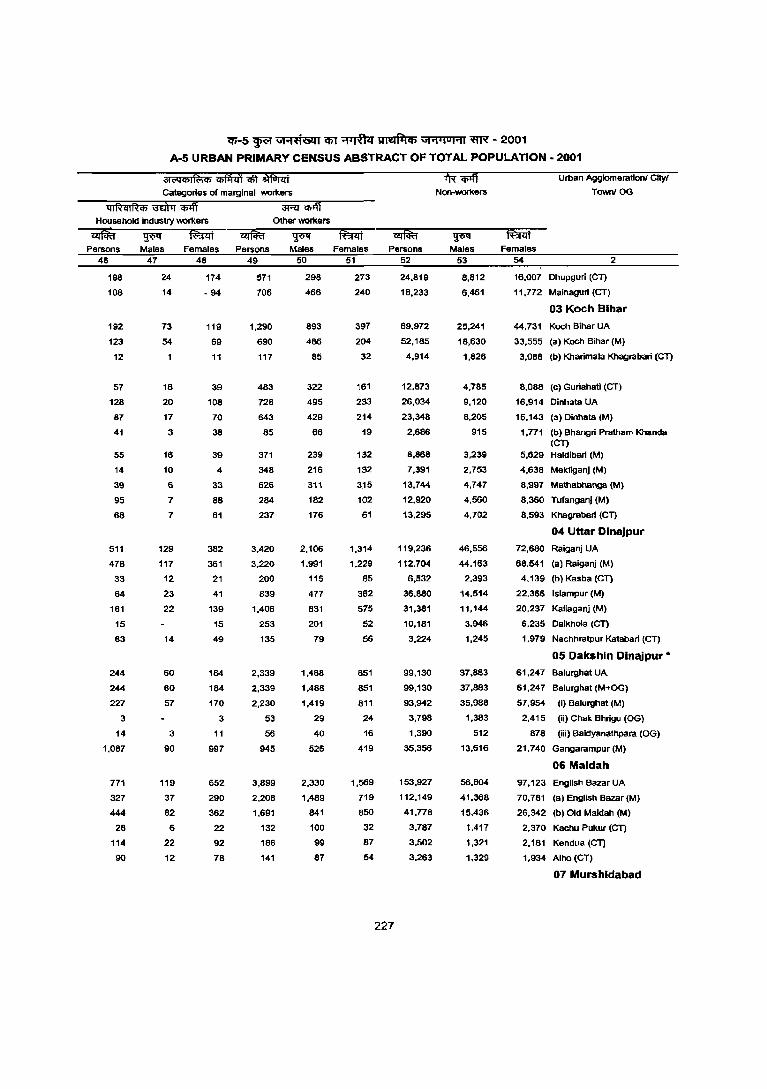
<11-5 ~ "''1'C1GZ1I <liT ~ ~ "''14IUI'1I ~ - 2001
A-5 URBAN PRIMARY CENSUS ABSTRACT OF TOTAL POPULATION· 2001
31 (iljCj)IR:iCj) ifi@f ~ JM&Tlit Categories of marginal worlcers Non-worlcers
Urban Agglomeration! Cltyl
Town/OO
Household Industry worlcers Other worlcers
Persons 46
198
108
192
123
12
57
128
87
41
55
14
39
95
68
511
478
33
64
161
15
63
244
244
227
3
14
1,087
771
327
444
28
114
90
Males 47
24
14
73
54
18
20
17
3
16
10
6
7
7
129
117
12
23
22
14
60
60
57
3
90
119
37
82
6
22
12
Females Persons 48 49
174
-94
119
69
11
39
108
70
38
39
4
33
88
61
382
361
21
41
139
15
49
184
184
170
3
11
997
652
290
362
22
92
78
571
706
1,290
690
117
483
728
643
85
371
348
626
284
237
3,420
3.220
200
839
1,406
253
135
2,339
2,339
2,230
53
56
945
3,899
2,208
1,691
132
186
141
Males 50
298
466
893
466
85
322
495
429
66
239
216
311
182
176
2,106
1,991
115
477
831
201
79
1,488
1,488
1,419
29
40
526
2,330
1,489
841
100
99
87
Females 51
273
240
397
204
32
161
233
214
19
132
132
3.15
102
61
1,314
1,229
85
362
575
52
56
851
851
811
24
16
419
1,569
719
850
32
87
54
Persons
227
52
24,819
18,233
69,972
52,185
4,914
12,873
26,034
23,348
2,666
8,668
7,391
13,744
12,920
13,295
119,236
112,704
6,532
36,880
31,381
10,181
3,224
99,130
99,130
93,942
3,798
1,390
35,356
153,927
112,149
41,778
3,787
3,502
3,263
~ Males
53
8,812
6,461
25,241
18,630
1,826
4,785
9,120
8,205
915
3,239
2,753
4,747
4,560
4,702
46,556
44,163
2,393
14,514
11,144
3,946
1,245
37,883
37,883
35,988
1,383
512
13,616
56,804
41,368
15,436
1,417
1,321
1,329
Females 54
16,007 Dhupguri (CT)
11,772 Mainaguri (CT)
2
03 Koch Bihar
44,731 Koch Bihar UA
33,555 (a) Koch Bihar (M)
3,088 (b) Kharimala Khagrabari (CT)
8.088 (c) Guriahatl (CT)
16,914 Dinhata UA
15,143 (a) Dinhata (M)
1,771 (b) Bhangri Pratham Khanda (Cn
5,629 Haldibari (M)
4.638 Mekliganj (M)
8,997 Matnabllanga (M)
8,360 Tutanganj (M)
8,593 Khagrabari (Cn
04 Uttar Dinajpur
72,680 Raiganj UA
68,541 (a) Raiganj (M)
4,139 (b)Kasba(CT)
22,366 Islampur (M)
20,237 Kallaganj (M)
6,235 Dalkhola (CT)
1,979 Nachhratpur Katabari (CT)
05 Oakshin Dlnajpur •
61,247 Balurghat UA
61,247 Balurghat (M+OO)
57,954 (i) Balurghat (M)
2,415 (ii) Chak Bhrigu (OG)
878 (iii) Baidyanathpara (OG)
21,740 Gangarampur (M)
06 Maldah
97,123 English Bazar UA
70,781 (a) English Bazar (M)
26.342 (b) Old Maldah (M)
2.370 Kachu Pukur (CT)
2,181 Kendua (eT)
1,934 Aiho (CT)
07 Murshidabad
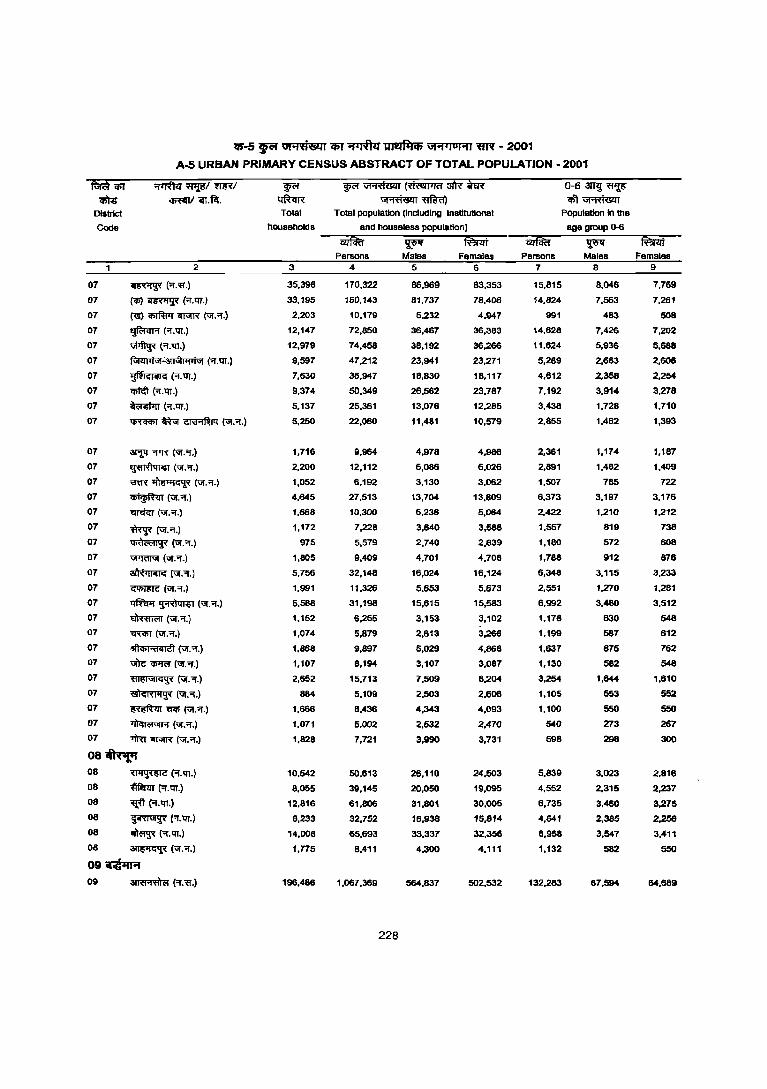
'Ifi-5 ~ \II ... 'fiiSlll 'If>r ~ ~ GI""loHllIN - 2001
A-5 URBAN PRIMARY CENSUS ABSTRACT OF TOTAL POPULATION - 2001
07
07
07
07
07
07
07
07
07
07
07
07
07
07
07
07
07
07
07
07
07
07
07
07
07
2
~(';f.'fl.)
(<fl) ~ ('i.lIT.)
~ ~ iIl'l!R ('iI.'Of.)
~ ('Of.lIT.)
~('i".lIT.)
~;~( ..... lIT.)
~(.,.lIT.)
q;tcft (.,.lIT.)
~("f.lIT.)
~~~('iI.-:r.)
aJ"l1J "'f'R (Uf • .,.)
~(Uf.';f.)
'Iffi ~ (Uf."'l.)
~(Uf.'!.)
~('iI.;r.)
~ (Uf.'Of.)
~('iI."'f.)
"IJITI<iI\iI (Uf.-:r.)
~(ur.'Of.)
~(Uf.or.)
~~(Uf.'!.)
~(Uf ...... )
~(Uf.'i".)
-ofi'f>I"d.Ii!l (Uf.'i".)
'iJIRo: ~ (\11."1".)
07 fill!I\ilI<:!i'< (\if.,!.)
07 <!I~<:I,(lij~ (\if. 'Of.)
07 ~ ~ (UI."f.)
07 ~(Uf."f.)
07 '11'm 1IT\iIR (\if. "f.)
08~ 08 ~ (-:r.lIT.)
08 ~ \-I.lIT.)
08 ~ (=r.lIT.)
08 ~ (;;.lIT.)
08 ~ (Of.lIT.)
08 ~ (\iI.'Of.)
09~ 09 ~(-:r.'ff.)
Total Total populatIOn (InclUding Institutional
households and housetess population)
iifiki ~ Miiif Persons Males Females
3 4 5 6
35,398
33,195
2,203
12,147
12,979
9,597
7,630
9,374
5,137
5,250
1,716
2,200
1,052
4,645
1,668
1,172
975
1,805
5,756
1,991
5,588
1,152
1,074
1,868
1,107
2,652
884
1,666
1,071
1,828
10,542
8,055
12,816
6,233
14,008
1,775
196,488
170,322
160,143
10,179
72,850
74,458
47,212
36,947
50,349
25,361
22,060
9,964
12,112
6,192
27,513
10,300
7,228
5,579
9,409
32,148
11,326
31,198
6,255
5,879
9,897
6,194
15,713
5,109
8,438
5,002
7,721
SO,613
39,145
61,806
32,752
65,693
8,411
1,067,369
228
86,969
81,737
5,232
36,467
38,192
23,941
lB,830
26,562
13,076
11.481
4,978
6,086
3,130
13,704
5,236
3,640
2,740
4,701
16,024
5.653
15,615
3,153
2,613
5,029
3,107
1,509
2,S03
4,343
2,532
3,990
26,110
20,050
31,801
16,938
33,337
4,300
564,837
83,353
78,406
4,947
36,383
36,266
23,271
lB,117
23,787
12,285
10,579
4,986
6,026
3,062
13,809
5,064
3,588
2,839
4,708
16,124
5,673
15,583
3,102
3,266
4,868
3,087
8,204
2,606
4,093
2,470
3,731
24,503
19,095
30,005
15,814
32,356
4,111
502,532
0-6 3ml 'fl'lllf ~~
Population In lI1e
age group ()..6
~ ~ Miiif Persons Males Females 789
15,815
14,824
991
14,628
11,624
5,289
4,612
7,192
3,438
2,855
2,361
2,891
1,507
6,373
2,422
1,557
1,180
1,788
6,348
2,551
6,992
1,178
1,199
1,637
1,130
3,254
1,105
1,100
540
598
5,839
4,552
6,735
4,641
6,958
1,132
132,283
8,046
7,563
483
7,426
5,936
2,683
2,358
3,914
1,72B
1,462
1,174
1,482
785
3,197
1,210
819
572
912
3,115
1,270
3,480
630
587
875
582
1,644
553
550
273
298
3,023
2,315
3,480
2,385
3,547
582
67,594
7,769
7,261
508
7,202
5,688
2,B<MI
2,254
3,278
1,710
1,393
1,187
1,409
722
3,176
1,212
738
608
876
3,233
1,281
3,512
548
612
762
548
1,610
552
550
267
300
2,816
2,237
3,275
2,256
3,411
550
64,689
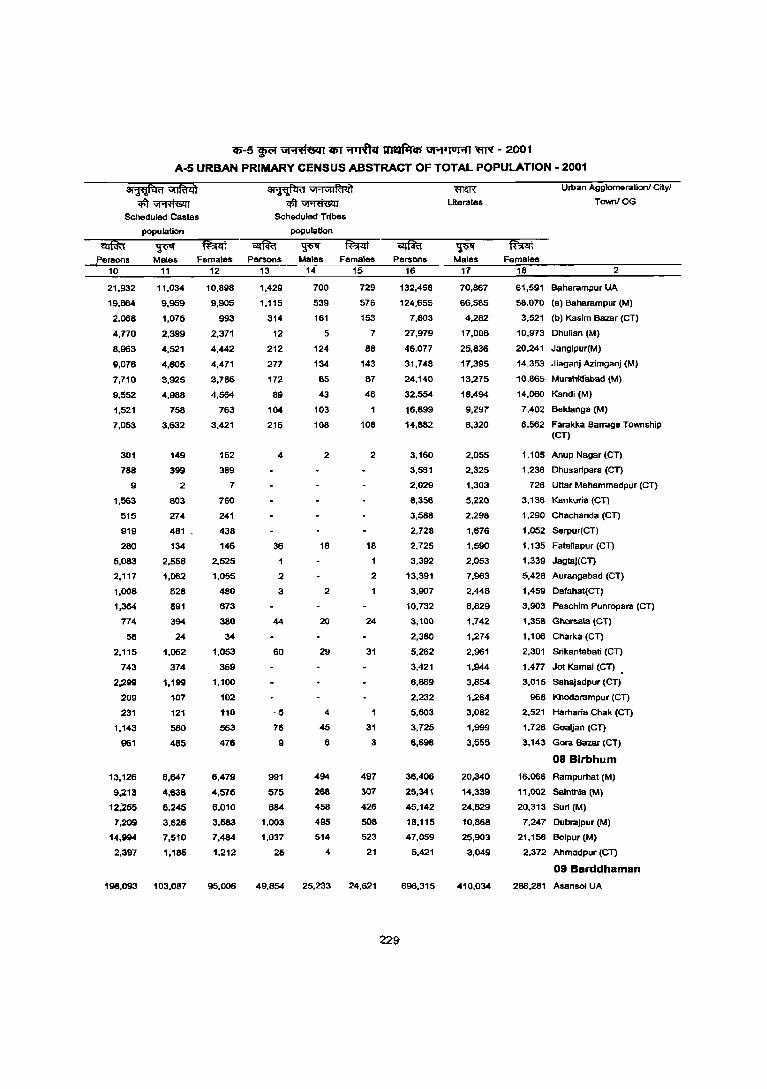
iIi-5 ~ \JI'1'ti6QIl6T 'OfIl& ~ \JI"'lul'1l WI"( - 2001
A-5 URBAN PRIMARY CENSUS ABSTRACT OF TOTAL POPULATION - 2001
~~ qft~
Scheduled Castes
population
~
~Vj;NlI~<i1 qft~
Scheduled Trfbes
population
Persons Males Females Persons Males Females Persons 10
21,932
19,664
2,068
4,770
8,963
9,076
7,710
9,552
1,521
7,053
301
788
9
1,563
515
919
280
5,083
2,117
1,008
1,364
774
58
2,115
743
2,299
209
231
1,1.3
961
13,126
9,213
12,255
7,209
14,994
2,397
198,093
11
11,034
9,959
1,075
2,399
4,521
4,605
3,925
4,988
758
3,632
149
399
2
803
274
481
134
2,558
1,062
528
691
3&4
24
1,062
374
1,199
107
121
580
485
6,647
4,638
6,245
3,626
7,510
1,185
103,087
12 13 14 15 16
10,898
9,905
993
2,371
4,442
4,471
3,765
4,564
763
3,421
152
389
7
760
241
438
146
2,525
1,055
480
673
380
34
1,053
369
1,100
102
110
563
476
6,479
4,575
6,010
3,583
7,484
1,212
95,006
1,429
1,115
314
12
212
277
172
89
104
216
4
36
2
3
44
60
·5
76
9
991
575
884
1,003
1,037
25
49,854
700
539
161
5
124
134
85
43
103
108
2
18
2
20
29
4
45
6
4&4
268
458
495
514
4
25,233
729
576
153
7
88
143
87
46
108
2
18
2
24
31
31
3
497
307
426
508
523
21
24,621
229
132,458
124,655
7,803
27,979
46,077
31,748
24,140
32,554
16,699
14,882
3,160
3,561
2,029
8,356
3,588
2,728
2,725
3,392
13,391
3,907
10,732
3,100
2,380
5,262
3,421
6,869
2,232
5,603
3,725
6,698
36,406
25,341
45,142
18,115
47,059
5,421
696,315
~
Uterates
~ Males
17
70,867
66,585
4,282
17,006
25,836
17,395
13,275
18,4&4
9,297
8,320
2,055
2,325
1,303
5,220
2,298
1,676
1,590
2,053
7,963
2,448
6,829
1,742
1,274
2,961
1,944
3,854
1,264
3,082
1,999
3,555
20,340
14,339
24,829
10,868
25,903
3,049
410,034
Urban Agglomeration! City!
TownJOG
Females 18 2
61,591 Bilharampur UA
58,070 (a) Baharampur (M)
3,521 (b) Kasim Bazar (CT)
10,973 Dhulian (M)
20,241 Janglpur(M)
14,353 Jiaganj Azimganj (M)
10,865 Murshkfabad (M)
14,060 Kandi (M)
7,402 Beldanga (M)
6,562 Farakka Barrage Township (CT)
1,105 Anup Nagar (eT)
1,236 Dhusaripara (CT)
726 Uttar Mahammadpur (CT)
3,136 Kankuria (CT)
1,290 Chachanda (CT)
1,052 Serpur(CT)
1,135 Fatellapur (CT)
1,339 JagtaJ(CT)
5,428 Aurangabad (CT)
1,459 Dafahat(CT)
3,903 Paschim Punropara (CT)
1,358 Ghorsala (eT)
1,106 Charka (eT)
2,301 Srikantabati (CT)
1,477 Jot Kamal (CT)
3,015 Sahajadpur (CT)
968 Khodarampur ICT)
2,521 Harharia Chak (CT)
1,726 Goaljan (eT)
3,143 Gora Bazar {CT}
08 Blrbhum
16,066 Rampurhat (M)
11,002 Sainthia 1M)
20,313 Surf (M)
7,247 DubraJpur (M)
21,156 Bolpur 1M)
2,372 Ahmadpur ICT)
09 Barddhaman
286,281 Asansol UA
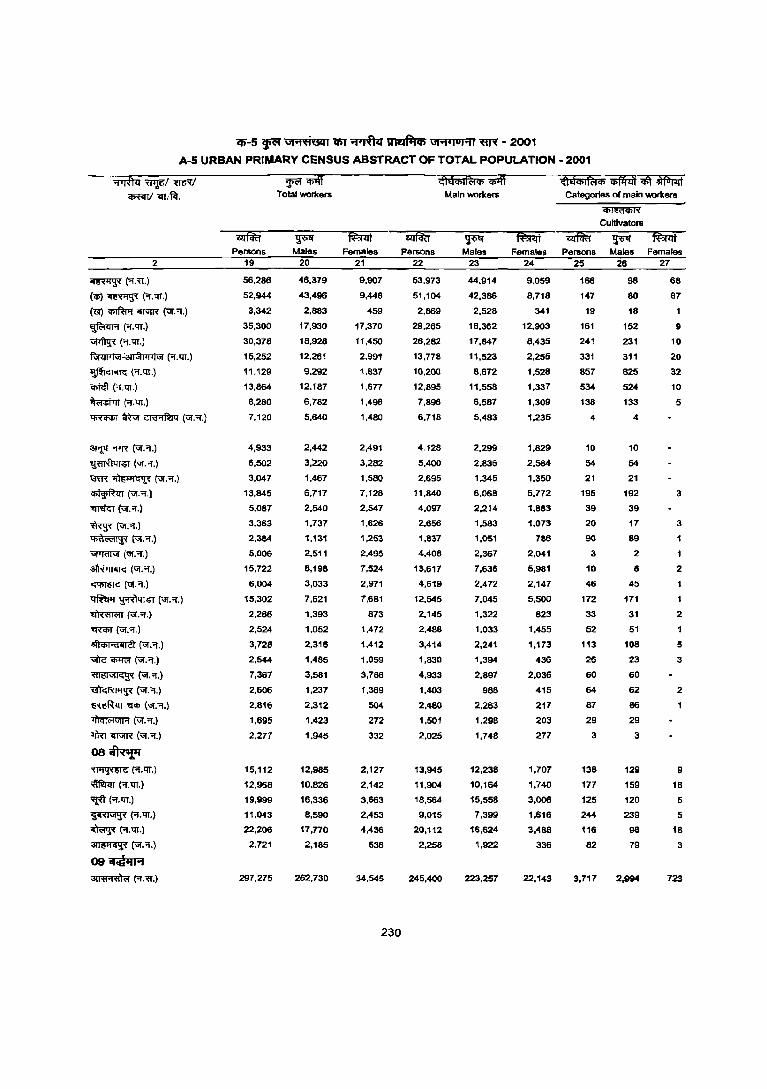
11)-5 -p \1I",ti'&ll iIiT ~ ~ \11",'101",1 ~ - 2001
A-5 URBAN PRIMARY CENSUS ABSTRACT OF TOTAL POPULATION - 2001
2
~(""'fI.)
(<Ii) ~ ("Of.'lT.)
('G) ~ <mllR (,;£."1.)
~(or.qJ.)
~ cor.'lT.)
~~~ (",!.'QT.)
~(0{.'lT.)
q;fcft ("'!.llT. )
~(or.qJ.)
~ ~ ~ (;;r."'t.)
3l'l'T "fIR (;;r:'f.)
~(\iI."'!.)
\3m ~ (ilf.'f.)
~c;;r·"'l·)
"ifIl'iGT \vi. O{.)
~C\1l."'f.) ~(\1I."'f.)
~(\1I:'f.)
~(\i!."f.)
~(\iI.'f.)
~~(\iI.or.)
tlTffilm (ur.Of.)
'R<I>T (ur."'f.)
J5llqil"1'1I~ (ur.or.)
>iITc 'l>'li.'I' (\11. "Of.)
'<111'i1"lIG~ (VI."'!.)
\1Il'GI\(I'1~ (\11.""1.)
~"t.fifi(\1I.""I.)
~(;;r:'f.)
<IM~(\1I.""I.)
08~ ~("'f.llT.)
~ ("r.llT.)
~("'f.QT.)
~(or.qJ.)
~("Of.m.)
~(\1I.-=r.)
09 iiICiflfA ~("r.".)
Persons 19
56.286
52.944
3.342
35.300
30.376
15.252
11,129
13.864
8.280
7,120
4.933
6.502
3.047
13,845
5,087
3,363
2,384
5,006
15,722
6,004
15,302
2.266
2.524
3,728
2,544
7,361
2,606
2,816
1,695
2.277
15,112
12,968
19,999
11.043
22.206
2.721
297,275
~~ Total workers
~ Males
20
46.379
43.496
2.883
17.930
18.928
12.261
9.292
12.181
6.782
5.640
2.442
3.220
1.467
6.711
2.540
1.731
1.131
2.511
B,198
3.033
7.621
1.393
1.052
2.316
1.4B5
3.5B1
1.237
2.312
1.423
1.945
12.985
10.826
16.336
B.590
17.770
2.185
262.730
Females 21
9.907
9.448
459
17,370
11.450
2.991
1.837
1.617
1,498
1,4BO
2,491
3.282
1.580
7.128
2.547
1,626
1,253
2,495
1,524
2,971
7,681
873
1,472
1,412
1,059
3,186
1,369
504
272
332
2,127
2,142
3,863
2,453
4,436
536
34,545
230
Persons 22
53,973
51,104
2,869
29,265
26,282
13,778
10,200
12,895
1,896
6.118
4.128
5,400
2,695
11,840
4,097
2,656
1.831
4.408
13,617
4,619
12.545
2.145
2,488
3.414
1.830
4.933
1.403
2.480
1.501
2.025
13.945
11.904
18.564
9.015
20.112
2.258
245.400
Main workers
~ Males
23
44.914
42.386
2.528
16.362
17.847
11.523
8.612
11.558
6.587
5.483
2.299
2.836
1.345
6,068
2.214
1.583
1.051
2.367
7.636
2.412
7.045
1.322
1.033
2.241
1.394
2.897
988
2.263
1.298
1.748
12.238
10.164
15.558
7.399
16.624
1.922
223.257
Categories of main workers
~
Cullivators
Females Persons 24 25
9.059 166
8.718 147
341 19
12.903 161
8.435 241
2.255 331
1.528 857
1.337 534
1.309 138
1.235 4
1.829 10
2.564 54
1.350 21
5.772 195
1.883 39
1.073 20
786 90
2.041 3
5.981 10
2.147 46
5.500 172
823 33
1.455 52
1.113 113
436 26
2.036 60
415 64
217 87
203 29
277 3
1.707 138
1.740 1n
3.006 125
1.616 244
3.488 116
336 82
22.143 3.711
Males Females 26 27
98 68
80 67
18
152 9
231 10
311 20
825 32
524 10
133 5
4
10
54
21
192 3
39
17 3
89
2 1
8 2
45
171
31 2
51
108 5
23 3
60
62 2
86 1
29
3
129 9
159 18
120 5
239 5
98 18
79 3
2.994 723
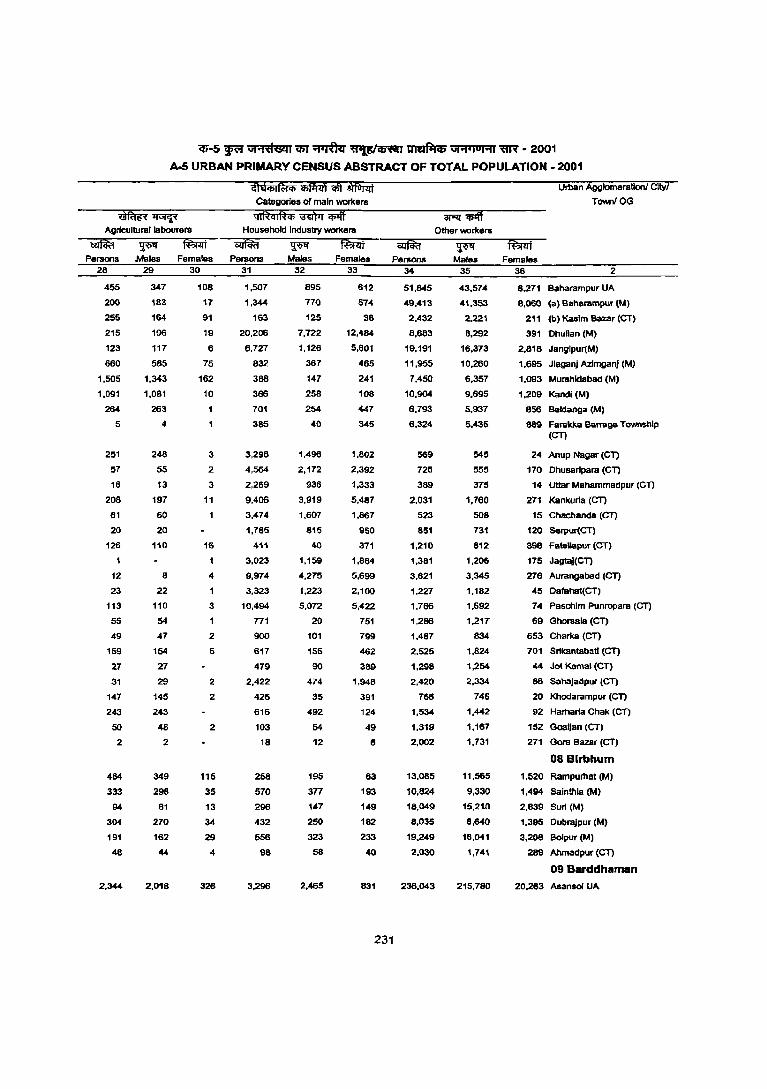
~-5 F'f Gt"l;fteJi (fjJ ~ ~ ~ Gt"l,jUHj 'lIR • 2001
A-5 URBAN PRIMARY CENSUS ABSTRACT OF TOTAL POPULATION· 2001
'df.tri ~ Agrlcullurallabourers
~ ~ f*jfiif Persons Males Females
28 29 30
455 347 108
200 183 17
255 164 91
215
123
660
1,505
1,091
264
5
251
57
16
208
61
20
126
12
23
113
55
49
159
27
31
147
243
50
2
464
333
94
304
191
48
2,344
196
117
585
1,343
1.081
263
4
248
55
13
197
60
20
110
8
22
110
54
47
154
27
29
145
243
48
2
349
298
81
270
162
44
2,018
19
6
75
162
10
3
2
3
11
16
4
1
3
2
5
2
2
2
115
35 13
34
29
4
326
cfld<t>I~Cji iG <fit ~ Categories of main INOrKers
aR iiff
Urban Aggiomerationl City!
TownIOG
ql~ql~Cji iCii1T iiff HousehOld Industry workers Other workers
Persons 31
1,507
1,344
1sa
20,206
6,727
832
388
366
701
385
3,298
4,564
2,269
9,406
3,474
1,765
411
3,023
9,974
3,323
10,494
nl 900
617
479
2,422
426
616
103
18
258
570
296
432
556
98
3,296
Males Females 32 33
895 612
770 574
125 38
7,722
1,126
367
147
258
254
40
1,496
2,172
936
3,919
1,607
815
40
1,159
4,275
1,223
5,072
20
101
155
90
474
35
492
54
12
195
377
147
250
323
58
2.465
12,484
5,601
465
241
108
447
345
1,802
2,392
1,333
5.487
1,867
950
371
1,864
5,699
2,100
5,422
751
799
462
389
1,948
391
124
49
6
63
193
149
182
233
40
831
Persons 34
51,845
49,413
2,432
8,683
19,191
11,955
7,450
10,904
6,793
6,324
569
725
389
2,031
523
851
1,210
1,381
3,621
1,227
1,766
1,286
1.487
2.525
1.298
2,420
766
1,534
1.319
2,002
13,085
10,824
18,049
8.035
19.249
2.030
236.043
231
Males Females 35 36 2
43.574 8.271 Baharampur UA
41.353 8,060 (a) Baharampur (M)
2.221 211 (b) Kaslm Bazar (eT)
8.292
16.373
10.260
6.357
9.695
5.937
5.435
545
555
375
1.760
508
731
812
1,206
3,345
1,182
1.692
1,217
834
1,824
1,254
2.334
746
1,442
1,167
1,731
11,565
9,330
15,210
8,640
16,041
1,741
215,780
391 Ohullan (M)
2,818 Janglpur(M)
1,695 Jlaganj AzlmganJ (M)
1,093 Murshidabad (M)
1,209 Kandi (M)
856 Saldanga (M)
889 Farakka Barrage Township (Cn
24 Anup Nagar (eT)
170 Dhussrtpara (en 14 Uttar Mahammadpur (en
271 Kankuria (en 15 Chachanda (eT)
t20 Serpur(Cn
398 Fatellapur (eT)
175 Jagta](CT)
276 Aurangabad (en 45 Dafahat(CT)
74 Paschlm Punropara (CT)
69 Ghorsala (eT)
653 Charka (eT)
701 Srtkantabati (eT)
44 Jot Kamal (CT)
86 SahaJadpur (eT)
20 Khodarampur (en 92 Harharta Chak (eT)
152 Goaljan leT)
271 Gora Bazar (eT)
08 Blrbhum
1,520 Rampurhat 1M)
1,494 Sainthla (M)
2,839 Sun eM)
1,395 Dubrajpur (M)
3.208 BoIpur (M)
289 Ahmadpur (CT)
09 B ... ddhaman
20.283 Asansol UA
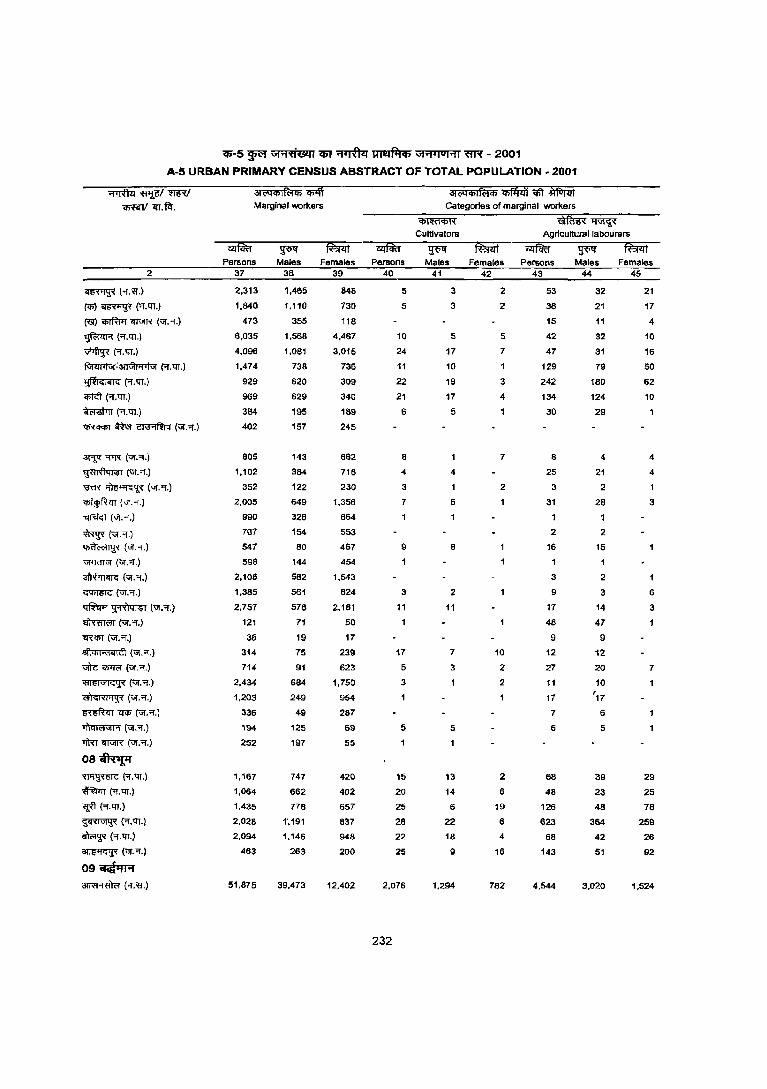
<1>-5 ~ \ilYl'tii8<ll CI>J ~ ~ \JI""loIYlI 'ffi'{ - 2001
A-5 URBAN PRIMARY CENSUS ABSTRACT OF TOTAL POPULATION. 2001
2
~("l.<l.)
(q;) ~ ("f. Ill.)
~ il>IfWr <il'iIR (\iI. Of.)
~("f.tn.)
~ ('I.tIT.)
~~~ ('f.tIT.)
~(1'.Ill.)
q;t<ft ("f. tIT.)
~\-LQT.)
'!IR<fCIiT ftot ~ (,,"."'.j
~ 0fl'R (""."f.)
~(UI.'1.)
\ffi'{ ~ (ur:"I.)
~(ur;;r.)
~(,," . ..,.) ~(,"."'I.)
~(UI.Of.)
Uf1l'<lTGI (UI. "l'. )
~(UI."'.)
~(,"."l'.)
~~(\lf."'.) ~(\lf.9'.)
TRCffi' (UI. Of.)
.ijftijil"<l .. ltl (\iI:'1.)
\If)c Cf>l'R'I' (\iI:'l'.)
'liIEI"'I<:~ ("I'.Of.)
<fr<:I~I'l~ ("1'."'1.)
~"fT1P(\lf.Of.)
~('".9'.)
11ffi <il'iIR (ur."'I.)
08~ ~(Of.'lT.)
~ (Of.tIT.)
~ (Of. tIT.)
~(.,.tIT.)
~(..,.tIT.)
~(vr,"'.)
09~ ~(Of.<r.)
Marginal worKers Categories of marginal worKers
Persons 37
2,313
1.840
473
6,035
4,096
1,474
929
969
384
402
805
1,102
352
2,005
990
707
547
598
2,105
1.385
2,757
121
36
314
714
2.434
1.203
336
194
252
1,167
1,064
1,435
2,026
2.094
463
51.875
~
Cultivators Agricultural labourers
Males Females Persons Males Females Persons Males Females 38 39 40 41 42 43 44 45
1,465 846 5 3 2 53 32 21
1.110 730 5 3 2 38 21 17
355 116 15 11 4
1,568 4,467 10 5 5 42 32 10
1.061 3,015 24 17 7 47 31 16
738 736 11 10 129 79 50
620 309 22 19 3 242 180 62
629 340 21 17 4 134 124 10
195 189 6 5 30 29
157
143
384
122
649
326
154
80
144
562
561
576
71
19
75
91
684
249
49
125
197
747
662
776
1',191
1.146
263
39.473
245
662
71B
230
1,356
664
553
467
454
1.543
824
2,181
50
17
239
623
1,750
954
287
69
55
420
402
657
837
948
200
12.402
8
4
3
7
9
3
11
17
5
3
5
15
20
25
28
22
25
2.076
232
4
6
1
8
2
11
7
3
5
13
14
6
22
18
9
1,294
7
2
10
2
2
2
6
19
6
4
16
782
8
25
3
31
2
16
3
9
17
48
9
12
27
11
17
7
6
68
48
126
623
68
143
4.544
" 21
2
28
2
15
2
3
14
47
9
12
20
10
'17
6
5
39
23
48
364
42
51
3,020
4
4
3
6
3
7
29
25
78
259
26
92
1.524
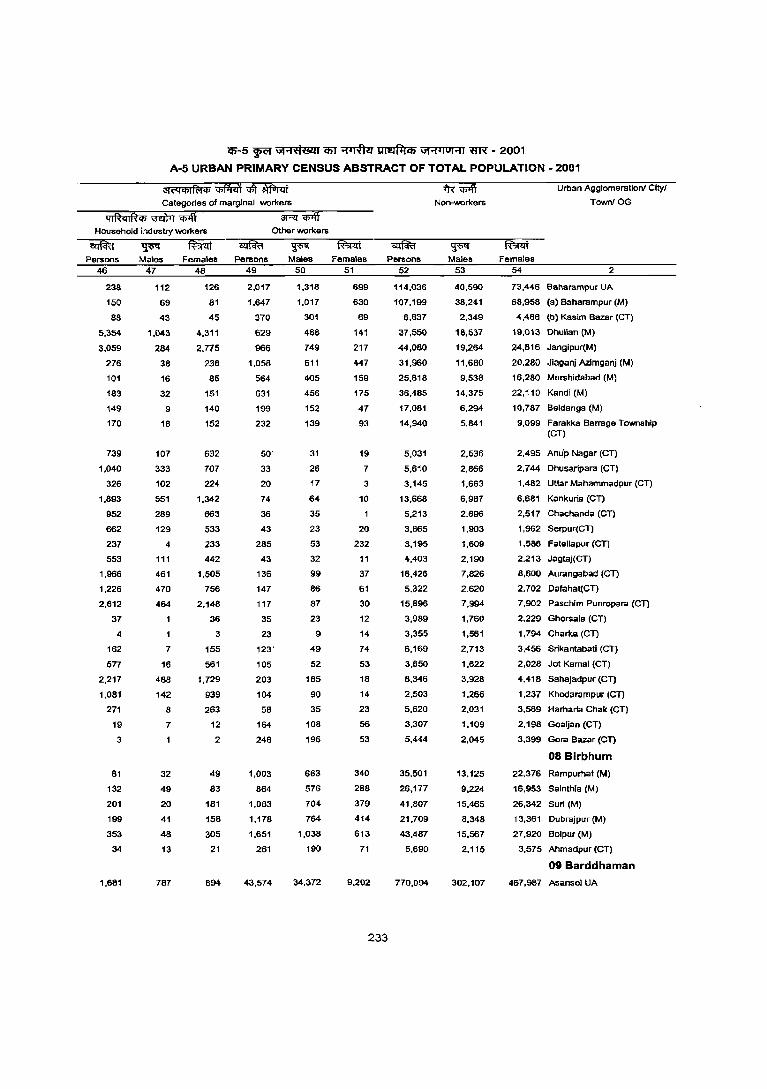
(5-5 WC1 \JFtfi&J1 if)(;:pRtzr ~ \J1"'1<IUI'1I "flR - 2001
A-5 URBAN PRIMARY CENSUS ABSTRACT OF TOTAL POPULATION - 2001
31<"lCjjI~qJ ~ <tt ~ Categories of marginal wor1<ers Non-wor1<ers
Urban Agglomeration! CItyJ
Town! OG
Household industry wor1<ers Other wor1<ers
Persons 46
238
150
88
5,354
3,059
276
101
183
149
170
739
1,040
326
1,893
952
662
237
553
1,966
1,226
2,612
37
4
162
577
2,217
1,081
271
19
3
81
132
201
199
353
34
1,681
Males 47
112
69
43
1,043
284
38
16
32
9
18
107
333
102
551
289
129
4
111
461
470
464
7
16
488
142
8
7
32
49
20
41
48
13
787
Females Persons 48 49
126
81
45
4,311
2,775
238
85
151
140
152
632
707
224
1,342
663
533
233
442
1,505
756
2,148
36
3
155
561
1,729
939
263
12
2
49
83
161
158
305
21
894
2,017
1,647
370
629
966
1,058
564
631
199
232
50'
33
20
74
36
43
285
43
136
147
117
35
23
123'
105
203
104
58
164
248
1,003
864
1,083
1,178
1,651
261
43,574
Males 50
1,318
1,017
301
488
749
611
405
456
152
139
31
26
17
64
35
23
53
32
99
86
87
23
9
49
52
185
90
35
108
195
663
576
704
764
1,038
190
34,372
Females 51
699
630
69
141
217
447
159
175
47
93
19
7
3
10
20
232
11
37
61
30
12
14
74
53
18
14
23
56
53
340
288
379
414
613
71
9,202
Persons 52
114,036
107,199
6,837
37,550
44,080
31,960
25,818
36,485
17,081
14,940
5,031
5,610
3,145
13,668
5,213
3,865
3,195
4,403
16,426
5,322
15,896
3,989
3,355
6,169
3,650
8,346
2,503
5,620
3,307
5,444
35,501
26,177
41,807
21,709
43,487
5,690
770,094
233
'fO'I' Males
53
40,590
38,241
2,349
18,537
19,264
11,680
9,538
14,375
6,294
5,841
2,536
2,866
1,663
6,987
2,696
1,903
1,609
2,190
7,826
2,620
7,994
1,760
1,561
2,713
1,622
3,928
1.266
2.031
1,109
2,045
13.125
9,224
15,465
8,348
15,567
2,115
302,107
Females 54 2
73,446 Baharampur UA
68,958 (a) Baharampur (M)
4,488 (b) Kasim Bazar (CT)
19,013 Dhulian (M)
24,816 Jangipur(M)
20,280 Jiaganj AzImganj (M)
16,280 Murshidabad (M)
22,110 Kandi (M)
10,787 Beldanga (M)
9,099 Farakka Barrage Township (CT)
2,495 Anu'p Nagar (Cn
2,744 Dhusarlpara (CT)
1,482 Uttar Mahammadpur (CT)
6,681 Kankuria (CT)
2,517 Chachanda (Cn
1,962 Serpur(CT)
1,586 Fatellapur (CT)
2,213 Jagtaj(CT)
8,600 Aurangabad (Cn
2,702 Dafahat(CT)
7,902 Paschim Punropara (Cn
2,229 Ghorsala (CT)
1,794 Chari<a (Cn
3,456 Srikantabati (CT)
2,028 Jot Kamal (CT)
4,418 Sahajadpur(CT)
1,237 Khodarampur (CT)
3,589 Harharia Chak (CT)
2,198 Goaljan (CT)
3,399 Gora Bazar (CT)
08 Birbhum
22,376 Rampurhat (M)
16,953 Sainthia (M)
26,342 Suri (M)
13,361 Oubrajpur (M)
27,920 BOlpur(M)
3,575 Ahmadpur (CT)
09 Barddhaman
467,987 Asansol UA
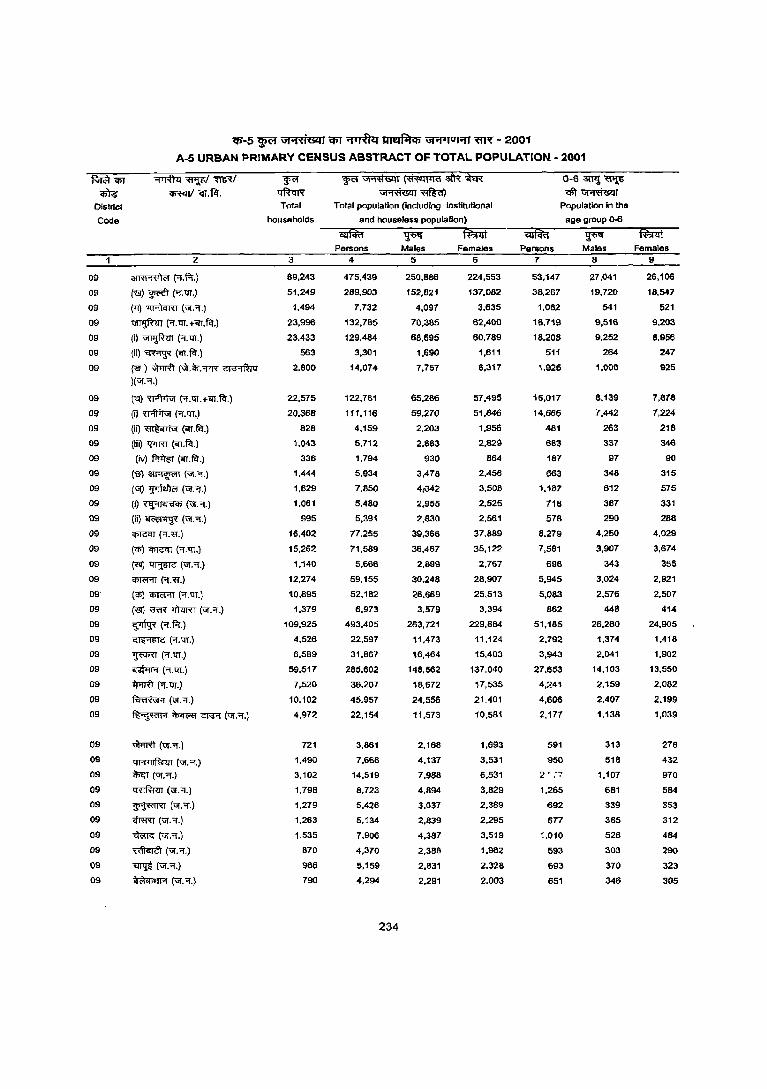
f-i&<I>T ~
District
Code
09
09
09
09
09
09
09
09
09
09
09
09
09
09
09
09
09
09
09
09
09'
09
09
09
09
09
09
09
09
09
09
09
09
09
09
09
09
09
09
"'-5 ~ \iI'1'<1&1) cpr ~ ~ \iI'1')U)'1) ~ - 2001
A-5 URBAN PRIMARY CENSUS ABSTRACT OF TOTAL POPULATION - 2001
~~I'fmI ~ ~~(~~*R 0-6~~ <IRCI1/ CTT.~. ttft<JR ~ ~ ~ ~
2
~R·f-i·) (U)~(""f.w.)
(ll) ~ (\l{.1'.)
~ ("l.tfI.+<n.~.)
(i)~("I.W.)
(ii)~('iff.~.)
(6 ) WrRt (~.~."f'R ~ )(VI."l.)
(<I) ~ ("l.w.+'iff.fcr.)
(i) ~ (~.trI.)
(iQ ~ (iIT fct.)
(iii)~(iU,~.)
(iv) ~ (iU.fit.)
(U)~(",."l.)
(ur) ~ (VI."'}'.)
(i) ~ (;;[.'.)
(ii)~(U!."l.)
~(,.'!T.)
(-a;J 'llTC<fT ("!. tIT .)
(~~(VI."!.)
<PR'RT ("J. '!T.)
(-a;J <llWRT ("!. trI.)
(~ \'RR >ft<!m (VI."!.)
~ ('l.f-i.)
~(1,trI.)
~ ('l.w.)
~ ('.trI.) Wntr {'Of. trI.)
~(VI.1.)
~ ~ ~ (VI:'l.)
~('Qr.'f.)
~(\if . .,.)
~ (VI.'l.)
~(;;[."I.)
~(VI.'l.)
<tRm (;;[."1.)
~ (VI.'!.)
~(VI."I.)
~(VI,"f.)
~(U!."l.)
To1a1 Total populaHon (including Institutional Population In the
households and houseless populaHon) age group ()..6
---~~-----~~~--~~~.----~----~~~~----~---.-
3
89,243
51,249
1.494
23,996
23,433
563
2,800
22,575
20,368
828
1,043
336
1.444
1,629
1,061
995
16.402
15,262
1,140
12,274
10.895
1,379
109.925
4,526
6.589
59.517
7,520
10,102
4,972
721
1,490
3,102
1.798
1,279
1,263
1,535
.870
966
790
Persons 4
475,439
289,903
7.732
132,785
129,484
3.301
14.074
122.781
111,116
4.159
5,712
1,794
5.934
7,850
5,480
5,391
77,255
71.589
5,666
59,155
52.182
6,973
493,405
22,597
31,867
285,602
36,207
45.957
22.154
3,861
7,668
14,519
8.723
5,426
5,134
7,906
4,370
5,159
4,294
234
Males Females Persons Males Females :; 6 7 8 9
250,886 224,553 53,147 27,041 26,106
152,821 137,082 38,267 19,720 18.547
4,097 3,635 1,062 541 521
10,385 62,400 18,719 9,516 9,203
68.695 60,789 18,208 9.252 8.956
1.690 1,611 511 264 247
7,757 6,317 1.925 1,000 925
65,286
59,270
2.203
2,883
930
3,478
4;i)42
2,955
2,830
39.366
36,467
2,899
30,248
26.669
3.579
263,721
11,473
16,464
148,562
'8.672
24.556
11,573
2,168
4,137
7,988
4.894
3,037
2,839
4,387
2,388
2,631
2,291
57,495
51,846
1,956
2,829
864
2,456
3,508
2,525
2.561
37.889
35,122
2,767
28,907
25,513
3,394
229,684
11,124
15,403
137,040
17,535
21.401
10,581
1,693
3.531
6,531
3,829
2,389
2.295
3.519
1,982
2,326
2,003
16,017
14,666
481
683
187
663
1,187
718
578
8.279
7,581
698
5,945
5,083
862
51,185
2,792
3,943
27,653
4,241
4,606
2.177
591
950
2' ,'7
1,265
692
677
1.010
593
693
651
8,139
7,442
263
337
97
348
612
387
290
4,250
3,907
343
3.024
2.576
448
26,280
1.374
2,041
14,103
2,159
2,407
1,138
313
518
1,107
681
339
365
526
303
370
346
7,878
7,224
218
346
90
315
575
331
288
4.029
3,674
355
2,921
2.507
414
24,905
1,418
1,902
13,550
2,082
2.199
1.039
278
432
970
584
353
312
484
290
323
305
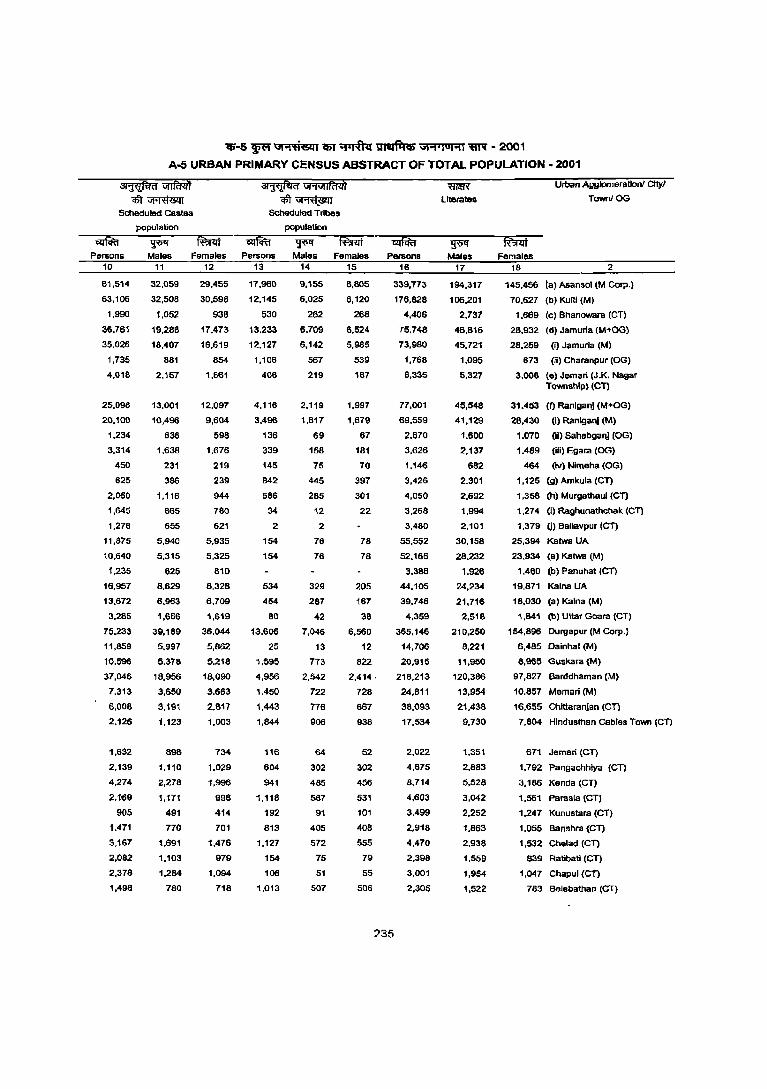
'is-5 ~ GHti&lll5T ~ ~ \JI"1'luHI "8R - 2001
A-5 URBAN PRIMARY CENSUS ABSTRACT OF TOTAL POPULATION - 2001
~~ <tt~
Scheduled Castes
population
~
~""'1UfIf<'1<i1 qft~
Scheduled Trtbes
population
Persons Males Females Persons Males Females Persons 10
61,514
63,106
1,990
36,761
35,026
1,735
4,018
25,098
20,100
1,234
3,314
450
625
2,060
1,645
1,276
11,875
10,640
1,235
16,957
13,672
3,285
75.233
11,859
10,596
37,046
7,313
6,008
2.126
1,632
2,139
4,274
2,169
905
1.471
3,167
2,082
2,378
1,498
11
32,059
32,508
1,052
19,288
18,407
881
2,157
13,001
10,496
636
1,638
231
386
1,116
865
655
5,940
5,315
625
8,629
6,963
1,666
39,189
5,997
5,378
18,956
3,650
3,191
1,123
898
1.110
2,278
1,111
491
770
1,691
1,103
1,284
780
12 13 14 15 18
29,455
30,598
938
17,473
16,619
854
1,861
12,097
9,604
598
1,676
219
239
944
780
621
5,935
5,325
610
8,328
6,709
1,619
36,044
5,862
5,218
18,090
3,663
2,817
1,003
734
1,029
1,996
998
414
701
1,476
979
1,094
718
17,960
12,145
530
13,233
12,127
1,106
406
4,116
3,496
136
339
145
842
586
34
2
154
154
534
454
80
13,606
25
1,595
4,956
1,450
1,443
1,844
116
604
941
1,118
192
813
1,127
154
106
1,013
9,155
6.025
262
6.709
6.142
567
219
2,119
1,B17
69
158
75
445
285
12
2
76
76
329
287
42
7,046
13
773
2,542
722
776
906
64
302
485
587
91
405
572
75
51
507
8,805
6,120
268
6,524
5,985
539
187
1,997
1,679
67
181
70
397
301
22
78
78
205
167
38
6,560
12
822
2,414.
728
667
938
52
302
456
531
101
408
555
79
55
506
339,773
176,828
4,406
75,748
73,980
1,768
8,335
77,001
69,559
2,670
3,626
1,146
3,426
4,050
3,268
3,480
55,552
52.166
3,388
44,105
39.746
4,359
365,146
14,706
20,915
218,213
24,811
38,093
17,534
2,022
4,675
8,714
4.603
3,499
2,918
4,470
2,398
3,001
2.305
235
~
Literates
'¥'I' Males
17
194,317
106,201
2,737
46,816
45,721
1,095
5,327
45,548
41,129
1,600
2,137
682
2,301
2,692
1,994
2,101
30,158
28.232
1,926
24,234
21.716
2,518
210,250
8,221
11,950
120,386
13,954
21,438
9,730
1,351
2,883
5,528
3,042
2,252·
1,863
2,93S
1,559
1.954
1,522
Urban Agglomeration! CIty!
TownIOG
Females 18 2
145,456 tal Asansol (M Corp.)
70,627 (b) Kulti (M)
1,669 (c) Bhanowara (eT)
28,932 (d) Jamurla (M+OG)
28,259 (I) Jamurla (M)
673 (ii) Charanpur (OG)
3,008 (e) Jemarl (J.K, Nagar Township) (CT)
31.453 (1) RanlganJ (M+OG)
26,430 (I) Ranlganj (M)
1,070 (II) SahebganJ COG)
1,489 (iii) Egara (OG)
464 (iv) Nlmaha (OG)
1,125 (g)Amkula(CT)
1.358 (h) Murgathaul (CT)
1,274 (I) Raghunathchak (CT)
1,379 (j) Ballavpur (CT)
25,394 Katwa UA
23,934 (a) Katwa (M)
1,460 (b) Panuhat (CT)
19,871 Kalna UA
18.030 (a) Kalna (M)
1,841 (b) Uttar Goara (CT)
154,896 Ourgapur (M Corp.)
6,485 Oainhat (M)
6,965 Guskara (M)
97,827 Barc:ldhaman (M)
10,857 Memari (M)
16,655 Chlttaranjan (CT)
7,804 Hlnduslhan cables Town (CT)
671 Jamari (CT)
1,792 Pangachhlya (CT)
3.186 Kanda (CT)
1,561 Parasla (CT)
1,247 Kunustara (CT)
1,055 Banshra (CT)
1,532 Chelad (CT)
839 Ratibali (CT)
1,047 Chapui (CT)
783 Balabathan (CT)
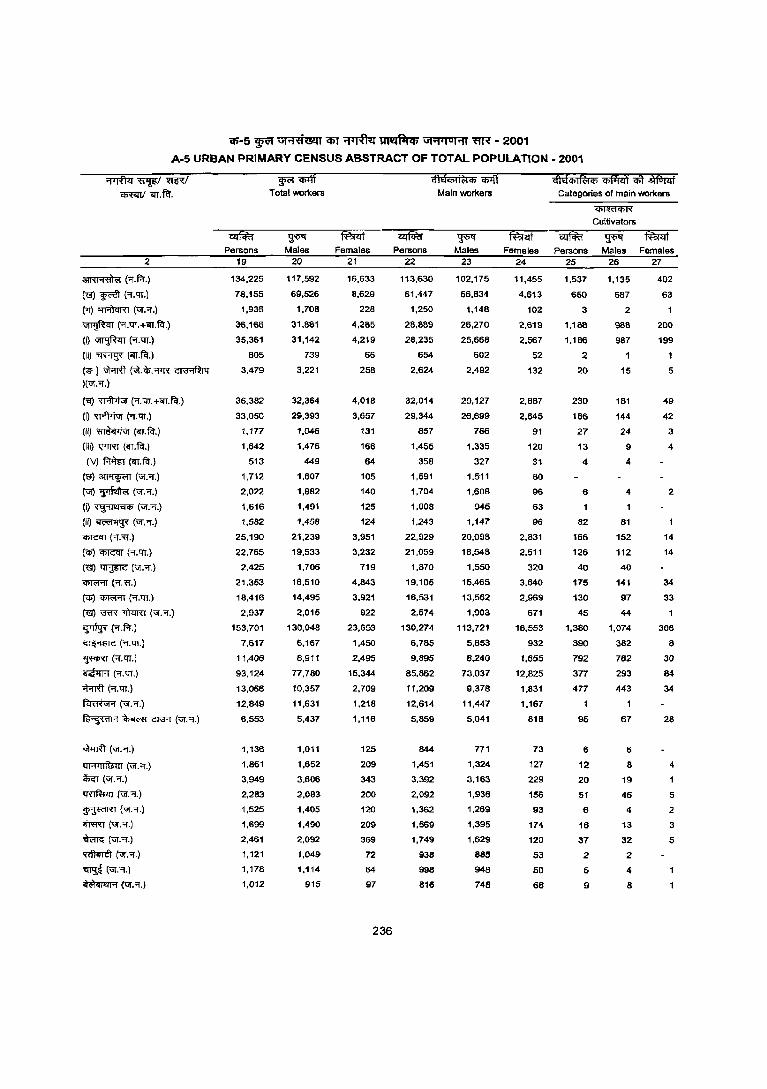
~-5 ~ Uj"'l'('j@ll <PI ~ ~ \i1"'1'l ol"'ll ~ - 2001
A-5 URBAN PRIMARY CENSUS ABSTRACT OF TOTAL POPULATION - 2001
2
~("'f.f.i.)
("lJ)~(1.qr.)
(TJ)~(<lf.'l.)
~ (';j."QT.+~.fcl.)
(i) ~ (.,."QT.)
(ii) ~ (iIT.fct)
(6') ~ (~.~.1'T'{ ~ )('G!."'f.)
(<1) ~ (1.'tlT.+~.fct)
(i) ~ ('i.'QT.)
(ii)~(..-r.f.t)
(iii) ~ (iIT.~.)
(iv) f.'\1trr (<IT. fit)
(tJ) ~ ("G!.1.)
("GI) ~ (<If.1.)
(i)~('<iI . .,.)
(ii)~(<lf.9'.)
'Cf)[C<fT ("HI.)
("iii) 'iI>IClIT ("I.'Tf.)
(~~("Gl."I.)
<!>R'RT (1. <1.)
(<p) <!>R'RT ("I.'Tf.)
("lJ) ~ 1'J'nIm ("G!.9'.)
~ (9'.f.r.)
~(".'QT.)
~("'f.'QT.)
~("I.'QT.)
~R.'QT.)
~('...,.)
~ ~ CJ\F! ('<iI.1.)
WrRl ("G! . .,.)
~(UI."I.)
~("Gl."'I.)
~(\if.'OJ.)
~("G!.1.)
-.tJ'IRT (\if.'OJ.)
~(UI.'1.)
~(vr.'OJ.)
~("G!.1.)
~(<lf.'l.)
Persons 19
134.225
78,155
1,936
36,166
35,361
805
3,479
36.382
33,050
1,177
1,642
513
1.712
2,022
1,616
1,582
25,190
22,765
2,425
21.353
18,416
2.937
153,701
7,617
11,406
93,124
13,066
12,849
6,553
1,136
1.861
3,949
2,283
1,525
1,699
2,461
1,121
1,178
1,012
~ilff Total workers
~ Males
20
117.592
69,526
1,708
31,881
31,142
739
3,221
32,364
29,393
1,046
1,476
449
1,607
1,882
1,491
1,458
21,239
19,533
1,706
16,510
14,495
2,015
130,048
6,167
8,911
77,780
10,357
11,631
5,437
1,011
1,652
3,606
2,083
1,405
1,490
2,092
1,049
1,114
915
Females 21
16,633
8,629
228
4,285
4,219
66
258
4,018
3,657
131
166
64
105
140
125
124
3,951
3,232
719
4,843
3,921
922
23,653
1,450
2,495
15,344
2,709
1,218
1,116
125
209
343
200
120
209
369
72
64
97
236
Persons 22
113,630
61,447
1,250
28,889
28,235
654
2,624
32,014
29,344
857
1,455
358
1,591
1,704
1,008
1,243
22,929
21,059
1,870
19,105
16,531
2,574
130,274
6,785
9,895
85,862
11,209
12,614
5,859
844
1,451
3.392
2,092
1,362
1,569
1,749
938
998
816
Main workers
~ Males
23
102.175
56,834
1,148
26,270
25,668
602
2.492
29,127
26,699
766
1.335
327
1,511
1,608
945
1,147
20,098
18,548
1.550
15,465
13,562
1,903
113,721
5,853
8,240
73,037
9,378
11,447
5,041
771
1,324
3,163
1,936
1,269
1,395
1,629
885
948
748
f¥ilif Females
24
11,455
4,613
102
2,619
2,567
52
132
2,887
2,645
91
120
31
80
96
63
96
2,831
2,511
320
3,640
2.969
671
16,553
932
1,655
12,B25
1,831
1,167
818
73
127
229
156
93
174
120
53
50
68
Cft jJ", I Rit Cf) "ii"iiiiin qft ~ Categories of main workers
Persons 25
1,537
650
3
1,188
1,166
2
20
230
166
27
13
4
6
62
166
126
40
175
130
45
1,380
390
792
317
477
95
6
12
20
51
6
16
37
2
5
9
<PmfCfil'< Cultivators
Males Females 26 27
1,135 402
587 63
2
988 200
987 199
1 1
15 5
181 49
144 42
24 3
9 4
4
4 2
6f
152 14
112 14
40
141 34
97 33
44
1,074 306
382 8
762 30
293 84
443 34
67 26
6
8 4
19
46 5
4 2
13 3
32 5
2
4
8
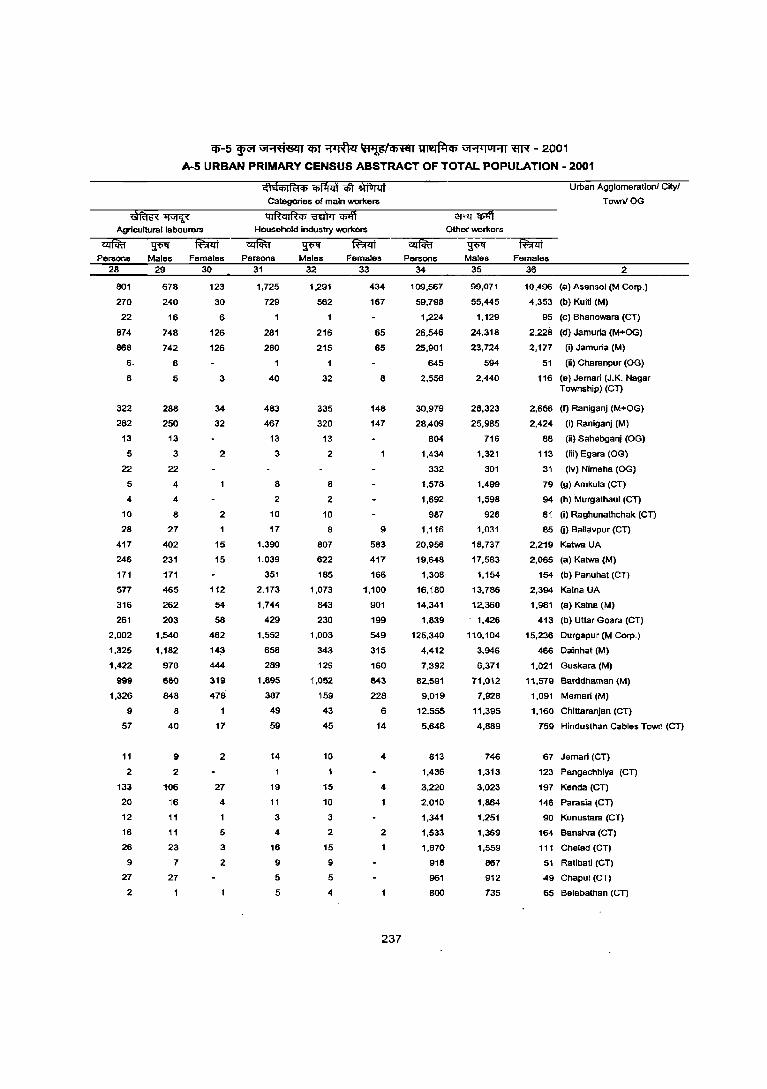
q;-5 ~ Gi'1:ftiC§Cii q;y ~ ~fcI;ro ~ Gf"1'ioi"1i ~ - 2001
A-S URBAN PRIMARY CENSUS ABSTRACT OF TOTAL POPULATION - 2001
~~ Agricultural labourers
Categories of main workel'll
41~ql~'" 'i3"dtrr ~ Household industry workers
Persons Males Females Persons Males Females 28 29 30 31 32 33
801
270
22
874
868
6.
8
322
282
13
5
22
5
4
10
28
417
246
171
577
316
261
2.002
1.325
1.422
999
1.326
9
57
11
2
133
20
12
16
26
9
27
2
678
240
16
748
742
6
5
288
250
13
3
22
4
4
8
27
402
231
171
465
262
203
1.540
1.182
978
680
848
8
40
9
2
106
16
11
11
23
7
27
123
30
6
126
126
3
34
32
2
2
15
15
112
54
58
462
14;3
444
319
478
1
17
2
27
4
5
3
2
1,725
729
281
280
40
483
467
13
3
8
2
10
17
1,390
1,039
351
2,173
1,744
429
1,552
658
289
1,895
387
49
59
14
19
11
3
4
16
9
5
5
1,291
562
216
215
32
335
320
13
2
8
2
10
8
807
622
185
1,073
843
230
1,003
343
129
1,052
159
43
45
10
15
10
3
2
15
9
5
4
434
167
65
65
8
148
147
9
583
417
166
1,100
901
199
549
315
160
843
228
6
14
4
4
1
2
237
Pel'llons 34
109,567
59,798
1,224
26,546
25,901
645
2,556
30,979
28,409
804
1,434
332
1,578
1,692
987
1,116
20,956
19,648
1,308
16,180
14,341
1,839
125,340
4,412
7,392
82,591
9,019
12,555
5,648
813
1,436
3,220
2,010
1,341
1,533
1,670
918
961
800
aFlT~ Other workers
Males 35
99,071
55,445
1,129
24,318
23,724
594
2,440
28,323
25.985
716
1,321
301
1,499
1,598
926
1.031
18,737
17,583
1,154
13,786
12,360
1,426
110,104
3,946
6,371
71,012
7,928
11.395
4,889
746
1,313
3,023
1,864
1.251
1,369
1,559
867
912
735
Urban Agglomeration! Cityl
TowniOG
Females 36 2
10,496 (a) Asansol (M Corp.)
4,353 (b) Kulti (M)
95 (c) Bllanowara (CT)
2,228 (d) Jamurla (M+OG)
2,177 (i) Jamuria (M)
51 (ii) Charanpur (OG)
116 (e) Jemari (J.K. Nagar Township) (CT)
2,656 (f) Raniganj (M+OG)
2,424 (i) Raniganj (M)
88 (il) Sahebganj (OG)
113 (iii) Egara (OG)
31 (iv) Nimeha (OG)
79 (g) Amkula (CT)
94 (h) Murgathaul (CT)
61 (i) Raghunathchak (CT)
85 (j) Ballevpur (CT)
2,219 Kalwa UA
2,065 (a) Kalwa (M)
154 (b) Panuhat (CT)
2,394 Kalna UA
1,981 (a) Kalna (M)
413 (b) Uttar Goara (CT)
15,236 Ourgapur (M Corp.)
466 Dainhat (M)
1.021 Guskara (M)
11,579 Barddhaman (M)
1,091 Memari (M)
1.160 Chittaranjan (CT)
759 Hindusthan Cables Town (CT)
67 Jemari (CT)
123 Pangachhiya (Cn
197 Kenda (CT)
146 Parasia (CT)
90 Kunustara (CT)
164 Banshra (eT)
111 Chelad (eT)
51 Ratibati (eT)
49 Chapui (CT)
65 Belebathan (CT)
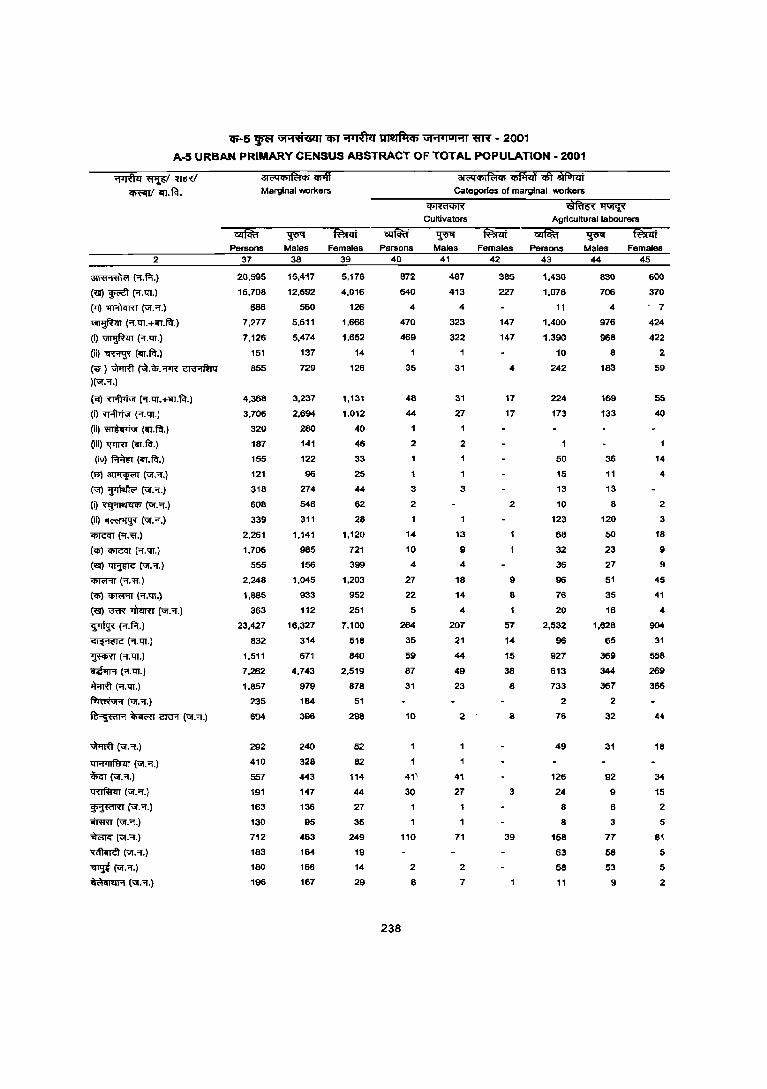
C5'-5 ~ Gi'1'fiiGlll 'lI>T ~ ~ Gi'1"IOI'11 'fiR' - 2001
A-5 URBAN PRIMARY CENSUS ABSTRACT OF TOTAL POPULATION - 2001
2
~(""I.f.i.)
(~~ ('r.t!I.)
(11) 1IFITIIRT (\iI.Of.)
~ (Of.t!I.+iIT.f?t.)
(i) ~ (Of. tIT.)
(ii) ~ (iIT.f?t.)
(e) ~ ~.~.0fIR ~ )(\iI."T.)
("iI) ~ ["I.tIT.+iIT.~.)
(i) ifAITi;;r ('f. tIT.)
(ii) ~ (iIT.f?t.)
(Iii) 1pTRT (ij"r.f?t.)
(iv) ~ (iIT.f?t.)
("B)~(\iI."T.)
(VJ)~(\iI.Of.)
(i)~(\iI."T.)
(ii)~(\iI.Of.)
~ (Of:~.)
(iii) ~ ('f. tIT.)
(~~(\iI."T.)
<Im'RT ("T.ll'.)
(iI» <i>1\"I'1T ("I.'fI.)
(~ "'"'"' -.mrm (\iI.'f.)
~(Of.f.r.)
~("T.tIT.)
~ (Of.t!I.)
~(Of.t!I.)
~("I".t!I.)
~(ur."I".)
~ ~ CJ;:J'l (\iI."I".)
Wffi\ (\iI. "1".)
tIFP1Tfmn (\iI. "1".)
~(\iI.Of.)
tRTfWIlT (\iI."I".)
~(\iI."T.)
iffi:m (ur. "T.)
~(\iI."I".)
~(V!."I.)
~ (\iI."".)
~(\jf."I.)
dH;q(jjI~q; :;iff Marginal workers
~ Persons Males Females
37
20,595
16,708
686
7,277
7.126
151
855
4,368
3.706
320
187
155
121
318
608
339
2,261
1.706
555
2,248
1,885
363
23,427
832
1.511
7.262
1.857
235
694
292
410
557
191
163
130
712
183
180
196
38
15,417
12,692
560
5.611
5,474
137
729
3,237
2,694
280
141
122
96
274
546
311
1,141
985
156
1,045
933
112
16,327
314
671
4.743
979
184
396
240
328
443
147
136
95
463
164
166
167
39
5,178
4.016
126
1.666
1,652
14
126
1,131
1,012
40
46
33
25
44
62
2&
1,120
721
399
1,203
952
251
7,100
518
840
2,519
878
51
298
52
82
114
44
27
35
249
19
14
29
Persons 40
872
640
4
470
469
35
48
44
2
3
2
14
10
4
27
22
5
264
35
59
87
31
238
10
41'
30
110
2
8
31<'4q;I~q; ~ ~ ~ Categories of marginal wo!tlers
~
Cultivators
Males 41
487
413
4
323
322
31
31
27
2
3
13
9
4
18
14
4
207
21
44
49
23
2
41
27
71
2
7
Females 42
385
227
147
147
17
17
2
9
8
57
14
15
38
8
8
3
39
~~ Agricultural labourers
Persons 43
1,430
1,076
11
1.400
1.390
10
242
224
173
50
15
13
10
123
68
32
36
96
76
20
2.532
96
927
613
733
2
76
49
126
24
8
8
158
63
58
11
Males Females 44 45
830 600
706 370
4 . 7
976 424
968 422
8 2
183 59
169 55
133 40
36 14
11 4
13
8
120
50
23
27
51
35
16
1,828
65
369
344
367
2
32
31
92
9
6
3
77
58
53
9
2
3
18
9
9
45
41
4
904
31
558
269
366
44
18
34
15
2
5
81
5
5
2
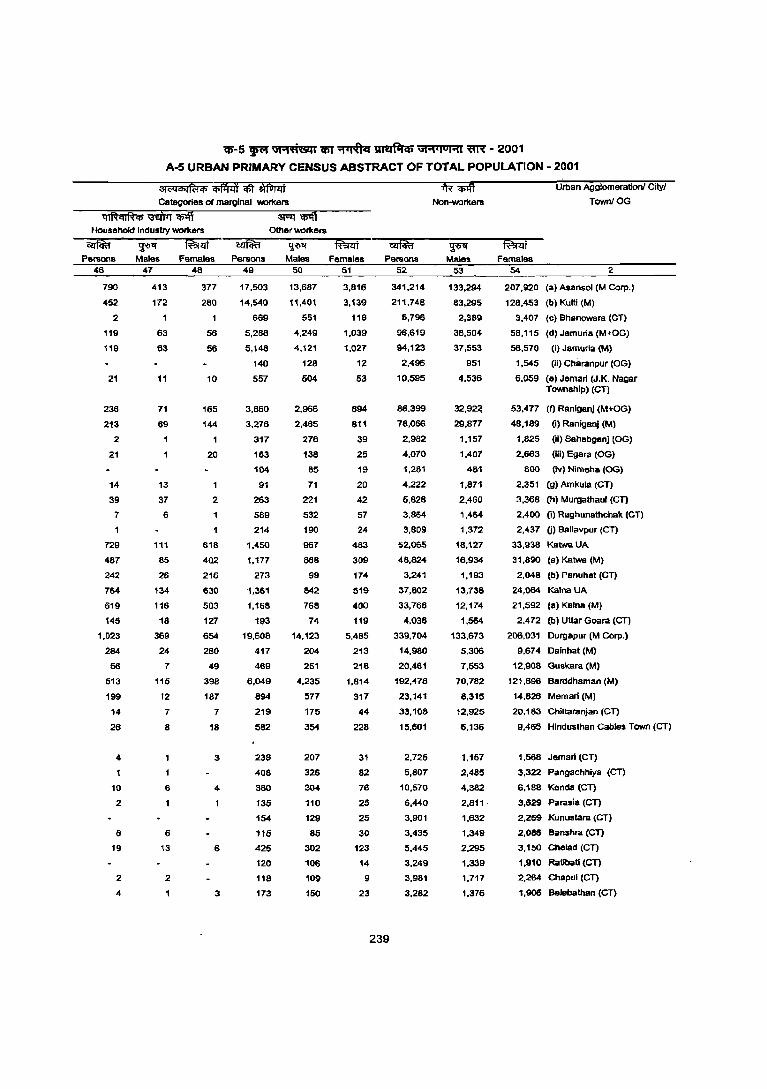
'iIi-5 ~ iJ,.,.d61u lin' ~ ~ 13,.,.1°1"11 ~ - 2001
A-5 URBAN PRIMARY CENSUS ABSTRACT OF TOTAL POPULATION - 2001
at <'II "'I ftii '" i'ii'fflm 'iiit IAfltTiif i'R 'liiIfi Urban Agglomeration! Cltyl Categories of marginal workers NorHNorkers Town! OG
q i~ q iR q; iiCI)'ii 'ilff 3R 'iifi Household Industry workers Other workers
Persons 46
790
452
2
119
119
21
236
213
2
21
14
39
7
729
481
242
164
619
145
1,023
284
56
513
199
14
26
4
10
2
«5
19
2
4
Males 47
413
112
63
63
11
71
69
13
31
6
111
85
26
134
116
18
369
24
1
115
12
7
8
6
1
6
13
2
Females Persons 48 49
311
280
56
56
10
165
144
20
1
2
618
402
216
630
503
121
654
260
49
398
181
7
18
3
4
6
3
11,503
14,540
669
5,288
5,148
140
557
3,860
3,276
317
163
104
91
263
589
214
1,450
1,111
213
1,361
1,168
193
19,608
417
469
6,049
894
219
582
238
408
380
135
154
115
425
120
118
173
Males 50
13,681
11,401
551
4,249
4,121
128
504
2,966
2,465
276
138
85
71
221
532
190
967
868
99
842
768
14
14,123
204
251
4,235
511
175
354
207
326
304
110
129
85
302
106
109
150
Females 51
3,816
3,139
118
1,039
1,027
12
53
894
811
39
25
19
20
42
57
24
463
309
174
519
400
119
5,485
213
218
1,814
311
44
228
31
82
76
25
25
30
123
14
9
23
ilIMi" Persons
52
341,214
211,748
5,796
96,619
94,123
2,496
10,595
86,399
78,066
2,982
4,070
1,261
4,222
5,828
3,864
3,809
52,065
48,824
3,241
37,802
33,766
4.036
339.704
14,980
20,461
192.478
23.141
33.108
15.601
2.725
5,807
10.570
6.440
3.901
3,435
5.445
3.249
3.981
3.282
239
~ Males
53
133.294
83.295
2,389
38,504
37,553
951
4.536
32,92~
29,817
1,157
1.407
461
1,871
2,460
1,464
1,372
18,127
16,934
1,193
13,138
12,174
1.564
133,673
5,306
7,553
70,782
8,315
12,925
6,136
1,157
2,485
4,382
2,8'"
1,632
1,349
2,295
1,339
1,717
1,376
fa;Jt Females
54 2
201,920 (a) Asansol (M Corp.)
128,453 (b) Kultl (M)
3,407 (c) Bhanowara (CT)
58,115 (d) Jamurla (M+OG)
56,570 (I) Jamurla (M)
1,545 (ii) Chiuanpur (OG)
6,059 (e) Jemar! (J.K. Nagar TO\WIshlp) (CT)
53,477 (f) Ranlganj (M+OG)
48,189 (I) Ranl9anj (M)
1,825 (ii) Saheb9snj (OG)
2,663 (iii) Egara (OG)
800 (Iv) Nimeha (OG)
2,351 (g) Amkuia (CT)
3,368 (h) Murgathaul (CT)
2,400 (I) Raghunathchak (CT)
2,437 (j) Ballavpur (eT)
33,938 Katwa UA
31,890 (a) Kalwa (M)
2,048 (b) Panuhat (CT)
24,064 Kalna UA
21,592 (a) Kalna (M)
2.4 72 (b) Uttar Goara (CT)
206,031 Durgapur (M Corp.)
9,674 Dalnhat (M)
12,908 Guskara (M)
121,696 Barddhaman (M)
14,826 Mernari (M)
20,183 Chittaranjan (eT)
9,465 Hindusthan Cables Town (CT)
1,568 Jemar! (CT)
3,322 Pangachhlya (CT)
6,188 Kenda (eT)
3,629 Parasla (Cn
2,269 Kunustara (CT)
2,086 Banshra (en
3,150 Chelad (eT)
1.910 Ratlbatl (Cn
2,264 Chapui (eT)
1,906 Belebathan (CT)
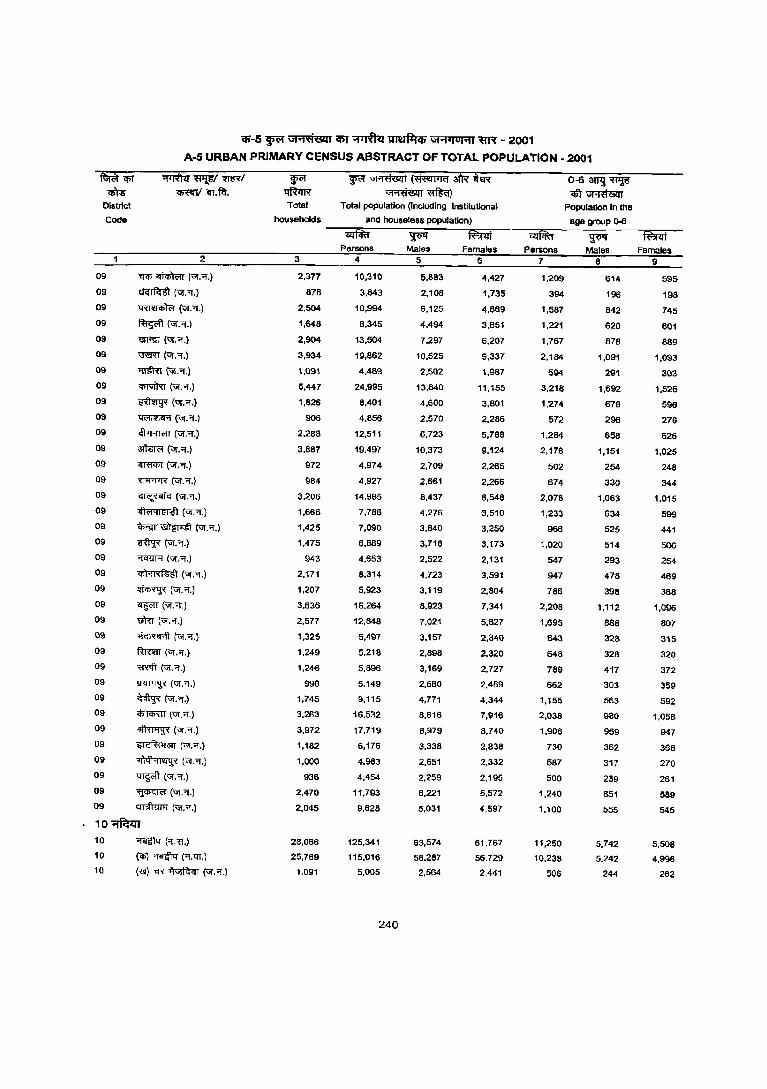
(1;-5 ~ \iI"lifi&U <fiT ~ ~ \iI"I'IUHI ~ - 2001
A-5 URBAN PRIMARY CENSUS ABSTRACT OF TOTAL POPULATION - 2001
~~m/ ~ ~~(~£*iR 0-6~~ ~'lfr.~. ~ ~~ qft~
09
09
09
09
09
09
09
09
09
09
09
09
09
09
09
09
09
09
09
09
09
09
09
09
09
09
09
09
09
09
09
2
'i'f1I;~(UI.'i.)
etGTfc:1ft (UI. 'i.J
~(vr.'l.)
~(UI."'I.)
'GT"ID (;;r. "'I.)
~(vr."'f.)
'lll!m GiI."'I.)
~(UI."'I,)
~(UI.",)
'«.'Im<I'1 (\if. 'l, )
~(\if,'l.J
~ (;;r . .,.)
"iffil"'IlT (UI,"!'.)
~(UI."'I.)
~(\if . .,.)
.. l<1ql~l:tl (\if,.,.)
~'~(\if."'I.)
~(\if.'l.)
"f1f!l'T'l' (\if . .,.)
~(\if,"'i',)
~ (\if,".)
<f§<'IT (\if. "1'. )
urn (Vf.'l,)
~(UI."I'.)
fmm (UI.'l.)
mtft GiI.'i.)
Y<iT"T"'l' (Vf,"'i',)
~(\if.'l,)
<l>l'"CIRlT (UI."1'.)
~(Vf,"'i',)
~(UI.",)
09 '~Q1'1II4'i( ("1."'1.)
09 ~(\if."'I.)
09 ~(Vf . .,.)
09 EID1TIwf ("","1'.)
10~ 10
10
10
~("'i'.R)
('1fi)~("'i'.qr,)
(~ 'i:R ~ (\if . .,.)
Total Total population (including Institutional
households and houseless population) --~~~-------~~~~~~~.--
3
2,377
876
2,504
1,648
2,904
3,934
1,091
5,447
1,826
906
2.288
3,887
972
984
3,206
1.666
1.425
1.475
943
2.171
1.207
3,636
2.577
1.325
1.249
1,246
990
1,745
3,263
3,972
1,182
1.000
936
2,470
2,045
28,066
25,769
1,091
Persons 4
10,310
3,843
10,994
8,345
13,504
19,862
4,489
24,995
8,401
4,856
12.511
19.497
4.974
4.927
14.985
7.786
7.090
6.889
4.653
8.314
5.923
16.264
12,848
5,497
5.218
5.896
5.149
9,115
16.532
17,719
6.176
4.983
4.454
11.793
9,628
125.341
115.016
5,005
240
Males 5
5.883
2.108
6.125
4.494
7.297
10,525
2,502
13,840
4,600
2,570
6,723
10,373
2,709
2,661
8,437
4,276
3,840
3,716
2,522
4,723
3,119
8.923
7,021
3,157
2,898
3,169
2,680
4,771
8,616
8,979
3,338
2,651
2,259
6,221
5,031
63,574
58,287
2,564
Females 6
4,427
1,735
4,869
3,851
6,207
9,337
1,987
11,155
3,801
2,286
5,788
9,124
2,265
2,266
8,548
3,510
3,250
3,173
2,131
3,591
2,804
7,341
5,827
2,340
2,320
2,727
2,469
4,344
7,916
8,740
2,838
2,332
2,195
5,572
4,597
61,767
56,729
2,441
~ Persons
7
1,209
394
1,587
1,221
1,767
2,184
594
3,218
1,274
572
1,284
2,178
502
674
2,078
1,233
966
1,020
547
947
786
2,208
1,695
643
648
789
662
1,155
2,038
1.906
730
587
500
1,240
1,100
11,250
10,238
506
Population in IIle
age group ()..6
Males. 8
614
196
842
620
878
1,091
291
1,692
678
296
658
1,151
254
330
1,063
634
525
514
293
478
398
1,112
888
328
328
417
303
563
980
959
362
317
239
651
555
5,742
5,242
244
Females 9
595
198
745
601
889
1,093
303
1,526
596
276
626
1.025
248
344
1,015
599
441
506
254
469
3B8
1,096
807
315
320
372
359
592
1,058
947
368
270
261
589
545
5,508
4,996
262
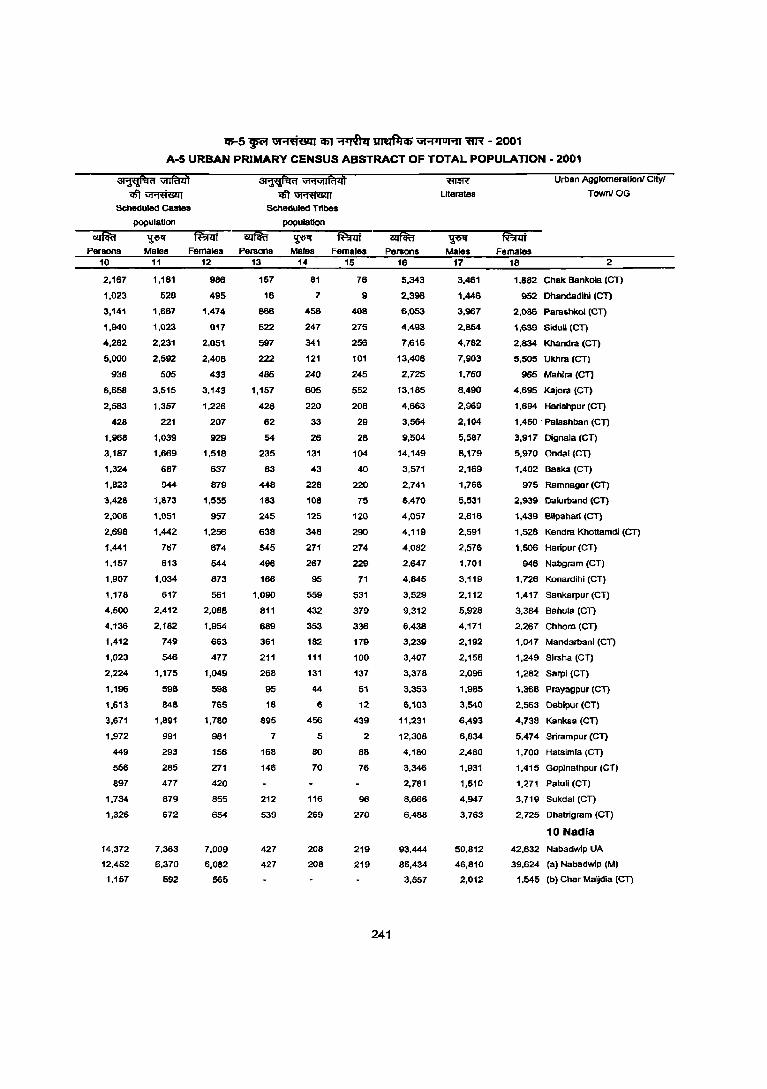
• Persons 10
2,167
1,023
3,141
1,940
4,262
5,000
938
6,658
2,563
428
1,968
3,187
1,324
1,823
3,426
2,006
2,696
1,441
1,157
1,907
1,178
4,500
4,136
1,412
1,023
2,224
1,196
1,613
3,671
1,972
449
556
897
1,734
1,326
14,372
12,452
1,157
If;-5 ~ G1.l'fiacu ~ ~ ~ G1"iiIUI"'1ll1R - 2001
A-5 URBAN PRIMARY CENSUS ABSTRACT OF TOTAL POPULATION - 2001
population
~ Males
11
1,181
528
1,667
1,02:?
2,231
2,592
505
3,515
1,357
221
1,039
1,669
687
944
1,673
1,051
1,442
7157
613
1,034
617
2,412
2,182
749
546
1,175
598
848
1,891
991
293
285
477
879
672
7,363
6,370
592
~ \i1'1V1lfr14i
'iIft~ Scnecluled Tribes
population
Females Persons Males Females Persons 12 13 14 15 16
986
495
1,474
917
2,051
2,408
433
3,143
1,226
207
929
1,518
637
879
1,555
957
1,256
674
544
873
561
2,088
1,954
663
477
1,049
598
765
1,780
981
156
271
420
855
654
7,009
6,082
565
157
16
866
522
597
222
485
1,157
428
62
54
235
83
448
163
245
638
545
496
166
1,090
811
689
361
211
268
95
18
895
7
168
146
212
539
427
427
81
7
456
247
341
121
240
605
220
33
26
131
43
228
108
125
348
271
267
95
559
432
353
182
111
131
44
6
456
5
80
70
116
269
208
208
76
9
408
276
256
101
245
552
208
29
28
104
40
220
75
120
290
274
229
71
531
379
336
179
100
137
51
12
439
2
88
76
96
270
219
219
241
5,343
2,398
6,053
4,493
7,616
13,408
2,725
13,185
4,663
3,564
9,504
14,149
3,571
2,741
8,470
4,057
4,119
4,082
2,647
4,845
3,529
9,312
6,438
3,239
3,407
3,378
3,353
6,103
11,231
12,308
4,180
3,346
2,781
8,666
6,488
93,444
86,434
3,557
Literates
~ Males
17
3,461
1,446
3,967
2,854
4,782
7,903
1,760
8,490
2,969
2,104
5,587
8,179
2,169
1,766
5,531
2,618
2,591
2.576
1,701
3,119
2,112
5,928
4,171
2,192
2,158
2,096
1.985
3,540
6,493
6,634
2,480
1,931
1,510
4,947
3,763
50,812
46,810
2,012
fa;if Females
18
Urban Agglomeration! Cltyl
TownIOG
2
1,882 Chak Bankola (CT)
952 Ohandadihl (CT)
2,086 Parashkol (CT)
1,639 Siclull (CT)
2,834 Khandra (CT)
5,505 Ukhra (CT)
965 Mahira (eT)
4,695 Kajora (eT)
1,694 Harishpur (CT)
1,460 . Palashban (CT)
3,917 Dignala (Cn
5,970 Cndal (eT)
1,402 Baska (CT)
975 Ramna90r (CT)
2,939 Oalurband (CT)
1,439 Bilpahari (CT)
1,528 Kendra KhOttamdi (CT)
1,506 Haripur (CT)
946 Nabgram (CT)
1,726 Konardihi (eT)
1,417 Sankarpur (CT)
3,384 Bahula (CT)
2,267 Chhora (CT)
1,047 Mandarbani (CT)
1,249 Sirsha (CT)
1,282 Sarpl (eT)
1,368 Prayagpur (CT)
2,563 Debipur (eT)
4,738 Kanksa (CT)
5,474 Srirampur (eT)
1,700 Hatsimla ICT)
1,415 Goplnathpur (CT)
1,271 Patuli (CT)
3,719 Sukdal (CT)
2,725 Dhatrigram (CT)
10 Nadia
42,632 Nabadwip UA
39,624 (a) Nabadwip (M)
1,545 (b) Char Maijdia (CT)
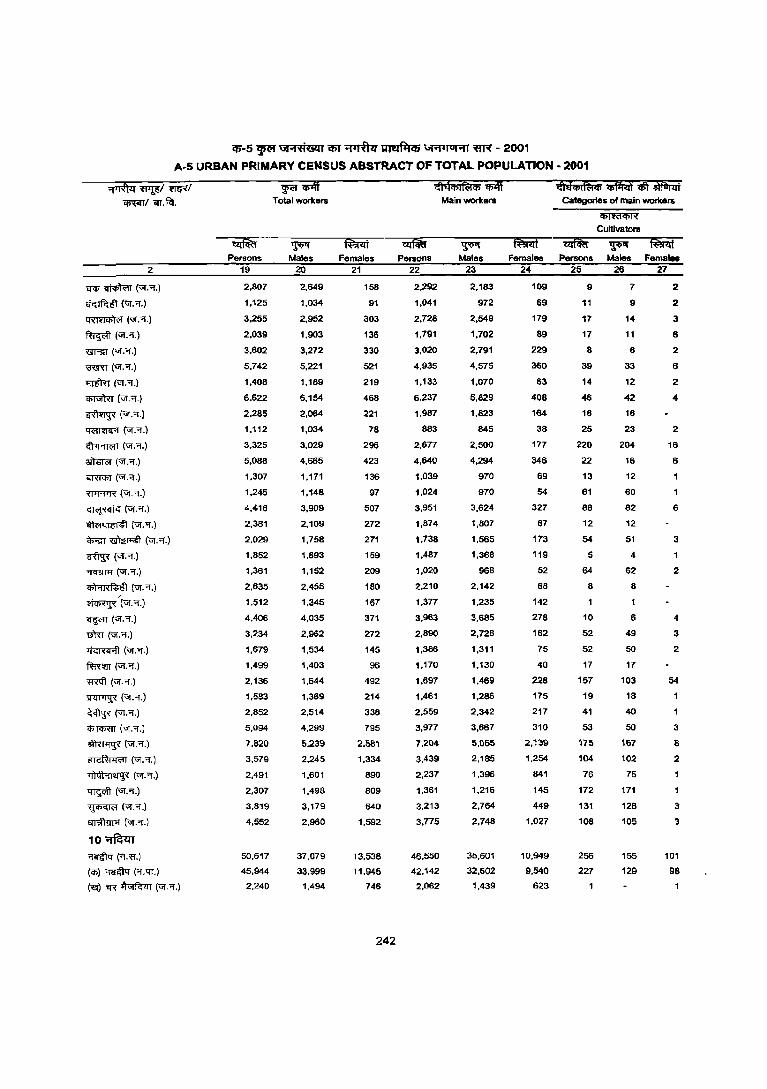
(1)-5 ~ \JI"1tii641 ifIT ~ ~ \JI'1' 10I"t I ~ - 2001
A-5 URBAN PRIMARY CENSUS ABSTRACT OF TOTAL POPULATION - 2001
2
qq;~(-;;r."'1".)
~(~."!'.)
~("I'."'I'.)
fu¥1T ("1'."'1'.)
«ROT (-;;(."'1".)
~("Gf.'f.)
~(vr."'I'.)
~("I'.'OJ.)
~("I'."'f.)
~("I':'f.)
~("I'.'l.)
aif6R;r (Uf. 'OJ.)
~(-;;r.'OJ.)
~("I'."'I'.)
~"iG("I'."'I.)
.. l('1Gn;ltt ("I':or.)
w.m ~ (Uf.".)
~(vr."!'.)
"f<f!!T'J ('>I."!'. )
qjJ'1H~i.ft (\if. 'f.)
~/Cvr.'OJ.) ~('G!."f.)
urn ("1'."'1'.)
~(Uf . .,.)
fmm (Uf."!'.)
~(Uf."f.)
~(\if.'l.)
~ (Ui.'l.)
<i>~(\if."f.)
~(Uf.'OJ.)
~(\if."f.)
~(~."!'.)
~(vr."!'.)
~(\if.,,!,.)
~ (\if . .,.)
10~ ~("!'.'ff.)
(<I» ~ ("f.lIT.)
('I!I) 'tI< ~ (\if."'!.)
Persons 19
2,807
1,125
3,255
2,039
3,602
5,742
1,408
6,622
2,285
1,112
3,325
5,088
1,307
1,245
4,416
2,381
2.029
1.852
1,361
2,635
1.512
4.406
3,234
1.679
1,499
2.136
1,583
2,852
5,094
7.820
3.579
2,491
2,307
3.819
4,552
50.617
45.944
2.240
~i1ff Total workers
~ Males
20
2.649
1.034
2.952
1.903
3,272
5,221
1,189
6.154
2,064
1,034
3,029
4,665
1.171
1.148
3,909
2,109
1,758
1,693
1,152
2,455
1.345
4,035
2,962
1,534
1.403
1.644
1,369
2,514
4,299
5.239
2,245
1,601
1,498
3,179
2,960
37,079
33.999
1,494
~ Females
21
158
91
303
136
330
521
219
468
221
78
296
423
136
97
507
272
271
159
209
180
167
371
272
145
96
492
214
338
795
2,581
1.334
890
809
640
1,592
13,538
11,945
746
242
~dij)I~ij) :;iff Main workers
Persons 22
2.292
1.041
2,728
1,791
3,020
4,935
1,133
6.237
1,987
883
2.677
4.640
1.039
1,024
3,951
1.874
1.738
1,487
1,020
2,210
1.317
3,963
2,890
1.386
1,170
1,697
1,461
2,559
3,917
7,204-
3,439
2,237
1,361
3,213
3,775
46.550
42,142
2.062
~ Males
23
2,183
972
2,549
1,702
2,791
4,575
1.070
5.829
1,823
845
2,500
4.294
970
970
3,624
1,807
1,565
1,368
968
2,142
1,235
3.685
2.728
1.311
1,130
1.469
1,286
2,342
3,667
5,065
2.185
1,396
1,216
2,764
2,748
35,601
32,602
1,439
~Efij)intq; ~ '$t ~ Categories of main worIters
15J"fflij)'R
Cultivators
Females Persons 24 25
109 9
69 11
179 17
89 17
229 8
360 39
63 14
408 46
164 16
38 25
117 220
346 22
69 13
54 61
327 88
67 12
173 54
119 5
52 64
68 8
142
278 10
162 52
75 52
40 17
228 157
175
217
310
2,139
1,254
841
145
449
1.027
10,949
9.540
623
19
41
53
175
104
76
172
131
108
256
227
Males Femate. 26 27
7 2
9 2
14 3
11 6
6 2
33 6
12 2
42 4
16
23 2
204 16
16 6
12
60
82 6
12
51 3
4
62 2
8
6 4
49 3
50 2
17
103 54
18
40
50
167
102
75
171
128
105
155
129
3
8
2
3
3
101
98
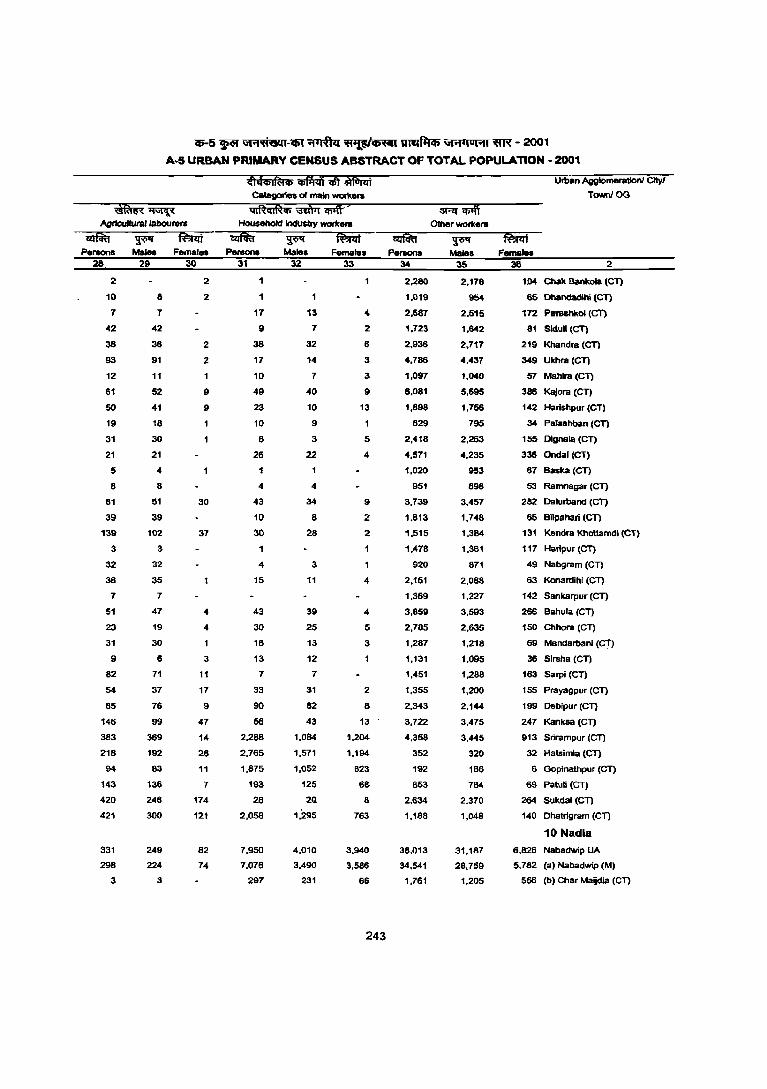
.5 ~ ",.,\ti(tQ1-1IiI "11l& ~ ~ GI"'I'IOlotl ~ - 2001
A-5 URBAN PRIMARY CENSUS ABSTRACT OF TOTAL POPULATION - 2001
~ ~ ~ Persons Main Females
28 29 30
2
10
1
42
38
93
12
61
50
19
31
21
5
8
81
39
139
3
32
36
7
51
23
31
9
82
54
85
146
383
218
94
143
420
421
331
298
3
a 7
42
36
91
11
52
41
18
30
21
4
8
51
39
102
3
32
35
7
47
19
30
6
71
37
76
99
369
192
83
136
246
300
249
224
3
2
2
2
2
9
9
30
37
4
4
3
11
17
9
47
14
26
11
7
174
121
82
74
cfttiCPI~qs 'iiiftriI'f ~ ~ Catagorln of main wor1< ....
ql~qlf&cp 'i3mrT ~ >
Household Indusll)' workers
Persons 31
1
1
11
9
38
17
10
49
23
10
8
26
4
43
10
30
1
4
15
43
30
16
13
7
33
90
56
2,288
2,765
1,875
193
28
2,058
7,950
7,076
297
Males 32
13
7
32
14
7
40
10
9
3
22
4
34
8
28
3
11
39
25
13
12
7
31
82
43
1,084
1,571
1,052
125
2Q
1.295
4,010
3,490
231
Females 33
.. 2
6
3
3
9
13
5
4
9
2
2
4
4
5
3
2
8
13
1,204
1,194
623
68
8
763
3.940
3,586
66
243
Urban AgglomeralIOnI CIty!
TCNIOIOG
~ ~ taiii Persons Males Females
34 35 38 2
2,280
1,019
2,687
1,723
2,936
4,786
1,097
6,081
1,898
829
2,418
4,571
1,020
951
3,739
1.813
1,515
1,478
920
2,151
1.369
3,859
2,785
1,287
1.131
1,451
1,355
2,343
3,722
4.358
352
192
853
2,634
1,188
38,013
34,541
1,761
2,176
954
2,515
1,642
2,717
4,437
1,040
5,695
1,756
795
2,263
4.235
953
898
3.457
1,748
1.384
1,381
871
2,088
1.227
3,593
2,635
1,218
1,095
1,288
1,200
2,144
3,475
3,445
320
186
784
2.370
1,048
31.187
28,759
1.205
1.04 Chak BIIInkoia (CT)
65 Dnandadihl (CT)
172 Parashkol (eT)
81 SlduU (CT)
219 Khandra (eT)
349 Ukhra (CT)
57 Mahlra (eT)
386 Kajara (CT)
142 Harishpur (CT)
34 Palashban (CT)
155 Dlgnala (eT)
336 Ondal (CT)
67 Baska (CT)
53 Ramnagar (CT)
282 Dalurband (eT)
65 Bilpahari (CT)
131 Kendra Khottamdl (eT)
117 Haripur (CT)
49 Nabgram (CT)
63 Konarclihl (CT)
142 Sankarpur (CT)
266 Bahula (CT)
150 Chhora (CT)
69 Mandarbanl (eT)
36 Sinsha (CT)
163 Sarpi (CT)
155 Prayagpur (CT)
199 Debipur (CT)
247 Kanksa (CT)
913 Srirampur (eT)
32 Hatsimla (eT)
6 Goplnathpur (eT)
69 Patul! (eT)
264 Sukdal (eT)
140 Dhatrigram (eT)
10 Nadia
6.826 Nabadwip UA
5.782 (a) Nabadwip (M)
556 (b) Char Maijdia (eT)
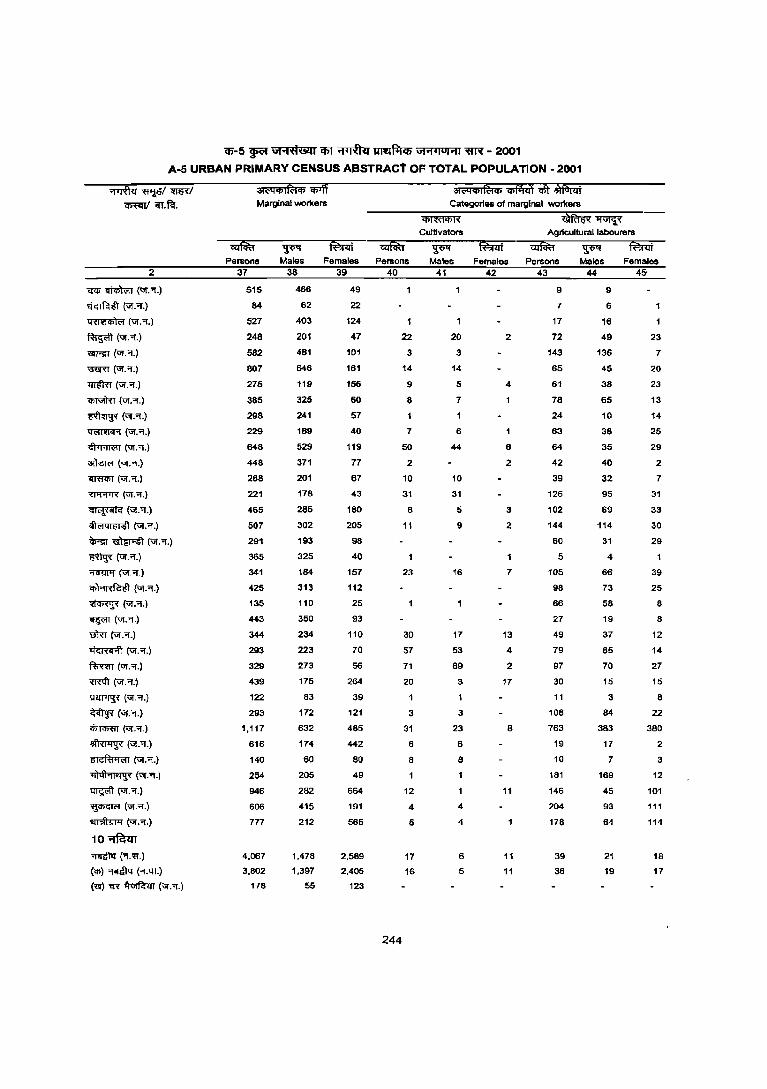
<1)-5 ~ UI'i'fi6ll1 itiT ~ ~ \i!'1.IUIi11 '«R - 2001
A-5 URBAN PRIMARY CENSUS ABSTRACt OF TOTAL POPULATION - 2001
2
'ff'P ~ (Vr."!.)
~(V!."!.)
~(Vr."!.)
~("Gf."i.)
~(ur."".)
~(ur."i.)
~("Gf.Of.)
CfiT\iIffi ("Gf. Of.)
~(Uf."!.)
trnTlII'r'I ("<3'1. "i .)
~("<3'I."!.)
~(ur."f.)
"iITflCI>T ("<3'I."i.)
~("<3'I."".)
~("<3'I."l.)
~(ur . .,.)
~~(ur."I.)
~(ur."i.)
;mwr (ur.'!".)
q;1'1ldM'I ("!."i.)
~(V!.'f.)
~(\iI.".)
tfflr (ur. Of.)
~(ur.-r.)
fffl"m (Uf."i.)
"ffi"Ifi (Uf."'J.j
~("Gf.Of.)
~ (ur.Of.)
<i>T<'Pm ("!.Of.)
~("!."l.)
~(ur . .,.)
~("<3'I . ..,.)
~ ("Gf."i.)
~("Gf.".)
~("<3'I • ..,.)
10~ ~("!.~.)
(q;) omlN (-r.m.)
~ t'R ~ ("Gf."l.)
Marginal workers Categories of marginal workers
~
Cultivators ~~
Agricultural labourers
Persons Males Females Persons Males Females Persons Males Females 37 38 39 40 41 42 43 44 45<
515 466 49 9 9
84 62 22 7 6
527 403 124 17 16
~ ~ ~ ~ ~ 2 n ~ D
582
807
275
385
298
229
648
448
268
221
465
507
291
365
341
425
135
443
344
293
329
439
122
293
1.117
616
140
254
946
606
777
4.067
3.802
178
481
646
119
325
241
189
529
371
201
178
285
302
193
325
184
313
110
350
234
223
273
175
83
172
632
174
60
205
282
415
212
1.478
1.397
55
101
161
166
60
57
40
119
77
67
43
180
205
98
40
157
112
25
93
110
70
56
264
39
121
485
442
80
49
664
191
565
2,589
2,405
123
244
3
14
9
8
7
50
2
10
31
8
11
23
30
57
71
20
3
31
6
8
12
4
5
17
16
3
14
5
7
6
44
10
31
5
9
16
17
53
69
3
3
23
6
8
4
4
6
5
4
6
2
3
2
7
13
4
2
17
8
11
11
11
143
65
61
78
24
63
64
42
39
126
102
144
60
5
105
98
66
27
49
79
97
30
11
106
763
19
10
181
146
204
178
39
36
136
45
38
65
10
38
35
40
32
95
69
114
31
4
66
73
58
19
37
65
70
15
3
84
383
17
7
169
45
93
64
21
19
7
20
23
13
14
25
29
2
7
31
33
30
29
39
25
8
8
12
14
27
15
8
22
380
2
3
12
101
111
114
18
17
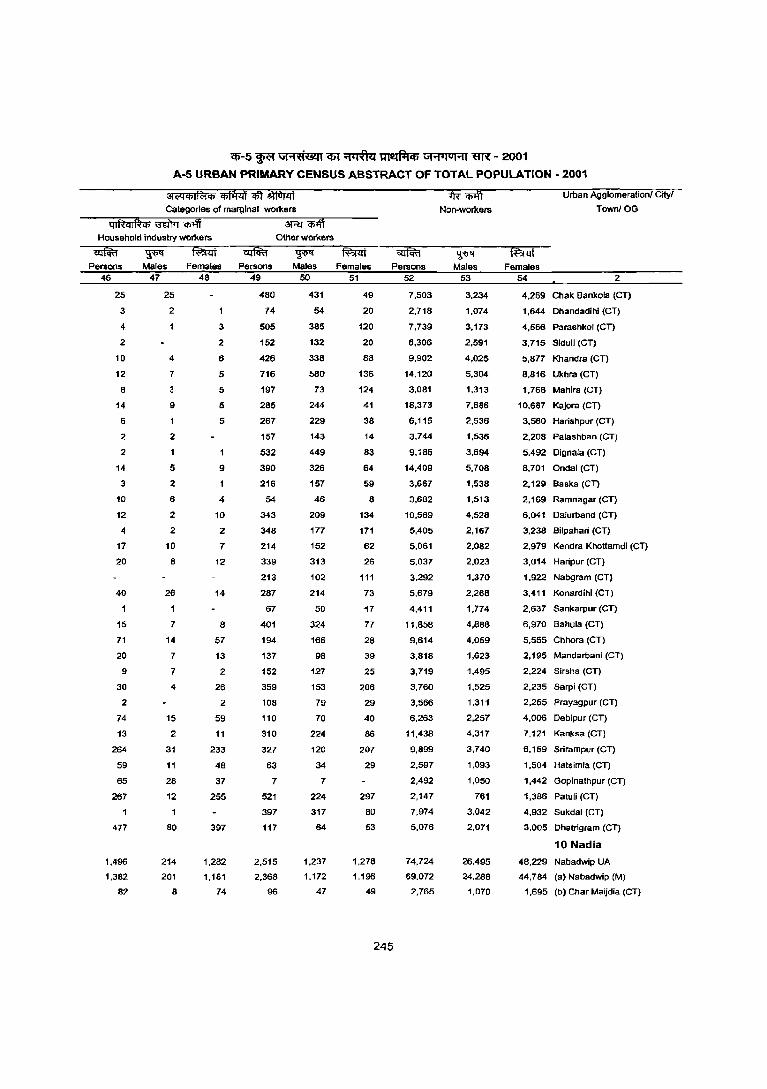
<p-5 ~ Gi'1'<'i&U <fi1 "1TI& ~ Gi'1'IUI'11 ~ - 2001
A-5 URBAN PRIMARY CENSUS ABSTRACT OF TOTAL POPULATION - 2001
31(;qCl>lffiCl> iflI"li¥ qll:;)faTlif 1R" ilff Urban Agglomeration!Cityl
Categories of marginal workers Non-workers Town! OG
qIRqi~<t> ~ ilW 3Rf ~ Household industry wof1(.ers Other workers
Persons 46
25
3
4
2
10
12
8
14
6
2
2
14
3
10
12
4
17
20
40
15
71
20
9
30
2
74
13
264
59
65
267
477
1,496
1,382
82
Males 47
25
2
4
7
9
2
1
5
2
6
2
2
10
8
26
7
14
7
7
4
15
2
31
11
28
12
80
214
201
8
Females Persons 48 49
3
2
6
5
5
5
5
1
9
4
10
2
7
12
14
8
57
13
2
26
2
59
11
233
48
37
255
397
1,282
1.181
74
480
74
505
152
426
716
197
285
267
157
532
390
216
54
343
348
214
339
213
287
67
401
194
137
152
359
108
110
310
327
63
7
521
397
117
2,515
2,368
96
Males 50
431
54
385
132
338
58l}
73
244
229
143
449
326
157
46
209
177
152
313
102
214
50
324
166
98
127
153
79
70
224
120
34
7
224
317
64
1,237
1.172
47
~ Females Persons
51
49
20
120
20
88
136
124
41
38
14
83
64
59
8
134
171
62
26
111
73
17
77
28
39
25
206
29
40
86
207
29
297
80
53
1.278
1.196
49
245
52
7.503
2.718
7,739
6,306
9,902
14,120
3.081
18,373
6,116
3,744
9,186
14,409
3,667
3,682
10,569
5,405
5.061
5.037
3.292
5.679
4,411
11,858
9,614
3,818
3,719
3.760
3,566
6.263
11.438
9,899
2,597
2,492
2.147
7.974
5,076
74.724
69.072
2,765
~ Males
53
3.234
1,074
3,173
2,591
4,025
5,304
1.313
7,686
2,536
1,536
3,694
5,708
1,538
1,513
4,528
2,167
2,082
2,023
1,370
2,268
1,774
4,888
4.059
1,623
1,495
1,525
1,311
2,257
4,317
3,740
1,093
1,050
761
3.042
2,071
26.495
24,288
1.070
~ Females
54 2
4.269 Chak Bankola (CT)
1,644 Dhandadihi (CT)
4,566 Parashkoi (CT)
3,715 Sidull (Cn
5,877 Khandra (eT)
8.816 Ukhra (eT)
1.768 Mahira (eT)
10,687 Kajora (eT)
3,580 Harishpur (eT)
2,208 Palashban (eT)
5.492 Dignala (CT)
8,701 Ondal (CT)
2,129 Baska (CT)
2,169 Ramnagar (CT)
6,041 Dalurband (eT)
3,238 Bilpahari (eT)
2,979 Kendra Khottamdi (CT)
3.014 Haripur (eT)
1,922 Nabgram (eT)
3,411 Konardihi (eT)
2,637 Sankarpur (eT)
6,970 Bahula (CT)
5,555 Chhora (eT)
2,195 Mandarbani (eT)
2,224 Sirsha (eT)
2,235 Sarpi (eT)
2,255 Prayagpur leT)
4,006 Debipur (eT)
7.121 Kanksa (eT)
6,159 Srirampur (eT)
1,504 Hatsimla (eT)
1,442 Gopinathpur (eT)
1,386 Patuli (eT)
4.932 Sukdal (CT)
3,005 Dhatri9ram (eT)
10 Nadia
48,229 Nabadwip UA
44.784 (a) Nabadwlp (M)
1,695 (b) Char Maijdia (CT)
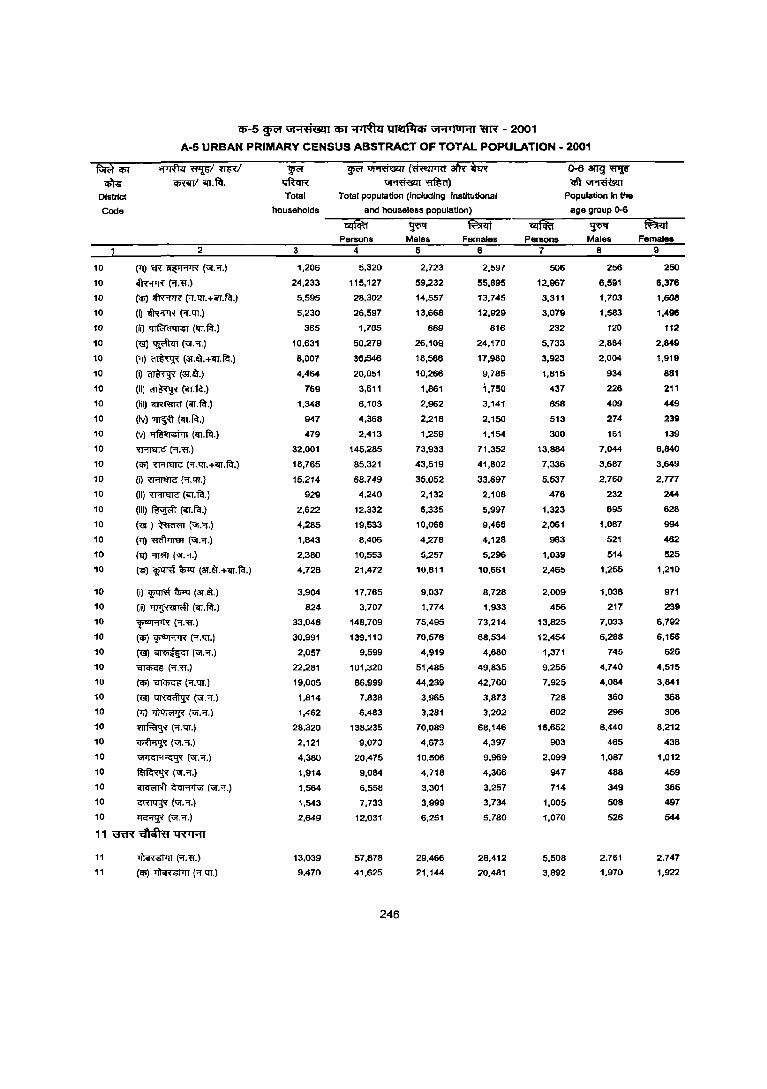
"'-5 ~ \J1"lfl&l1 (fiT ~ ~ \J1"l'luHI ~ - 2001
A-5 URBAN PRIMARY CENSUS ABSTRACT OF TOTAL POPULATION - 2001
~1PI ~
District
Code
10
10
10
10
fO
10
10
10
10
10
10
10
10
10
10
10
10
10
10
10
10
10
10
10
10
10
10
10
10
10
10
10
10
10
10
10
2
('1) 'i'R ~ ("I.'!.)
~ ("f:~r.)
('if;) ~ ('f.'CU.+iif(.~.)
(i) ~ ("f.tn.)
(ii)~(iif(.~.)
(~ ~ ("1."1'.)
(l'J) ~ (~.Il).HT.~.)
(i)~(au).)
(ii)~~.fq.)
(iii) ;;umno ('Ir.~.)
(iv) ~ (qr.~.)
(v)~(iif(.F<I.)
~(.,.'ff.)
(q;) 'U'fI'EII'<! (.,.llT.+<IT.~.)
(i) ~ (.,.'CU.)
(ii) ~ (<IT.~.)
(iii)~~.fq.)
(<< ) ~ ("1."1'.)
('1) ~ ("I . .,.)
('EI) "fTm ("1."1.)
(6') ~ ~ (al.a.+<IT.fcr.)
(i) ~ ~ (al."'.)
(il) ~ (<IT.~.)
~(.,.'ff.)
('if;) 'F"'J"l'R (".tn.)
~~("I . .,.)
~("I.'ff.)
(lli) ~ ('!.llT.)
("llI) ~ ("I."'.)
(7J) ~ (vr.'f,)
~(.,.tn.)
~("I . .,.)
1i1'1C:1'1"<::t~ (vr:'1.)
~("I."I.)
~~("I.;;.)
~(vr . .,.)
10 ~ ("I."I.)
11 '\'ffi"'{~'tWAT
11
11
>il<mrt>rr ("I. 'ff.)
(1P) ~ (.,.llT.)
Total Tolal populatloo (including Instirutiooal
households and houseless population)
3
1,206
24,233
5.595
5,230
365
10,631
8,007
4,464
769
1,348
947
479
32,001
18,765
15,214
929
2,622
4,285
1,843
2,380
4,728
3,904
824
33,048
30,991
2,057
22,281
19,005
1,814
1,462
28,320
2,121
4,380
1,914
1,564
1,543
2,649
13,039
9,470
Persons 4
5,320
115,127
28,302
26,597
1,705
50,279
361546
20,051
3,611
6,103
4,368
2,413
145,285
85,321
68,749
4,240
12,332
19,533
8,406
10,553
21,472
17.765
3,707
148,709
139,110
9,599
101,320
86,999
7,838
6,483
138,235
9,070
20,475
9,084
6.558
7,733
12,031
57.878
41.625
246
~ Males
5
2,723
59,232
14,557
13,668
669
26,10Q
16,566
10,266
1,861
2,962
2,218
1,259
73,933
43,519
35,052
2,132
6,335
10,068
4,278
5,257
10,811
9,037
1,774
75,495
70,576
4,919
51,485
44,239
3,965
3,281
70,089
4,673
10,506
4,718
3,301
3,999
6,251
29,466
21,144
Females 6
2,597
55,895
13,745
12,929
816
24,170
17,980
9,785
1,750
3,141
2,150
1,154
71,352
41,802
33,697
2,108
5,997
9,465
4,128
5,296
10,661
8,728
1,933
73,214
68,534
4,680
49,835
42,760
3,873
3,202
68,146
4,397
9,969
4,366
3,257
3,734
5,780
28.412
20,481
O-6~~ <Ilt wmoo
Population In the
age group ()-6
Pellions 7
506
12,967
3,311
3,079
232
5,733
3,923
1,815
437
858
513
300
13,884
7,336
5,537
476
1,323
2,061
983
1,039
2,465
2,009
456
13,825
12,454
1,371
9,255
7,925
728
602
16,652
903
2,099
947
714
1,005
1,070
5,508
3,892
~ Males
8
256
6,591
1,703
1,583
120
2,884
2,004
934
226
409
274
161
7,044
3,687
2,760
232
695
1,067
521
514
1,255
1,038
217
7,033
6,288
745
4,740
4,084
360
296
8,440
465
1,087
488
349
508
526
2.761
1,970
~ Femal ..
9
250
6,376
1,608
1,496
112
2,849
1,919
881
211
449
239
139
6,840
3,649
2,777
244
628
994
462
525
1,210
971
239
6,792
6,166
626
4,515
3,841
368
306
8,212
438
1,012
459
365
497
544
2,747
1,922
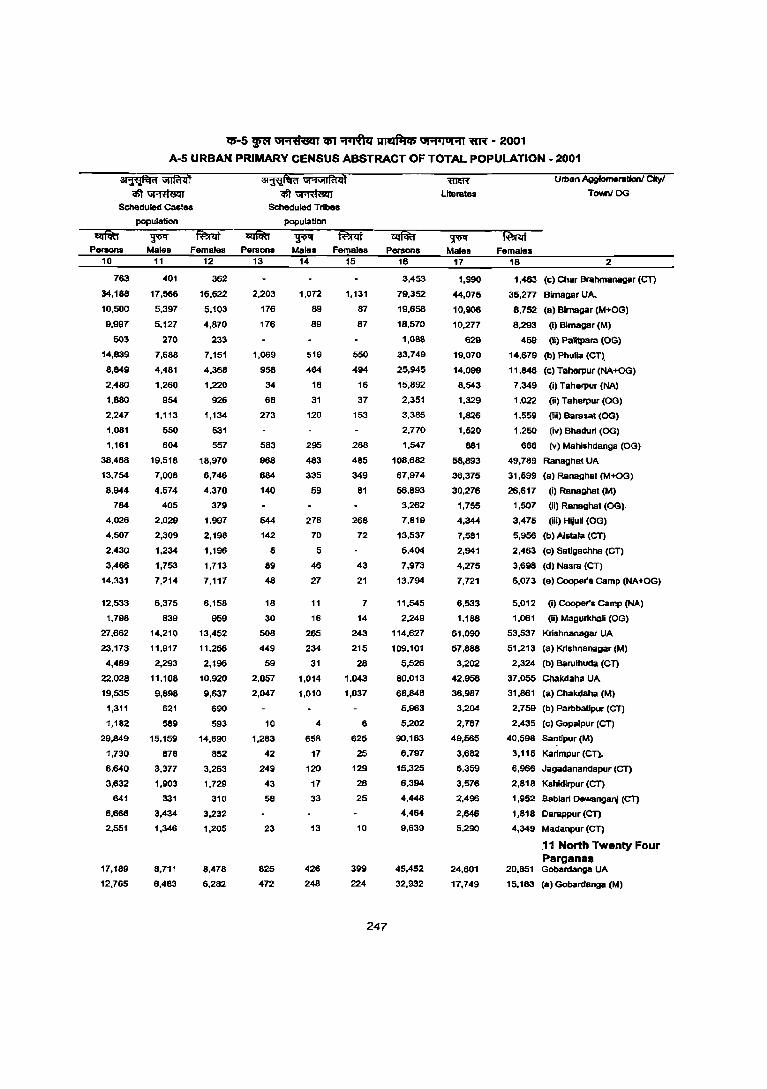
l5-5 ~ ",.,t'i6tljl5T ~ ~ ",.,ijOj.,j1lN - 2001
A-5 URBAN PRIMARY CENSUS ABSTRACT OF TOTAL POPULATION - 2001
~~ $l'~
Scheduled Callt"
population
~
~\iI"\ilI~<il <tft~
Scheduled Tribes
population
Males Females Persons Males Femalss Persons 10
763
34,188
10,500
9,997
503
14,839
8,&49
2,480
1,880
2,247
1,081
1,161
38,488
13,754
8,944
7&4
4,026
4,507
2,430
3,466
14,331
12,533
1,798
27,662
23,173
4,489
22,028
19,535
1,311
1,182
29,&49
1,730
6,640
3,632
641
6,666
2,551
17,189
12,765
11
401
17,566
5,397
5,127
270
7,686
4,481
1,260
954
1,113
550
604
19,518
7,008
4,574
405
2,029
2,309
1,234
1,753
7,214
6,375
839
14,210
11,917
2,293
11,108
9,898
621
589
15,159
878
3,377
1,903
331
3,434
1,346
8,711
6,483
12 13 14 15 16
362
16,622
5,103
4,870
233
7,151
4,368
1,220
926
1,134
531
557
18,970
6,746
4,370
379
1,997
2,198
1,196
1,713
7,117
6,158
959
13,452
11,256
2,196
10,920
9,637
690
593
14,690
852
3,263
1,729
310
3,232
1,205
8,478
6,262
2,203
176
176
1,069
958
34
68
273
583
968
6&4
140
544
142
5
89
48
18
30
508
449
59
2,057
2,047
10
1,283
42
249
43
58
23
825
472
1,072
89
89
519
464
18
31
120
295
483
335
59
276
70
5
46
27
11
16
265
234
31
1,014
1,010
4
658
17
120
17
33
13
426
248
1,131
87
87
550
494
16
37
153
286
485
349
81
268
72
43
21
7
14
243
215
28
1,043
1,037
6
625
25
129
26
25
10
399
224
247
3,453
79,352
19,658
18,570
1,Oas
33,749
25,945
15,892
2,351
3,385
2,770
1,547
108,682
67,974
56,893
3,262
7,819
13,537
5,404
7,973
13,794
11,545
2,249
114,627
109,101
5,526
80,013
68,848
5,963
5,202
90,163
6,797
15,325
6,394
4,448
4,464
9,639
45,452
32,932
~
Literates
~ Males
17
1,990
44,075
10,906
10,277
629
19,070
14,099
8,543
1,329
1,626
1,520
861
58,893
36,375
30,276
1,755
4,344
7,581
2,941
4,275
7,721
6,533
1,188
61,090
57,888
3,202
42,958
36,987
3,204
2,767
49,565
3,662
8,359
3,576
2,496
2,646
5,290
24,601
17,749
~ Females
18
Urban AggIomeraIIonI Cltyl
Tf:NtnI OG
2
1,463 (c) Char Brahmanagar (eT)
35,277 Bimagar UA.
8,752 (a) Blmagar (M+OG)
8,293 (I) Blrnagar (M)
459 (til Palltpara (OG 1 14,679 (b) Phulla (CT),
11,846 (c) Taherpur (NA+OG)
7,349 (i) Taherpur (NA)
1,022 (ii) Taherpur (OG)
1 ,559 (iii) Barasat (OG)
1 ,250 (iv) Bhaduri (OG)
666 (v) Mahlshdanga (OG)
49,789 Ranaghat UA
31,599 (al Ranaghat (M+OG)
26,617 (i) Ranaghat(M)
1,507 (Ii) Ranaghat (OG)
3,475 (iii) Hljull (OG)
5,956 (b) Aislala (CT)
2,463 (c) Satigachha (CT)
3,698 (d) Naara (CT)
6,073 (e) Cooper's Camp (NA+OG)
5,012 (I) Cooper's Camp (NA)
1,061 (Ii) Magul'khali (OG)
53,537 Krishnanagar UA
51,213 (a) Krishnanagar (M)
2,324 (b) Barulhuda (eT)
37.055 Chakdaha UA
31,861 (a) Chakdaha (M)
2,759 (b) Parbbatlpur (CT)
2.435 (c) Gopalpur (eT)
40,598 Sa~tipur (M)
3,115 Karlmpur (Cl)..
6,966 Jagadanandapur (eT)
2,818 Kshidirpur (eT)
1,952 Sablari Dewanganj (et)
1,818 Oarappur (CT)
4,349 Madanpur (eT)
,11 North Twenty Four Parganas
20,851 Gobardanga UA
15,163 (al Gobardanga (M)
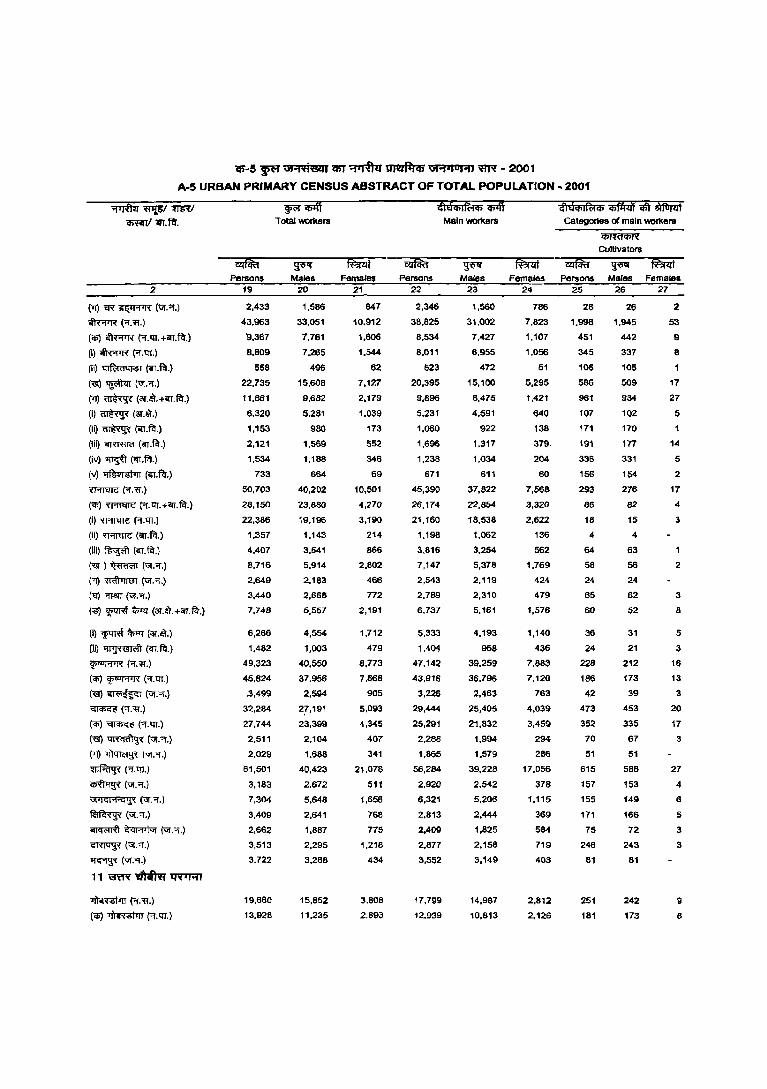
;';-5 ~ ilI'1:fl&l,l5T ~ 'Il'IVlftm 0..,.,0'"1' wrv - 2001
A·5 URBAN PRIMARY CENSUS ABSTRACT OF TOTAL POPULATION - 2001
2
("lJ) 'tR ~ ("ijf.rr.)
~(".<f.)
(<I» ~ \'J.tII.+ifT.~.)
(i) ~ (rr.ttI.)
(ii) ~ (1iIT.F<t)
(~~('G\'.<f.)
(>1) ~ (ar,~.HT.~.J
(i)~(ar.~.)
(ii) ~ (ifT,flI.)
(iii) <rnR!TCl (<rr.~.)
(iv)~('itT.~.)
(v) ~ (<rr.flI.)
~("'f.w.J
('Il) ~ (,.GT.+<rr.fltJ
(i) ~ ('I.tII.)
(ii) W!l'm<! (<n.flI.) (iiI)~(<rr,~.)
('" J ~ ("I."i.)
("1)~("I."!.)
(~ "ITm(vr.'9'.)
(<I') ~ ~ (3T.it.+'itT.flI.)
(i) ~ ~ (ar.e).)
(ll)~(<rr.~.)
'F'f'PR \oU!.)
('Il) ~ ("i. ttl.)
(<§)~('G\'.-;;.J
~("!.w.)
(<I»~(1.1;jf.)
(<§) ~ (VI.1.)
(11) ~ (ur.Of.)
~(rr.ttI.)
~(Uf . ..,.)
GI'I':I'1'G~ (Uf."f.)
~(Uf."!.)
~~('G\'."i.)
~('GI.'1.)
~('G\'."'f.)
11~~~
~I-r.w.)
(q;) ~ (,.tIT.)
Persons 19
2,433
43.963
'9,367
B,B09
55B
22,735
11,861
6,320
1,153
2,121
1,534
733
50,703
28,150
22,386
1,357
4.407
8,716
2,649
3,440
7,748
6,266
1,482
49,323
45,824
.3,499
32,284
27,744
2,511
2,029
61,501
3,183
7,304
3,409
2,662
3,513
3,722
19,660
13,928
~iIilff Total workers
~ Males
20
1,586
33,051
7,761
7,265
496
15,608
9,682
5,281
980
1,569
1,1B8
664
40,202
23,680
19,196
1,143
3,541
5,914
2,183
2,668
5,557
4,554
1,003
40,550
37,956
2,594
2!,191
23,399
2,104
1,688
40,423
2,672
5,648
2,641
1,B87
2,295
3,288
15,852
11,235
f¥iiit Females
21
847
10,912
1,608
1,544
62
7,127
2,179
1,039
173
552
346
69
10,501
4,270
3,190
214
866
2,802
466
772
2,191
1,712
479
8,773
7,868
905
5,093
4,345
407
341
21,076
511
1,655
768
775
1,218
434
3,808
2,693
4) dq;Jfi1q; iiff
Persons 22
2,346
38.825
8.534
8.011
523
20,395
9,896
5,231
1,080
1,696
1,238
671
45,390
26,174
21,160
1,198
3.816
7,147
2,543
2,789
6,737
5,333
1,404
47,142
43,916
3,226
29,444
25,291
2,288
1,865
56,284
2,920
6,321
2,813
2,409
2,877
3,552
17,799
12,939
Main WOrkIIns
~ Males
23
1,560
31.002
7,427
6,955
472
15,100
8,475
4,591
922
1,317
1,034
611
37,822
22,854
18,538
1,062
3,254
5,378
2,119
2,310
5,161
4,193
968
39,259
36,796
2,463
25,405
21,832
1,994
1.579
39,228
2,542
5.206
2,444
1.825
2,158
3,149
14,987
10,813
.Mq;Ifi;tq; iMiJii iih ~ Gategotles <:I maIn wocIIers
Females Persons 24 25
786 28
7.823 1.998
1,107 451
1,055 345
51 106
5,295 586
1,421 961
640 107
138 171
379. 191
204 336
60 155
7,558 293
3,320 86
2,622 18
136 4
562 64
1,769 58
424 24
479 65
1,576 60
1,140 36
436 24
7,883 228
7.120 186
763 42
4,039 473
3,459 352
294 70
286 51
17,056 615
378 157
1,115 155
369 171
584 75
719 246
403 61
2,812 251
2,126 181
~
CUltJvators
Males Females 26 27
26 2
1.945 53
442 9
337 8
105
569 17
934 27
102 5
170
177 14
331 5
154 2
276 17
82 4
15 3
4
63
55 2
24
62 3
52 8
31 5
21 3
212 16
173 13
39 3
453 20
335 17
67 3
51
588 27
153 4
149 6
166 5
72 3 243 3
81
242 9
173 8
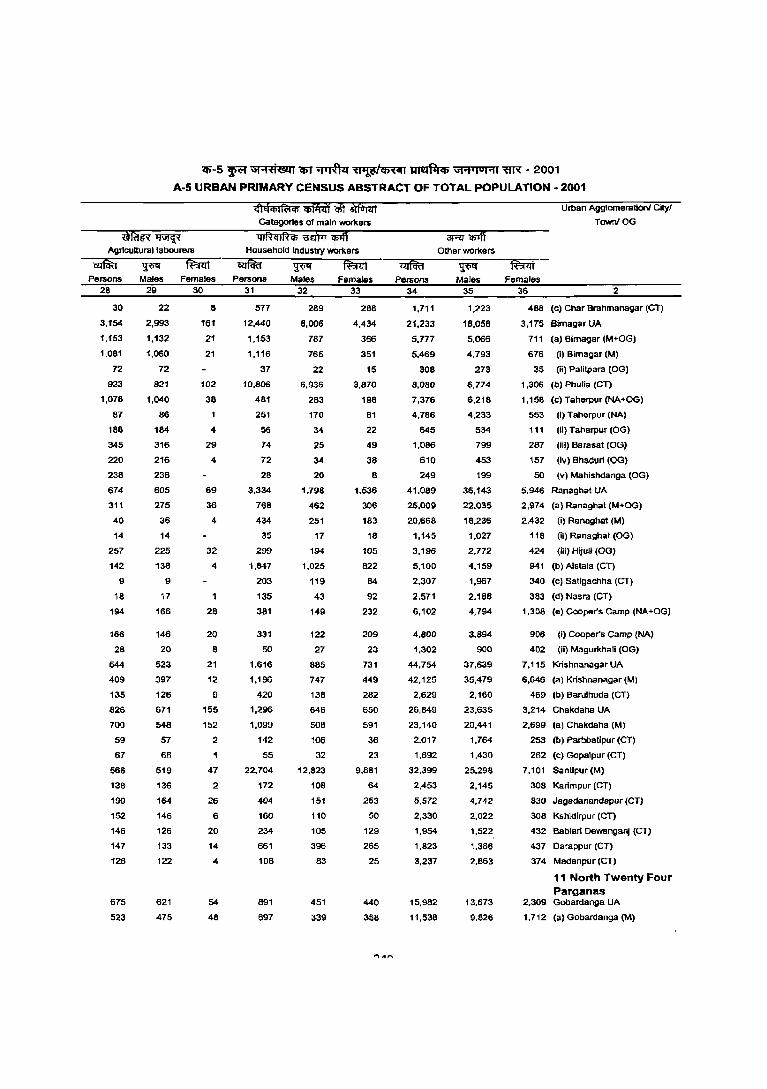
if;-5 ~ GtOitiG41 <liT ~ ~~ ~ \11"'1 0 1011 ~ - 2001
A-S URBAN PRIMARY CENSUS ABSTRACT OF TOTAL POPULATION - 2001
iifcIri~ Agrlculturallabourers
<l'Iif""~,,, iftriii <1ft ~ Categories of main wor1ters
QIR qlR '" iiI'iTT iiil Household Industry workers
Persons Males Females Persons Males Females 28 29 30 31 32 33
30
3,154
1,153
1,081
72
923
1,078
87
188
345
220
238
674
311
40
14
257
142
9
18
194
166
28
544
409
135
826
700
59
67
566
138
190
152
146
147
126
675
523
22
2,993
1,132
1,060
72
821
1,040
86
184
316
216
238
605
275
36
14
225
138
9
17
166
146
20
523
397
126
671
548
57
66
519
136
164
146
126
133
122
621
475
8
161
21
21
102
38
4
29
4
69
36
4
32
4
28
20
8
21
12
9
155
152
2
47
2
26
6
20
14
4
54
48
577
12,440
1,153
1,116
37
10,806
481
251
56
74
72
28
3,334
768
434
35
299
1,847
203
135
381
331
50
1,616
1,196
420
1,296
1,099
142
55
22,704
172
404
160
234
661
108
891
697
289
B,006
787
765
22
6,936
283
170
34
25
34
20
1,798
462
251
17
194
1,025
119
43
149
122
27
885
747
13B
646
508
106
32
12,823
108
151
110
105
396
83
451
339
288
4,434
366
351
15
3,870
198
81
22
49
38
8
1,536
306
183
18
105
822
84
92
232
209
23
731
449
282
650
591
36
23
9,881
64
253
50
129
265
25
440
358
Persons 34
1,711
21,233
5,777
5,469
308
8,080
7,376
4,786
645
1,086
610
249
41,089
25,009
20,668
1,145
3,196
5,100
2,307
2,571
6,102
4,800
1,302
44,754
42,125
2,629
26,849
23,140
2,017
1,692
32,399
2,453
5,572
2,330
1,954
1,823
3,237
15,982
11,538
3RT i1ff Other workers
Males 35
1,223
18.058
5,066
4,793
273
6,774
6,218
4,233
534
799
453
199
35,143
22,035
18,236
1,027
2,772
4,159
1,967
2.18e
4,794
3,894
900
37.639
35,479
2,160
23,635
20,441
1,764
1,430
25,298
2,145
4,742
2,022
1.522
1,386
2,863
13,673
9,826
Urtlan AgglomeraliOnl City!
TownIOG
Females 36 2
488 (e) Char Brahmanagar (CT)
3.175 Bimagar UA
711 (a) Birnagar (M+OG)
676 (i) Bimagar (M)
35 (ii) Palitpara COG)
1,306 (b) Phulia (Cn
1.158 (e) Taherpur (NA+OG)
553 (i) Taherpur (NA)
111 (iI) Taharpur (OG)
287 (iii) Barasat (OG)
157 (Iv) Bhadurl (OG)
50 (v) Mahishdanga (OG)
5,946 Ranaghat UA
2.974 (a) Rana9hat (M+OG)
2.432 (i) Ranaghat (M)
118 (ii) Ranaghat (OG)
424 (iii) HljUli (OG)
941 (b) Aistaia (CT)
340 (c) Satigaehha (eT)
383 (d) Nasra (eT)
1,308 (e) Cooper's Camp (NA+OG)
906 (I) Cooper's Camp (NA)
402 (ii) Magurkhali (OG)
7,115 Krishnanagar UA
6,646 (a) Krishnanagar (M)
469 (b) Barulhuda (CT)
3,214 Chakdaha UA
2,699 (a) Chakdaha (M)
253 (b) Parbbatipur leT)
262 (e) Gopalpur (eT)
7,101 Santlpur (M)
308 Karimpur (CT)
830 Jagadanandapur (eT)
308 Kshidirpur (Cn
432 Bablarl Dewanganj (CT)
437 Darappur (CT)
374 Madanpur (CT)
11 North Twenty Four Parganas
2,309 Gobardanga UA
1,712 (a) Gobardanga (M)
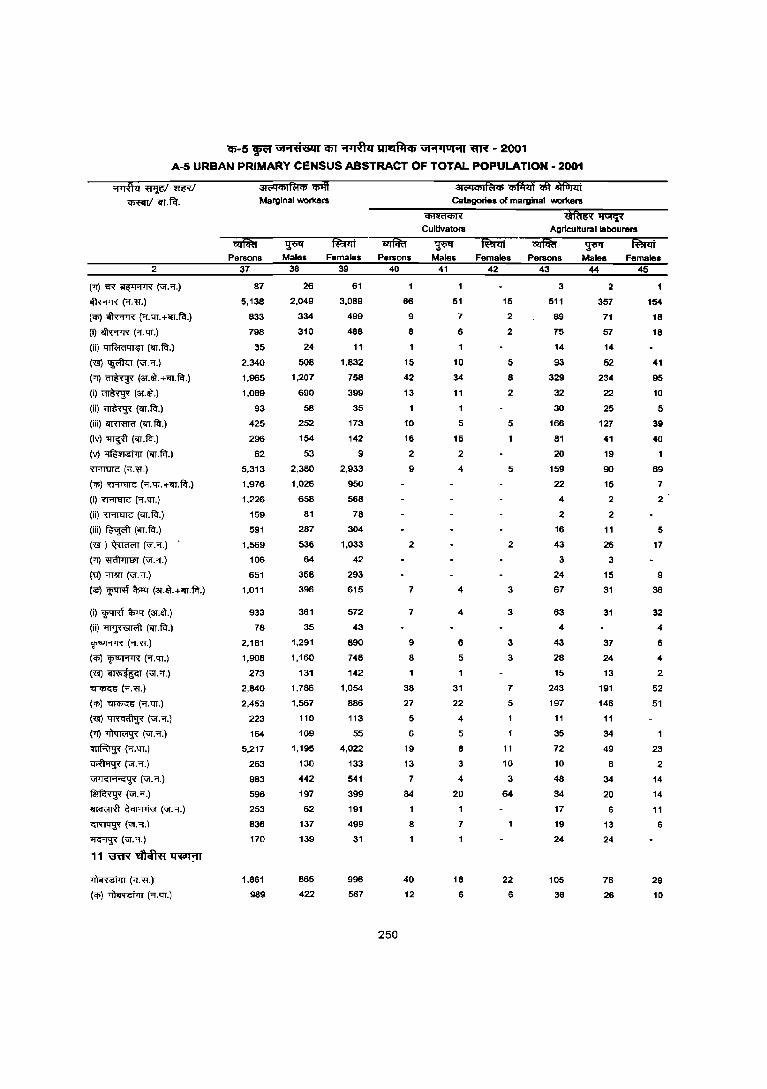
"iff-5 ~ \'JI'1;c1uZIi <ffT ~ ~ \'JI.,iIUI.,1 ~ - 2001
A-5 URBAN PRIMARY CENSUS ABSTRACT OF TOTAL POPULATION - 2001
2
('1) ~ ~ (VI . .".)
~('r.'Il.)
('Ii) ~ ("'l.tIT.+;n.~.)
(i)~(.".tIT.)
(ii) ~ (;n.~.)
«g) ~ (VI."!.)
('1) ~ (3l".af.+;n.~.)
(i)~(3l".af.)
(ii) ~ (iIT.~.)
(iii) <!Im!Rf (1U.~.)
(Iv) ~ (;n.~.)
(v) ~ (1U.~.)
~("!.<l".)
('Ii) "IT'!1<ITC (.".-qr.+1U.~.)
(i) ~ ("".tIT.)
(ii) "IT'!1<ITC (;n.~.)
(iii)~(;n.~.)
(<< ) ~ (VI."!.)
('1) ~ (VI."'l.)
[<l) '1PlIT (VI . .".)
(<:') ~ ~ (3l".af.+1U.~.)
(i) ~ ~ (3!.af.)
(ii) ~ (orr.~.)
~("!.'ff.)
(<I» ~ ("'.tIT.)
(<<) ~ (VI . .".)
~("'l.'Il.)
(<I» ~ ('I. tIT.)
(<<) ~ (VI."'l,)
('1) ~ (VI."'l.)
~("'l,"lfT,)
~(VI . .,.)
Vl'IGI+<::9;i< (VI.'1.)
~(VI."'l.)
~~(VI.'1.)
GRl'l"'J{ (VI."'I",)
~(VI,"'l.)
11 \3ffi"~~
~("'l.'ff.)
(<I» ~ ("!,GY,)
:o!('Qq;I~q; i1ff Marginal worKers
Persons 37
87
5,138
833
798
35
2,340
1,965
1,089
93
425
296
62
5,313
1,976
1,226
159
591
1,569
106
651
1 ,011
933
78
2,181
1,908
273
2,840
2,453
223
164
5,217
263
983
596
253
636
170
1,861
989
Males Females Persons 38 39 40
26 61
2,049 3,089 66
334 499 9
310 488 8
24 11
508 1,832 15
1,207 758 42
690 399 13
58 35
252 173 10
154 142 16
53 9 2
2,380 2,933 9
1,026 950
658 568
81 78
287 304
536 1,033 2
64 42
358 293
396 615 7
361 572 7
35 43
1,291 890 9
1,160 748 8
131 142
1,786 1,054 38
1,567 886 27
110 113 5
109 55 6
1,195 4,022 19
130 133 13
442 541 7
197 399 84
62 191
137
139
865
422
499
31
996
567
250
8
40
12
:o!<"Qq;I~q; ~ ~ ¥Tlit Categories of marginal worKers
~
Cultivators Agricultural labourers
Males Females Persons 41 42 43
3
51 15 511
7 2 89
6 2 75
14
10 5 93
34 8 329
11 2 32
30
5 5 166
15 81
2 20
4 5 159
22
4
2
16
2 43
3
24
4 3 67
4 3 63
4
6 3 43
5 3 28
15
31 7 243
22 5 197
4 11
5 35
6 11 72
3 10 10
4 3 48
20 64 34
7
18
6
22
6
17
19
24
105
36
Males Females 44 45
2
357 154
71 18
57 18
14
52 41
234 95
22 10
25 5
127 39
41 40
19
90 69
15 7
2 2
2
11 5
26 17
3
15 9
31 36
31 32
4
37 6
24 4
13 2
191 52
146 51
11
34
49 23
8 2
34 14
20 14
6 11
13
24
76
26
6
29
10
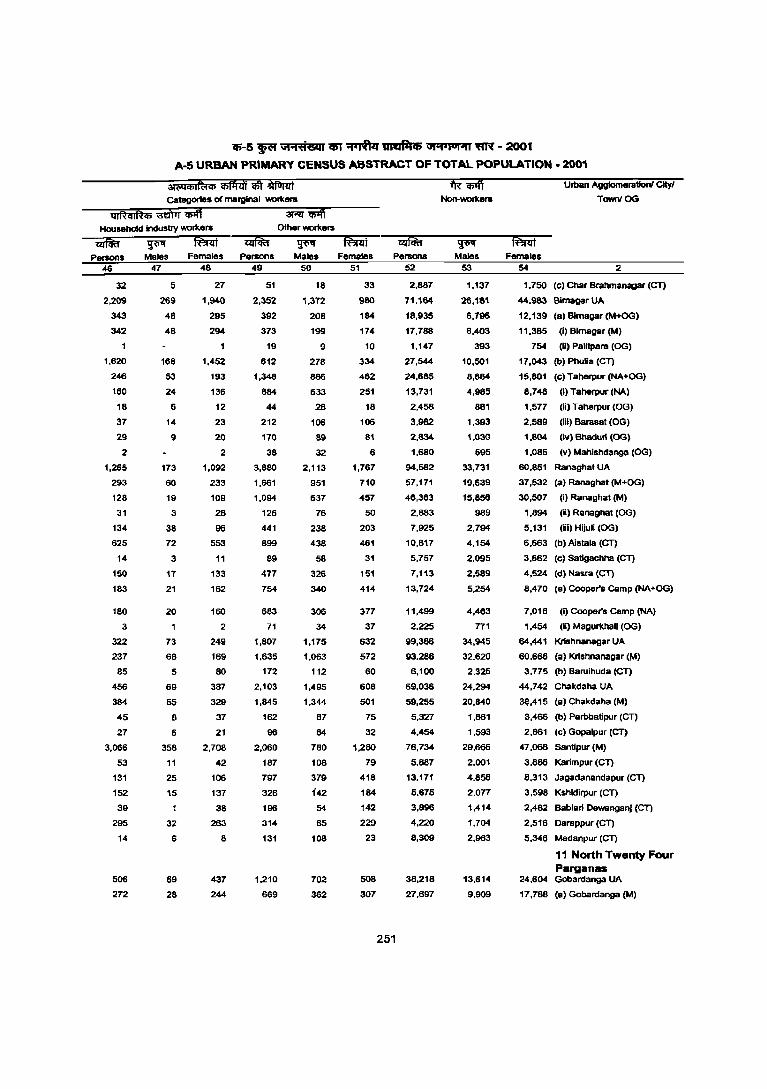
15-5 ~ ", .. 't'i6i1l 1fiT ~ 1I'IWIfipf; "' .. *1°1 .. 1 ~ - 2001
A-5 URBAN PRIMARY CENSUS ABSTRACT OF TOTAL POPULATION· 2001
Categories of marginal worIters Non-workers
Ulban AggIomllrationl Cltyl
TownfOG
Household Industry worlcers Other worIters
Persons
32
2.209
343
342
1.620
246
160
18
37
29
2
1,265
293
128
31
134
625
14
150
183
180
3
322
237
85
456
384
45
27
3,066
53
131
152
39
295
14
506
272
Males 47
5
269
48
48
168
53
24
6
14
9
173
60
19
3
38
72
3
17
21
20
73
68
5
69
55
8
6
358
11
25
15
32
6
69
28
Females Persons 48 49
27
1,940
295
294
1,452
193
136
12
23
20
2
1,092
233
109
28
96
553
11
133
162
160
2
249
169
80
387
329
37
21
2,708
42
106
137
38
263
8
437
244
51
2.352
392
373
19
612
1.348
884
44
212
170
38
3,880
1,661
1,094
126
441
899
89
477
754
683
71
1,807
1.635
172
2.103
1,845
162
96
2,060
187
797
326
196
314
131
1,210
669
Males 50
18
1.372
208
199
9
278
886
633
26
106
89
32
2,113
951
637
76
238
438
58
326
340
306
34
1,175
1.063
112
1,495
1,344
87
64
780
108
379
142
54
85
108
702
362
Females 51
33
980
184
174
10
334
462
251
18
106
81
6
1,767
710
457
50
203
461
31
151
414
377
37
632
572
60
608
501
75
32
1,280
79
418
184
142
229
23
508
307
Parsons
251
52
2,887
71.164
18,935
17,788
1,147
27,544
24,685
13,731
2.458
3.982
2,834
1,680
94,582
57,171
46,363
2.883
7.925
10.817
5.757
7,113
13,724
11,499
2,225
99,386
93,286
6,100
69,036
59,255
5,327
4,454
76,734
5,887
13,171
5.675
3,896
4,220
8,309
38,218
27,697
~ Males
53
1,137
26,181
6,796
6,403
393
10,501
8,884
4,985
881
1.393
1,030
595
33,731
19,639
15,856
989
2.794
4,154
2.095
2,589
5,254
4,483
771
34,945
32,620
2,325
24,294
20,840
1,861
1,593
29,666
2,001
4,856
2.077
1,414
1,704
2,963
13,614
9,909
~ Females
54 2
1,750 Cc) Char Brahmanagar (CT)
44,983 Blmagar UA
12,139 (a) Blmagar (M+OG)
11,385 (i) Bimagar (M)
754 (il) Palitpara (OG)
17,043 (b) Phulia (eT)
15,801 (c) Taherpur (NA+OG)
8,746 (I) Taherpur (NA)
1,577 (II) Taherpur (OG)
2.589 (Iii) Barasat (OG)
1,804 (Iv) Bhadurl (OG)
1,085 (v) Mahishdanga (OG)
60,851 Ranaghat UA
37,532 (a) Ranaghat (M+OG)
30,507 (i) Ranaghat (M)
1,894
5,131
6,663
3,662
(ii) Ranaghat (OG)
(iii) Hijuli (OG)
(b) Aistala (CT)
(c) Satigachha (eT)
4,524 (d) Nasra (CT)
8,470 (e) Cooper's Camp (NA+OG)
7,016 (i) Cooper's Camp (NA)
1,454 (II) Magurlchall (OG)
64,441 Krlshnanagar UA
60.666 (a) Krlshnanagar (M)
3.775 (b) Baruihuda (CT)
44,742 Chakdaha UA
38,415 (a) Chakdaha (M)
3,466 (b) Parbbatipur (eT)
2,861 (c) Gopalpur (CT)
47,068 Santlpur (M)
3,886 Karimpur (CT)
8,313 Jagadanandapur (CT)
3,598 Kshldlrpur (CT)
2,482 Bablari DewanganJ (CT)
2,516 Darappur (eT)
5,346 Madanpur (CT)
11 North Twenty Four Parganas
24,604 Gcbardanga UA
17,788 (e) Gobardanga (M)
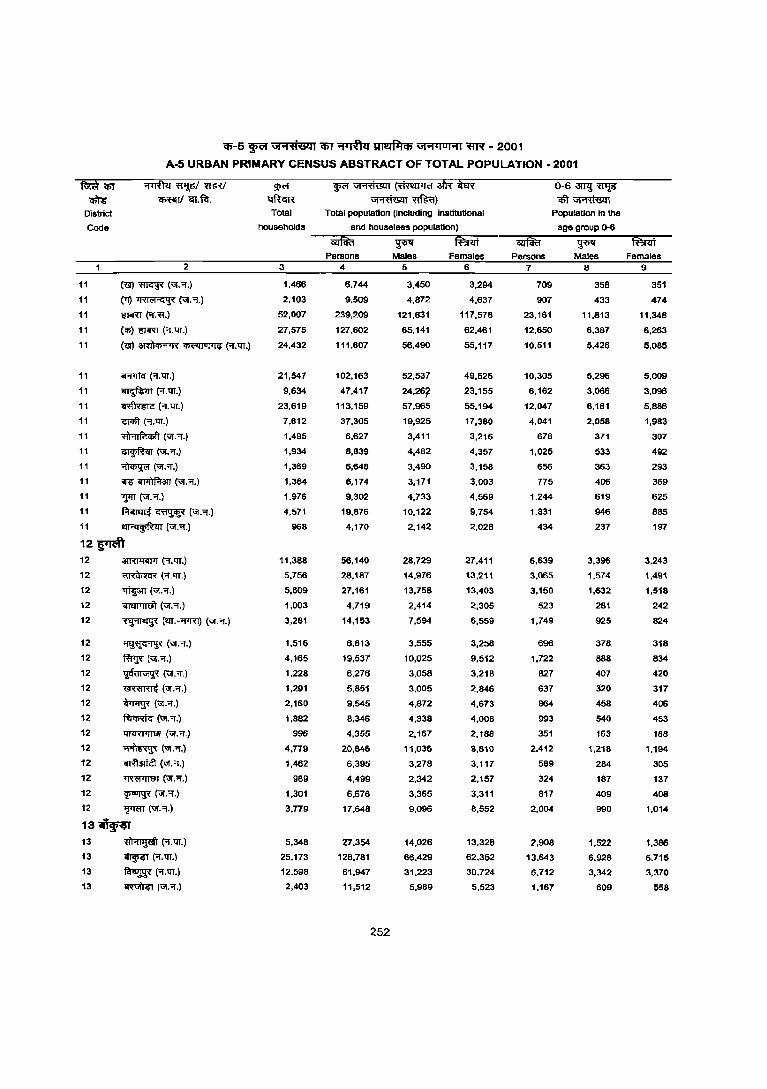
'$-5 ~ Gi'1'!1'6t11 q;r ~ ~ Gi'1 i IOI'1I "flR - 2001
A-5 URBAN PRIMARY CENSUS ABSTRACT OF TOTAL POPULATION· 2001
f&'i&q;y ~
District
Code
11
11
11
11
11
11
11
11
11
11
11
11
11
11
11
2
(~~(ur."'!.)
('1) ~ Cur."'!.)
~ ("r:R)
(<Ii)~('.QT.)
~ ~ ~ ("r.QT.)
~(,,!.'QT.)
~("'!.t(T.)
~("I.QT.)
Gl<!lt (" QT.)
~Cur·"·) ~(ur:'f.)
~(ur.'l.)
~~Cur."'!.}
".PIT (ur."!.)
~~(ur.,.)
11 Ejl .... !!'~lli (ur."'!.)
12 rroft 12
12
12
12
12
12
12
12
12
12
12
aTRJlro1T ("'!. 'QT.)
~("o{.QT.)
~(<;f.",!.)
"iII'<WlTEfr (ur. '1. )
~ (OQT.-'PRT) (ur."f.)
~(ur."f.)
~(vr.",!,)
~(\;f.'1.)
~(<;f."o{.)
~(vr."O{.)
~(ur.'1.)
12 tmRJ7ll"I}T (<;fa.)
12 ~ (ur.'!.)
12 ~(\;f.'1.)
12 TR<'r'lT9T Cur. 'Of.)
12 ~(ur.'Of.)
12 'rffiT (ur:"!.)
13~ 13
13
13
13
~('.QT.)
~('Of.t(T.)
~("'I.QT.)
~(vr.Of.)
WC'f "tIfuffi Total
househOlds
3
1,466
2,103
52,007
27,575
24,432
21,547
9,634
23,619
7,612
1,495
1,934
1,369
1,364
1,976
4,571
966
11,388
5,756
5,609
1,003
3,281
1,516
4,165
1,228
1,291
2,160
1,882
996
4,779
1,462
989
1,301
3,779
5,348
25.173
12.598
2,403
WC'f ~ (~ 3fi'i ffii ~~
Total population (InCluding institutional
and houseless population)
Persons 4
6,744
9,509
239,209
127,602
111,607
102,163
47,417
113,159
37,305
6,627
8,839
6,648
6,174
9,302
19,876
4,170
56,140
28,187
27,161
4,719
14,153
6,813
19,537
6,276
5,851
9,545
8,346
4,355
20,846
6,395
4,499
6,676
17,648
27,354
128,781
61,947
11,512
252
~ Males
5
3,450
4,872
121,631
65,141
56,490
52,537
24,26~
57,965
19,925
3,411
4,482
3,490
3,171
4,733
10,122
2,142
28,729
14,976
13,758
2,414
7,594
3,555
10,025
3,058
3,005
4,872
4,338
2,167
11,036
3,278
2,342
3,365
9,096
14,026
66,429
31.223
5,989
fFiiif Females
6
3,294
4,637
117,578
62,461
55,117
49,626
23,155
55,194
17,380
3,216
4,357
3,158
3,003
4.569
9,754
2,028
27,411
13,211
13,403
2,305
6,559
3,258
9,512
3,21B
2,846
4,673
4,008
2,188
9,810
3,117
2,157
3,311
8,552
13,328
62,352
30,724
5,523
0-6~~
~~ Population in the
age group ()-6
Persons 7
709
907
23,161
12,650
10,511
10,305
6,162
12,047
4,041
678
1,025
656
775
1,244
1,831
434
6,639
3,065
3,150
523
1,749
696
1,722
827
637
864
993
351
2,412
589
324
817
2,004
2,908
13,643
6,712
1,167
~ Males
6
358
433
11,813
6,381
5,426
5,296
3,066
6,161
2,058
371
533
363
406
619
946
237
3,396
1,574
1,632
281
925
378
888
407
320
458
540
163
1,218
284
187
409
990
1,522
6,928
3,342
609
~ Females
9
351
474
11,348
6,263
5,085
5,009
3,096
5,886
1,983
307
492
293
369
625
885
197
3,243
1,491
1,518
242
824
318
834
420
317
406
453
18a
1,194
305
137
408
1,014
1,388
6,715
3,370
558
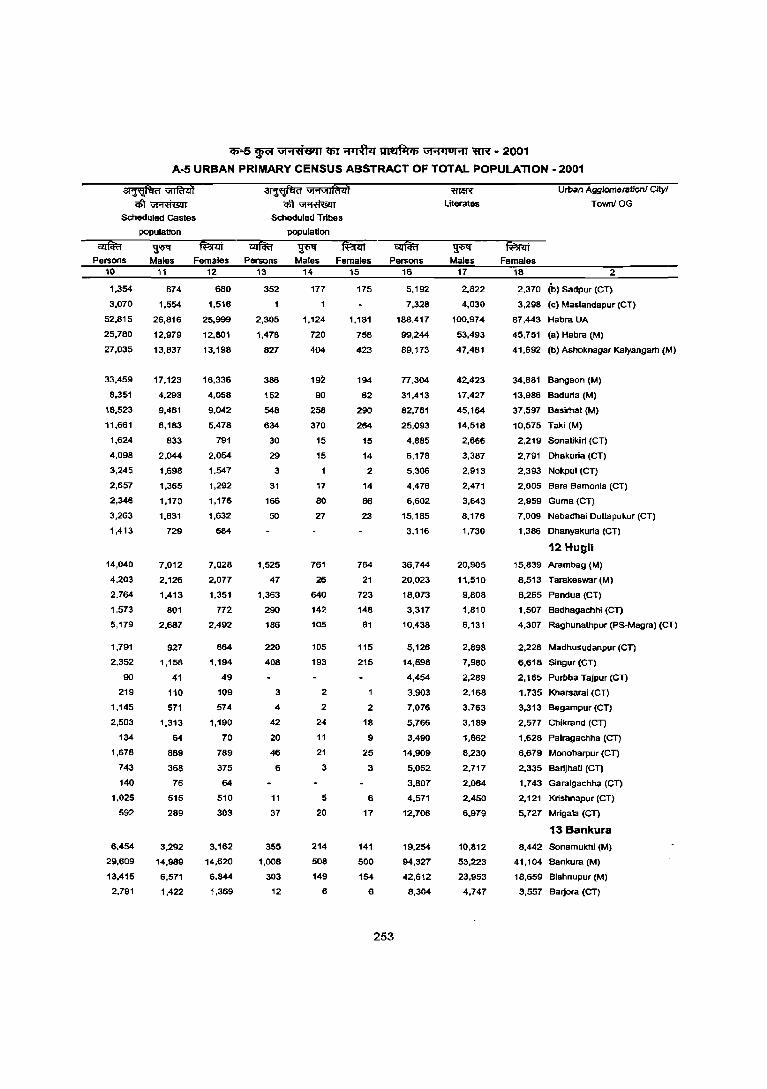
Cfi-5 ~ U1"1i1'i6ll1 'CPT ~ ~ U1"1'IUI"1I ltR - 2001
A-5 URBAN PRIMARY CENSUS ABSTRACT OF TOTAL POPULATION - 2001
~ "Gi1fffiii ~~
Sched~led castes
population
~ fF.iirt Persons Males Females
10
1,354
3,070
52,815
25,780
27,035
33,459
8,351
18,523
11,661
1,624
4,098
3,245
2,657
2,346
3,263
1,413
14,040
4,203
2.764
1,573
5,179
1,791
2,352
90
219
1,145
2,503
134
1,678
743
140
1,025
592
6.454
29,609
13,415
2,791
11
674
1,554
26,816
12,979
13,837
17,123
4,293
9,481
6,183
833
2,044
1,698
1,365
1,170
1,631
729
7,012
2,126
1,413
801
2,687
927
1,158
41
110
571
1,313
64
889
368
76
515
289
3,292
14,989
6.571
1.422
12
680
1.516
25.999
12.801
13.198
16,336
4.058
9,042
5,478
791
2,054
1,547
1,292
1,176
1,632
684
7,028
2,077
1,351
772
2,492
864
1,194
49
109
574
1,190
70
789
375
64
510
303
3,162
14,620
6,844
1,369
~ vt.,vtlf?t41 "ijfi~
Scheduled Tribes
population
~ Persons
13
352
2,305
1,478
827
386
152
548
634
30
29
3
31
166
50
1,525
47
1,363
290
186
220
408
3
4
42
20
46
6
11
37
355
1,008
303
12
~ Males
14
177
1,124
720
404
192
90
258
370
15
15
17
80
27
761
26
640
142
105
105
193
2
2
24
11
21
3
5
20
214
508
149
6
fF.iirt Females
15
175
1,181
758
423
194
62
290
264
15
14
2
14
86
23
764
21
723
148
81
115
215
2
18
9
25
3
6
17
141
500
154
6
Persons
253
16
5,192
7,328
188.417
99,244
89,173
77,304
31,413
82,761
25,093
4,8B5
6.17B
5,306
4,476
6,602
15,185
3.116
36,744
20,023
18,073
3,317
10,438
5,126
14,598
4,454
3.903
7,076
5,766
3,490
14,909
5,052
3,807
4,571
12,706
19,254
94,327
42,612
8,304
wra:R
Literates
~ Males
17
2,822
4,030
100,974
53,493
47,4Bl
42,423
17,427
45,164
14,518
2,666
3,387
2,913
2,471
3,643
8,176
1,730
20,905
11,510
9,80B
l,Bl0
6,131
2,89B
7,980
2,289
2,168
3,763
3,189
1,862
8,230
2,717
2,064
2,450
6,979
10,812
53,223
23,953
4,747
Urban Agglomeration! Cityl
TownlOG
~ Females
18 2
2.370 (b) Sadpur (eT)
3,298 (c) Maslandapur (CT)
87,443 Habra UA
45,751 (a) Habra (M)
41,692 (b) Ashoknagar Kalyangarh (M)
34,8Bl Bangaon (M)
13,986 Badurla (M)
37,597 Baslmat (M)
10,575 Taki (M)
2,219 Sonatikiri (eT)
2.791 Dhakurla (CT)
2.393 Nokpul (eT)
2,005 Bara Bamonia (CT)
2,959 Guma (CT)
7,009 Nebadhai Duttapukur (CT)
l,3B6 Dhanyakurla (CT)
12 Hugli
15,839 Arambag (M)
8,513 Tarakeswar (M)
8,265 Pandua (eT)
1,507 Badhagachhl (CT)
4,307 Raghunathpur (PS-Magra) (CT)
2,228 Madhusudanpur (Cn
6,618 Singur (CT)
2,165 Purbba Tajpur (CT)
1,735 Kharsarai (CT)
3,313 Begampur (Cn
2,577 Chikrand (CT)
1,628 Pairagachha (CT)
6,679 Monoharpur (Cn
2,335 BariJllati (CT)
1,743 Garalgachha (CT)
2,121 Krishnapur (CT)
5,727 Mrlgala (Cn
13 Bankura
8,442 Sonamukhi (M)
41,104 8ankura (M)
18,659 Bishnupur (M)
3,557 8arjora (CT)
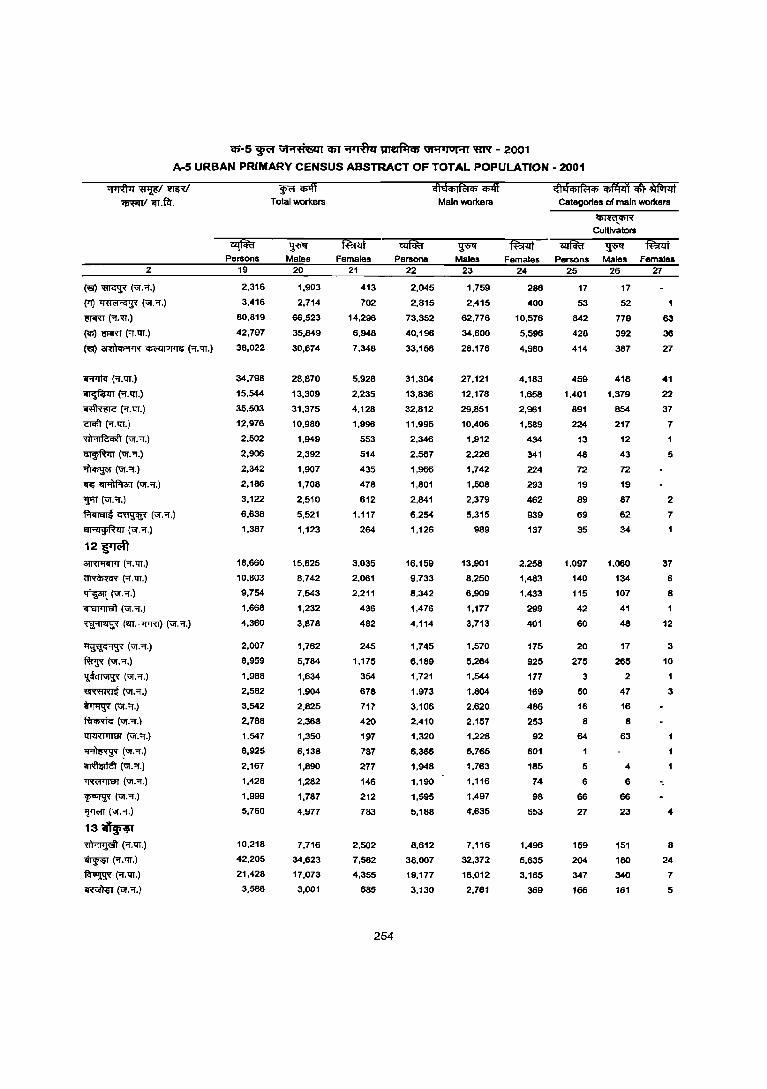
$-5 ~ v:..,.ti'6!ll CPf ~ ~ \iI'14101'illrN - 2001
A-5 URBAN PRIMARY CENSUS ABSTRACT OF TOTAL POPULATION - 2001
2
«iI)~(ur:'1.)
('7J)~(ur.'1.)
~(1.'!l'.)
«P) ~ A·IlI.)
«lI) ~ ~ ('1.IlI.)
~(1.1lI.)
~ A.ttI.)
~A·IlI.)
~ ('1.IlI.)
~(ur."'I.)
~(ur."'I.)
~(ur.'1.)
~ iIT"'!)f.m (ur.1.)
WIT (ur.1.)
~~(ur.'1.)
""'i!!,~lll (ur:'f.)
12~ ~('1.IlI.)
~('f.IlI.)
~(ur.'1.)
~(ur.'1.)
~ (orr.·lfTRl) (ur."'I.)
~(ur."'I.)
~ ("I.Of.)
~(ur.Of.)
~(ur.'1.)
~(ur.'1.)
~(ur.'1.)
lIflR'T1mJT ('iI. '1.)
~!ur.'1.) ~(ur.1.)
'ffi¥ii'iJT (ur.'f.)
"f""¥ (ur. 'f.)
'!'Tffi (ur. 'I .)
13~ ~('f:qT.)
~ ('f.'lT.)
~('f.tU,)
~("I.'f.)
i2f.ki Persons
19
2,316
3,416
80,819
42,797
38,022
34,798
15,544
35,503
12,976
2,502
2,906
2,342
2,186
3,122
6,638
1,387
18,660
10,803
9,754
1,668
4,360
2,007
6,959
1,988
2,582
3,542
2,788
1,547
6,925
2,167
1,428
1,999
5,760
10,218
42,205
21,428
3,586
Wt'filff Total workers
~ Males
20
1,903
2,714
66,523
35,849
30,674
28,870
13,309
31,375
10,980
1,949
2,392
1,907
1,708
2,510
5,521
1,123
15,625
8,742
7,543
1,232
3,878
1,762
5,784
1,634
1,904
2,825
2,368
1,350
6,138
1,890
1,282
1,787
4,977
7,716
34,623
17,073
3,001
Females 21
413
702
14,296
6,948
7,348
5,928
2,235
4.128
1,996
553
514
435
478
612
1.117
264
3,035
2,061
2,211
436
482
245
1,175
354
678
717
420
'll7 787
277
146
212
783
2,502
7,582
4,355
585
254
Persons 22
2,045
2,815
73,352
40,196
33,156
31,304
13,836
32,812
11,995
2,346
2,567
1,966
1,801
2,841
6.254
1,126
16,159
9,733
8,342
1,476
4,114
1,745
6,189
1,721
1,973
3,106
2,410
1,320
6,366
1,948
1,190
1,595
5,188
8,612
38,007
19,177
3,130
Main workers
~ Males
23
1,759
2,415
62,776
34,600
28,176
27,121
12,178
29,851
10,406
1,912
2,226
1,742
1,508
2,379
5,315
989
13,901
8,250
6,909
1,177
3,713
1,570
5,264
1,544
1,804
2,620
2,157
1,228
5,765
1,763
1,116
1,497
4,635
7,116
32,372
16,012
2,761
4'\aq;I~q; iItIiIT ~ ~ Categories of main workers
Females Persons 24 25
286 17
400 53
10,576 842
5,596 428
4,980 414
4,183 459
1,658 1,401
2,961 891
1,589 224
434 13
341 48
224 72
293 19
462 89
939 69
137 35
2,258 1,097
1,483 140
1,433 115
299 42
401 60
175 20
925 275
177 3
169 50
486 16
253 8
92 64
601
185 5
74 6
98 66
553 27
1,496 159
5,635 204
3,165 347
369 166
~ Cultivators
Males Females 26 27
17
52
779 63
392 36
387 27
418 41
1,379 22
854 37
217 7
12
43 5
72
19
87 2
62 7
34
1,060 37
134 6
107 8
41
48 12
17 3
265 10
2
47 3
16
8
63
4
6 -,
66
23 4
151 8
180 24
340 7
161 5
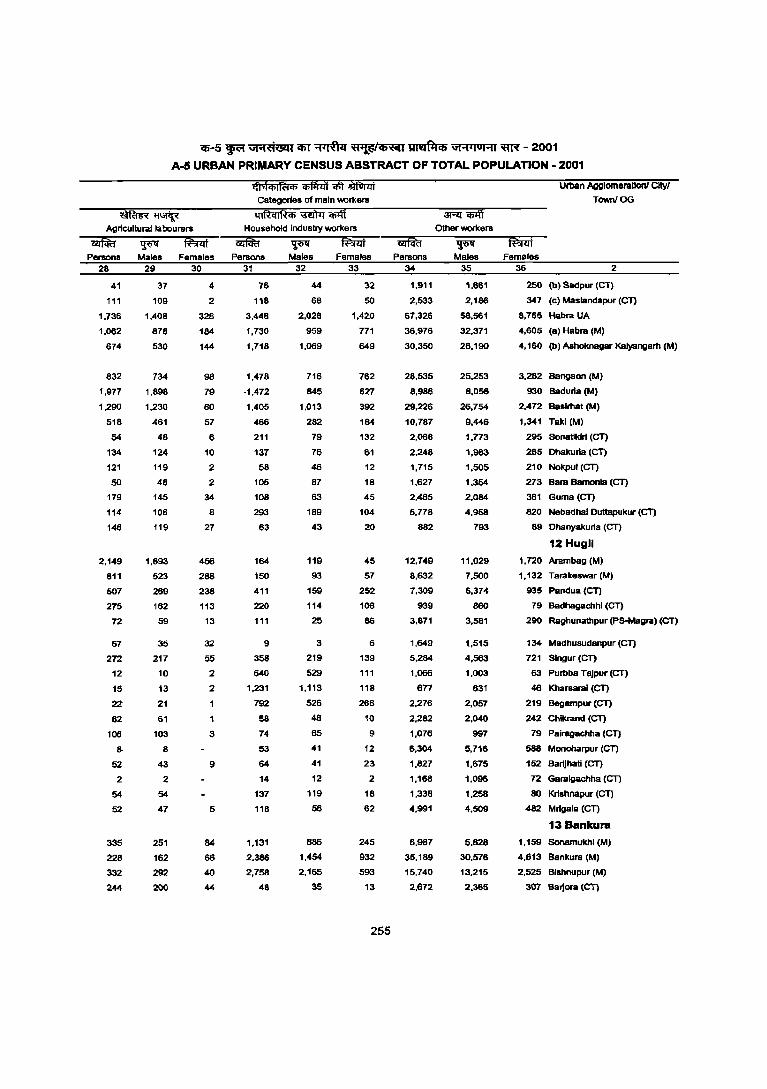
ifi-5 ~ ..... ;d6Q1 CIif ~ ~~ ~ ",,,lluHt m:f - 2001
A-5 URBAN PRIMARY CENSUS ABSTRACT OF TOTAL POPULATION - 2001
iiffuR~ Agricultural labourers
categories of main worl(ers
q I~ q I~q) "iiiIfIl i1ff Household industry workers
Persons Males Females Persons Males Females 28 29 30 31
41
111
1,736
1,062
674
832
1,977
1,290
518
54
134
121
50
179
114
148
2,149
811
507
275
72
67
272
12
15
22
62
106
8-
52
2
54
52
335
228
332
244
37
109
1,.408
87B
530
734
1,898
1,230
461
4B
124
119
4B
145
106
119
1,693
523
269
162
59
35
217
10
13
21
61
103
8
43
2
54
47
251
162
292
200
4
2
328
184
144
98
79
60
57
6
10
2
2
34
8
27
456
288
238
113
13
32
55
2
2
1
1
3
9
5
84
66
40
44
76
118
3,448
1,730
1,718
1,478
-1,472
1,405
466
211
131
58
105
108
293
63
164
150
411
220
111
9
358
640
1,231
792
58
74
53
64
14
137
118
1,131
2,386
2,758
48
32
44
68
2,028
959
1,069
716
845
1,013
282
79
76
46
87
63
189
43
119
93
159
114
25
3
219
529
1,113
526
48
65
41
41
12
119
56
886
1,454
2,165
35
33
32
50
1,420
771
649
762
627
392
184
132
61
12
18
45
104
20
45
57
252
106
86
6
139
111
118
266
10
9
12
23
2
18
62
245
932
593
13
255
Persons 34
1,911
2,533
61,326
36,976
30,350
28,535
8,986
29,226
10,787
2,068
2,248
1,715
1,627
2,485
5,778
882
12,749
8,632
1,309
939
3,871
1,649
5,284
1,066
677
2,276
2,282
1,076
6,304
1,827
1,168
1,338
4,991
6,987
35,189
15,740
2,672
Other workers
Males 35
1,661
2,186
58,561
32,371
26,190
25,253
8,056
26,754
9,446
1,773
1,983
1,505
t.354
2.084
4,958
793
11.029
7.500
6,374
860
3,581
1,515
4,563
1,003
631
2,057
2,040
997
5,716
1,675
1,096
t.258
4.509
5.828
30,576
13,215
2,365
Urtlan Agglomerallonl Cltyl
TownJOG
Females 36 2
250 (b) Sadpur (CT)
34 7 (c) Maslandapur (eT)
8,765 Habra UA
4.605 (a) Habra (M)
4.160 (b) Ashoknagar Kalyangat1l (M)
3.282 Bangaon (M)
930 Baduria (M)
2.472 -Baslt1lat (M)
1,341 Taki (M)
295 Sonatlkiri (eT)
265 Ohakurla (eT)
210 Nokpul (eT)
273 Bara Bamonla (CT)
381 Guma (eT)
820 Nebadhai Duttapukur (eT)
89 Dhanyakuria (CT)
12 Hugll
1,720 Arambag (M)
1,132 Tarakeswar (M)
935 Pandua (eT)
79 Badhagachhl (eT)
290 Raghunathpur (pS-Magra) (eT)
134 Madhusudanpur (CT)
721 Slngur (eT)
63 Purtlba Tajpur (eT)
46 Kharsarai (eT)
219 Begampur (eT)
242 Chlkrand (CT)
79 Pairagachha (CT)
588 Monoharpur (CT)
152 Barijhatl (CT)
72 Garalgachha (eT)
80 Krishnapur (eT)
482 Mrlgala (CT)
13 Bankura
1,159 Sonamukhl (M)
4,613 Bankura (M)
2,525 Bishnupur (M)
307 Batjora (CT)
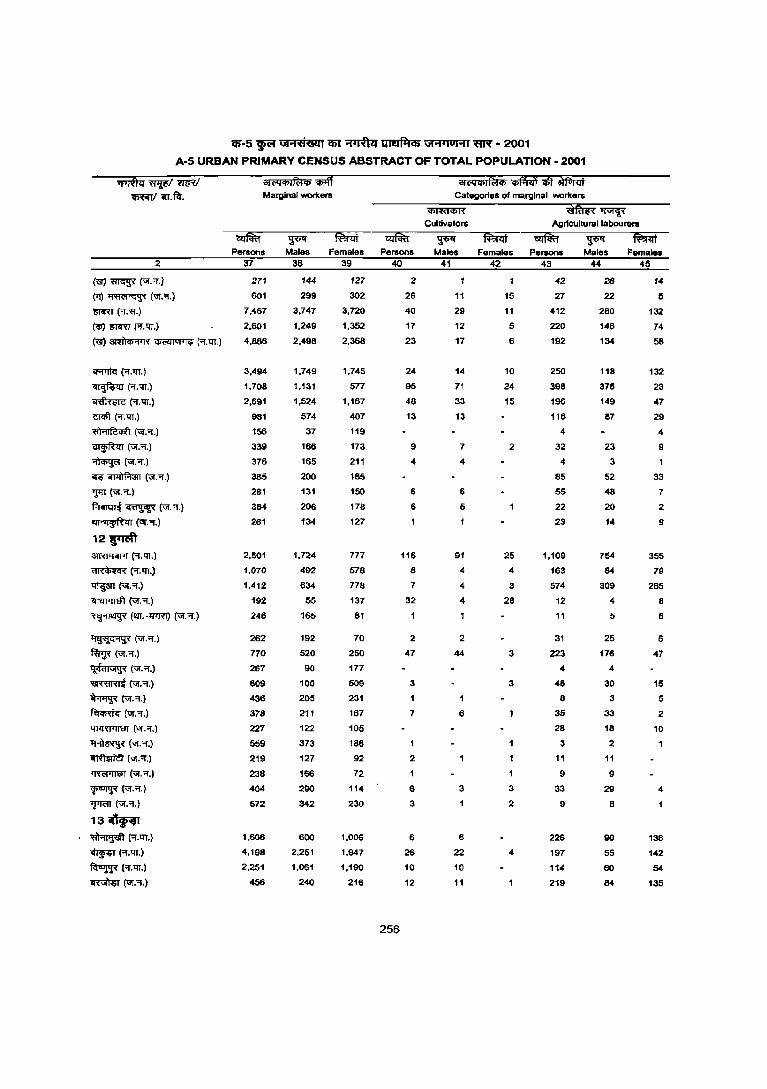
lP-5)ffi' \iI"tfiwli em '"11'1'& ~ \iI"t1jOj"t1 ~ - 2001
A-S URBAN PRIMARY CENSUS ABSTRACT OF TOTAL POPULATION - 2001
2
(&J ~ (Uf.'T.)
(Tf)~C\;f.'1.)
~("'1."fl.)
(q;) ~ C"'f."QT.)
~~~(,,!.QT.)
<r-flTIit ("'I. QT.)
~("'1.QT.)
~R·QT.l
<!!<Ill R. 'IT .)
~(Uf.'1.)
~(Uf."!.)
~(Uf."'f.)
«~(Uf."'l".)
"'J'!T (Uf."!.)
~ crew (-;;£."'1.)
~(Gr."I.)
12~ aJRJll<IJTl (or. qy.)
~('T."IJT.)
~(Uf."I.)
~(vJ.'1.)
~ (~.-lfIR1) (Uf."'f.)
~(ur.'1.)
~ (ur:Of.)
~(ur."'I.)
~(vJ:,.)
~(vJ.""I.)
~(Uf."f.)
~(ur."!.)
~("I"."!.)
~(Uf."!.)
1ffCITJJtJT ("1". 'T.)
'f"'I'l'l (ur. 'I. )
'rJ<'lT (ur.""I.)
13~ ~R.QT.)
~(""'t.'IT.)
~('1."IJT.)
~("ur."'t.)
~
31 ('Qq;j ~ q; i1ff Marginal WOf1(ers
Persons Females 37
271
601
7,467
2.601
4,866
3,494
1,708
2,691
981
156
339
376
385
281
384
261
2,501
1.070
1,412
192
246
262
no 267
609
436
378
227
559
219
238
404
572
1.606
4,198
2,251
456
38
144
299
3,747
1.249
2,498
1.749
1,131
1,524
574
37
166
165
200
131
206
134
1,724
492
634
55
165
192
520
90
100
205
211
122
373
127
166
290
342
600
2.251
1,061
240
39
127
302
3,720
1,352
2.368
1,745
577
1,167
407
119
173
211
185
150
178
127
777
576
778
137
81
70
250
177
509
231
167
105
186
92
72
114
230
1,006
1,947
1,190
216
Persons 40
256
2
26
40
17
23
24
95
46
13
9
4
6
6
116
8
7
32
2
47
3
7
1
2
6
3
6
26
10
12
31('QiI>li%lq; ~ '$'t ~ Categories of margInal workers
~ 1l'\iI"<f{ ~
Cultivators Agricultural labourers
Males 41
11
29
12
17
14
71
33
13
7
4
6
6
91
4
4
4
2
44
1
6
3
6
22
10
11
Females 42
15
11
5
6
10
24
15
2
25
4
3
28
3
3
3
2
4
Persons 43
42
27
412
220
192
250
398
196
116
4
32
4
85
55
22
23
1,109
163
574
12
11
31
223
4
45
6
35
26
3
11
9
33
9
226
197
114
219
Males 44
28
22
260
146
134
118
375
149
67
23
3
52
48
20
14
754
54
309
4
5
25
176
4
30
3
33
18
2
11
9
29
8
90
55
60
54
Females 45
14
!5
132
74
56
132
23
47
29
4
9
1
33
7
2
9
355
79
265
8
6
6
47
15
5
2
10
4
136
142
54
135
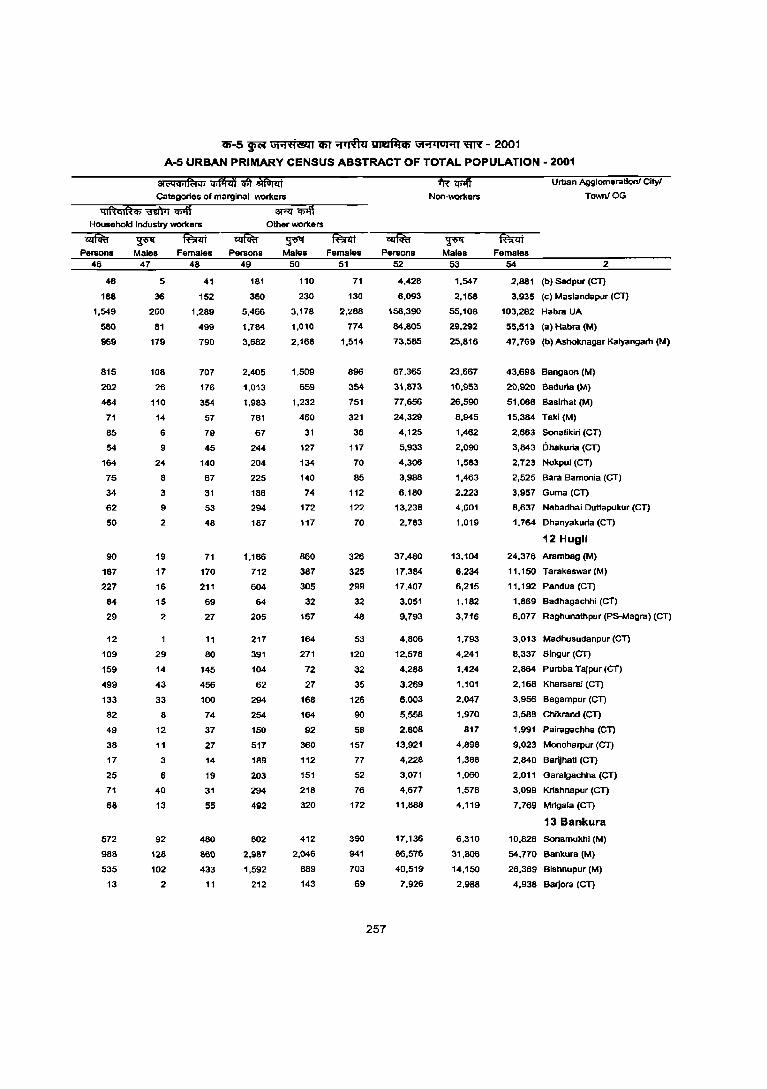
CIi-5 ~ GiOI't{&l1 iIiT ~ ~ "'"1<101'11 ~ - 2001
A-5 URBAN PRIMARY CENSUS ABSTRACT OF TOTAL POPULATION - 2001
31<"Q<t>lfiii<t> if4'lH '*I ~ Categories ot marginal wor1<ers
+tii"Jff Non-wor1<ars
Urban Agglomeration! City/
TCMTlIOG
Household Industry wor1<ers Other wor1<ers
Persons 46
46
188
1,549
580
969
815
202
464
71
86
54
164
75
34
62
50
90
187
227
84
29
12
109
159
499
133
82
49
38
17
25
71
68
572
988
535
13
~ Males
47
5
36
260
81
179
108
26
110
14
6
9
24
8
3
9
2
19
17
16
15
2
29
14
43
33
8
12
11
3
6
40
13
92
128
102
2
Females Persons 48 49
41
152
1,289
499
790
707
176
354
57
79
45
140
67
31
53
48
71
170
211
69
27
11
80
145
456
100
74
37
27
14
19
31
55
480
860
433
11
181
360
5,466
1,784
3,682
2,405
1.013
1,983
781
67
244
204
225
186
294
187
1.186
712
604
64
205
217
391
104
62
294
254
150
517
189
203
294
492
802
2,987
1.592
212
~ Males
50
110
230
3,178
1,010
2,168
1,509
659
1,232
460
31
127
134
140
74
172
117
860
387
305
32
157
164
271
72
27
168
164
92
360
112
151
218
320
412
2,046
889
143
Females 51
71
130
2,~88
774
1,514
896
354
751
321
36
117
70
85
112
122
70
326
325
299
32
48
53
120
32
35
126
90
58
157
77
52
76
172
390
941
703
69
Persons
257
52
4,428
6,093
158,390
84,805
73,585
67.365
31.873
77,656
24,329
4,125
5,933
4,306
3,988
6.1BO
13.238
2,783
37.4BO
17.384
17,407
3,051
9,793
4,806
12,578
4,288
3.269
6.003
5,558
2,808
13,921
4,228
3,071
4,677
11,888
17,136
86,576
40,519
7,926
~ Males
53
1.547
2,158
55,108
29.292
25,816
23.667
10.953
26.590
8.945
1,462
2,090
1,583
1.463
2.223
4.601
1.019
13,104
6,234
6.215
1,182
3,716
1,793
4,241
1,424
1,101
2,047
1.970
817
4,898
1,388
1,060
1,578
4,119
6,310
31,806
14,150
2,988
Females 54 2
2,881 (b) Sadpur (eT)
3,935 (c) Maslandapur (CT)
103,262 Habra UA
55,513 (a) Habra (M)
47.769 (b) Ashoknagar Kalyangarh (M)
43.698 Bangaon 1M)
20,920 Baduna (11.1)
51,066 Baslrhat (M)
15,384 Taki (M)
2,663 Sonatikiri (eT)
3,843 Dhakuria (eT)
2,723 Nokpul (eT)
2,525 Bara Bamonia IGT)
3.957 Guma (eT)
8,637 Nebadhai DuHapukur (eT)
1,764 Dhanyakuria (eT)
12 Hugll
24.376 Alambag (M)
11.150 Tarakeswar(M)
11.192 Pandua (eT)
1,869 Badhagaehhi (CT)
6.077 Raghunathpur (PS-Magra) (eT)
3,013 Madhusudanpur (eT)
8.337 Singur (CT)
2,864 Purbba Tajpur (eT)
2,168 Kharsarai (CT)
3,956 Begampur (eT)
3.588 Chikrand (CT)
1,991 Pairagachha (eT)
9.023 Monoharpur (CT)
2,840 Barijhati (CT)
2,011 Garalgachha (eT)
3,099 KriShnapur (CT)
7,769 Mrlgala (eT)
13 Bankura
10,826 Sonamukhi (M)
54,770 8ankura (M)
26,369 Bisnnupur (M)
4,938 Barjora (CT)
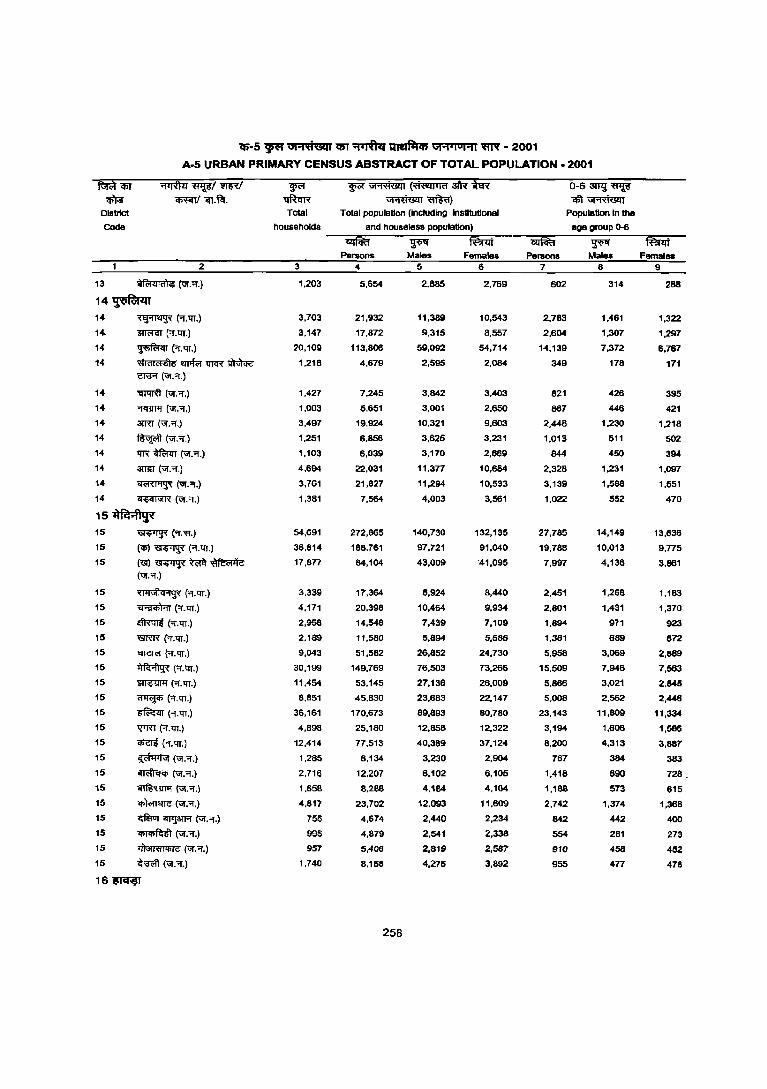
lIS-5 ~ Wi"ti&lIl5T ~ ~ ""9111°1.,1 ~ - 2001
A-5 URBAN PRIMARY CENSUS ABSTRACT OF TOTAL POPULATION. 2001
2
13 ~{i:i!."'I.)
14~ 14
1'"
14
14
14
14
14
14
14
14
14
~("'I.'ll.)
~("'I.'ll.)
~("'I.'ll.)
~ ewm 'I!T<R ~ ~(VI:"f.)
~ (Uf:'f.)
"f?rnllf (VI. "'I.)
3TRT (VI. "'I.)
~(Uf."'I.)
tIR~{i:i!."'I.)
ansa (VI. "'I.)
~("I."'I.)
14 ~ (Uf:'f.)
15 ilR;fl~ 15
15
15
15
15
15
~("'I.~.)
«I»~("'I.'tIT.)
«lI)~~~ {i:i!.""!.)
~I>tuflq .. !!~ ("'I.'ll.)
~("'f.'ll.)
~("'f.'ll.)
15 <rnR ('T.'ll.)
15 ~("'f.QT.)
15 ~ ('l.'tIT.)
15 ~("f.'ll.)
15 CIl!¥ ("'I.'ll.) 15 ~ ("f.'ll.)
15 ~ (-r.'ll.)
15 ~ (Of.'ll.)
15 ~(UJ."'f.)
15 ~(UJ.-r.)
15 ~(Uf."'f.)
15 ~ (Uf.-r.)
15 ~ ~ (Uf.-r.)
15 ~(Uf.""!.)
15 ~ (UI'.'T.)
15 ~ (UJ.-r.)
16~
F' ~ Total
nousenalds
3
1.203
3,703
3,147
20,109
1,218
1,427
1,003
3A97
1.251
1.103
4,694
3,761
1,381
54,691
36,814
17,8n
3.339
4,171
2,958
2.189
9,043
30,199
11,454
8.851
36,161
4,898
12,414
1,285
2,716
1.658
4.817
755
995
957
1,740
~ ~ (~3tii itR ~m=to)
Total population (inclUding Institutional
and hooseless population)
Parsons Males Females Persons
0-6 3ITg WlW ~~
Poputatlon In the
age group 0-6
Males Femalea 4 567 8 9
5.654
21,932
17.872
113,806
4,679
7,245
5,651
19,924
6,856
6,039
22,031
21,827
7,564
272,865
188,761
84,104
17,364
20,398
14,548
11,580
51,582
149,769
53,145
45.830
170,673
25,180
77,513
6,134
12,207
6,266
23,702
4,674
4,879
5,408
B,168
258
2,885 2,769 602
11,389
9.315
59,092
2,595
3,842
3,001
10,321
3.625
3,170
11,3n
11,294
4,003
140,730
97,721
43,009
8,924
10,464
7,439
5,894
26,852
76,503
27,136
23.683
89,893
12,858
40,369
3,230
6,102
4,184
12,093
2,440
2,541
2,819
4,276
10,543
8,557
54,714
2,084
3,403
2,650
9,603
3,231
2,869
10,654
10,533
3,561
132,135
91,040
'41,095
8,440
9,934
7,109
5,686
24,730
73,266
26,009
22,147
80,780
12,322
37,124
2,904
6,105
4,104
11,609
2,234
2,338
2,587
3,892
2,783
2,604
14,139
349
821
867
2,448
1.013
844
2,328
3,139
1,022
27,785
19,788
7,997
2,451
2,801
1,894
1,361
5,958
15,509
5,866
5,008
23,143
3,194
8,200
767
1,418
1,188
2,742
842
554
910
955
314 288
1,461
1,307
7,372
178
426
446
1,230
511
450
1,231
1,588
552
14,149
10,013
4,136
1,268
1,431
971
689
3,069
7,946
3,021
2.562
11,809
1,608
4,313
384
690
573
1,374
442
281
458
477
1,322
1,297
6,767
171
395
421
1,218
502
394 1,097
1,551
470
13,636
9,n5
3,861
1,183
1,370
923
672
2,889
7,563
2.845
2,446
11,334
1,586
3,887
383
728.
615
1,368
400
273
452
478
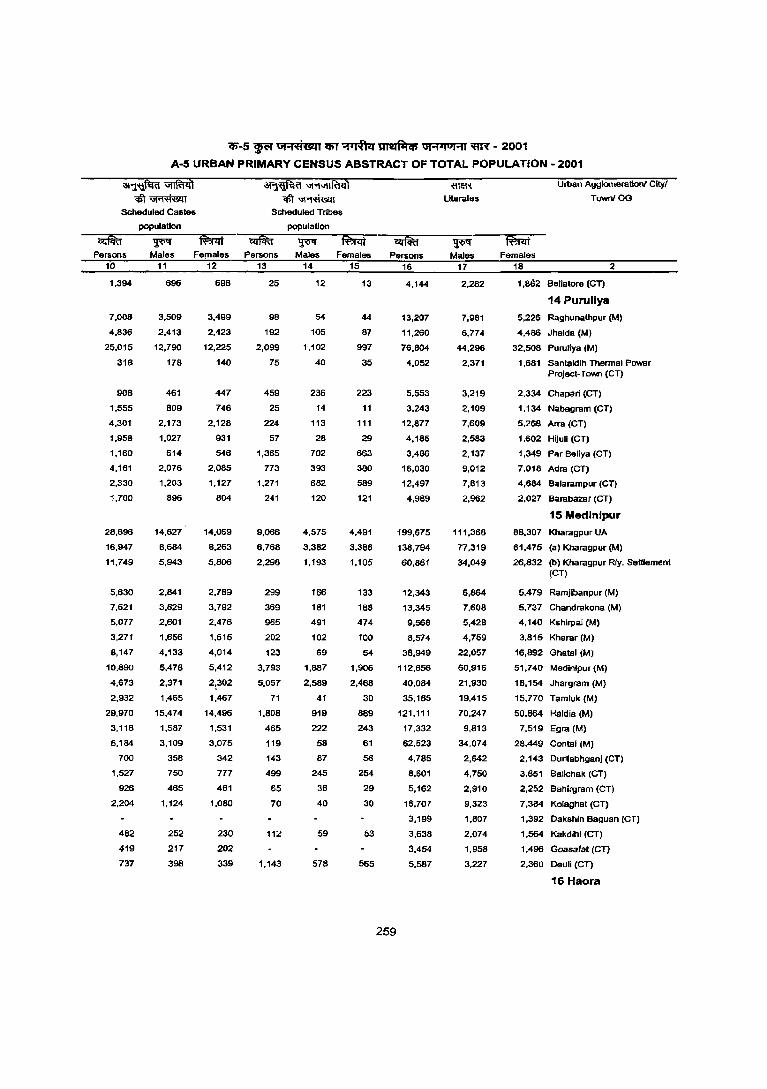
<J;-5 ~ GiOf'tiC41 Cf;T ~ ~ GiOf'loHI ~ - 2001
A-5 URBAN PRIMARY CENSUS ABSTRACT OF TOTAL POPULATION - 2001
~~ ~~
Scheduled CaslH
population
~
~ WI\JIIR!<il qfi~
Scheduled Tnbea
population
Persons Males Females Persons Males Females 10
1,394
7,008
4,836
25,015
318
908
1,555
4,301
1,958
1,160
4,161
2,330
1,700
28,696
16,947
11,749
5,630
7,621
5,077
3,271
8,147
10,890
4,673
2,932
29,970
3,118
6,184
700
1,527
926
2,204
482
419
737
11
696
3,509
2,413
12,790
178
461
809
2,173
1,027
614
2,076
1,203
896
14,627
8,684
5,943
2,841
3,829
2,601
1,656
4,133
5,478
2,371
1,465
15,474
1,587
3,109
358
750
465
1,124
252
217
398
12 13 14 15
698
3,499
2,423
12,225
140
447
746
2,128
931
546
2,085
1,127
804
14,069
8,263
5,806
2,789
3,792
2,476
1,615
4,014
5,412
2~302
1,467
14,496
1,531
3,075
342
777
461
1,080
230
202
339
25
98
192
2,099
75
459
25
224
57
1,365
173
1,271
241
9,066
6,768
2,296
299
369
965
202
123
3,793
5,057
71
1,808
465
119
143
499
65
70
112
1,143
12
54
105
1,102
40
236
14
113
28
702
393
662
120
4,575
3,382
1,193
166
181
491
102
69
1,887
2,589
41
919
222
58
87
245
36
40
59
578
13
44
87
997
35
223
11
111
29
663
380
589
121
4,491
3,386
1,105
133
188
474
100
54
1,906
2,468
30
889
243
61
56
254
29
30
53
565
Persons
259
16
4,144
13,207
11,260
76,804
4,052
5,553
3,243
12,877
4,185
3,486
16,030
12,497
4,989
199,675
138,794
60,881
12,343
13,345
9,568
8,574
38,949
112,656
40,084
35,185
121,111
17,332
62,523
4,785
8,601
5,162
16,707
3,199
3,638
3,454
5,587
'ffi~
LIterates
~ Males
17
2,282
7,981
6,774
44,296
2,371
3,219
2,109
7,609
2,583
2,137
9,012
7,813
2,962
111,366
77,319
34,049
6,864
7,608
5,428
4,759
22,057
60,916
21,930
19,415
70,247
9,813
34,074
2,642
4,750
2,910
9,323
1,807
2,074
1,958
3,227
Urban Agglomeration! City/
TawniOG
Females 18 2
1,862 Beliatore (CT)
14 Purullya
5,226 Raghunathpur (M)
4,486 Jhalda (M)
32,506 Puruliya (M)
1,681 Sentaldih Thermal Power Project-Town (CT)
2,334 Chapen (CT)
1,134 Nabagram (CT)
5,266 Arra (CT)
1,602 Hijuli (CT)
1,349 Par Beliya (CT)
7,016 Adra (CT)
4,684 Balarampur (eT)
2,027 Barabazar (CT)
15 Medlnipur
88,307 Kharagpur UA
61,475 (a) Kharagpur (M)
26,832 (b) Kharagpur Rty. Settlement leT)
5,479 Ramjibanpur (M)
5,737 Chandrakona (M)
4,140 Kshirpai (M)
3,815 Kharar (M)
16,892 Ghatal (M)
51,740 Medinipur (M)
18,154 Jhargram (M)
15,770 Tamluk (M)
50,864 Haldie (M)
7,519 Egra (M)
28,449 Contai (M)
2,143 Durllabhganj (CT)
3,651 Balichak (CT)
2,252 Bahirgram (CT)
7,384 Kolaghat (CT)
1,392 Dakshin Baguan (eT)
1,564 Kakdihi (CT)
1,496 Goasafat (CT)
2,360 Deuli (CT)
16 Haora
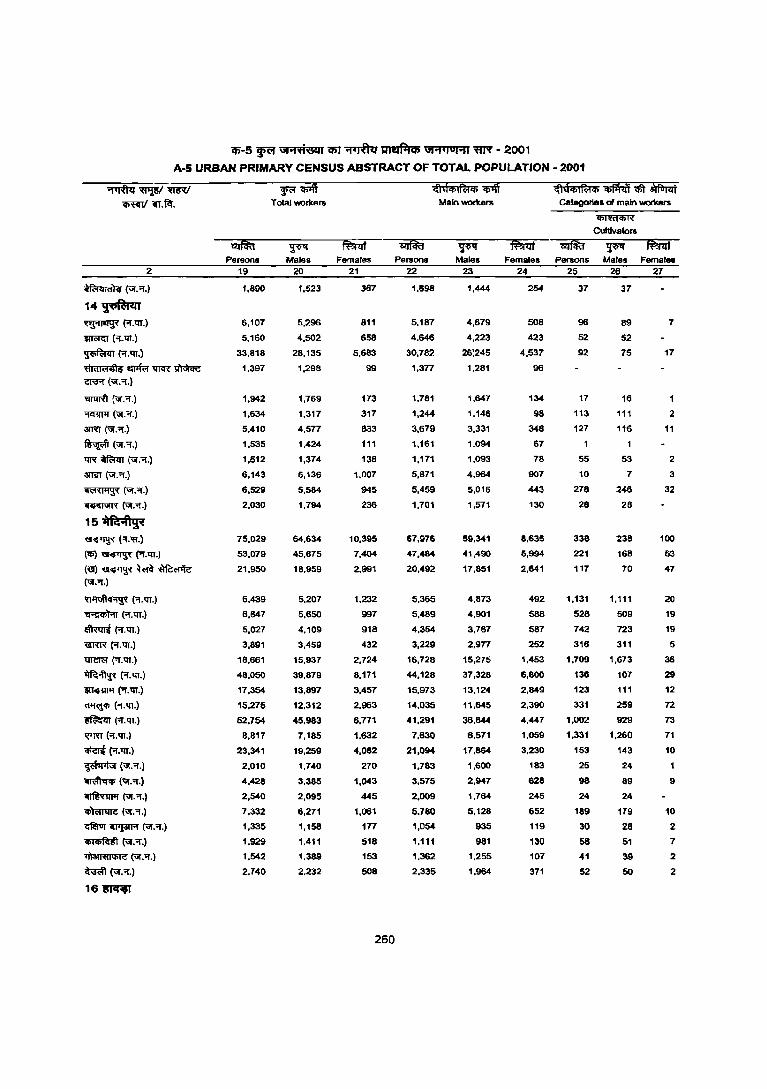
(1;-5 ~ \JI'iifi&l1 CIiT -;:prfuJ ~ \JI'i.)oi"llllT'l - 2001
A-5 URBAN PRIMARY CENSUS ABSTRACT OF TOTAL POPULATION - 2001
2
~(vr.'1.)
14~ ~('r.qJ.)
1I1"OI<:T ("I. qJ. )
~('r.qJ.)
~~"II"1"'R~ ?J\R (';t."'I".)
~(ur."'I".)
"'IlrnTIf (ur ..... )
31RT (ur."'\".)
~(-;;r ..... )
"qR ~ (ur: .... )
amn (-;;r:'l.)
~('if ..... )
~('if ..... )
15 it~;ft!l\(
~("'I".~.)
(<J;) ~ ('r.qJ.)
(~ ~ ~"flf<:<'P'ic (';1 ..... )
tlij~q'1!l~ (Of.qJ.)
~("'.qJ.)
~('r.qJ.)
"«Rf'{ ('r. tfI.)
tI1CT<'f ('r. qJ.)
~(Of.qJ.)
~('r.qJ.)
<I"I¥ ('1. tfI.)
~('r.qJ.)
~ ("I.tfI.)
~ (Of.qJ.)
~(ur ..... )
~(ur ..... )
~(U1.'l.)
~(\l[."f.)
~~. (-;;r.'1.)
~(';1."'f.)
~('Gr ...... )
~ <ur:'I".)
16~
Persons 19
1,890
6.107
5,160
33,818
1,397
1,942
1,634
5,410
1.535
1,512
6,143
6,529
2,030
75.029
53,079
21,950
6.439
6,647
5,027
3,891
18,661
48,050
11,354
15,275
52,754
8,817
23,341
2,010
4,428
2,540
7,332
1,335
1.929
1,542
2,140
~"iiiilf Total workers
~ Males
20
1,523
5,296
4,502
28,135
1,298
1,769
1,317
4.577
1.424
1,374
5,136
5,584
1,794
64,634
45,675
18,959
5.207
5.650
4.109
3.459
15,937
39,879
13.897
12,312
45,983
7.185
19,259
1,740
3,385
2,095
6,271
1.158
1.411
1.389
2,232
Females 21
387
811
658
5,683
99
173
317
833
111
138
1,007
945
236
10,395
7,404
2,991
1,232
997
918
432
2,724
8,171
3,457
2,963
6,771
1.632
4,082
270
1,043
445
1,061
177
518
153
508
260
i!lil<t>t~Cji 'iifi
Persons 22
1,698
5.187
4,646
30,782
1,377
1,781
1,244
3,679
1,161
1,171
5.871
5,459
1,701
67,976
47,484
20,492
5.365
5.489
4,354
3,229
16,728
44,128
15,973
14,035
41,291
7,630
21,094
1,783
3,575
2,009
5,780
1,054
1,111
1,362
2,335
Main workers
~ Males
23
1,444
4.679
4.223
26:245
1,281
1,647
1,146
3.331
1.094
1,093
4,964
5,016
1,571
59,341
41.490
17,851
4.873
4.901
3,767
2,977
15,275
37,328
13,124
11,645
36,844
6.571
17,864
1,800
2,947
1,764
5,128
935
981
1.255
1,964
~d<t>t~'" ifMt <tt ~ Categories d main woncers ~
Cultivators
Females Persons Males Females 24 25 26 27
254
508
423
4,537
96
134
98
348
67
78
907
443
130
8,635
5,994
2,641
492
588
587
252
1,453
6,800
2,849
2,390
4,447
1.059
3,230
183
628
245
652
119
130
107
371
37
96
52
92
17
113
127
55
10
278
28
338
221
117
1,131
528
742
316
1,709
136
123
331
1,002
1,331
153
25
98
24
189
30
58
41
52
31
89
52
75
16
111
116
53
1
246
28
238
168
70
1,111
509
723
311
1,673
107
111
259
929
1,260
143
24
89
24
119
28
51
39
50
7
17
1
2
11
2
3
32
100
53
47
20
19
19
5
36
29
12
72
73
71
10
9
10
2
7
2
2
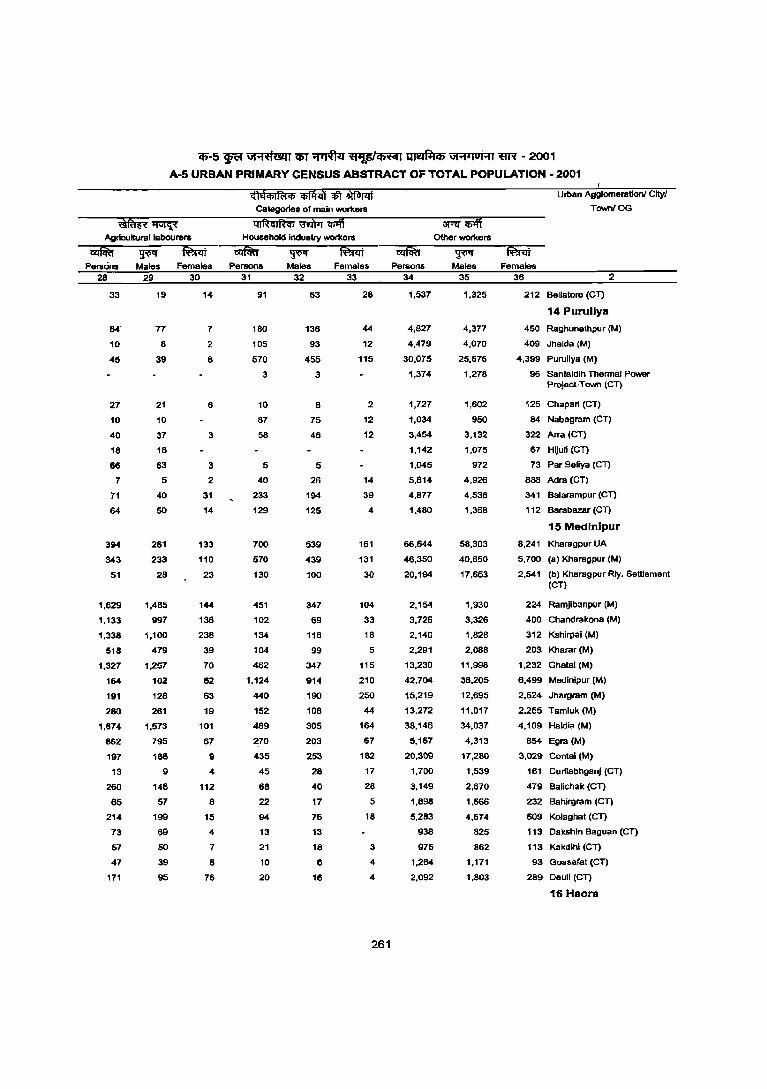
11)-5 wcr UI'1flUtlI 'lIiT...-.rful ~ ~ UI'1'lui'1l ~ - 2001
A-S URBAN PRIMARY CENSUS ABSTRACT OF TOTAL POPULATION - 2001
~~ Agriculturallabourens
<fId"'Ift;t", i1'iIiI) ~ ~ Categories of main workars
ql~ql~'" ~ ;iff Household industry wol1lers
PensOns Males Females Persons Males Famales 28 29 30 31 32 33
33
84'
10
45
27
10
40
18
66
7
71
64
394
343
51
1,629
1,133
1,338
518
1,327
164
191
280
1,674
862
197
13
260
65
214
73
51
47
171
19
77
8
39
21
10
37
18
63
5
40
50
261
233
28
1,485
997
1,100
479
1;2.57
102
128
261
1,573
795
188
9
148
57
199
69
50
39
95
14
7
2
6
6
3
3
2
31
14
133
110
23
144
136
238
39
70
62
63
19
101
67
9
4
112
8
15
4
7
8
76
91
180
105
570
3
10
87
58
5
40
233
129
700
570
130
451
102
134
104
462
1,124
440
152
469
210
435
45
68
22
94
13
21
10
20
63
136
93
455
3
8
75
46
5
26
194
125
539
439
100
347
69
116
99
347
914
190
108
305
203
253
28
40
17
76
13
18
6
16
28
44
12
115
2
12
12
14
39
4
161
131
30
104
33
18
5
115
210
250
44
164
67
182
17
28
5
18
3
4
4
261
Persons 34
1,537
4,827
4,479
30,075
1,374
1,727
1,034
3,454
1,142
1,045
5.814
4.877
1,480
66,544
46,350
20,194
2,154
3,726
2.140
2,291
13,230
42.704
15.219
13.272
38.146
5,167
20,309
1,700
3,149
1.898
5.283
938
975
1,264
2.092
Males 35
1,325
4,377
4,070
25.676
1,278
1.602
950
3.132
1.075
972
4.926
4.536
1,368
58,303
40,650
17.653
1,930
3,326
1,828
2,088
11,998
36,205
12,695
11.017
34.037
4,313
17,280
1,539
2,670
1.666
4,674
825
862
1,171
1,803
Urban Agglomeration! Cityl
Town/OG
Females 36 2
212 Beliatore (CT)
14 Purullya
450 Raghunalhpur (M)
409 Jhalda (M)
4,399 Puruliya (M)
96 Santsldih Thermal Power Project-Town (CT)
125 Chapari (CT)
84 Nabagram (CT)
322 Arra (CT)
67 HIJuil (CT)
73 Par 8eliya (CT)
888 Adra (CT)
341 Balarampur (en
112 Barabazar (CT)
15 Medlnipur
8,241 Kharagpur UA
5,700 (a) Kharagpur (M)
2,541 (b) Kharagpur RIy, Settlement (Cn
224 Ramjibanpur (M)
400 Chandrakona (M)
312 Kshirpai (M)
203 Kharar (M)
1,232 Ghatsl (M)
6,499 Madinipur (M)
2,524 Jhargram (M)
2,255 Tamluk (M)
4,109 Haldia (M)
854 Egra (M)
3,029 Conte; (M)
161 Durllabhganj (CT)
479 Balichak (Cn
232 Bahirgram (CT)
609 Kolaghal (Cn
113 Dakshin Baguen (CT)
113 Kakdihi (CT)
93 Ge>asafal (CT)
289 Deuli (en
16 Haora
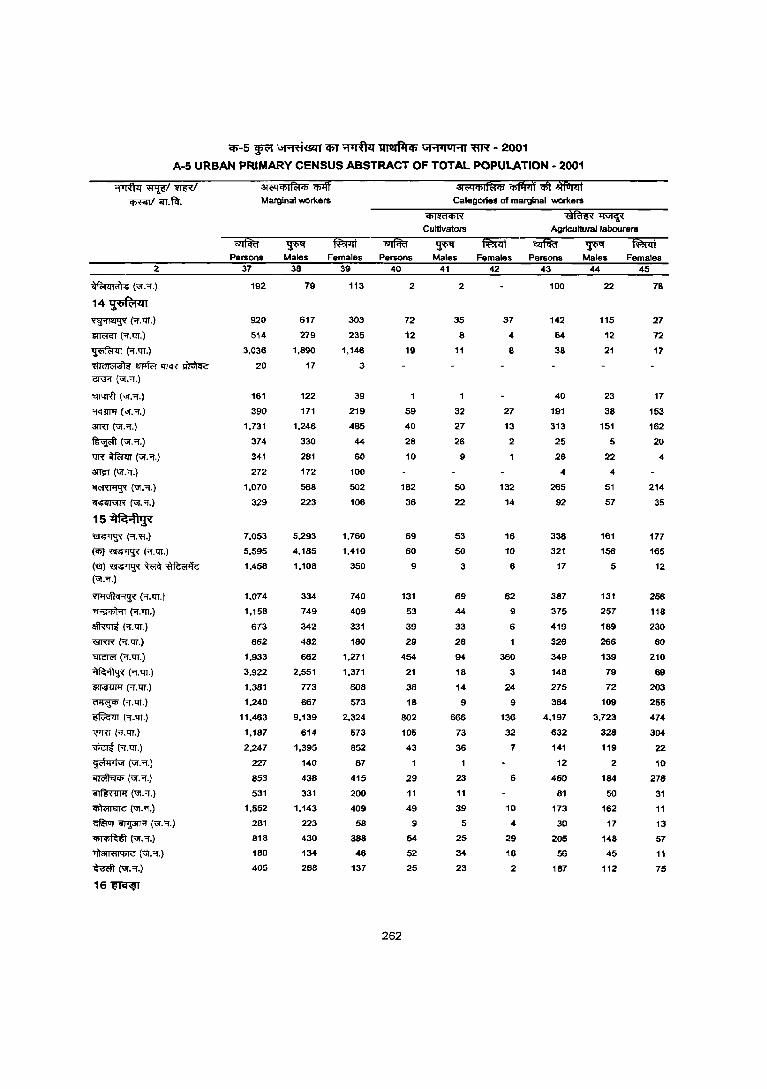
ip-5 ~ ",,"'1'<1&11 (I;J ~ ~ "'1"1010 1'11 ~ - 2001
A-5 URBAN PRIMARY CENSUS ABSTRACT OF TOTAL POPULATION· 2001
2
~(Uf.""I.)
14~ ~\-f.TJr.)
$Il<'!Gl (""I. Ql.)
~A.Ql.)
~ ewfur -qTQ< ~ ~(Uf.""I.)
~(Uf.Of.)
"I'f!111l" (Uf.""I.)
3Tffi (Uf. Of.)
~(Uf.""I.)
"Il'R ~ (Uf.Of.)
3TTSll (Uf.'"I.)
~(Uf.Of.)
~("I.0f.)
15 iI~41~i(
~ (Of:'H.)
(<j;) ~ (Of.GT.)
(~~~~ (Uf."!.)
~r"'\ll'Iq'i~ ('1.GT.)
~\-f.Ql.)
~(Of.GT.)
wm- ('"I.Ql.)
~('"I.GT.)
~(Of.Ql.)
~(""I.llT.)
~ (Of."Ql.)
~("'l"_"Ql.)
~ (Of,"Ql,)
<i!crf ('"I.1I1.)
~(Uf:"!.)
~(ur.Of,)
~(Uf."'l".)
~(vr-"'l".)
~ iIT'J3lR (Uf.""I.)
~('iI."'l",)
~(Uf.Of.)
~(Uf."!.)
16~
3l('4<t>1~ij) ilff Marginal worKers
~ Persons Males Females Persons
37
192
920
514
3,036
20
161
390
1.731
374
341
272
1,070
329
7,053
5,595
1,458
1.074
1.158
673
662
1.933
3,922
1,381
1.240
11,463
1.187
2,247
227
853
531
1.552
281
818
180
405
38
79
617
219
1,890
17
122
171
1.246
330
281
172
568
223
5.293
4.165
1.108
334
749
342
462
662
2.551
773
667
9.139
614
1.395
140
438
331
1.143
223
430
134
268
39 40
113
303
235
1,146
3
39
219
485
44
60
100
502
106
1,760
1,410
350
740
409
331
180
1.271
1.371
608
573
2.324
573
852
87
415
200
409
58
388
46
137
2
72
12
19
59
40
28
10
182
36
69
60
9
131
53
39
29
454
21
38
18
802
105
43
29
11
49
9
54
52
25
262
031 <"l<t> I~ij) iffl'lil <1ft ¥lTlit Categories of marginal workers
~
Cultivators Agricullurallabourers
~ Males
41
2
35
8
11
1
32
27
26
9
50
22
53
50
3
69
44
33
28
94
18
14
9
666
73
36
23
11
39
5
25
34
23
Females Persons 42 43
37
4
8
27
13
2
132
14
16
10
6
62
9
6
360
3
24
9
136
32
7
6
10 .. 29
18
2
100
142
64
38
40
191
313
25
26 .. 265
92
338
321
17
387
375
419
326
349
148
275
364
4,197
632
141
12
460
81
173
30
205
56
187
Males Females 44 45
22
115
12
21
23
38
151
5
22
.. 51
57
161
156
5
131
257
189
266
139
79
72
109
3,723
328
119
2
184
50
162
17
148
45
112
78
27
72
17
17
153
162
20
4
214
35
177
165
12
256
118
230
60
210
69
203
255
474
304
22
10
276
31
11
13
57
11
75
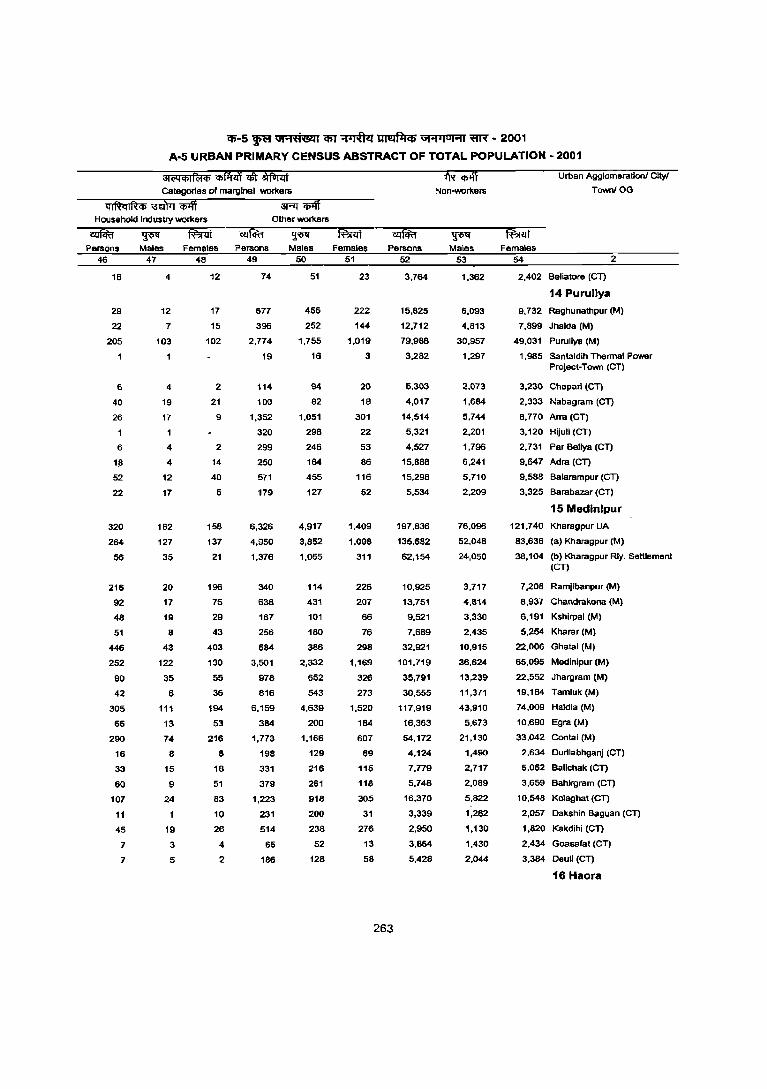
<6'-5 ~ ", ... 'ti@il C6'T ~ ~ ","1'1°1 ... 1 lIR' - 2001
A-5 URBAN PRIMARY CENSUS ABSTRACT OF TOTAL POPULATION - 2001
3hiq<l>lf<;j<l> ifliiIT i\ #Ia 1R ri Urban Agglomerationl City,
Categones of marginal workers Non-workers Town! OG
ql~ql~<I> i3aTI "ijiiff aRr ri Household Industry workers Other workers
Persons 46
16
29
22
205
6
40
26
6
1$
52
22
320
264
56
216
92
48
51
446
252
90
42
305
66
290
16
33
60
107
11
45
7
7
Males 47
4
12
7
103
4
19
17
4
4
12
17
162
127
35
20
17
19
8
43
122
35
6
111
13
74
8
15
9
24
19
3
5
Females Persons 48 49
12
17
15
102
2
21
9
2
14
40
5
158
137
21
196
75
29
43
403
130
55
36
194
53
216
8
18
51
83
10
26
4
2
14
677
396
2,774
19
114
100
1,352
320
299
250
571
179
6,326
4,950
1,376
340
638
167
256
684
3,501
978
816
6,159
384
1,773
198
331
319
1,223
231
514
65
186
Males 50
51
455
252
1,755
16
94
82
1,051
298
246
164
455
127
4,917
3,852
1,065
114
431
101
180
386
2,332
652
543
4,639
200
1,166
129
216
261
918
200
238
52
128
Females Persons 51
23
222
144
1,019
3
20
18
301
22
53
86
116
52
1,409
1,098
311
226
207
66
76
298
1,169
326
273
1,520
184
607
69
115
118
305
31
276
13
58
263
52
3,764
15,825
12,712
79,988
3,282
5,303
4,017
14,514
5,321
4,527
15,888
15,298
5,534
197,836
135,682
62,154
10,925
13,751
9,521
7,689
32,921
101,719
35,791
30,555
117,919
16,363
54,172
4,124
7,779
5,748
16,370
3,339
2,950
3,664
5,428
~ Males
53
1,362
6,093
4,813
30,957
1,297
2,073
1,684
5,744
2,201
1,796
6,241
5,710
2,209
76,096
52,046
24,050
3,717
4,814
3,330
2,435
10,915
36,624
13,239
11,371
43,910
5,673
21,130
1,490
2,717
2,069
5,822
1,282
1,130
1,430
2,044
Females 54 2
2,402 Beliatore (CT)
14 Purullya
9,732 Raghunathpur (M)
7,899 Jhalda (M)
49,031 Puruliya (M)
1,985 Santaldih Thermal Power Project-Town (eT)
3,230 Chapari (CT)
2,333 Nabagram (CT)
8,770 Arm (CT)
3,120 Hijuli (CT)
2,731 Par Beliya (en
9,647 Adra (en
9,588 Balarampur (CT)
3,325 Barabazar (eT)
15 Medinipur
121,740 Kharagpur UA
83,636 (a) Kharagpur (M)
38,104 (b) Kharagpur RJy. Settlement (CT)
7,208 Ramjibanpur (M)
8,937 Chandrakona (M)
6,191 Kshlrpal (M)
5,254 Kharar (M)
22,006 Ghatal (M)
65,095 Medinipur (M)
22,552 Jhargram (M)
19,184 Tamluk (M)
74,009 Haldia (M)
10,690 Egrs (M)
33,042 Contai (M)
2,634 Durtlabhganj (eT)
5,062 Ballchak (en 3,659 Bahirgram (en
10,548 Kolaghat (eT)
2,057 Dakshin Baguan (en 1,820 Kakdihi (Cn
2,434 Goasafat (CT)
3,384 Deull (en
16 Haora
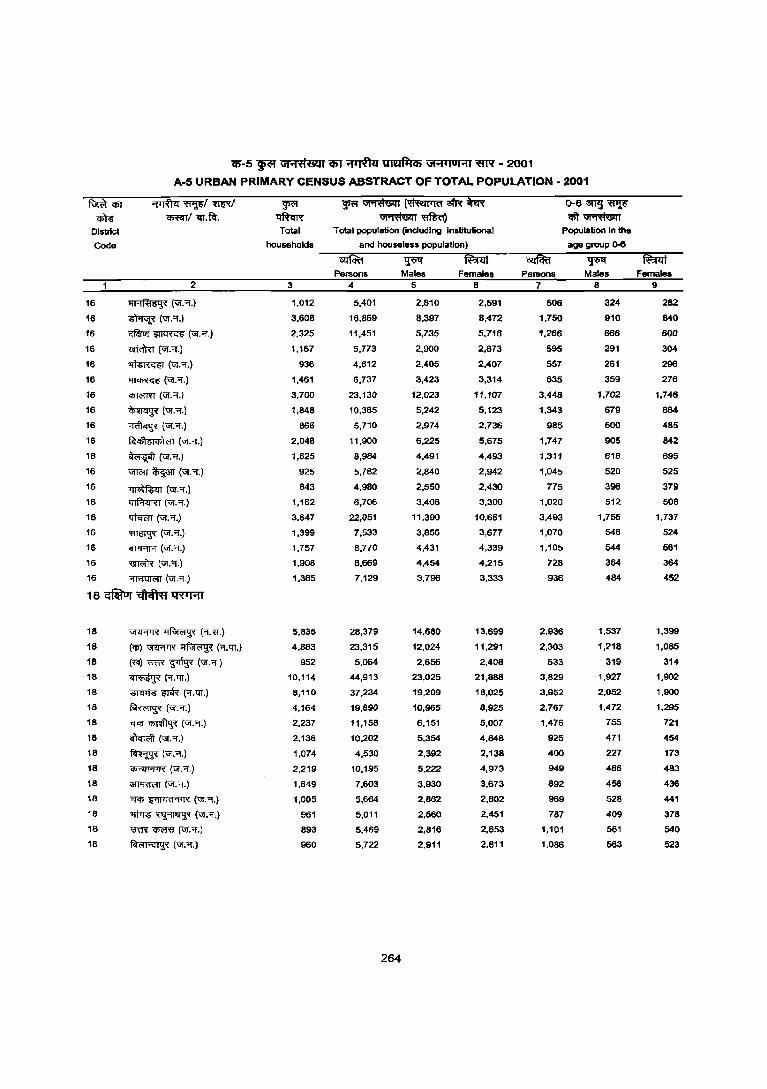
0-5 ~ \Jf'1'ti6Q1 CIiT ~ ~ \Jf'1'IUI'11 'HN - 2001
A-5 URBAN PRIMARY CENSUS ABSTRACT OF TOTAL POPULATION - 2001
~<r>T ~~/-m'{1 ~ ~ ~ ~ atR' 'iiiR 0-6~~
em- ~/lIT,~, ~ ~~ ~~ Distllc! Total Total population (including Institutional Population In the
Code householda and houseless population) age group ().6
~ ~ ~ ~ ~ R!'i!li Persons Males Females Persons Males Females
2 3 4 5 6 7 8 9
16 ~(VI.""!.) 1,012 5,401 2,810 2,591 606 324 282
16 ~(VI.""!,) 3,608 16,869 B,397 8,472 1,750 910 840
16 ~~(Uf . .,.) 2.325 11,451 5,735 5,716 1,266 666 600
16 -m<I'Rr ("f.,.) 1,167 5,773 2,900 2,873 595 291 304
16 ~("f,'i,) 936 4,812 2,405 2,407 557 261 296
16 ~(VI.""!.) 1,461 6,737 3,423 3,314 635 359 276
16 "1IiT<.'Im (VI .1.) 3,700 23,130 12,023 11,107 3,448 1,702 1,746
16 ~{"f."I'.} 1,848 10,365 5,242 5,123 1,343 679 664
16 ~("f."'l.) 866 5,710 2,974 2.736 985 500 485
16 foI<tI51q;1<'11 ("f."f,) 2,048 11,900 6,225 5,675 1,747 905 842
16 ~("f."'I,) 1,625 8,984 4,491 4,493 1,311 616 695
16 ~ ~an (VI.""!.) 925 5,782 2,840 2,942 1,045 520 525
16 ~{"I',"I',} 843 4,980 2,550 2,430 775 396 379
16 'ltf.!I<rm ("1'."1'.) 1,162 6,706 3,406 3,300 1,020 512 508
16 1:JiVc;rr (VI. "1'.) 3,647 22,051 11,390 10,661 3,493 1,756 1,737
16 ~{"f,"I',} 1,399 7,533 3,856 3,677 1,070 546 524
16 EIPRR ("f.'1.) 1,757 8,770 4,431 4,339 1,105 544 561
16 ~("I',"i,) 1,908 8,669 4,454 4,215 728 364 364
16 ~("I'."'I'.) 1,385 7,129 3,796 3,333 936 484 452
18 ~ ~ 'tR'1A1
18 \iI<f'flR ~ (,.<'1,) 5,835 28,379 14,680 13,699 2,936 1,537 1,399
18 (q;) 'iJflI"ffR ~ ("'I','l1,) 4,883 23,315 12,024 11,291 2,303 1,218 1,085
18 (~ ~ ~ ("f."'I'.) 952 5,064 2,656 2,408 633 319 314
18 ~("'I','TT,) 10,114 44,913 23,025 21,888 3,829 1,927 1,902
18 ~ '5'1'<R ("'I'.'TT.) 8,110 37,234 19,209 18,025 3,952 2,052 1,900
18 ~("I' . .,.) 4,164 19,B90 10,965 8,925 2,767 1,472 1,295
18 'fI'Ij~("I' . .,.) 2,237 11,158 6,151 5,007 1,476 755 721
18 ~("f."I'.) 2,136 10,202 5,354 4,848 925 471 454
18 ~("f."'l.) 1,074 4,530 2,392 2,138 400 22:1 173
18 ~(ur."'l.) 2,219 10,195 5,222 4,973 949 466 483
18 ~("I',"'I',) 1,649 7,603 3,930 3,673 892 456 436
18 'fI'Ij ,.11<1(1'1'1'( (ur.'9'.) 1,005 5,664 2,862 2,802 969 526 441
18 ~~("I,'1.) 961 5,011 2,560 2,451 787 409 378
18 mR W<'ffl (VI."!'.) 893 5,469 2,816 2.653 1,101 561 540
18 ~("I'.,.) 960 5,722 2,911 2,811 1,086 563 523
264
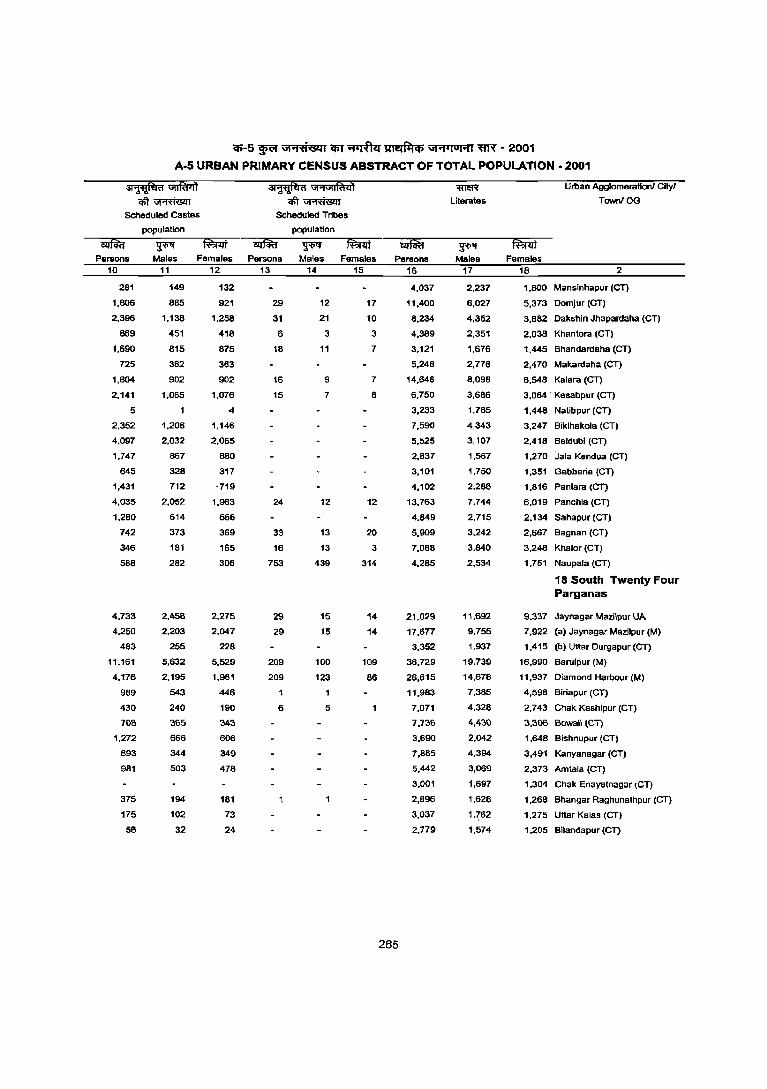
CIi-5 ~ \Jt'1;fliBZOll em ~ ~ \Jt'1 i IUHI ~ - 2001
A-5 URBAN PRIMARY CENSUS ABSTRACT OF TOTAL POPULATION - 2001
~"Gi1fuiit ~ Gj.,GjI~<i1 ~ Urban Agglomeration! City!
qft~ qft~ Literates TawnJOG
Scheduled Casles Scheduled Tribes
population population
~ ~ ~ ilfifu ~ f¥illi ~ ~ MiI"lIt Persons Males Females Persons Males Females Persons Males Females
10 11 12 13 14 15 16 17 18 2
281 149 132 4,037 2,237 1,800 Mansinhapur (eT)
1,806 885 921 29 12 17 11,400 6,027 5,373 Domjur (CT)
2,396 1,138 1,258 31 21 10 8,234 4,352 3,882 Dakshln Jhapardaha (eT)
869 451 418 6 3 3 4,389 2,351 2,038 Khantora (eT)
1,690 815 875 18 11 7 3,121 1,676 1,445 Bhandardaha (CT)
725 362 363 5,246 2,776 2,470 Makardaha (eT)
1,604 902 902 16 9 7 14,646 8,098 6,548 Kalara (eT)
2,141 1,065 1,076 15 7 8 6,750 3,686 3,064 . Kesabpur (CT)
5 4 3.233 1,785 1.448 Natibpur (eT)
2,352 1,206 1,146 7,590 4,343 3,247 Bikihakola (CT)
4,097 2,032 2,065 5,525 3,107 2,418 Beldubl (CT)
1,747 867 880 2,837 1,567 1,270 Jala Kendua (eT)
645 328 317 3,101 1,750 1,351 Gabberia (CT)
1,431 712 ,719 4.102 2,286 1,816 Paniara (eT)
4,035 2,052 1,983 24 12 12 13,763 7,744 6,019 Panchla (CT)
1,280 614 666 4,849 2,715 2,134 Sahapur (eT)
742 373 369 33 13 20 5,909 3,242 2,667 Bagnan (eT)
346 181 165 16 13 3 7,088 3,840 3,248 Khalor(CT)
588 282 306 753 439 314 4,285 2,534 1,751 Naupala (eT)
18 South Twenty Four Parganas
4,733 2,458 2,275 29 15 14 21,029 11,692 9,337 Jaynagar Mazilpur UA
4,250 2,203 2,047 29 15 14 17,677 9,755 7,922 (a) Jaynagar Mazilpur (M)
483 255 228 3,352 1,937 1,415 (b) Uttar Durgapur (CT)
11,161 5,632 5,529 209 100 109 36,729 19,739 16,990 Baruipur (M)
4,176 2,195 1,981 209 123 86 26.615 14,678 11,937 Diamond Harbour (M)
989 543 446 11,983 7,385 4,598 Biriapur (CT)
430 240 190 6 5 7,071 4,328 2,743 Chak Kashlpur (CT)
70S 365 343 7,736 4,430 3,300 Bawali{Cl)
1,272 666 606 3,690 2,042 1,648 Bishnupur (CT)
693 344 349 7,885 4,394 3,491 Kanyanagar (CT)
981 503 478 5,442 3,069 2,373 Amtala (CT)
3,001 1,697 1,304 Chak Enayelnagar leT)
375 194 181 2,896 1,628 1,268 Bhangar Raghunalhpur (CT)
175 102 73 3,037 1?62 1,275 Uttar Kalas (CT)
56 32 24 2,779 1,574 1,205 Bilandapur (CT)
265
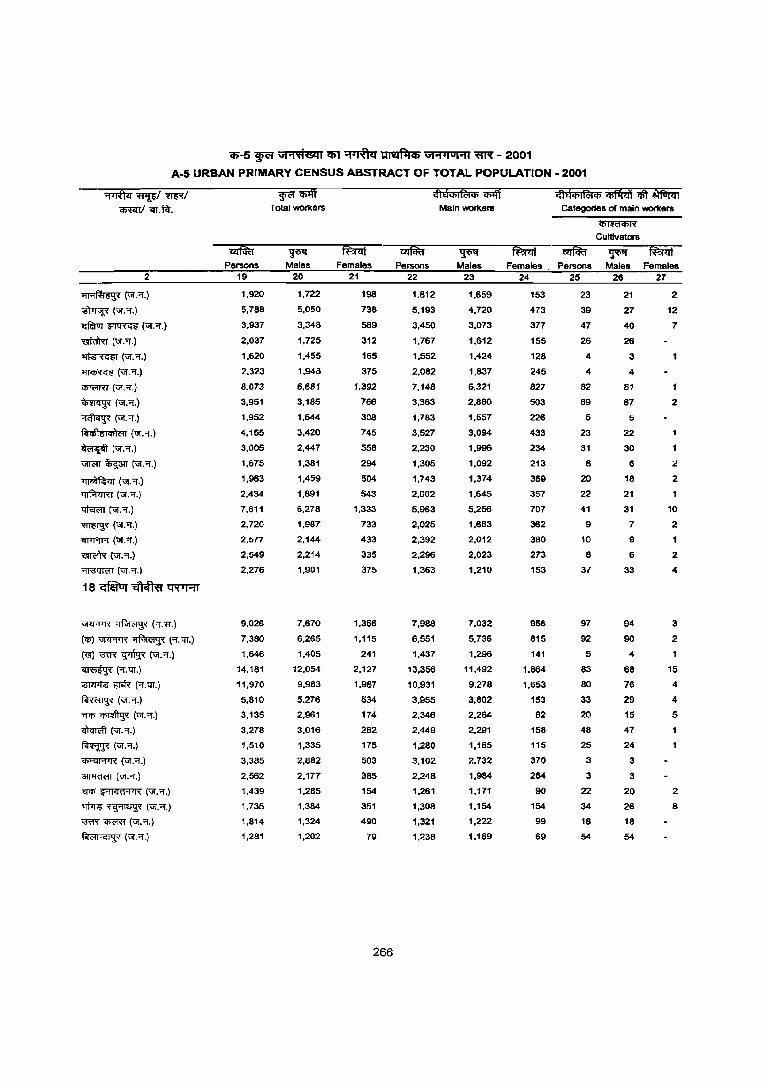
<1)-5 ~ GH'ti6Zli em ~ ~ Gi'1 i iUI..,1 ;m;r - 2001
A-5 URBAN PRiMARY CENSUS ABSTRACT OF TOTAL POPULATION - 2001
2
~("GI.'1.)
~(\i(.'.)
<:fflrur ~ ("GI.'1.)
moRT ("GI.'1.)
~(\i(.'.)
~("GI.'1.)
C5T<'fRT fur. '1. )
~(\i(.'.)
~ (Uf."I.)
IilIcGi1::IQ;)('u ("Uf."'!.)
~ ("Uf:'1.)
Ul'I'iffi ~ (Uf."I.)
~("GI."I.)
l'fif.'rzrRT ("GI. '1.)
~("Uf."'!.)
~("Uf."I.)
~("GI."I.)
~("Uf."i.)
~("GI.'1.)
1 8 Gfiiiny ;:ftofu:r q;{Tj"1'T
~ ~ ('1.<1'.)
(<Ii) ~ ~ ("i.qJ.)
(~ ~ ~ (Uf."i.)
~('.G1.) ~ E'Jik ('1.G1.)
~("Uf."'!.)
<T<P ~ ("GI.'1.)
<Wm:ft ("Uf. "i.)
~(ur."i.)
~(ur."i.)
~(\i(.".)
<T<P i;'114<l'1'1,( ("GI."1'.)
~~("Uf."i.)
'iO'ffi '1P<'I'<l (ur. "i.)
~("GI.'.)
Persons 19
1.920
5,788
3,937
2.037
1,620
2.323
8.073
3,951
1.952
4,165
3.005
1.675
1.963
2.434
7.611
2.720
2.577
2,549
2,276
9,026
7,380
1,646
14,181
11.970
5.810
3,135
3,278
1,510
3,385
2.562
1,439
1,735
1,814
1.281
~lfilff Total workers
~ Males
20
1.722
5,050
3.348
1,725
1,455
1.948
6.681
3,185
1.644
3,420
2,447
1,381
1,459
1.891
6.218
1.981
2,144
2,214
1,901
7,610
6,265
1.405
12.054
9.983
5.276
2.961
3,016
1,335
2,882
2.177
1.285
1,384
1.324
1.202
Females 21
198
738
589
312
165
375
1.392
766
308
745
558
294
504
543
1,333
733
433
335
375
1,356
1.115
241
2,127
1,987
534
174
262
175
503
385
154
351
490
79
266
Persons 22
1.812
5.193
3.450
1.767
1,552
2.082
7.148
3,363
1,783
3,527
2,230
1,305
1,743
2.002
5,963
2,025
2,392
2,296
1,363
7,988
6.551
1.437
13,356
10.931
3.955
2,346
2.449
1,280
3.102
2.248
1,261
1,308
1,321
1.238
Main workel'8
~ Males
23
1.659
4,720
3,073
1,612
1,424
1,837
6.321
2,860
1,557
3,094
1,996
1,092
1,374
1,645
5,256
1,663
2,012
2,023
1.210
7,032
5,736
1,296
11,492
9.278
3,8Q2
2,264
2,291
1,165
2.732
1,984
1,171
1,154
1,222
1,169
G1fl(j)I~(j) "lfifii'iH qft ~ Categories or main wor1cel'8
"ifilrcf(j)ff
Cultivators
Females. Persons Males Females 24 25 26 27
153
473
377
155
128
245
827
503
226
433
234
213
369
357
707
362
380
273
153
956
815
141
1,864
1.653
153
82
158
115
370
264
90
154
99
69
23
39
47
26
4
4
82
69
5
23
31
8
20
22
41
9
10
8
37
97
92
5
83
80
33
20
48
25
3
3
22
34
18
54
21
27
40
26
3
4
81
67
5
22
30
6
18
21
31
7
9
6
33
94
90
4
68
76
29
15
47
24
3
3
20
26
18
54
2
12
7
2
:l
2
10
2
2
4
3
2
15
4
4
5
2
8
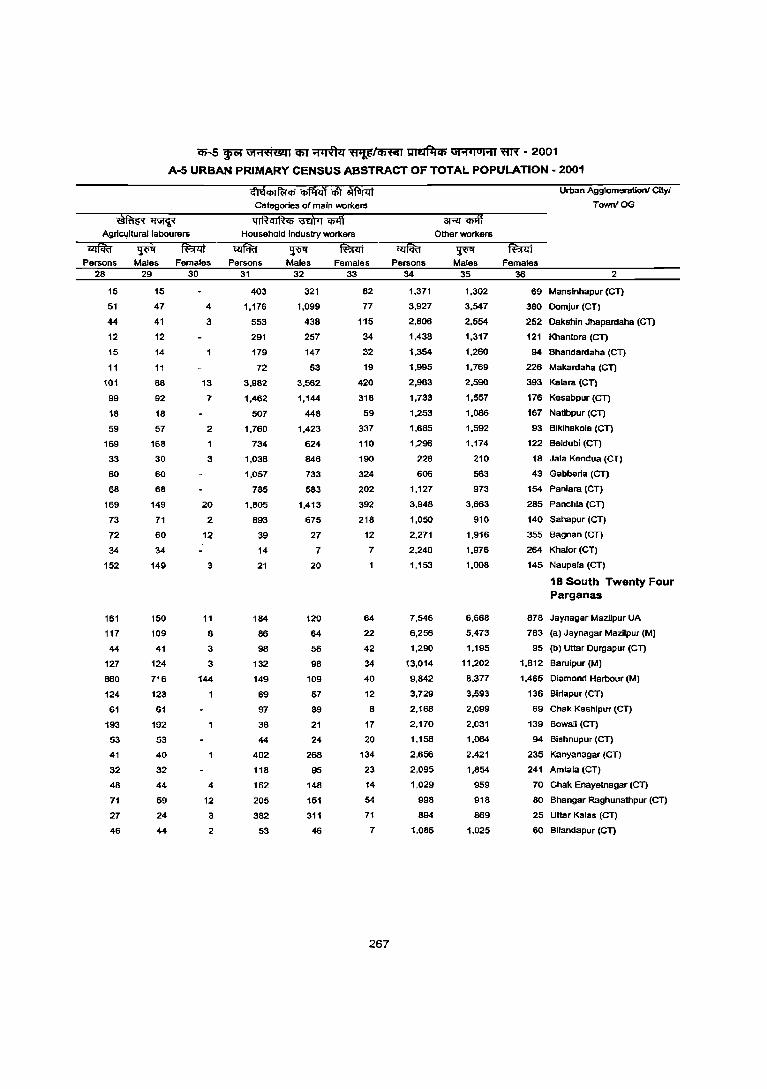
q;-5 ~ Gt ... 'Ei&l1 (f;J ~~~ ~ Gt .... IUJOtI ~ - 2001
A-5 URBAN PRIMARY CENSUS ABSTRACT OF TOTAL POPULATION - 2001
~~ AgrlCl,llturallabourers
G"jaCPI~qJ ii*li'i c€t ~ Categories of main workers
qlR<uRcp ~"iIiIff Household indu&try workers
~ Persons Male& Females Persons Males Females
28 29 30 31
15
51
44
12
15
11
101
99
18
59
169
33
60
68
169
73
72
34
152
161
117
44
127
860
124
61
193
53
41
32
48
71
27
46
15
47
41
12
14
11
B8
92
18
57
168
30
60
68
149
71
60
34
149
150
109
41
124
716
123
61
192
53
40
32
44
59
24
44
4
3
13
7
2
1
3
20
2
12
3
11
8
3
3
144
4
12
3
2
403
1,176
553
291
179
72
3,982
1,462
507
1,760
734
1,036
1,057
785
1,805
893
39
14
21
184
86
98
132
149
69
97
38
44
402
118
162
205
382
53
32
321
1,099
438
257
147
53
3,582
1,144
448
1,423
624
846
733
563
1,413
675
27
7
20
120
64
56
98
109
57
89
21
24
268
95
148
151
311
46
33
82
77
115
34
32
19
420
318
59
337
110
190
324
202
392
218
12
7
64
22
42
34
40
12
8
17
20
134
23
14
54
71
7
267
Persons 34
1,371
3,927
2,806
1,438
1,354
1,995
2,983
1,733
1,253
1,685
1,296
22B
606
1,127
3,948
1,050
2,271
2,240
1,153
7,546
6,258
1,290
13,014
9,842
3,729
2,168
2,170
1,158
2,656
2,095
1,029
998
894
1,OB5
3Rf "iJff Other workers
Males 35
1,302
3,547
2,554
1,317
1,260
1,769
2,590
1,557
1,086
1,592
1,174
210
563
973
3,663
910
1,916
1.976
1,OOB
6,668
5,473
1,195
11,202
8,377
3,593
2,099
2,031
1,064
2,421
1,854
959
91B
869
1,025
Urban Agglomeration! CltyJ
TownIOG
Females 36 2
69 Manslnhapur (CT)
3BO OomJur (CT)
252 Dakshin Jhapardaha (CT)
121 Khantora (en 94 Bhandardaha (CT)
226 Makardaha (CT)
393 Kalara leT)
176 Kesabpur (eT)
167 Natlbpur (CT)
93 Bikihakola (CT)
122 Beldubi (eT)
18 Jala Kendua leT)
43 Gabberla (en 154 Paniara (eT)
285 Panchla (CT)
140 Sahapur (CT)
355 Bagnan leT)
264 Khalor (CT)
145 Naupala (CT)
18 South Twenty Four Parganas
876 Jaynagar Maz1lpur UA
783 (a) Jaynagar Mazilpur (M)
95 (b) Uttar Ourgapur (CT)
1,812 Baruipur (M)
1,465 Diamond Harbour (M)
136 Birlapur (CT)
69 Chak Kashipur (eT)
139 Bowal1 (CT)
94 Bishnupur (CT)
235 Kanyanagar (eT)
241 Amtala (CT)
70 Chak Enayetnagar (CT)
80 Bhangar Raghunathpur (eT)
25 Uttar Kalas (CT)
60 Bllandapur (CT)
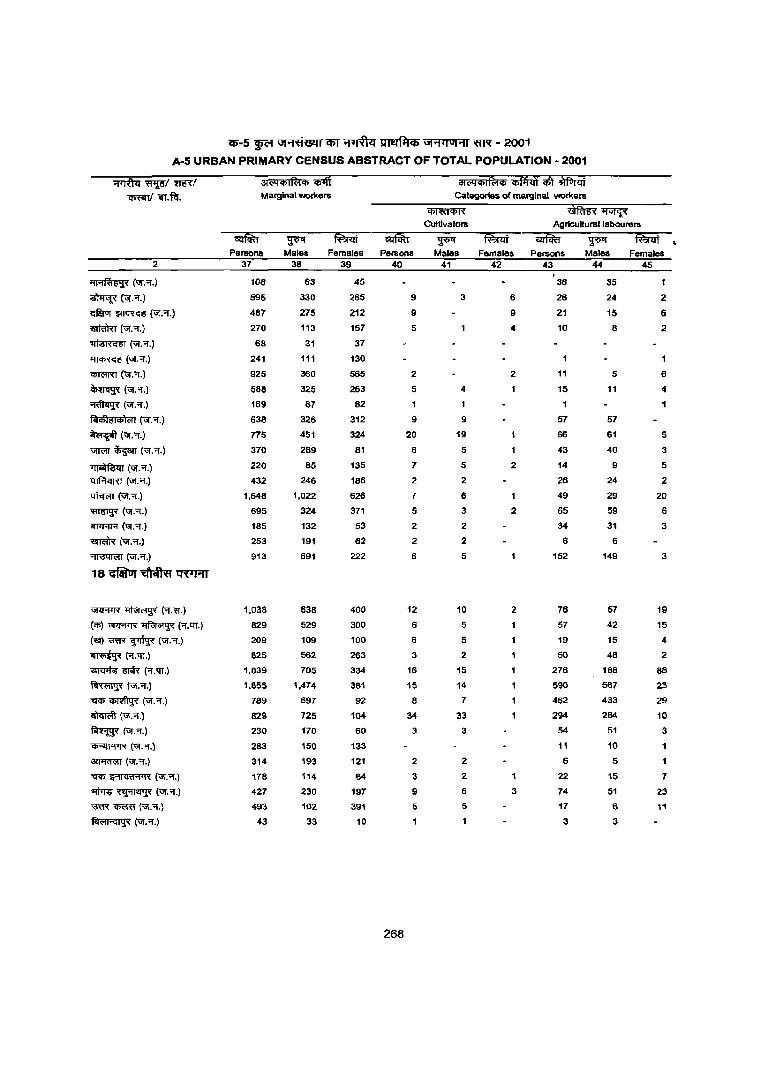
<6"-5 WC' \II'1flUQI CI)J ~ ~ \11'1'[01'11 ~ - 200"1
A-5 URBAN PRIMARY CENSUS ABSTRACT OF TOTAL POPULATION - 2001
2
~(GI'.Of.)
~(U(.Of.)
c:fSur ~ (Uf:'f.)
~(U(."'I'.)
~("I.'f.)
~("I."'f.)
~(U(."'I'.)
~(\jf."'.)
~(U(."'I'.)
~~61a>l(;11 \uf.'l'.)
~(U(."'I'.)
Ul1<'Il ~ ("1."'1.)
~("I."'I'.J 'IiIf.'r>:Im (Uf."'f.)
t:rf;:rt;rr (Uf."'I'.)
~(1;r:'l'.)
ii!J1I"'I1"'I \uf."'f.)
~('H.)
''IT\'Jtffi'IT ("1."'1'.)
"18 c:filur ~ ~
\iRRTR ~ ( .... 'll.)
('Ii) \iRRTR ~ (or.rrr.)
(~ mR ~ \uf:'f.)
~("'I'.ttT.)
~~('1'.rrr.)
~ ("1:'1'.)
TI"il>~("I."'I'.)
~('\3I."'I'.)
~(U(."f.)
~("I."f.)
3lJl1cI"<'IT ("1."'1'.)
_,."fI<ltl"f'I'«"<lI".""f'.)
~~(\jf.".)
mR <IX'f'{1 (\Jf."'I'.)
~("I."'I'.)
31<'4"'IIa", i1fi Marginal worl<ers
Persona 37
106
595
487
270
68
241
925
588
169
638
775
370
220
432
1,648
895
185
253
913
1,038
829
209
825
1,039
1,855
789
829
230
283
314
178
427
493
43
Males Females Persona 38 39 40
63 45
330 265 9
275 212 9
113 157 5
31
111
360
325
87
326
451
289
85
246
1,022
324
132
191
691
638
529
109
562
705
1,474
697
725
170
150
193
114
230
102
33
37
130
565
263
82
312
324
81
135
186
626
371
53
62
222
400
300
100
283
334
381
92
104
60
133
121
64
197
391
10
268
2
5
9
20
6
7
2
7
5
2
2
6
12
6
6
3
16
15
8
34
3
2
3
9
5
31<'4"'11%1", ~ ctt ~ Categories of marginal worKers
~
Cultivators ~ lfVfii'C
AgriCUltural labourers
Males Females Persons 41 42 43
36
3 6 26
4
9
19
5
5
2
6
3
2
2
5
10
5
5
2
15
14
7
33
3
2
2
6
5
9 21
4 10
2
2
1
2
2
1
3
11
15
57
66
43
14
26
49
65
34
6
152
76
57
19
50
276
590
462
294
54
11
6
22
74
17
3
Males Females 44 45
35
24 2
15 6
8 2
5
11
57
61
40
9
24
29
59
31
6
149
57
42
15
48
188
567
433
284
51
10
5
15
51
6
3
6
4
5
3
5
2
20
6
3
3
19
15
4
2
88
23
29
10
3
1
1
7
23
11
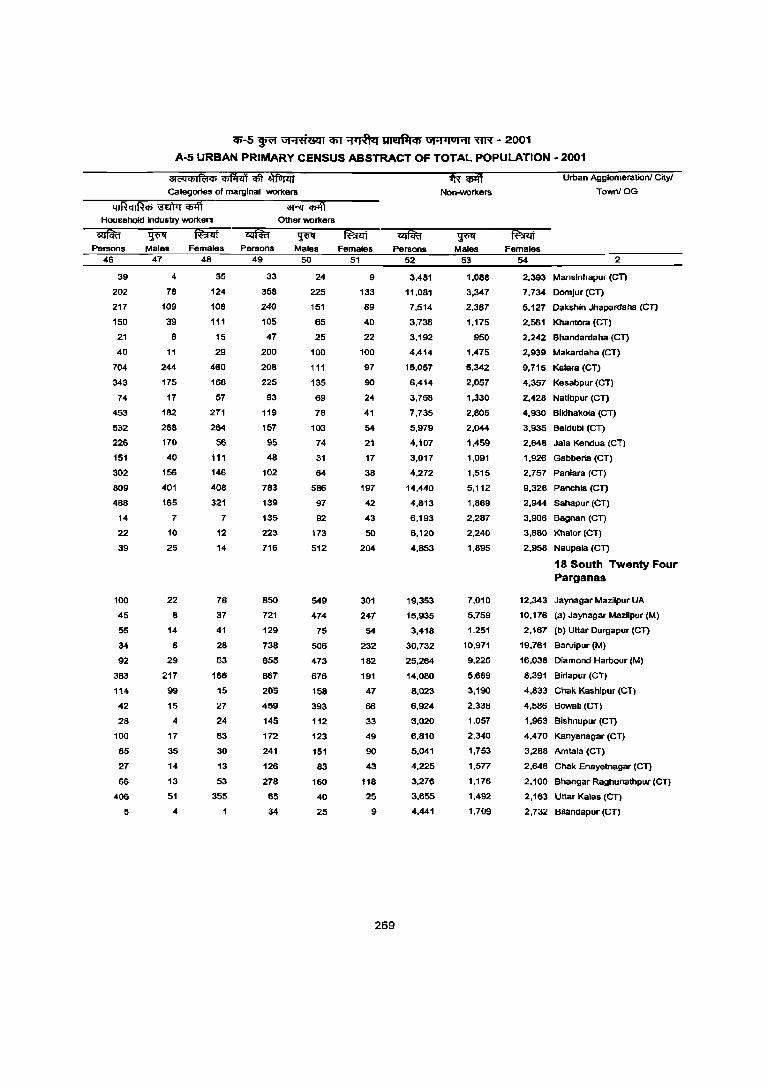
<1>-5 ~ Ul"1't1dZ1l em ~ ~ Ul"1'lul'1l ~ - 2001
A-5 URBAN PRIMARY CENSUS ABSTRACT OF TOTAL POPULATION - 2001
31<"'l"'IR;t", ~ ~ ¥iTlit Categories of marginal wor1<ers
'II R q IR '" iii"ih7T ;iff '3Rr ;iff Household Induslly wor1<ers Other wor1<ers
Persons 46
39
202
217
150
21
40
704
343
74
453
532
226
151
302
809
486
14
22
39
100
45
55
34
92
383
114
42
28
100
65
27
66
406
6
Males 47
4
78
109
39
6
11
244
175
17
182
268
170
40
156
401
165
7
10
25
22
8
14
6
29
217
99
15
4
17
35
14
13
51
4
Females Persons 48 49
35
124
lOB
111
15
29
460
168
57
271
264
56
111
146
408
321
7
12
14
78
37
41
28
63
166
15
27
24
83
30
13
53
355
33
358
240
105
47
200
208
225
93
119
157
95
48
102
783
139
135
223
716
850
721
129
738
655
867
20'5
459
145
172
241
126
278
65
34
Males 50
24
225
151
65
25
100
111
135
69
7B
103
74
31
64
586
97
92
173
512
549
474
75
506
473
676
158
393
112
123
151
83
160
40
25
Females Persons 51
9
133
89
40
22
100
97
90
24
41
54
21
17
38
197
42
43
50
204
301
247
54
232
182
191
47
66
33
49
90
43
118
25
9
269
52
3,481
11,081
7,514
3,736
3,192
4,414
15,057
6,414
3,758
7,735
5,979
4,107
3,017
4,272
14,440
4,813
6,193
6,120
4,853
19,353
15,935
3,418
30,732
25,264
14,OBO
8,023
6,924
3,020
6,810
5,041
4,225
3,276
3,655
4,441
¥l!f Males
53
1,088
3,347
2,387
1,175
950
1,475
5,342
2,057
1,330
2,805
2,044
1,459
1,091
1,515
5,112
1,869
2,287
2,240
1,895
7,010
5,759
1,251
10,971
9,226
5,689
3,190
2,338
1,057
2,340
1,753
1,577
1,176
1,492
1,709
Urban Agglomeration! City/
TowniOG
Females 54 2
2,393 Manslnhapur (CT)
7,734 Domjur (CT)
5.127 Dakshin Jhapardaha (CT)
2.561 Khantora (CT)
2.242 Bhandardaha (CT)
2.939 Makardaha (CT)
9.715 Kalara (CT)
4,357 Kesabpur (Cn
2,428 Natibpur (CT)
4,930 Blklhakola (CT)
3,935 Beldubi (CT)
2,648 Jala Kendua (eT)
1,926 Gabberia (CT)
2,757 Paniara (CT)
9,328 Panchla (CT)
2,944 Sahapur (CT)
3,906 Bagnan (CT)
3,880 Khalor (CT)
2,958 Naupala (CT)
18 South Twenty Four Parganas
12,343 Jaynagar Mazilpur UA
10,176 (a) Jaynagar Mazilpur (M)
2,167 (b) Uttar Durgapur (eT)
19,761 Barulpur (M)
16,038 Diamond Harbour (M)
8,391 Birlapur (CT)
4,833 Chak Kashipur (CT)
4,586 Bewail (CT)
1,963 Bishnupur (CT)
4,470 Kanyanagar (CT)
3,288 Arnlela (eT)
2,648 Chak Enayelnagar (Cn
2,100 Bhangar Raghunalhpur (eT)
2,163 Uttar Kalas (CT)
2,732 Bilandapur (CT)

't"I1,!uft q;-6 : 'fi'«!ll~ fd G1 '1'fi'Lclil
TABLE A-6 : INSTITUTIONAL POPULATION

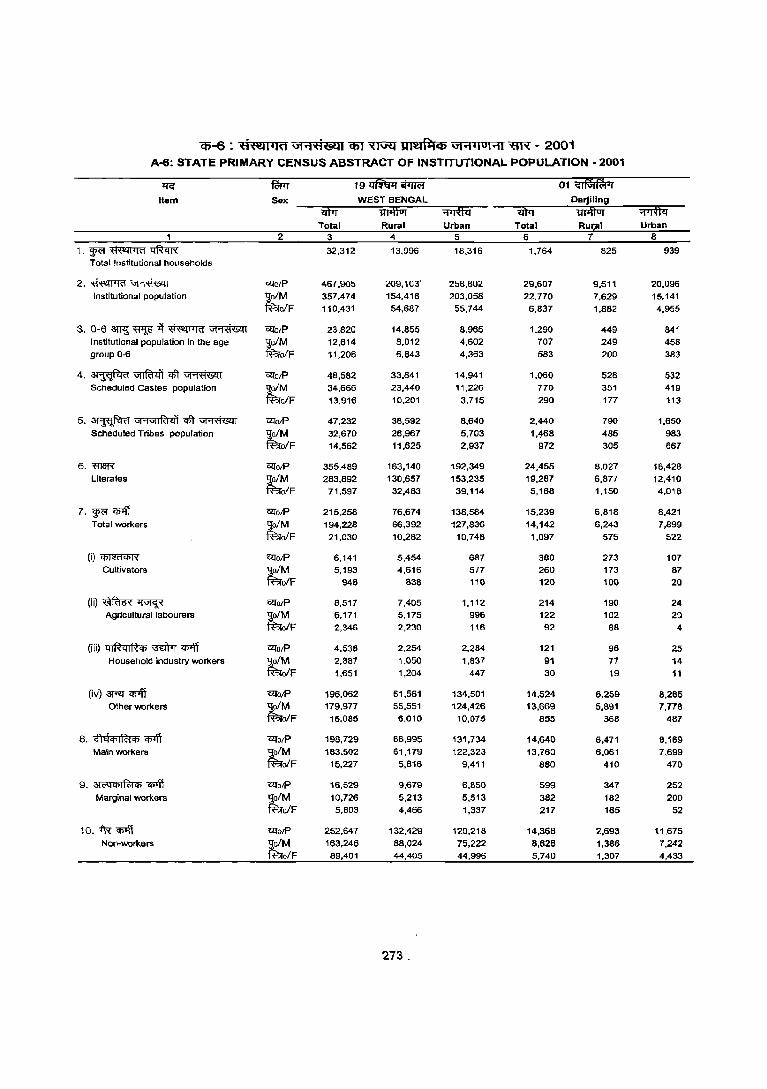
cp-6 : ti«:ll~ld \JH'f16l11 Cfil ~ UI\!l~Cf) \J1"1~I01"11 ~ - 2001 A-6: STATE PRIMARY CENSUS ABSTRACT OF INSTITUTIONAl- POPULATION· 2001
llG fcWT 19 "IiMfii iiTJrc;!' 01~ Item Sex WEST BENGAL Oarjillng
"ijfiT IDifiVi ;prfui iIli1 lififfUi "'fTrtlii Total Rural Urban Total Rur~1 Urban
1 2 3 4 5 6 7 8
1·wa~~ 32.312 13.996 18,316 1,764 825 939 Total !lIstitutional households
2,~~ GQo/P 467,905 209,103' 258,802 29,607 9,511 20,096 Institutional population
~ 357,474 154,416 203,058 22.770 7.629 15,141
ofF 110,431 54,687 55,744 6,837 1,882 4,955
3.0-6~~~~~ CQorP 23,820 14,855 8,965 1,290 449 841 Institutional population in the age t,M 12,614 8,012 4,602 707 249 458 group 0-6 ofF 11,206 6,843 4,363 583 200 383
4.~~qft~ 'O!l'orP 48,582 33,641 14,941 1,060 528 532 Scheduled Castes population tM 34,666 23,440 11,226 770 351 419
ofF 13,916 10.201 3,715 290 177 113
5. ~ GJ'1U11R'i1l1 qft ~ 'O!l'ot? 47,232 38,592 8,640 2,440 790 1,650
Scheduled Tribes population tM 32,670 26,967 5,703 l,te8 485 983 ofF 14,562 11,625 2,937 972 305 667
6. WIlR G1To/P 355,489 163,140 192,349 24,455 8,027 16,428 Literates ~ 283,892 130,657 153,235 19,287 6,877 12,410
olF 71,597 32,483 39,114 5,168 1,150 4,018
7. ~ q;lft 'e2l'o/P 215,258 76,674 138,584 15,239 6,818 8,421 Total workers tM 194,228 66,392 127,836 14,142 6,243 7,899
olF 21,030 10,282 10,748 1,097 575 522
(i)~ 'O!l'O/P 6,141 5,454 687 380 273 107 Cultivators tM 5,193 4,616 577 260 173 87
olF 948 838 110 120 100 20
(ii)~~ GQo/P 8,517 7,405 1,112 214 190 24 Agricultural labourers
~ 6,171 5,175 996 122 102 20
oIF 2,346 2,230 116 92 88 4
(iii) ql~ql~q; '31dM ~ "6!JorP 4,538 2,254 2,284 121 96 25 Household industry workers ~M 2,887 1,050 1,837 91 77 14
oIF 1,651 1,204 447 30 19 11
(iv) 3RT <P1fi "6!Jo/P 196,062 61,561 134,501 14,524 6,259 8,265 Other wor1<.ers tM 179,977 55,551 124,426 13,669 5,891 7,778
oIF 16,085 6,010 10,075 855 368 487
8. ,,"iQCflIfc;jij) <P1fi O!forP 196,729 66,995 131,734 14,640 6,471 8,169 Main workers f(M 183.502 61,179 122,323 13,760 6,061 7,699
oIF 15,227 5,816 9,411 880 410 470
9. 3lc;;qQ;IR>tCfl ~ GQolP 16,529 9,679 6.850 599 347 252 Margina! workers tM 10,726 5,213 5,513 382 182 200
o./F 5,803 4,466 1,337 217 165 52
10. fR~ "&{olf' 252,647 132,429 120,218 14,368 2,693 11,675 Non-workers tM 163,246 88,024 75,222 8,628 1,386 7,242
olF 89,401 44,405 44,996 5,740 1,307 4,433
273 .
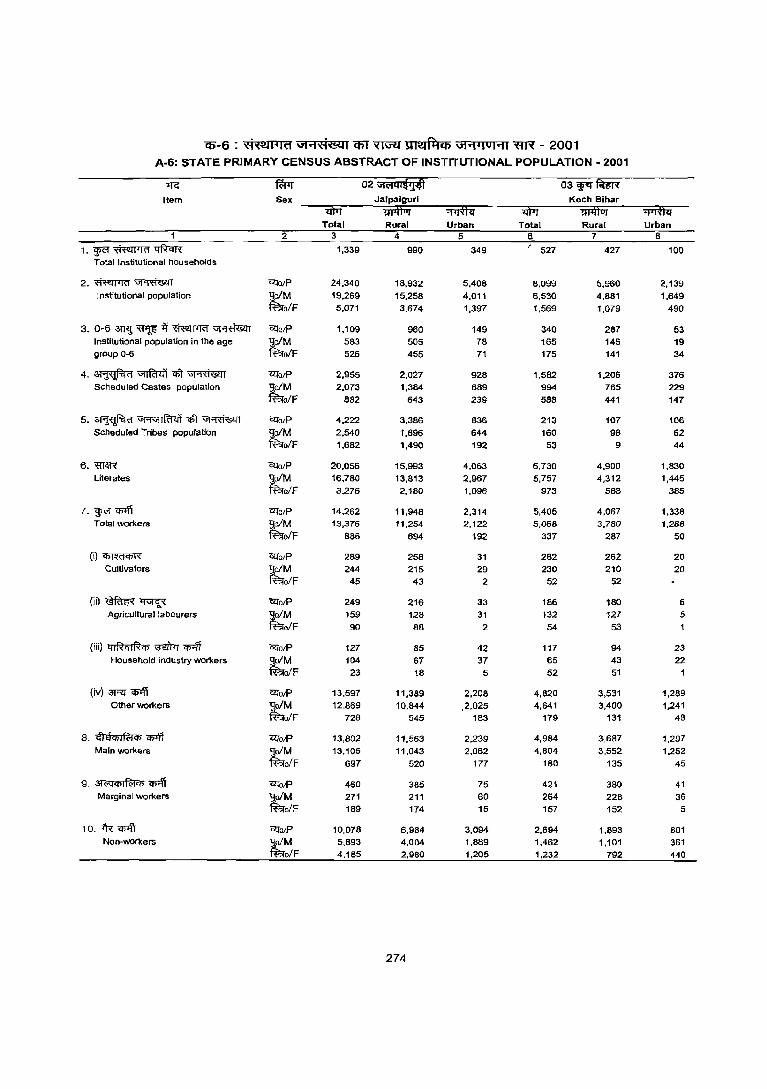
C6"-6 : ~ GI"'I'<1'L<41 q;r ~ m~~tf) "i"'l4101"'l1 ~ - 2001 A-6: STATE PRIMARY CENSUS ABSTRACT OF INSTITUTIONAL POPULATION· 2001
1lG f«>r 02 iIIclql~'}41 03 CJffI' fitt:'R Item Sex Jalpalgurl Koch Bihar
"iitIT "riTiffIJi ""fiTffii =;ffii liTiftUT "=J"iTffii Total Rural Urban Total Rural Urban
1 2 3 4 5 S 7 8
1.~~~ 1,339 990 349 :- 527 427 100 Total Institutional households
2.~~ C2:lOlP 24,340 18,932 5,408 8,099 5,960 2,139 Institutional population tM 19,269 15,258 4,011 6,530 4.881 1,649
olF 5,071 3.674 1,397 1,569 1,079 490
3, 0-6;m<J:~~~~ C2:lo/P 1,109 960 149 340 287 53 Institutional population in the age ~M 583 505 78 165 146 19 group 0-6 ofF 526 455 71 175 141 34
4.~~qft~ Clio!? 2,955 2,027 928 1,582 1,206 376 Scheduled Castes population tM 2,073 1,384 689 994 765 229
olF 882 643 239 588 441 147
5. ~ Gi'1"lIRl<li <tt ~ Clio/P 4,222 3,386 836 213 107 106 Scheduled Tribes population tM 2,540 1,896 644 160 98 62
olF 1,682 1,490 192 53 9 44
6. Wl\R Clio/P 20,056 15,993 4,063 6,730 4,900 1,830 Literates ~M 16,780 13,813 2,967 5,757 4,312 1,445
ofF 3,276 2,180 1,096 973 588 385
7. '¥'f q;>fi CliO/P 14,262 11,948 2,314 5,405 4,067 1,338 Total workers tM 13,376 11,254 2,122 5,068 3,780 1,288
olF 886 694 192 337 287 50
(i)~ Clio/P 289 258 31 282 262 20 Cultivators tM 244 215 29 230 210 20
olF 45 43 2 52 52
(ii)~~ <Zl'o/P 249 216 33 186 180 6 Agricultural la bourers
~F 159 128 31 132 127 5 90 88 2 54 53
(iii) qrRqlRq; ~ '1l>'ff Cliot? 127 85 42 117 94 23 Household industry workers tM 104 67 37 65 43 22
ofF 23 18 5 52 51
(iv) 3Rl' <I>Ifi Clioif' 13,597 11,389 2,208 4,820 3,531 1,289 Other workers tM 12,869 10,844 ,2,025 4,641 3,400 1,241
olF 728 545 183 179 131 48
8. ,~'lEIq;If(;j<il "'Illff CliO/P 13,802 11,563 2,239 4,984 3,687 1,297 Main work'lrs ~o/M 13,105 11.043 2.062 4,804 3,552 1.252
fF.;{o/F 697 520 177 180 135 45
9. 31(>Qq;If(;jCj) ~ CliO/P 460 385 75 421 380 41 Marginal workers ;tM 271 211 60 264 228 36
olF 189 174 15 157 152 5
10. i"R ~ CliO/P 10,078 6,984 3,094 2,694 1,893 801 Non-workers tM 5.893 4,004 1.889 1,462 1,101 361
ofF 4,185 2,980 1,205 1,232 792 440
274
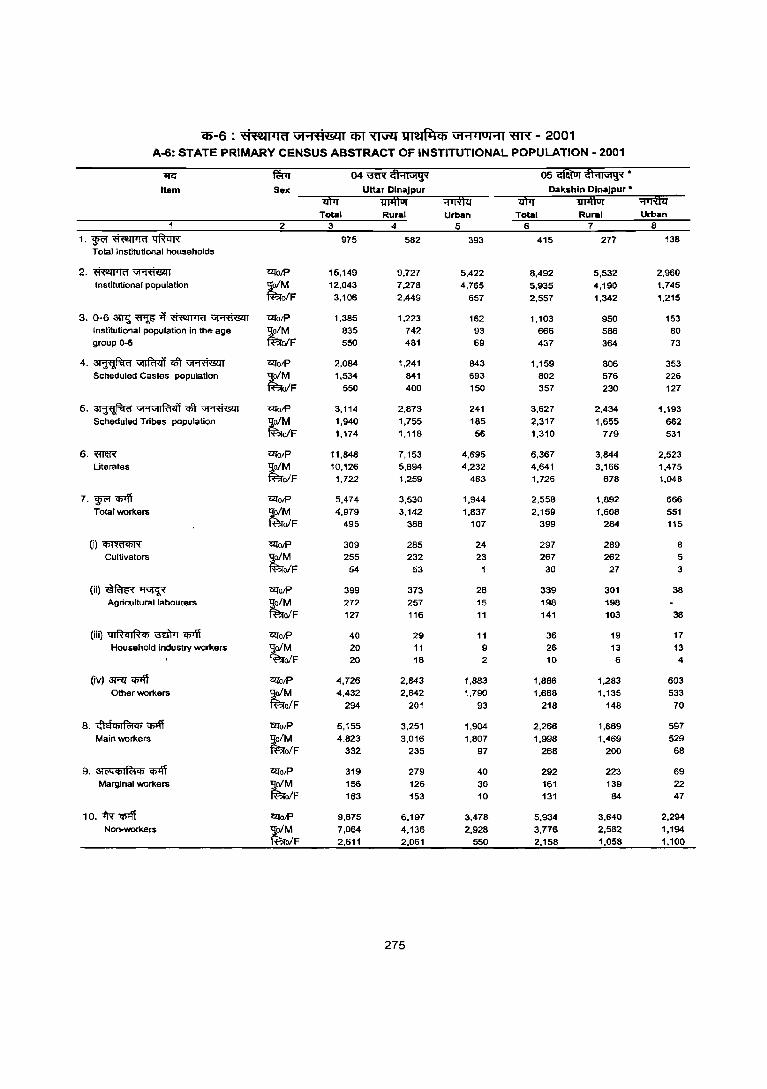
'i6'-6 : ~'Wu-Id Gi""lfl&ll q;r ~ ~ Gi""l'.OI"'1I ~ - 2001 A-6: STATE PRIMARY CENSUS ABSTRACT OF INSTITUTIONAL POPULATION - 2001
If<: ~ 04\nR~ 05~~· Item Sex Uttar Olnajpur Oakshln OlnaJpur •
m"1T ii11\tiJl ;pffui iIl1i 'I1l1ffUT :;pf$ Total Rural Urban Total Rural Urban
1 2 3 4 5 6 7 8
l·wa~~ 975 582 393 415 277 138 Tolal Institutional households
2.~~ ~o!P 15.149 9.727 5,422 8,492 5,532 2,960 Institutional population
~ 12,043 7,278 4,765 5,935 4,190 1,745 ofF 3,106 2,449 657 2,557 1,342 1,215
3.0-6~~it~~ Cl(o!P 1,385 1,223 162 1,103 950 153 Institutional population in the age
~ 835 742 93 666 586 80 group 0-6 blF 550 481 69 437 364 73
4.~~cGr~ (;lfotP 2,084 1,241 843 1,159 806 353 Scheduled Castes populatlon ~M 1,534 841 693 802 576 226
oiF 550 400 150 357 230 127
5. ~ VI.,vtl~1I1 cGr ~ GlfotP 3,114 2,873 241 3,627 2,434 1,193 Scheduled Tribes population ~M 1,940 1,755 185 2,317 1,655 662
oiF 1,174 1,118 56 1,310 779 531
6.m~ O!TotP 11,848 7,153 4,695 6,367 3,844 2,523 Literates ~M 10,126 5,894 4,232 4,641 3,166 1,475
o/F 1,722 1,259 463 1,726 678 1,048
7. W"I <J>Ifi O!TotP 5,474 3,530 1,944 2,556 1,892 666 Tolal WOrkilrs ~M 4.979 3,142 1,837 2,159 1,608 551
o/F 495 388 107 399 284 115
(i)~ ~O/P 309 285 24 297 289 8 Cultivators tM 255 232 23 267 262 5
o/F 54 53 30 27 3
(ii)~~ cz:(O/P 399 373 26 339 301 38 Agricultural labourers tM 272 257 15 198 198
oiF 127 116 11 141 103 38
(iii) 41RqlRcti ~ ~ cz:(o!P 40 29 11 36 19 17 Household induslly workers ~ 20 11 9 26 13 13
blF 20 18 2 10 6 4
(iv) ~ 'ctiJff '6ll'o!P 4,726 2,843 1,883 1,886 1,283 603 Other workers ~M 4,432 2,642 1,790 1,668 1,135 533
ofF 294 201 93 218 148 70
8. <!Ie!ctilf<:lcti q;;ff Cl(olP 5,155 3,251 1,904 2,266 1,669 597 Main workers tM 4,823 3,016 1,807 1,998 1,469 529
blF 332 235 97 268 200 68
9. 3l<'4ctil~cti ~ ClIOIP 319 279 40 292 223 69 Marginal workers ~M 156 126 30 161 139 22
iJlF 163 153 10 131 84 47
lo.1R~ 'C2I'otP 9,675 6,197 3,478 5,934 3,640 2,294 Non-workers
~ 7,064 4,136 2,928 3,776 2,582 1,194 iJlF 2,611 2,061 550 2,158 1,058 1,100
275
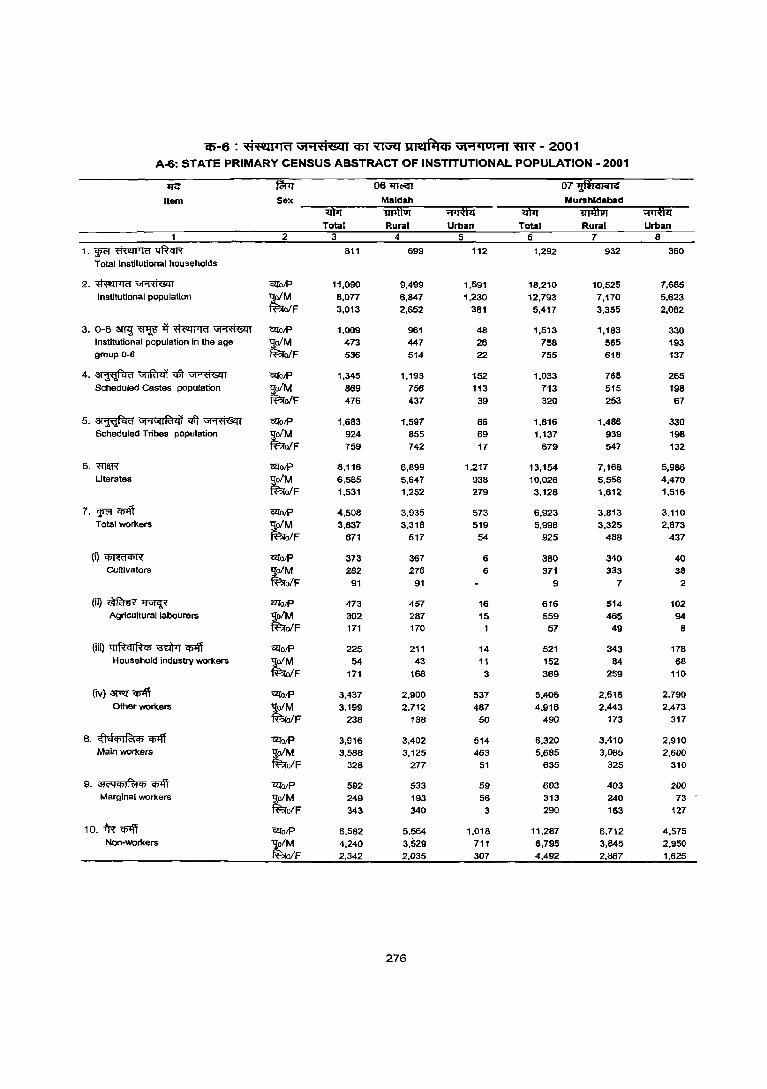
ifi-6 : 'fi~I~J(1 Gt"'tfl&ll C5T ~ lml~<b Gt""lil01""l1 ~ - 2001 A-6: STATE PRIMARY CENSUS ABSTRACT OF INSTITUTIONAL POPULATION - 2001
IJG fWr 06~ 071fild'''IG
Item Sex Maldah Murshldabad m'IT fuifiUi ~ m'IT 1iTifuIj ~
Total Rural Urban Total Rural Urban 1 2 3 4 5 6 7 8
1. wrr ~ tIftcrR 811 699 112 1,292 932 360 Total Institutional households
2.~~ wOJP 11,090 9,499 1,591 18,210 10,525 7,685 Institutional population tM 8,077 6,847 1,230 12,793 7,170 5,623
ofF 3,013 2,652 361 5,417 3,355 2,062
3. 0-6 3TT<l ~ ~ ~ ~ WolP 1,009 961 48 1,513 1,163 330 Institutional population In the age tM 473 447 26 756 565 193 group 0-6 ofF 536 514 22 755 618 137
4,~~qft~ l2:folP 1,345 1,193 152 1,033 768 265 SCheduled Castes population tM 869 756 113 713 515 198
olF 476 437 39 320 253 67
5, ~ Gf'1Gflia4'1 qlT ~ 'Ell'olP 1,683 1,597 86 1,816 1,488 330 Scheduled Tribes population ~M 924 855 69 1,137 939 198
ofF 759 742 17 679 547 132
6. "fITiff'{ 'ClIolP 8,116 6,899 1,217 13,154 7,168 5,986 Literates ;(M 6,585 5,647 938 10,026 5,556 4,470
ofF 1,531 1,252 279 3,128 1,612 1,516
7,~~ 'ClIo/P 4,508 3,935 573 6,923 3,813 3,110 Total workers ~M 3,837 3,318 519 5,998 3,325 2,673
olF 671 617 54 925 4B8 437
(i)~ CllolP 313 367 6 380 340 40 Cultivators ~M 282 276 6 371 333 38
ofF 91 91 9 7 2
(jj)~~ molP 473 457 16 616 614 102 Agricultu ral labourers tM 302 287 15 559 465 94
ofF 171 170 1 57 49 8
(iii) ql~ql~Cj) ~ 'Cj)1ff c;qolP 225 211 14 521 343 178 Household industry workers
~ 54 43 11 152 M 68 ofF 171 168 3 369 259 110
(iv)~~ c;qolP 3,437 2,900 537 5,406 2,616 2,790 Other workers
~ 3,199 2,712 487 4,916 2,443 2,473 IF 238 188 50 490 173 317
8, cftQClJlffilCIJ ~ <2:iOIP 3,916 3,402 514 6,320 3,410 2,910 Main workers tM 3,588 3,125 463 5,685 3,085 2,600
ofF 328 277 51 635 325 310
9, 3IC'4fPJR-IfP ~ c;qolP 592 533 59 603 403 200 Marginal workers tM 249 193 56 313 240 73
ofF 343 340 3 290 163 127
10, 1R~ O!:!olP 6,582 5,564 1,018 11,287 6,712 4,575 Non-workers tM 4,240 3,529 711 6,795 3,M5 2,950
ofF 2,342 2,035 307 4,492 2,867 1,625
276
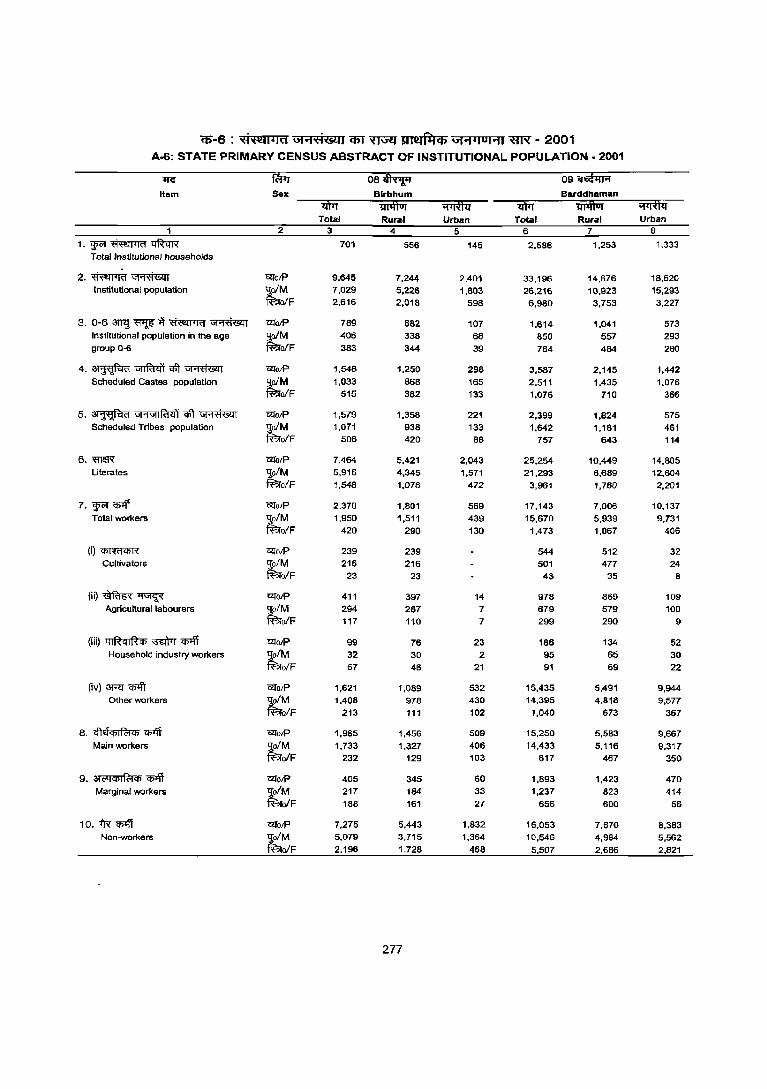
'$-6 : xtiMI11d Gt"'l-HiI5IlIl CJlT ~ ~ ",,"'1 4101"'11 ~ - 2001 A-6: STATE PRIMARY CENSUS ABSTRACT OF INSTITUTIONAL POPULATION· 2001
"If<:" 1Wr 08~ 09 ii$'IA Item Sex Blrbhum Barddhaman
'ijfIi iri1ffiJi ¥Tful 1ltlT iil1fiUT "'fl1'ffii Total Rural Urban Total Rural Urban
1 2 3 4 5 6 7 8
1.~~~ 701 556 145 2,586 1,253 1,333 Total Institutional households
2,~~ "&IorP 9,645 7,244 2,401 33,196 14,6-76 18,520 Institutional population tM 7,029 5,226 1,803 26,216 10,923 15,293
ofF 2,616 2,018 598 6,980 3,753 3,227
3. 0-6 3ITI;! ~ ~ ~ ~ C2forP 789 682 107 1,614 1,041 573 Institutional population in the age tM 406 338 68 850 557 293 group 0-6 ofF 383 344 39 764 484 280
4. ~ -;:;rrfmIT qfr ~ C2folP 1,548 1.250 298 3,587 2,145 1,442 Scheduled Castes population ~M 1,033 868 165 2,511 1,435 1,076
olF 515 382 133 1,076 710 366
5, ~ Vl'1VlIRtlOl) qft ~ C2fO/P 1,579 1,358 221 2,399 1,824 575 Scheduled Tribes population tM 1,071 938 133 1,642 1,181 461
olF 508 420 88 757 643 114
6, meR C2fO/P 7,464 5,421 2,043 25,254 10,449 14,805 Literates -qofM 5,916 4,345 1,571 21,293 8,689 12,604
~o/F 1,548 1,076 472 3,961 1,760 2,201
7. ~ q;<ff C2fO/P 2,370 1,801 569 17,143 7,006 10,137 Total workers tM 1,950 1,511 439 15,670 5,939 9,731
o/F 420 290 130 1,473 1,067 406
(i)~ C2fO/P 239 239 544 512 32 Cultivators -qo/M 216 216 501 477 24
~0/F 23 23 43 35 8
(ii)~~ lZI"O/P 411 397 14 978 869 109 Agricultural labourers -qo/M 294 287 7 679 579 100
~o/F 117 110 7 299 290 9
(iii) 4IRqIRij) ~ <I>'ff C2fO/P 99 76 23 186 134 52 Household industry worl<ers ~M 32 30 2 95 65 30
olF 67 46 21 91 69 22
(iv) 3RT q;<ff C2fO/P 1,621 1,089 532 15,435 5,491 9,944 Other workers ;(M 1,408 978 430 14,395 4,818 9,577
ofF 213 111 102 1,040 673 367
8. «"jElCbIR:i<J> ~ C2foIP 1,965 1,456 509 15,250 5,583 9,667 Main workers ~M 1,733 1,327 406 14,433 5,116 9,317
ofF 232 129 103 817 467 350
9, at6<lij)1R:i<J> cpiff C2forP 405 345 60 1,893 1,423 470 Marginal workers tM 217 184 33 1,237 823 414
ofF 188 161 27 656 600 56
10, iR cpiff C2forP 7,275 5,443 1,8-32 16,053 7,670 8,383 Non-workers
~ 5,079 3,715 1,364 10,546 4,984 5,562
ofF 2,196 1,728 468 5,507 2,686 2,821
277
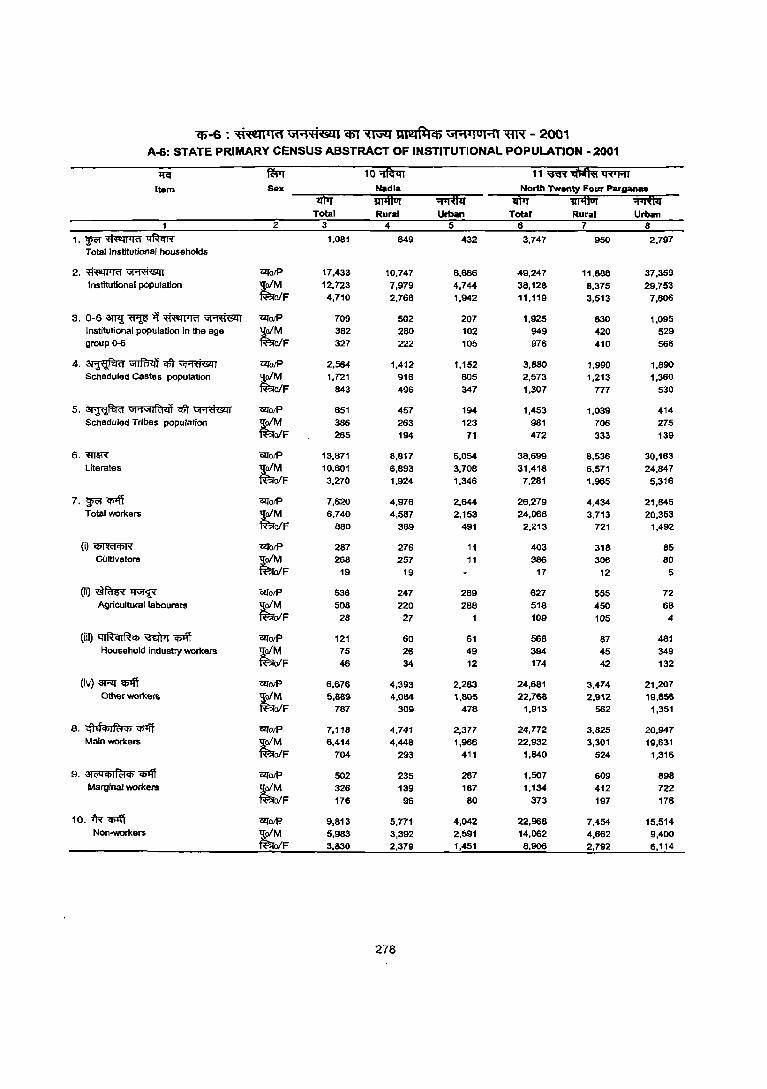
(1)-6 : ofl'{\!Wit1 GFHi&:n C6l ~ met~Cfi Gi'1t IUHI ~ - 200'1 A-6: STATE PRiMARY CENSUS ABSTRACT OF INSTITUTIONAL POPULATION - 2001
1{G fWI 10 "ih 11 \M{ ~ 'IA"'FIl
Item Sex Nadia North Twenty Four Paraan_ ifl'iT iiTiflUi ¥rtfii 1itiT ii1ftiJT ¥Tffii
Total Rural Urban Total Runal Ulinn 1 2 3 4 5 6 7 8
1.~~~ 1,081 649 432 3,747 950 2,797 Total Institutional households
2.~~ Gli"orP 17,433 10,747 6,686 49,247 11,688 37,359 Institutional population tM 12,723 7,979 4,744 38,128 8,375 29,753
ofF 4,710 2,768 1,942 11,119 3,513 7,606
3. 0-63lTll~'ij~~ Gli"orP 709 502 207 1,925 830 1,095 Institutional popUlation in the age tM 382 280 102 949 420 529 group Q-6 ofF 327 222 105 976 410 566
4.~~qlt~ Gli"orP 2,564 1,412 1,152 3,880 1,990 1,890 SCheduled Castes population tM 1,721 916 805 2,573 1,213 1,360
ofF 843 496 347 1,307 777 530
5. ~ Vj,"jVilRI<ii c5t~ Gli"orP 651 457 194 1,453 1,039 414 SCheduled Tribes population tM 386 263 123 981 706 275
ofF 265 194 71 472 333 139
6.~ WorP 13,871 8,817 5,054 38,699 8,536 30,163 Literates tM 10,601 6,893 3,708 31,418 6,571 24,847
ofF 3,270 1,924 1,346 7,281 1,965 5,316
7.~~ WorP 7,620 4.976 2,644 26,279 4,434 21,845 Total workers tM 6,740 4,587 2,153 24,066 3,713 20.353
ofF 880 389 491 2,213 721 1,492
(i)~ "i2lorP 287 276 11 403 318 85 CUltivators tM 268 257 11 386 306 80
ofF 19 19 17 12 5
(iQ~~ "i2lolf' 536 247 269 627 555 72 Agricultural labourers "9:oIM 508 220 268 518 450 68
iaoiF 28 27 1 109 105 4
(iiij ql~ql~CI> \ffi)Tr "<I>'ff urorP 121 60 61 568 87 481 Household Industry workers tM 75 26 49 394 45 349
ofF 46 34 12 174 42 132
(iv) ~ "<I>'ff uroiP 6,676 4,393 2,283 24.681 3,474 21,207 Otl\erworkelll ;tM 5,889 4,084 1,805 22,1158 2,912 19,856
ofF 787 309 478 1,913 562 1,351
8. ,{hfCfJ,fi:r '" q;1ff l2I'orP 7,118 4,741 2,377 24,772 3,825 20,947 Mainworl<ers tM 6,414 4,448 1,966 22,932 3,301 19,631
ofF 704 293 411 1,840 524 1,316
9. 31 r;;q CfJIh>1C1> "C!>lff C2l'orP 502 235 267 1,507 609 898 MarglnalllolOrkers ~M 326 139 187 1,134 412 722
ofF 176 95 80 373 191 176
1 o. 1R" <f>Iff "i2loiP 9,813 5,171 4,042 22,968 7,454 15,514 Non-l\'Ol1(ers
t~F 5,983 3,392 2,591 14,062 4,662 9,400 3,830 2.379 1,451 8,906 2,792 6,114
278
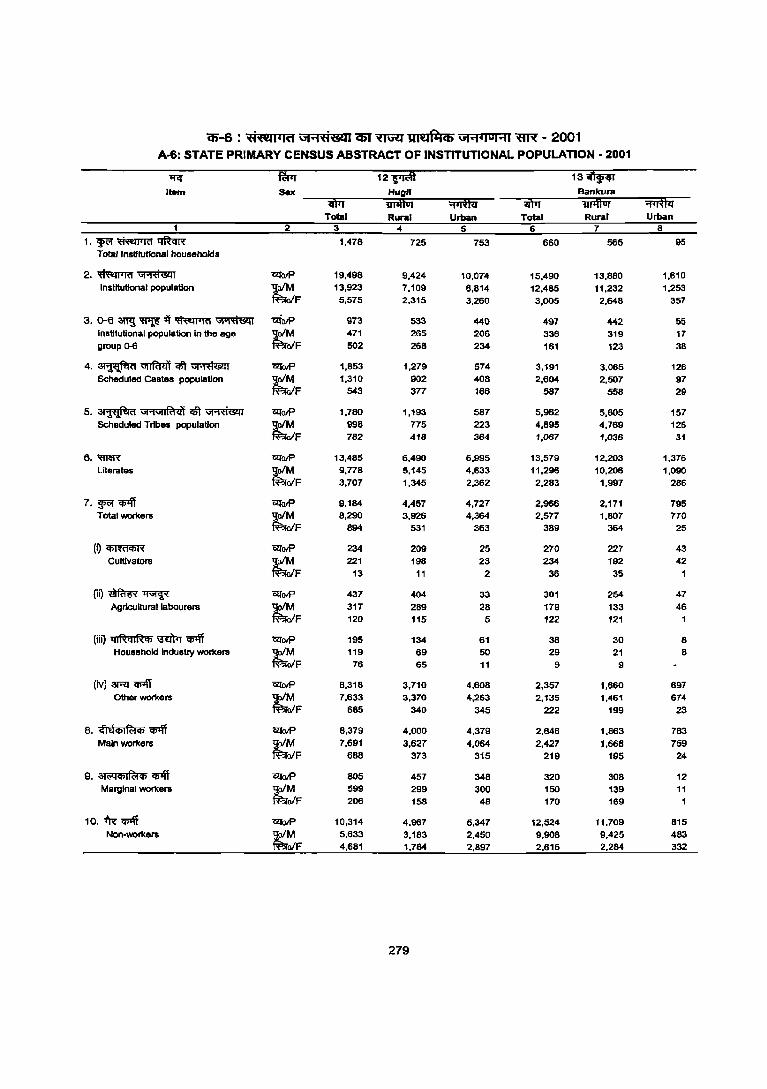
(5-6 : ;H'NIlild G .... I;H&l1 C6T ~ UllQfqC6 GI"'I4IUHI "flR - 2001 A-6: STATE PRIMARY CENSUS ABSTRACT OF INSTITUTIONAL POPULATION - 2001
'II<; fflPT 12 i1Ji4l 13~ I ..... Sex Hug" Bankura
"iIfij 1iT1ffUi <;;f11& "iIfij 1IliffiIi ¥I& Total Rural Urban Total Rural Urban
1 2 3 4 5 6 7 8
1. Ff ~ ttft1m 1,478 725 753 660 565 95 Total Instilutlonal oouseoolds
2,~~ ~OIP 19,498 9,424 10,074 15,490 13,880 1,610 Institutional population tM 13,923 7,109 6,814 12,485 11,232 1,253
oIF 5,575 2,315 3,260 3,005 2,648 357
3.O-63Wl~'l't~~ uTOIP 973 533 440 497 442 55 Institutional population in the age ~F
471 265 206 336 319 17 group Q-6 502 268 234 161 123 38
4.~~~~ ~olP 1,853 1,279 574 3.191 3,065 126 Scheduled castes population ~F
1,310 902 408 2,604 2,507 97 543 377 166 587 558 29
5. ~ iJi .. iJilfc!41 qft ~ 12IoIP 1,780 1,193 587 5,962 5,805 157 Scheduled Tribes population ~F 998 775 223 4.895 4,769 126
782 418 364 1,067 1,036 31
6.~ ~OIP 13,485 6,490 6,995 13,579 12,203 1,376 Literates ~F 9,778 5,145 4,633 11,296 10,206 1,090
3,707 1,345 2,362 2,283 1,997 286
7, ~ <!>Iff '&I'olP 9,184 4,457 4,727 2,966 2,171 795 Total workers ~F 8,290 3,926 4,364 2.577 1,807 770
894 531 363 389 364 25
(Q~ C2l'olP 234 209 25 270 227 43
Cultivators ~~F 221 198 23 234 192 42 13 11 2 38 35 1
(iQ~~ <;!JolP 437 404 33 301 254 47 Agrlculturallabourers ~F 317 289 28 179 133 46
120 115 5 122 121
(iiQ ql~ql~if) ~ <!>Iff l2I'olP 195 134 61 38 30 8 Hous"hold industry workers ~F 119 69 50 29 21 8
76 65 11 9 9
(ivJ 3T""lI" <!>Iff <;!JoIP 8,318 3,710 4,608 2.357 1,660 697 Other workers tM 7,633 3,370 4,263 2,135 1,461 674
oIF 685 340 345 222 199 23
8. <!hl4'i1 ~4'i <!>Iff 12IoIP 8,379 4,000 4,379 2,646 1,863 783 Malnwortcers ;tM 7,691 3.627 4,064 2,427 1,668 759
oIF 688 373 315 219 195 24
9, aI(iQif)I~if) ~ -ar0lP 805 457 348 320 308 12 Marginal workers tM 599 299 300 150 139 11
oIF 206 158 4B 170 169
10. ofR~ l2I'oIP 10,314 4,967 5,347 12,524 11,709 815 Non-workers ~
5,633 3,183 2,450 9,908 9.425 483 oIF 4,681 1,784 2,897 2,616 2,284 332
279
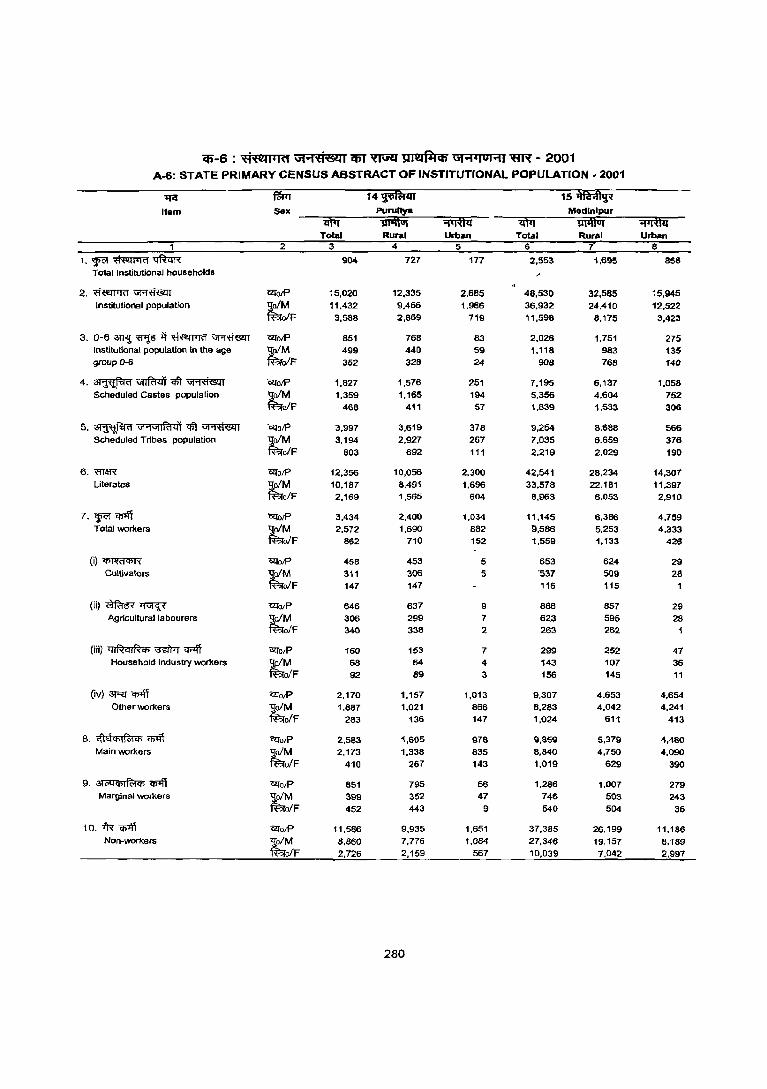
iJi-6 : ti'flllI'ld UI"1fl&:l1 iIiT 'U\Rl suedllCfi UI"1410 1"11 "flR - 2001 A-6: STATE PRIMARY CENSUS ABSTRACT OF INSTITUTIONAL POPULATION. 2001
~ fWT 14~ 15~ Item Sex Pun"~ Medlnlpur
iI't1i 1ififfiii ¥fijii lilii liii\til1 ~ Total Rural Urban Total Rural Urban
1 2 3 4 5 6 7 8
1.~mmrrn~ 904 727 177 2,553 1,695 858 Total Institutional households
2,~~ ClI'olP 15,020 12,335 2,685 48,530 32,585 15,945 Institutional population tM 11,432 9,466 1,966 36.932 24,410 12,522
oIF 3,588 2,869 719 11,598 8,175 3,423
3, 0-6~~it~~ ClI'olP 851 768 83 2,026 1,751 275 Institutional population in the age tM 499 440 59 1.118 983 135 groupO-S oIF 352 328 24 908 76B 140
4, ~ vntam qft ~ OlfolP 1,827 1,576 251 7,195 6,137 1,058 Scheduled Castes population tM 1.359 1,165 194 5.356 4,604 752
oIF 468 411 57 1,839 1,533 306
5. ~ \i1"1GtIRlq'j ~ ~ OlfotP 3.997 3,619 378 9,254 8,688 566 Scheduled Tribes population tM 3,194 2,927 267 7.035 6,659 376
elF 803 692 111 2,219 2,029 190
6. WIIff OlfolP 12,356 10,056 2,300 42,541 28,234 14,307 Literates ~ 10.187 8,491 1.696 33.578 22,181 11.397
olF 2.169 1,565 604 8,963 6,053 2,910
7. <g<;r ~ 'iZlorP 3.434 2,400 1,034 11,145 6,386 4,759 Total workers r 2.572 1,690 882 9,586 5,253 4,333
oIF 862 710 152 1,559 1,133 426
(i)~ 'iZloiP 458 453 5 653 624 29 Cultivators
~ 311 306 5 '537 509 28 oIF 147 147 116 115
(ii)~~ 'iZlDlP 646 637 9 886 857 29 Agricultural labourers tM 306 299 7 623 595 28
ofF 340 338 2 263 262 1
(iii) ql~ql~q; ~ 1'li'>ff 'iZlolP 160 153 7 299 252 47 HousehOld industry workers
~ 68 64 4 143 107 36 ofF 92 89 3 156 145 11
(iv) 3'Rl <i»lT ~o!P 2,170 1,157 1,013 9,307 4,653 4,654 Other workers tM 1,887 1,021 866 8,283 4,042 4,241
ofF 283 136 147 1,024 611 413
B. <f\th61 f<;j <Ii Cfi1ff '2ltolP 2,583 1,605 978 9,859 5,379 4,480 Main workers
~ 2,173 1,338 835 8,840 4,750 4,090 ofF 410 267 143 1,019 629 390
9. 31 (;Q q,1 fc;jq, 'q;ljf ~OIP 851 795 56 1.286 1,007 279 Marginal workers
~ 399 352 47 746 503 243 ofF 452 443 9 540 504 36
10. iR ri ~o!P 11,586 9,935 1,651 37.385 26,199 11,186 Non-workers
~ 8,860 7,776 1,084 27,346 19,157 B,189
iJlF 2,726 2,159 567 10,039 7,042 2,997
280
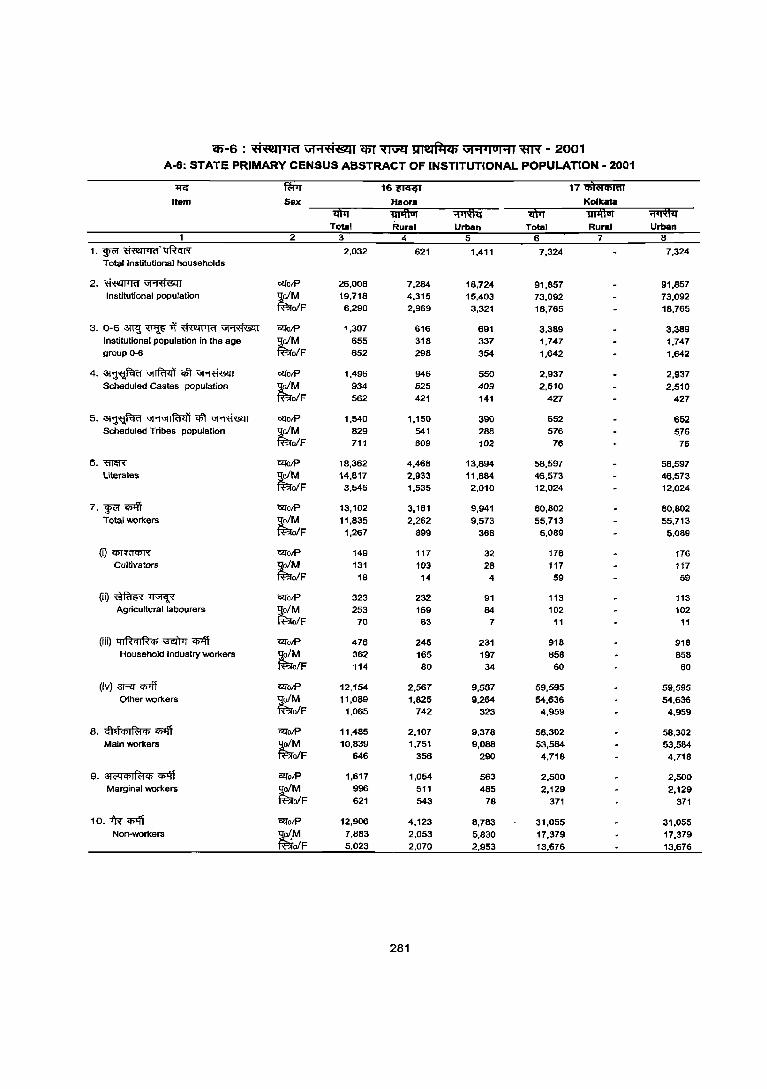
iP-6 : 't1'N113Id \i1"1't1&l1 q;y ~ ~maillq; GI"1 310HI ~ - 2001 A-6: STATE PRIMARY CENSUS ABSTRACT OF INSTITUTIONAL POPULATION - 2001
lfa' ffitT 16~ 17 Cl>161q;lnl
Item Sex Haor. Kolka ..
'ifi"IT 1iTi\tiii ¥Tffii 1ttI1 1i'i1ffUf =;:fiRfij
Total Rural Urban Total Rural Urban 1 2 3 4 5 6 7 8
1.~~·~ 2,032 621 1,411 7,324 7,324 TotailnsUtutlonal households
2,~~ WolP 26,008 7,284 18,724 91,857 91,857 InsUtutional population ~M 19,718 4,315 15,403 73,092 73,092
olF 6,290 2,969 3,321 18,765 18,765
3.0-63W.l~1'f~~ CZlolP 1,307 616 691 3,389 3,389 Institutional population in the age ~M 655 318 337 1,747 1,747 group 0-6 ofF 652 298 354 1,642 1,642
4.~~qft~ CZ[olP 1,496 946 550 2,937 2,937 Scheduled Castes population ~M 934 525 409 2,510 2,510
ofF 562 421 141 427 427
5. ~ "I'1"1IR14i qft ~ CZ[olP 1,540 1,150 390 652 652 Scheduled Tribes population tM 829 541 288 576 5.76
ofF 711 609 102 76 76
6.~ CQolP 18,362 4,468 13,894 58,597 58,597 Literates ~M 14,817 2,933 11,884 46,573 46,573
ofF 3,545 1,535 2,010 12,024 12,024
7. ~ q;#i CZfolP 13,102 3,161 9,941 60,802 60,802 Total workers ~M 11,835 2,262 9,573 55,713 55,713
ofF 1,267 899 368 5,089 5,089
(i)~ CZ[olP 149 117 32 176 176 CuIHvators tM 131 103 28 117 117
olF 18 14 4 59 59
(ii)~~ CZ[O/P 323 232 91 113 113 Agricultural labourers tM 253 169 84 102 102
ofF 70 63 7 11 11
(iii) ql~ql~i'fl ~ -q;;ff ClTolP 476 245 231 918 918 Household industry workers tM 362 165 197 858 858
olF 114 80 34 60 60
(iv) 3RI" q>1ff ClTolP 12,154 2,567 9,587 59,595 59,595 Other workers tM 11,089 1,825 9,264 54,636 54,636
ofF 1,065 742 323 4,959 4,959
8. <!hfct>1 ft;t '" q>1ff ClTolP 11,485 2,107 9,378 58,302 58,302 Main workers tM 10,839 1,751 9,088 53,584 53,584
ofF 646 356 290 4,718 4,718
9. ::>l<""li'fllffi", CJ>Iff ClTolP 1,617 1,054 563 2,500 2,500 Marginal workers tM 996 511 485 2,129 2,129
ofF 621 543 78 371 371
10. ~ <J>Iff ClfolP 12,906 4,123 8,783 31,055 31,055 Non-workers ~M 7,883 2,053 5,830 17,379 17,379
ofF 5,023 2,070 2,953 13,676 13,676
281
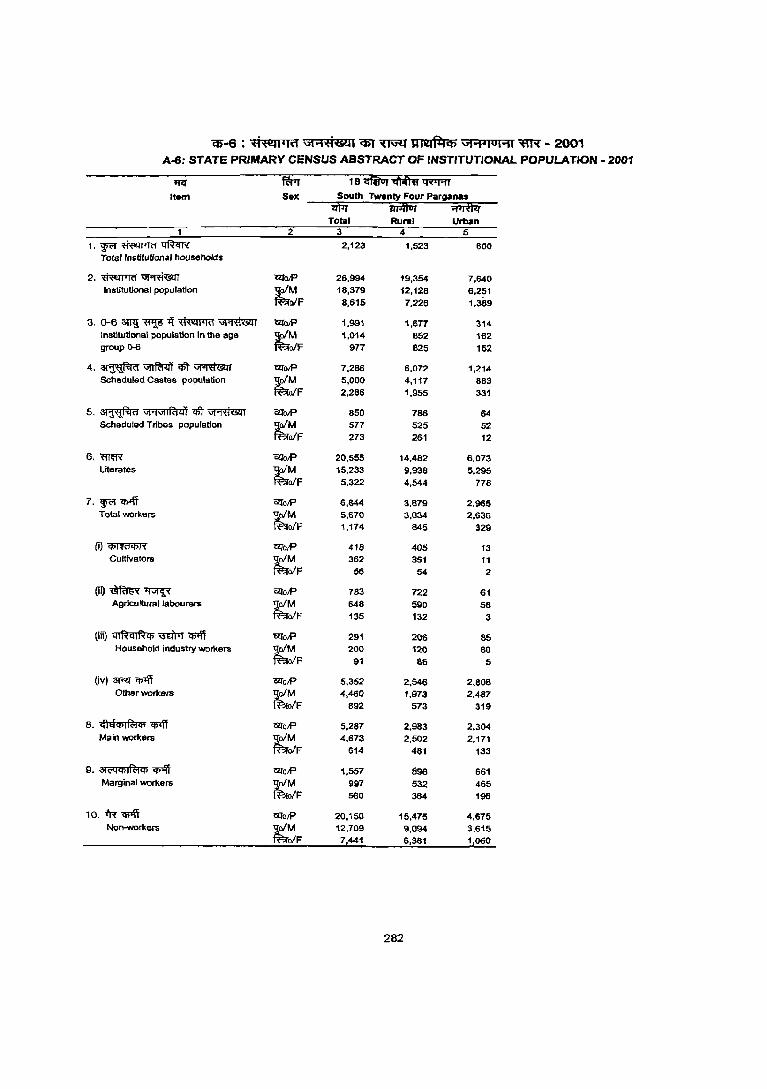
C5-6 : ifi'MI'm ut"'iifi&ll 'ifiT ~ UlItIIl'4Cf) ut .... lu' ... 1 ~ - 2001 A-6: STATE PRIMARY CENSUS ABSTRACT OF INSTITUTIONAL POPULATION - 2001
~ IWT 1 B iifitiir "Itf.ff.ii 'IRI'AT
Item Sax South Twenty Four Parganas 1ifu 1ilifl1ii iJlI1lii Total Rural Urban
1 2 3 4 5
l·Ff~~ 2,123 1,523 600 Total Institutional households
2.~~ <:!loiP 26,994 19,354 7,640 Institutional population tM 18,379 12,128 6,251
o/F 8,615 7,226 1,389
3. 0-6 3ml~-q~~ moiP 1,991 1,677 314 Institutional population In the age ~M 1,014 652 162 group ()-6 o/F 977 825 152
4,~~'CIlt~ CZl'oiP 7,286 6,072 1,214 Scheduled Castes population ;tM 5,000 4,117 863
ilIF 2,286 1,955 331
5, ~ \i!;NlIRt<ll 'CIlt ~ CZl'OJP 850 766 64 Scheduled Tribes population ;tM 577 525 52
ilIf 273 261 12
6. 'ffi'm CZl'oiP 20,555 14,482 6.073 Literates tM 15,233 9,938 5,295
ilIF 5,322 4,544 778
7, wa <P4T l2ToIP 6,844 3,879 2,965 Total worl<ers ~M 5,670 3,034 2,636
ofF 1,174 845 329
(j)~ ClTolP 418 405 13 Cultivators lJofM 362 351 11
~0/F 56 54 2
OQ~~ 'flI'o/P 783 722 61 Agricultural labourers
~ 648 590 58 oIF 135 132 3
(iii) ql~ql~Cf> -rnm ~ C2tolP 291 206 85 HousehOld industry workers ~M 200 120 80
oIF 91 B6 5
(Iv) 3RT <'I>'ft 'flI'olP 5,352 2,546 2,606 Other workers
~ 4,460 1,973 2,487 ofF 892 573 319
8. ~o:f<t>I~<t> Cf>1ff 'flI'olP 5,287 2,983 2,304 Main workers
t~F 4,673 2,502 2,171
614 481 133
9, 31('iq<t>I~<t>~ 'flI'alP 1,557 896 661 Marginal workers ~M 997 532 465
ofF 560 364 196
10. -IR~ CZl'oJP 20,150 15,475 4,675 Non-workers ~~F 12,709 9,094 3.615
7,441 6,381 1,000
282
tll~oft q;-7 : aa~ \11~1fit._clIl TABLE A-7 : HOUSELESS POPULATION

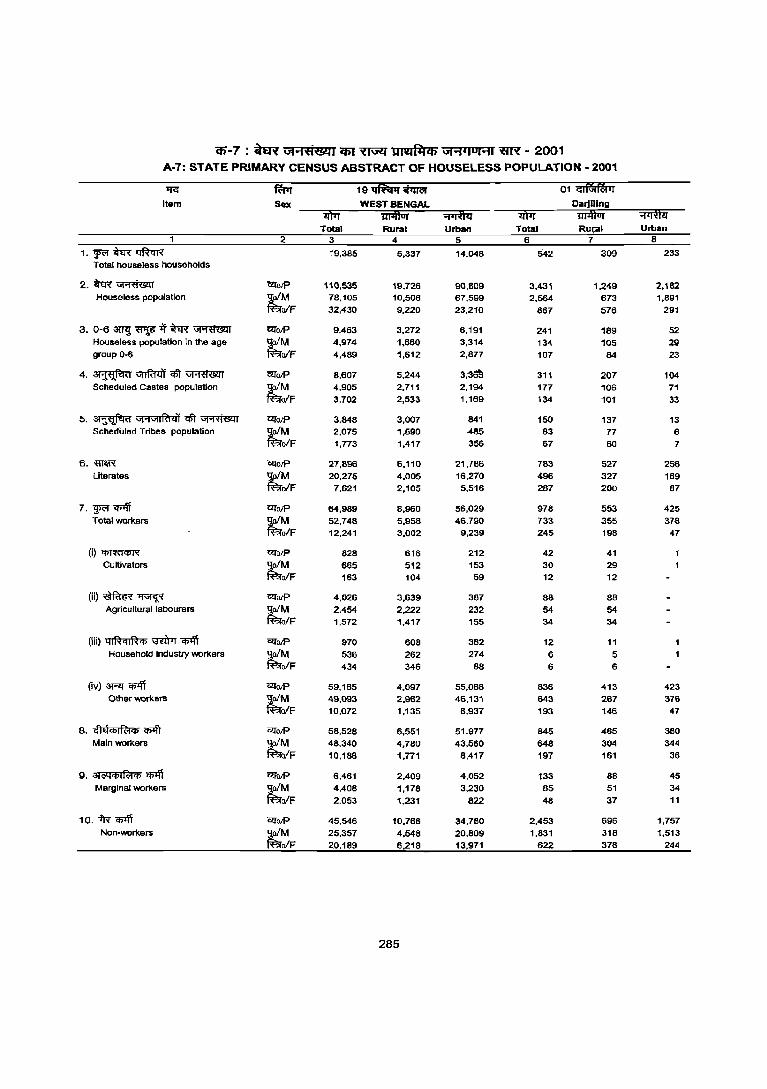
75-7 : W Uf"FHi8lIl i6I ~ Ulitfl!Cb Uf .... 4IUI"11 lIR - 2001 A-7: STATE PRIMARY CENSUS ABSTRACT OF HOUSELESS POPULATION - 2001
lJG ~ 19 1iffti'i ~ 01~ Item Sex WEST BENGAL Oarjlllng
liliI iiiiffiJi :;p:ffui liliI iiiiffiJi :;rirtfu Total Rural Urban Total RUJ;lII Urban
1 2 3 4 5 6 7 8
1. 'W<'f~~ 19.385 5.337 14.048 542 309 233 Total houseless households
2.~~ '&(olP 110.535 19,726 90.809 3,431 1,249 2.1B2 Houseless population r;M 78.105 10,506 67,599 2,564 673 1.891
OIF 32.430 9,220 23.210 867 576 291
3,O-6~~-if~~ t2TolP 9,463 3,272 6.191 241 189 52 Houseless population in the age tM 4,974 1,660 3,314 134 105 29 group 0-6 OIF 4,489 1,612 2,877 107 84 23
4. ~ 'V!Tfum qft ~ C2TolP 8,607 5,244 3,~a!3 311 207 104 Scheduled Castes population tM 4,905 2,711 2,194 177 106 71
OiF 3,702 2,533 1,169 134 101 33
5, ~ GI'1G1IRt<i'i <tt ~ Clfo/P 3,848 3,007 841 150 137 13 Scheduled Tribes population ~M 2.075 1,590 4a5 83 77 6
o/F 1.773 1,417 356 67 60 7
6.~ Clfo/P 27.896 6,110 21.786 783 527 256 Literates tM 20,275 4,005 16,270 496 327 169
oIF 7.621 2,105 5,516 287 200 87
7. 'W<'f 'if>Iff t2TolP 64,989 8,960 56,029 978 553 425 Total workers tM 52,746 5,958 46,790 733 355 378
o/F 12.241 3,002 9.239 245 198 47
(i)~ Clfo/P 828 616 212 42 41 Cultivators tM 665 512 153 30 29
o/F 163 104 59 12 12
(ii)~~ ClfolP 4.026 3,639 387 88 88 Agricultural labourers tM 2,454 2,222 232 54 54
oIF 1,572 1,417 155 34 34
(iii) ql~ql~'" ~ ~ C2folP 970 608 362 12 11 Household industry workers tM 536 262 274 6 5
oIF 434 346 88 6 6
(iv) 3RJ "<ii4T Clfo/P 59,165 4,097 55.068 836 413 423 Other workers tM 49.093 2,962 46.131 643 267 376
alF 10.072 1,135 8.937 193 146 47
8. "ld"'Ift:t", "<ii4T Clfo/P 58.528 6,551 51.977 845 465 380 Main workers tM 48.340 4,780 43.560 648 304 344
alF 10.188 1,771 8,417 197 161 36
9. 03it'<l"'I~",ri C2TolP 6.461 2,409 4.052 133 88 45 Marginal workers ~M 4.408 1,178 3.230 85 51 34
alF 2.053 1,231 822 48 37 11
10. iN ~ C2TolP 45.546 10,766 34.780 2,453 696 1,757 Non-workers tM 25.357 4,548 20.809 1,831 318 1,513
oIF 20.189 6,218 13.971 622 378 244
285
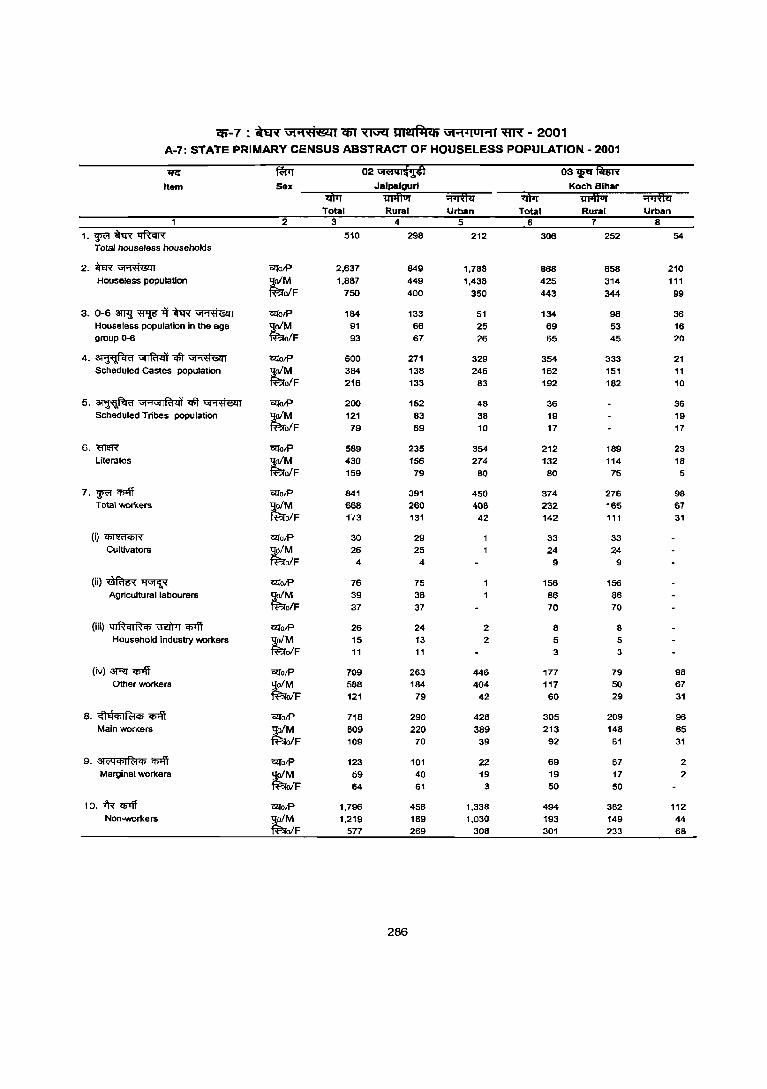
"i6-7 : ~ UfOO(it'i6lti <fiT ~ UI:a(ilC6 Gt .... 4IUi .... 1 ~ - 2001 A.7: STATE PRIMARY CENSUS ABSTRACT OF HOUSELESS POPULATION· 2001
~ ~ 02 \MjQl~it1 03 CJltr fiiWl Item Sex Jalpalgurl Koch Bihar
ijfij 'ii1iff1Ji ¥Tffii "lIliT iiPfiiIi ¥Tffii Total Rural Urban Total Rural Urban
2 3 4 5 6 7 8
1.w<"~~ 510 298 212 306 252 54 Total houseless households
2.~~ C2fotP 2,637 849 1,788 868 658 210 Houseless population tM 1,887 449 1,438 425 314 111
OfF 750 400 350 443 344 99
3. 0-63Wj~-q~~ OllotP 184 133 51 134 98 36 Houseless population In the age ~ 91 66 25 69 53 16 group 0-6 olF 93 67 26 65 45 20
4.~~CJfr~ C!iotP 600 271 329 354 333 21 Scheduled Castes population tM 384 138 246 162 151 11
OfF 216 133 83 192 182 10
5. ~ Gt1GtiR!<if CJfr ~ C!iotP 200 152 48 36 36 Scheduled Tribes population ~M 121 83 38 19 19
OfF 79 69 10 17 17
6. m&R C2fotP 589 235 354 212 189 23 Literates tM 430 156 274 132 114 18
OfF 159 79 80 80 75 5
7. ~ q;;jT C!iotP 841 391 450 374 276 98 Total worKers ~M 668 260 408 232 165 61
OfF 173 131 42 142 111 31
(i)~ C2fotP 30 29 33 33 Cultivators ~M 26 25 24 24
olF 4 4 9 9
(ii)~~ C2fo/P 76 75 156 156 Agricultural labourers ~ 39 38 86 86
olF 37 37 70 70
(iii) ql~ql~q> ~ "Cf>1ff C2fotP 26 24 2 8 8 Household industry workers ~M 15 13 2 5 5
ofF 11 11 3 3
(iv) 3RT "Cf>1ff C21"o/p 709 263 446 177 79 98 Other workers tM 588 184 404 117 50 67
OfF 121 79 42 60 29 31
8. <fttlCfllfclCfl ~ C21"otP 718 290 428 305 209 96 Main workers tM 609 220 389 213 148 65
ofF 109 70 39 92 61 31
9. 31<i<1CflIft1 Cfl "<Il'lT ClfotP 123 101 22 69 67 2 Marginal workers tM 59 40 19 19 17 2
ofF 64 61 3 50 50
10. *< q;;jT C21"otP 1.796 458 1.338 494 382 112 Non-WOrKers tM 1,219 189 1,030 193 149 44
ofF 577 269 308 301 233 68
286
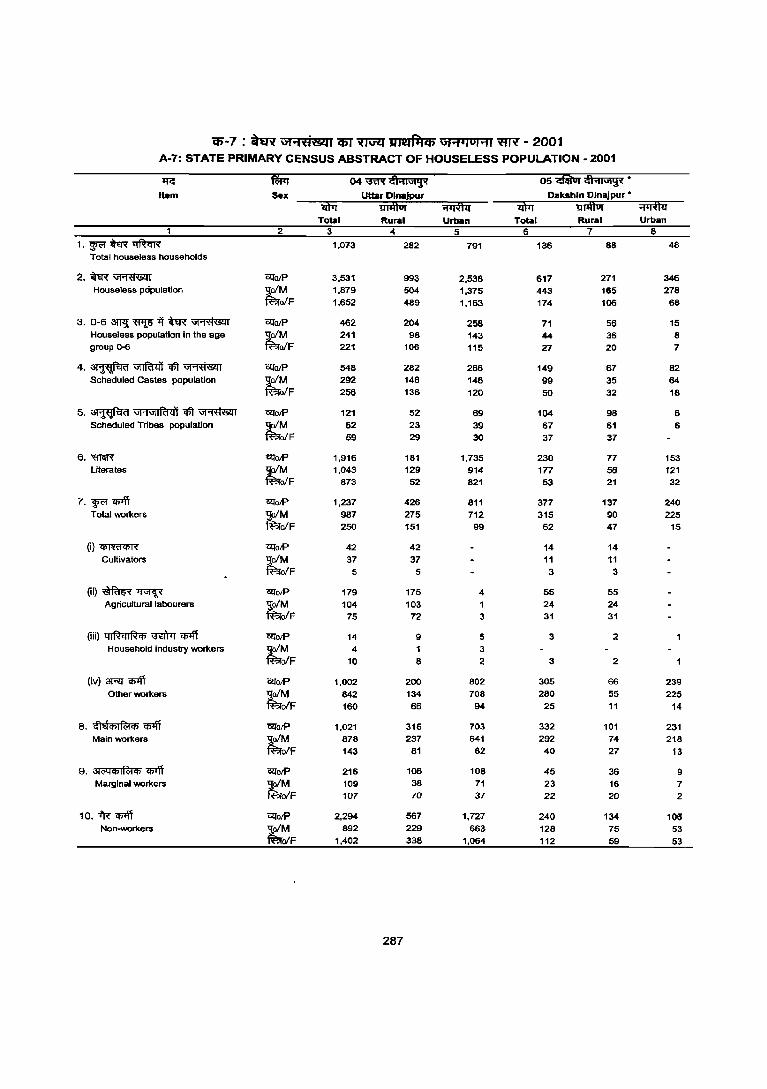
ffi-7 : ~ \'iI9f'<1MI i5T ~ Ultlfqq; Gf9f1 jOHI ~ - 2001 A-7: STATE PRIMARY CENSUS ABSTRACT OF HOUSELESS POPULATION - 2001
Zfi':' ft!Fr 04~~ 05 'iifiDi' ~ • Item Sex Uttar DlnaJpur Dakshln DlnaJpur·
"Q)ii 1riiffVi ;riI#Ii miT 1i1iftUi <;fiTfui Total Rural Urban Total Rural Urban
1 2 3 4 5 6 7 8 1.~~~ 1,07'3 282 791 136 88 48
Total houseless households
2.~~ 'i2l'0IP 3,531 993 2,538 617 271 346 Houseless population tM 1,879 504 1,375 443 165 278
'o/F 1,652 489 1,163 174 106 68
3.0-6~~-ijffi~ Gll'0IP 462 204 258 71 56 15 Houseless population in the age tM 241 98 143 44 36 8 group Q-6 'o/F 221 106 115 ZT 20 7
4.~~qft~ Gll'0IP 548 282 266 149 67 82 Scheduled Castes population tM 292 146 146 99 35 64
'o/F 256 136 120 50 32 18
5. ~ "I;1'l1l~41 qft ~ 'i2l'otP 121 52 69 104 9B 6 Scheduled Tribes population tM 62 23 39 67 61 6
'o/F 59 29 30 37 37
6. 'ffI1IR <lfotP 1,916 181 1,735 230 77 153 Literates tM 1,043 129 914 177 56 121
'o/F 873 52 821 53 21 32
7. $lc'I <I>'ff OQ'otP 1,237 426 811 377 137 240 Tolal workers tM 987 275 712 315 90 225
'o/F 250 151 99 62 47 15
(i)~ <lfotP 42 42 14 14 Cultivators tM 37 37 11 11
ofF 5 5 3 3
(ii)~~ OQ'O/P 179 175 4 55 55 Agricultural labourers tM 104 103 1 24 24
ofF 75 72 3 31 31
Qii) qIRql~q> ~ ~ ClTotP 14 9 5 3 2 Household industry workers tM 4 1 3
'o/F 10 8 2 3 2
(Iv) 3RT <I>'ff ClTotP 1,002 200 B02 305 66 239 Other workers tM 842 134 708 280 55 225
olF 160 66 94 25 11 14
8. Gldq>I~q> q;1jl ClTolP 1.021 318 703 332 101 231 Main workers tM 878 237 641 292 74 21B
'o/F 143 81 62 40 27 13
9. 31<"44?Ifc;t4? <I>'ff OUolP 216 108 108 45 36 9 Marginal workers tM 109 38 71 23 16 7
oiF 107 70 37 22 20 2
1 O. i'R q;1jl 'i2l'olP 2,294 567 1,727 240 134 106 Non-workers ~
892 229 663 128 75 53 ofF 1,402 338 1,064 112 59 53
287
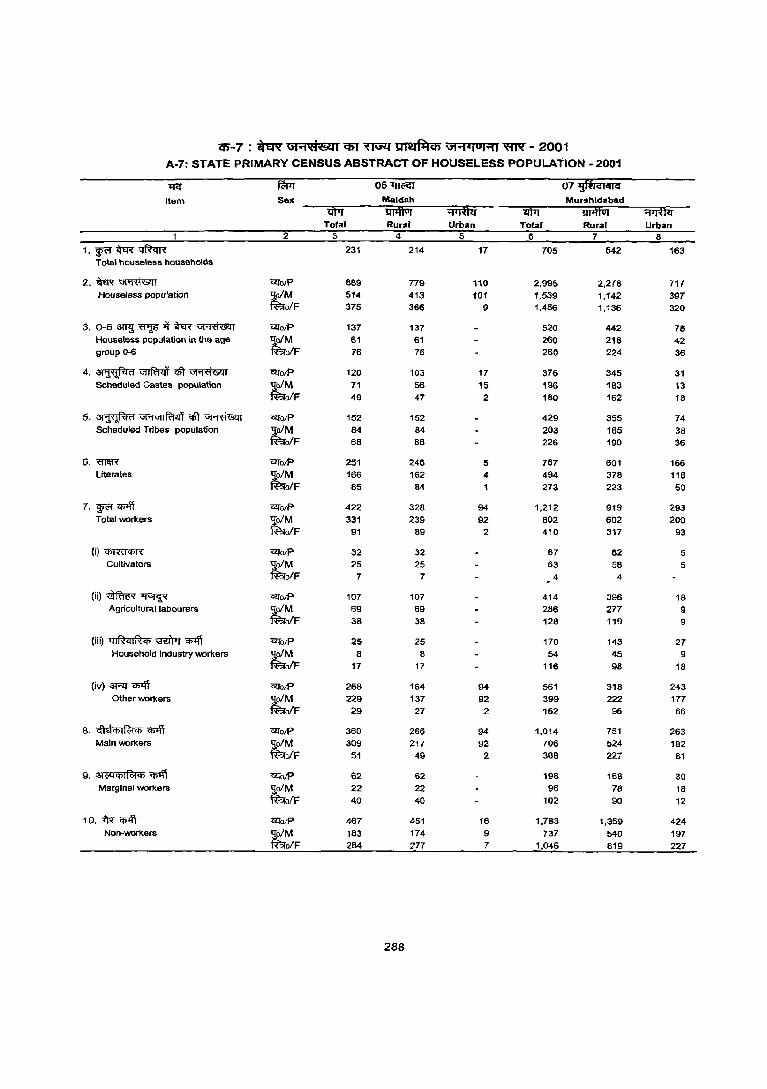
Cfi-7 : ~ Gt"1I('j'<!ltl1 q;r ~ Jfm~q) \11"'1:01 0 1'11 ~ - 2001 A-7: STATE PRIMARY CENSUS ABSTRACT OF HOUSELESS POPULATION - 2001
"I<:' ~ 06~ 07 ij!t1C:liUC;
Item Salt Maldah Murshldabad
iW1 liTiffiii ¥fffii 1M 1WffOi ¥fffii Total Rural Urban Total Rural Urban
2 :> 4 5 6 7 8
1.gR'f~~ 231 214 17 705 542 163 Total houseless households
2.~~ Cll"olP 889 779 110 2.995 2.278 717 Houseless population tM 514 413 101 1.539 1.142 397
o/F 375 366 9 1.456 1.136 320
3. 0-6amj~il~~ Cll"olP 137 137 520 442 78 Houseless population in the age tM 61 61 280 218 42 group 0-6 oIF 76 76 260 224 36
4.~~qIT~ Cll"otP 120 103 17 376 345 31 Scheduled Castes population tM 71 56 15 196 183 13
olF 49 47 2 180 162 18
5. ~ V1"1V1IRi<ll <!IT ~ Cll"otP 152 152 429 355 74 Scheduled Tribes population tM 84 84 203 165 38
olF 68 68 226 190 36
6. mt\R Cll"o/P 251 246 5 767 601 166 Literates tM 166 162 4 494 378 116
oIF 85 84 1 273 223 50
7. ¥f <n4T Cll"orP 422 328 94 1.212 919 293 Total workers tM 331 239 92 802 602 200
olF 91 89 2 410 317 93
(i)~ Cll"orP 32 32 67 62 5 Cultivators ~oIM 25 25 63 58 5
~oIF 7 7 4 4
(ii)~~ Cll"otP 107 107 414 396 18 Agricultural labourers ~o/M 69 69 286 277 9
~oIF 38 38 128 119 9
(iii) qIR4IR4> ~ q;off Cll"otP 25 25 170 143 27 Household industry workers tM 8 B 54 45 9
oIF 17 17 116 98 18
(iv) aR q;>ff Cll"otP 258 164 94 561 318 243 Other workers tM 229 137 92 399 222 177
oIF 29 27 2 162 96 66
8. ('ndCl>I~if) cmff Cll"otP 360 266 94 1,014 751 263 Main workers ~M 309 217 92 706 524 182
ofF 51 49 2 308 227 81
9. 31;:;t1ij)I~4> ~ Cll"oiP 62 62 198 168 30 Mar9inal workers jtM 22 22 96 78 18
ofF 40 40 102 90 12
1 O. i'R" Cf>lfi Cll"otP 467 451 16 1,783 1,359 424 Non-workers tM 183 174 9 737 540 197
olF 284 277 7 1,046 819 227
288
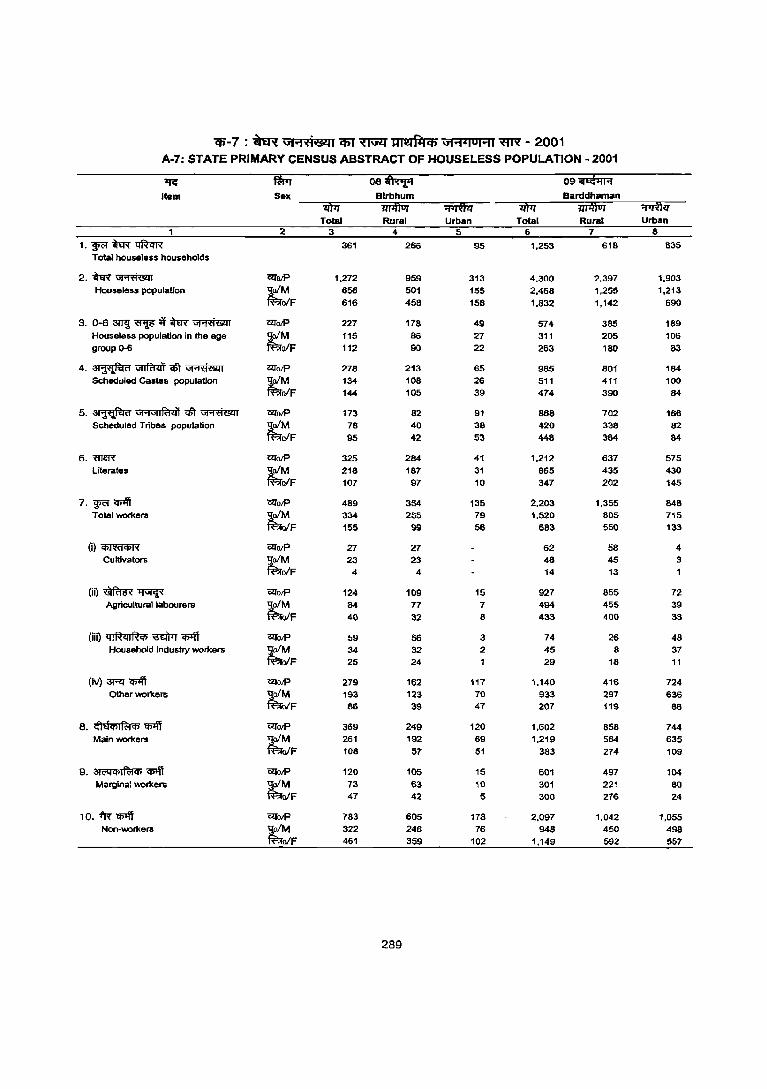
?6-7 : ~ \i1'1;;H641 CfiT ~ lITiailiCb \iI..,..loHI ~ - 2001 A-7: STATE PRIMARY CENSUS ABSTRACT OF HOUSELESS POPULATION - 2001
1JC:' ~ 08~ 09a1i'R
Item Sex Blrbhum Barddhllman
iItii liTifi1ii ili'I'& il)"iI fuiffiJj "iflifui Total Rural Urban Total Rural Urban
1 2 3 4 5 6 7 &
l·FJteR~ 361 266 95 1.253 618 635 Total houseless households
2.teR~ Q!J"olP 1,272 959 313 4,300 2.397 1,903 Houseless population tM 656 501 155 2.468 1,255 1,213
oIF 616 458 158 1.832 1,142 690
3. 0-6 ~~;'f<feR~ Q!J"olP 227 178 49 574 385 189 Houseless population In the age tM 115 88 27 311 205 106 group 0-6 oIF 112 90 22 263 180 83
4.~~cSt~ -WolP 278 213 65 985 801 184 Scheduled Castell population ;tM 134 108 26 511 411 100
ofF 144 105 39 474 390 84
5. ~ VI;:NlIR'I<i'i cSt ~ CZlolP 173 82 91 868 702 166 Scheduled Tribes population r;;M 78 40 38 420 338 82
oIF 95 42 53 448 364 84
6.mm -WolP 325 284 41 1.212 637 575 Literates tM 218 187 31 865 435 430
ofF 107 97 10 347 202 145
7. ~ <i>lfi Q!J"olP 489 354 135 2,203 1,355 848 Totel wor1<ers tM 334 255 79 1,520 805 715
oIF 155 99 66 683 550 133
(i)~ C2Jo/p 27 27 62 58 4 Cultivators ~M 23 23 48 45 3
o/F 4 4 14 13
(ii)~~ C2JolP 124 109 15 927 &55 72 Agricultural labourers
~F 84 77 7 494 455 39 40 32 & 433 400 33
(iiO ql~ql~qs ~ q;>ff -arolP 59 56 3 74 26 48 Household industry wor1<ers tM 34 32 2 45 8 37
oIF 25 24 1 29 18 11
(iv) ~ <i>lfi C2JolP 279 162 117 1,140 416 724 Other wor1<ers ~F 193 123 70 933 297 636
B6 39 47 207 119 B8
8. cfI Efqs I R:t qs 'C#1ff 12TolP 369 249 120 1,602 858 744 Mainwor1<ers ~F 261 192 69 1,219 584 635
108 57 51 383 274 109
9. 3!CQqslf<it<J) cplff C2JolP 120 105 15 601 497 104 Marginal wor1<ers ~F 73 63 10 301 221 80
47 42 5 300 276 24
1 o. 1'R cplff G!JO/P 783 605 178 2,097 1,042 1,055 Non-wor1<ers tM 322 246 76 948 450 498
oIF 461 359 102 1,149 592 557
289
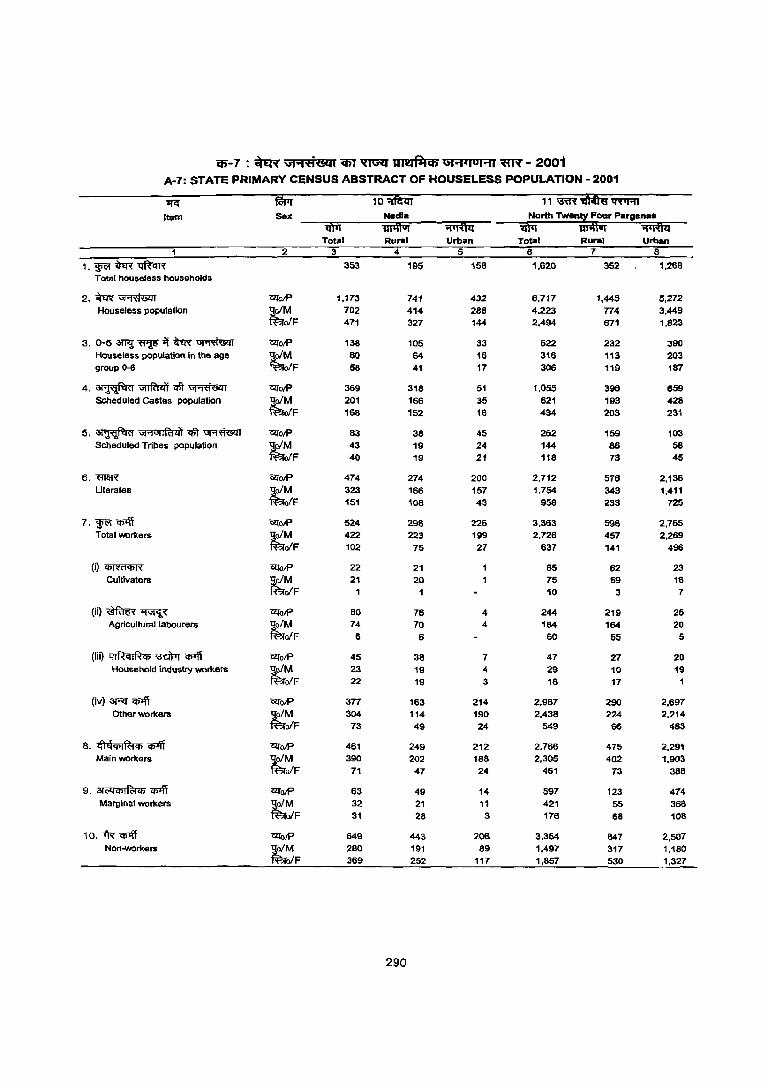
iff-7 : ~ Gt",'ti&il C5T ~ DRJiltCb GtOJj'lul",r ~ - 2001 A-7: STATE PRIMARY CENSUS ABSTRACT OF HOUSELESS POPULATION - 2001
~ ~ 10~ 11 ~'dm'ii~ It.m Sex Nadia North Twanty Four Pargan ••
iftiT iiTifl1IT ¥ri1ii 1rtiT iri1\11it ¥iffii ToUI Rural Urban ToUl Rural Urban
1 2 3 4 5 6 7 B
1.~~~ 353 195 158 1,620 352 1,26B Total houseless households
2.~~ 1ZToIP 1,173 741 432 6,717 1,445 5,272 Houseless population tM 702 414 288 4,223 774 3.449
ofF 471 327 144 2.494 671 1.823
3. 0-6amJ~it~~ 12fotP 138 105 33 622 232 390 Houseless population In the age ~F 80 64 16 316 113 203 group 0-6 58 41 17 306 119 187
4.~~~~ 12fotP 369 316 51 1,055 396 659 Scheduled Castes population tM 201 166 35 621 193 428
ofF 168 152 16 434 203 231
5. ~ GI.,""IRlzi'i qff ~ OIlotP 83 38 45 262 159 103 Scheduled Tribes population t~F 43 19 24 144 86 58
40 19 21 118 73 45
6.m~ OIlotP 474 274 200 2,712 576 2.136 Uterates tM 323 166 157 1.754 343 1.411
ofF 151 108 43 958 233 725
7. wa 'I>'ff OIlQIP 524 29B 226 3.363 59B 2,765 Total workers tM 422 223 199 2,726 457 2,269
ofF 102 75 27 637 141 496
(i)~ OIlolP 22 21 85 62 23 Cultivators tM 21 20 75 59 16
ofF 10 3 7
(iO~~ OIlotP BO 76 4 244 219 25 Agricultur:al labourers tM 74 70 4 184 164 20
ofF 6 6 60 55 5
(iii) ql~qlRCI> ~ <I>'lt l2fotP 45 38 7 47 27 20 Household industry workers tM 23 19 4 29 10 19
ofF 22 19 3 18 17
(iv) 3Rt q;lff l2fotP 377 163 214 2,987 290 2.697 Other workers tM 304 114 190 2.438 224 2.214
ofF 73 49 24 549 66 483
8. e.'l qCl>IRoiCl> Cfi1\1 12folP 461 249 212 2.766 475 2.291 Main workers tM 390 202 188 2,305 402 1.903
o/F 71 47 24 461 73 388
9. 31('qCl>IR>!CI> cpJff 12fotP 63 49 14 597 123 474 Marginal worners
~F 32 21 11 421 55 366 31 28 3 176 68 108
1 O. *< CJl1ff <;qolP 649 443 206 3,354 847 2,507 Non.......:>rkers ~M 280 191 89 1,497 317 1,180
o/F 369 252 117 1,857 530 1,327
290
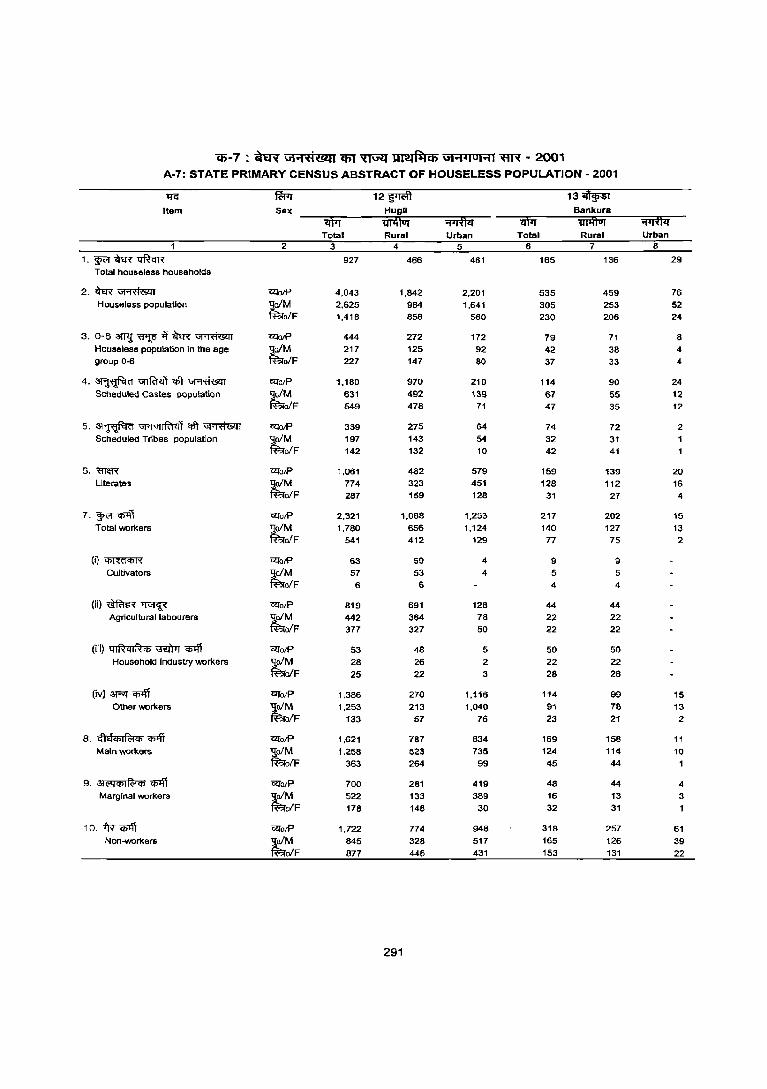
Cfi-7 : "ffi \11"1'ti'&l1 CfiI ~ ~ \)1"1-1 0 1"11 ~ - 2001 A·7: STATE PRIMARY CENSUS ABSTRACT OF HOUSELESS POPULATION - 2001
lre fWr 12~ 13~ Item Sex Hugll Bankura
iI)iT 1iT4t1ii "=iiTffii 'liM 1iJiffiIT mt# Total Rural Urban Total Rural Urban
1 2 3 4 5 6 7 8
1.~ffi~ 927 466 461 165 136 29
Total houseless households
2.~~ <2:iolP 4,043 1,842 2,201 535 459 76 Housftless population tM 2,625 984 1,641 305 253 52
ofF 1,418 858 560 230 206 24
3. 0-6 3TT<l ~ if ~ ~ ~oJP 444 272 172 79 71 8 Houseless population in the age tM 217 125 92 42 38 4 group 0--6 ofF 227 147 80 37 33 4
4.~~qft~ ~a/P 1,180 970 210 114 90 24
Scheduled Castes population tM 631 492 139 67 55 12 ofF 549 478 71 47 35 12
5. ~ GJ"1GJIRt41 ql't ~ ~o/p 339 275 64 74 72 2 Scheduled Tribes population ~M 197 143 54 32 31
ofF 142 132 10 42 41
6,m~ CZ<o/p 1,061 482 579 159 139 20 Literates ~M 774 323 451 128 112 16
ofF 287 159 128 31 27 4
7. ~ q;+\1 CZ<otP 2,321 1,068 1,253 217 202 15 Total workers ~ofM 1,780 656 1,124 140 127 13
fBiolF 541 412 129 77 75 2
(i)~ CZ<OIP 63 59 4 9 9 Cultivators tM 57 53 4 5 5
ofF 6 6 4 4
(ii)~~ CZ<a/P 819 691 128 44 44
Agricultural labourers ~M 442 364 78 22 22 ofF 377 327 50 22 22
(ill) 4IRqIRCj) \ffiTrr CI>Iff cz<otP 53 48 5 50 50 Household Industry workers tM 28 26 2 22 22
ofF 25 22 3 28 28
(iv) 3r-'lJ m CZ<O/P 1,386 270 1,116 114 99 15 Other workers ~ 1,253 213 1,040 91 78 13
olF 133 57 76 23 21 2
8. ,fhlCj)If<:iCj) 'Cj)lff cz<oJP 1,621 787 834 169 158 11
Main workers ~ 1,258 523 735 124 114 10 IF 363 264 99 45 44
9. 3l<i<lCj)If<:1Cj) 'Cj)lff OlTo/P 700 281 419 48 44 4 Marginal workers
~ 522 133 389 16 13 3 D/F 178 148 30 32 31 1
1 o. iN' CI>Iff OlTolP 1,722 774 948 318 257 61 Non--workers ~ 845 326 517 165 126 39
ofF 877 446 431 153 131 22
291
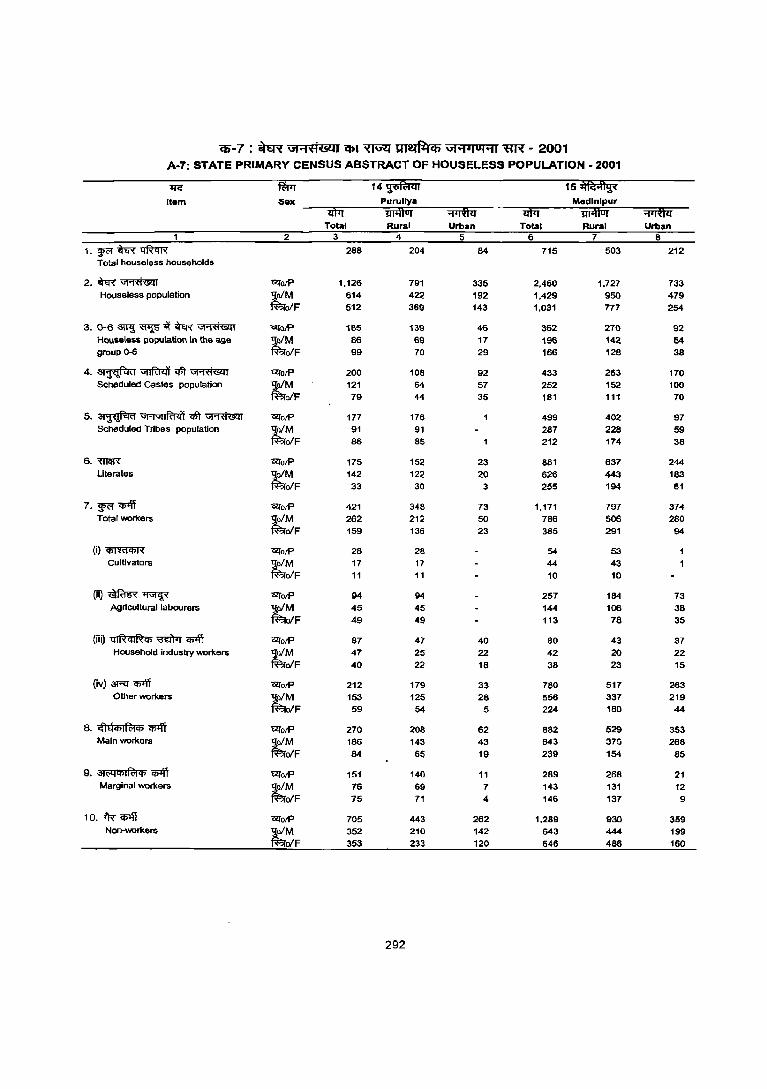
Cfi-7 : chff Gi"'f'ff(5q1 CfjJ ~ ur\!l~q) Gi"'t1IOI"'f1 '«R - 2001 A-7: STATE PRIMARY CENSUS ABSTRACT OF HOUSELESS POPULATION - 2001
~ ~ 14 iJiih 15~ Item 5ex Purullya Medlnlpur
iiF1 WffiJT ~ lJlTI ii1lffUi ~ Total Rural Urban Total Rural Urban
1 2 3 4 5 6 7 8 1. W<'fffi~ 288 204 84 715 503 212
Total houseless households
2.ffi~ <2folP 1,126 791 335 2,460 1,727 733 Houseless population tM 614 422 192 1,429 950 479
blF 512 369 143 1,031 777 254
3. 0-6'3Wl~~~~ "UfoiP 185 139 46 362 270 92 Houseless population In the age tM 86 69 17 196 142 54 group 0-6 oIF 99 70 29 166 128 38
4.~~~~ 12fo/P 200 108 92 433 263 170 Scheduled Castes population tM 121 64 57 252 152 100
blF 79 44 35 181 111 70
5. ~ G19G11R141 <Gt ~ 12foiP 177 176 499 402 97 Scheduled Tribes population tM 91 91 287 228 59
oIF 86 85 212 174 38
6.~ "12folP 175 152 23 881 637 244 Literates tM 142 122 20 626 443 183
oIF 33 30 3 255 194 61
7. ~ CI>lff c;!JotP 421 348 73 1,171 797 374 Total workers tM 262 212 50 786 506 280
oIF 159 136 23 385 291 94
(i)~ "12fotP 28 28 54 53 Cultivators tM 17 17 44 43
oIF 11 11 10 10
(ii)~~ "12folP 94 94 257 184 73 Agricultural labourers tM 45 45 144 106 38
blF 49 49 113 78 35
(iii) ql~cll~'Il ~ CI>lff 12folP 87 47 40 80 43 37 Household industry workers tM 47 25 22 42 20 22
oIF 40 22 18 38 23 15
(iv) 3Rl ~ "12folP 212 179 33 780 517 263 Other workers tM 153 125 28 556 337 219
blF 59 54 5 224 180 44
8. cflEfij)IR:tCl> q;1fi "O!folP 270 208 62 882 529 353 Main workers tM 186 143 43 643 375 268
oIF 84 65 19 239 154 85
9, 3IWCf>IR:t'll ~ "O!folP 151 140 11 289 268 21 Marginal workers ~M 76 69 7 143 131 12
oIF 75 71 4 146 137 9
10. -fR ~ "O!folP 705 443 262 1,289 930 359 Non-workers tM 352 210 142 643 444 199
blF 353 233 120 646 486 160
292
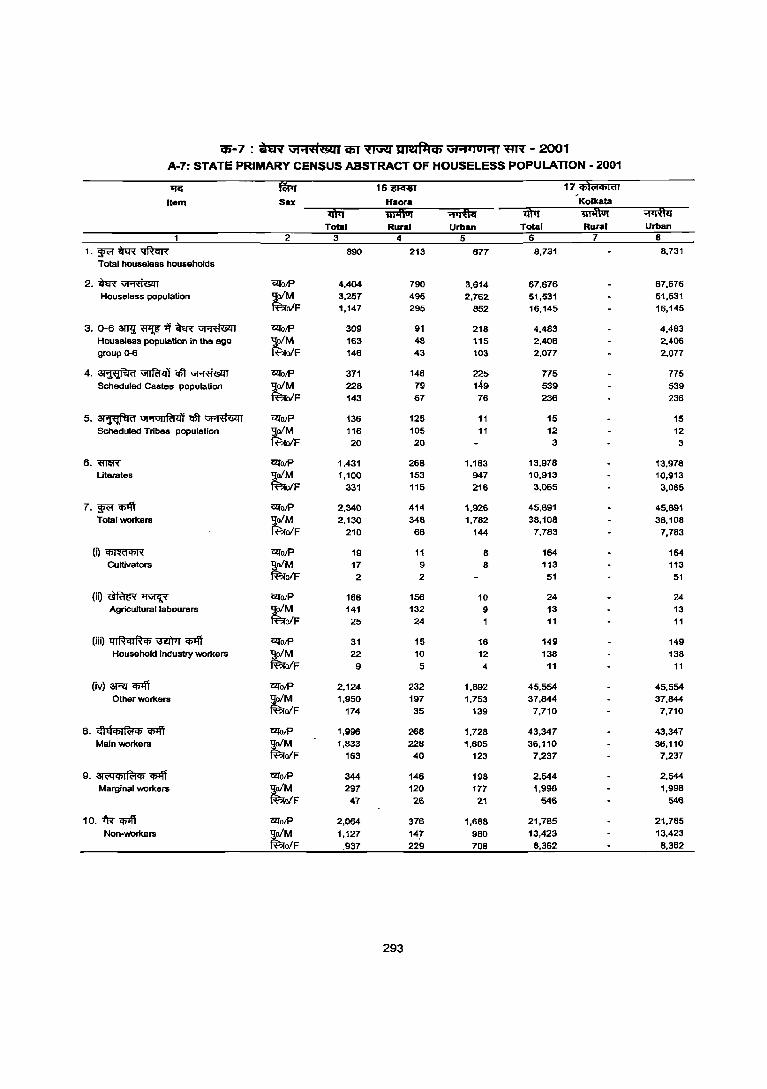
?Ii-7 : ~ \Ji ... 'fi&ll 'iJiT ~ Ur.alliCb vt .... jOI ... r ~ - 2001
A-7: STATE PRIMARY CENSUS ABSTRACT OF HOUSELESS POPULATION - 2001
1JCf fWr 16~ 17 4»(iiq;I<l1 ,
Item Sex Heora Kolkata
1fiiT 1ri1ffiii "iii& lltil "miffiii ~ Total Rural Urban Total Rural Urban
1 2 3 4 5 6 7 8
1. ~~-qfum- 890 213 677 8,731 8,731
Total houseless households
2. ~WRRsm CZlolP 4.404 790 3.614 67.676 67.676 Houseless population tM 3,257 495 2.762 51,531 51,531
oIF 1,147 295 852 16,145 16,145
3. 0-63!P1~ifW~ CZlolP 309 91 218 4,483 4.483 Houseless population in thE> age ~F 163 48 115 2,406 2,406 group 0-6 146 43 103 2,077 2,077
4.~~qfi~ CZlolP 371 146 225 775 775 Scheduled Castes population tM 228 79 149 539 539
oIF 143 67 76 236 236
5. ~ ijj.NlI~<fl ctt ~ CZlo/P 136 125 11 15 15 Scheduled Tribes population tM 116 105 11 12 12
oIF 20 20 3 3
6.~ CZlolP 1,431 268 1.163 13.978 13.978 Literates ~M 1,100 153 947 10,913 10,913
oIF 331 115 216 3,065 3,065
7.~~ CZlolP 2,340 414 1.926 45.891 45.891 Total woriters ~M 2,130 348 1,782 38,108 38,108
oIF 210 66 144 7,783 7,783
(i)~ CZlo/P 19 11 8 164 164 Cultivators ~M 17 9 8 113 113
o/F 2 2 51 51
(iO~~ CZlo/P 166 156 10 24 24 Agricultural labourers tM 141 132 9 13 13
oIF 25 24 11 11
(iii) ql~qIRq; \3EI)'IT "4>1ff CZlolP 31 15 16 149 149 Household industry woriters ~M 22 10 12 138 138
oIF 9 5 4 11 11
(iv) aRJ "4>1ff 17folP 2,124 232 1.892 45,554 45.554 Other woriters tM 1,950 197 1,753 37,844 37,844
oIF 174 35 139 7,710 7,710
8. cM<t>I~ifi"4>1ff "6!TolP 1,996 268 1,728 43,347 43,347 Mainworiters tM 1,833 228 1,605 36,110 36,110
oIF 163 40 123 7,237 7,237
9. ~ ~q;Ift;j<t> "4>1ff CZfolP 344 146 198 2,544 2.544 Marginal woriters ~F 297 120 177 1,996 1,998
47 26 21 546 546
10. ~ <t>lff "GlTolP 2,064 376 1,688 21,785 21.785 Non-lNOriters tM 1,127 147 980 13,423 13,423
oIF .937 229 708 6,362 8,362
293
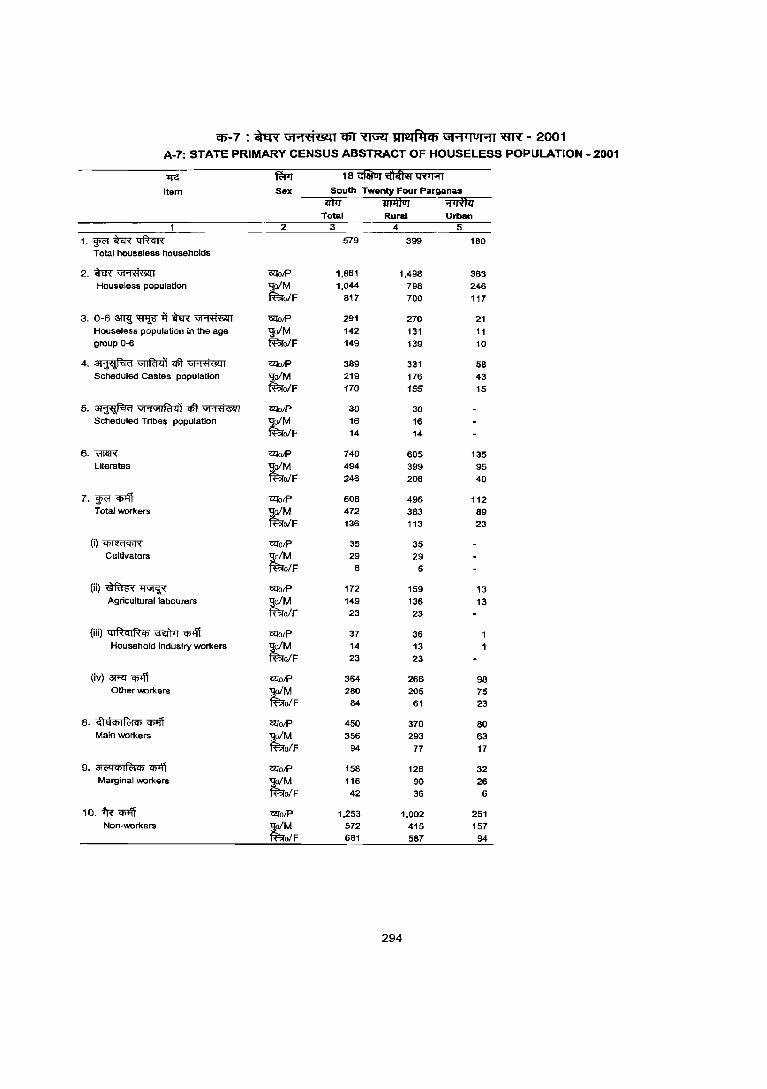
Cfi-7 : ~ Gt..,'("j(Y:j1 CfjJ ~ m2<j~Cf) Gt ..... lul..,1 ~ - 2001 A-7: STATE PRIMARY CENSUS ABSTRACT OF HOUSELESS POPULATION - 2001
'Ifa" ~ 18 clitiiT 'iiIt.ftii tNTAl
Item Sex South Twenty Four Parganas
iitii iiTi!fI1i '#1Tffii Total Rural Urban
1 2 3 4 5
l,~W~ 579 399 180 Total houseles5 households
2.W~ ClIQIF' 1.861 1,498 363 Houseless population
tM 1.044 798 246
ofF 817 700 117
3, 0-63W:!~~m~ ClIoIF' 291 270 21 Houseless population in the age '9;o/M 142 131 11 group 0-6 fBro/F 149 139 10
4. ~ urrta-d'i "$t ~ CLIoIF' 389 331 58 Scheduled Castes population
tM 219 176 43
o/F 170 155 15
5. ~ VI'1V1,fdlll qlt ~ ClIO/P 30 30 Scheduled Tribes population
tM 16 16
olF 14 14
6.~ ClIoIF' 140 605 135 literates
tM 494 399 95
ofF 246 206 40
7.¥~ ClIoIF' 60B 496 112 Total workers
tM 472 383 89
olF 136 113 23
(i)~ ClIO/P 35 35 Cultivators
tM 29 29
olF 6 6
(ii)~~ ClIoIF' 172 159 13 Agricultural labourers
;tM 149 136 13
o/F 23 23
(iii) ql~qlfh, ~ q;off CLlO/P 37 36 Household industry workers
tM 14 13
olF 23 23
(iv) 3RI'~ Cl:!olF' 364 266 98 Other workers
tM 280 205 75
ofF 84 61 23
8. <tlti<l>Ifc;j<f') cpJff ClIoiP 450 370 80 Main workers
tM 356 293 63
o/F 94 77 17
9 • 3{ (iq <I> I R:t <I> 'CIfIff ClIoiP 158 126 32 Marginal workers
tM 116 90 26
ofF 42 36 6
1 0, f'R 'CIfIff CZlO/P 1.253 1.002 251 Non-workers '9;o/M 572 415 157
fBro/F 681 587 94
294
34 ~C'1 J ~ CJ)
ANNEXURES

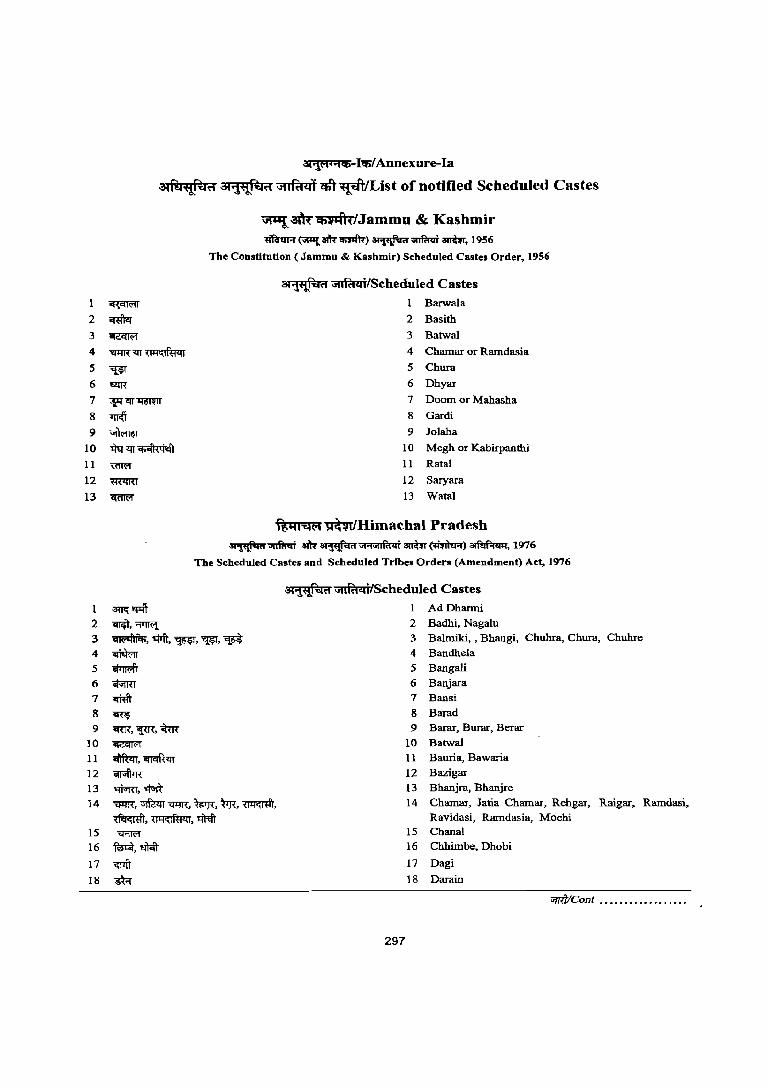
311('1'''$-1,.;/ Annexure-Ia
atf@1'1.fili1 0i~i1 \i'l1~41Cfft~/List of notified Scheduled Castes
~ .~/Jammu & Kashmir ~~~~)~~amm, 1956
The Constitution (Jammu & Kashmir) Scheduled Castes Order, 1956
1 ~ 1 Barwala
2 ~ 2 Basith
3 iRCIWr 3 Batwal
4 ~~ <1"l"'lf~ql 4 Chamar or Ramdasia
5 ~ 5 Chura
6 ~ 6 Dhyar
7 ~~~ 7 Doom or Mahasha
8 -.00 8 Gardi
9 ~ 9 lolaha
10 mr~~ 10 Megh or Kabirpanthi
11 «IR"r 11 Ratal
12 m<mT 12 Saryara
13 ~ 13 Watal
~ql'i4M ~/Himachal Pradesh ~~ ~~"';Nnf.lqi ~~)~, 1976
The Scheduled Castes and Scheduled Tribes Orden (Amendment) Act, 1976
1 ~w:il
2 ~, "ITlR'l 3 ~,$ft,~,~,~ 4 ~
5 'iiTrRoiT 6 $1m
7 omft 8 ~
9 <RR,~.oRR 10 iRCIWr
11 ~,~
12 ~ 13 $ro, $it 14 'i1I!1\, ~'i1I!1\, 'W:R,~,~,
~, ~,'Ilfeit 15 "<FlR'{
16 fu1:<;f, '*It 17 ;::rrft
18 ~
at"lf!!~.q~ ~/Scheduled Castes
1 Ad Dharmi
297
2 Badhi, Nagalu 3 Balmiki" Bhangi, Chubra, Chura, Chubre 4 Bandhela 5 Bangali 6 Banjara 7 Bansi 8 Barad 9 Barar, Burar, Berar
10 Batwal 11 Bauria, Bawaria 12 Bazigar 13 Bhanjra, Bhanjre 14 Chamar, Jatia Chamar, Rehgar, Raigar, Ramdasi,
Ravidasi, Ramdasia, Mochi IS Chanal 16 Chhimbe, Dhobi
17 Dagi
18 Darain
"fTftICont .••..•.•.••••..•••
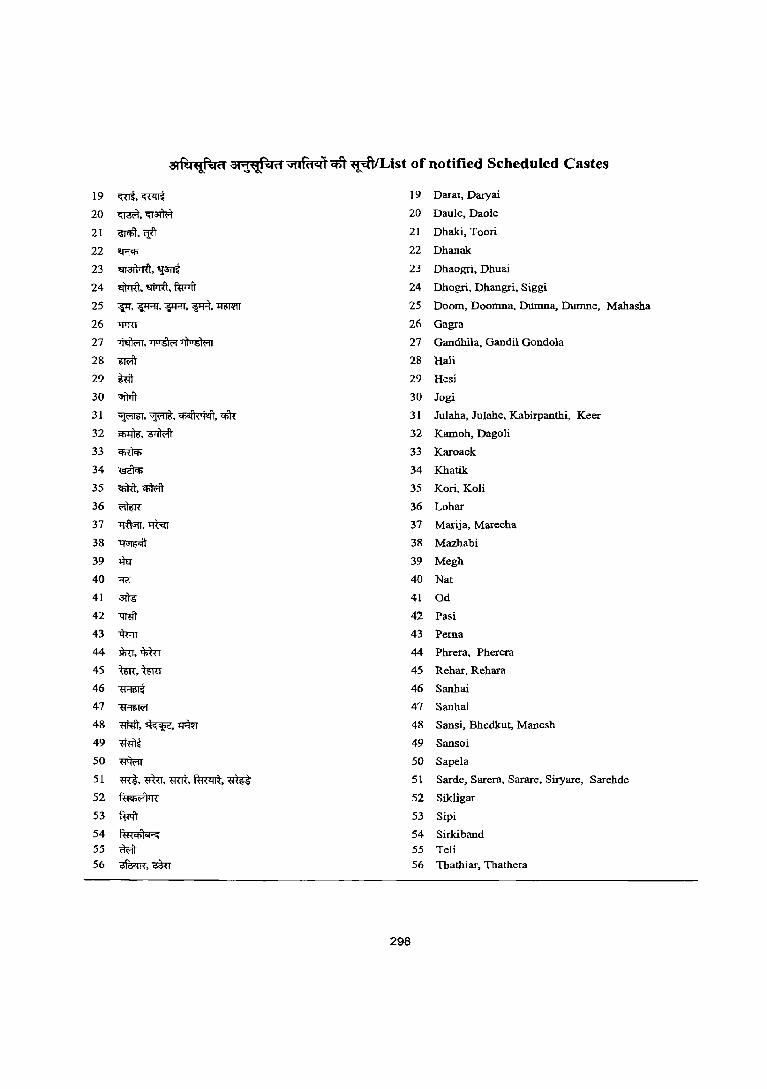
atM~"'.q('j ati~('j "t.f('l<U Cfft ~lList of notified Scheduled Castes
19 ~,~ 19 Darai, Daryai
20 ~.~amt 20 Daule, Daole
21 Gfiit, <ttt 21 Dhaki, Toorl
22 tRCIl 22 Dhanak
23 \lTaWm, ~-mt 23 Dhaogri, Dhuai
24 ~, '-WRT, furrft 24 Dhogri, Dhangri, Siggi
25 ~, ~, ~, ~.llm'IT 25 Doom, Doomna, Dumna, Dumne, Mahasha
26 "IJTm 26 Gagra
27 ~.~~ 27 Gandhila, Gandil Gondola
28 ~ 28 Hali
29 im 29 Hesi
30 m 30 Jogi
31 ~,~,~, Cf>'R 31 Julaha, Julahe, Kabirpanthi, Keer
32 ~,~ 32 Kamoh, Dagoli
33 ~ 33 Karoaek
34 ~ 34 Khatik
35 CfiRt, q;t;IT 35 Korl. Koli
36 ~ 36 Lohar
37 ~,~ 37 Marija, Marecha
38 ~ 38 Mazhabi
39 iteJ 39 Megh
40 ~ 40 Nat
41 ~ 41 Od
42 'mfi 42 Pasi
43 ~ 43 Perna
44 Jl;u, -q;m 44 Phrera, Pherera
45 ~,mu 45 Rehar, Rehara
46 ~ 46 Sanhai
47 ~ 47 Sanhal
48 -mm, ~, -r:mr 48 Sansi, Bhedkut, Manesh
49 m=rrt 49 Sansoi
50 ~ 50 Sapela
51 ~,~, Bm,~, mrt 51 Sarde, Sarera, Sarare, Siryare, Sarehde
52 ~ 52 Sikligar
53 futit 53 Sipi
54 ffl~<6liil'" 54 Sirkiband 55 <WIT 55 Teli 56 ofu>m, oan 56 Thathiar, Thathera
298
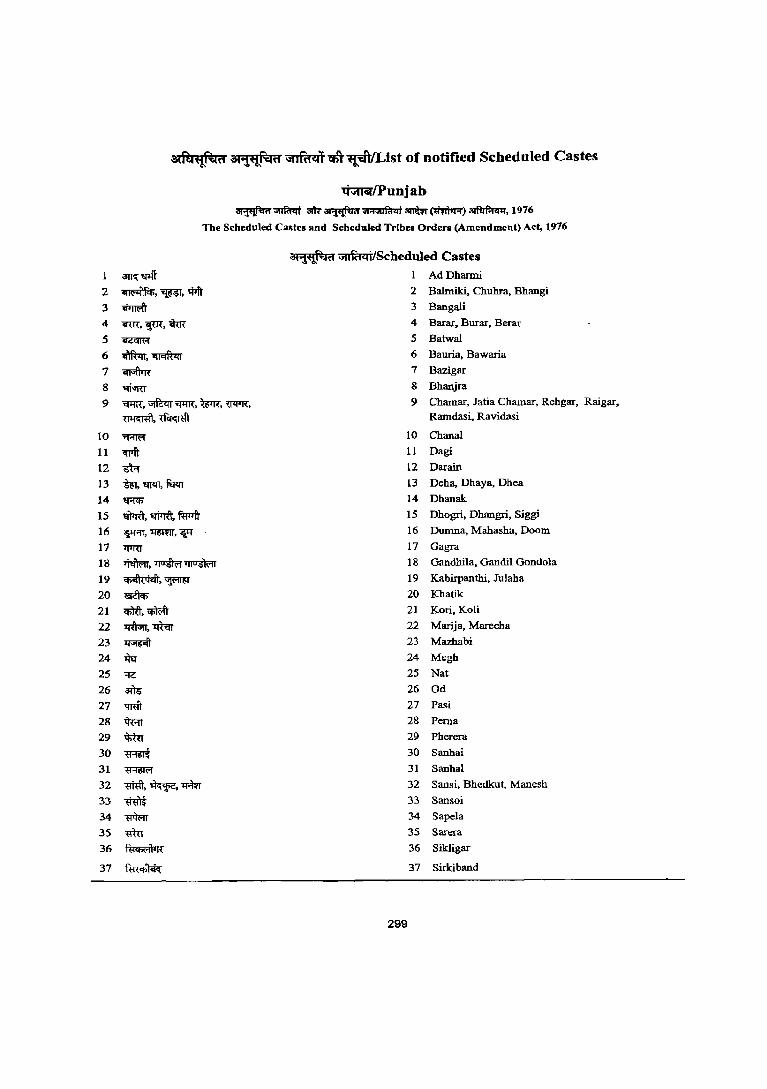
~/Punjab
~~ ,,~~amm~)~.1976
The Scheduled Castes and Scheduled Tribes Orders (Amendment) Act, 1976
'3ti"i'~?1 ~/Scheduled Castes
3Il'l;~ 1 AdDharmi
2 ~''fiW,$ft 2 Balmiki, Chuhrn, Bhangi
3 Wmofi 3 Bangali
4 "iRl"{, "¥R. tlw 4 Barar, Burar, Berar
5 ~ 5 Batwal
6 ~,~ 6 Bauria, Bawaria
7 ~ 7 Bazigar
8 ~ 8 Bhanjra
9 ~, "iiIWrr~, WR, \l<I'R, 9 Chamar, Jatia Chamar, Rehgar, Raigar,
~,oom Ramdasi. Ravidasi
10 ~ 10 Chana!
11 m 11 Dagi
12 ~ 12 Darain
13 -m,~,m 13 Deha, Dhaya, Dhea
14 ~ 14 Dhanak:
15 ~,~.funit 15 Dhogri, Dhangri, Siggi
16 ~,"llmlT,~ 16 Dumna, Mahasha, Doom
17 'I'flro 17 Gagra
18 ~,~~ 18 Gandhila, Gandil Gondola
19 ~,~ 19 Kabirpanthi, Julaha
20 lSI& 20 Khatik
21 ~, q;R;ft 21 Kori, Koli
22 ~,m-m 22 Marija, Marecha
23 ~ 23 Mazhabi
24 1lq 24 Megh
25 ~ 25 Nat
26 ~ 26 Od
27 'IRit 27 Pasi
28 ~ 28 Perna
29 ~ 29 Pherera
30 ~ 30 Sanhai
31 ~ 31 Sanhal
32 ~,~~ 32 Sansi, Bhedkut, Manesh
33 mnt 33 Sansoi
34 ~ 34 Sapela
35 WI 35 Sarera
36 ~ 36 Sikligar
37 ~ 37 Sirkiband
299
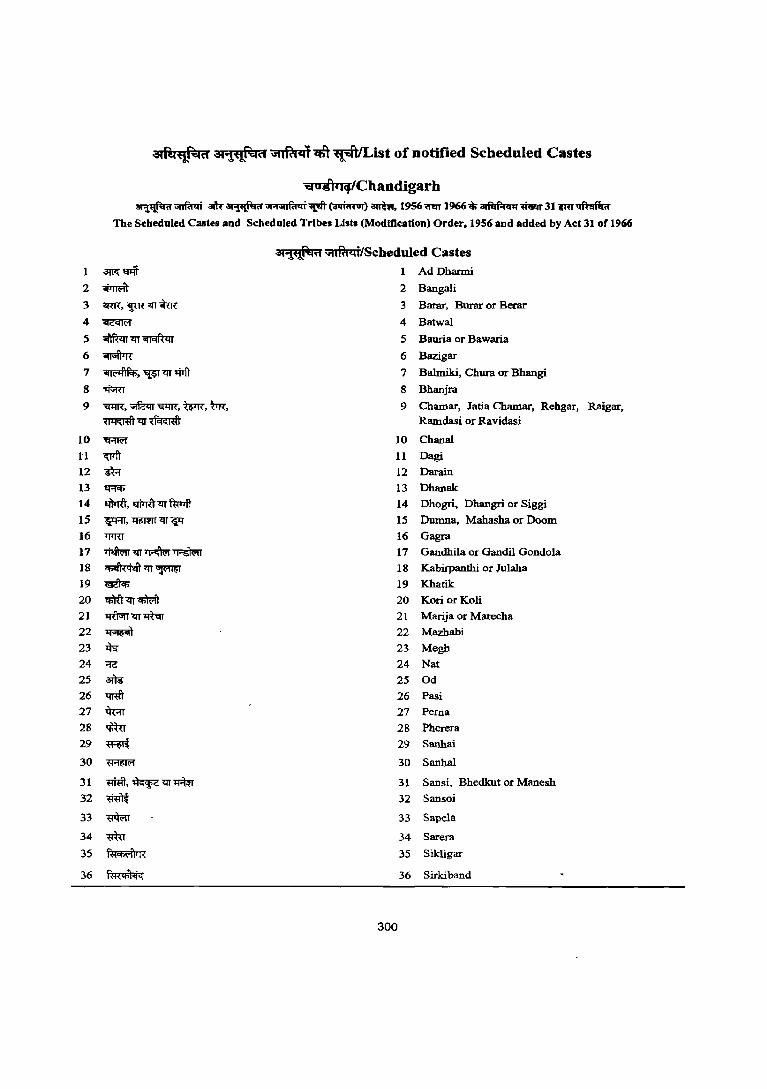
'3tRl~a '3t~;a 'ilIRt<if ~~ist of notified Scheduled Castes
'iii oi'lilCJ/Chandigarh ~~ .~"''''''lfdlli~(1Pri;mrr) :mtn,19S6<1l1T 1966"$~lisrr311RT~
The Scheduled Castes and Scheduled Tribes List. (Modification) Order. 1956 and added by Act 31 of 1966
at"i~?I ~/Scheduled Castes
1 ~~ I AdDharmi
2 ~ 2 Bangali
3 ORR, 'FR ~ elm 3 Barar, Burar or Berar
4 ~ 4 Batwal
5 ~'llT~ 5 Bauria or Bawaria
6 ~ 6 Bazigar
7 ~.W~q,ft 7 Balmiki, Chura or Bhangi
8 $m 8 Bhanjra
9 "iifllR",~~,~,~. 9 Ch8ll1ar, Jatia Ch8ll1ar, Rehgar, Raigar,
~<u~ Ramdasi or Ravidasi
10 ~ 10 Chanal
U ~ 11 Dagi
12 ~ 12 Darain
13 ~ 13 Dhanak
14 ~, !firRT'lIT funit 14 Dhogri, Dhangri or Siggi
IS ~,~'lIT~ 15 Dumna, Mahasha or Doom
16 TJ1Rf 16 Gagra
17 ~~TPfu;r~ 17 Gandhila or Gandil Gondola
18 ~'lIT~ 18 Kabirpanthi or lulaha
19 ~ 19 Khatik
20 q;)tt<rr~ 20 Kori or Koli
21 ~~~ 21 Marija or Marecha
22 ~ 22 Mazhabi
23 mr 23 Megh
24 ~ 24 Nat
25 ~ 25 Od
26 ..:nm 26 Pasi
27 ~ 27 Perna
28 'IIfur 28 Pherera
29 ~ 29 Sanhai
30 ~ 30 Sanhal
31 mm,~~~ 31 Sansi, Bhedkut or Manesh
32 ~ 32 Sansoi
33 ~ 33 Sapela
34 mu 34 Sarera
35 ~ 35 Sikligar
36 ~ 36 Sirkiband
300
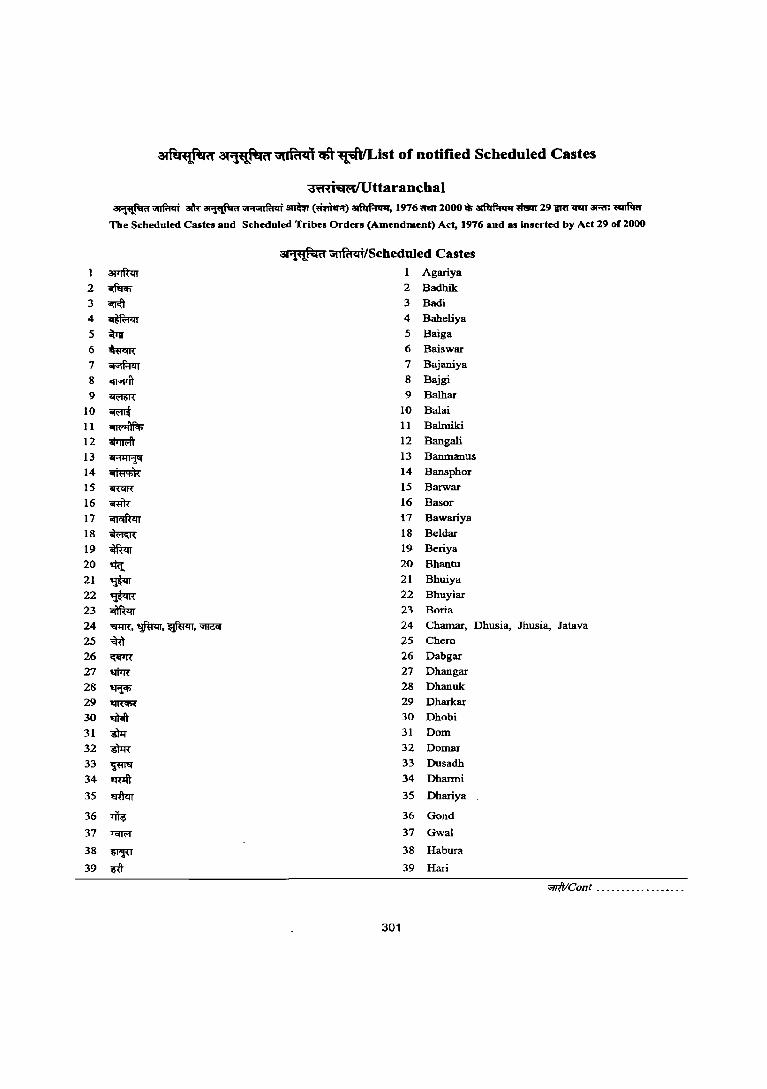
2 3 4
5 6 7 8
9 10 11
12 13 14 15 16 17 18
19 20 21 22 23 24 25 26 27 28 29 30 31 32 33 34
35
36
37
38
39
31f':1'f1fEitt 31"WfE4tt \il1~cif $T~ist of notified Scheduled Castes
3't1"ti'i4HiUttaranchal ~~ at. ~ w,,,,,fu.jj ~~)~, 1976<t1!1T 2000" ~Wsrr 2911'UlPIT ar-tt: ~
The Scheduled Castes and Scheduled Tribes Orders (Amendment) Act, 1976 and as Inserted by Ad 29 of 2000
at~(1 ~/Scheduled Castes
~ Agariya
~ 2 Badhik
~ 3 Badi
~ 4 Baheliya
~ 5 Baiga
~ 6 Baiswar
~ 7 Bajaniya
CIT"Pft 8 Bajgi
~ 9 Balhar
~ 10 Balai
~ 11 Balmiki
ifrm;ft 12 Bangall
~ 13 Banmanlls
~ 14 Bansphor
'iI"{CI'R" 15 Barwar
iIlil< 16 Basor
~ 17 Bawariya
~ 18 Beldar o)Wrr 19 Beriya
~ 20 Bhantu
Wrr 21 Bhuiya
~ 22 Bhuyiar
~ 23 Boria
"i:IltR,~,~, ~ 24 Chamar, Dhusia, Jhusia, Jatava
~ 25 Chero
~ 26 Dabgar \tiTr{ 27 Dhangar
~ 28 Dhanuk
~ 29 Dharkar
~ 30 Dhobi
mt:r 31 Dom
~ 32 Domar
~ 33 Dusadh
~ 34 Dharmi
~ 35 Dhariya
~ 36 Gond
~ 37 Gwal
~ 38 Habura
lit 39 Hari
vnitlCont ..............•...
301
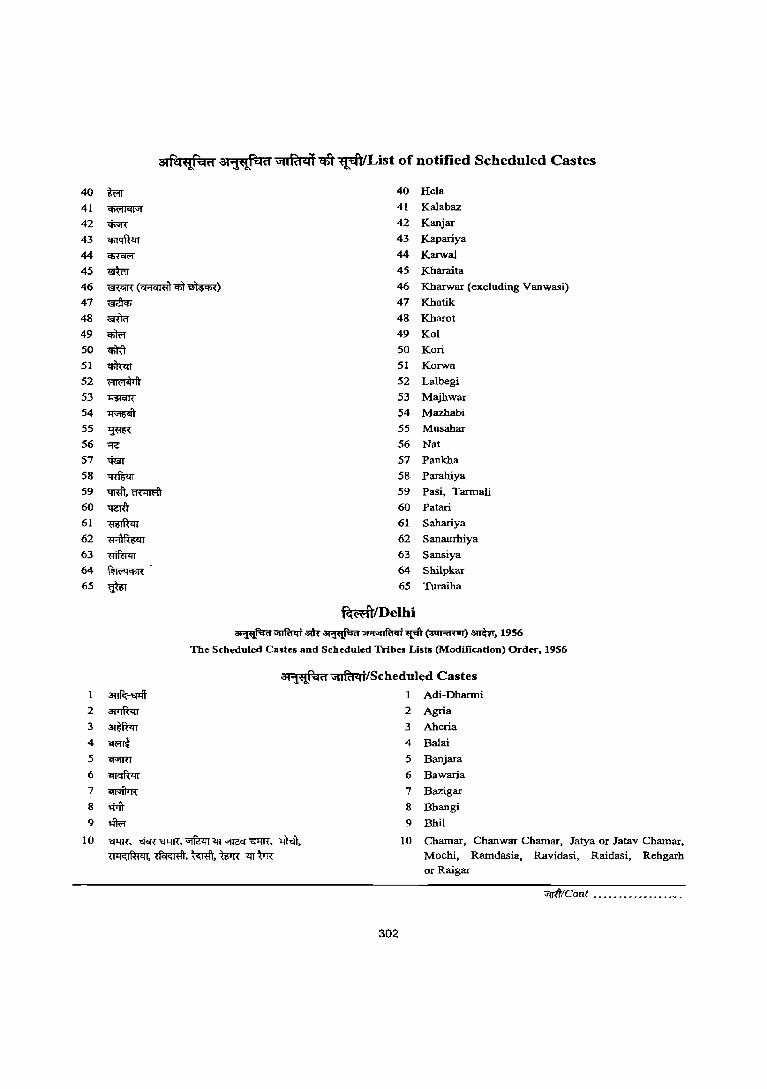
atfQ~" 3fi~?f "lIRtc:if ~~ist of notified Scheduled Castes
40 %FIr 40 Hela
41 ~ 4l Kalabaz
42 ~ 42 Kanjar
43 ~ 43 Kapariya
44 ~ 44 Kanva!
45 ~ 45 Kharaita
46 \SRCIR (~-.m~) 46 Kharwar (excluding Vanwasi)
47 ~ 47 Khatik
48 ~ 48 Kharot
49 <IiWr 49 Kol
50 ~ 50 Korl
51 <PR<u 51 Korwa
52 ~ 52 Lalbegi
53 ~ 53 Majhwar
54 ~ 54 Mazhabi
55 ~ 55 Musahar
56 -;::g 56 Nat
57 '!fun" 57 Pankha
58 ~ 58 Parahiya
59 1Jllft,~ 59 Pasi, Tarmali
60 'IGRl 60 Patari
61 ~ 61 Sahariya
62 ~ 62 Sanaurhiya
63 "f!ifu"lIT 63 Sansiya
64 ~. 64 Shilpkar
6S ~ 6S Turaiha
~/Delhi ~~. ~ ",,,,,,,raqi~(atiT:ffivT)~, 1956
The Scheduled Castes and Scheduled Tribes Lists (Modification) Order, 1956
31~t1 ~/Scheduled Castes
1 anf<::-~ 1 Adi-Dharmi
2 3l11Wu 2 Agria
3 ~ 3 Aherla
4 ~ 4 Balai
5 ~ 5 Banjara
6 ~ 6 Bawaria
7 ~ 7 Bazigar
8 $it 8 Bhangi
9 ~ 9 Bhil
10 ~, ~"'QllR", ~ <IT "f)2q"$1IT, l=lMt, 10 Chamar, Chanwar Chamar, Jatya or Jatav Chamar,
~,~, -wm, WR <IT~ Mochi, Ramdasia, Ravidasi, Raidasi, Rehgarb or Raigar
~/Cant _____ . __ . ___ ._ ... __
302
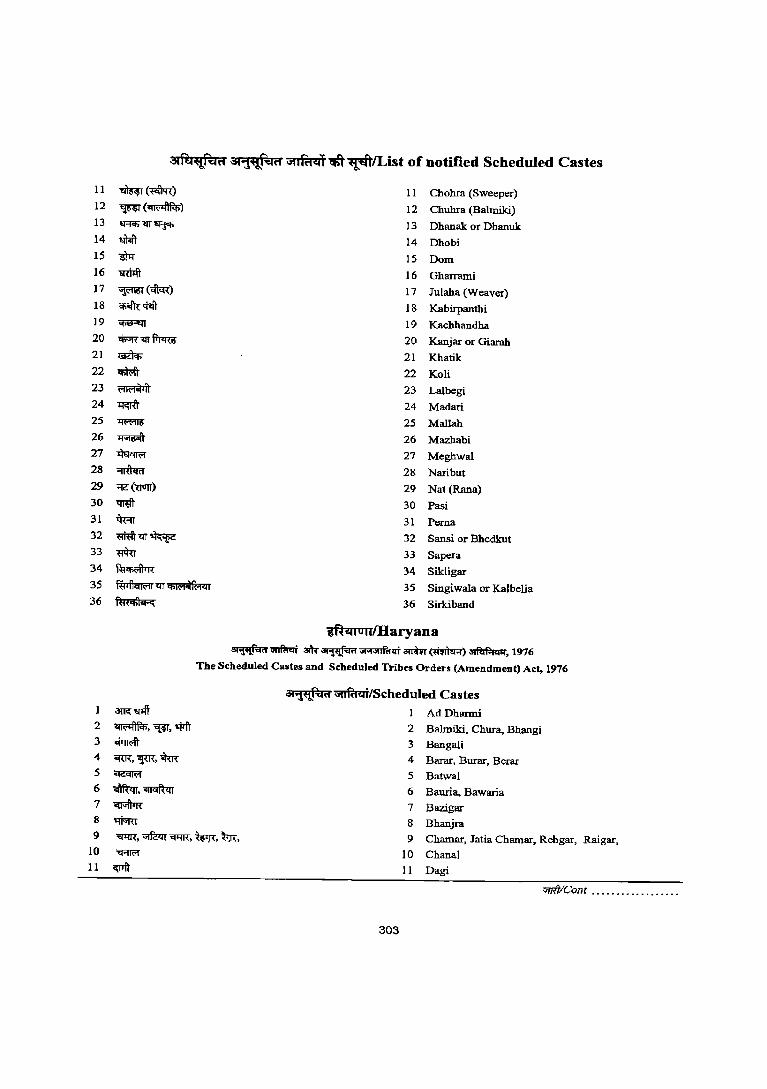
11
12
13
14
15
16 17
18 ]9
20
21 22
23 24 25
26 27 28
29
30
31 32
33 34
35
36
1
2
3
4
5
6
7 8
9
10 11
~(~) 11 Chohra (Sweeper) ~(~) 12 Chuhra (Balmiki) \f=(ql-m 'FjiIi" 13 Dhanak or Dhanuk llWt 14 Dhobi Wi 15 Dom tffia:ft 16 Gharrami ~(<lm) 17 Julaha (Weaver) q;cftt$ft" 18 Kabirpanthi ~ 19 Kachhandha ~mf'il>m" 20 Kanjar or Giarah ~ 21 Khatik q;toft- 22 Koli ~ 23 Lalbegi
~ 24 Madari
~ 25 Mallah ~ 26 Mazhabi ~ 27 Meghwal ::rriIom 28 Naribut ;g(-uotr) 29 Nat (Rana)
~ 30 Pasi ~ 31 Perna
~'l!T~ 32 Sansi or Bhedkut -mu 33 Sapera ~ 34 Sikligar ft'tftcm;rr 'lIT CfiI(O(.qfM<l1 35 Singiwala or Kalbelia ~ 36 Sirkiband
gncuonlHaryana ~~ 3!\;~"''''''ll'ltqi anUr(~)~. 1976
The Scheduled Castes and Scheduled Tribes Orders (Amendment) Act, 1976
~tllff ~,~,qrfr
~
~,"FR.~ ~
~,~
~ $m
"<IlIR. "Ifmr~. Wr<. ~, '<RR'r
<wft
Oi"lf!!~iI~ ~/Scheduled Castes
1 AdDharmi
2 Balmiki, Chura, Bhangi
3 Bangali
4 Barar, Burar, Berar 5 Batwal
6 Bauria. Bawaria 7 Bazigar
8 Bhanjra
9 Chamar, Jatia Chamar, Rehgar, Raigar, 10 Chanal
11 Dagi
"fTitICont ............. , ... .
303
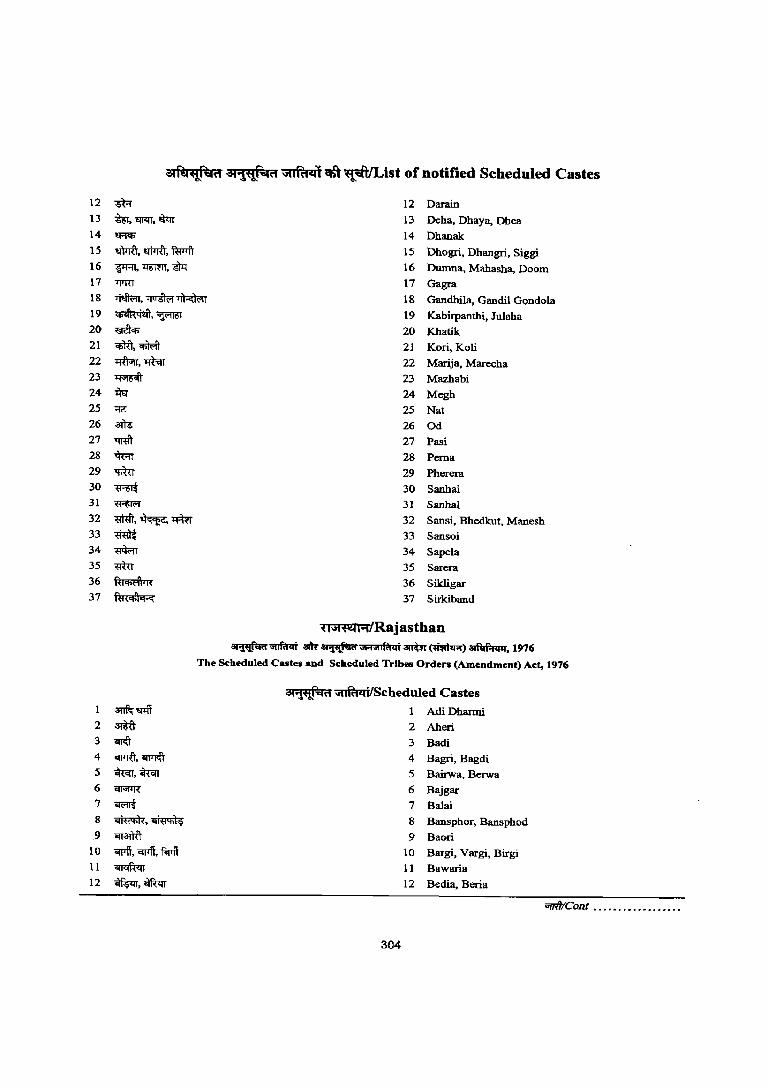
12 13 14 15 16 17 18
19 20 21 22 23 24 25 26 27 28 29 30 31 32 33 34 35 36 37
2
3
4
5
6
7
8
.9 10 II
12
atfQ~a :at~H ~ ~ ''l~ft,/List of notified Scheduled Castes
m 12 Darain
~,'EWU,~ 13 Deba, Dhaya, Dhea
~ 14 Dhanak wm, "fiTrU, funfr 15 Dhogri, Dhangri, Siggi ~,~.6P:r 16 Dumna., Mahasha, Doom T(l'lU 17 Gagra TPfu;;t,~~ 18 Gandhila, Gandil Gondola
~.~ 19 Kabirpanthi, Julaha ~ 20 Khatik <6TU, q;)ffi 21 Kori. Koli ~,"Ilhn 22 Marija, Marecha ~ 23 Mazhabi *r 24 Megh ~ 25 Nat am 26 Od tmft 27 Pasi ~ 28 Perna -.rnr 29 Pherera
~ 30 Sanhai
~ 31 Sanhal
~,~ . .mr 32 Sansi, Bhedkut, Manesh
~ 33 Sansoi ~ 34 Sapela mu 35 Sarera ~ 36 Sikligar f.a<CfiI .. ::« 37 Sirkiband
'( l,iH~ i"'IlRajasthan ~~ a!h'~,"""'iHl ... i~~)~.1976
The Scheduled Castes and Scheduled Tribes Orders (Amendment) Act, 1976
~~ ~ on<tt OIJTItT. ~ ~ . ..m.r ~
~ ~,~
ClTarnT orriT, CIJTft, fcIrit ~
~,~
3\"l't'l!~i1 ~/Scheduled Castes
AdiDhanni
2 Aheri
3 Badi
4 Bagri, Bagdi
5 Bairwa, Berwa
6 Bajgar
7 Balai
8 Bansphor, Banspbod
9 Baori
10 Bargi, Vargi, Birgi
11 Bawaria
12 Bedia, Beria
304
"f!#ICont ................. .
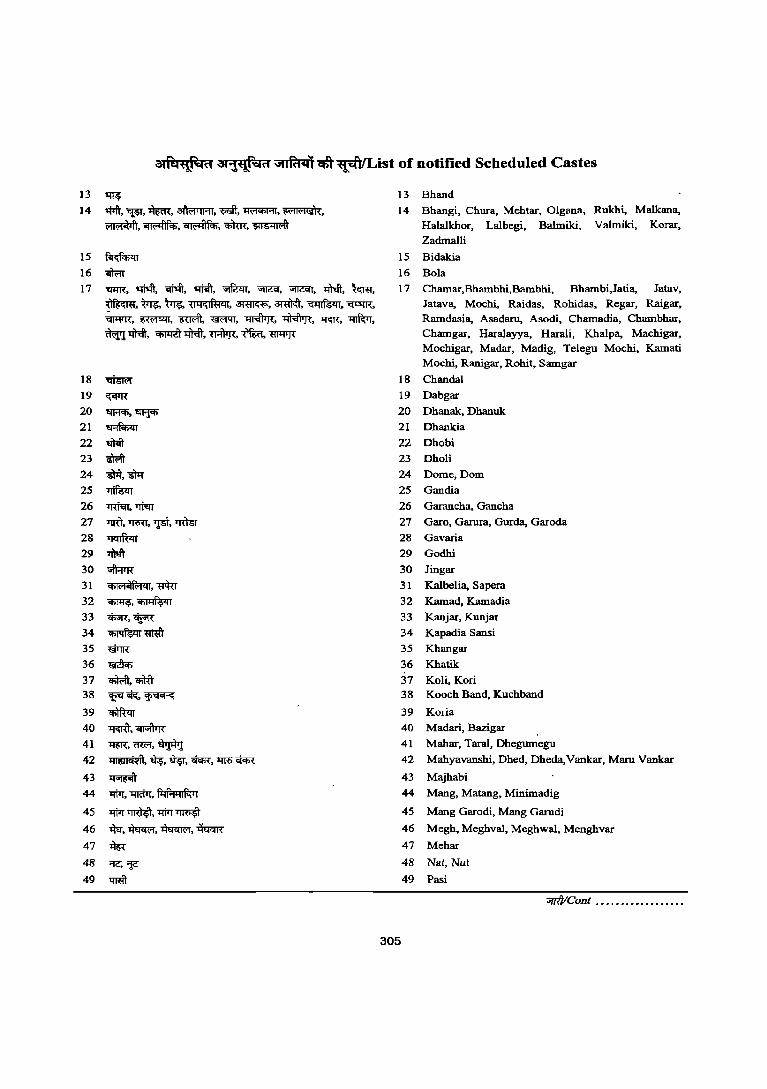
13 ~ 14 *fr,~,~,~,Qdl-,~,~, ~,~,~,~,~
15 ~
16 ..m:rr 17 "1'lI'!R, qh:ft, "iINT, qjoff, ~, ~, ~, .wdt, ~, ~,m,~, {14"lf*l% ~,~,~,~ ~,~,~,~,~,~, ~,~, ~"Ilf;:ft, ~"4h:It,~,~,~
18 ~ 19 <:;iltR
20 tTFICIi, ~
21 ~
22 \11cit 23 ~ 24 ~,~ 25 ~ 26 lRf<n, '$u
27 1'lIit, TRiU, 1J5T, ~ 28 '1"fCI'1WtT 29 11lm 30 ~ 31 <6lt"14ft"l<4l, ~
32 ~,~ 33 $iR,~
34 ~m 35 WTR 36 ~ 37 ~,<nRt 38 "¥f~,~
39 ~ 40 ~,~ 41 ~,<m"f,~ 42 ~, ~, ~, ci<t><, llRi ci<t><
43 ~ 44 l'filT,1:fRitT, f",f"lqlF;' I
45 l'filT~, l'filT ~ 46 ~,~,~,~
47 ~ 48 ~'¥
49 1:!Rft
13 Bhand
14 Bhangi, Chura, Mehtar, Olgana, Rukhi, Malkana, Halalkhor, Lalbegi, Balmiki, Valmilci, Korar,
Zadmalli
15 Bidakia
16 Bola
17 Chamar,Rhambhi,Bambhi, Bhambi,Jatia, Jatav, Jatava, Mochi, Raidas, Rohidas, Regar, Raigar, Ramdasia, Asadaru, Asodi, Chamadia, Chambbar, Chamgar, Haralayya, Harali, Khalpa, Machigar, Mochigar, Madar, Madig, Telegu Mochi, Kamati Mochi, Ranigar, Rohit, Samgar
18 Chandal
19 Dabgar
20 Dhanak, Dhanuk
21 Dhankia
22 Dhobi
23 Dholi
24 Dome,Dom
25 Gandia
26 Garancha, Gancha
27 Garo, Garura, Gurda, Garoda
28 Gavarla
29 Godhi
30 Jingar
31 Kalbelia, Sapera
32 Kamad, Kamadia
33 Kanjar, Kunjar
34 Kapadia Sansi
35 Khangar
36 Khatik
37 Koli, Korl 38 Kooch Band, Kuchband
39 Koria
40 Madari, Bazigar
41 Mahar, Taral, Dhegumegu
305
42 Mahyavanshi, Dhed, Dheda,Vankar, Maru Vankar
43 Majhabi
44 Mang, Matang, Minimadig
45 Mang Garodi, Mang Garudi
46 Megh, Meghval, Meghwal, Menghvar
47 Mehar
48 Nat, Nut
49 Pasi
"ffftICont .......••..•...•..
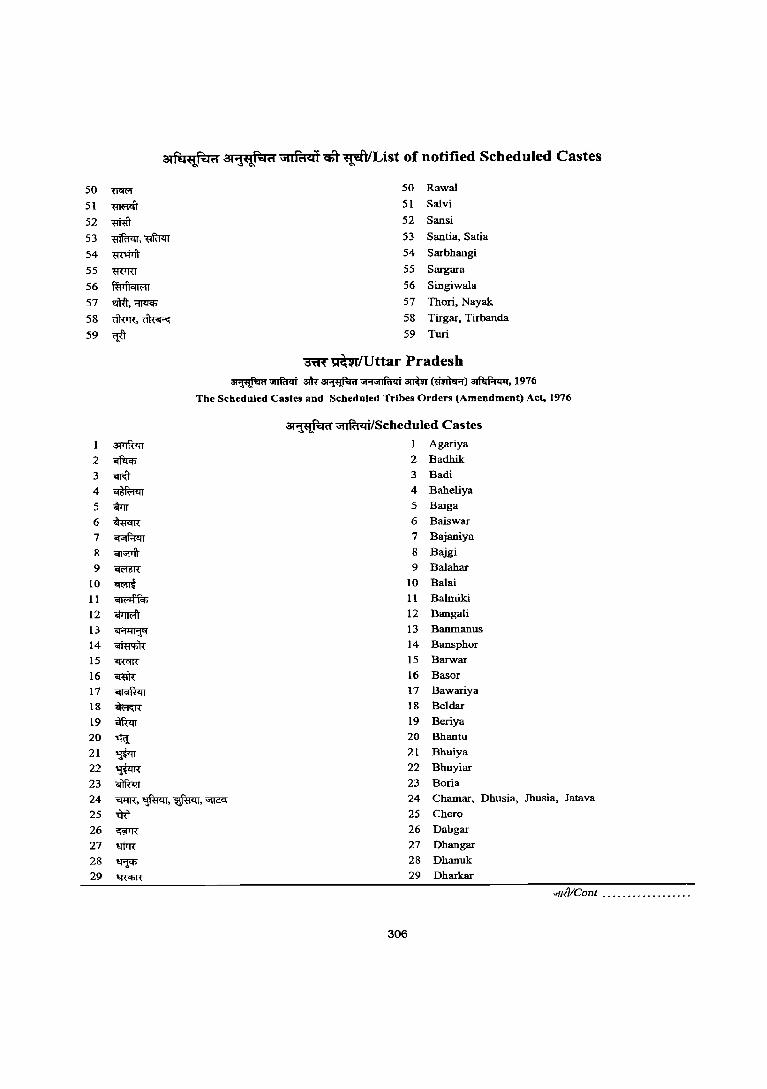
31~~i1 311~n ::J1lft:1:c:n ctt ~/List of notified Scheduled Castes
50 TiC«'f 50 Rawal
51 ~ 51 Salvi
52 ~ 52 Sansi
53 mffi<:rr. ~ 53 Santia, Satia
54 m:$iT 54 Sarbhangi
55 ~ S5 Sargara
56 ~ 56 Singiwala
57 ~,~ 57 Thori, Nayak
58 clWR".~ 58 Tirgar, Tirbanda
59 eFt 59 Turi
~mrlUttar Pradesh ~~ 31k~"''1'''lliiqiarnm(~)~,1976
The Scheduled Castes and Scheduled Tribes Orders (Amendment) Act, 1976
3i1'tf-il(i ~/Scheduled Castes
~ 1 Agariya
2 ~ 2 Badhik
3 ~ 3 Badi
4 ~ 4 Baheliya
5 Glrrr 5 Baiga
6 ~ 6 Baiswar
7 ~ 7 Bajaniya
8 ~ 8 Bajgi
9 ~ 9 Balahar
10 ~ 10 Balai
11 ~ 11 Balmiki
12 <ttmoft 12 Bangali
13 ~ 13 Banmanus
14 ~ 14 Bansphor
15 "iRC!K 15 Barwar
16 0Rltt 16 Basor
17 ~ 17 Bawariya
18 ~ 18 Beldar
19 ~ 19 Beriya
20 ~ 20 Bhantu
21 ~ 21 Bhuiya
22 ~ 22 Bhuyiar
23 ~ 23 Boria
24 '<fI'{R,~,~, ~ 24 Chamar, Dhusia, Jhusia, Jatava
25 -mT 25 Chero
26 <@TIT 26 Dabgar
27 mrR 27 Dhangar
28 ~ 28 Dhanuk
29 ~ 29 Dharkar
"fJ{tIConl ................•.
306
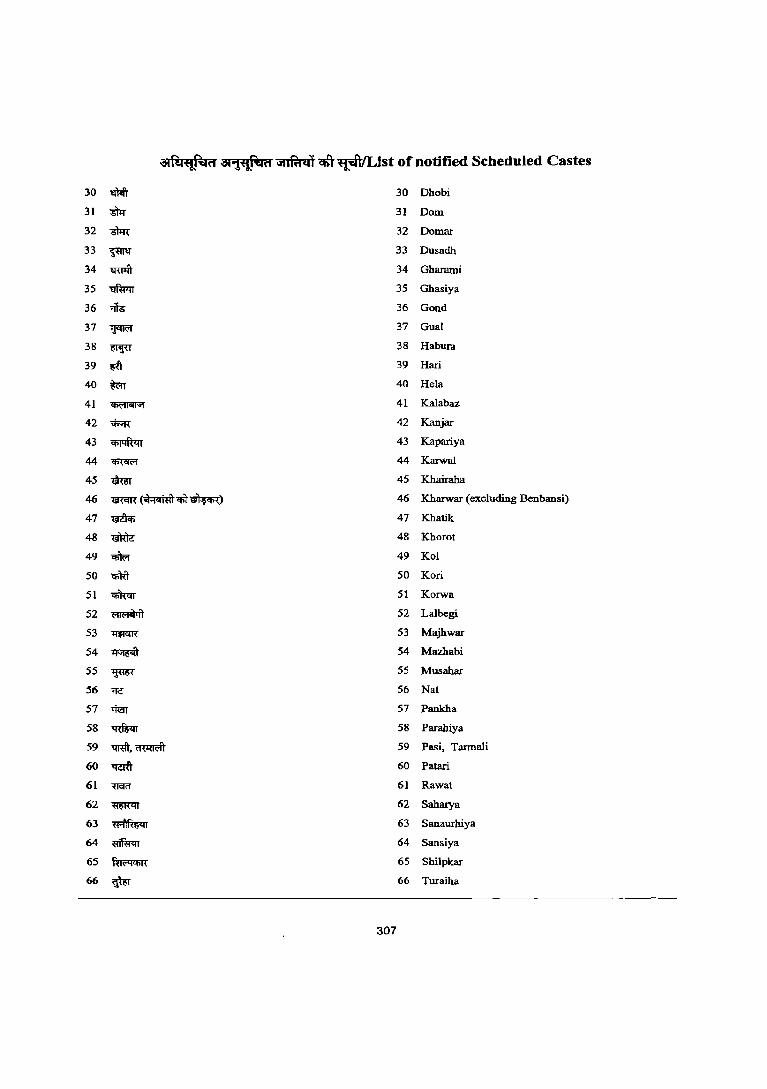
atfQ~fI at~""ilfl ~ ctfr ~/List of notified Scheduled Castes
30 t1Wt 30 Dhobi
31 m- 31 Dom
32 ~ 32 Domar
33 ~ 33 Dusadh
34 ~ 34 Gharami
35 "ElfWu 35 Ghasiya
36 <i16 36 Gond
37 'lj<ffi'f 37 Gual
38 ~ 38 Habura
39 ~ 39 Hari
40 ~ 40 Hela
41 ~ 41 Kalabaz
42 ~ 42 Kanjar
43 ~ 43 Kapariya
44 ~ 44 Karwal
45 ~ 45 Khairaha
46 ~(~q;l-~) 46 Kharwar (excluding Benbansi)
47 ~ 47 Khatik
48 ~ 48 KhOTOt
49 ~ 49 Kol
50 q;)tt 50 Kori
51 ~ 51 Korwa
52 ~ 52 Lalbegi
53 ~ 53 Majhwar
54 ~ 54 Mazhabi
55 ~ 55 Musahar
56 ;g 56 Nat
57 tm 57 Pankha
58 ~ 58 Parahiya
59 'QRft,~ 59 Pasi, Tarmali
60 trerit 60 Patari
61 mrrr 61 Rawat
62 ~ 62 Saharya
63 ~ 63 Sanaurhiya
64 ~ 64 Sansiya
65 ~ 65 Shilpkar
66 ~ 66 Turaiha
307
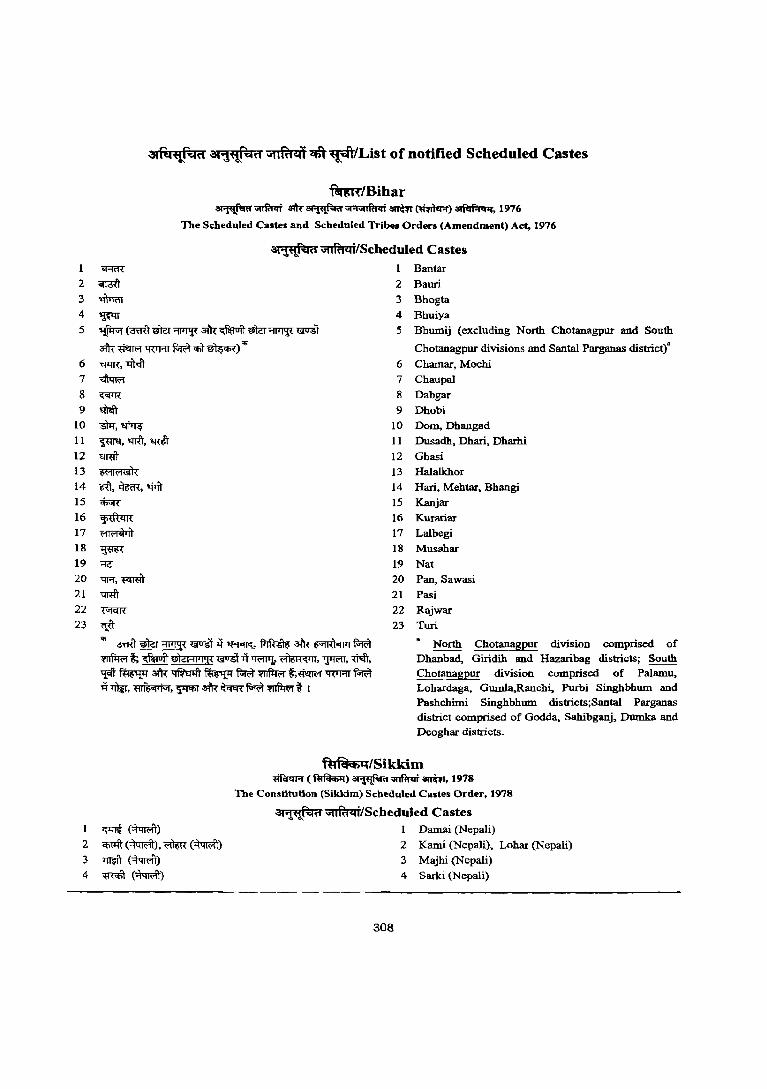
atfq"!!".qd at"j'Ei! .... -eid ,i'IIRtq'f '2ifft~lList of notified Scheduled Castes
fc!rm"fBibar ~~ .~"'·""'~'Ii ~~)~.1!J76
The Scheduled Castes and Scheduled Tribes Orders. (Amendment) Act. 1976
at~~(1 ~/Scheduled Castes
1 Bantar
4 'WIT 5 ~(~mcr~am:~'5)c:r~~
am: ~ '1{TRT ~ qit~) ~
6 '<l1'IR,"tJ'r<IT 7 ~
8 ~ 9 m.rr
10 •• ~ 11 ~.~,~ 12 mm 13 ~
14 -roo ~, '<Pft 15 ~
16 ~ 17 ~
18 ~ 19 "Ie
20 'Wf,~ 21 ~
22 ~ 23 ctt
.. oOO~~~-q~,~~~m ~~ ~ 0)<!HI'I~ lS"it-q~~, ']llffi,~,
'J.Cfr~ am: mm ~ ~~~~WRTm it'l1lir. ~, ~ ~~f-;ffi~~ I
2 Bauri 3 Bhogta
4 Bhuiya
5 Bhumij (excluding North Chotanagpur and South
Chotanagpur divisions and Santa! Parganas district)"
6 Chamar, Mochi 7 Chaupal
8 Dabgar
9 Dhobi 10 Dom, Dhangad
11 Dusadh, Dhari, Dharhi
12 Ghasi
13 Halalkhor 14 Hari, Mehtar, Bhangi
15 Kanjar 16 Kurariar 17 Lalbegi
18 Musahar
19 Nat
20 Pan. Sawasi 21 Pasi
22 Rajwar
23 Turi
a North Chotanagpur division comprised of Dhanbad, Giridih and Hazaribag districts; South Chotanagpur division comprised of Palamu, Lohardaga, Gwnia,Ranchi, Purbi Singhbhum and Pashchimi Singhbhum districts;Santa! Parganas district comprised of Godda, Sahibganj, Dumka and Deoghar districts.
fu{fiq/Sikkim ~(~)~~amW,1978
~(~)
2 ~(~),~(~) 3 mW (~) 4 m<t\ (~)
The Constitution (Sikkim) Scheduled Castes Order, 1978
ajw~"I\1 ~/Scheduled Castes
308
1 Damai (Nepali)
2 Kami (Nepali), Lohar (Nepali)
3 Majhi (Nepali) 4 Sarki (Nepali)
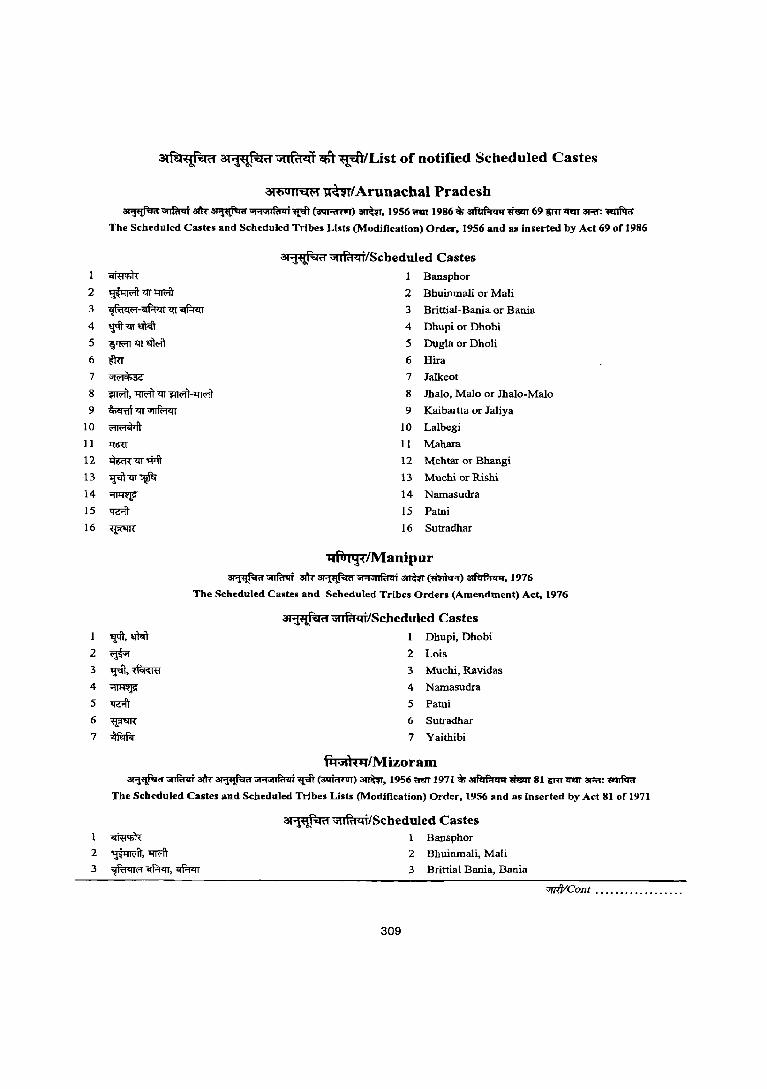
2
3
4
5
6
7
8
9
10
11
12
13
14
15
16
I
2 3
4
5
6
7
3lfh'(fr'~a 3l"ft'il ..... ~'i1 "",Rr41 <it~tList of notified Scheduled Castes
aH'iUII'i4('1 ~(Arunachal Pradesh ~;;ffiffqf am-~ ..,,,,,,,fa .. i ~~) arroW, 1956 n!U 1986 of; ~~ 69 'IRT'IRrT 3Rf: ~
The Scheduled Castes and Scheduled Tribes Lists (Modification) Order, 1956 and as inserted by Act 69 of 1986
ac~<1 ~/Scheduled Castes
~ 1 Bansphor
~m~ 2 BhuinmaJi or Mali
~-~m~ 3 Brittial-Bania or Bania
1fITm~ 4 Dhupi or Dhobi
~m~ 5 Dl,lgla or Dholi
mr 6 Hira
~ 7 Jalkeot
~, l1Iffim~-l'ffi'IT 8 Jhalo, Malo or ]halo-Malo
~trr~ 9 Kaibartta OJ: Jaliya
~ 10 Lalbegi
J:fflU 11 Mahara
~m.q,-ft 12 Mehtar or Bhangi
~m~ 13 Muehi or Rishi
~ 14 Namasudra
tg:ft 15 Patni
~ 16 Sutradhar
ilfOI 'l:dManipur ~;;nfu-qf am-~", .. ..,d'd .. i~(~)~,1976
The Scheduled Castes and Scheduled Tribes Orders (Amendment) Act, 1976
31'F{fi:ld ~/Scheduled Castes
~, "1r.fi I Dhupi, Dhobi
~ 2 Lois
1JdT,~ 3 Muehi, Ravidas
~ 4 Namasudra
"Wft 5 Patni
'FlR 6 Sutradhac
~ 7 Yaithibi
rq",hqlMizoram ~~ am-~ "''''''liitCii ~ (:Nt;mrT)~, 1956nm 1971 of;~~ 81 'lRT1l'm ar-;t: ~
The Scheduled Castes and Scheduled Tribes Lists (Modification) Order, 1956 and as inserted by Act 81 of 1971
31~""(1 ~/Scheduled Castes 1 Bansphor
2 Bhuinmali, Mali
3 Brittial Bania, Bania
309
"I7ft/Cont ................. .
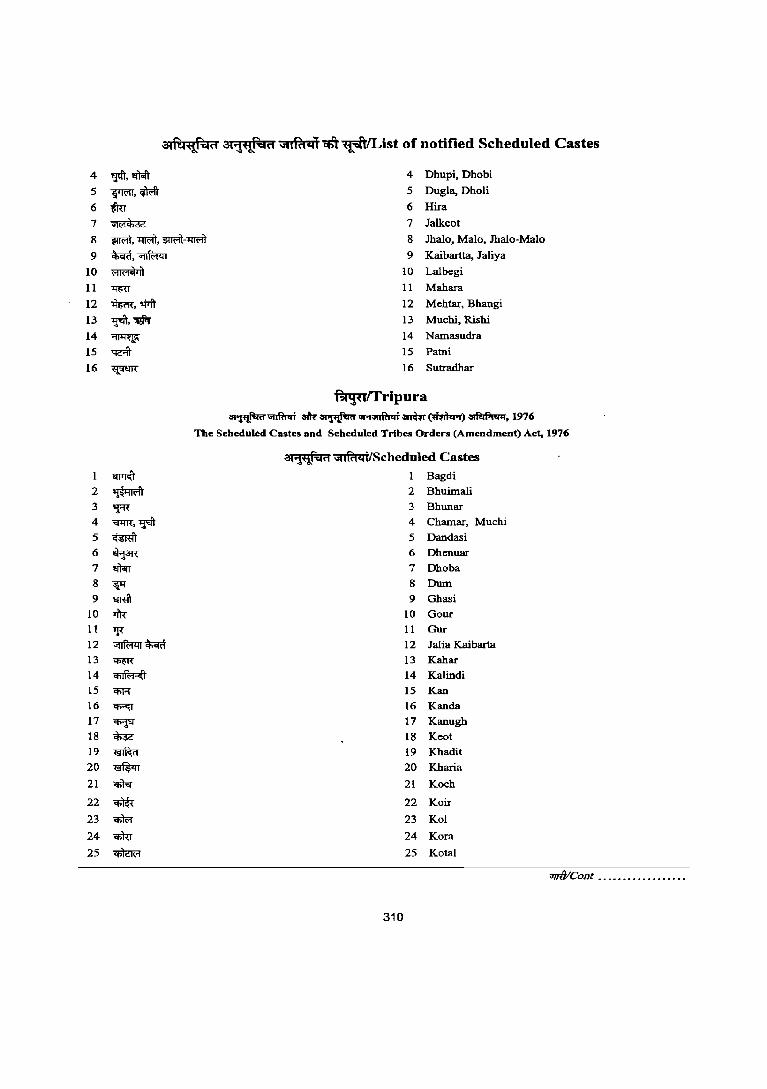
4 ~,~ 4 Dhupi, Dhabi
5 wwrr,~ 5 Dugla, Dholi
6 itu 6 Hira
7 ~ 7 Jalkeot
8 lIWlT, 'll'IFit, lIWlT-mffi 8 Jhalo, Malo, Jhalo-Malo
9 ~,~ 9 Kaibartta. Jaliya
10 ~ 10 Lalbegi
11 'l:!ro 11 Mahara
12 ~.$ft 12 Mehtar, Bhangi
13 ~,~ 13 Muehi, Rishi
14 ~ 14 NaIllasudra
15 ~ 15 Patni
16 ~ 16 Sutradhar
~lTripura ~~ a1k~""Nllfd .. i ~~)~, 1976
The Seheduled Castes and Scheduled Tribes Orders (Amendment) Act, 1976
ac~('f ~/Scheduled Castes
1 ~ Bagdi
2 ~ 2 Bhuimali
3 'fR 3 Bhunar
4 ~,~ 4 ChaIllar, Muchi
5 ~ 5 Dandasi
6 ~3l\ 6 Dhenuar
7 ~ 7 Dhoba
8 ~ 8 Dum
9 ~ 9 Ghasi 10 >lR 10 Gour
11 1F 11 Gur
12 ~~ 12 Jalia Kaibarta 13 ~ 13 Kahar
14 ~ 14 Kalindi
15 q;r:; 15 Kan 16 q;;ey 16 Kanda
17 ~ 17 Kanugh
18 ~ 18 Keat 19 ~ 19 Khadit
20 ~ 20 Kharia
21 cWr 21 Koch
22 ~ 22 Kair
23 ~ 23 Kol
24 q;ffi 24 Kora
25 ~ 25 Kotal
"fTfl/Cont ...•••••..•.••••••
310
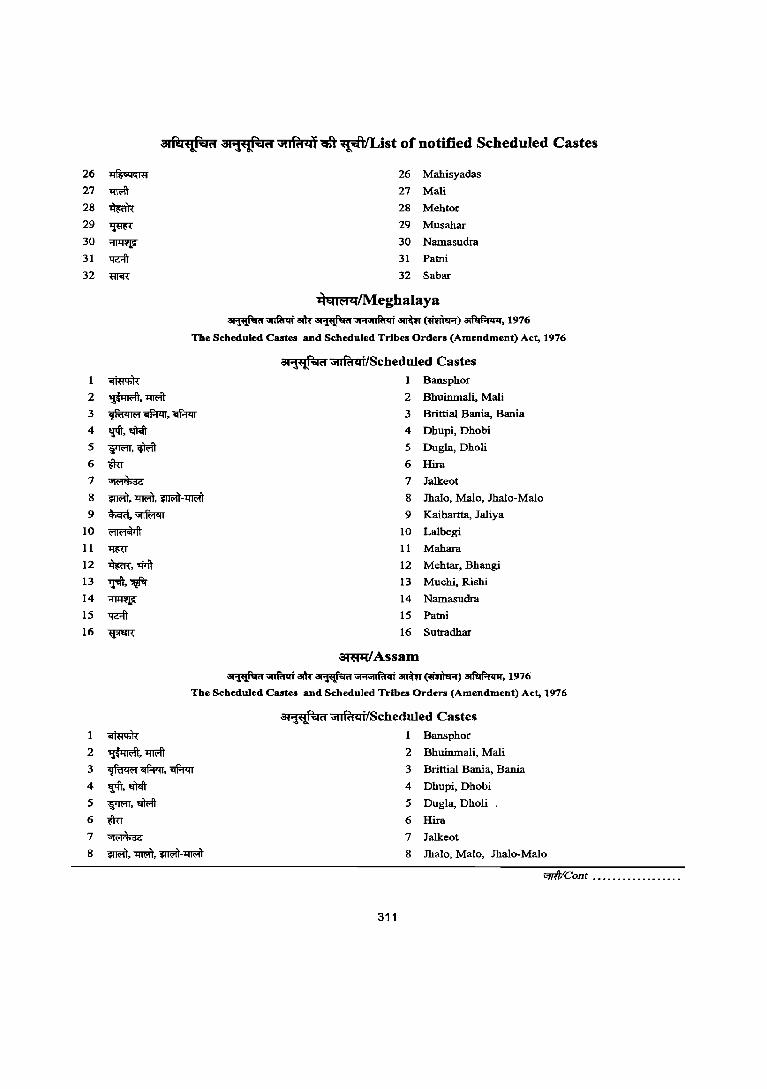
26
27
28
29
30
31
32
1
2
3
4
5
6
7
8
9
10
11
12
13
14
15
16
1
2
3
4
5
6
7
8
atftl~1:iri at~ri \il1~<d ltft' ~/List of notified Scheduled Castes
~
~
~
~
~ -qz;ft
"ffiiR
26 Mahisyadas
27 Mali
28 Mehtoc
29 Musahar
30 Namasudra
31 Patni
32 Sabar
qEU€14lMeghalaya ~~.~"''''''ifft<ii~~)~,1976
The Scheduled Castes and Scheduled Tribes Orders (Amendment) Act, 1976
""'¥l!;(i ~/Scheduled Castes
~ 1 Bansphor
~.mtoit 2 Bhuinmali, Mali
~~.~ 3 Brittial Bania. Bania
':rit. $It 4 Dhupi, Dhobi
~,~ 5 Dugla, Dholi
mr 6 Hira
~ 7 Jalkeot
lJR'it. +nM), ~-"l1"IMt 8 Jhalo, Malo, Jhalo-Malo
clicffi.~ 9 Kaibartta, Jaliya
~ 10 Lalbegi
~ 11 Mahara
~,o:j.-ft 12 Mehtar, Bhangi
~':Fr 13 Muehi. Rishi
~ 14 Namasudra -qc;ft IS Patni
~ 16 Sutradhar
31'lfI=I'1 Assam ~~alll"~"''''''ir.tqi ~~)~, 1916
The Scheduled Castes and Scheduled Tribes Orders (Amendment) Act, 1976
~
~,mtYft
~~,~
':rit, $It
wwrr,~
tm ~
lJR'it, ~, ~-~
""'¥l!~T4(i ~/Scheduled Castes
I Bansphor
2 Bhuinmali, Mali
3 Brittial Bania, Bania
4 Dhupi, Dhobi
5 Dugla, Dholi
6 Hira
7 Jalkeot
8 Jhalo, Malo, Jhalo-Malo
'JfTit/Cont ................. .
311
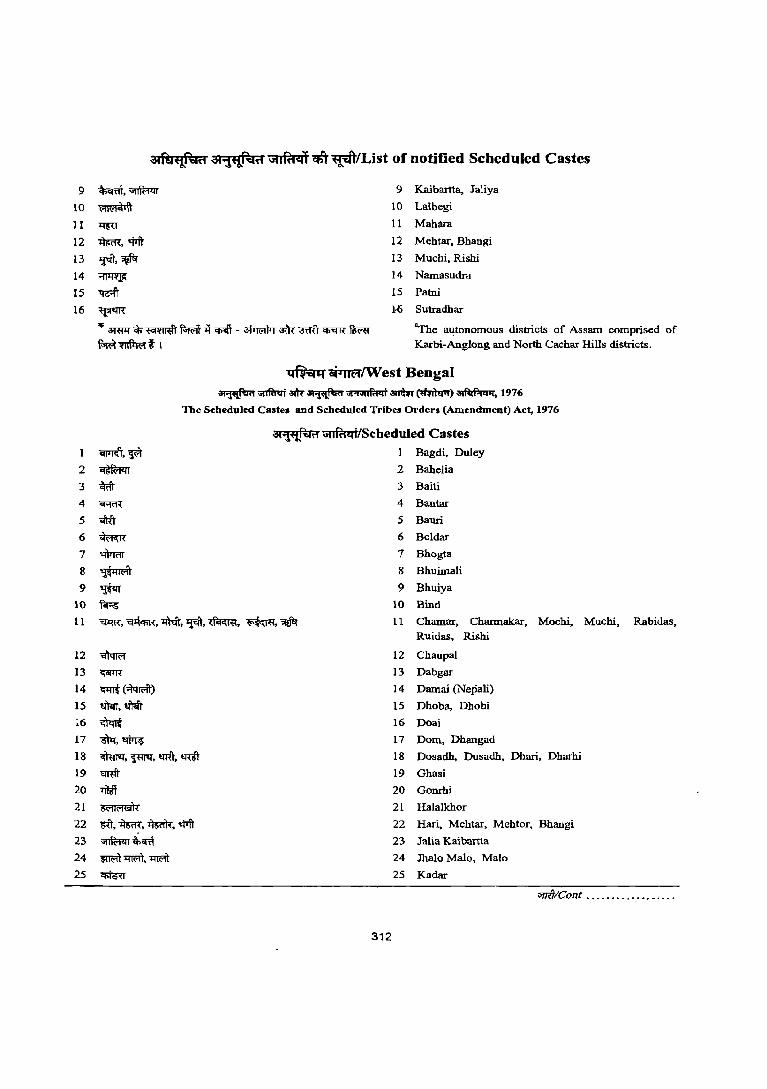
9
10
11
12
13
14
15
16
1
2
3
4
5
6
7
8
9
10
11
12
13
14
15
~6
17
18 19
20
21
22 23
24
25
atft:i,,{!",:1t'1 at"W:! ..... 'iili't iitrRtcif ~~lList of notified Scbeduled Castes
~.~ 9 Kaibartta, Ja1iya
~ 10 Lalbegi
1'tRT 11 Mahara ~,$ft 12 Mehtar. Bhangi
1j'<ft,~ 13 Muebi, Rishi
~ 14 Namasudra
~ 15 Patni
~ 1·6 Sutradhar
1& 3RfI1 ~ ~ ~ -if q;ofi -~ 31l< <ftffr ~ ~ "The a~tonomous districts of Assam comprised of
~~tl Karbi-Anglong and North Cachar Hills districts.
~ aiTm=l"lWest Bengal ~~iJIk~\iI""'lfuqi ~~)~, 1976
The Scheduled Castes and Scheduled Tribes Orders (Amendment) Act, 1976
aci'tf.!~fI ~/Sc:heduled Castes
~,~ 1 Bagdi. Duley
~ 2 Bahelia
-Mt 3 Baiti
~ 4 BantaI"
oM 5 Bauri
~ 6 Beldar
.wmr 7 Bhogta
~ 8 Bhuimali
WIT 9 Bhuiya
foR 10 Bind
'fI1lR,~,~,~,~, ~, ~ 11 Chamar, Charmakar, Mochi, Muehi, Rabidas, Ruidas. Rishi
~ 12 Chaupal
~ 13 Dabgar
~(~) 14 Damai (Nepali)
~. 'Iitiit 15 Dhoba, Dhabi
~ 16 Doai .,~ 17 Dom, Dhangad
~. ',iWi. ttRT. tRtt 18 Dosadh. Dusadh, Dhari, Dharhi
....m 19 Ghasi
~ 20 Gonrhi
~ 21 Halalkhor
-ro, ~, ~,$fr 22 Hari, MebtaI", Mebtor, Bbangi
~~ 23 Jalia Kaibartta
~~,~ 24 Thalo Malo, Malo
~ 25 Kadar
"flftICont ••..•.•..•••.•....
312
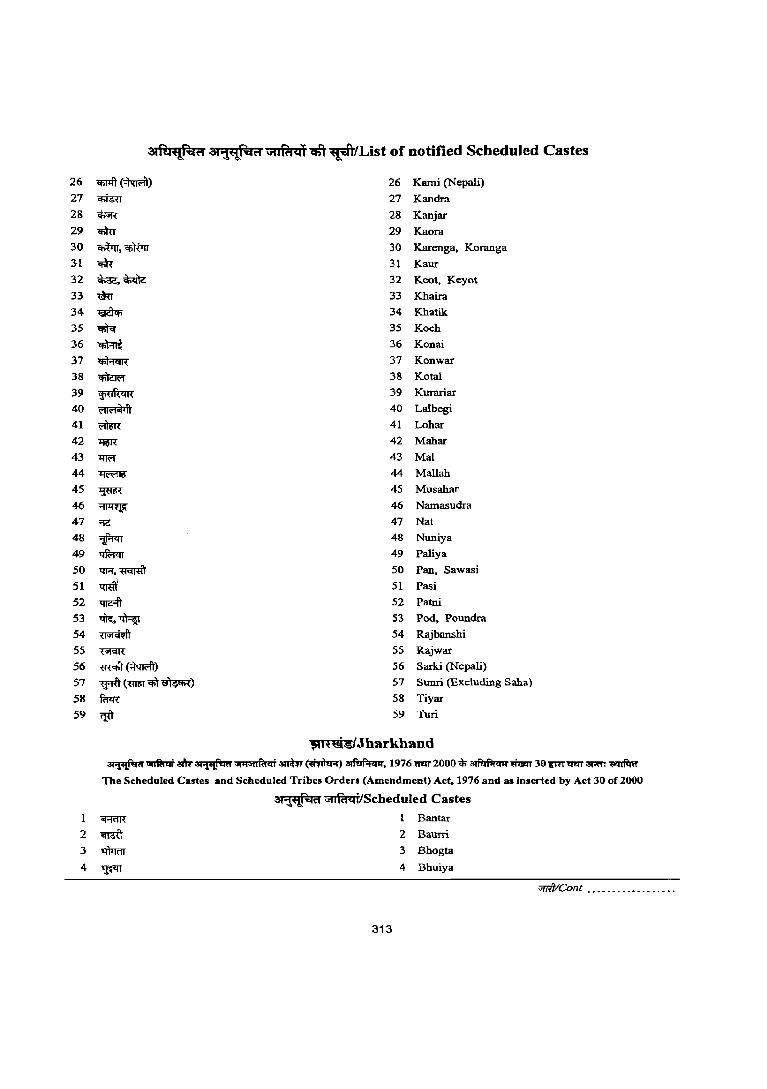
26 27 28 29 30
31
32
33
34
35 36 37 38
39
40
41
42
43
44
45
46
47 48
49 50
51 52 53 54 55 56 57 58 59
3(it"lf~(1 3(~~(1 \riiifl4i '$t ~JList of notified Scheduled Castes
~(~) 26 Kami (Nepali)
cnmr 27 Kandra
~ 28 Kanjar
cmr 29 Kaora oWn, q;Wrr 30 Karenga. Koranga
.m 31 Kaur
~~ 32 Keot, Keyot
~ 33 Khaira
~ 34 Khatik q;f<r 35 Koch
~ 36 Konai
CfiAcrR 37 Konwar
~ 38 Kota1
~ 39 Kurariar
~ 40 LaIbegi
~ 41 Lohar
~ 42 Mahar
11R'f 43 Mal
~ 44 MaIlah
~ 45 Musahar
~ 46 Namasudra
""IG 47 Nat
~ 48 Nuniya
~ 49 Paliya
'qR,~ 50 Pan. Sawasi
~ 51 Pasi
~ 52 Patni
..w::, ~ 53 Pod, Poundra
~ 54 Rajbanshi
~ 55 Rajwar
-mcfit(~) 56 Sarki (Nepali)
~(~q;f~) 57 Sunri (Excluding Saha)
fum- 58 Tiyar
ilit 59 Turi
flH ui-sl Jharkhand ~unftrqf.~ "''''''''Iraqi ~~)~, 1976 <rm 2000 ~ ~~ 30lrRT"tm 3I'<f: ~
The Scheduled Castes and Scheduled Tribes Orders (Amendment) Act, 1976 and as inserted by Act 30 of 2000
0l"i"t!~t1 ~/Scheduled Castes
313
1 Bantar
2 Baurri
3 Bhogta
4 Bhuiya
;;ntt/Cont ..••........•.....
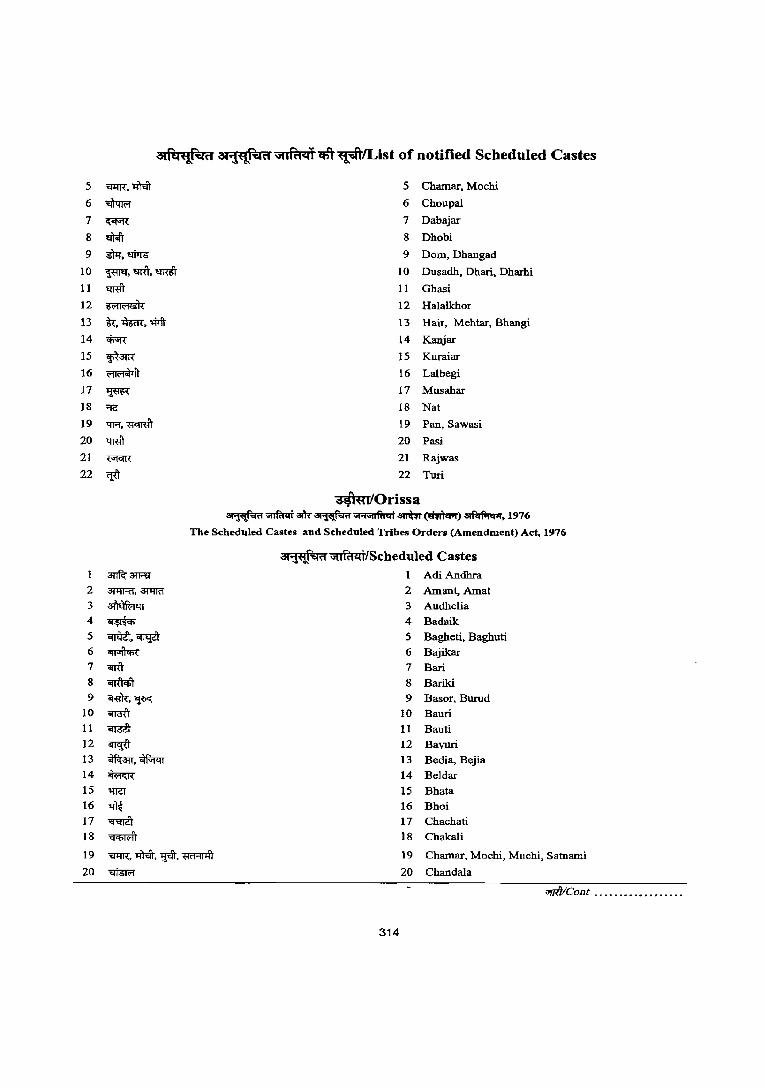
5
6
7
8
9
10
11
12
13
14
15
16
17
18 19
20 21 22
2 3
4
5 6
7 8 9
10
11 12 13 14
15 16 17
18
19
20
atftH~~H at-:wf~H "fifflql-qft~lList of notified Scheduled Castes
"<l'liR", 'I:I1m 5 Chamar, Mochi
~ 6 Choupal
~ 7 Dabajar
$IT 8 Dhobi
~,~ 9 DOIll, Dhangad
~,t11ft,~ 10 Dusadh, Dhari, Dharhi
"S!Rft 11 Ghasi
~ 12 Halalkhor
~,~,¢iT 13 Hair, Mehtar, Bhangi
~ 14 Kanjar
~3lR 15 Kuraiar
~ 16 Lalbegi
~ 17 Musahar
';'fG 18 Nat
'qR,~ 19 Pan, Sawasi -qn:ft 20 Pasi
~ 21 Rajwas
~ 22 Turi
~/Orissa ~~am-~"'·Nilfd .. i~(~)~.1976
The Scheduled Castes and Scheduled Tribes Orders (Amendment) Act, 1976
anf<; 31Rl
31'liRi, 31lmi
~
~ ilT<ID.~ ~ W ~
GRffi:, ~ ~ iIT3ir ~ ~31T,~
~ ~
~ ~ ~
'<Il'IR, -.::Wd\-, l}'i'lT, ~ ~
at"f+!!"'~~ ~/Scheduled Castes
314
1 Adi Andhra
2 Amant, Amat 3 Audhelia 4 Badaik
5 Bagheti, Baghuti 6 Bajikar 7 Bari
8 Bariki 9 Basor, Burud
10 Bauri
11 Bauti
12 Bavuri 13 Bedia, Bejia
14 Beldar
15 Bhata 16 Bhoi 17 Chachati 18 Chakali
19 Chamar, Mochi, Muehi, Satnami
20 Chandala
~/Cont .........•..•.....
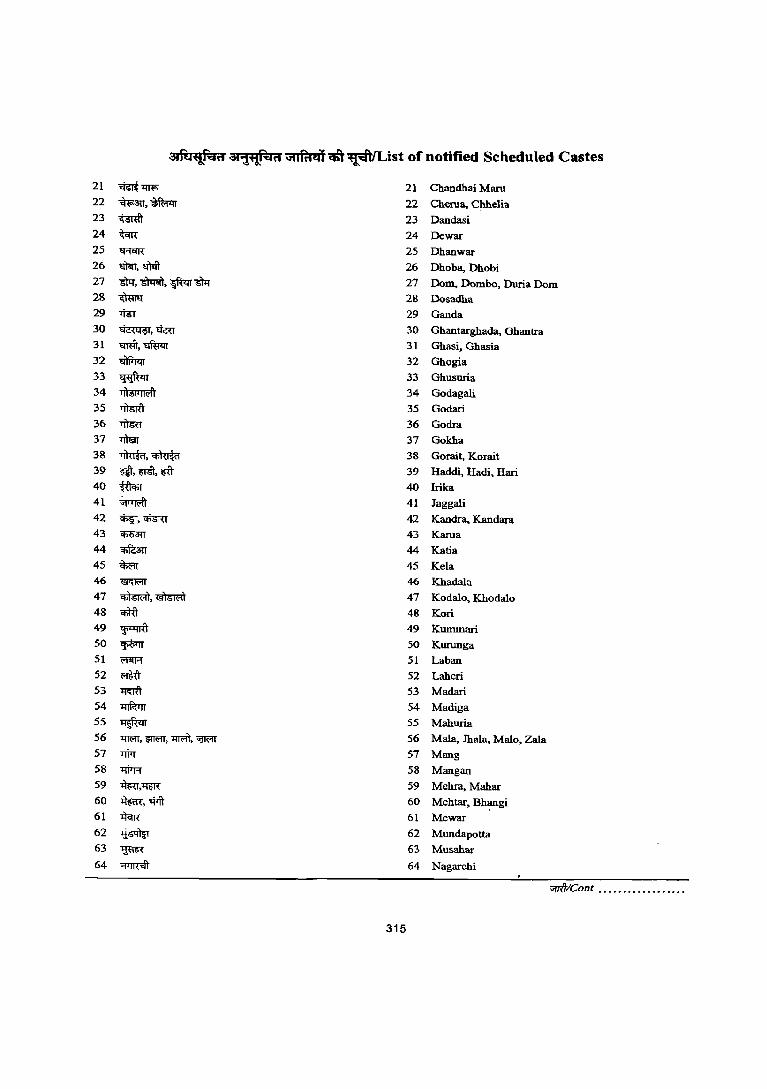
atffHlf..:att at1~~tt ~ '1ft ~ist of notified Scheduled Castes
21 ~~ 21 Chandhai Maru 22 $m,~ 22 Cherua, Chhelia 23 ~ 23 Dandasi 24 ~ 24 Dewar 25 'fROR 25 Dhanwar 26 "1lin, "lliit 26 Dhoba, Dhobi 27 sltr, "ittr-IT, ~ ~ 27 Dam, Dombo, Doria Dam 28 ~ 28 Dosadha 29 -,m 29 Ganda 30 ~,tku 30 Ghantarghada, Ohantra 31 'IR'ft, ~ 31 Ghasi, Ghasia 32 ~ 32 Ghogia 33 ~ 33 Ghuswia 34 ~ 34 Godagali 35 ~ 35 Godari 36 11Tm 36 Godra 37 • 37 Gokha 38 "IlR$f,~ 38 Gorait, Korait 39 W,~,~ 39 Haddi, Hadi, Hari 40 -«m 40 Irika 41 ~ 41 Jaggali 42 ~,~ 42 Kandra, Kandara 43 ~m 43 Karua 44 CliR:m 44 Katia 45 ~ 45 Kela 46 ~ 46 Khadala 47 ~,~ 47 Kodalo, Khodalo 48 iI#T 48 Korl 49 ~ 49 Kummari 50 ~ 50 Kurunga 51 ~ 51 Laban 52 ~ 52 Laherl 53 ~ 53 Madari 54 ~ 54 Madiga 55 ~ 55 Mahuria 56 l'IWIT, ~, "I1R"it, ~ 56 Mala, ]haia, Malo, Zala 57 -.:fill 57 Mang 58 l1iTR 58 Mangan 59 ~,~ 59 Mehra, Mahar 60 ~,$TI 60 Mehtar. Bhill1gi 61 *rR 61 Mewar 62 ~ 62 Mundapotta 63 ~ 63 Musahar
64 ~ 64 Nagarchi
;;nit/Cont ....•••••.•..•••••
315
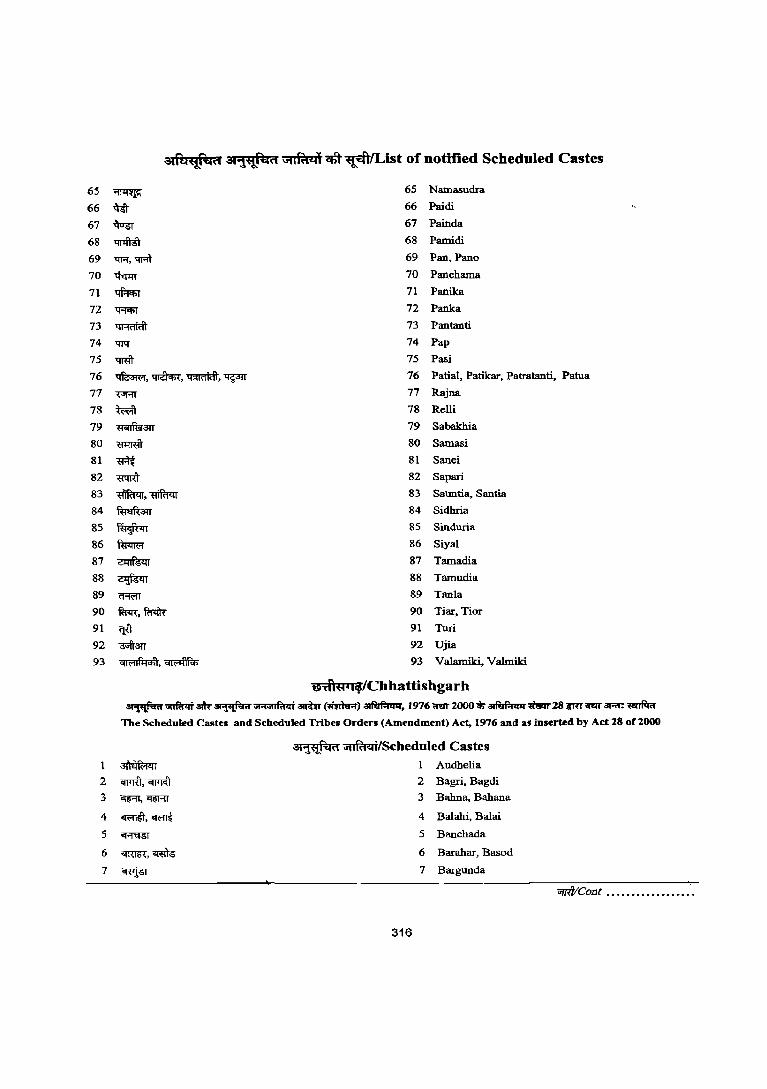
65
66
67
68
69
70
71
72
73
74
75
76
77
78
79
80
81
82
83
84
85
86
87
88
89
90
91
92
93
I
2
3
4
5
6
7
::aftl~~.q\1 31*1:(\1 ~ <fit ~ist of notified Scheduled Castes
~ 65 Namasudra
~ 66 Paidi
~ 67 Painda
~ 68 Pamidi
'lR', 'Wlf 69 Pan, Pano
$tm 70 Panchama
'I!f.:tq;r 71 Panika
'Ifoi<IiT 72 Panka
~ 73 Pantanti
-qrq 74 Pap
~ 75 Pasi
~,~,~,~ 76 Patial, Patikar, Patratanti, Patua
<'JRT 77 Rajna
~ 78 RelJi
mnflgau 79 Sabakhia
w:nm 80 Samasi
~ 81 Sanei
mro- 82 Sapari
~,~ 83 Sauntia,Santia
~3{f 84 Sidhria
~ 85 Sinduria
~ 86 Siyal
~ 87 Tamadia
~ 88 Tamudia
n=R'iT 89 TanIa
futR, frI<IIT 90 Tiar. Tior
<tU 91 Turi
a-;it3{f 92 Ujia
~,~ 93 Valamiki, Valmiki
i§:JIfti .iJ/Chhattishgarh ~~.~",,,,,,,Fd .. i ~(~)~. 1976;mr2000~~m.r28wmil1!lTar-;;r: ~
The Scheduled Castes and Scheduled Tribes Orders (Amendment) Act, 1976 and as inserted by Act 28 or 2000
dI"M)'":i.t11 ~/Scheduled Castes
~ 1 Audhelia
OfI'Tft, ~ 2 Bagri, Bagdi
~,~ 3 Bahna. Bahana
~,~ 4 Balahi, Balai
~ 5 Banchada
iifRl'l'{, ~ 6 Barahar, Basod
~ 7 Bargunda
;srr#ICont ••••••••••••••••• ".
316
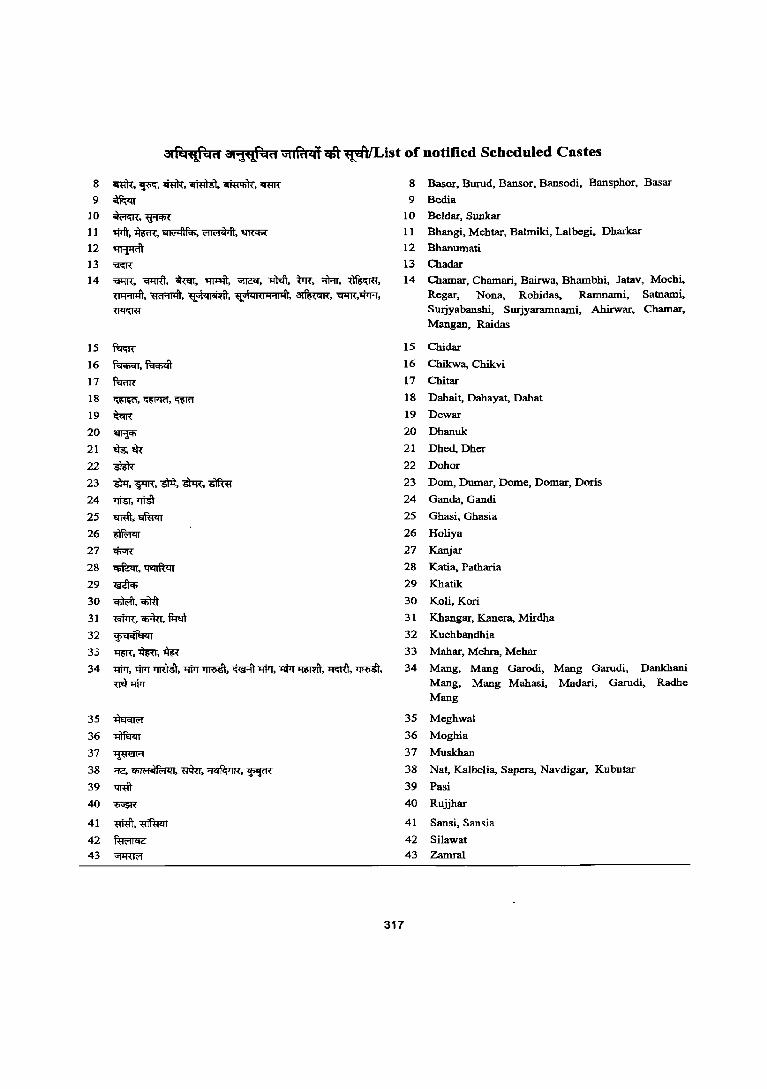
3(~~ri 3(~ri \il1R\4lc6t~lList of notified Scheduled Castes
8 omR,~, -mR.~. ~, omIt
9 ~
10 ~.~ 11 ~.~.~,~,~
12 ~
13 ~
14 ~.~,~.~,~, ~, m, -;fAr, ~,
~, mA'Jlft, ~, 'E'l.;;l"U<Il'l'1lift, ~, 'i'l'J'I'R,lftR, ~
15 ~
16 ~,~
17 ~
18 ~, ~, <m<t'
19 ~
20 ~
21 ~~
22 ~
23 ~, WfR", mq, ~. 'ifur 24 ~,1"Ji5"t
25 ~.~
26 ~
27 $'it<
28 q;fuou,~
29 ~
30 q;)ffi, cmT 31 "WR", q;;ffi, m 32 ~
33 ~.~,-,m
34 l'1i>T,.wr~. 1WT~. ~1WT, l'1i>T~ • ...mr, ~, wt l'1i>T
35 ~
36 ~
37 ~
38 ;:g CfiJHilf"""II, mu. ~. ~ 39 'IRft 40 ~
41 mm,~
42 ftR;ncg
43 ~
8 Basor, Burud, Bansor, Bansodi, Bansphor, Basar
9 Bedia
10 Beldar, Sunkar
11 Bhangi, Mchtar, Balmiki, Lalbegi. Dharkar
12 Bhanumati
13 Chadar
14 Chamar, Chamari, Bairwa. Bhambhi, Jatav, Mochi. Regar, Nona, Rohidas, Ramnami, Satnami, Surjyabanshi, Surjyaramnami, Ahirwar. Chamar, Mangan, Raidas
15 Chidar
16 Chikwa, Chikvi
17 Chitar
18 Dahait, Dahayat, Dahat
19 Dewar
20 Dhanuk
21 Dhed. Dher
22 Dohor
23 Dom, Dumar, Dome, Domar, Doris
24 Ganda, Gandi
25 Ghasi, Ghasia
26 Holiya
27 Kanjar
28 Katia, Patharia
29 Khatik
30 Koli, Kori
31 Khangar, Kanera, Mirdha
32 Kuchbandhia
33 Mahar, Mehra, Mehar
34 Mang, Mang Garodi, Mang Garudi, Dankhani Mang, Mang Mahasi, Madari, Garudi, Radhe Mang
317
35 Meghwal
36 Moghia
37 Muskhan
38 Nat, KaIbelia, Sapera, Navdigar, Kubutar
39 Pasi
40 Rujjhar
41 Sansi, Sansia
42 Silawat 43 Zamral
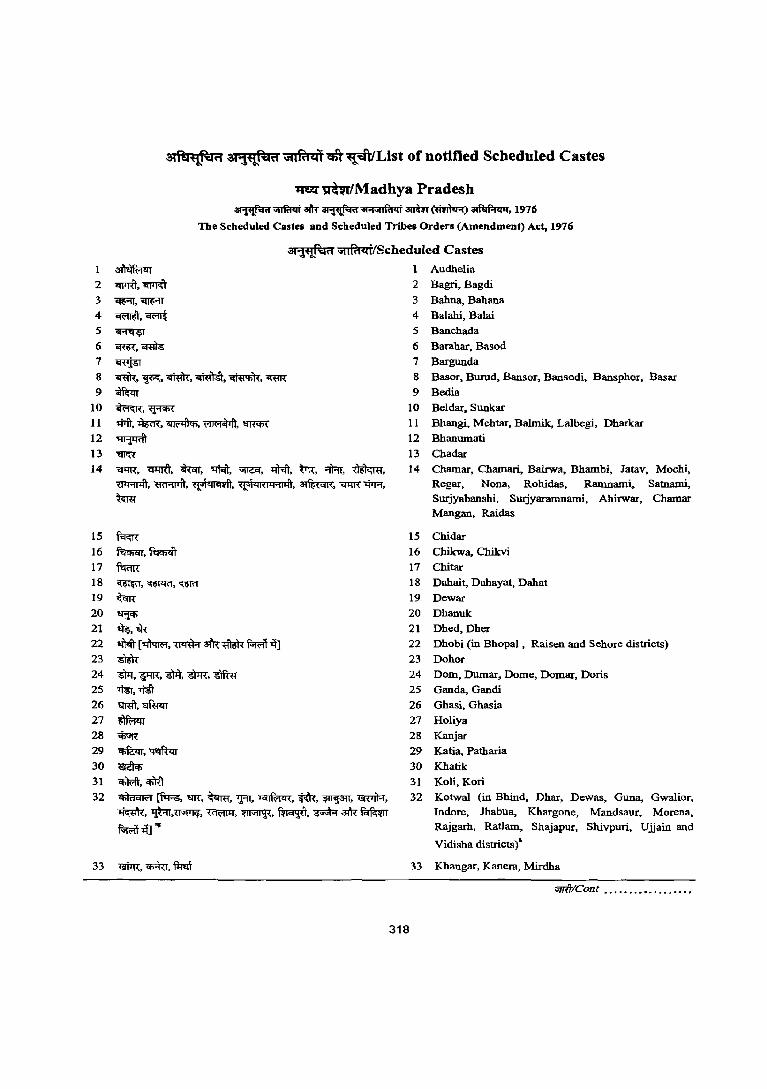
a:tftl~""'~" 31~~ft ",d:~<r1-$t~lst of notified Scbeduled Castes
~~/Madhya Pradesb ~~.~"'.NlIr..qianm(~)~.1976
The Scheduled Castes and Scheduled Tribes Orders (Amendment) Act, 1976
<IIrtRsi<'1 ~/Scheduled Castes
1 Audhelia
cw-:rr, ~ 4 ~. <R"IIt 5 6 ~
~,~
7 CRljsT 8 ornR,~,~, ~,~, ~ 9 ~
10 ~,~ 11 *it, ~, ~, ~, '!iJRi'f){
12 ~ 13 ~ 14 ~,~,~,~, ';iflGcf, 'I1Mt, trR, 0fRr, ~,
15
16 17 18 19
20 21 22 23 24 25 26 27 28 29
30 31 32
33
W1-lJl'ft, ~, ~, ~,;j;qRjl1""141, ~, "qlffi" 'lfrR.
t:.m
~ ~,~
frlm ~,~,<\imf
~
~ ~,~ ~ [~. ~ 3l'ttmrn f.;wit"Ill ~
W:r, WlR.~'~' ~ ~.@
~, <Ifulrr ~ ~ ~,~
~
~,~
~ [~, "lff, ~. '.fIT. ~, ~, ~3{T, ~, ~,~,~,~,~,~,~$~ ~"Il]~
~,q;;ffi,m
2 Bagri, Bagdi
3 Bahna, Bahana 4 Balahi, Balai 5 Banchada 6 Barahar, Basod
7 Bargunda 8 Basor, Burud, Bansor, Bansodi, Bansphor, Basar 9 Bedia
10 Beldar. Sunkar 11 Bhangi, Mehtar. Balmik, Lalbegi, Dharkar 12 Bhanumati 13 Chadar 14 Chamar, Chamari, Bairwa, Bhambi, Jatav, Mochi,
Regar, Nona, Rohidas. Ramnami, Satnami, Surjyabanshi, Surjyaramnami, Ahirwar, Chamar Mangan, Raidas
15 Chidar
16 Chikwa, Chikvi 17 Chitar 18 Dahait, Dahayat, Dabat
19 Dewar
20 Dhanuk
21 Dhed, Dher 22 Dhobi (in Bhopal, Raisen and Sehore districts) 23 Dohor 24 Dom, Dumar, Dome, Domar, Doris 25 Ganda, Gandi
26 Ghasi, Ghasia
27 Holiya
28 Kanjar 29 Katia, Patharia
30 Khatik 31 Koli, Korl
32 Kotwal (in Bhind, Dhar, Dewas. Guna, Gwalior, Indore, Jhabua, Khargone, Mandsaur, Morena, Rajgarh, Ratlam. Shajapur, Shivpurl, Ujjain and
Vidisha districts)'
33 Khangar, Kanem, Mirdha
"fTftICont •••.•..•••....••••
318
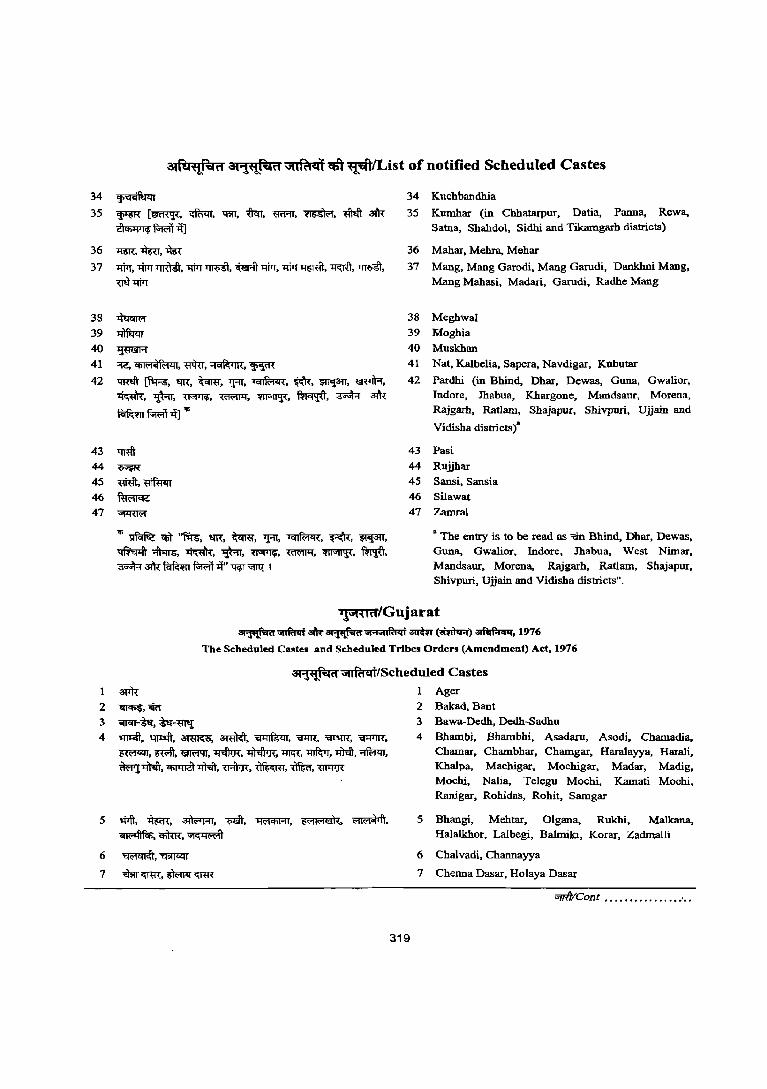
~f!.I~~H at~H ~$\'~/List of notified Scheduled Castes
34 ~
35 ~ ['ffi'RtF. ~, -qm, tI<ir, m'RT, ~, ~ aiR ~~it]
36 l'Im,~,~
37 'I1i1T, >fTTT 'I'IR)tt, tWr~, ~ l1i>T, 'I'IiTT~. ~, ~, ~'I'IiTT
38 ~
39 ~
40 ~ 41 ~ Cfiil"1;;lfMlll, ~, ~, 'JiiFR"
42 ~~, 'lR, ~, ':fIT'~' w,~,~, ~,~,~,~,~,~,~ ~ ~ fi>R;if -q] 'fi
43 'l'Rft 44 ~ 45 w,~ 46 fuW<fc;
47 ~
'fi ~ 'CfiT 'om, ttR", ~, 1f1I, ~, ~, ~3{T, ~~, ~, ~, ~, mffi'f. ~. m¢, ~ ~~~1f'lfcJT;;uq I
34 Kuchbandhia
35 Kumhar (in Chbatarpur. Datia, Panna, Rewa, 3atna, Shahdol, Sidhi and Tikamgarh districts)
36 Mahar, Mehra, Mehar
37 Mang, Mang Garodi, Mang Garudi, Dankhni Mang, Mang Mahasi, Madan, Garudi, Radhe Mang
38 Meghwal 39 Moghia
40 Muskhan
41 Nat, Kalbelia, Sapera, Navdigar, Kobutar
42 Pardhi (in Bhind, Ohar, Dewas, Guna, Gwalior, Indore, Jhabua, Khargone, Mandsaur, Morena, Rajgarh, Ratlam, Shajapur, Shivpuri, Ujjain and
43
44
45
46 47
Vidisha districtst
Pasi
Rujjhar
Sansi, Sansia
Silawat
Zamral
a The entry is to be read as '<in Bhind, Dhar, Dewas, Guna, Gwalior, Indore, Jhabua, West Nimar, Mandsaur, Morena, Rajgarh, RatIam, Shajapur, Shivpuri, Ujjain and Vidisha districts".
~/Gujarat
~~.~",,,,,,,Fct .. i~~)~.1976 The Scheduled Castes and Scheduled Tribes Orders (Amendment) Act, 1976
at'"fCi!~T.li;1 ~/Scheduled Castes
1 Ager
2 ~, em 3 ancrr-~, ~-~ 4 oqp:cft,~, amm;, ~, ~, '<Ilm:. ~, ~.
~, m, ~, ~, ~, lfIl1(, ~, lJl;:ft, ~, ~~, 'Cfi1ltIit~, ~, ~,~, m>I"R
5 $ft,~, ~, m, ~, ~, ~, ~,<!iTm:,~
6 ~,~
7 ~~,~<mR
319
2 Bakad, Bant 3 Bawa-Dedh, Dedh-Sadhu
4 Bhambi. Bhambhi. Asadaru. Asodi. Chamadia, Chamar. Chambhar, Charngar. Haralayya, Harali, Kbalpa, Machigar, Mochigar, Madar, Madig, Mochi, Nalia. Telegu Mochi, Karnati Mochi, Ranigar, Rohida"S, Rohit, Sarngar
5 Bhangi, Mehtar, Olgana, Rukhi, Malkana, Halalkhor. Lalbegi, Balmiki, Korar, Zadmalli
6 Chalvadi, Channayya
7 Chenoa Dasar. Holaya Dasar
;;rrftICont •...••••••...••• ' .•
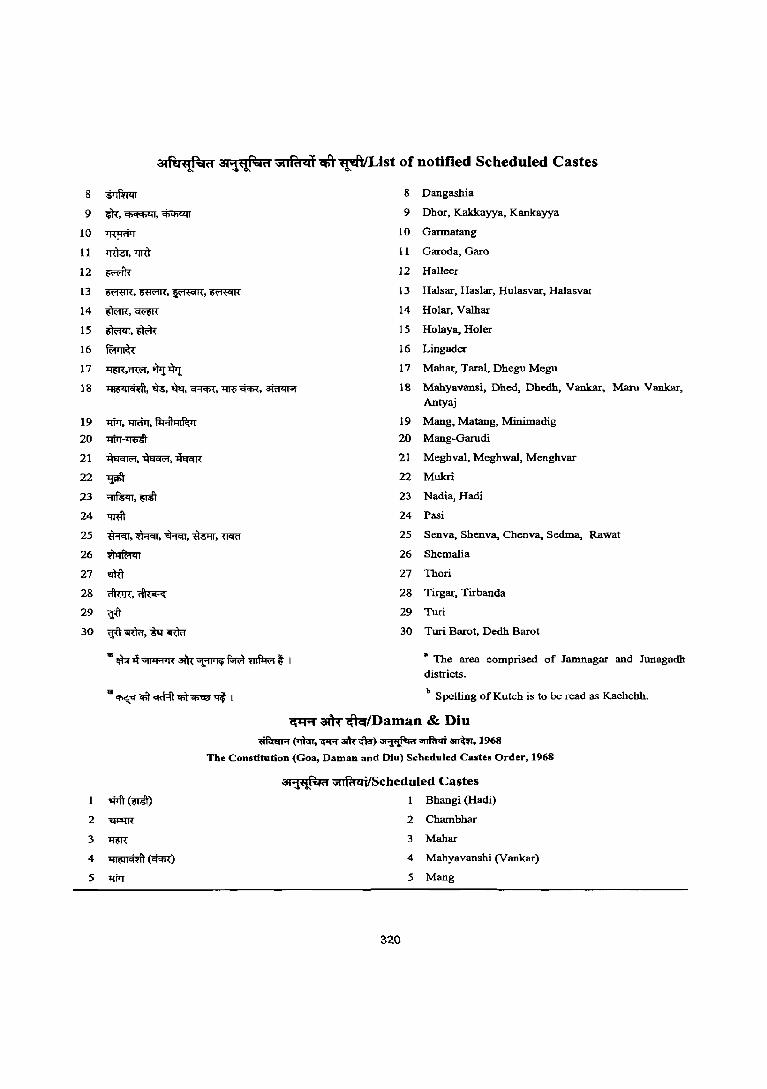
8
9
10
11
12
13
14
15
16
17
18
19
20
21
22
23
24
25
26
27
28
29
30
2
3
4
5
atfu't{l~('1 at~('1 ;iIlRt41lfft~JList of notified Scheduled Castes
~ 8 Dangashia
~,~,~ 9 Dhor, Kakkayya, Kankayya
~ 10 Garmatang
~,"lr{)' 11 Garoda, Garo
~ 12 Halleer
~,~,~,~ 13 Halsar, Haslar, Hulasvar, Halasvar
~,~ 14 Holar, Valhar
~,mm 15 Holaya, Holer
~ 16 Lingader
Xfrn,<m"r, ~ *r. 17 Mahar, Taral, Dhegu Megu
~. ~, tN, cr-r<1l<, "Ire 'Cjcp{, ~ 18 Mahyavansi, Dbed, Dbedh, Vankar, Maru Vankar, Antyaj
1WT, llRfrr, l14;jhHf~11 19 ~ang,~a~,~lltiLnadig
1WT-~ 20 ~ang-Garudi
~,~,~ 21 ~eghval, ~eghwal, Menghvar
~ 22 Mukri
~,~ 23 Nadia, Hadi
'tffift 24 Pasi
fficn, w..cu, ~, ~, <JCrff 25 Senva, Shenva, Chenva, Sedma, Rawat
~ 26 Shemalia
~ 27 Thori
rIW:rr,~ 28 Tirgar, Tirbanda
<Ft 29 Turi
<Ftatmr,~~ 30 Turi Barot, Dedh Barot
"'I$f-.l~a:ht~f.;wt~t I a The area comprised of Jamnagar and Junagadh
8 ~ <fit <iRf;:ft <fiT ~ ~ I
districts.
b Spelling of Kutch is to be read as Kachchh.
~ am-cftcr/Daman & Diu ~ (1'1l<rr,"lfIR ~;fuJ) ~..."r,m~. 1968
The Constitution (Goa, Daman and Diu) Scheduled Castes Order, 1968
ati'tl!';fd ~/Scheduled Castes
$it (-mt) 1 Bhangi (Hadi)
~ 2 Chambhar
Xfrn 3 Mahar
~('Cjcp{) 4 Mahyavanshi (Vankar)
1WT 5 Mang
320
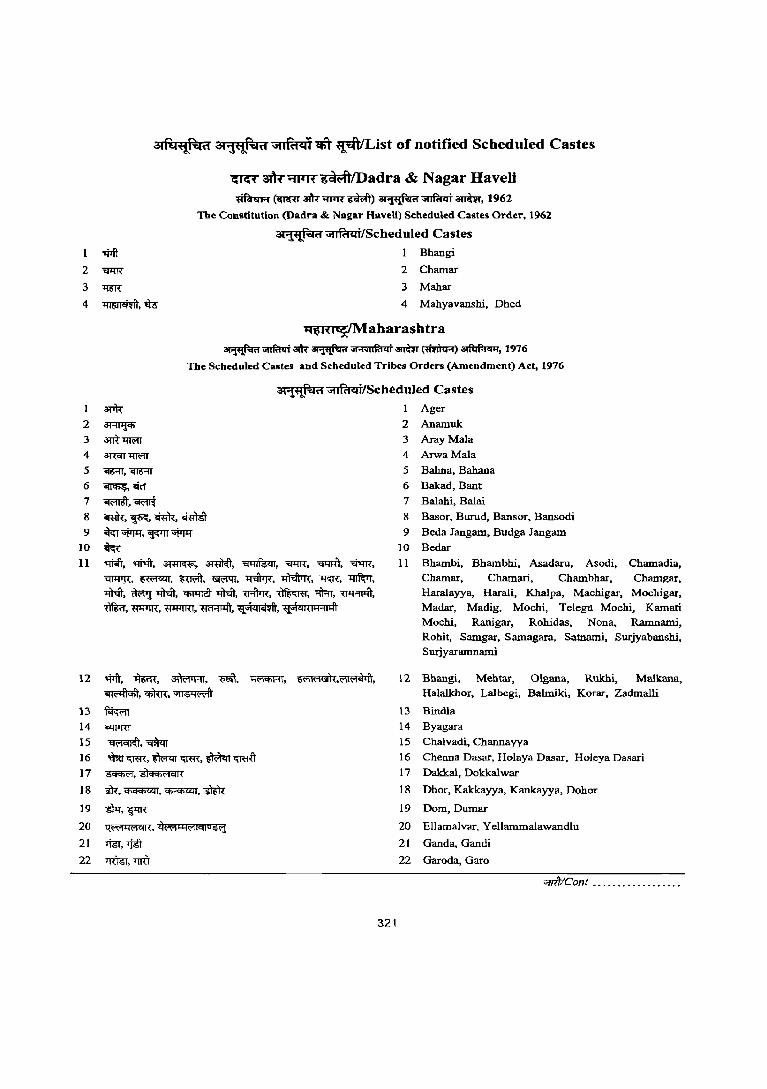
am:.~(1 aiifl!';:;j(1 iitlkt~l ctt ~ist of notified Scheduled Castes
en« 31tt';fl1'ff~lDadra & Nagar Haveli lffiIm;r~3!h-~~) ~~a:mm, 1962
The Constitution (Dadra & Nagar HaveU) Scheduled Castes Order, 1962
,;pft
3(~~(1 ~/Scheduled Castes
1 Bbangi
2 ~ 2 Chamar
3 'tim 3 Mahar
4 ~,tre- 4 Mahyavanshi, Dbed
~aharashtra
~OfIftm<llk~ 'ri'1'rilfll .. j ~~)~, 1976
The Scheduled Castes and Scheduled Tribes Orders (Amendment) Act, 1976
3('ft{r.:.t'I ~/Scheduled Castes
1 3PR 2 ~ 3 am-"J:ffi"lf 4 ~1ffi'1T
5 qg;:rr, CIl5-IT
6 ~,'ikf
7 ~,~ 8 <ml<,~,~,~
9 om"$p:;, ~"$p:; 10 ~ 11 "!tift, qNt, ~, ~, ~, ~, "Il1Ift, ~,
'i'fllPR, ~, ~, ~, ~, ~, ~, ~, ~,~~, ~~,~,~, "IRr,~,
~, W'fIlR", W¥TRT. m'FI'Jlit,~, ~"j"i{1""'11",,1
12 ~, ~, 3l1wRT, QOO, lWlCmT, ~,~,
~,~,~
13 ~
14 UUJRT
15 ~,~
16 mrri:Jm, ~i:Jm, ~~ 17 ~, 051%<'IClI{
18 ~,~,~,mm
19 ~,~
20 Qt"t"FWIClI(, QR'1 ....... t"11C11 0 S(j
21 rm, TfflT 22 TTOO, T"!Rl
321
1
2 3
4
5
6
7
8
9
10
II
Ager
Anamuk
ArayMala
ArwaMala
Bahna, Bahana
Bakad, Bant
Balahi, Balai
Basor, Burud, Bansor, Bansodi
BedaJangam, BudgaJangam
Bedar
Bhambi, Bhambbi, Asadaru, Asodi, Chamadia, Chamar, Chamari, Chambhar, Chamgar, Haralayya, Harali, Khalpa, Macbigar, Mochigar, Madar, Madig, Mochi, Telegu Mochi, Kamati Mochi, Ranigar, Rohidas, Nona, Ramnami, Rohit, Samgar, Sarnagara, Satnarni, Surjyabanshi, Swjyaramnarni
12 Bhangi, Mehtar. Olgana, Rukhi, MaJkana, Halalkbor, Lalbegi, Balmiki, Korar, Zadmalli
13 Bindla
14 Byagara
IS Chalvadi, Channayya
16 Chenna Dasar, Holaya Dasar, Ho1eya Dasari
17 Dakkal, Dokkalwar
18 Dhor, Kakkayya, Kankayya, Dohor
19 Dom, Dumar
20 Ellamalvar, Yellarnmalawandlu
21 Ganda, Gandi
22 Garoda, Garo
"ffITICont ...........•..•...
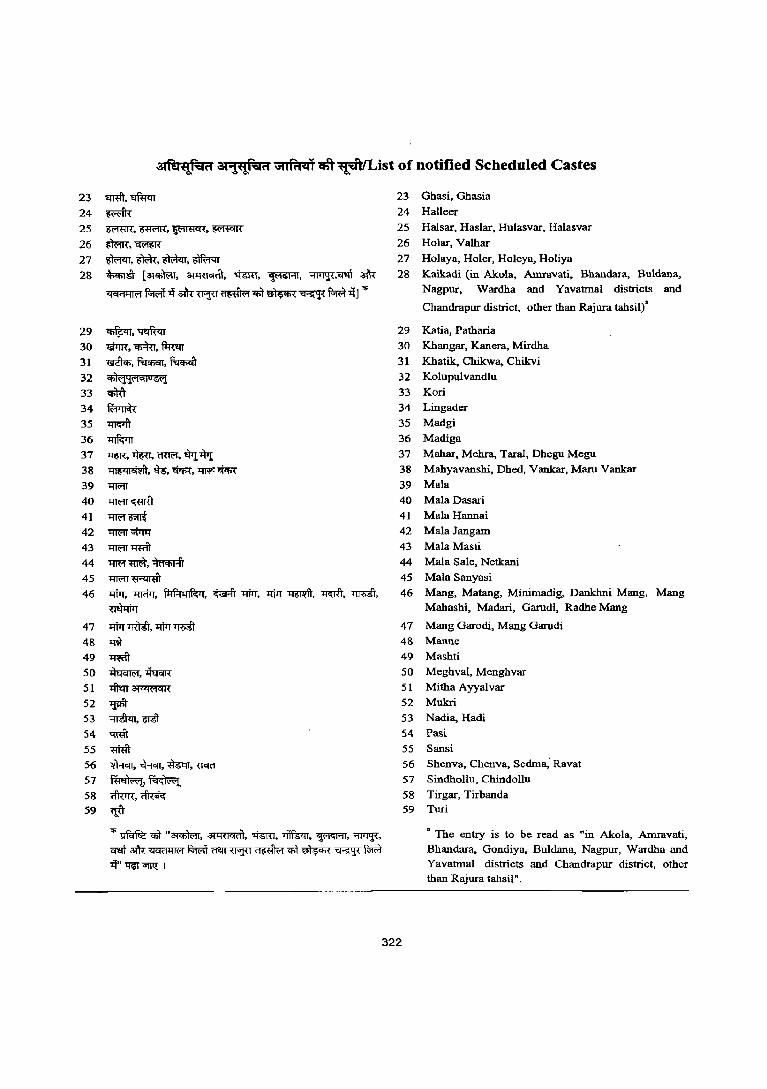
6Ifu~~H ~1~H \i111"d41 cfit~lList of notified Scheduled Castes
23 ~, 'EIfu'tn 24 ~ 25 ~,~,~.~
26 ~,~ 27 ~,mw,~,~
28 ~ [~, ~, .wu, ~, ~.~ :dR ~ fi;wif1f ~WjU <mfRorq;t ~~ f.;ffi1f] -.,;
29 CfifP:rr, ~ 30 <Si>m", ~, ~ 31 ~, ~, fuq:;cfr
32 i.f»~1I'1ql0'*l
33 q;)ft
34 ~
35 ~
36 ~ 37 ~,~, OUI'I", ~WI 38 ~, ~.~, 'I:fR!'~ 39 'l1f(':lT
40 'l1f(':lT~
41 11R't~ 42 'l1f(':lT'*tJf
43 'l1f(':lT~
44 11R't~,~
45 'l1f(':lT~
46 1:Itrr,"lll<i>T. fqf-l41f~jl, ~ 1TIrr. 1:Itrr ~. ~, llRdt, "{I$:rtrr
47 1:Itrr~, "fill ~ 48 -.:ffi 49 ~
50 ~,~
51 lftqy~
52 ~ 53 ~.-rnt 54 ~ 55 ~ 56 ~, ~, ~, \lCffl
57 ~~ 58 <furrr, <ilr.iG 59 <I.U
"'~'fi't"~,~,~,~,~,"'il'T'!" wrt 3l'tt ~ fi;wifn'<IT ~ ~'fi't ~ ~ ~ if"~~ I
23 Ghasi. Ghasia
24 Halleer
25 Halsar, Haslar, Hulasvar. Halasvar
26 Holar, Valhar
27 Holaya, Holer, Holeya, Holiya
28 Kaikadi (in Akola, AmIavati, Bhandara, Buldana, Nagpur, Wardha and Yavatmal districts and
Chandrapur district, other than Rajura tahsil)'
29 Katia, Patharia
30 Khangar, Kanem, Mirdha
31 Khatik. Chikwa. Chikvi
32 Kolupulvandlu
33 Korl
34 Lingader
35 Madgi
36 Madiga
37 Mahar, Mehra, Taral, Dhegu Megu
38 Mahyavanshi, Dhed, Vankar, Maru Vankar
39 Mala
40 Mala Dasari
41 Mala Hannai
42 Mala Jangam
43 Mala Masti
44 Mala Sale, Netkani
45 Mala Sanyasi
46 Mang, Matang, Minimadig, Dankhni Mang, Mang Mahashi, Madari, Garudi, Radhe Mang
47 Mang Garodi, Mang Garudi
48 Manne 49 Mashti
50 Meghval, Menghvar
51 Mitha Ayyalvar
52 Mukri
53 Nadia, Hadi
54 Pasi 55 Sansi 56 Shenva, Chenva, Sedma; Ravat
57 Sindhollu, Chindollu
58 Tirgar, Tirbanda 59 Turi
a The entry is to be read as "in Akola, AmIavati, Bhandara, Gondiya, Buldana, Nagpur, Wardha and Yavatmal districts and Chandrapur district, other than Rajura tahsil".
322
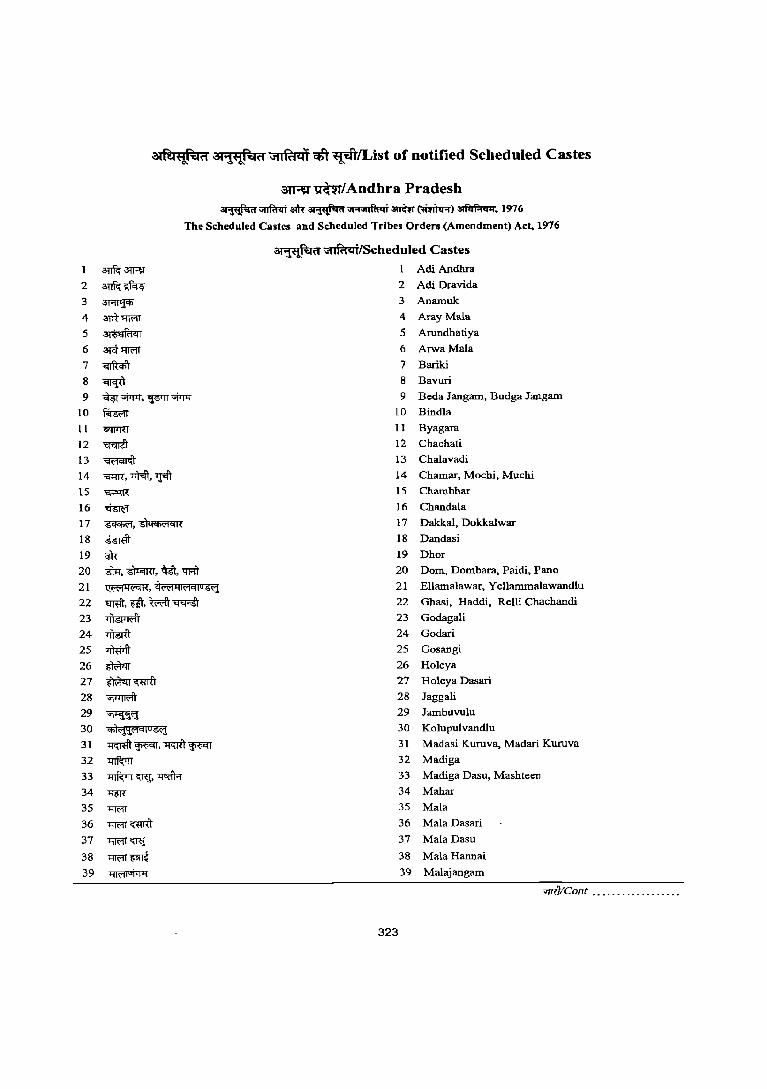
2 3 4
5 6
7 8 9
10
II 12
13
14 IS 16 17 18 19 20 21 22 23 24 25 26 27 28 29 30 31 32 33 34 35 36 37
38 39
.:st~~~rl 3t1~~rl \Jtll'aqt ctt ~/List of notified Scheduled Castes
31Rl ~/Andhra Pradesh ~~ am-~ ",,,,,,.l'IIqj ~ (lQahr-r)~. ]976
The Scheduled Castes and Scbeduled Tribes Orders (Amendment) Act, 1976
~3lRl
~~
3Rfl.J'f' am"'lWlT ~ 31<t~
~
~ <i9r $m, <j6'lT ~
f.irg<'If
<XWI'U
~ ~ "<I1m", ~, ~
~
~ ~, s)q<j)C'!cm.
~ em: 6]-q,~,~,t:Jl=it
~ffi4'-"""1<, ilffi'lIW-llus\j
~,W,tR'iT~
~ ~ -.-nwrr ~
mm~ ~
~ <t»~Hqlu:g\j
~~,~~ ~ "4"lWrr C\R.I. ~ "4m
l:ffi'!T
l1lRT~
l1lRT~
l1lRT~ ~
3!~ft ~/Scheduled Castes
I Adi Andhra
2 Adi Dravida
3 Anamuk
4 kay Mala
5 AIundhatiya
6 ArwaMala
7 Bariki
8 Bavuri
9 Beda Jangam, Budga Jangam
10 Bindla
11 Byagara
12 Chachati
13 Chalavadi
14 Chamar, Mochi, Muchl
15 Chambhar
16 Chandala
17 Dakkal, Dokkalwar
18 Dandasi
19 Dhor
20 Dom, Dombara, Paidi, Pano
21 EUamalawar, Yellammalawandlu
22 Ghasi, Haddi, Relli Chachandi
23 Godagali
24 Godari
25 Gosaogi
26 Holeya
27 Boleya Dasari
28 Jaggali
29 Jambuvulu
30 Kolupulvaodlu
31 Madasi Kuruva, Madari Kuruva
32 Madiga
33 Madiga Dasu, Mashteen
34 Mahar 35 Mala
36 Mala Dasari
37 Mala Dasu
38 Mala Haonai
39 Malajangam
"ffftICont ................. .
323
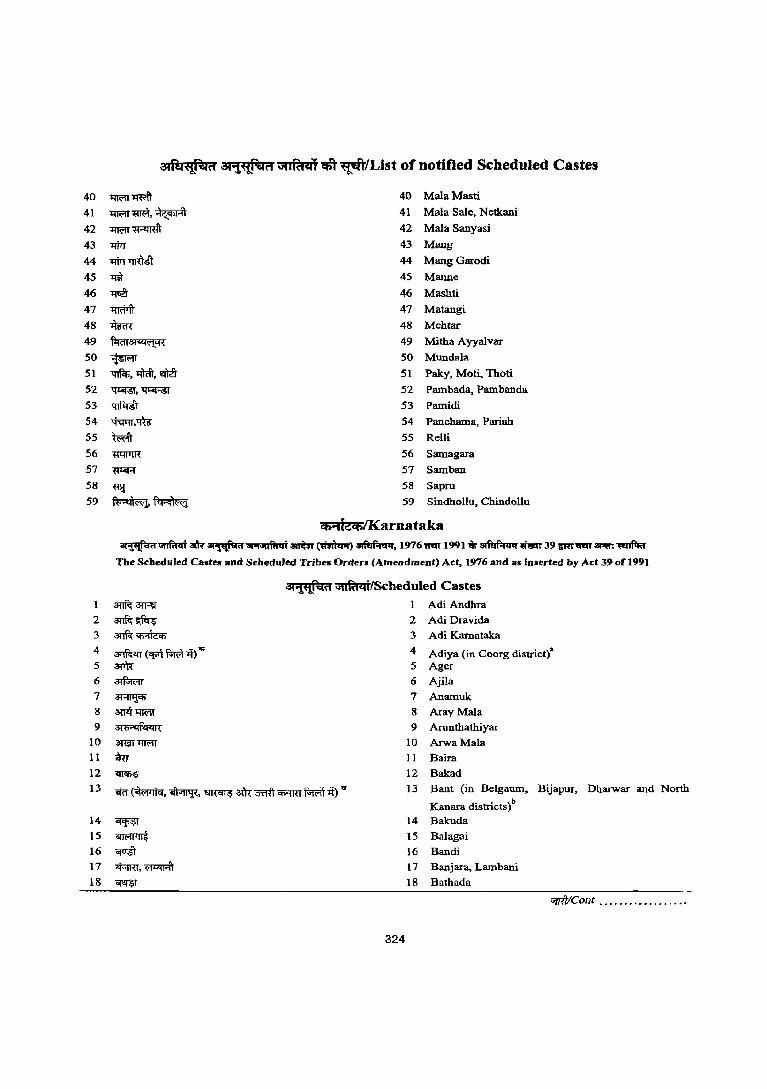
40
41
42 43 44
45 46
47 48 49 50 51 52 53 54 55 56 57 58 59
2 3
4
5 6
7 8
9 10 11
12 13
14
15 16 17 18
34itl"if'cfH arii!~(1 JtIRien cST ~/List of notified Scheduled Castes
1'fROIT 1ffift 40 MalaMasti
1'fROITm,~ 41 Mala Sale, Netkani
1'fROIT~ 42 Mala Sanyasi
l1i>T 43 Mang
~TJRliT 44 Mang Garodi
.m 45 Manne
~ 46 Mashti
"I'Iffi"lft 47 Matangi
~ 48 Mc:htar
m~ 49 Mitha Ayyalvar
~ 50 Mundala .,~.~ 51 Paky, Moti, Thoti
~,~ 52 Pambada, Pambanda
~ 53 Pamidi
~.~ 54 Panchama, Pariah
tR'it 55 Relli
"f!l11TlR 56 Samagara
lIl4R 57 Samban
~ 58 Sapru
~~ 59 Sindhollu, Chindollu
cti"fieCfi/Karnataka ~~ .~"''''''Ifa .. i awmr~)~, 1976i11!fT 1991.~~ 39'1Rr'qfll'~~
The Scheduled Castes and Scheduled Tribes Orders (Amendment) Act, 1976 and as Inserted by Ad 39 of 1991
OI'i't1l~d ~/Scheduled Castes a:nf.{ 3!Rf 1 Adi Andbra
a:nf.{~ 2 Adi Dravida
anR~ 3 Adi Karnataka
~ (<fill FIB -q) ,.; 4 Adiya (in Coorg district)" a:rR 5 Ager
~ 6 Ajila
~ 7 Anamuk:
awl' l:!R'IT 8 ArayMala ;3H)"",,~,,1{ 9 Arunthathiyar
3l1§T TffiOIT 10 ArwaMala
~ 11 Bairn
~ 12 Bakad
oRr (~, ~. ~ afu:"3'iffi <i>'1TU f.;wit -q) ... 13 Bant (in Belgaum,
Kanara districts)b
Bijapur, Dharwar and North
~ 14 Bakuda
~ 15 Balagai
G!uit 16 Bandi
'$tm,~ 17 Banjara, Lambani
~ 18 Bathada
"ffft/Cont ..................
324
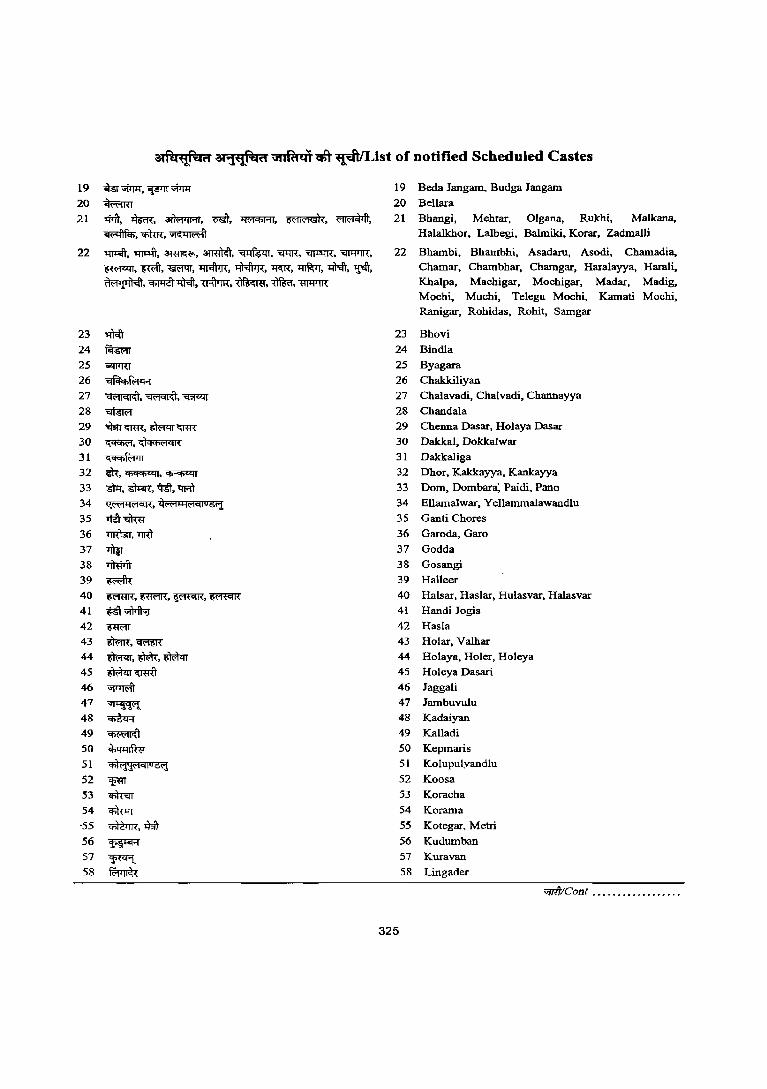
~M~R:.H at1~H \itlfi:t<tl cfiT ~/List of notified Scheduled Castes
19 -rn'*m. ~'*m 20 clR=!m 21 ~,~.~,m,~,~,~,
~,Cfilm:,~
22 '11MlT.~,~,~.~, 'EIliR, ~, 'flTl1'l1R,
~, -mfr,~,~, ~,~, ~,-qfcfi,~, ~,~~,~,~,~,~
23 q)cft
24 ~ 25 ozwm 26 '€Iiifq,f""ll"'1
27 ~,~,"ffl"lZII' 28 ~ 29 '<)m~,~~ 30 ~, q'j#){1<1i(
31 ~ 32 ;zh:,~,~
33 ~, ~, ~, trFit 34 ~'i{'1cm" QffiU1M<UU6t1
35 -.m~ 36 mmr, TJTU 37 lllF 38 ~ 39 ~ 40 ~,~,~,~ 41 ~~ 42 ~ 43 ~,'Cffim 44 ~,~,~ 45 ~eymT
46 ~ 47 ~ 48 ~ 49 ~ 50 ~ 51 q;1t1'jM<ilu6t1
52 'f?m 53 ~ 54 ~ ·55 ~,~ 56 ~ 57 ~ 58 ~
19 Beda Jangam, Budga Jangam
20 Bellara 21 Bhangi, Mehtar, Olgana, Rukhl, Malkana,
Halalkhor, Lalbegi, Balmiki, Korar, Zacimalli
22 Bhambi. Bhambhi, Asadaru, Asodi, Chamadia, Chamar, Chambhar, Chamgar, Haralayya, Harali, Khalpa, Machigar, Mochigar, Madar, Madig, Mochi, Muchi, Telegu Mochi, Kamati Mochi. Ranigar, Rohidas, Rohit, Samgar
23 Bhovi
24 Bindla
25 Byagara
26 Chakkiliyan
27 Chalavadi, Chalvadi, Channayya
28 Chandala 29 Chenna Dasar, Holaya Dasar
30 Dakkal, Dokkalwar
31 Dakkaliga 32 Dhor, Kakkayya, Kankayya
33 Dom, Dombara; Paidi, Pano
34 Ellamalwar, Yellammalawandlu
35 Ganti Chores
36 Garoda, Garo
37 Godda
38 Gosangi
39 Halleer
40 Halsar, Haslar, Hulasvar, Halasvar
41 Handi Jogis
42 Hasla
43 Rolar, Valhar 44 Rolaya, Holer, Holeya
45 Holeya Dasari
46 Jaggali
47 lambuvulu
48 Kadaiyan
49 Kalladi
50 Kepmaris 51 Kolupulyandlu
52 Koosa
325
53 Koracha
54 Korama
55 Kotegar. Metri
56 Kudumban
57 Kuravan
58 Lingader
UfTIt/Cont •••.•..•.•••••••.•
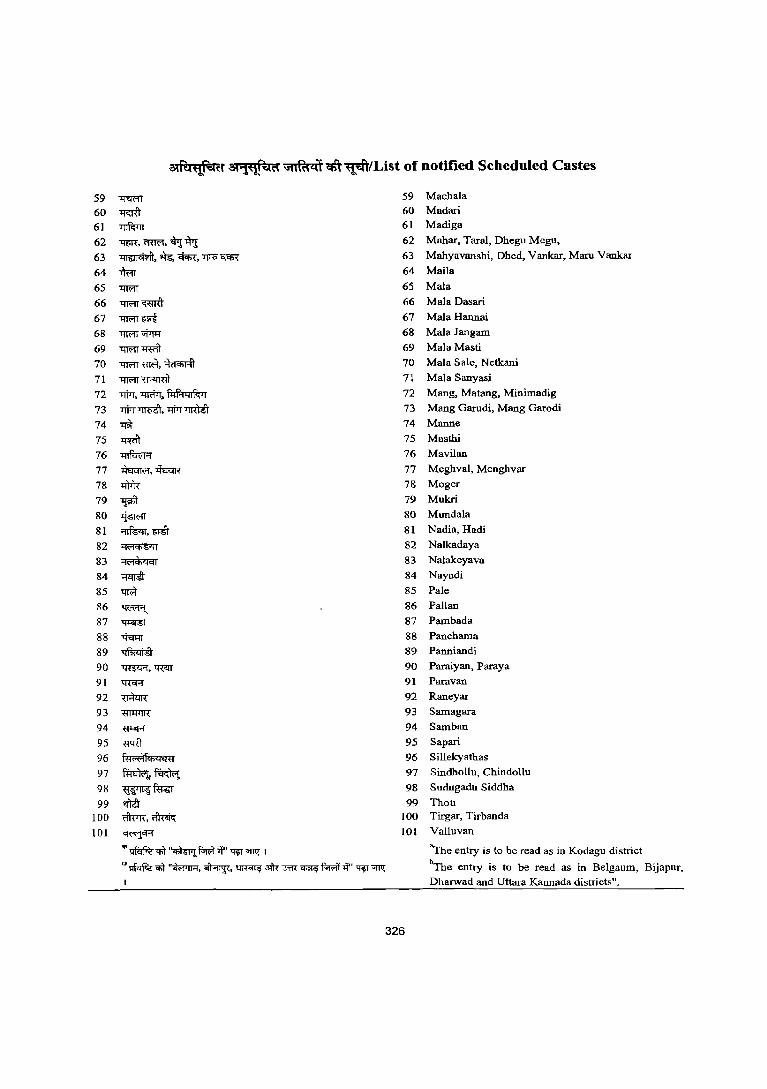
59 1'f'€R'IT 59 Machala
60 ~ 60 Madari
61 lilWn 61 Madiga
62 -rm<. mwt. w.r ~ 62 Mahar. Taral, Dhegu Megu,
63 ~,~~,'I:JT"$q~ 63 Mahyavanshi, Dhed, Vankar, Maru Vankar
64 ~ 64 Maila
65 1ffi'IT 65 Mala
66 1ffi'IT <rnffi 66 Mala Dasari
67 1ffi'IT~ 67 Mala Hannai
68 1ffi'IT~ 68 Mala Jangam
69 1ffi'IT~ 69 Mala Masti
70 1ffi'IT~,~ 70 Mala Sale, Netkani
71 1'lR'fT~ 71 Mala Sanyasi
72 1'1iTr,~~ 72 Mang, Matang, Minimadig
73 1'1iTr~.1'1iTr~ 73 Mang Gorudi, Mang Garodi
74 ~ 74 Manne
75 'If'f<'ft 75 Masthi
76 l'fIliwr;; 76 Mavilan
77 ~,~ 77 Meghval, Menghvar
78 lll>tt 78 Moger
79 ~ 79 Mukri
80 ~ 80 Mundala
81 ~,mit 81 Nadia, Hadi
82 ~ 82 Nalkadaya
83 ~ 83 Nalakeyava
84 ~ 84 Nayadi
85 ~ 85 Pale
86 ~ 86 Pallan
87 ~ 87 Pambada
88 -.:f<mT 88 Panchama
89 ~ 89 Panniandi
90 1lWR, twrr 90 Paraiyan, Paraya
91 'RCR' 91 Paravan
92 ~ 92 Raneyar
93 "ffill111t 93 Samagara
94 ~ 94 Samban
95 <r<ffi 95 Sapari
96 ft1R'lfCf>'"I1!1'H 96 Sillekyathas
97 ~~ 97 Sindhollu, Chindollu
98 ~ft«::r 98 Sudugadu Siddha
99 mit 99 Thot)
100 ffitrR,~ 100 Tirgar, Tirbanda
101 ~ 101 Valluvan
'"~q;)"~~-.f'~omr I "The entry is to be read as in Kodagu district
'"~q;) "~,~, ~ afR<ITR~f.wif Jl" ~"ITI!; bThe entry is to be read as in Belgaum, Bijapur, Dharwad and Uttara K3lUlada districts".
326
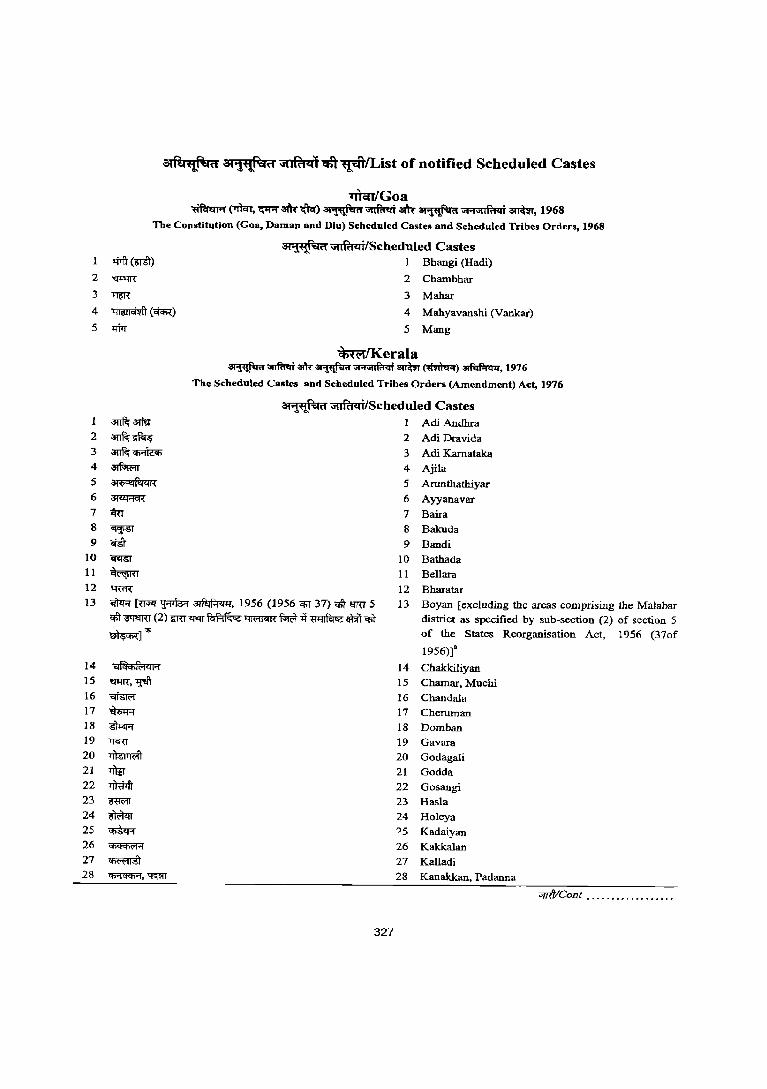
atRl'*l!~d at~d ~~~lList of notified Scheduled Castes
TJTcn'lGoa ~ ("I"Ilcn, ~~~) ~~~ ~ ..... "',Rtqj anW, 1968
The Constitution (Goa, Daman and Diu) Scheduled Castes and Scheduled Tribes Orders, 1968
.:fT"IT(m\)
2 W'lI\
3 'l'lm
4 ~(~)
5 lWT
a:r@;"aW 2 a:r@;"~
3 a:r@;"~
4 ~
5 at '6""1 (ejll i{
6 ~
7 ~ 8 ~ 9 <iit
10 ~
11 ~ 12 ~
<I'I':W.'~"ld ~/Scheduled Castes 1 Bhangi (Hadi)
2 Chambhar
3 Mahar
4 Mahyavanshi (Vankar)
5 Mang
~lKerala ~~am-~"''''''If?t<d ~~)~, 1976
The Scheduled Castes and Scheduled Tribes Orders (Amendment) Act, 1976
311~~d ~/Scheduled Castes 1 AdiAndhra
2 Adi Dravida
3 Am Karnataka
4 Ajila
5 Arunthathiyar
6 Ayyanavar
7 Baira 8 Bakuda
9 Bandi 10 Bathada 11 BeIIara
12 Bharatar 13 ~ [Wlf ~~, 1956 (1956 q;r 37) qlt "1ffi 5
qlt~ (2) iffiT~~~m"if~~~ 13 Boyan [excluding the areas comprising the Malabar
district as specified by sub-section (2) of section 5
of the States Reorganisation Act, 1956 (37of
1956)]"
14 ilf4¥R=tll H
15 -;:pm-, 1fCIt 16 ~ 17 ;W:r-r
18 ~ 19 "fJCR[
20 ~ 21 T])gr 22 TJ1WlT 23 ~ 24 ~ 25 ~ 26 ~ 27 ~ 28 ~,~
327
14 Chakkiliyan 15 Chamar, Muehi 16 Chandala 17 Cheruman 18 Domban 19 Gavara 20 Godagali 21 Godda 22 Gosangi 23 Hasla
24 Holeya '>5 Kadaiyan 26 Kakkalan
27 Kalladi 28 Kanakkan, Padanna
vrrttlCont •..•...•...•.••...
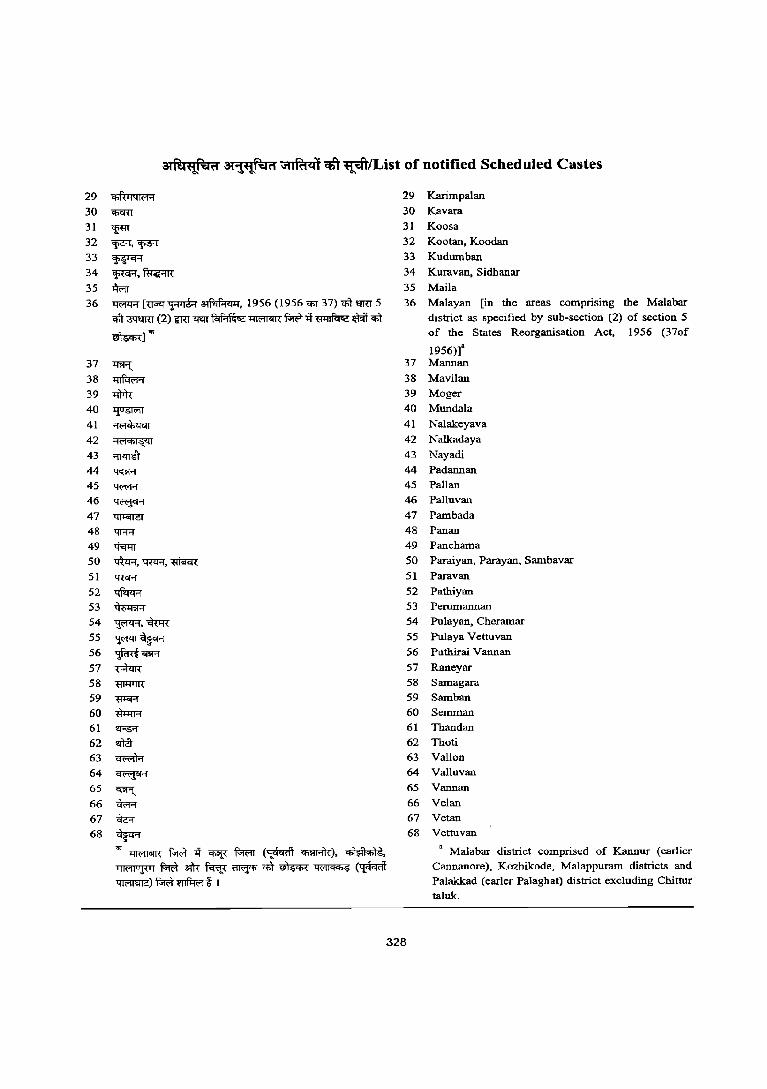
Oi~~H 3t"!fV"'ilH ~ ctft ·~~ft'lList of notified Scheduled Castes
29 <iif"Nl<'1'1
30 "<iiCm
31 'fl!T 32 ~,~ 33 ~
34 ~,~ 35 4ffi 36 'tWflFl [~~~, 1956 (1956 q;r 37) 'If>11lm 5
'If>1"3GmU (2) iffiT ~ ~ 1'lW!fiIIT m it ~ $it '<tiT ~]'"
37 mF!. 38 'I'I'Jfc:wR 39 11Ph: 40 ~ 41 ~
42 ~ 43 ~
44 'roR
45 <m+1
46 ~ 47 'tfll4I'I6T
48 'lR"f
49 $p::rr
50 ~,~,~
51 WCFI
52 ~ 53 ~
54 'FPR,~
55 'F'<IT~ 56 'ffiRt Cffi1
57 ~ 58 ~ 59 'W4R
60 ~
61 I!RR
62 W 63 ~
64 ~
65 ~ 66 ~
67 m 68 ~
'" 1'lW!fiIIT ~ it ~ ~ (~ ~), ~, ~ ~ 31tt ~ ~ '<tiT ~ ~ (~ ~) f>rR wfi:rR % I
29 Karimpalan 30 Kavara
31 Koosa
32 Kootan, Koodan
33 Kudurnban
34 Kuravan, Sidhanar
35 Maila 36 Malayan [in the areas compnsmg the Malabar
district as specified by sUb-section (2) of section 5 of the States Reorganisation Act, 1956 (37of
1956)], 37 Mannan
38 Mavilan 39 Moger 40 Mundala
41 Nalakeyava 42 Nalkadaya
43 Nayadi
44 Padannan 45 Pallan 46 Palluvan
47 Pambada
48 Panan 49 Panchama 50 Paraiyan, Parayan, Sambavar
51 Paravan
52 Pathiyan 53 Perumannan 54 Pulayan, Cheramar
55 Pulaya Vettuvan
56 Puthirai Vannan
57 Raneyar 58 Samagara 59 Samban
60 Semman 61 Thandan 62 Thoti 63 Vallon 64 Valluvan
65 Vannan
66 Velan 67 Vetan 68 Vettuvan
a Malabar district comprised of Kannur (earlier Cannanore), Kozhikode, Malappuram districts and Palakkad (earler Palaghat) district excluding Chiuur taluk.
328
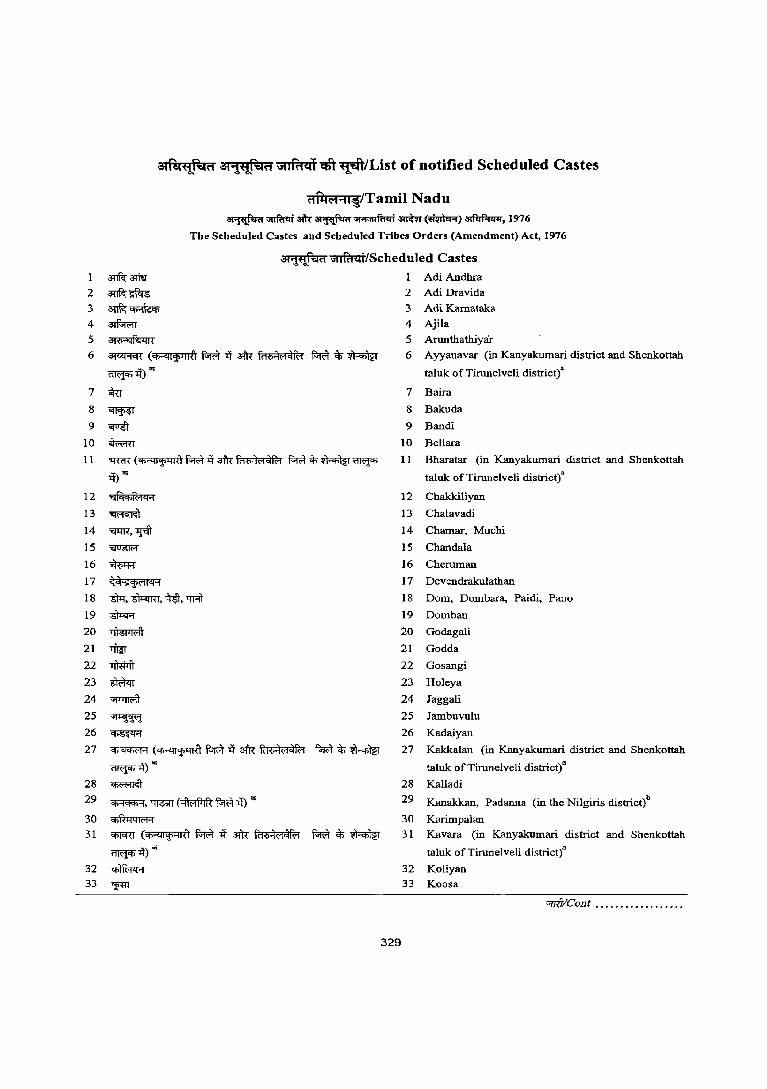
otf!:cfJjT.aH 311W-aH ~ qft lfdl/List of notified Scheduled Castes
HM('1""t~/Tamil Nadu ~~.~""MltiI.<i ~(~)~, 1976
The Scheduled Castes and Scheduled T.ibes Orders (Amendment) Act, 1976
a:t:pf",UI ~/Scheduled Castes
anf<:: amr 2 ~OO
3 ~~
4 ~
5 3l6'""lm<li{
6 3J<ZRCR (Cf?1I'J1'"1lil f;wl1l :a:ftr fli'6"lI"l~f('i ~ ~ ~
~1l)"
7 om 8 ~
9 'ifITit 10 -.ffi;m
II '<mIT(Cfi'"'"lI'JI4Hlf;wl1l~f<i'6:'j<'1~~ ~~~~
-.t)'"
12 i:lM<hlWH
13 ~
14 'qqR,"'l"fi 15 ~
16 ~
17 k4=<;;'JI1"I14"1
18 sm,~, ~, 'l'Fit 19 ~
20 ~
21 'l1lgr
22 ~
23 itWn 24 "'fTI11"I"Il
25 ~
26 ~
27 'Cfi"~ ('f>'"'"I1'JI41{\ f;wl1l ~ fd6;'jI"l~f<'1 ~ ~ ~
~ll)'" 28 ~
29 ~, ~ (~f';ffi1l> '"
30 Cf>R:qqlt'1"1
31 'Cf>l'<ro (q;0<l1'JI4Ifl f;wl 1l ~ f(F(>"lw~f('i f.;w1 ~ ~
~ll)'" 32 ~
33 'FIT
329
Adi Andhra
2 Adi Dravida
3 Adi Karnataka
4 Ajila
5 Aruntbatbiyar
6 Ayyanavar (in Kanyakumari district and Shenkottah
taluk of Tirunelveli district)'
7 Baira
8 Bakuda
9 Bandi
10 Bellara
11 Bharatar (in Kanyakumari district and Shenkottah
taluk of Tirunelveli district)"
12 Chakkiliyan
13 Chalavadi
14 Chamar, Muchi
15 Chandala
16 Cheruman
17 Devendrakulathan
18 Dom, Dombara, Paidi, Pano
19 Domban
20 Godagali
21 Godda
22 Gosangi
23 Holeya
24 Jaggali
25 J ambuvulu
26 Kadaiyan
27 Kakkalan (in Kanyakumari district and Shenkottah
taluk ofTirunelveli district)'
28 Kalladi
29 Kanakkan, Padanna (in the Nilgiris district)b
30 Karimpalan
31 Kavara (in Kanyakumari district and Shenkottah
taluk ofTirunelveli districtt
32 Koliyan
33 Koosa
'Wit/Cont ....... .......... .
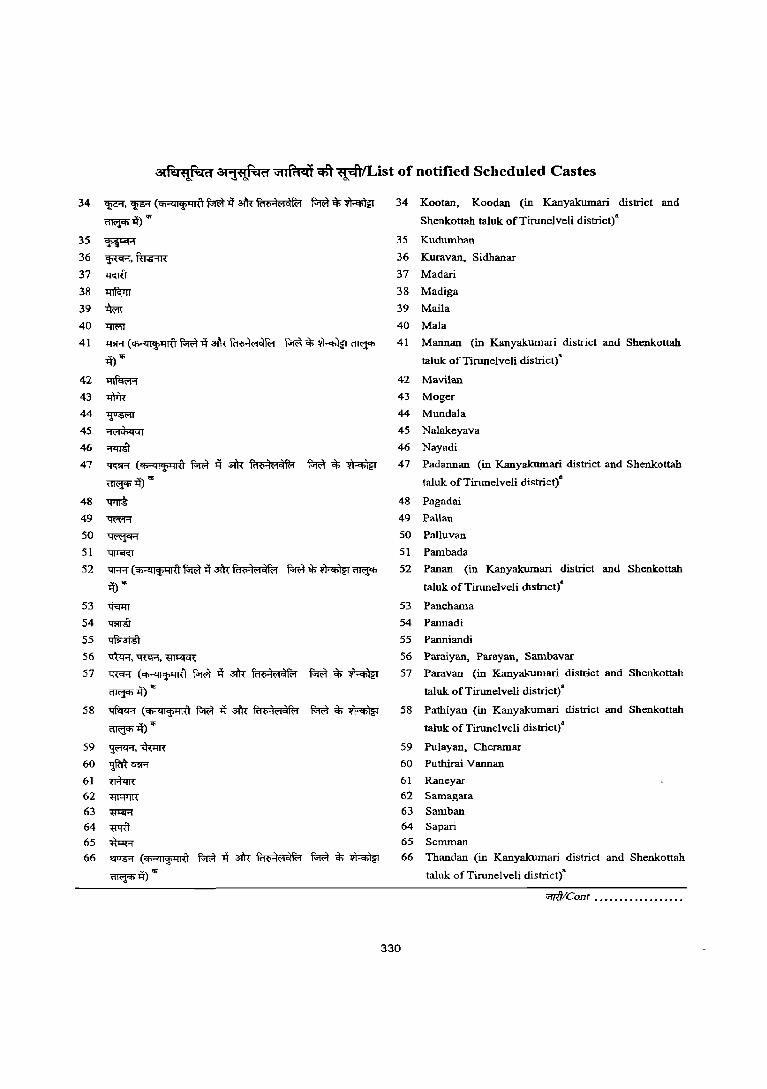
31fu~d at~';;jR iJ1liftctt qft~/List of notified Scheduled Castes
34 ~,'f&l' (q;"'4I'1'''1Hl f-;n;f 1l afR frt'Clilt'1~f.;;t f.;wf *" ~ ~1l) '6
35 ~
36 ~,~
37 wOO 38 111Wrr 39 ~
40 'llI"t'1T
41 1'f>Ff (Cfi"'llc:t''llt'l f.;wf'it aiR f<1'tl4t'1ClR1 f.ifR * ~ ~ It)'''
42 ~
43 11l>R 44 ~
45 ~
46 ~
47 tror-r (q;"'4I'1'''1Hl ~ if afR f<H>4t'1~f~ f.;wf *" ~ ~if)'"
48 ~
49 ~
50 ~
51 w<r<:J
52 "GFH(q;"'4I'1''lIt\~'itafRfi1'tlilt'1~ft'1 f-iIR*"~~
'it) '"
53 $Il:rr
54 ~
55 Wr-mT 56 ~, "<f{l:R, ~
57 ~ (Cfi"'lI'1'''1lfl ~ if 3I'R fi1'tl4(i1~fC1 ~ * ~ ~'it)'"
58 ~ (Cfi"'lI".{i'lRI f.;wf'it afR R1'tl4(i1~R1 ~ * ~ ~1l)'"
59 lJWR,~
60 '3.fut Cffi'1
61 ~
62 'm"1'1R
63 W<iR
64 mTI 65 ~
66 ~ (q;"'4I'1'''1I<l f;rot 'it 3I'R f<1'tl4t'1<lf<1 ~ *" ~ ~it)'"
34 Kootan, Koodan (in Kanyakumari district and
Shenkottab taluk ofTirunelveli district)"
35 Kudumban
36 Kuravan, Sidhanar
37 Madari
38 Madiga
39 Maila
40 Mala
41 Manuan (in Kanyakumari district and Shcnkottah
taluk ofTirunelveli district)-
42 Mavilan
43 Moger
44 Mundala
45 Nalakeyava
46 Nayadi
47 Padannan (in Kanyakumari district and Shenkottah
taluk ofTirunelveli district)"
48 Pagadai
49 Pallan
50 Palluvan
51 Pambada
52 Panan (in Kanyakumari district and Shenkottah
taluk ofTirunelveli district)"
53 Panchama
54 Pannadi
55 Panniandi
56 Paraiyan, Parayan, Sambavar
57 Paravan (in Kanyakumari district and Shenkottah
taluk of Tirunelveli district)"
58 Pathiyan (in Kanyakumari district and Shenkottah
taluk of Tirunelveli district)"
59 Pulayan, Cheramar
60 Puthirai Vannan
61 Raneyar 62 Samagara
63 Samban
64 Sapari
65 Semman
66 Thandan (in Kanyakumari district and Shenkottah
taluk of Tirunelveli district)-
U'fliTICont ................. .
330
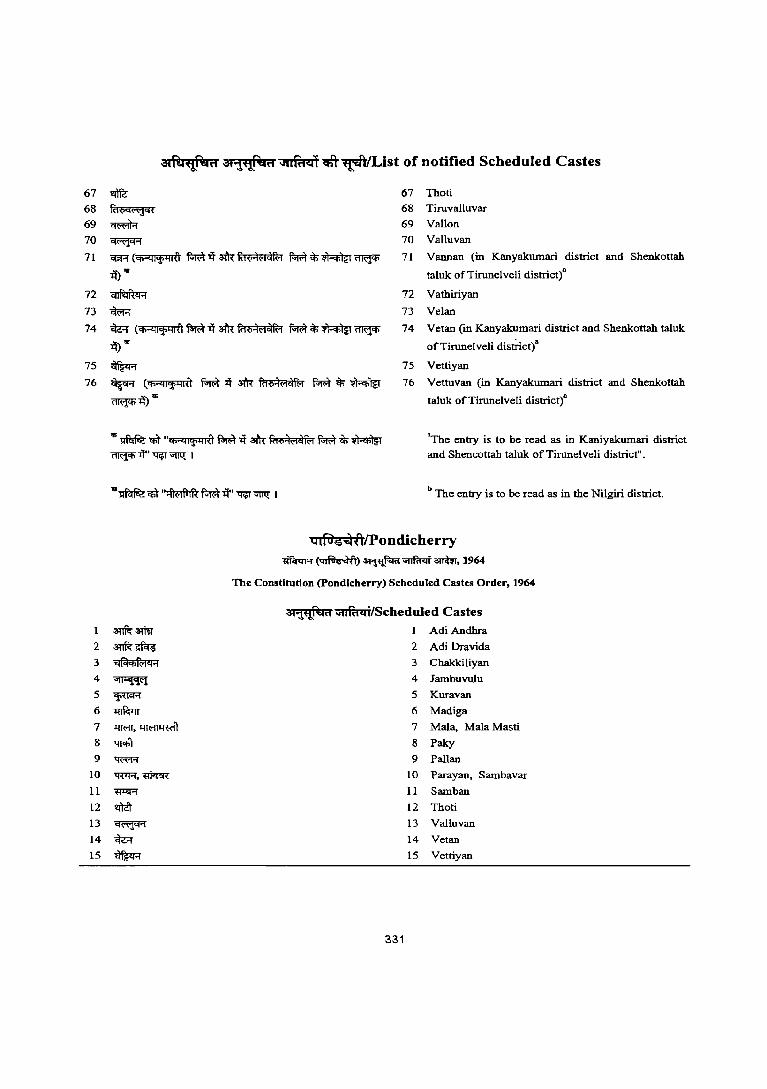
atRl~""~h'l at~~" ~qft~List of notified Scheduled Castes
67 ~
68 fC'1<><!ctj<n 69 "1ffi'1R 70 ~
71 ern:; {"hO<J1'l'41{1 f.;wt 11" 3ltt fC'1'64{'1~f~ f.m:?t"* ~ ~ ll)'"
72 ~
73 ~
74 ~ (<tiO<J1'l'41{1 f.;wt 11" 3ltt f0<>4{'1~R1 f.m:?t"* ~ ~ ~ ...
75 ~
76 ~ (<tiO<J1'l'41{1 f.;wt 11" afR fC'1<>4{'1~fH ~"* ~
~~'"
... ~ <t>T "<tiO<Ji'l'4i:O f.;wt.q am- f<t<>:?jt"l~f<:"i f.;wt"* ~ ~-if'''''fI~i
67 Thoti
68 Tiruvalluvar
69 Vallon
70 Valluvan
71 Vannan (in Kanyakumari district and Shenkottah
taluk ofTirunelveli district)8
72 Vathiriyan
73 Velan
74 Vetan (in Kanyakumari district and Shenkottah taluk
ofTirunelveli district)'
75 Vettiyan
76 Vettuvan (in Kanyakumari district and Shenkottah
taluk ofTiruneLveli district)"
"The entry is to be read as in Kaniyakumari district and Shencottah taluk of Tirunelveli district".
b The entry is to be read as in the Nilgiri district.
q IfUe:i1:filPondicherry ~~)~~amm,1964
The Constitution (Pondicherry) Scheduled Castes Order, 1964
3l~'"'~ri ~/Scheduled Castes 1 ~amr 1 Adi Andhra
2 anR~ 2 Adi Dravida
3 T4WW'i'1 3 Chakkiliyan
4 ~ 4 lambuvuLu
5 ~ 5 Kuravan
6 ~ 6 Madiga
7 mRT,~ 7 Mala, Mala Masti
8 'fiCf>"r 8 Paky
9 'lR'R 9 Pallan
10 'WR,~ 10 Parayan, Sambavar
II ~ 11 Samban
12 ~ 12 Thoti
L3 ~ 13 Valluvan
14 ~ 14 Vetan
15 ~ 15 Vettiyan
33'1
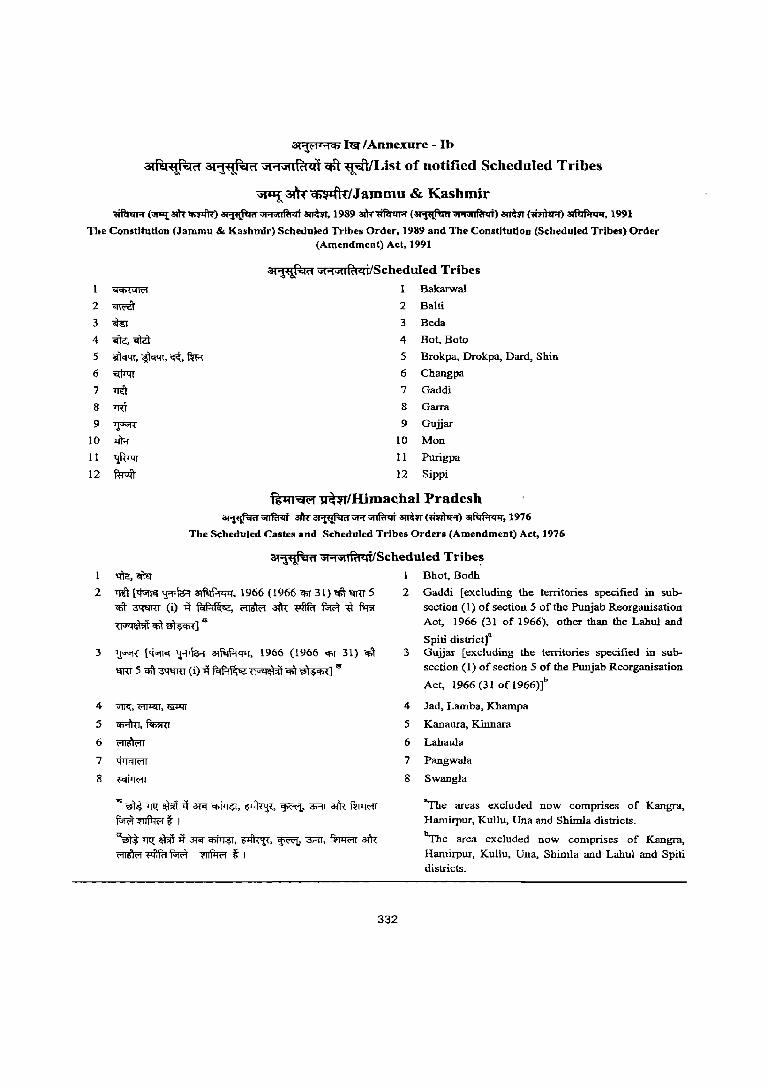
3iiM'''1Cfi Iw/Annexure - Ib
ac:ftc~""":(H o{~~H \Oi\91\l11{'Rcil ctf~/List of notified Scheduled Tribes
\iI"t. .~/Jammu & Kashmir ~ (~adl"<fi'fifR) ~ ",.Nt,f.!"j amm, 1989 3Ilt~ (~",,,,,,,f.!,,j) atmr (l:irlv.r) ~, 1991
The Constitution (Jammu & Kasbmir) Scbeduled Tribes Order, 1989 and The Constitution (Scheduled Tribes) Order (Amendment) Act, 1991
1
2
3
4
5
6
7
8
9
10
11
12
~
"lR'it om -.&.~
~,~,«,WR
~
'lit 1RT 'p:;R l:J);,
'ffinrr fuu:ft
3i~~<1 'iI"1Gtlfu<:ti/Scheduled Tribes I Bakarwal
2 Balti
3 Beda
4 Bot, Boto
5 Brokpa, Drokpa, Dard, Shin
6 Changpa
7 Gaddi
8 Garra
9 Gujjar
10 Mon
11 Purigpa
12 Sippi
f~"II'i1(Wj ~/Himachal Pradesh ~ ii!lfuqj- aJk ~'lFf~ amrn (liWr-r) ~. 1976
The Scheduled Castes and Scheduled Tribes Orders (Amendment) Act, 1976
1 ~,~ Bbot, Bodb
2 -rOO [$nor~~, 1966 (1966 q;r 31) em tim 5 cfiT ~ (i) -if ~ ~ 3ih: ~ ~ -a ~ ~<fi't~]"
3 1J'NR [~~ ~, 1966 (1966 q;r 31) qft
tim 5 qi\~ (i).q ~~q;)~] ~
4
5
6
7
8
';if1<\, ("fjlqT, lSIl'1T
ct>-frn, fcnmT
~
~
«WTffi
.. ~ ~ eJ;« -if .31if ~, ~, ~ 0i"IT dR m.:wrr ~~tl
~~ 1fI1.: !$iT if ar.r ~, ~, ~ a;;rr, WJm;rr am"fI1&'tR ~ f.irR "WJ:n;r t I
332
Gaddi [excluding the territories specified in subsection (I) of section 5 of the Punjab Reorganisation Act, 1966 (31 of 1966), other than the Lahul and
Spiti district]" 3 Gujjru- [excluding the territories specified in sub
section (1) of section 5 of the Punjab Reorganisation
4
5
(j
7
8
Act, 1966 (31 of1966)t
Jad, Lamba, Khampa
Kanaura, K.innru-a
Lahaula
Pangwala
Swangla
"The areas excluded now comprises of Kangra, Hamirpur, Kullu, Una and Shimla districts.
"The area excluded now comprises of Kangra, H3£Oirpur, Kullu, Una, Shimla and Lahul and Spiti districts.
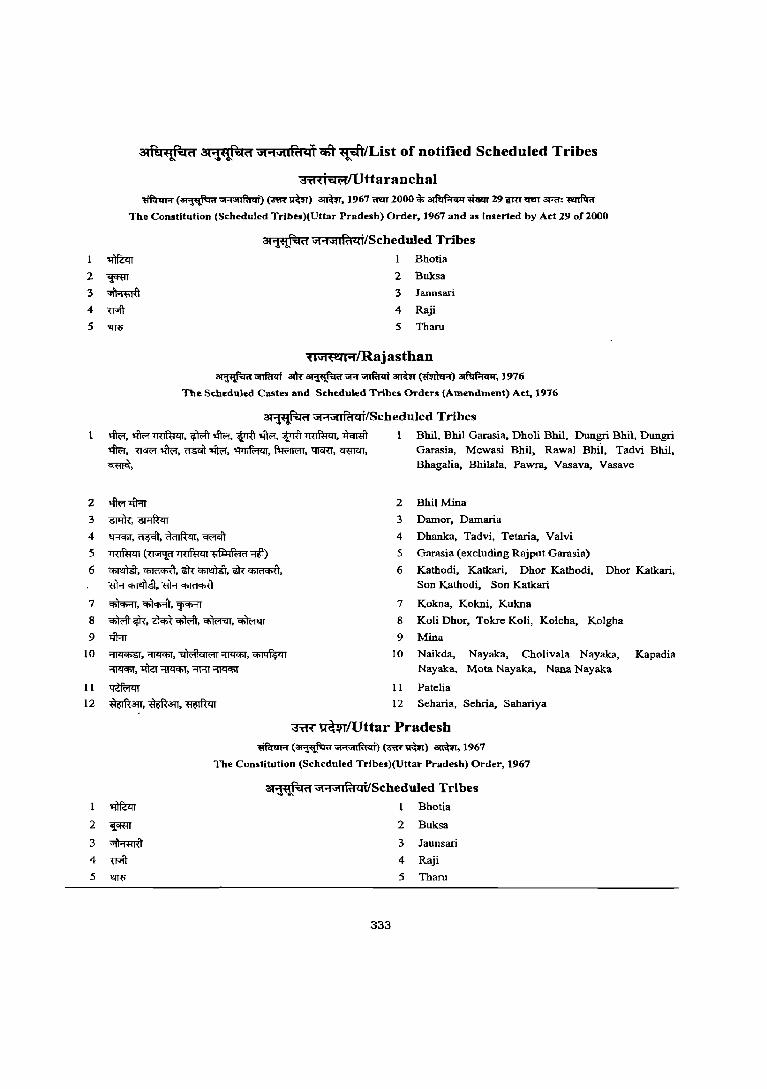
2
3
4
5
6
7
8
9
10
11
12
3{fu~~a 3{"Pt!~-Qa \i{OO(\i{IRc"if ctft~/List of notified Scheduled Tribes
d'iH jT<lI.'1/Uttaranchal ~ (~""NllfdQi) (<I'iR'~) armr, 1967 om 2000<l;~.nm 29i(m'Q'GT 31"<f: 'MIflln
The Constitution (Scheduled Trlbes){UUar Pradesh) Order,1967 and 3sInserted by Act 29 or2000
3l'iti!~('1 "'·NIIR!<:(i/ScheduJed Tribes
1 Bhotia
2 Buksa
3 Jannsan
4 Raji
5 Tharu
'tM't"'4I"'1lRajasthan ~~ 3Itt~vr-r""flfuqjarmr~)~, 1976
The Scheduled Castes and Scheduled Tribes Orders (Amendment) Act, 1976
3l":W!":i:i('1 "' .... "'liflqifScheduJed Tribes
~, tfuof lRlft:r>tr, ~ tfuof, ~ .fu;r, trm~, ~ I Bhil, Bhil Garasia, Dholi Bhil, Dungri Bhil, Dungri ~, Wffl,:fu;r, <ro:IT~, ~, f1:wm::rr, 'Il<m, crmm, Garasia, Mewasi Bhil, Rawal Bhll, Tadvi Bhil, ~,
>fuor~ 6l1=ITr, ~ ~,~,~,~
~(~~~"'l'tt)
~,~,~~,iilR~, <lR~,<lR~
~,~,~
'f>tffi~, ~~, ~, ~
~
~,~,~~,~ ~, 1iRl~, "'1RT ~
~
~arr, ~31T, ~
Bhagalia, Bhilala, Pawra, Vasava, Vasave
2 BhilMina
3 Damor, Damaria
4 Dhanka, Tadvi, Tetaria, Valvi
5 Garasia (excluding Rajput Garasia)
6 Kathodi, Katkari, Dhor Kathodi, Dhor Katkari, Sun Kathodi, Son Katkari
7 Kokna, Kokni, Kukna
8 Koli Dhor, Tokre Koli, Kolcha, Kolgha
9 Mina
10 Naikda, Nayaka, Cholivala Nayaka, Kapadia Nayaka, Mota Nayaka, Nana Nayaka
11 Patelia
12 Seharia, Sehria, Sahariya
~~lUttar Pradesh ~ (~""Nllf<lQi) (~~) atmr.1967
The Constitution (Scheduled Tribes)(Uttar Pradesh) Order, 1967
<!I"l~":i:i'l'1 "' .... "'lfuqi/Scheduled Tribes
1 Bhotia
333
2 Buksa
3 Jaunsari
4 Raji
5 Tharu
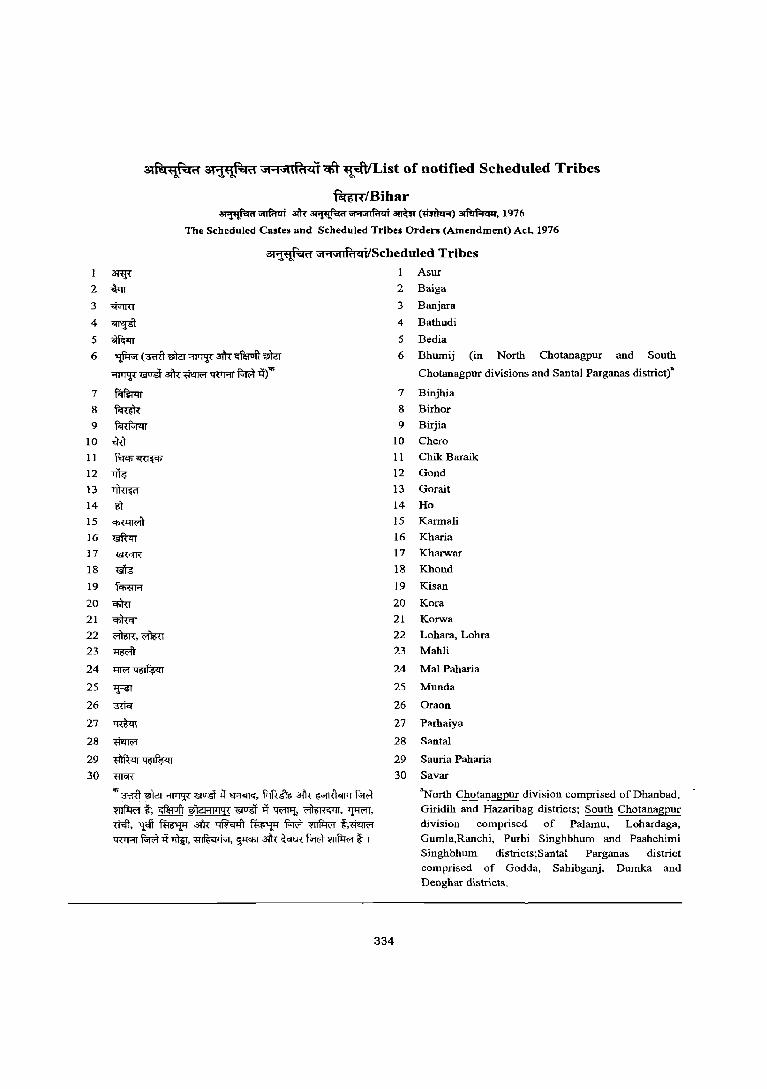
~M"li'~~ ~i"li'''''''4~ "';:"iCl~<41 <tf~lList of notified Scheduled Tribes
~/Bibar ~~ am-~", .. utlfdQiarr.m~)~,1976
The Scheduled Castes and Scheduled Tribes Orders (Amendment) Act, 1976
1 ~
2 ~
dtW'i4{1 \iI.NlIRt~i/Scheduled Tribes I Asur
3 "$'1m
4 ~ 5 ~
6 ~(~~~aft<~~
~~aft<~~~1lf"
7 ~
8 ~
9 ~
10 'iffi 11 m~
12 ~
13 ~
14 m 15 ~
16 ~
17 ~
18 ~
19 ~
20 emu 21 cmcrr 22 fflR,~
23 ~
24 llfIq~
25 1FST 26 <ffiq
27 ~
28 ~
29 ~~
30 mcrr
"'"3TfU -rncr 3"'l'.R ~ it~, ~ aft< ~ BIR ~ t, ~ 01c:HI1iq< "&uir it"lWll1t ~, ~, Wft,~~3lk~~m~t,~ 1WRT~it1llgr, ~, ~ 3lk~m"Wi:wr~ I
2 Baiga
3
4
5
6
7
8
9
10
11
12
13
14
15
16
17
18
19
20
21
22
23
24
25
26
27
28
29
30
334
Banjara
Bathudi
Bedia
Bhumij (in North Chotanagpur and South
Chotanagpur divisions and Santal Parganas district)"
Binjhia
Birhor
Birjia
Chero
Chik Baraik
Gond
Gorait
Ho
Karmali
Kharia
Kharwar
Khond
Kisan
Kora
Korwa
Lohara, Lohra
Mahli
Mal Paharia
Munda
Oraon
Parhaiya
Santa!
Sauria Paharia
Savar
"North Ch~aI_lagpur division comprised ofDhanbad, Giridih and Hazaribag districts; South Chotanagpur division comprised of Palamu, Lohardaga, Gumla,Ranchi, Purbi Singhbhum and Pashchimi Singhbhum districts;Santal Parganas district comprised of Godda, Sahibganj, Dumka and Deoghar districts.
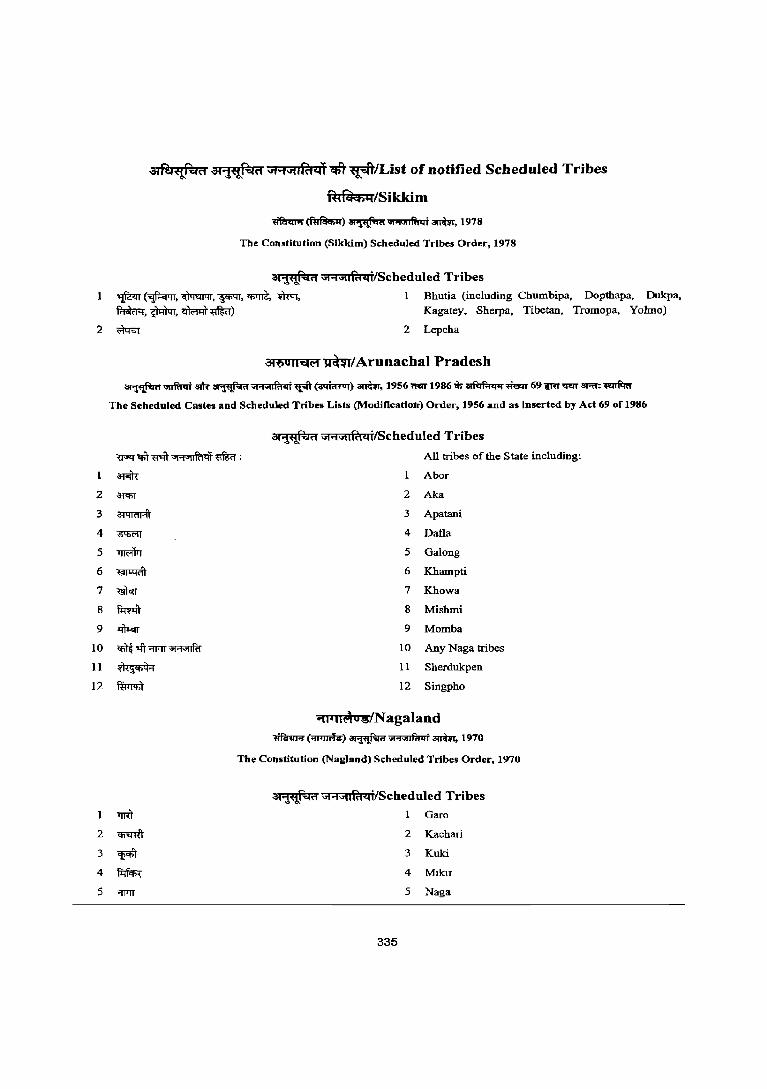
2
3
4
5
6
7
8
9
10
11
12
1
2
3
4
5
atfel~H at~H "'.NtlRfcif ctt~/List of notified Scheduled Tribes
~~q/Sikkim
The Constitution (Slkkim) Scheduled Tribes Order, 1978
:at'i~" "' .... "'If.:!c:ai/Scheduled Tribes ~ (~, ~, ~,~ m, 1 Bhutia (including Chumbipa, Dopthapa, Dukpa, fualFR, ~, ~~) Kagatey, Sherpa, Tibetan, Tromopa, Yolmo)
2 Lepcha
dI'60II'i4(i1 ~/Arunachal Pradesh
~~~~"I'1"'lf.:lqi~~)~,1956mrrI986<l;~~691(RT'fm3Rf:~
The Seheduled Castes and Scheduled Tribes Lists (Modification) Order, 1956 and as inserted by Act 69 of 1986
W"t 'fit <'I"it ",:ptlf<'lq) ~ :
~
~
~
6'I>ffi
1'ffi'Wr
~
<iiTcn
~
~
~\ft;:wlT~
~ ~
3i~" \iI'1\i1IR\c:ai/Scheduled Tribes
All tribes of the State including:
AboT
2 Aka
3 Apatani
4 Dalla
5 Galong
6 Khampti
7 Khowa
8 Mishmi
9 Mamba
10 Any Naga tribes
11 Sherdukpen
12 Singpho
., I.II~ o:s/N agaland 1fflnIFJ~) ~ "I'1",lfl'I .. i amm, 1970
The Constitution (Nagland) Scheduled Tribes Order, 1970
rrm Garo
~ 2 Kachari
~ 3 Kuki
~ 4 Mikir
:wrr 5 Naga
335
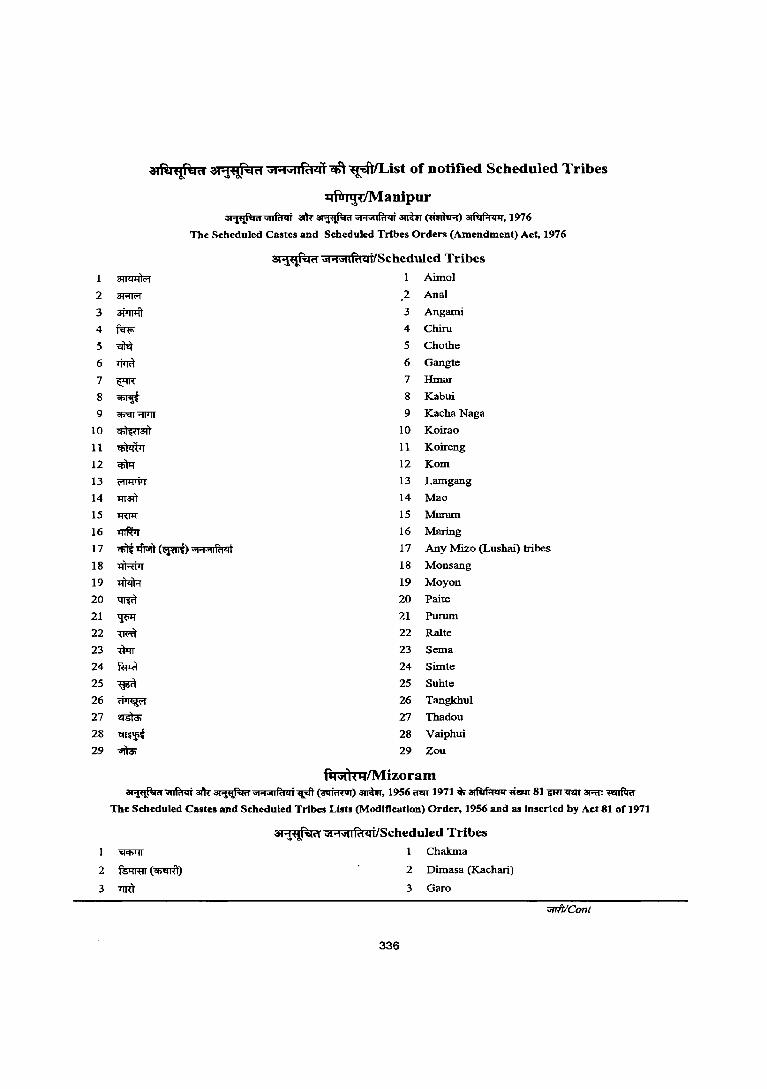
1
2
3
4
5
6
7
8
9
10
11
12
13
14 15
16
17
18
19
20
21
22 23
24 25
26 27
28
29
atliHf~" a{~""~" \iI.:1'iI.~;ql ctT~lList of notified Scheduled Tribes
~JManipur
~~ ~~"'''1"",faqi~~)~,1976
The Scheduled Castes and Scheduled Trlbes Orders (Amendment) Act, 1976
31'Fi~ii "{91\1{ci"a4jfScheduled Tribes
~ 1 Aimol
a;.:mor 2 Anal
a:irrrJ:IT 3 Angami
~ 4 Chiru
~ 5 Chothe
~ 6 Gangte
~ 7 Hmar
CIiJij{ 8 !Cabui
'fi'<IT ;wrr 9 !Cacha Naga
~an 10 Koirao
~ 11 Koireng
• 12 Kom
ffil'!1iTr 13 Lamgang
man 14 Mao
~ 15 Maxam
mWr 16 Maring
q;lt 'IfI;;ft (~) "I"'t"1lf<'llli 17 Any Mizo (Lushai) tribes
~ 18 Monsang
lll<If.:r 19 Mayan
~ 20 Paite
'1Ql'f 21 Purum
~ 22 RaIte
WIT 23 Sema
fur<t 24 Simte
~ 25 Suhte
~ 26 Tangkhul
~ 27 Thadou
~ 28 Vaiphui .. 29 Zou
i1:t'3l1't q/Mizoram ~~ack~", .. "",I'a .. il[iiT('OIffimrr)~,1956nmI971$~~81imTlIQT3Rt:~
The Scheduled Castes and Scheduled Tribes Lists (Modification) Order, 1956 and as inserted by Act 81 of 1971
at1~o "''''''''Iraqi/Scheduled Tribes Chakma
2 fu1m:Ir (~)
3 TTRT
2 Dimasa (Kachari)
3 Garo
vrr!TIConl
336
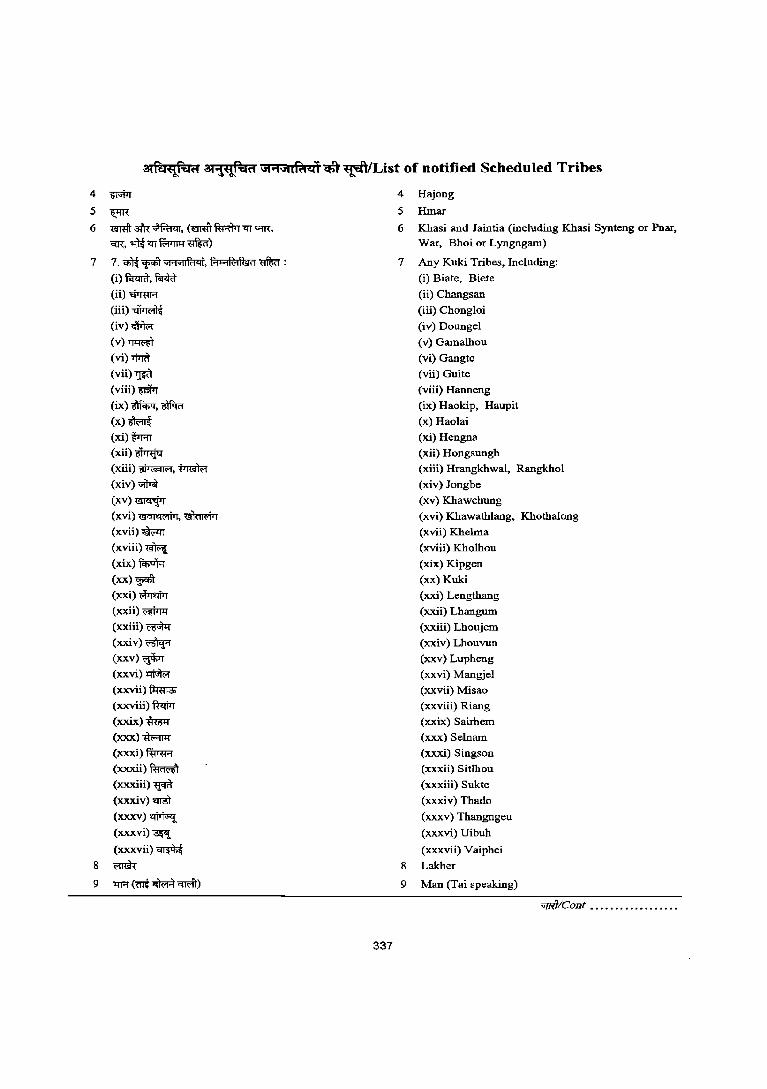
am:.~ri at¥l!~iiri """"I\iiiPtcif ~ ~lList of notified Scheduled Tribes
4 m*T 4 Hajong
5 ~ 5 Hmar
6 oom 3TR~, (oom fu::itrr"llT "fR. 6 Khasi and Jaintia (including Khasi Synteng or Pnar,
<m. ~ ~ fFrrnll~) War, Bhoi or Lyngngam)
7 1. -.:mt~ "1'1"lif<i4i. f'1"'1R:1fum ~ : 1 Any Kuki Tribes, Including:
(i) f.rzml. f.ictt (i) Biate, Biete
(ii)~ (ii) Changsan
(iii)~ (iii) Chongloi
(iv)~ (iv) Doungel
(v) 1"fIlffi (v) Gamalhou
(vi)"1"f"rRt (vi) Gangte
(vii) l_Wl (vii) Guite
(viii)mWr (viii) Hanneng
(ix)~,~ (ix) Haokip, Haupit
(x)~ (x) Haolai
(xi)m (xi) Hengna
(xii)~ (xii) Hongsungh
(xiii)~.~ (xiii) Hrangkhwal, Rangkhol
(xiv)~ (xiv) Jongbe
(xv)~ (xv) Khawchung
(xvi)~,~ (xvi) Khawathlang, Khothalong
(xvii)~ (xvii) Khelma
(xviii)~ (xviii) Kholhou
(xix) fcf;tiI;:r (xix) Kipgen
Cxx)~ (xx) Kuki
(xxi)~ (xxi) Lengthang
(xxii)~ (xxii) Lhangum
(xxiii)~ (xxiii) Lhoujem
(xxiv)~ (xxiv) Lhouvun
(xxv)~ (xxv) Lupheng
(xxvi)~ (xxvi) Mangjel
(xxvii)~ (xxvii) Misao
(xxviii) WWT (xxviii) Riang
(xxix)~ (xxix) Sairhem
(xxx)~ (xxx) Selnam
(xxxi)~ (xxxi) Singson
(xxxii)~ (xxxii) Sitlhou
(xxxiii) wffi (xxxiii) Sukte
(xxxiv)~ (xxxiv) Thado
(xxxv)~ (xxxv) Thangngeu
(xxxvi)~ (xxxvi) Uibuh
(xxxvii)~ (xxxvii) Vaiphei
8 ~ 8 Lakher
9 llR (<1"It -.m-R 0IR'il-) 9 Man (Tai speaking)
o:ifTit/Cont •••••.••••••••••••
337
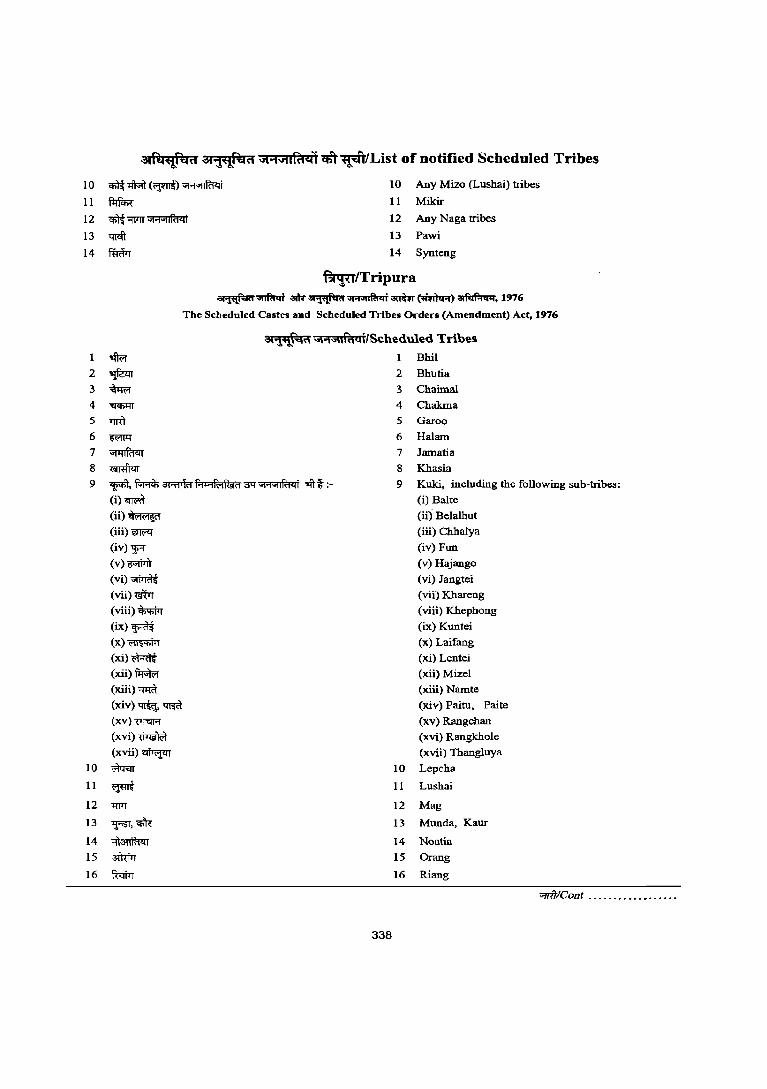
~f!.I:tf.qri 3il"l!-~ri \it::N'IIf'dc:i1 ctT~lList of notified Scheduled Tribes
10 <nTt~(~) "I'1"lIif1<1i 10 Any Mizo (Lushai) tribes
11 ftlm 11 Mikir
12 CfiTt -:wrr Gj"1"1if<'1Qj 12 Any Naga tribes
13 wa- 13 Pawi
14 \WTr 14 Synteng
~/Tripura
~~ .~"''1'''IIa.Ii~~)~, 1976
The Scheduled Castes and Scheduled Tribes Orders (Amendment) Act, 1976
1 ,fu;r
2 ~ 3 ~
4 ~
5 TTR1
at1"i!~~ 'ij;Nnfu4i/Scheduied Tribes 1 Bhit
6 ~
7 ~
8 ~
9 ~,~ 3RI1ffif-i ...... fflf@\'1aq "I'1"1if<l"'li ~f:
(i)~
(ii)~
(iii)~
(iv) 'FI" (v)~
(vi)~
(vii)mrr
(viii)~
(ix)~
(x)~
(xi)~
(xii)~
(xiii)~
(xiv)~~
(xv)~
(xvi)~
(xvii)~
10 ~
ll~
12 1WT
13 ~,<i>'R
14 -,n~
15 31Tm 16 ft<rtTr
338
2 Bhutia
3 Chaima!
4 Chakma
5 Garoo
6 Halam
7 Jamatia
8 Khasia
9 Kuki, including the following sub-tribes:
(i) Balte
(ii) Belalhut
(iii) Cbhalya
(iv) Fun
(v) Hajango
(vi) Jangtei
(vii) Khareng
(viii) Khephong
(ix) Kuntei
(x) Laifang
(xi) Lentei
(xii) Mizel
(xiii) Namte
(xiv) Paitu, Paite
(xv) Rangchan
(xvi) Rangkhole
(xvii) Thangluya
10 Lepcha
11 Lushai
12 Mag
13 Munda, Kaur
14 Noatia
15 Orang
16 Riang
"fffrICont .•.....••••••.••.•
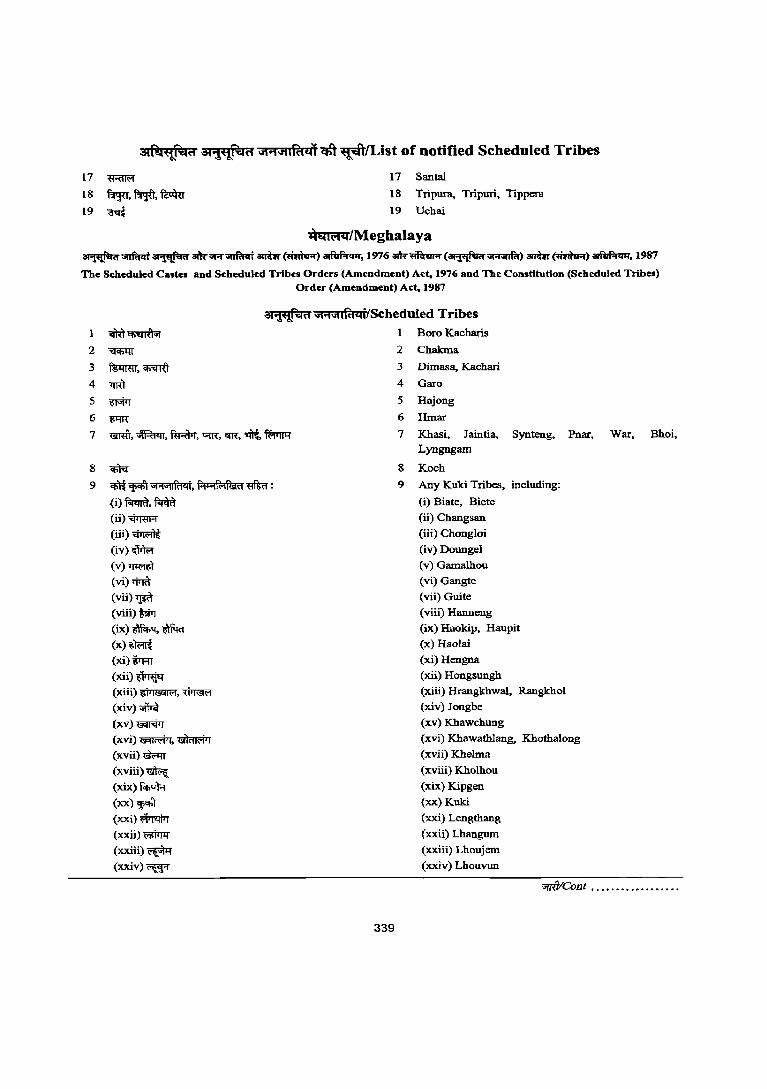
atf!l'1! ..... "Oilri at'1"E@:iR \i1;:jJ'IIfd<il ctft ~ist of notified Scheduled Tribes
17 ~
18 flrFy. ~, ft;n1u
19 ~
17 Santa!
18 Tripura, Tripuri, Tippera
19 Uchai
qEOjIH<tlMeghalaya ~~~.~~~(lhrltR)~,1976<Rk~(~~armr~)~.1987
The S\:heduled Castel and S.:beduled Tribes Orders (Amendment) A.:t, 1976 and The Constitution (Scheduled Tribes) Order (Amendment) Act, 1987
atftR:4n >iI"I>illfuqj/Scheduled Tribes
6 ~
7 ~, ~, fi:F<W, ~, cm-, ~, W!IJll1
8 q;fq
9 ~ ~ "1"1"1lfi1<ii, f.:I""1R>1f~(1 ~ : {i) fiI<ml, ~ (ii)"$mR
(iii)~
(iv)~
(v)~
(vi) 'l'jTj(f
(vii)~
(viii) 'totrr (ix)~,mm
(x)~
(xi)m
(xii)~
(xiii)~,~
(xiv)..w.t
(xv)~
(xvi)~,~
(xvii)~
(xviii)~
(xix) fcJ>oB (xx)~ (xxi)~
(xxii)~
(xxiii)~
(xxiv)~
339
1 Boro Kacharis
2 Chakma
3 Dimasa. Kachari
4 Garo
5 Hajong
6 Hmar
7 Khasi, Jaintia, Synteng, Pnar, War, Bhoi, Lyngngam
8 Koch
9 Any Kuki Tribes, including:
(i) Biate, Biete
(ii) Changsan
(iii) Chongloi
(iv) Doungel
(v) Gamalhou
(vi) Gangte
(vii) Guite
(viii) Hanneng
(ix) Haokip, Haupit
(x) Haolai
(xi)Hengna
(xii) Hongsungh
(xiii) Hrangkhwal, Rangkhol
(xiv) Jongbe
(xv) Khawchung (xvi) Khawathlang, Khothalong
(xvii) Khelma
(xviii) Kholhou
(xix) Kipgen
(xx) Kuki
(xxi) Lengthang
(xxii) Lhangum
(xxiii) Lhoujem
(xxiv) Lhouvun
"fTfllCont ................. .
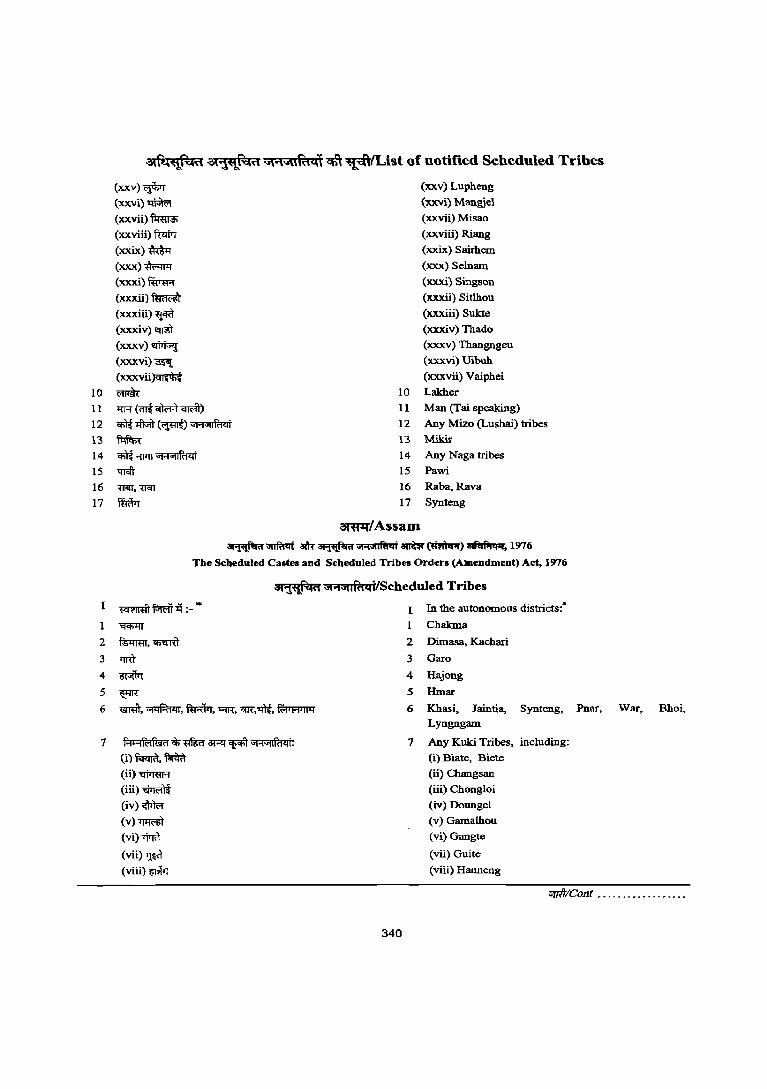
~~~ '3\1~~ 'i\w\>i(~4t ~ ~lList of notified Scheduled Tribes
(XXV)<fm (xxv) Lupheng
(xx.vi)~ (xxvi) Manrue\
(xxvii) fl::mra; (xxvii) Misao
(xxviii) WWT (xxviii) Riang
(xxix)~ (xxix) Sairhem
(xxx)~ (xxx) Selnam
(xxxi) fWt:R' (xxxi) Singson
(xxxii)~ (xxxii) Sitlhou
(xxxiii)~ (xxxiii) Sukte
(xxxiv) ~ (xxxiv) Thado
(xxxv)~ (xxxv) Thangngeu
(xxxvi)~ (xxxvi) Uibuh
(xxxvii~ (xxxvii) Vaiphei
10 ~ 10 Lakher
11 "lfFf (<il{"iIlffi~) 11 Man (Tai speaking)
12 Cfi){ ~ (~) "I+'uif1<1i 12 Any Mizo (Lushai) tribes
13 ~ 13 Mikir
14 Cfi){ '1lIJT "I"1"1ifi1<li 14 Any Naga tribes
15 "I'l<ft 15 Pawi
16 <JilT. ~ 16 Raba,Rava
17 ffffi>r 17 Synteng
~/Assam
~~ 8Itt~",",Jilfa .. iawmr~)~,1976
The Scheduled Castes and Scheduled Tribes Orders (Amendment) Act, 1976
at'l~d \iI"N1i(fc .. ilScheduled Tribes
1 ~
2 f.s>:rrrn, ~ 3 ",-u
4 ~
5 ~ 6 ~, ~, fu*T, ~, ctR,'1lt, ~
7 f.:J"'1f~flJiti c);~ ~'Pf"T "I"1",lfn<li. (i)~,~
(ii)~
(iii)~
(iv)~
(v)~
(vi)~
(vii)~
(viii)mWr
340
I In the autonomous districts:
Chakma
2 Dimasa, Kachari
3 Gam
4 Hajong
5 Hmar
6 Khasi, Jaintia, Synteng, Pnar, War, Bhoi. Lyngngam
7 Any Kuki Tribes. including:
(i) Biate, Biete
(ii) Changsan
(iii) Chongloi
(iv) Doungel
(v) Gamalhou
(vi) Gangte
(vii) Guite
(viii) Hanneng
;;g#/Cont •........•...•.•..
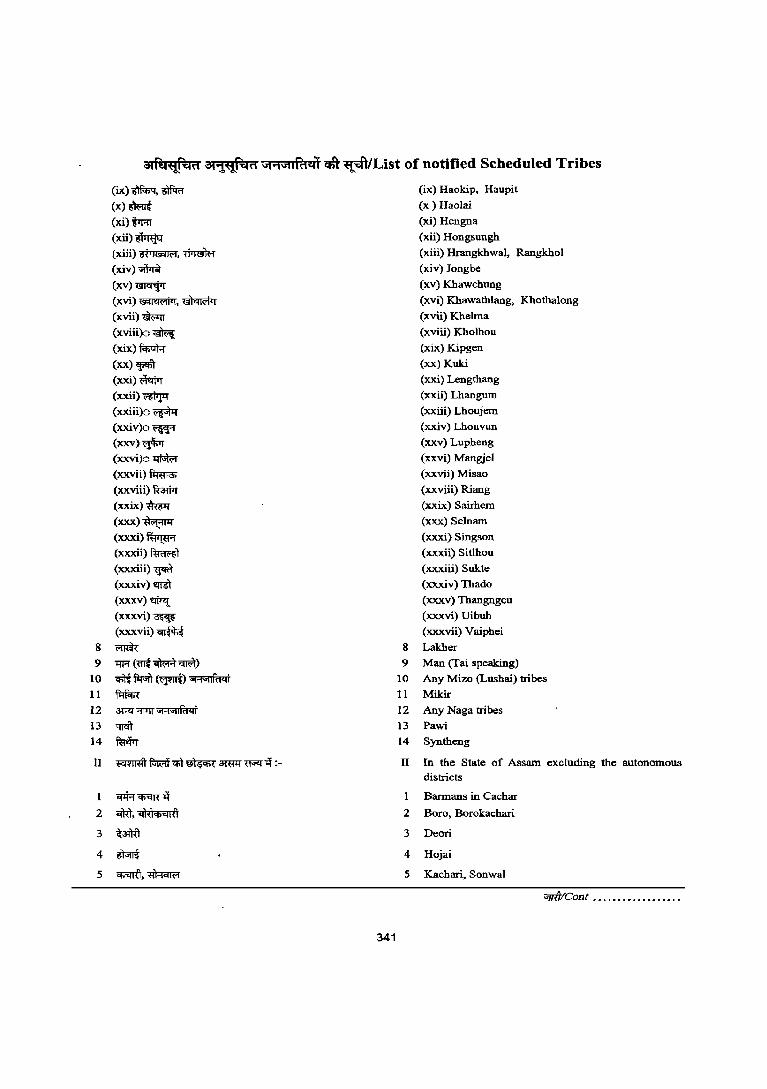
a4N"i!~" ac"l~" \jf"N1IRtcn Cfft ~/List of notified Scheduled Tribes
(ix)~,mn
(x)~
(xi)m
(xii)~ (xiii)~,~
(xiv)~
(xv)~
(xvi)~,mwr
(xvii)~
(xviii)o~
( xix) fcf;oT;:r
(xx)~ (xxi)~
(xxii)~
(xxiii)o~
(xxiv)o~
(xxv)~ (xxvi)o~
(xxvii)~
(xxviii) Rm (xxix)~
(xxx)~ (xxxi)~
(xxxii)~
(xxxiii) wffi" (xxxiv)~
(xxxv)~
(xxxvi)·~
(xxxvii)~
8 ~
9 "tfF[ ("fflt 'iffioR~) 10 q;Jt~(~)"1'1"1jf<'1<ti
11 ~
12 ~ '117lr "''1''1lfd''li
131l1'Oit 14 ~
II ~~q;'t~~~ll:-
1 ~q;Tffi"ll
2 :aM, q'\<.)"''tijil
3 ~31l{\
4 ~
5 ~.~
341
(ix) Haokip. Haupit
(x) Haolai
(xi) Hengna
(xii) Hongsungh
(xiii) Hrangkhwal, Rangkhol
(xiv) Jongbe
(xv) Khawchung
(xvi) Khawathlang, Khothalong
(xvii) Khelma
(xviii) Kholhou
(xix) Kipgen
(xx) Kuki
(xxi) Lengthang
(xxii) Lhangum
(xxiii) Lhoujem
(xxiv) Lhouvun
(xxv) Lupheng
(xxvi) Mangjel
(xxvii) Misao
(xxviii) Riang
(xxix) SaiIhem
(xxx) Selnam
(xxxi) Singson
(xxxii) Sitlhou
(xxxiii) Sukte
(xxxiv) Thado
(xxxv) Thangngeu
(xxxvi) Uibuh
(xxxvii) Vaiphei
8 Lakher
9 Man (fai speaking)
10 Any Mizo (Lushai) tribes
11 Mikir
12 Any Naga tribes
13 Pawi
14 Syntheng
II In the State of Assam excluding the autonomous districts
Barmans in Cachar
2 Boro, Borokachari
3 Deori
4 Hojai
5 Kachari, Sonwal
"fIit/Cont •...••.•......••.•
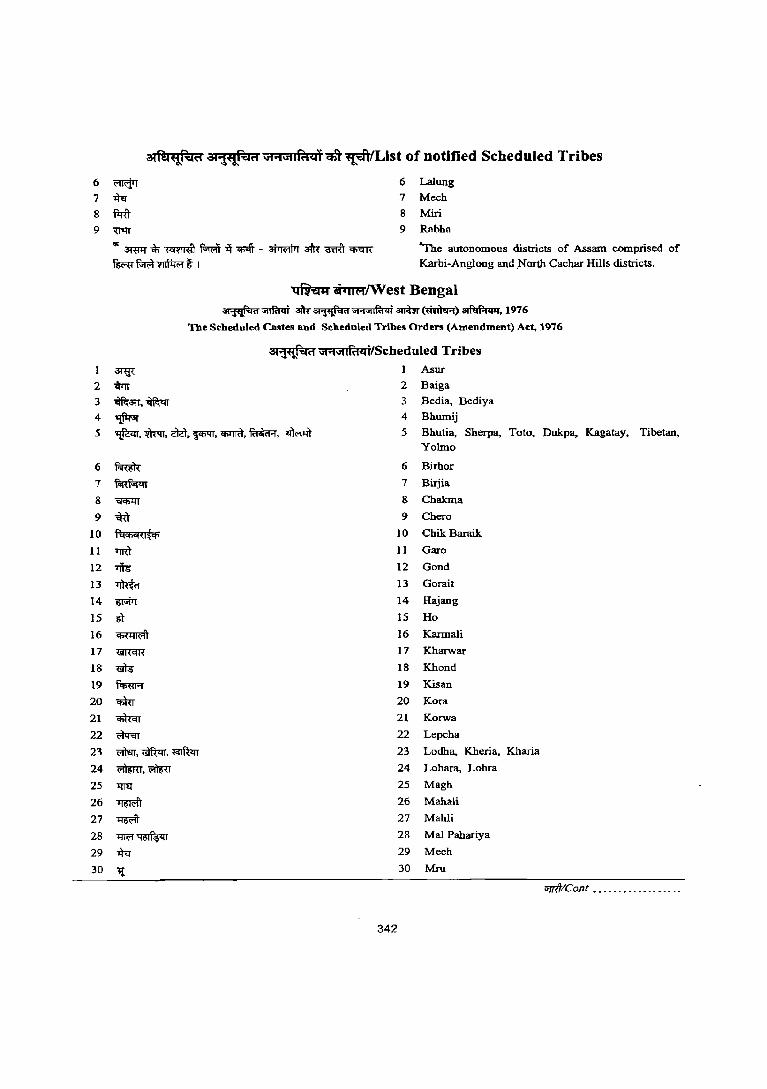
aiNl~H at1~H ViPfViII'it<d qft~ist of notified Scheduled Tribes
6 mt:[rT 7~
8 f1:rft 9 ~
6 Lalung 7 Mech
8 Miri
9 Rabha
'" 31Wf ~ ~ ~ -ij q;.fr - 3f"rwlM ~ atm ~ ~ f~ri'hTlfi:1R ~ I
"The autonomous districts of Assam comprised of Karbi-Anglong and .North Cachar Hills districts.
3 ~m,~
4 ~
~GiTm;rlWest Bengal ~~ ~~"'''''''lfa .. ianUr~)~,1976
The S~beduled Caste1!l and Scheduled Tribes Orders (Amendment) Act, 1976
3t"Fij":;;cCi "tot'" lfu ... i/Scheduled Tribes 1 Asur
2 Baiga
3 Bedia, Bediya
4 Bhumij
5 ~, m.rr, cRt, ~, CfiTIT<l, fui1<Fr, ~ 5 Bhutia, Sherpa, Toto, Dukpa, Kagatay, Tibetan,
6 f.mR 7 ~
8 ~
9 ~
10 1'i4"".HI~q;
11 TJR1 12 ~
13 ~ 14 ~
15 m-16 ~
17 ~
18 • 19 ~
20 m 21 ~
22 ~
23 ~,~.~
24 ~,~
25 ~
26 ~ 27 ~ 28 lW'f~ 29 ~
30 or
Yolmo
6 Birhor
7 Birjia
8 Chakma
9 Chero
10 Chik Baraik
11 Garo
12 Gond
13 Gorait
14 Hajang
15 Ho
16 Karmali
17 Kharwar
18 Khond
19 Kisan
20 Kora
21 Korwa
22 Lepcha
23 Lodha. Kheria, Kharia
24 Lohara, Lohra
25 Magh
26 Mahali
342
27 Mahli
28 Mal Pahariya
29 Mech
30 Mru
;rrr#ICont •••.•..•.•••..•...
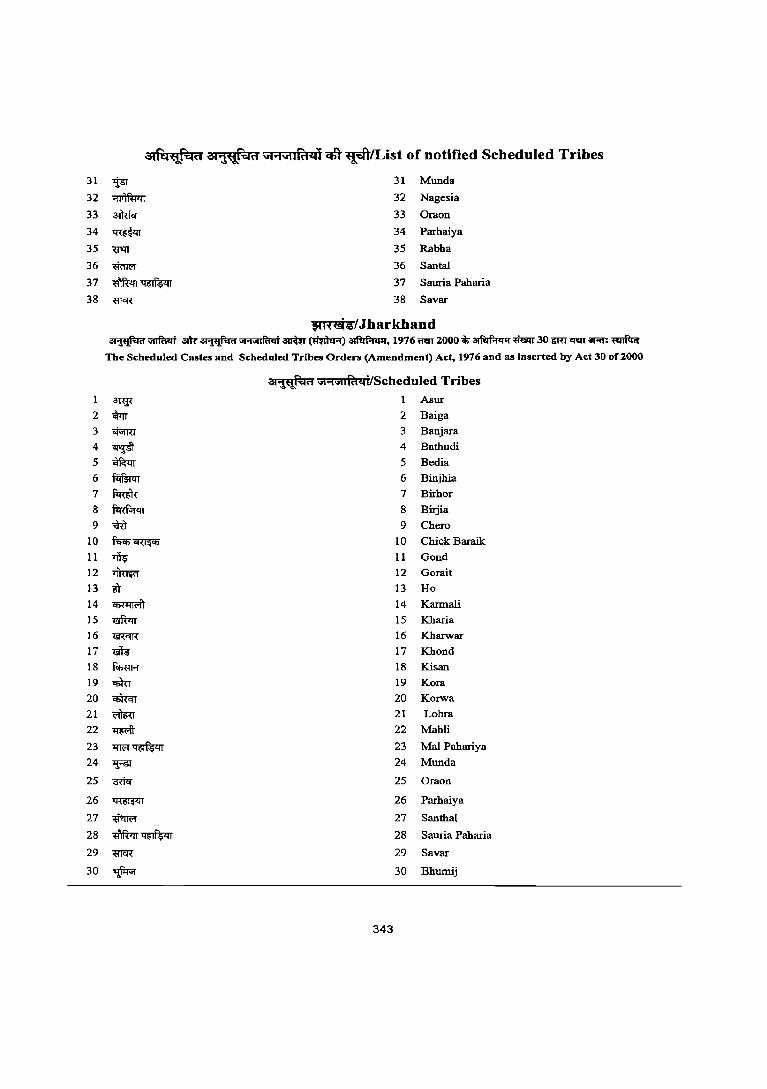
31
32
33
34
35
36
37
38
1 2 3
4 5 6
7 8 9
10 11
12 13
14 15 16 17 18 19 20 21 22
23 24
25
26
27
28
29
30
atfu~-;'a ati~""'.qa ;ij"1'i1liftcif ctft ~lList of notified Scheduled Tribes
~ 31 Munda
~ 32 Nagesia
3fffiq 33 Oraan
~ 34 Parhaiya
"Ul1T 35 Rabha
~ 36 Santal
~~ 37 Sauria Paharia
meR 38 Sayar
$(H&:s/Jharkhand ~~ am-~;;j;NlIf'a.d~~)~.1976nerr2000.q,~mw30-mT~~~
The Scheduled Castes and Scheduled Trlhes Orders (Amendment) Act, 1976 and as Inserted by Ad 30 of2oo0
at~<'1 'iI .... 'illfuqj/Scheduled Tribes
3lW 1 Asur
$rr 2 Baiga
~ 3 Banjara
~ 4 Bathudi
-.1Wrr 5 Bedia
~ 6 Binjhia
~ 7 Birhar
~ 8 Birjia
"'<hl 9 Chera
Wci>~ 10 Chick Baraik
>if9 11 Gond
1l1um 12 Gorait
~ 13 Ho
~ 14 Kannali
~ 15 Kharia
llWl'T{ 16 Kharwar
~ 17 Khond
f<fi<:rR 18 Kisan
i'fiRr 19 Kora
~ 20 Korwa
~ 21 Lahra
~ 22 Mahli
1ffi'f~ 23 Mal Pahariya
1F5f 24 Munda
~ 25 Oraan
~ 26 Parhaiya
~ 27 Santhal
-mwrr~ 28 Sauria Paharia
mq( 29 Sayar
~ 30 Bhumij
343
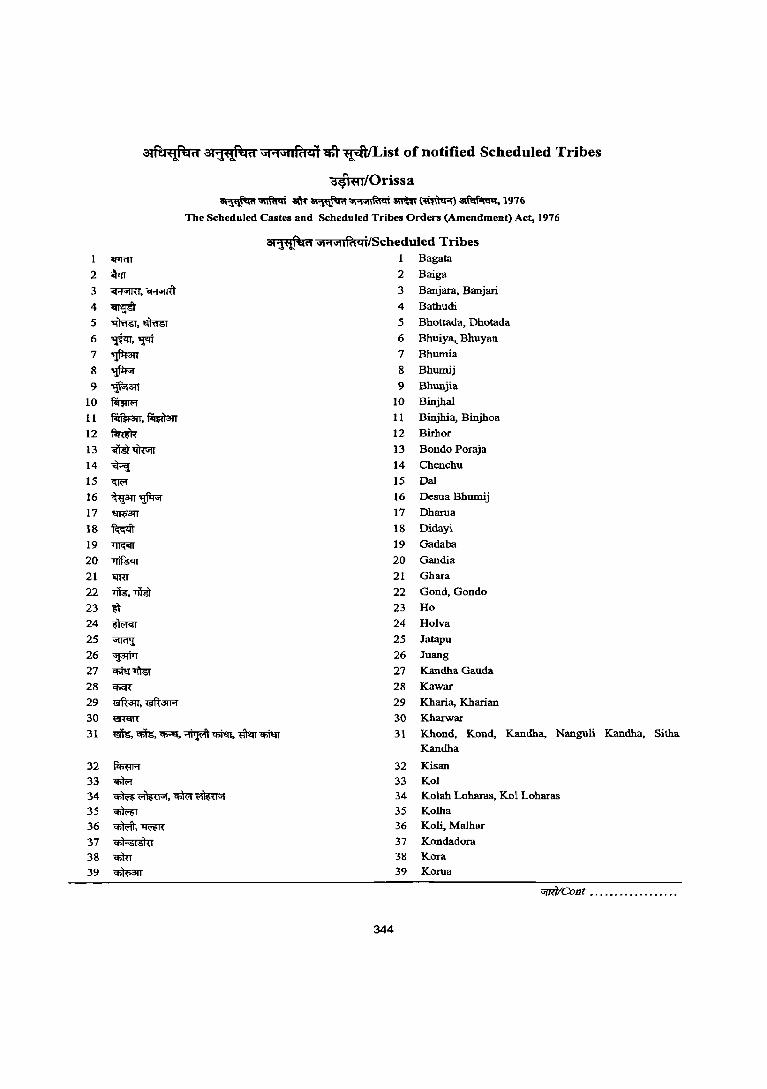
3lftl't{l .... ~rl 3l~~rl ;:;"'l>itlfd<:(f c6t ~/List of notified Scheduled Tribes
~/Orissa
1 <flffiT
2 c\Trr 3 CFfiiIRT. q;:prrft
4 cn¢ 5 ~,~
6 ~,'fU 7 ~3IT 8 ~ 9 ~31l
10 ~
11 'f.iIm"3IT, fiIW;m 12 ~ 13 .ny 1l1"rvrr 14 ~ 15 <m"f
16 ~3IT~ 17 "1"R'3IT
18 1Wt 19 ~
20 l'"IiWIr 21 tiRT
22 ~,-rim)
23 ~
24 ~
25 ~
26 ~ 27 ~~
28 CfiCR"
29 "I9ft;m, 19R3lR
30 ~
~~ .~"""'i\lfMi~~)~.1976
The Scheduled Castes and Scheduled Tribes Orders (Amendment) Act, 1976
0I1~" "1""'I~"Ii/Scbeduled Tribes 1 Bagata
2 Baiga
3 Banjara, Banjari
4 Bathum
5 Bhottada, Dhotada
6 Bhuiya.. Bhuyan
7 Bhumia
8 Bhumij
9 Bhunjia
10 Binjhal
11 Binjhia, Binjhoa
12 Birhor
13 Bondo Poraja
14 Chenchu
15 Dal 16 Desua Bhumij
17 Dharua
18 Didayi
19 Gadaba
20 Gandia
21 Ghara
22 Gond, Gonda
23 Ho
24 Holva
25 Jatapu
26 Juang
27 Kandha Gauda
28 Kawar
29 Kharia, Kharian
30 Kharwar
31 19l5, C!i'h!;, <Pt •• ~, "WiT~ 31 Khond, Kond, Kandha, Nanguli Kandha, Sitha
32 fc!;m;J
33 cn1M 34 ~~,~~ 35 ~ 36 ~,~ 37 ~ 38 q:;m 39 .3IT
344
Kandha
32 Kisan 33 Kol 34 Kolab Loharas, Kol Loharas
35 Kolba 36 Kali, Malhar
37 Kondadom
38 Kora 39 Kama
Uf1it/Cont •.•••••••••.•••.••
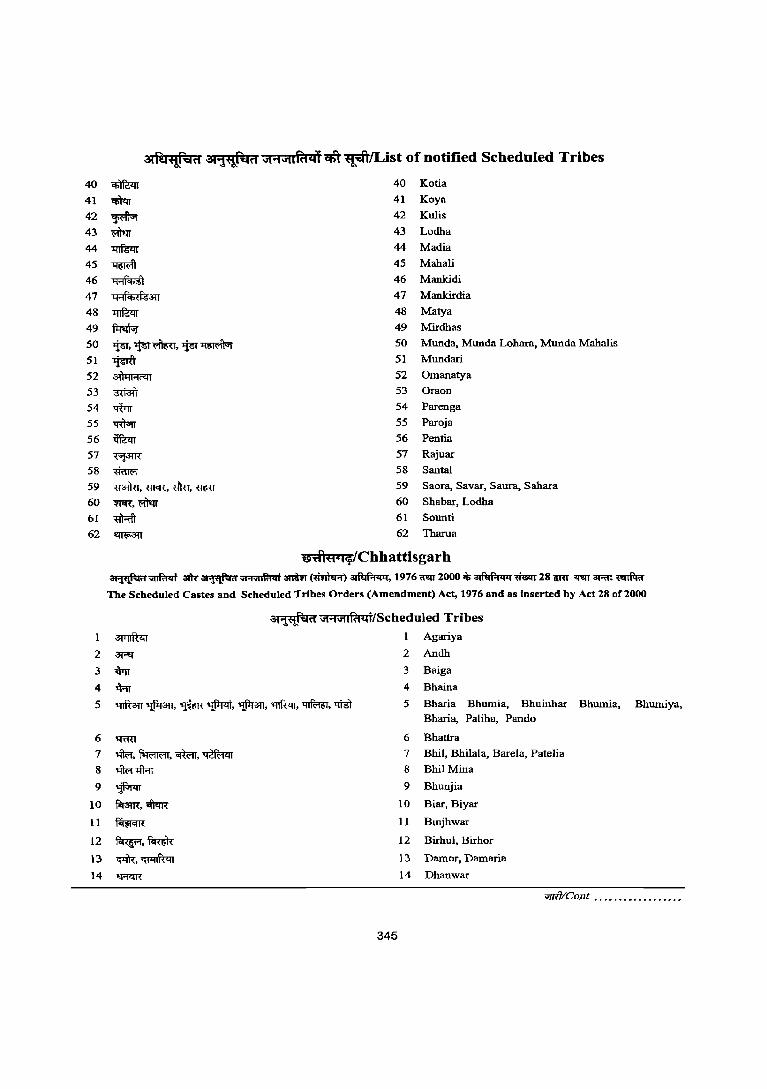
~~'tf~i1 31i~';:(i1 J1 .... J1Iff1<tT ctf ~/List of notified Scheduled Tribes
40 ~ 40 Kotia
41 • 41 Koya
42 43 ~ •
44 ~
45
46 47 48 49 50
51
52
~ ~
~m
~
~ ~,~~.~~
~ ~
53 ~,m
54 Wrr 55 'Rl";;;r
56 ~
57 ~3lR
58 -mm-r 59 <l3llu,"ffiCR, -Btu, mm 60 ~,~
61 m::ffi 62 I1ffi"m
42
43
44
45 46 47 48 49 50
51 52
53 54 55
56 57 58
59 60 61
62
Kulis
Lodha
Madia
Mahali
Mankidi
Mankirdia
Matya
Mirdhas
Munda, Munda Loham, Munda Mahalis
Mundari
Omanatya
Oraon
Parenga
Paroja
Pentia
Rajuar
Santal Saora, Sayar, Saura, Sahara
Shabar, Lodha
Sounti
Thama
0:dl'H'14iChhattisgarh ~~ .~"''''''ifu4i anrn(mmr.r) ~,1976<rm2000~~~2811RT ~3Rf:~
The Scheduled Castes and Scheduled Tribes Orders (Amendment) Act, 1976 and as inserted by Act 28 of20oo
2
3
4
5
6
7
8
9
10
11
12
D
14
'I:ITRT
,:lWr, ~. <ffiou. ~ ,:lWr -.:lRr
~ r.r3lR. oftlfR ~
~,~
~,~
"R<m:
311A!~i1 ,",;1'i1IR1~i/Scheduled Tribes
1 Agariya
2 Andh
3 Baiga
4 Bhaina
5 Bharia Bhumia. Bhuinhar Bharia, Paliha, Pando
6 Bhattra
7 Bhil, Bhilala, Barela, Patelia
8 Bhil Mina
9 Bhunjia
10 Biar, Biyar
II Bmjhwar
12 Birhul, Birhor
13 Damor, Damaria
14 Dhanwar
Bhumia. Bhumiya.
"flit/Cont .......•.........•
345
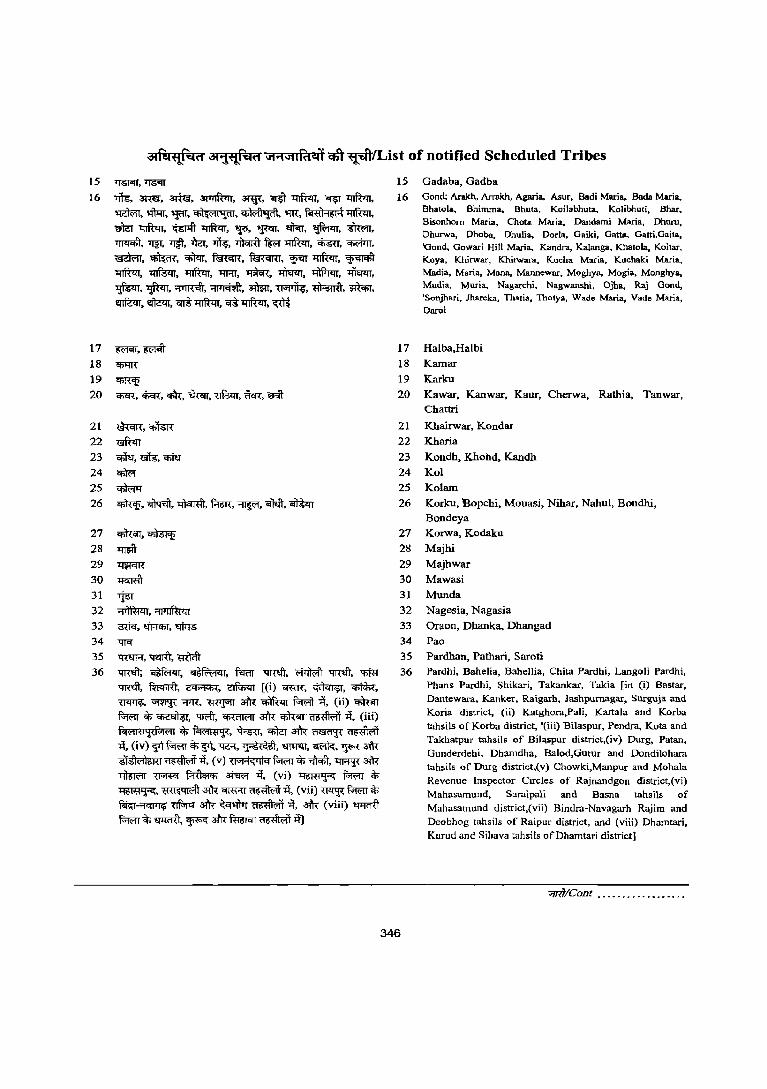
atf!4~"""rl at1't@:4rl iit"1'itIRtltl q:ft~/List of notified Scheduled Tribes
15 ~. "I'JSGIT
16 ~,amsr, amsr, ~, 3IW, ..m 'I1'lftzrr, "if9T 'I:fIWrr, ~, 'Ii\J:rr, 'FIT, ~,~, "iR, ~mW:rr, m ~, ~ ~, '¥, ~, t11<rr, ~. mwrr, ~, ~. -.w, >ta, -rit? TJ)qffi ~ 'I:fIWrr, ~, ~, ~, ~, ~, fuRcIR, fumIm, '¥IT ltlWrr, ~ 'l1Jltqr, ~, ~, lW'IT, ~, ~, mm. ~. ~,~,~,~,a:mn,~,~,~, ~. eWn, ~ l:lTft<rr, CIt 11IR<rr, ~
17 ~,~
18 ~
19 ~ 20 q>cR, <f;cR", ~, ~, ~, <feR, mit
21 ~.~ 22 mm 23 Cfih<, uits, ~ 24 ~ 25 ~
26 ~,~,~. f.m<.~,~, ~
27 ~,~ 28 •
29 ~ 30 ~
31 "1'& 32 ~,~ 33 "3Uq,~,~
34 'W'f
35 ~. ~, -mrnt 36 ~~,~, f<.wrr ~, WlMt '1R1ft, ~
~,fu<f;rU,~, ~ [(i) 0ffiR",~,~,
~, ~ -;:p'R, m>pn <R'R ~ ~ ~, (ii) ~ f-;wrr ~~, 'ffi'fr, CIiU1R'fr <R'R ~'~ it, (iii) r"lHI fi'i{f-l1f1 I 'If;~,~, ~ $ ~~ it. (iv)~~$~, -qc:;{,~.~.~, 'F'nl'R :ST:Slcili!HI ~it, (v) ~1"1;j"'liq f-;wrr~~, ~ 3!'R ~ ~ ~ ~ it, (vi) ~ f.;wrr ;$
~, ~.$:~~it, (vii) ~~$ f.ti;r-~ m.r $ ~ ~ it, .aft< (viii) wmU ~ 'If; ~, '.F"" afr< ft:®crr ~ it]
15 Gadaba, Gadba
16 Gond; Arakh. Arrakh. Agaria. Asur. Badi Mari .. Bada Maria., Bhatola, Bhinuna. Bhuta, Koilabhuta, Kolibhuti, Bhar. Bisonhom Maria, Chota Maria, Dandarni Maria, Dhuru, Dhurwa, Dhoba, Dhulia, Doria, Gail<i, Gatta, Gatti,Gaita. 'Goud. Gowari Hill Maria, Kandra, Kalanga. K)latola, Koitar, Koya, Khirwar, Khirwara, Kucha Maria, Ktlchaki Maria, Madia, Maria, Mana, Mannewar, Moghya, Mogia, Monghya, Mudla, Muria, Nagarchi, Nagwanshi, Ojha, Raj Gond, 'Sonjhari, Jhareka, Thatia, Thotya, Wade Maria, Vade Maria,
Daroi
17 Halba,Halbi
18 Kamar 19 Karku 20 Kawar. Kanwar. Kaur, Cherwa, Rathia, Tanwar,
Chattri
21 Khairwar, Kondar 22 Kharia
23 Kondh,Khohd,Kandh 24 Kol 25 Kolam
26 Korku, Ropehi, Mouasi, Nihar, Nahul, Bondhi, Bondeya
27 Korwa, Kodaku
28 Majhi 29 Majhwar
30 Mawasi 31 Munda
32 Nagesia, Nagasia
33 Oraon, Dhanka, Dhangad
34 Pao
35 Pardhan, Pathari, Saroti 36 Pardhi, Bahelia, Bahellia, Chita Pardhi, Langoli Pardhi,
Phans Pardhi, Shikari, Takankar, Takia [in Ci) Bastar, Dantewara, Kanker, Raigarh, Jashpurnagar, Surguja and Koria district, (ii) Katghora,Pali, Kartala and Korba tahsils of Korba district, '(iii) Bilaspur, Pendra, Kota and Takhatpur tahsils of Bil~spur district,(iv) Durg, Patan, Gunderdehi, Dhamdha, Balod,Gurur and Dondilohara tahsils of Durg district,{v) Chowki,Manpur and Mohala Revenue Inspector Circles of Rajnandgon district,(vi) Mahasamund, Saraipali and Basna tahsils of Mahasamund district,(vii) Bindra-Navagarh Rajim and Deobhog tahsils of Raipur district, and (viii) Dhamtari, Kurud and Sihava tahsils ofDhamtari district]
~/Cont •......•...•......
346
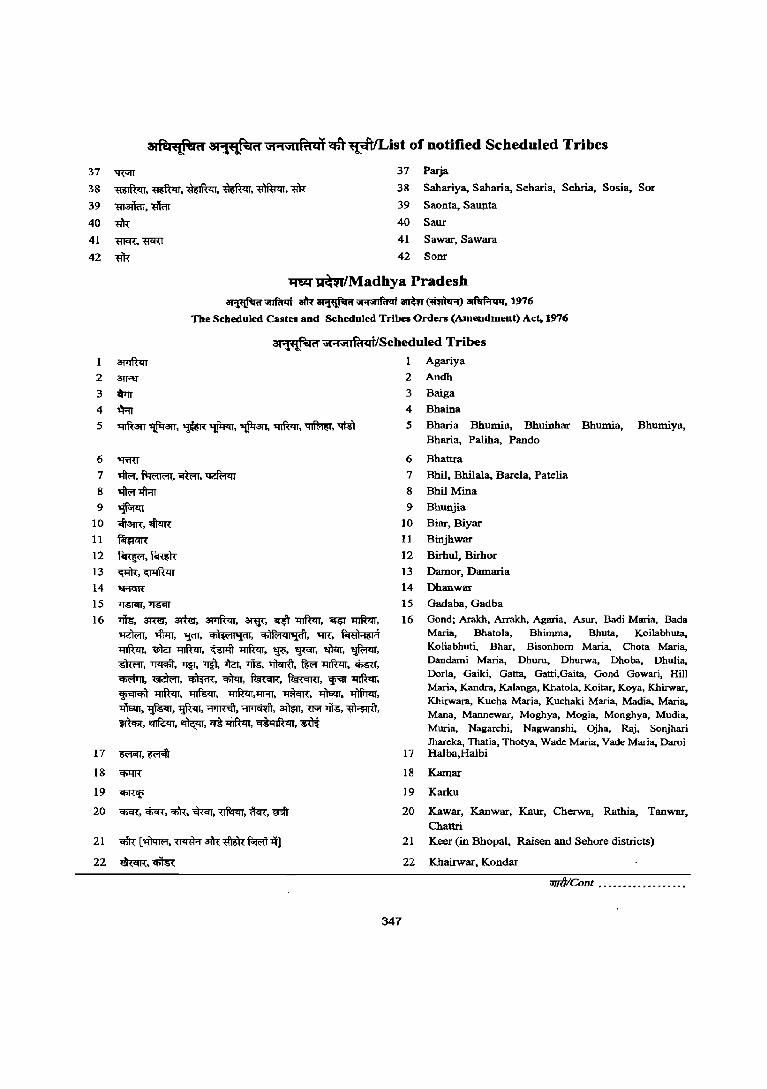
3ti'Q"l!1:ari 3t1'fll"iCri \iI.,GtIf'a4l cit' ~ist of notified Scheduled Tribes
37 'lrv!1" 37 Parja
38 ~,~,~.~.~,<'lR 38 Sahariya, Saharia, Seharia, Sehria, Sosia, Sor
39 m.o:ii;;r,. 39 Saonta, Saup.ta
40 * 40 Saur
41 t11C'R. lfCm 41 Sawar, Sawara
42 liR 42 Sonr
~~lMadhya Pradesh ~~ ~~"'Oj"'If.tqi atmr~)~, 1976
The Scheduled Castes and Scheduled Tribes Orden (Amendment) Act, 1976
at1't1!;('1 id"NufC:l"li/Scheduled Tribes ~ 1 Agariya
2 ~ 2 Andh
3 'i\rrr 3 Baiga
4 ~ 4 Bhaina
5 ~3IT ~3IT, ~~, ~3lT, ~, ~. ~ 5 Bhana Bhumia, Bhuinhar Bhumia, Bhumiya,
6 ~
7 ~.~,oRm,~
8 ~~
9 ~ 10 oiT31R, ~
11 ~
12 ~,f.Rm:
13 ~,~
14 ~ 15 TTSfCIT, "Jf5iIT
16 Tits, ams, a:rtlg, ~, 3'IW, ~ ~, ~ ~, ~, ~, 'Ilffi, ~, ~, "Iff, ~ ~, ~~, ~ mWrr, '¥, ~, ~, ~, 6ffi;rr. ~, ~, ~, ~. $;, Tjjqffi. tre ~, ~, ~, ~, ~, ~, fuRcrR, ~, <Ji'<If ~. ~ ~,~, ll'Tftlrr,ltRT,~,~, mm, ~,~, 1jft<n,~,~,., wr~,~,
~,~,~,cB~,~,~
17 ~,6mit
18 q;t:JJ<
19 ~
20 C!iOR, cfI<R, Cf>h:, ~. ~, ~, 'ffiit
21 qfu:- [~, ~ a:hnll~f"rt'ibt]
22 ~,~
Bharia, Palma, Pando
6 Bhattra
7 Bhil, Bhilala. Barela, Patelia
8 Bhil Mina
9 Bhunjia
10 Biar, Biyar
11 Binjhwar
12 Birhul, Birhor
13 Damor, Damaria
14 Dhanwar
15 Gadaba, Gadba
16 Gond; Arakh, Arrakh, Agaria, Asur, Badi Maria, Bada Maria, Bhatola, Bhimrna, Bhuta, Koilabhuta, Koliabhuti, Bhar, Bisonhom Maria, Chota Maria, Dandami Maria, Dhuru, Dhurwa, Dhoba, Dhulia, DorIa, Gaiki, Gatta, Gatti,Gaita, Gond Gowari, Hill Maria, Kandra, Kalanga, Khatola, Koitar, Koya, Khirwar, Khirwara, Kueha Maria, Kuehaki Maria, Madia. Maria, Mana, Mannewar, Moghya, Mogia, Monghya, Mudia, Muria, Nagarchi, Nagwanshi. Ojha, Raj, Sonjhari Ihareka, Thatia, Thotya, Wade Maria. Vade Maria, Daroi
347
17 Halba,Halbi
18 Kamar
19 Karku
20 Kawar, Kanwar, Kaur, Cherwa, Rathia, Tanwar, Chattri
21 Keer (in Bhopal, Raisen and Sehore districts)
22 Khairwar, Kondar
"fTttICont ...•••••.••..•...•
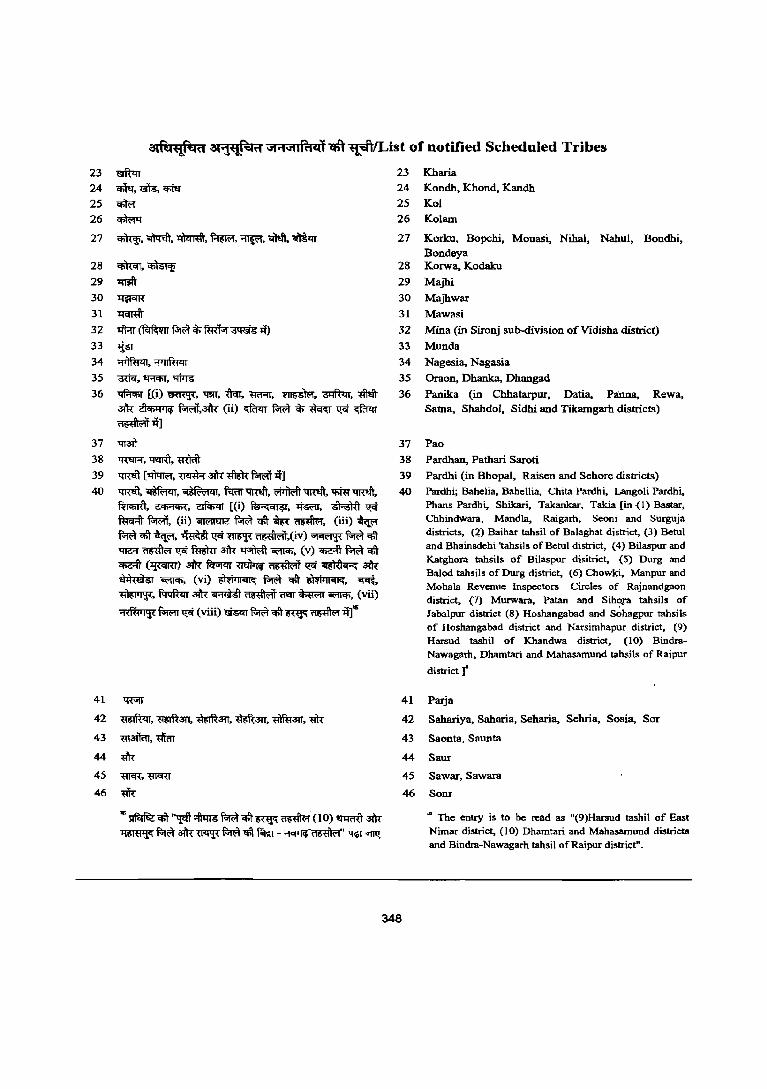
3iRc~a 3i1't'l!~i1 \i1rt;zcIRicif ~~fList of notified Scheduled Tribes
23 ~ 24 $,~,~
25 -q;"ffi
26 ~
27 ~,~,~,~,~,~.~
28 ~.~ 29 ~
30 ~
31 ~
32 ;ft;rr~~*fW;if~~
33 ~
34 ~,~
35 "&icf. ~, ~
36 ~ [(i) 'ffi'!W. 1fflT. ~. mr-rr. ~.~,"Wft aft< ~ ~.3lk (ii) ~ ~ * Ww ~ ~ ~.q]
37 'U~
38 'R'fiIR". ~. mMt 39 ~[~,~aftt~~.q]
40 ~,~,~, f\mr~, WfKoft~. ~~. ~,~,~[(i)~,~, ~~ fuq.:ft-~, (ii) omonme fiR;f <tit ~~, (iii) ~
fiR;f <tit~, ~~~ ~,(iv) ~ fiR;f qft
'DG-J~~~3lk~~, (v) ~~qft ~(~)aftt~~~~~3!lt ~ ~, (vi) ~ ~ <tit~, ~. ~, ~ aft< ~ ~<I2IT~;;;;;nq;, (vii)
~f.>R;rr ll!f (viii) ~~q,'t~ ~-q.j'"
41 ~
42 ~, ~a:rr, ~a:rr, ~a:rr, -mmarr, ~ 43 matffir,.mu
44 ~
45 ~,m<ro
46 ~
... ~q;T ''t:f.ff ~~qlt rn¥i~ (10) ~ an. ~~3!\t~~~foro-~-~'~~
23 Kharia
24 Kondh, Khond, Kandh
25 Kol
26 Kolam
27 Korku, Bopchi, Mouasi, Nihal, Nahul, Bondhi,
Bondeya 28 Korwa. Kodaku
29 Majhi
30 Majhwar
31 Mawasi
32 Mina (in Sironj sub-division ofVidisha district)
33 Munda
34 Nagesia, Nagasia
35 Oraon, Dhanka, Dhangad
36 Panika (in Chhatarpur. Datia. Panna, Rewa, Satna, Shahdol. Sidhi and Tikamgarh districts)
37 Pao
38 Pardhan, Pathari Saroti
39 Pardhi (in Bhopal. Raisen and Sehore districts)
40 Pardhi; Bahelia, Bahellia, Chita Pardhi. Langoli Pardhi.
41
42
43
44
45
46
Phans Pardhi, Shikari, Takankar, Takia [in (I) &star, Chhindwara, Mandla, Raigarh, Seoni and Surguja districts, en Baihar tahsil of Balaghat district, (3) Betul and Bhainsdehi 'tahsils of Betul district, (4) Bilaspur and Katghora tahsils of Bilaspur disitrict. (5) Ourg and Balod tahsils of Ourg district, (6) Chowki, Manpur and Mohala Revenue Inspectors Circles of Rajnandgaon district, (7) Murwara. Patan and Siho.,ra tahsils of Jaoolpur district (8) Hoshangabad and S~hagpur tahsils of Hoshangabad district and Narsimhapur district. (9) Harsud tashil of Khandwa district, (10) BindraNawagarh, Dhamtari and Mahasamund tahsils of Raipur
district ]"
Parja
Sahariy~Saharia.Seharia. Sehria, Sosia, Sor
Saonta, Saunta
Saur
Sawar. Sawara
Som
.. The entry is to be read as "(9)Harsud tashil of East Nimar district, (10) Dhamtari and Mahasamund districts and Bindra-Nawagarh tahsil ofRaipur district".
348
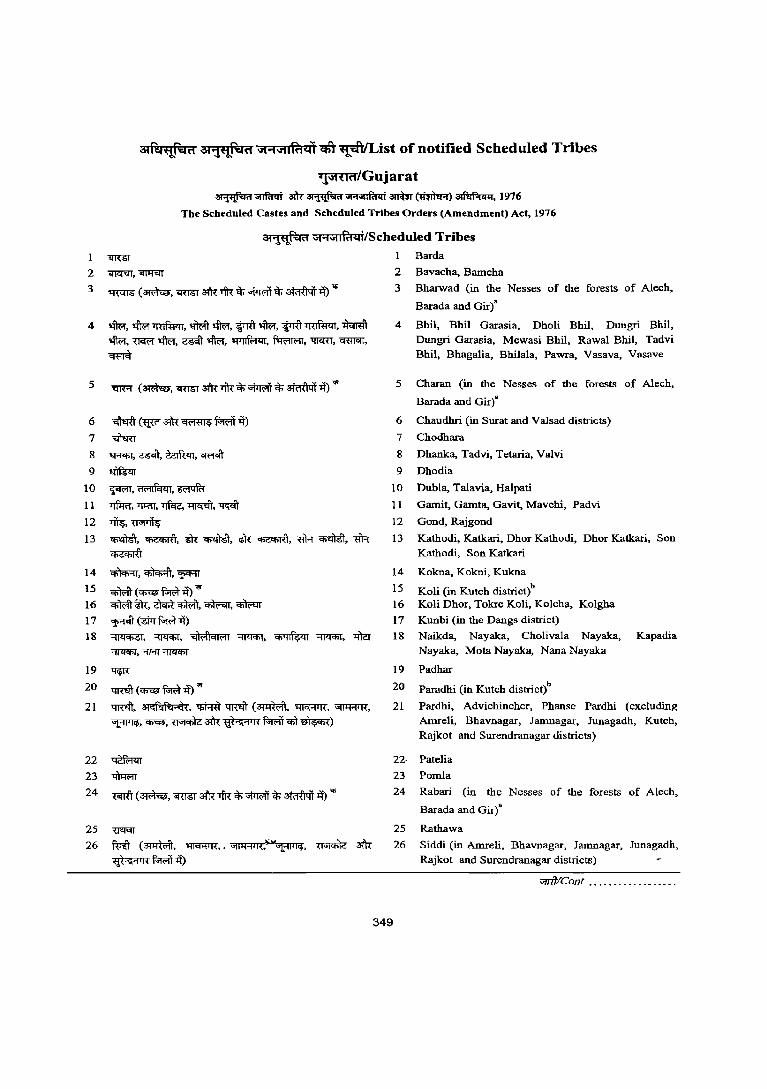
~~'t!!"'ilH ~1't!!~H "''''''''1if141 CIft~ist of notified Scheduled Tribes
~/Gujarat
~~ :mr~"'"I"'ifdqi atmr(lhmFr)~, 1976
The Scheduled Castes and Scheduled Tribes Orders (Amendment) Act, 1916
at~~t1 "1"NlIR1~iJScheduled Tribes
~ 1 Barda
2 ~,'iIttf<IT 2 Bavacha, Bamcha
3 ~ (~, <rom 3l'R Tft< *";;j>rnl *" ~ -q) ,. 3 Bharwad (in the Nesses of the forests of Alech.
4 ~,~~,"1Tffi~,wro~,wm~,~ 'ifuq, ~~, ~ 'ifuq, ~, ~, wm, qmqr,
cmT<f
6 ~(~3l'R~~-q)
7 ~
8 ~,~,~,~
9 ~
10 ~,~,~
11 '1fJ:Kr, 7Jrffi, TTfcIG, ~, w:ft 12 ~,~
13 ~,~, Gh: ~, Gh: ~, m., ~, m., ~
14 ~,~, 'l""'IT 15 ~(~~~1!J 16 CfiTffi~, ~~, ~, ~
17 ~(m~"4)
18 ~,~, ~ -=w:r<Fil, ~ ~, 11ler ~,~~
19 ~
20 ~(~~~)"'
21 ~, 3I~fqfil...?t{, ~ ~ (~. 'I1fCRlT{", ~,
~,~, ~3I'R~~-.m~)
22 ~
23 ~
24 ~ (~, ~ 3l'RTft< *";;j>rnl *" at;trq'f"4) q;
25 ~
26 fi:ro (3lIffivft, 'I1fCRlT{",. ~~, ~ aft< ~~-q)
Barada and Gir)a
4 Bhil, Bhil Garasia, Dholi Bhil, Dungri Bhil, Dungri Garasia, Mewasi Bhil, Rawal Bhil, Tadvi Bhil, Bhagalia, Bhilala, Pawra, Vasava, Vasave
5 Charan (in the Nesses of the forests of Alech,
Barada and Gir)a
6 Chaudhri (in Surat and Valsad districts)
7 Chodhara
8 Dhanka, Tadvi. Tetaria, Valvi
9 Dhodia
10 Dubla, Talavia, Halpati
11 Gamit, Gamta, Gavit, Mavchi, Padvi
12 Gond, Rajgond
13 Kathodi, Katkari, Dhor Kathodi, Dhor Katkari. Son Kathodi, Son Katkari
14 Kokna, Kokni, Kukna
15 Koli (in Kutch district)b 16 Koli Dhor, Tokre Koli, Kolcha, Kolgha
17 Kunbi (in the Dangs district)
18 Naikda, Nayaka, Cholivala Nayaka, Kapadia Nayaka, Mota Nayaka, Nana Nayaka
19 Padhar
20 Paradhi (in Kutch district)b
21 Pardhi, Advichincher, Phanse Pardhi (excluding Amreli, Bhavnagar, Jamnagar, Junagadh, Kutch, Rajkot and Surendranagar districts)
349
22· Patelia
23 Pomla
24 Rabari (in the Nesses of the forests of Alech,
Barada and Gir)"
25 Rathawa
26 Siddi (in Amreli, Bhavnagar, Jarnnagar. Junagadh, Rajkot and Surendranagar districts)
,,""/Cant ............•.....
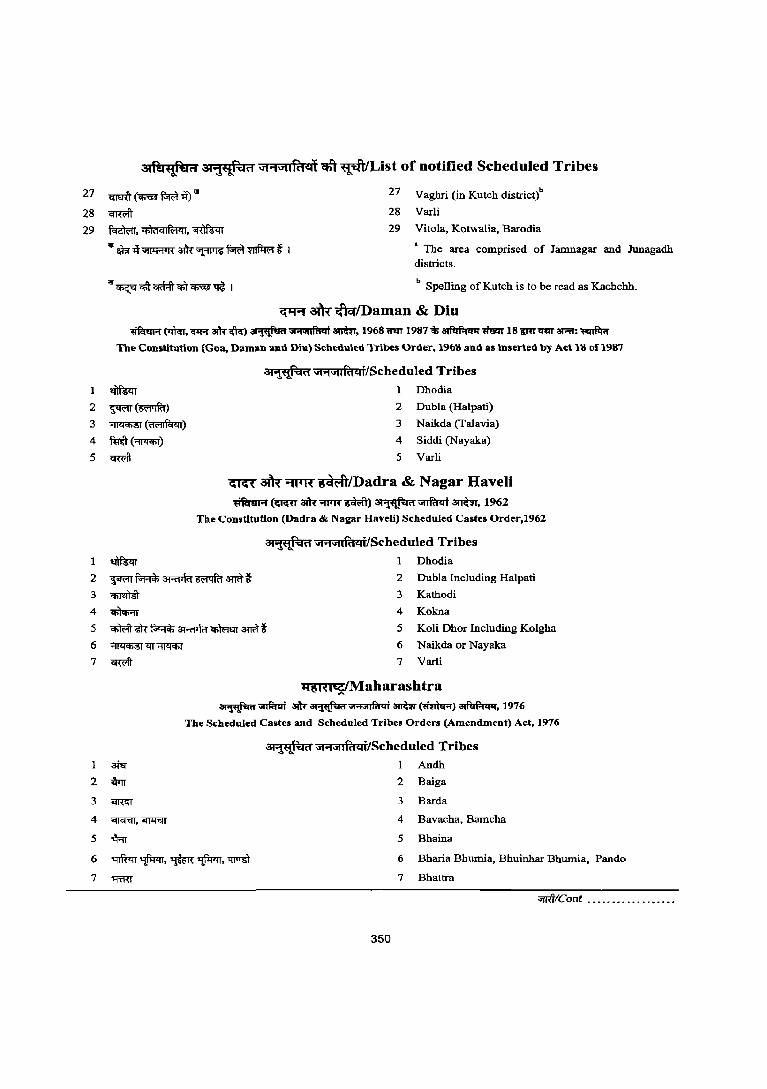
27 cnmt (Cfi'i'3" ~ -R) II
28 qm;fi
27 Vaghri (in Kutch district)b
28 Varli
29 ~, if>IMlfcl41. ~
"'lIbrlf~am-~m~f I
29 Vito la, Kotwalia, Barodia
• The area comprised of Jamnagar and Junagadh districts.
b Spelling of Kutch is to be read as Kachchh.
GJ:A' atkmlDaman & Diu ~ (1l1<n, ~ .~) ~ .... Nllf<iqj otmT, 1968<rm 1987-$ ~-mw 18irnT1fm~: ~
The Constitution (Goa, Daman and Diu) Scheduled "l'Tibes Order, 1968 and as inserted by Act 1S of 1987
at1~fI Gt"G'tI~qi!Scheduled Tribes
1 ~ 1 Dhodia
2 ~(~)
3 ~(~)
4 fuit(~)
5 <Rffi
2 Dubla (Halpati)
3 Naikda (Talavia)
4 Siddi (Nayaka)
5 Varli
~.';f'(1"R"~JDadra & Nagar Haveli ~(~am-~~)~~31Rw, 1962
The Constitution (Dadra & Nagar Haveli) Scheduled Castes Order,1961
31'¥i!~fI G'H""IRtqi/Scheduled Tribes
1 Dhodia
2 ~~ 3Rflffi~-mTf 2 Dubla Including Halpati
3
4
5
6
7
1
2
3
4
5
6
7
~ 3 Kathodi
~ 4 Kokna
CfiR;itm ~ 3FiiIlR~ m~ 5 Koli Dhor Including KDlgha
~<IT~
<ffi'1t
-m. ~
~
~.~
~
6 Naikda or Nayaka
7 Varli
~aharashtra
~;;nfu-qf .~"''''''Ifaqi ~~)~, 1976
The Scheduled Castes and Scheduled Tribes Orders (Amendment) Act, 1976
311'1!~.qC1 """'''1IR1qilScheduled Tribes
1 Andh
2 Baiga
3 Barda
4 Bavacha, Bamcha
5 Bhaina
"lftqy~, WR~, ~ 6 Bharia Bhumia, Bhuinhar Bhumia, Pando
7 Bhattra "'fffiT
~(Cont ................ ..
350
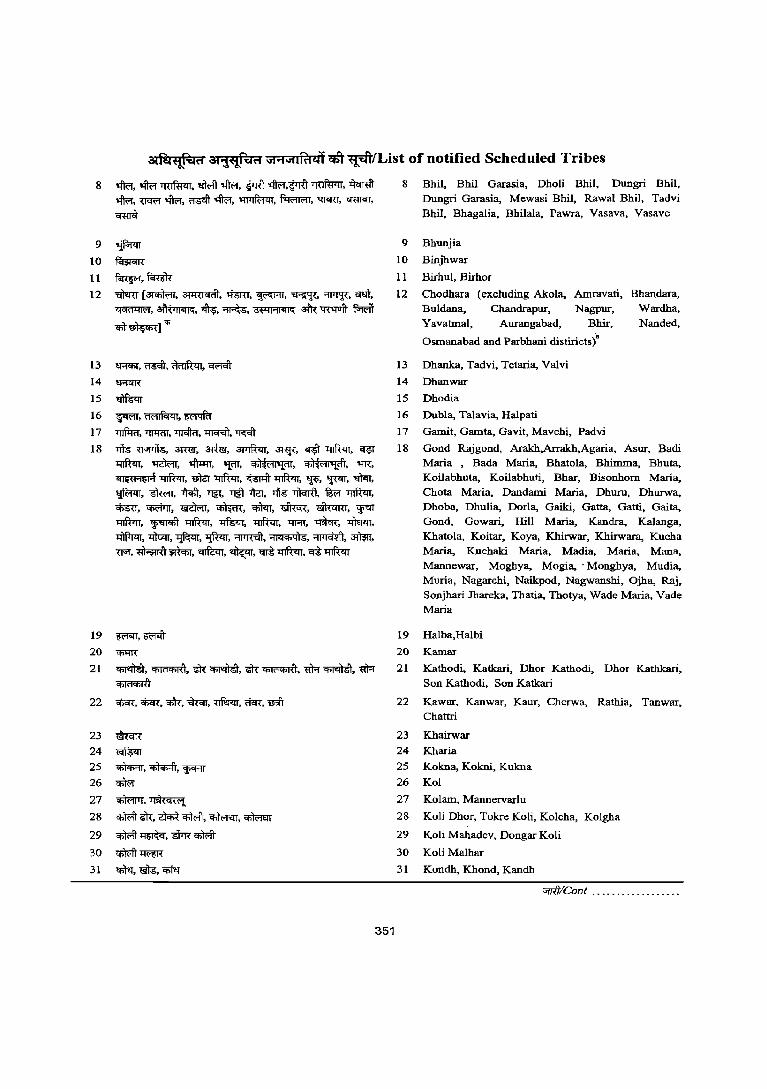
a!ftl~~H a!if{l~i4H ::i1""1\rllm4l ctr ~/List of notified Scheduled Tribes
8 ~,ofuor l'f{lfum, tfR;ft ,fWr, ~ >fu;r,wm~, itcmft 8 Bhil. Bhil Garasia, Dholi Bhil, Dungri Bhil,
~, ~ ,fWr, i'Wit ,fWr, ~, ~, "CfTCRT, CffIlCU,
m:ucT
9 ~ 10 ~
11 ~,fcmR
12 ~ [~, ~, ~, ~, ~, "fIlT'F, <NT, ~,~,~,~, 3f'li'1i"H<i .~ f.;wit q;)-~]q;
13 "FfCfir, ~, ~. ~
14 ~
15 mrrr 16 "§'WiT, ~. ~
17 'Tlfl::Rr, 7JI1'RtT, ~, ~, ~
18 lTIs~, 3l&, affig, ~, *;F", ~ l1lR<rr, ~ 'I'!1ft<rr, ~, ~, 'lffi", ~, ~, 'BR,
'1i~{l'1(\l"i "ll'IfMT, m 'I:fiWrr, ~"ll'IfMT, ~, ';IOO, ~, ~, sRffi, ~, ~, ~ ~, m TJ1qffi, li.wr ~, ~, ~, mJm, ~, <mT, ~, ~, cplT
1::!lft>a, ~ ~, ~, -.:nft<rr, l'IRT, ~, ~,
~,muu,~,~,~,~,~,~,
\FiT, ~~,~,~, ~'tflft>rr, ~'tflW.rr
19 ~,~
20 ~
21 ~,~, ~~, m~, t1R~. <'I1=r ~
22 ~, ci;cR, ~, ~, ~, <!err, mit
23 ~
24 ~ 25 ~,~, <pFIT
26 ~
27 <iiWIm,~
28 q;t;ft~. ~ 'IiWft, ~, ~
29 q;t;ft~, 'ifrR cnlffi 30 q;)(;fi~
31 ~,~,~
351
Dungri Garasia, Mewasi Bhil, Rawal Bhil, Tadvi Bhil, Bhagalia, Bhilala, Pawra, Vasava, Vasave
9 Bhunjia
10 Binjhwar
11 Birhul, Birhor
12 Chodhara (excludillg Akola, Amravati, Bhandara, Buldana, Chandrapur, Nagpur, Wardha, Yavatmal, Aurangabad, Bhir, Nanded,
Osmanabad and Parbhani distirictsja
13 Dhanka, Tadvi, Tetaria, Valvi
14 Dhanwar
15 Dhodia
16 Dubla, Talavia, Halpati
17 Gamit, Gamta, Gavit, Mavchi, Padvi
18 Gond Rajgond, Arakh,Arrakh,Agaria, Asur, Badi Maria , Bada Maria, Bhatola, Bhimrna, Bhuta, Koilabhuta, Koilabhuti, Bhar, Bisonhom Maria, Chota Maria, Dandarni Maria, Dhuru, Dhurwa, Dhoba, Dhulia, Dorla, Gaiki, Gatta, Gatti, Gaita, Gond, Gowari, Hill Maria, Kandra, Kalanga, Khatola, Koitar, Koya, Khirwar, Khirwara, Kueha Maria, Kuchaki Maria, Madia, Maria, Mana, Mannewar, Moghya. Mogia,· Monghya, Mudia, Muria, Nagarchi, Naikpod, Nagwanshi, Ojha, Raj, Sonjhari Jhareka, Thatia, Thotya, Wade Maria, Vade Maria
19 Halba,Halbi
20 Kamar
21 Kathodi. Katkari, Dhor Kathodi, Dhor Kathkari. Son Kathodi, Son Katkari
22 Kawar, Kanwar, Kaur, Cherwa, Rathia, Tanwar, Chattri
23 Khairwar
24 Kharia
25 Kokna, Kokni, Kukna
26 Kol
27 Kolam, Mannervarlu
28 Koli Dhor, Tokre Koli, Kolcha, Koigha
29 Koli Mahadev, Dongar Koli
30 Koli Malhar
31 Kondh, Khond, Kandh
"TliJICont ................. .
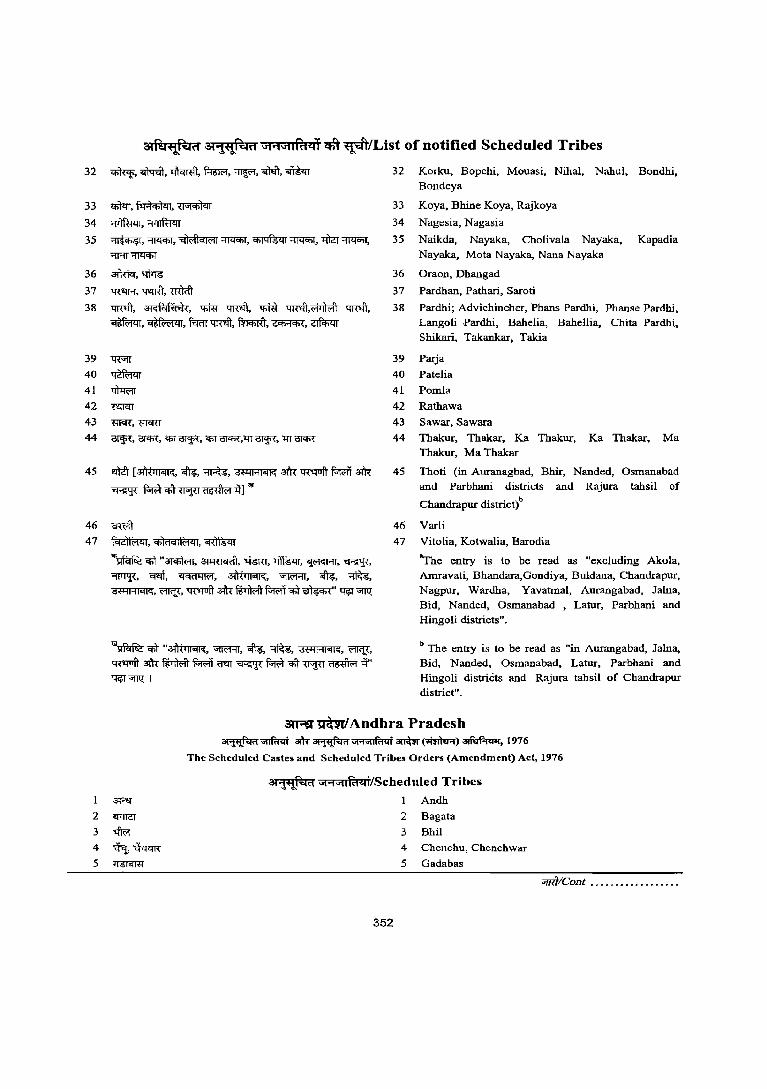
atR:!1!"'-Ch1 3t~H \i1;:'j\J1If~<if Cfft~/List of notified Scheduled Tribes
32 ~, ~, ~, furM, ~, <i!m, ~ 32 Korku, Bopchi, Mouasi, Nihal, Nahul, Bondhi,
33 cW:rr, ~, ~ 34 ~,~
35 ~,~,~~,~~,.u-a~,
"lAT~
36 anm, ~ 37 ~, 'lilffi, mMt 38 -mm, 31i(fqfiJih, q>R:f l:!Wft, -q;ffi l:!Wft,Wffi;ft ~, ~,~, m~, f.n<mU,~, ~
39 'WIT
40 ~
41 ~
42 ~
43 ~,"BIORT
44 ~, OT<!>{, q)[~, q)[0T<!>{,1:!T0J¥, 1:!T0T<!>{
45 ~[~,~,~,3~HI"lIi(3!'tt~~~
~ ~q,'f<T"Ff ~llJ l;J
46 <Ri.'ft 47 ~,cn1<lCillfl'1<li, ~
"'~q,'t "~,~, -.tsm, ~, <jMi(RT, ~, "fiTl"l\, wn, ~, ~, UfWRT, ~, ~, 3V4HI"lIi(,~, ~3!'tt~F<R'ihfir~' ~~
1S~ q,'t "~, ~, aiT:?, ~, 3~Hi"li'i, ~, ~ a:tr< ~ ~ <MT ~ ~ q,'f <T"Ff ~~' ~~i
Bondeya
33 Koya, Bhine Koya, Rajkoya
34 Nagesia, Nagasia
35 Naikda, Nayaka, Cholivala Nayaka, Kapadia Nayaka, Mota Nayaka, Nana Nayaka
36 Oraon, Dhangad
37 Pardhan, Pathari, Saroti
38 Pardhi; Advichincher, Phans Pardhi, Phanse Pardhi, Langoli Pardhi, Bahelia, Bahellia, Chita Pardhi, Shikari, Takankar, Takia
39 Parja
40 Patelia
41 Pomla
42 Rathawa
43 Sawar, Sawara
44 Thakur, Thakar, Ka Thakur, Ka Thakar, Ma Thakur, Ma Thakar
45 Tholi (in Auranagbad, Bhir, Nanded, Osmanabad and Parbhani districts and Rajura tahsil of
Chandrapur district)b
46 Varli
47 Vitolia, Kotwalia, Barodia
"The entry is to be read as "excluding Akola, Amravati, Bhandara,Gondiya, Buldana, Chandrapur, Nagpur, Wardha, Yavatmal, Aurangabad, Jalna, Bid, Nanded, Osmanabad , Latur, Parbhani and Hingoli districts".
b The entry is to be read as "in Aurangabad, lalna, Bid, Nanded, Osmanabad, Latur, Parbhani and Hingoli districts and Rajura tahsil of Chandrapur district".
atAT ~/ Andhra Pradesh ~~ am-~"''''''lfiNi~(~)~,1976
I ~
2 "iI'11CJ
3 'IfuYf 4 *l,~ 5 ~
The Scheduled Castes and Scheduled Tribes Orden (Amendment) Act, 1976
ati*!!~<1 ... =t"iIRt4i/Scheduled Tribes
1 Andh
352
2 Bagata
3 Bhil
4 Chenchu, Chenchwar
5 Gadabas
,,""IConl ......•..•........
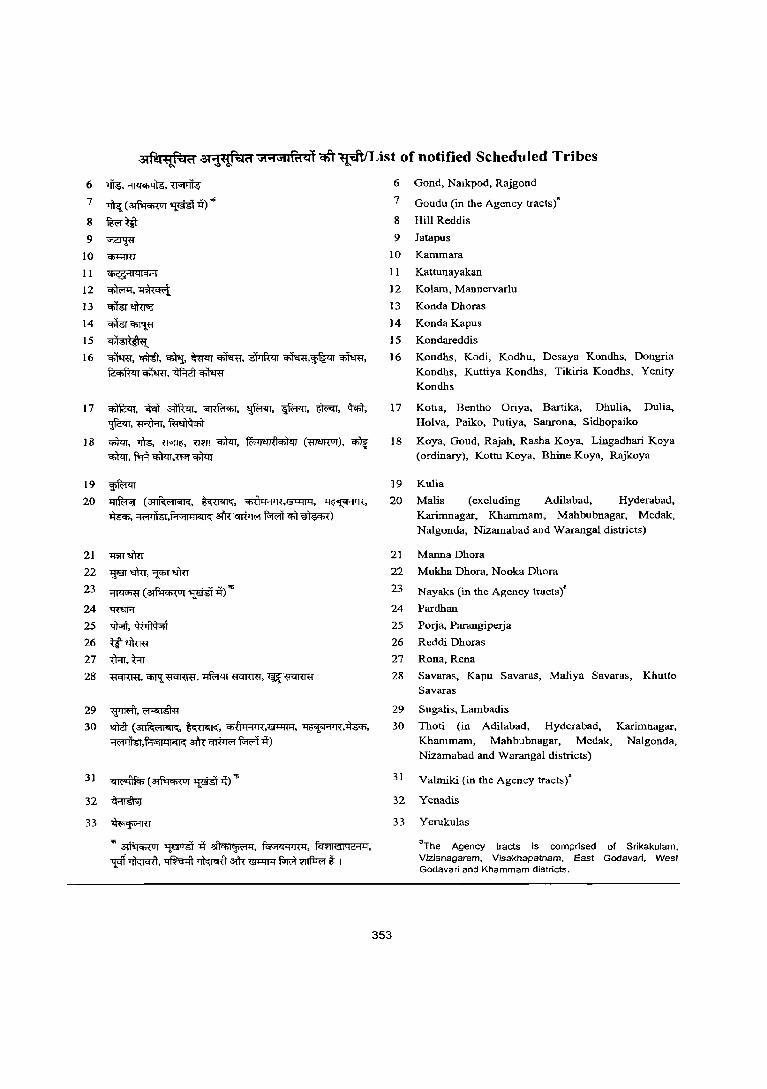
~"lrT.4ct ~i~1:t(1 Jt""lJtlfrl<'if Cffr ~'lList of notified Scheduled Tribes
6 ~.~,~
7 ~(~~it)'" 8 frn~ 9 ~
10 ~ 11 Q;«"'1I<llili'1
12 ~,~ 13 'lifi'fsr~
14 <Ii'i6r CiiT'{H
15 ~ 16 ~,~,~,~~,~~,~~,
R:ct>W.rr~, ~~
17 ~,~~,~,~,~,~,W,
~,~,~
] 8 ~,~,~, <1m <WIT, ~ (tIlm{UT), ~
~, f':R"ct>l>n,~~
19 ~
20 ~ (31IR;<'1IG1I«, ~, ~,~, 4~1.'H'I{, ~, ~,f"'''1141''1''' .aitnrrtrwr j(;w['fiT~)
21 "'ffiT tOO 22 1fID "llu, "'iilif "llu 23 ~(~~it)'" 24 ~
25 'l1"1t. ~ 26 ~~ 27 <:Hr, t=rr 28 ~,Cfi11{.~, ~~, ~wmR1
29 ~,~ 30 ~ (31IR;<'1IQI<:;, ~, ~,~, 4i'\1.<1'1'i{,~,
~,f+i1lql.*i .3=Ih: ~ f-;wIT it)
31 ~(~~it)'"
32 ~
33 ~
'" ~ ~ it ~, fClGl"l'1'I{q,· fCl~II@OIq&1q, ~~, ~~3=i'R~f.m;l~t I
6 Gond, Nalkpod, Rajgond
7 Goudu (in the Agcncy tracts)'
8 Hill Reddis
9 Jatapus
10 Kammara
11 Kattunayakan
12 Kolam, Manncrvarlu
13 Konda Dhoras
14 Konda Kapus
15 Kondarcddis
16 Kondhs, Kodi, Kodhu, Desaya Kondhs, Dongria Kondhs, Kuttiya Kondhs, Tikiria Kondhs, Yenity
Kondhs
17 Kotia, Bcntho Oriya, Bartika, Dhulia, Dulia, Holva, Paiko, Putiya, Sanrona, Sidhopaiko
18 Koya, Goud, Rajah, Rasha Koya, Lingadhari Koya (ordinary), Kottu Koya, Bhine Koya, Rajkoya
19 Kulia
20 Malis (excluding Adilabad, Hyderabad,
21
22
23
24
25
26
27
28
29
30
353
31
32
33
Karimnagar, Khammam, Mahbubnagar, Medak, Nalgonda, Nizamabad and Warangal districts)
Manna Dhora
Mukha Dhora, Nooka Dhora
Nayaks (in thc Agency tracts)'
Pardhan
Porja, Parangipcrja
Reddi Dhoras
Rona, Rena
Savaras, Kapu Savaras, Maliya Savaras, Khutto Savaras
Sugalis, Lambadis
Thoti (in Adilabad, Hydcrabad, Karimnagar, Khamrnam, Mahbubnagar, Medak, NaJgonda, Nizarnabad and Warangal districts)
Valmiki (in the Agency tracts)"
Yenadis
Ycrukulas
3 The Agency tracts is comprised of Srikakulam, Vizianagaram, Visakhapatnam, East Godavari, Wes! Godavari and Khammam districts.
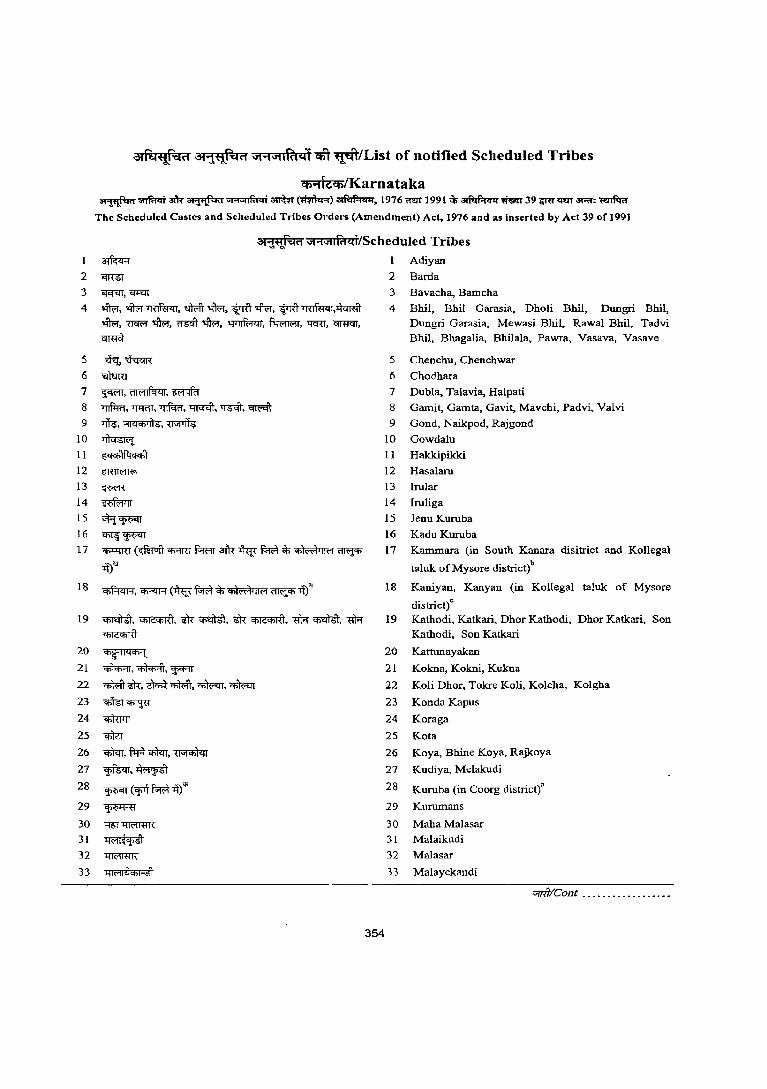
atfu<t{''ilH at1~""''ilH ;j1;:1'Juft't«il cit ~/List of notified Scheduled Tribes
Cfi .... iGCfilKarn a taka ~~ 31\t ~ ",.,,,,,F.I,,j ~ (~)~, 1976nm 1991 '$ ~W!!m 39 i;mttQT ~ l'mftm
The Scheduled Castes and Scheduled Tribes Orders (Amendment) Act. 1976 and as inserted by Aet 39 of 1991
I~
2 ~
<li1~i:ti'1 "'''1\i1lRlqi/Scheduled Tribes
1 Adiyan
3 ~,~
4 GWr, GWr~, ~M GWr, ~ GWr, ~~,*mft 'lfu;;, 1l<Wf 'lfu;;. croft 'lfu;;. "I'1Ifffqr. f':wm;rr. llCRT. <mrciT.
qmcf
5 *L~ 6 Titmu 7 ~, <IlFIlfcr<rr, ~ 8 'llftm, TJl1<lT, 1'JWm, ~, ~, ~ 9 ~,~,~
10 ~ II (\~fl:!#j
12 ~
13 ~
14 ~
IS uq~
16 ~~
17 CI>l+IlU (~<Am ~ 3l'R ~ ~ ~ ~~ if)"
18 ~,~("4w~~CfJiffi'IIM~ll)"
19 ~.~. -m~, -m~. <'IR~, ~
~
20 <t>~'114<t>"l
21 ~,~,'¥AT
22 '<t>Mt-m. ~~,~. ~ 23 Cf>l:sr~
24 "<t>ffirTT 25 ~
26 ~,f1P;~,~
27 ~,~
28 ~(~~if)'"
29 ~
30 'm~
31 ~ 32 ~
33 4IMI~Cf>I;;i)
354
2 Barda
3 Bavacha, Bamcha
4 Bhit, Bhit Garasia, Dholi Bhit, Dungri Bhil, Duogri Garasia, Mewasi Bhit, Rawal Bhit, Tadvi
Bhit, Bhagalia, BhiIata, Pawra, Vasava, Vasave
5 Cheochu, Cheochwar
6 Chodhara
7 Dubta, Talavia, Halpati 8 Gamit, Garnta, Gavit, Mavchi, Padvi, Valvi
9 Good, Naikpod, Rajgond
10 Gowdalu
11 Hakkipikki
12 Hasalaru
13 Irular
14 Iruliga
15 Jenu Kuruba 16 Kadu Kuruba
17 Kammara (in South Kanara disitrict and Kollegal
tatuk of My sore district)b
18 Kaniyan, Kanyan (in Kollegal taluk of Mysore
district)"
19 Kathodi, Katkari, Dhor Kathodi, Dhor Katkari, Son Kathodi. Son Katkari
20 Kattunayakan
21 Kokna, Kokni, Kukna
22 Koli Dhor, Tokre Koli, Kolcha, Kotgha
23 Konda Kapus
24 Koraga
25 Kota
26 Koya, Bhine Koya, Rajkoya
27 Kudiya. Metakudi
28 Kuruba (in Coorg district)"
29 Kurumans
30 Maha Malasar
31 Malaikudi
32 Malasar
33 Malayckandi
"'flit/Cont . .. ' ............. .
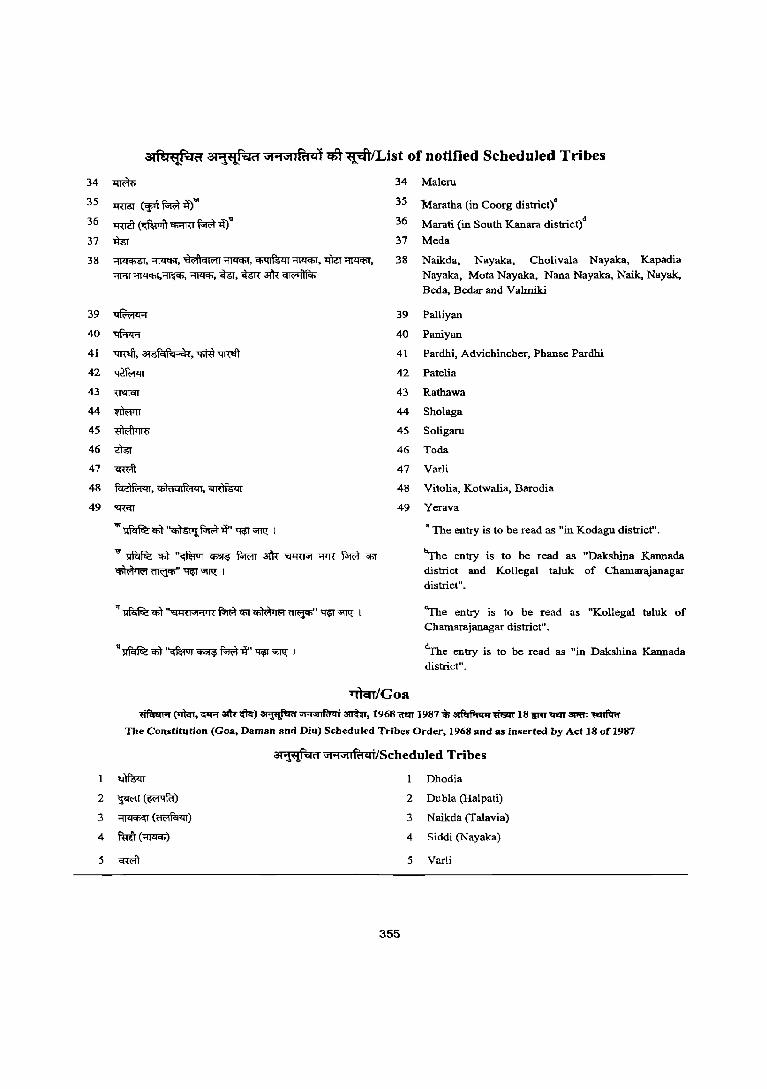
34 11Tffi;
3S lfUOT (¥~~ .. 36 1R!it (~i!f>-mT ~~" 37 ~
3& ~,~,~~,~~,t:i1Gr~, ;u;:rr~,~, ~, ~, cl6R afu" ~
39 ~
40 ~
41 -qmit. all:;fqf"l~{, 'Iiffi-qmit
42 ~
43 ~
44 Wwn
4S ~
46 -mr 47 Cffi'iT
48 ~. ,*,1(i4Iict<U, ~
49 ~
"'~Cfi)'~~1l"~~ I
~~ 'fit'~ ~ ~ afu" ~""!"IT ~ 'fiT
~~'~~I
34 Maleru
35 Maratha (in Coorg district)·
36 Marati (in South Kanara district)d
37 Meda
38 Naikda, Nayaka, Cholivala Nayaka, Kapadia Nayaka, Mota Nayaka, Nana Nayaka, Naik, Nayak, Beda, Bedar and Valmili
39 Palliyan
40 Paniyan
41 Pardhi, Advichincher. Phanse Pardhi
42 Patelia
43 Rathawa
44 Sholaga
45 Soligaru
46 Toda
47 Varli
48 Vitolia, Kotwalia, Barodia
49 Yerava
• The entry is to be read as "in Kodagu district" .
~e entry is to be read as "Dakshina Kannada district and Kollegal taluk of Chamarajanagar district".
"The entry is to be read as "Kollegal taluk of Cbamarajanagar district" .
~e entry is to be read as "in Dakshina Kannada district".
1'l1crr/Goa
2
3
4
5
~crmrr,~31k;fur)~"''1'''lfd4i ormr, 1968<tm1987'll;~~18tm'qqf3P«:~ The Constitution (Goa, Daman and Diu) Scheduled Tribes Order, 1968 and al inserted by Act 18 of 1987
3f'ft'l!"'*cl "'.Nlltit<Ol ilScheduled Tribes
mfu<rr Dhodia
~(~) 2 Dubla (Halpati)
~(~) 3 Naikda (Talavia)
futT(~) 4 Siddi (Nayaka)
<wit 5 Varli
355
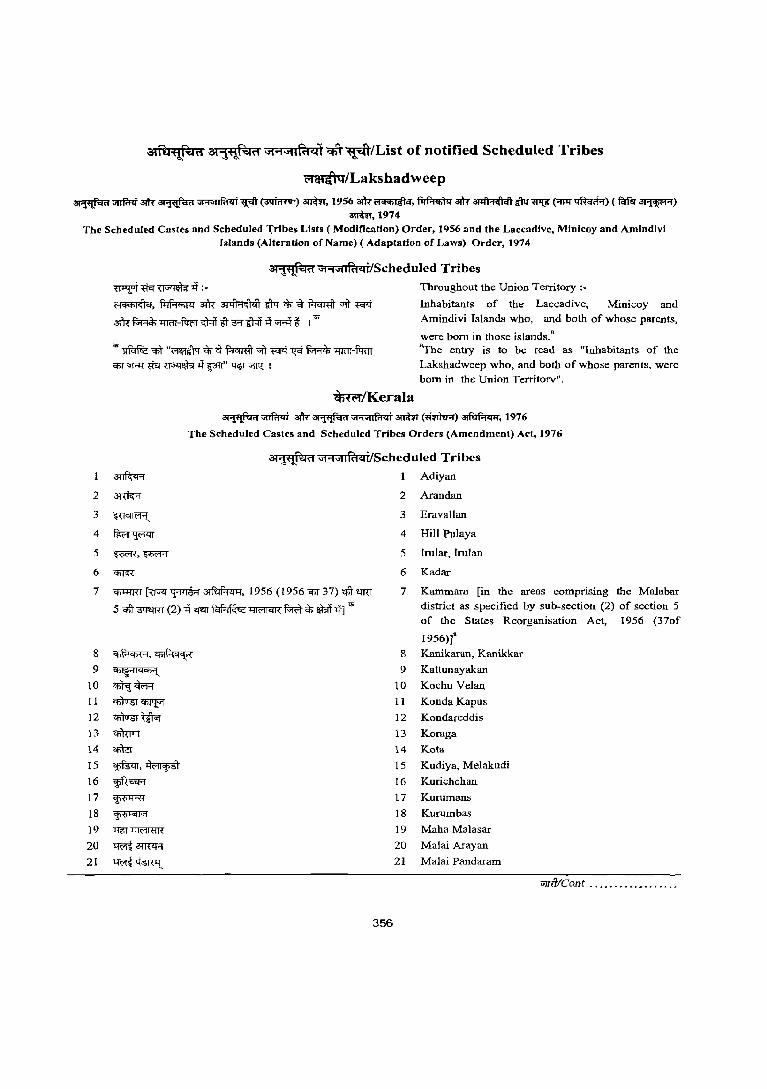
alMW..sHi ati~~i'1 'l1"'1"ufulll qft~/List of notified Scheduled Tribes
~/Lakshadweep
~;;nffflt 3ltt ~ ""MIRt .. i ~ (0TffiRvr) anffi, 1956 ~~, ~ ~ ~"dttJ~ (0fl1i~) ( taN aFWt'R) arivr, 1974
The Schedultd Castes and Schedultd 1ribes Lists (Modification) Order, 1956 and tht Laceadivc, Minlcoy and Amindivi Islands (Alteration of Name) (Adaptation of Laws) Order, 1974
atW~~ OJi .... J1Ii'a<lilScheduled Tribes
'~p:JrhiEf ~-# :- Throughout the Union Territory :-
~, ~ dR ~l<fT rn c); ~ f-lcm:ft ;;IT m ~~~-mrr<;Blm<Hmr-#;;Rf I'"
Inhabitants of the Laccadive, Minicoy and Amindivi Islands who, and both of whose parents,
'" ~ q;f "~c); ~ f.l<mTI vil m ~ ~ '''IT<'r.-l'mr Qfif "iRi -aor ~ if lan" ~ ~ I
were born in those islands." "The entry is to be read as "Inhabitants of the Lakshadweep who, and both of whose parents. were born in the Union Territorv".
c)m;r/Kerala ~;;nfrr<Ii 3ltt ~ "''1 "'IRt",i amm <mrlv.r) ~, 1976
The Scheduled Castes and Scheduled Tribes Orders (Amendment) Act, 1976
3t"l"!!'"'.q<1 "1'1"ui'a .. i/Scheduled Tribes
1 Adiyan
2 Arandan
3 Eravallan
6 ~
4 Hill Pulaya
5 Irular. Irulan
6 Kadar
7 ~r [Vv<f ~~, 1956 (1956 '!iT 37) <:fit 'loUD
5 qit ~ (2) ot <f'!lT ~ 11IMl<!R FrR $ $if ot] '"
8 ~.~ 9 CfiI~"'I<l"''"l
10 ~~ II ~~ 12 ~~ 13 <li1wrr 14 ~
15 ~.~ 16 ~f~ 17 cp»Rl
18 ~ 19 t:Jf;f~
20 ~am<R 21 ~~
356
7 Kammara [in the areas comprising the Malabar district as specified by sub-section (2) of section 5 of the States Reorganisation Act, 1956 (37of
1956)]" 8 Kanikaran, Kanikkar
9 Kattunayakan
10 Kochu Velan
11 Konda Kapus
12 Kondaceddis
13 Koraga
14 Kota
15 Kudiya, Melakudi
16 Kurichchan
17 Kurumans
18 Kurumbas
19 Maha Malasar
20 Malai Arayan
21 Malai Pandaram
vrrttlCont ....•.....•.......
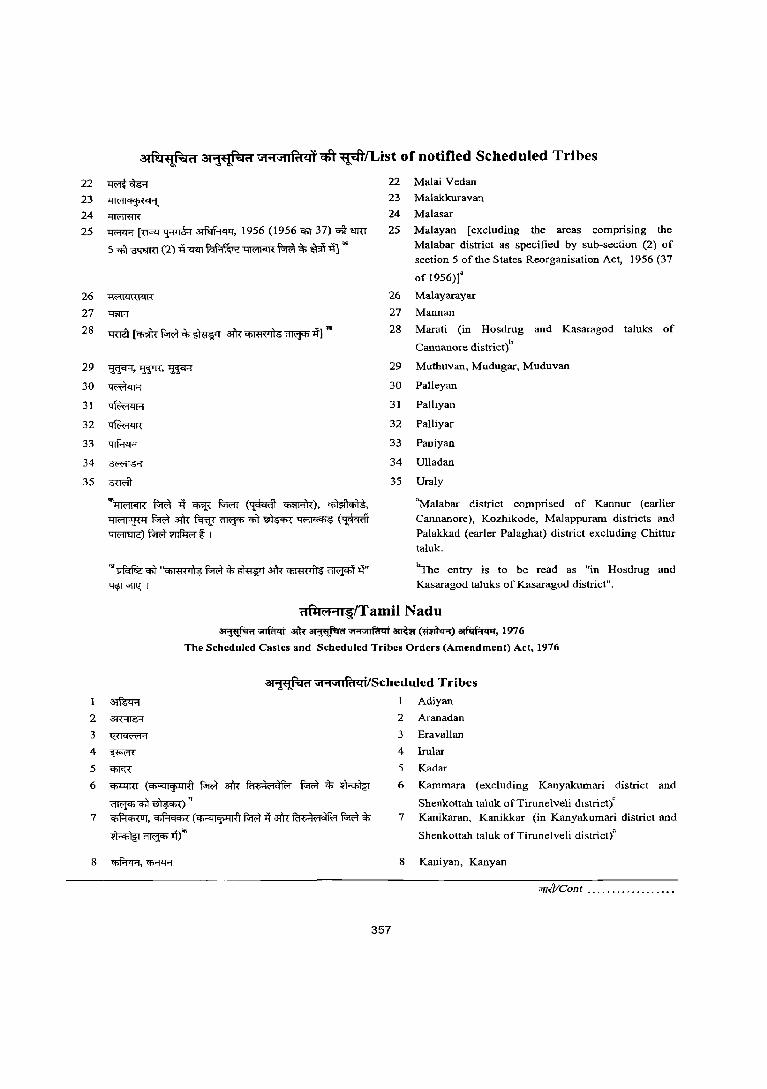
atfu~(1 atlWiOI(1 J"'\illfi:t~j ctiT ~/List of notified Scheduled Tribes
22 ~cf6;:{
23 1OI1('11<fiii~q"l
24 ~
25 ~ [~'fFTcH~' 1956 (1956 CfiT 37) ~ 'OlRT
Sq;,'l0'Nm(2)~<mi~~~*~~] ..
26 U;~\l:(({'4\,(
27 '1?IR
28 'tRlit [Cfi"iR ~ ~ ~ 3ft\ ~ i'iR'fP ll] to
29 ~,-rwrr,~
30 ~
31 ~
32 ~
33 ~
34 ~
35 ~
";~~-q~~(~~),~,
~ ~ 3ft\ ~~q;'t~~ (~ ~) fo1c;;f ~i I
"'~<'fiT"~~~~3ft\~~1l" ~"ll1l;1
22 Malai Vedan
23 Malakkurava'.l
24 Malasar
25 Malayan [excluding the areas comprising the Malabar district as specified by sub-section (2) 0 f section 5 of the States. Reorganisation Act, 1956 (37
26
27
28
29
30
31
32
33
34
35
of 1956)]"
Malayarayar
Mannan
Marati (in Hosdrug and Kasaragod taluks of
Cannanore district)b
Muthuvan, Mudugar, Muduvan
Palleyan
PalJiyan
Palliyar
Paniyan
Ulladan
Uraly
'Malabar district comprised of Kannur (earlier Cannanore), Kozhikode, Malappuram districts and Palakkad (earler Palaghat) district excluding Chittur taluk_
~e entry is to be read as "in Hosdrug and Kasaragod taluks of Kasaragod district"_
(1ilt(i1.1I~/Tamil Nadu ~~ am-~"''1'''lia<li ~~)~, 1976
The Scheduled Castes and Scheduled Tribes Orders (Amendment) Act, 1976
<Il1fJ:1';jft "'·'NlIMQi/Scheduled Tribes I Adiyan
6 q;D:flU (CfI::qI'1'lOIl{l f;Wt 3ft< fM:?j",,~f<'1 ~ ~ ~
~<tiT~)'l 7 ~, ~ (-""tf>='"<4""I'i'=lOIrTll-:fttl ~ -if 3ft\ Ri'6;i""C)f(1 ~ ~
~~-q)'"
357
2 Aranadall
3 Eravallan
4 Irular
5 Kadar
6 Kammara (excluding Kanyakumari district and
Shenkottah ta\uk of TirunelveE dlstrict)c
7 Kanikaran, Kanikkar (in Kanyakumari district and
Shenkottah taluk of Tirunelveli district)"
8 Kaniyan, Kanyan
CifTftICont . _______ .•• __ . _ .••
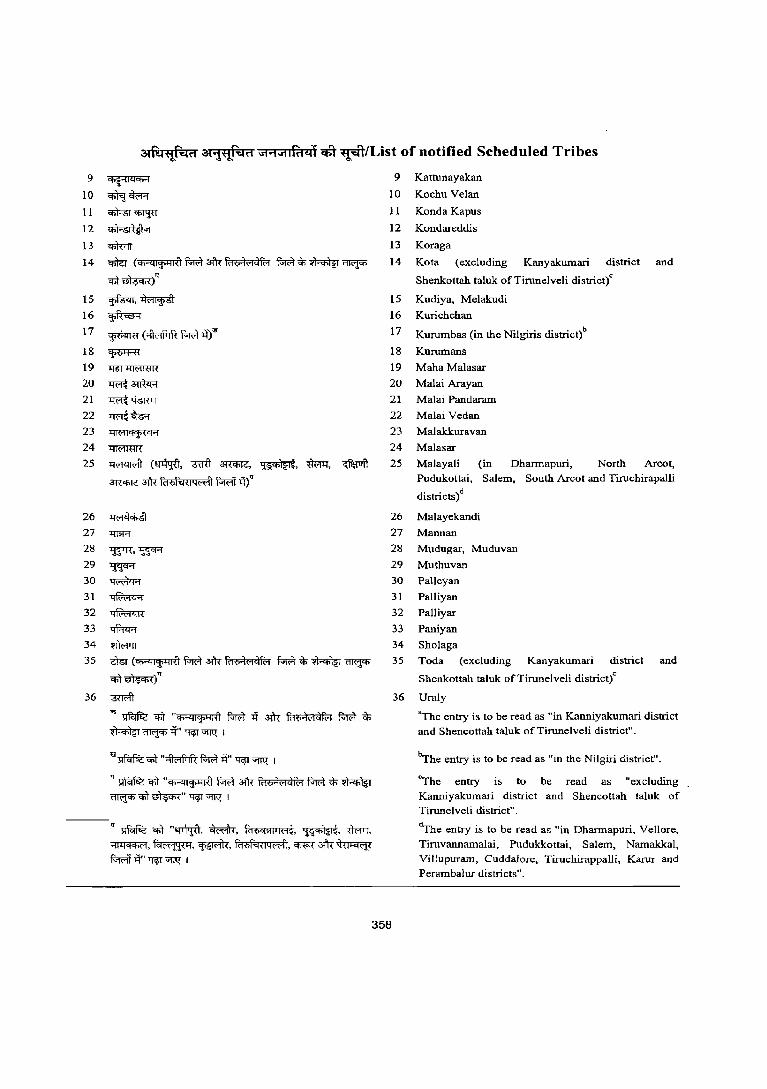
9 &>~'114&i"'l
1 0 ~ cI'ffo:r 11 ~Ci>l'Ff
12 CflI'""5I{jjl"1
13 "&iWrr 14 "i'fi1cJ (4i"41'!'4RI ~ aft< f<'1{iOl<"l<1f<'1 ~ ~ ~ ~
&iT~)'T
15 ~,~
16 ~
17 ~(~~~)'"
1& ~
19 ~~
20 ~ -m'l:4'1 21 ~~
22 ~~
23 41<"lI""l'V'H
24 'I'lW!mR
25 ~ (~, '3Uft ~, ~, mom, ~ ~ 3fu: f<F6ftHlq~ .. n ~ ~) ..
26 ~
27 "4"ffi'1
28 ~,~
29 1NH 30 ~
31 ~
32 ~
33 tIf.:!<t"'1 34 ~
35 itsr (&i"""1I'!''iIU ~ 3fu: frH8<"l<1fc1 ~ ell ~ ~
&iT~)"
36 "3m'fr
'" ~ &iT "&i"""1J,!,4HI ~ ~ aft< frHi4<"l<1f<'l ~ ~ ~~>t'~~1
'"~&iT"~Fwt>t'~~ I
'1 ~ &iT "&>"""11,!,41(1 Fwt afR fiHiOl<"l<1f<'1 fiR;t <I> ~ ~&iT~"~~1
.. ~ Cfit "~, ~, f'Hict>t14<"l~, ~, itRq,
~,~,~, f,Hif-<i,(lqd, ~afu"~
~ >t' ~ "fIl{ 1
9 Kattunayakan
10 Koehu Velan
11 Konda Kapus
12 Kundareddis
13 Koraga
14 Kota (excluding Kanyakumari district and
Shenkottah taluk ofTirunelveli district)c
15 Kudiya, Melakudi
16 Kurichchan
17 Kurumbas (in the Nilgiris district)b
1& Kurumans
19 Maha Malasar
20 Malai Arayan
21 Malai Pandaram
22 Malai Vedan
23 Malakkuravan
24 Malasar
25 Malayali (in Dharmapuri, North Arcot,
26
27
28
29
30
31
32
33
34
35
Pudukottai, Salem, South Arcot and Tiruchirapalli
districts)d
Malayekandi
Mannan
Mudugar, Muduvan
Muthuvan
PaUeyan
Palliyan
Palliyar
Paniyan
Sholaga
Toda (excluding Kallyakumari district and
Shcnkottah taluk ofTirunelveIi districtt
36 Uraly
"Thc entry is to be read as "in Kanniyakumari district and Shencottah taluk of Tirunelveli district".
~he entry is to be read as "in the Nilgiri district".
eThe entry is to be read as "excluding
Kanniyakumari district and Shencottah taluk of Tirunelveli district".
d.yhe entry is to be read as "in Dharmapuri, Vellore, Tiruvannamalai, Pudukkottai, Salem, Namakkal, Villupurarn, Cuddalore, Tiruchirappalli, Karur and Perambalur districts".
358
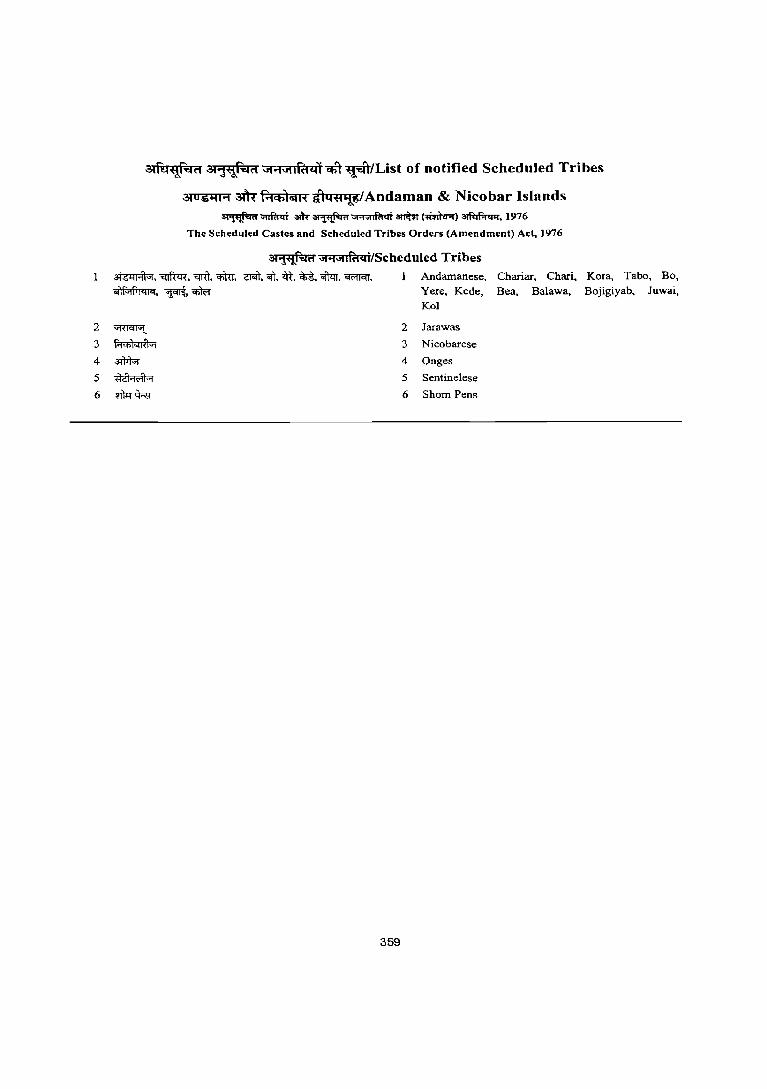
2
3
4
5
6
atfuW"'4ft 3I'jw~ft "'"'i"1lrn£ll <tT~/List of notified Scheduled Tribes
~O$"II"'i altt F ... <h)iilH d14f1'1t/Andaman & Nicobar Islands ~~ 31h-~"'''1'''lfiI''i amm~)~, 1976
The Scheduled Castes and Scheduled Tribes Orders (Amendment) Act, 1976
at1'''f''l('i ;;;j"1;;;jlia'd/Scheduled Tribes ~, ~, 'qffi, 'lim, ~,<it.~,~,~. <w!fCIT. 1 Andamanese. Chariar, Chari, Kora, Tabo, Bo, otlf->1PI<nq, ~,<t>Wr Yere. Kede, Bea, Balawa, Bojigiyab. Juwai,
Kol
~ 2 Jarawas
fo'l<t>I"lIU"1 3 Nicobarcse
~ 4 Onges
~ 5 Sentinelese
~~ 6 Shorn Pens
359

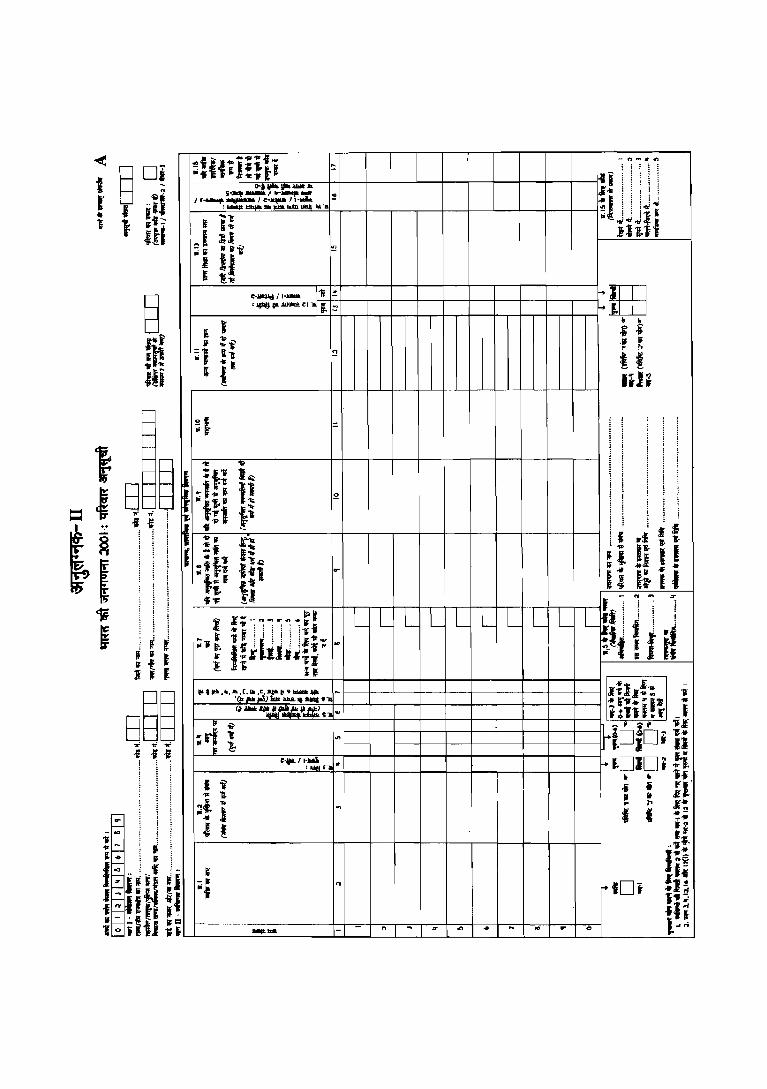
-< f' ... ", ... ., ... -n .... 'oI'lI
§ OJ ;.if~J~!tJ ~
ti II ijJ t ··i! s-..,. ...:!r.-~.: ::!! r I I [~:'::;-':':'O;;"s: ~= hI'K . 'iiI ~ ... Ii:: "'"t · iii f l I iu Ii h
::I ;gl .. Ii lIi'i ~
j Ij t '! ...
§ e·.IIOlIod/ I• ..... 11i :'!. ~IE '~~-tl·ij. ::!
I • • l i i
ft! J :'i .J If ,.. 1-q 1I"l !:! I I ... ~
iii I I nJi
i ~
-IJ n
I ';f
= 5 --
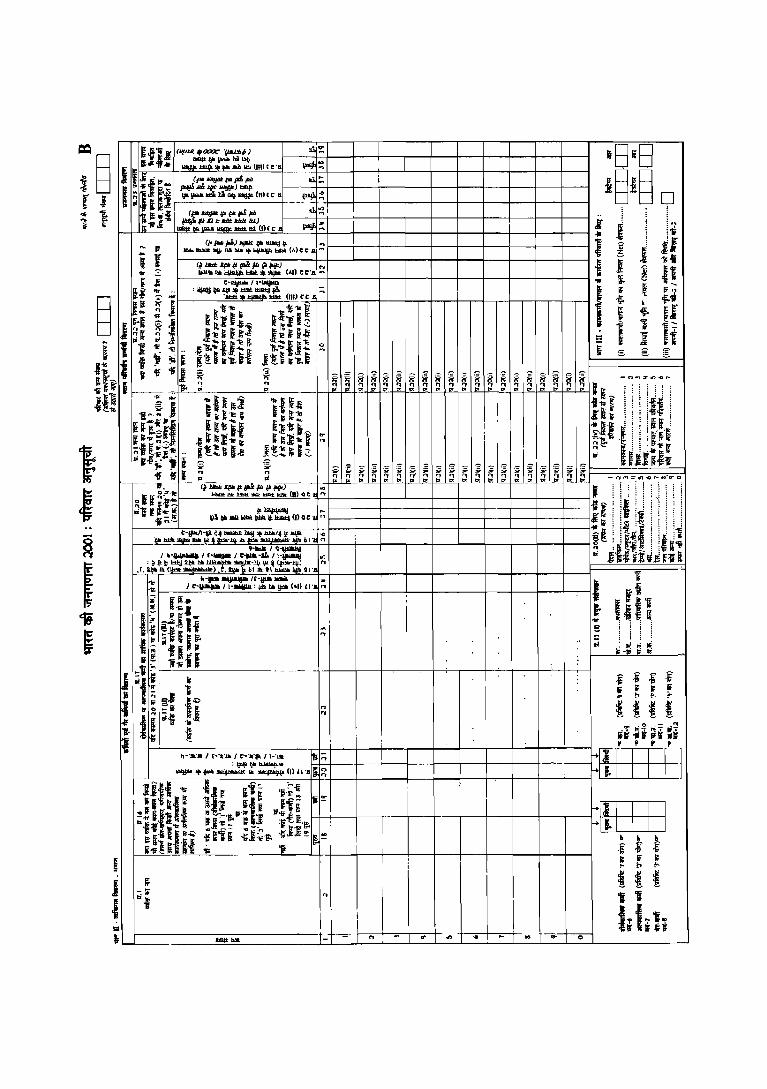
= !fl! (_.~'IJ'U!I'D) III!;
1§ _llItll»"lli,*
lI"!I::
II~f"" ~""~"'(III),e'a
(1!"""IJIl'~p.piI III:;; i jOI(Jl.JJI..-'F"W)_
r i 15~ i fi ... ""","""IlI,*"'!li!'-(II)'C 11 -~ ... ~
-10 1 ~;li ~OiI(JIIC",!*p.piI III ~I
1 ~"'J:_bbJJ.JU) ~!; _·""iJIa-.._1tl (,)'e.
iBid i§i§ 0
,
I~ I 1 .. ,
~ 'if j ii 3-
1 I 'lOt ~ I! ... w. (
t 10 IT,;, f. ~ <J,"
~ f. (I 1 1 It :: I
~ s :;; ~
I i
Ilil I-... iii! s
~ .. .. ~.! ~ : :
j j j j
~ ~ If If !> '" 1r
I « I I ItI'" 1If~"= .~
lit "Iii iiI ~Jf , , , , ~III I I I I
~Itl I I I ~ ~ ~ j i' i If If .. !> '" I I I .. .. I~ t~ Ii
! j ~
-:Ii '"
i 1St
I l I = ~ -"'" 1-1 - ... ~ ... '" ... - .. ... C>
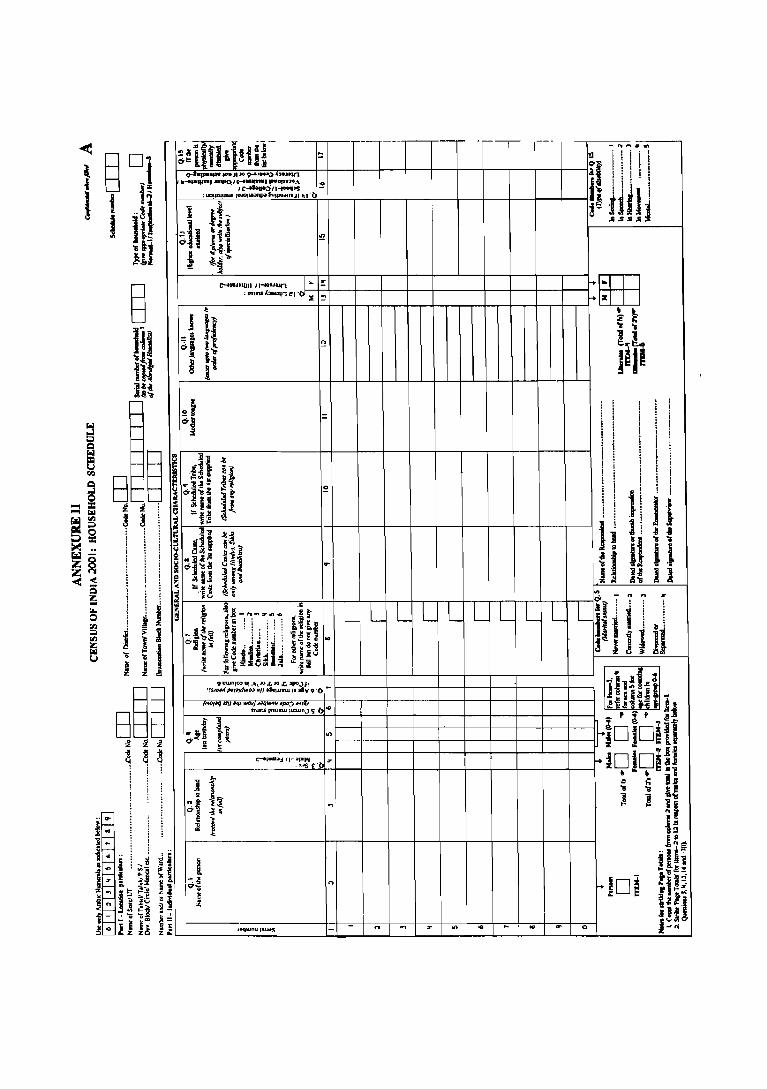
'j I o{ -:-5 ~! 0''0
~ 3 1 ;! ~
~~
1:-'.· .. 11111 II-.1· ... 00n .,J-I_~ t-!!+--+--1f--+--+-+--+---t--t--t------ir+ EITJ "",mA'"'"'l,el''i::E ~ r-~
....
J~\Unu ,-\US - .... ~ z '" .. ~ .. ... 0
. ~ :0 I: '8 '8 1 1
jill
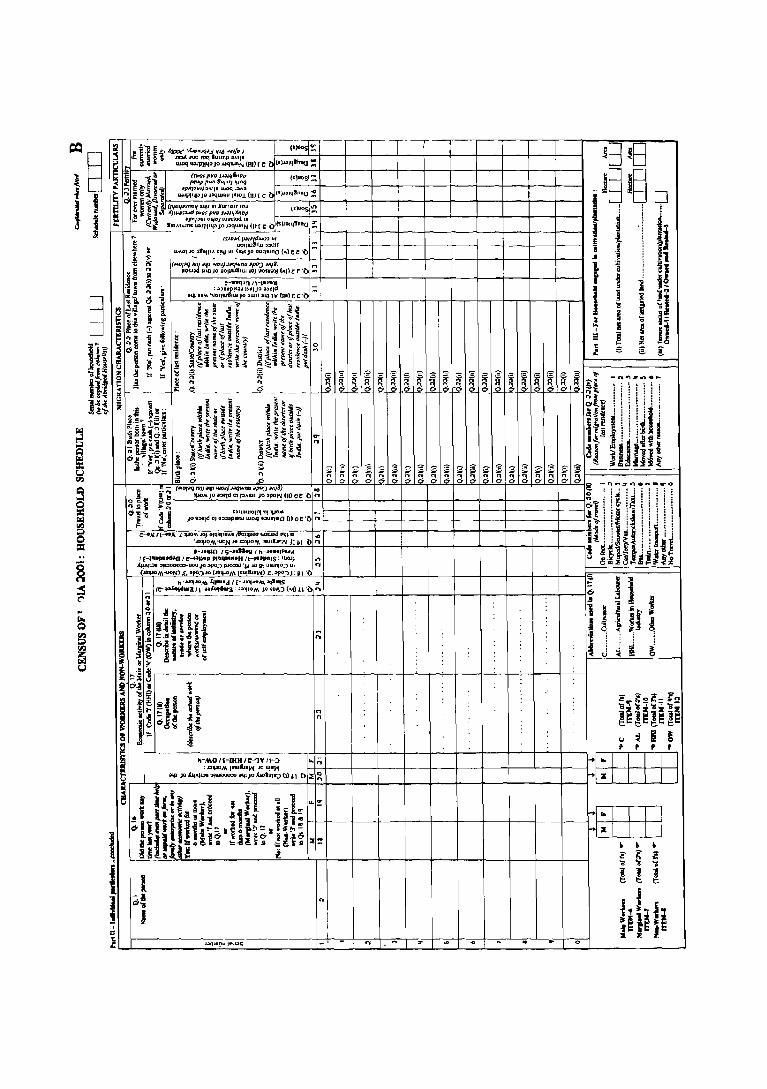
(MDl~ I~I ~I(I I4HUj .IMlklnu ~fX':J MIg) n UO!J~ 51'1IJO uo!auhwJOj ~M(AI)er'b ..,
C'-DlIIPIl/I-,·JlI1I : 3:)U~P!t~J lUI JO ;):)8Id ;:;
alb .. /DO 'UOI1~!UI JO ~wn ~"IllV (m) t c ·0
, '"

Related Documents