1 Pricing in the Japanese Bond Markets * ---Using asset swap spreads to identify relative-value of fixed-income--- Toyoharu Takahashi † Abstract Both in the theoretical and applied literature of finance the difference in yield-to-maturity between corporate bonds and government bonds has been used as a measure of the risk of the former over the latter. While this approach has sometimes provided interesting results, the usefulness of yield spreads is lessened by ignoring the term structure of interest rate. This paper presents an alternative measure, “Asset swap spread”, use asset swaps to convert fixed income cash flows to floaters which refer LIBOR plus spread as index coupon rate. This spreads show much broader characteristics as well as riskiness of each corporate and government bonds. Effectively by using the swap curve to create a set of equal and opposite fixed-rate cash flows, we create a synthetic floating rate note (FRN) with an index coupon rate. Moreover, this value is now being captured through the trading of bond asset swap packages. Based on these ideas, We provide an introduction to government and corporate bond asset swaps, explaining their basic mechanics The use of asset swap spreads in identifying and capturing relative value is discussed The market drivers of asset swaps spreads are examined 12 July 2011 for the presentation of ACE2011 * Earlier version of this paper was presented at the annual meeting of the Japan Society of Monetary Economics (on 15 May 2010 at Chuo University, Tokyo, Japan ) and at the 73th annual meeting of the Society of Economic Studies of Securities (on 6 June 2010 at Meiji University, Tokyo, Japan). The author is very grateful to Yasuhiro Yonezawa, and Fumio Yokoyama for their helpful comments. Of course, remaining errors are the author ’ s responsibility. This is a part of research which was supported by a Grant-in-Aid for Scientific Research (19530287) from Japan Society for the Promotion of Science. † Professor of Finance, Faculty of Commerce, Chuo University, Tokyo 192-0393, Japan and Visiting fellow, Australia-Japan Research Centre, Crawford School of Economics and Government, the Australian National University, ACT 0200, Australia. Tel: +61(0)2 6125 1840, E-mail: [email protected]

Welcome message from author
This document is posted to help you gain knowledge. Please leave a comment to let me know what you think about it! Share it to your friends and learn new things together.
Transcript
1
Pricing in the Japanese Bond Markets*
---Using asset swap spreads to identify relative-value of fixed-income---
Toyoharu Takahashi†
Abstract
Both in the theoretical and applied literature of finance the difference in
yield-to-maturity between corporate bonds and government bonds has been used as a
measure of the risk of the former over the latter. While this approach has sometimes
provided interesting results, the usefulness of yield spreads is lessened by ignoring the
term structure of interest rate.
This paper presents an alternative measure, “Asset swap spread”, use asset swaps
to convert fixed income cash flows to floaters which refer LIBOR plus spread as index
coupon rate. This spreads show much broader characteristics as well as riskiness of
each corporate and government bonds. Effectively by using the swap curve to create a
set of equal and opposite fixed-rate cash flows, we create a synthetic floating rate note
(FRN) with an index coupon rate. Moreover, this value is now being captured through
the trading of bond asset swap packages.
Based on these ideas,
We provide an introduction to government and corporate bond asset swaps,
explaining their basic mechanics
The use of asset swap spreads in identifying and capturing relative value is
discussed
The market drivers of asset swaps spreads are examined
12 July 2011 for the presentation of ACE2011
* Earlier version of this paper was presented at the annual meeting of the Japan Society
of Monetary Economics (on 15 May 2010 at Chuo University, Tokyo, Japan ) and at the
73th annual meeting of the Society of Economic Studies of Securities (on 6 June 2010 at
Meiji University, Tokyo, Japan). The author is very grateful to Yasuhiro Yonezawa, and
Fumio Yokoyama for their helpful comments. Of course, remaining errors are the
author’s responsibility. This is a part of research which was supported by a Grant-in-Aid
for Scientific Research (19530287) from Japan Society for the Promotion of Science. † Professor of Finance, Faculty of Commerce, Chuo University, Tokyo 192-0393, Japan
and Visiting fellow, Australia-Japan Research Centre, Crawford School of Economics
and Government, the Australian National University, ACT 0200, Australia. Tel: +61(0)2
6125 1840, E-mail: [email protected]

2
1 Introduction
In recent years Japanese bond markets, as a whole, expanding in its volume of
transaction, and its variety. The Japanese Government Bonds (JGBs) are issued in
various maturities, just from two types of long-term bonds;10YRs and 20YRs in
maturity, to more long and mid term maturities. Also corporate straight bonds began to
have their varieties. In this paper, we investigate how the Japanese bonds are priced in
the relative- value view, from the estimation of “asset swap spread”.
Asset swaps are ideal for expressing relative-value views. The matching of
fixed-rate cash flows limits exposure to the overall level of interest rates and
incorporates coupon effects. Furthermore, both positions will roll down the curve at the
same rate, limiting exposure to curve shape. At any point the NPV of the asset swap
package will be determined by cost of unwinding the swap and selling the bond - a value
driven by the yield spread between bonds and swaps and termed the asset swap spread
of the bond.
For the reason above, practitioners commonly use the asset swap spreads for the
analysis of bond markets, there are few articles to investigate the pricing of bond
markets using the asset swap spreads. Tonge, D. (2001) estimated asset swap spreads
and main driver for them, and tried to apply for CEEMEA Fixed Income Strategy. For
the Japanese markets1, Ieda and Ohba (1998) estimated the asset swap spreads in the
Japanese straight corporate bond markets from May 1997 to Mar 1998, and investigate
the factors which mostly affect the spreads. They found the years to maturity, coupon
rates, and the credit ratings are the major determinants to the spreads. Takahashi
(1999) investigated the asset swap spreads for the JGB market.
Swap spreads, showing the quoted spreads of the yields on government bonds,
mainly T-notes, and the interest rate swaps are widely investigated. Grinblatt (2001)
attributes the swap spread to the liquidity difference between Treasury bonds and
Eurodollar borrowings. Longstaff and Schwartz (1995), Duffie and Huang (1996),
Lekkos and Milas (2001), Blanco, et al. (2005), In, Brown and Fang (2003), and Afonso
and Strauch (2007) model swap spreads as a risk premium to compensate swap
counterparties for various risks. Their results were supported by the empirical tests.
However, Lekkos and Milas (2001) have noted that the impact from changes in the term
structure on swap spreads is not uniform across swap maturities. Huang and Chen
(2007) find that liquidity premium is the only contributor to the 2-year swap spread
variance in monetary tightening cycles, and the impact of default risk varies across both
1 Asset swap spreads in Japanese markets are mostly called “LIBOR spreads”. Ieda and
Ohba (1998) and Takahashi(1999) are the examples.
3
monetary cycles and swap maturities. They have analyzed whether the relative
importance of these determinants and consequently the swap spreads generating
process vary according to the different monetary policy regimes in the USA.
For the Japanese market so far except for a few recent studies by Eom, et al. (2000),
Eom, et al. (2002), Fehle(2003) and Huang et al. (2008). These authors examined the
determinants of the Japanese swap spreads and provided empirical evidence that some
risk factors such as default risk of counterparty, interest rate volatility, liquidity risk of
LIBOR and slope of term structure affects the swap spreads depending on the length to
maturity of the swap contract and the sample periods they analyze.The Japanese
economy has experienced two major financial crises of the “Lost Decade of Japan”
originated by the stock prices bubble collapse from 1990 to 2001 and the global financial
crisis initiated by subprime loan problem from 2007, in the last two decades. The
monetary policy and market condition in Japan are very different among the regimes of
the pre-zero-interest-rate period, the zero-interest-rate period and the
post-zero-interest-rate period. However, neither Eom et al. (2000) nor Fehle (2003)
investigated the effects of regime changes on the determinants of swap spreads. Only
Huang et al. (2008) explicitly analyzed the effects of regime changes by applying a
smooth transition vector autoregressive model. Moreover their study only used the
sample data up to 2005 and did not deal with the sample period of global financial crisis.
Shimada et al (2010) investigated three risk factors which have been taken as
determinants of swap spreads on the Japanese markets and compare the relative
importance of factors between the three different regimes of Lost Decade of Japan,
zero-interest rate period and global financial crisis classified by the Japanese economic
condition. They apply a standard static regression model with the GARCH error terms
as well as an alternative regression model which allows the coefficients possibly change
along with time.
This paper is broken into following sections. In section2 we take a brief look at the
Japanese secondary bond markets from its transaction data. We also investigate the
interest rate swap market in Japan. Section3 reviews the mechanics of a bond asset
swap, and studies the use of asset swaps in identifying and capturing relative value.
Section5 interpreting the asset swap spread (2004--2009), and analyzes factors that
influence asset swap spreads. Finally, section5 summarizes our conclusions.
2 Japanese bond markets
Just take a brief look at Japanese bond OTC markets, from the “Reference
Statistical Prices [Yields] for OTC Bond Transactions” published by the Japan
4
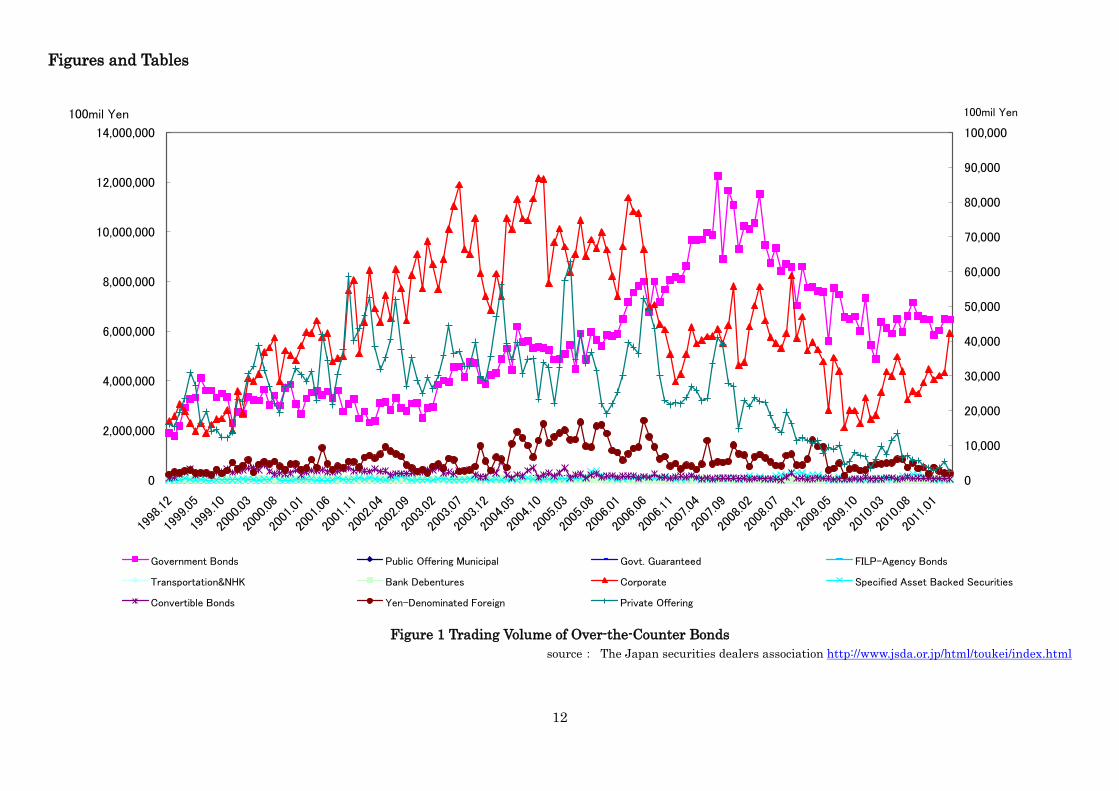
Securities Dealers Association for the bond trading data2. Figure 1 shows the variety of
fixed income traded in the OTC markets, from Dec 1998 to Nov. 2005. Every figures are
denominated in 100milion yen, left axis for JGB and right axis for other fixed-incomes.
<Figure 1>
This figure shows the trading volume is expanding in this period, showing a little
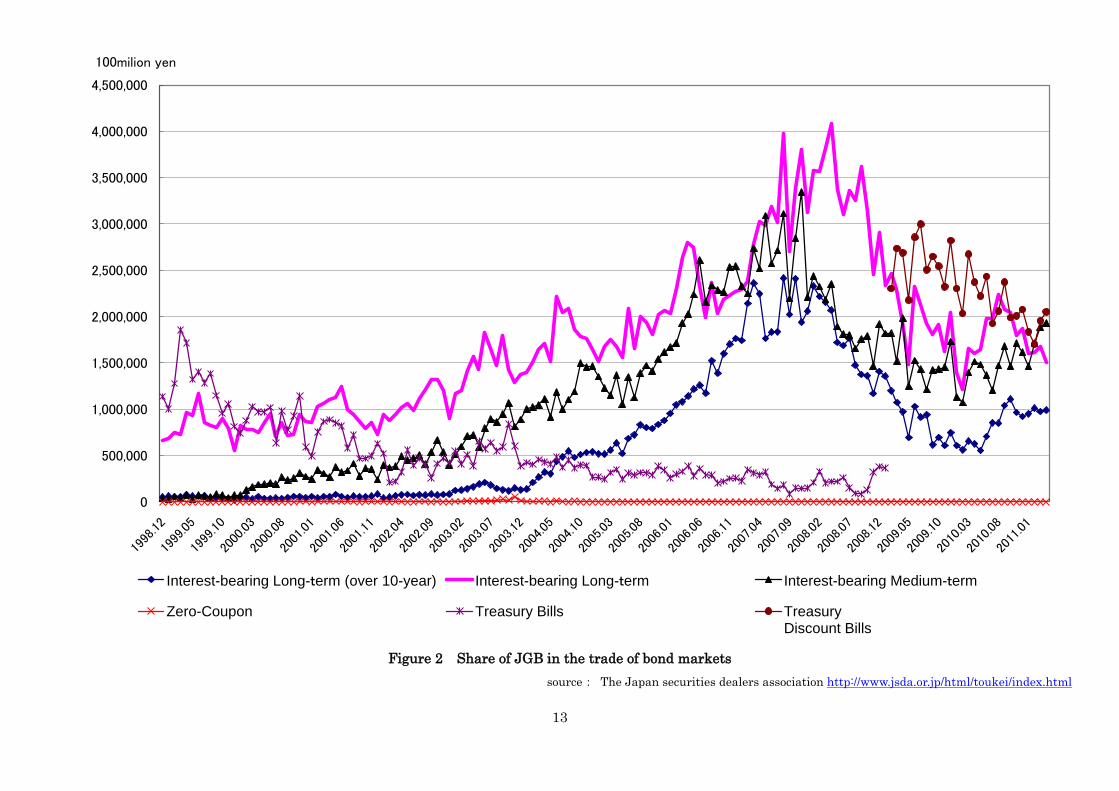
cyclical movement. Figure 2 shows the components of JGB sales. This figure shows
long-term JGB has the biggest trade volume, and sales in mid-term JGB is growing
dramatically, and also short-term JGB is also growing rapidly.
<Figure 2>
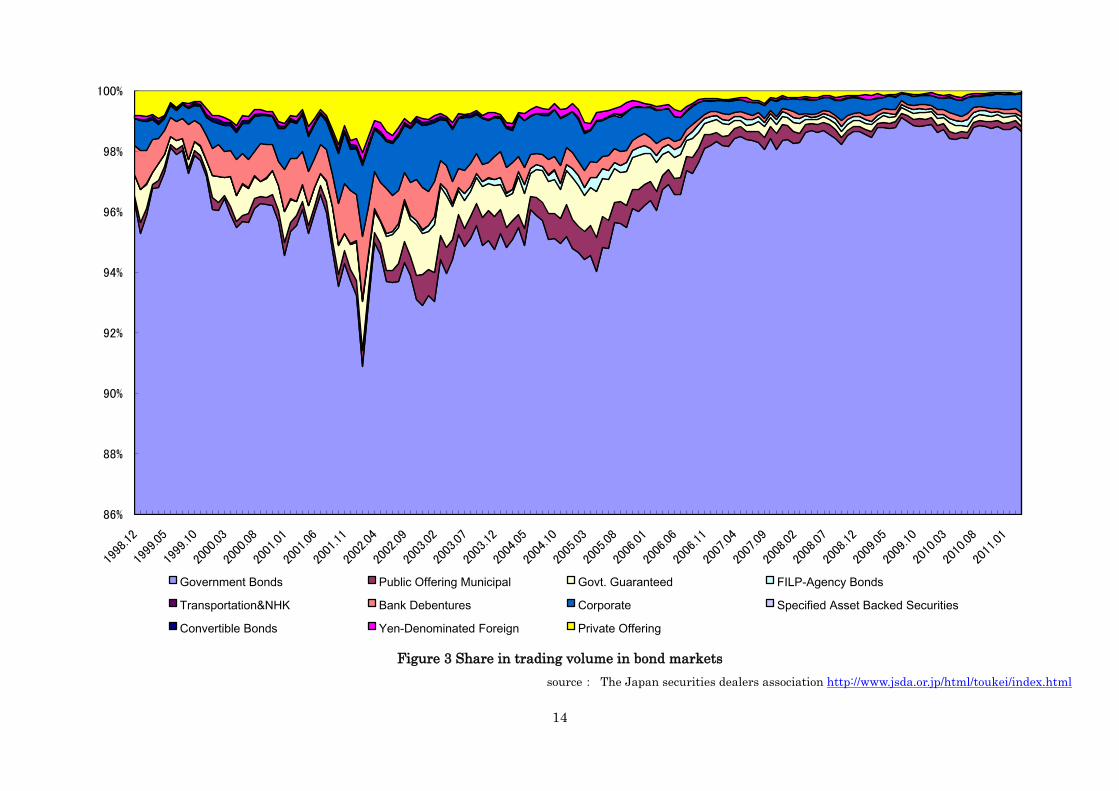
Nest, we can see the annual trading share 1 year from Dec. 2004 in Figure 3. This
chart shows that the share of JGB in fixed income trading is the biggest and other
securities are traded under 10%. Trading in corporate bonds is growing, but still the
trades are mostly concentrated to JGB.
<Figure 3>
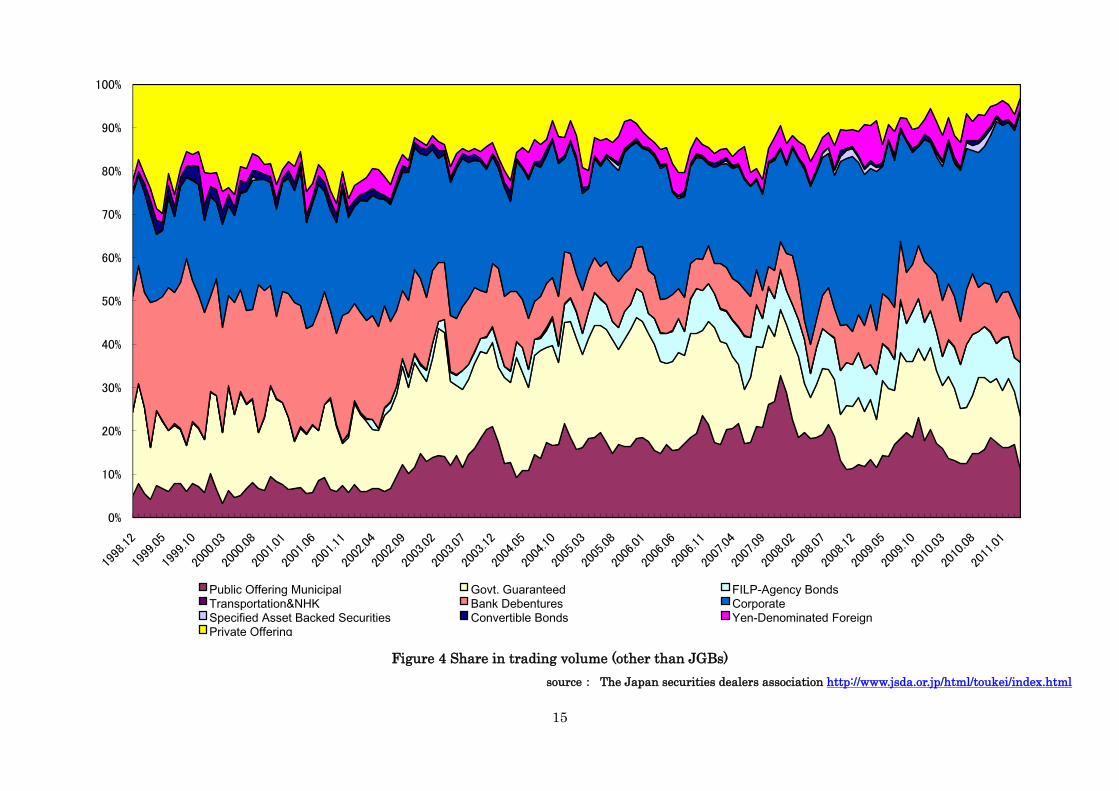
We also show the other public bonds in Figure 4. This is also supporting that the
share of JGB is extraordinary big, and in the JGB trading, long-term bonds have the
largest share.
<Figure 4>
The market for interest rate derivatives, in general, and for swaps, in particular,
has grown exponentially in the last decade. Recent estimates indicate that in the
notional outstanding volume of transactions of privately negotiated (over-the-counter)
derivatives at the end of December 2007, the total notional amount of interest rate
swaps outstanding amounted to $310trillion from that of $29 trillion at the end of 19973.
Among the major players, Japanese yen interest rate swap plays a pivotal role in
the global interest rate derivatives market. It amounts to an average of 17% of the total
2 From the website of Japan Securities Dealers Association
http://www.jsda.or.jp/html/toukei/index.html
3 At that period, All counterparties (net)Notional amounts outstanding is Euro 119,
US dollar 96, Japanese yen, 49, Pound sterling 23 (in millions of US dollars). And
interest rate swap market share by currency is Euro 40%, USD 34%, Yen 17% and
Pound sterling 8%. Source: BIS(2009) OTC derivatives market activity in the second
half of 2008
5
outstanding interest rate derivatives worldwide. Given the importance of the yen in
international trade and finance, it is not surprising that yen interest rate swaps form a
substantial proportion of this volume, next to those denominated in US dollars. The
expansion in the Japanese yen interest rate swap speaks for the importance of
understanding the yen swap pricing mechanism.
Interest rate swaps are sometimes quoted at a margin or spread above the
government bond nearest in maturity to the final date of the swap. This is because the
government bonds are often used as a partial hedge for mismatched swap portfolios or
books. But in JPY swaps, we have the different quotation system. Interest rate swaps in
Japan are not quoted by spread, but are quoted by absolute level. This is partly because
of the historical background of JPY interest rate swaps.
In mid 1980's interest rate swap in Japan has launched. Many Japanese banks
started to run Swap desks, to hedge their swap position. In 1986, a US bank started
market make of the interest rate swaps in the Japanese market. At that time, JGB was
thought to be "kinky" market. Transactions are concentrated on "benchmark
issue"(shihyo meigara), arbitrages were insufficient. For these reasons, the Japanese
interest rate swap rates, not the JGB rate, plays as a reference rate for mid to long term
transaction, quotation was not based spreads over JGB yields. The situation began to
change in late 1990's. The financial deregulation accelerates, and the Ministry of Finance came to
issue JGB of various varieties in maturity. Trades dispersed, and the arbitrage became active and the
role of the “benchmark issue” was over by the end of March 1999.
3 Relative-value analysis using asset swaps
3.1 Asset swap spreads
The essence of relative-value analysis is replication of cash flows at cheaper cost -
usually by taking "basis risk". This contrasts with yield curve analysis that is centered
on the valuation of mismatched cash flows. Asset swaps are ideal for relative-value
analysis of government bonds because the process of constructing a synthetic FRN
creates a level playing field.
For government bonds there are no variations in credit risk
By replicating bond's fixed cash flows with swaps, we hedge mismatches in
coupon
interest-rate duration (directional risk)
curve exposure
The asset swap package can be transacted
The price of the complete package and the notional are fixed at par. Typically there
will be an up-front exchange of cash flows to compensate for the non-par price of the
6
bond. Par asset swap packages are transacted more commonly than any other asset
swap. In this case, synthetic FRN cash flow will be that of <Figure 5>.
<Figure 5>
In Figure 5, 360
1001,,
,,
jiji
ijiji
ttLl
This synthetic FRN will contain the package of underlying bond and asset swap,
which pays index rate (LIBOR plus spread) and receive the equivalent amount of cash
flow to the coupon payment. This will be realized by the asset swap trade shown in
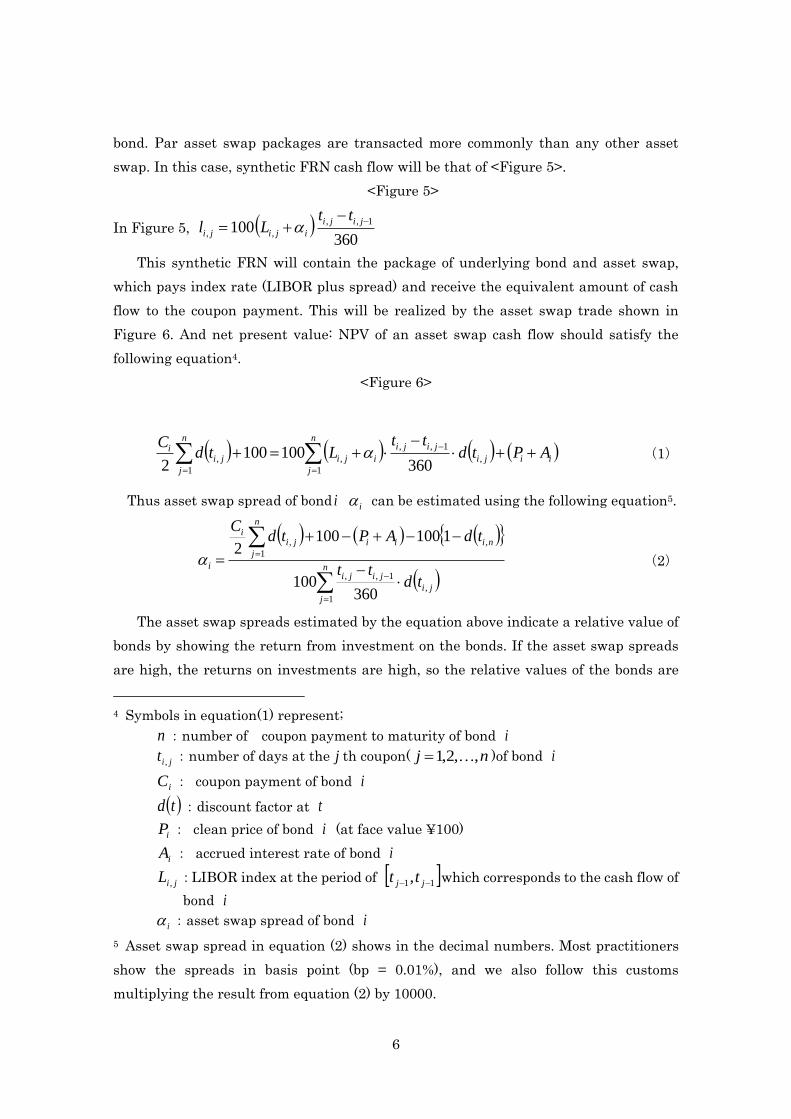
Figure 6. And net present value: NPV of an asset swap cash flow should satisfy the
following equation4.
<Figure 6>
ii
n
j
ji
jiji
iji
n
j
jii APtd
ttLtd
C
1
,
1,,
,
1
,360
1001002
(1)
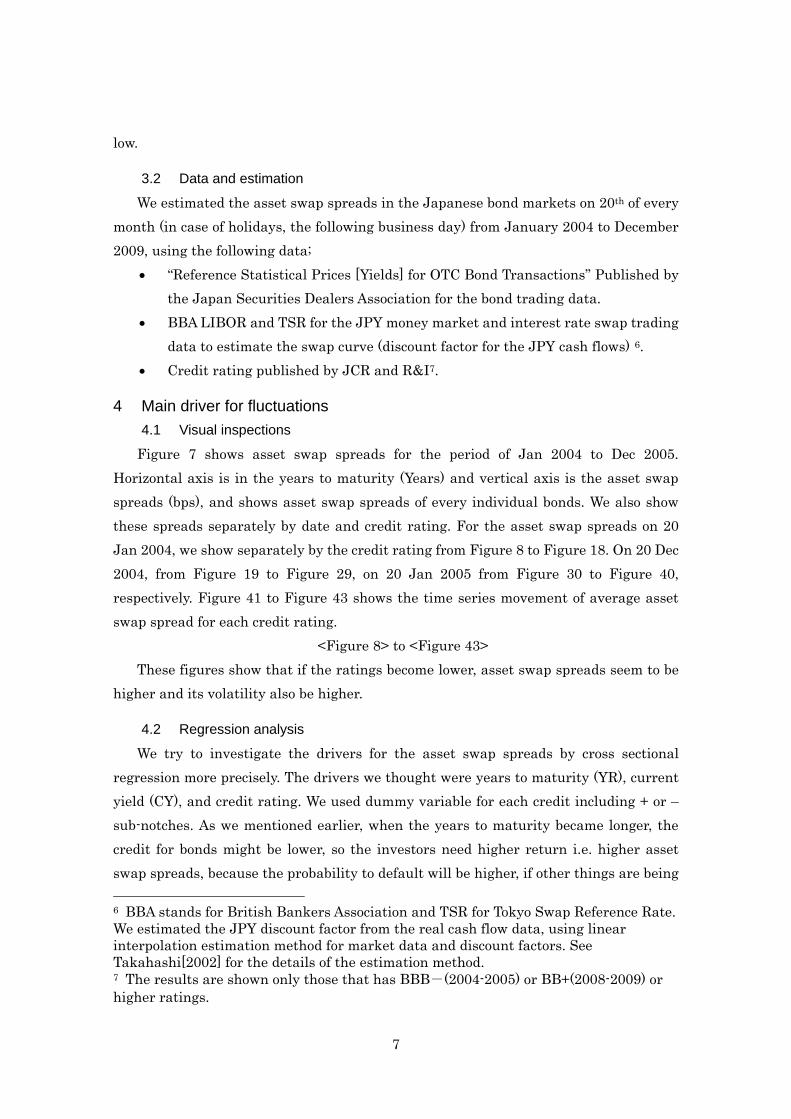
Thus asset swap spread of bond i i can be estimated using the following equation5.
n
j
ji
jiji
niii
n
j
jii
i
tdtt
tdAPtdC
1
,
1,,
,
1
,
360100
11001002
(2)
The asset swap spreads estimated by the equation above indicate a relative value of
bonds by showing the return from investment on the bonds. If the asset swap spreads
are high, the returns on investments are high, so the relative values of the bonds are
4 Symbols in equation(1) represent;
n :number of coupon payment to maturity of bond i
jit , :number of days at the j th coupon( nj ,,2,1 )of bond i
iC : coupon payment of bond i
td :discount factor at t
iP : clean price of bond i (at face value ¥100)
iA : accrued interest rate of bond i
jiL , :LIBOR index at the period of 11, jj tt which corresponds to the cash flow of
bond i
i :asset swap spread of bond i
5 Asset swap spread in equation (2) shows in the decimal numbers. Most practitioners
show the spreads in basis point (bp = 0.01%), and we also follow this customs
multiplying the result from equation (2) by 10000.
7
low.
3.2 Data and estimation
We estimated the asset swap spreads in the Japanese bond markets on 20th of every
month (in case of holidays, the following business day) from January 2004 to December
2009, using the following data;
“Reference Statistical Prices [Yields] for OTC Bond Transactions” Published by
the Japan Securities Dealers Association for the bond trading data.
BBA LIBOR and TSR for the JPY money market and interest rate swap trading
data to estimate the swap curve (discount factor for the JPY cash flows) 6.
Credit rating published by JCR and R&I7.
4 Main driver for fluctuations
4.1 Visual inspections
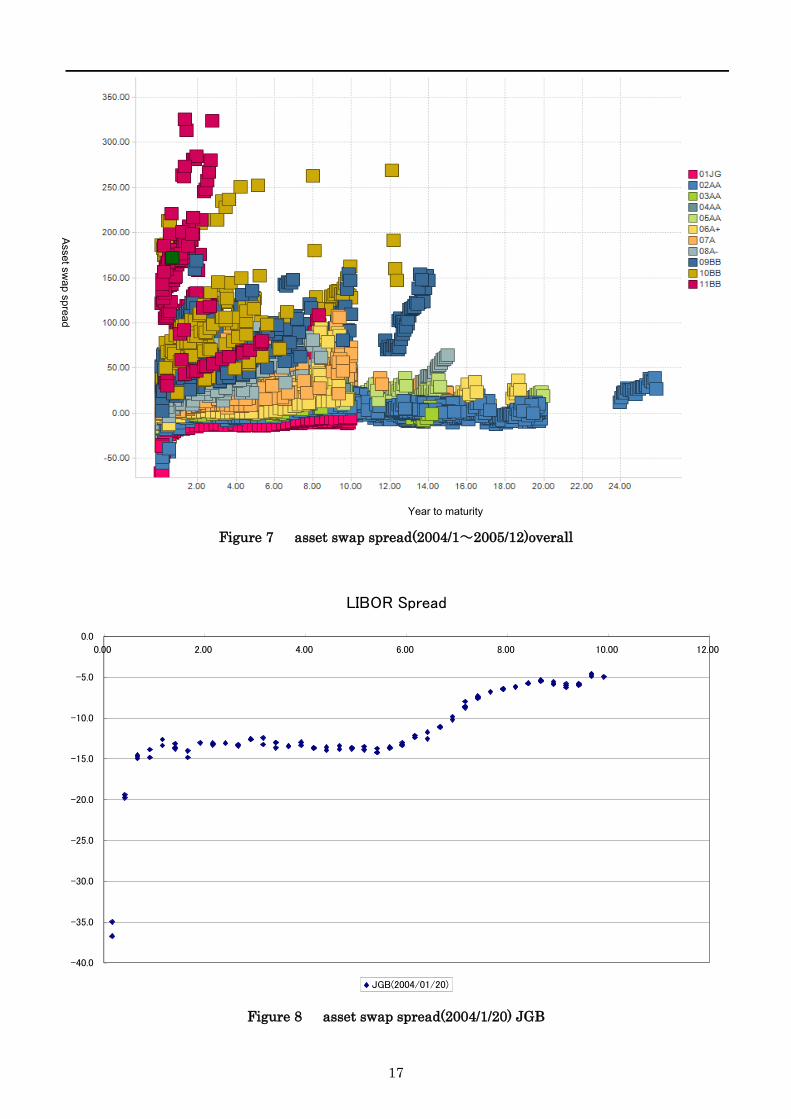
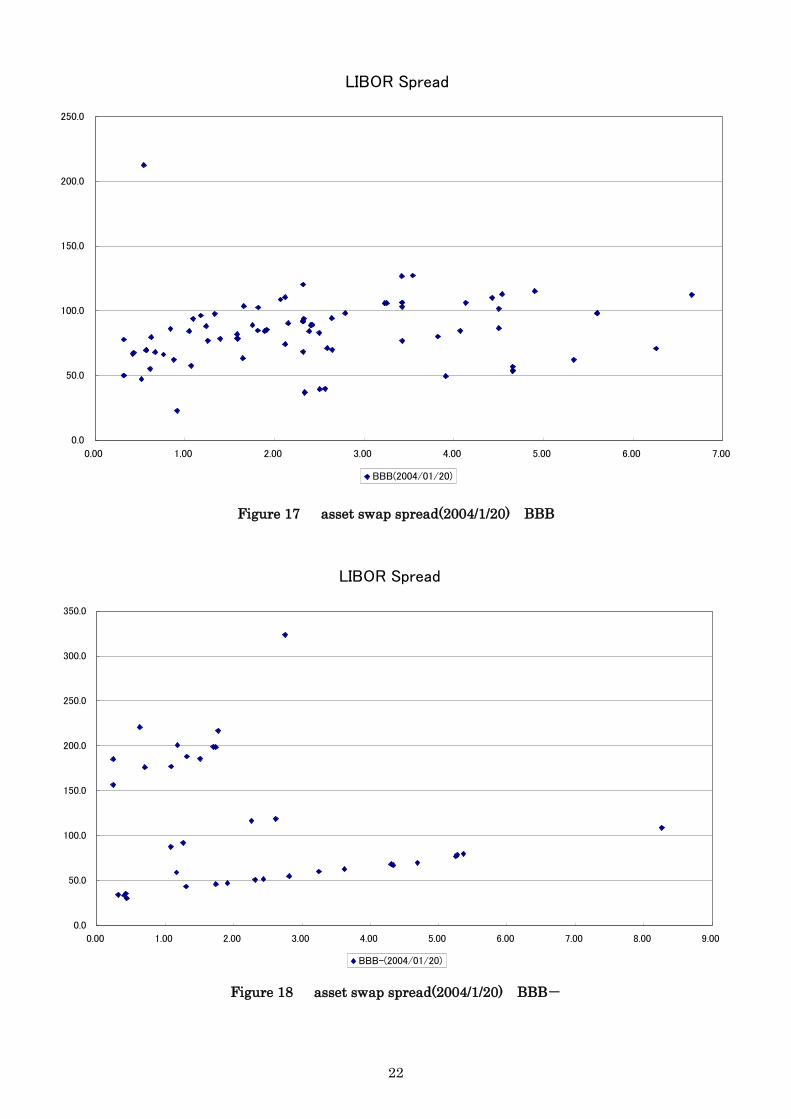
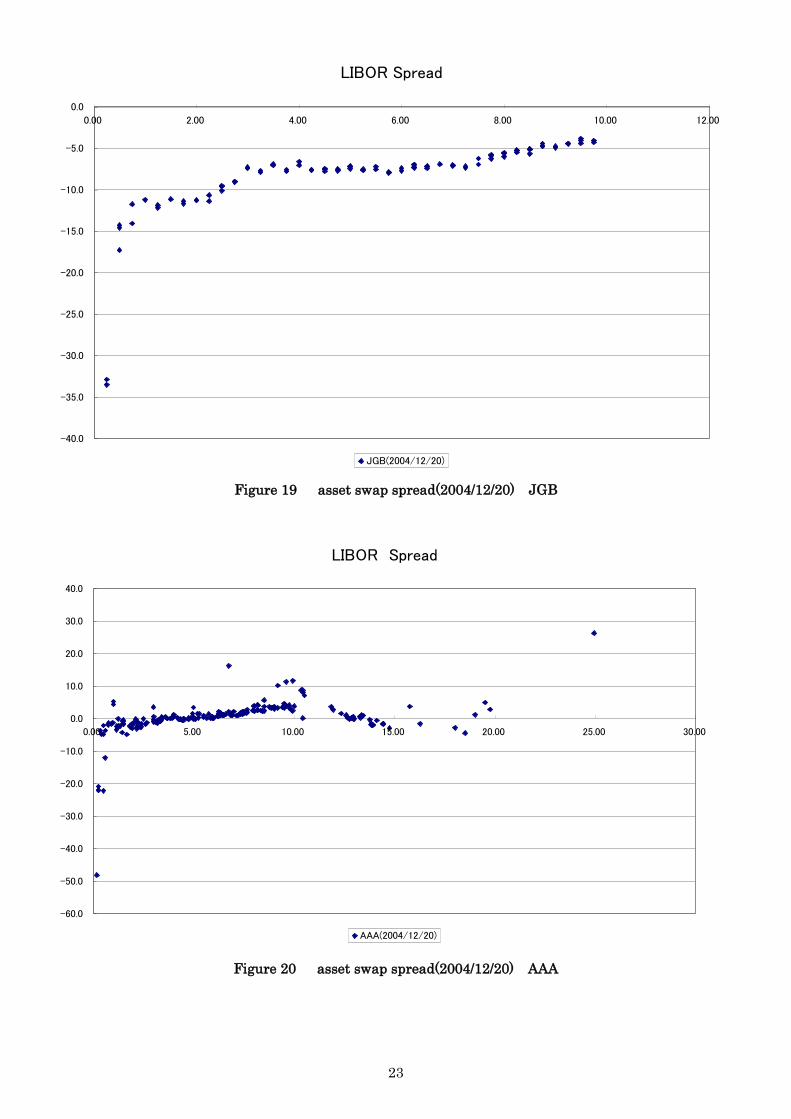
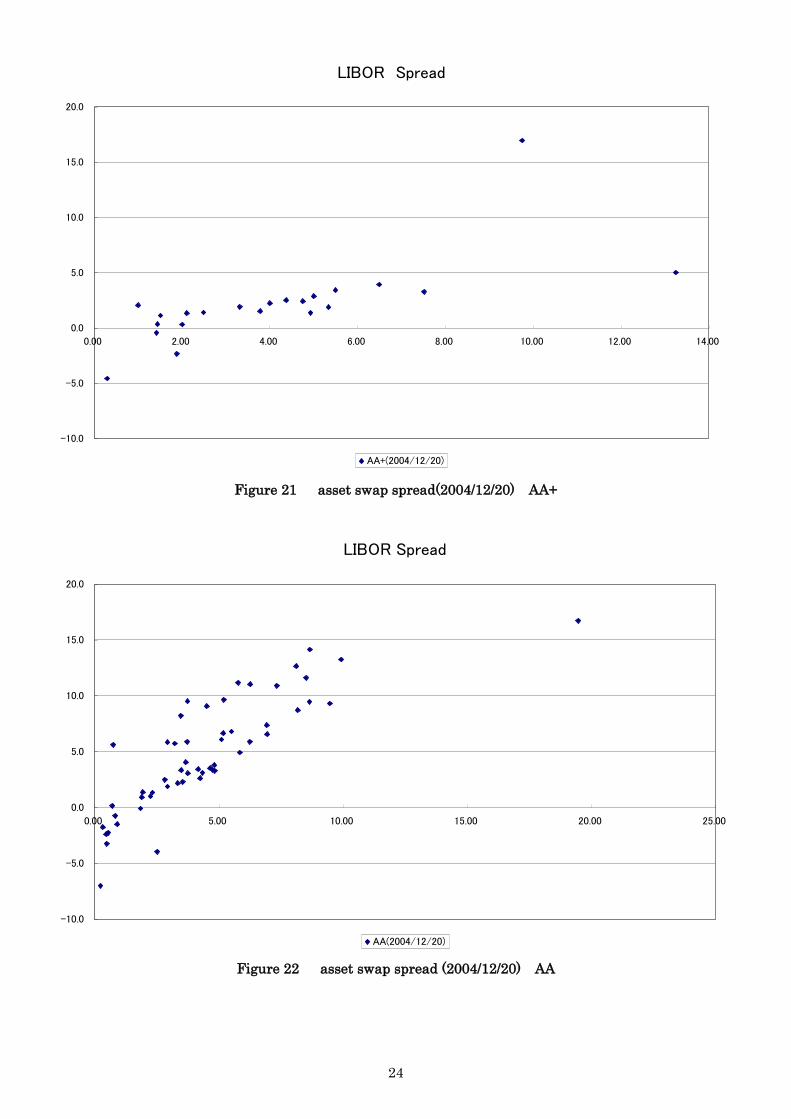
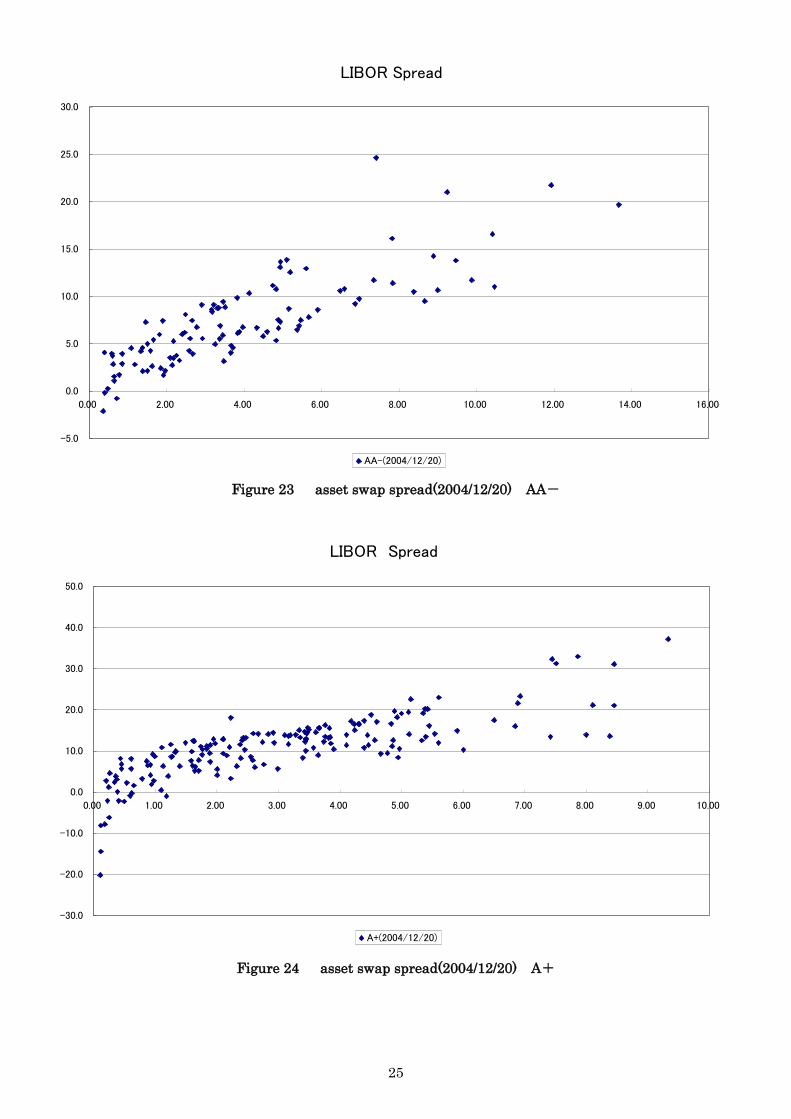
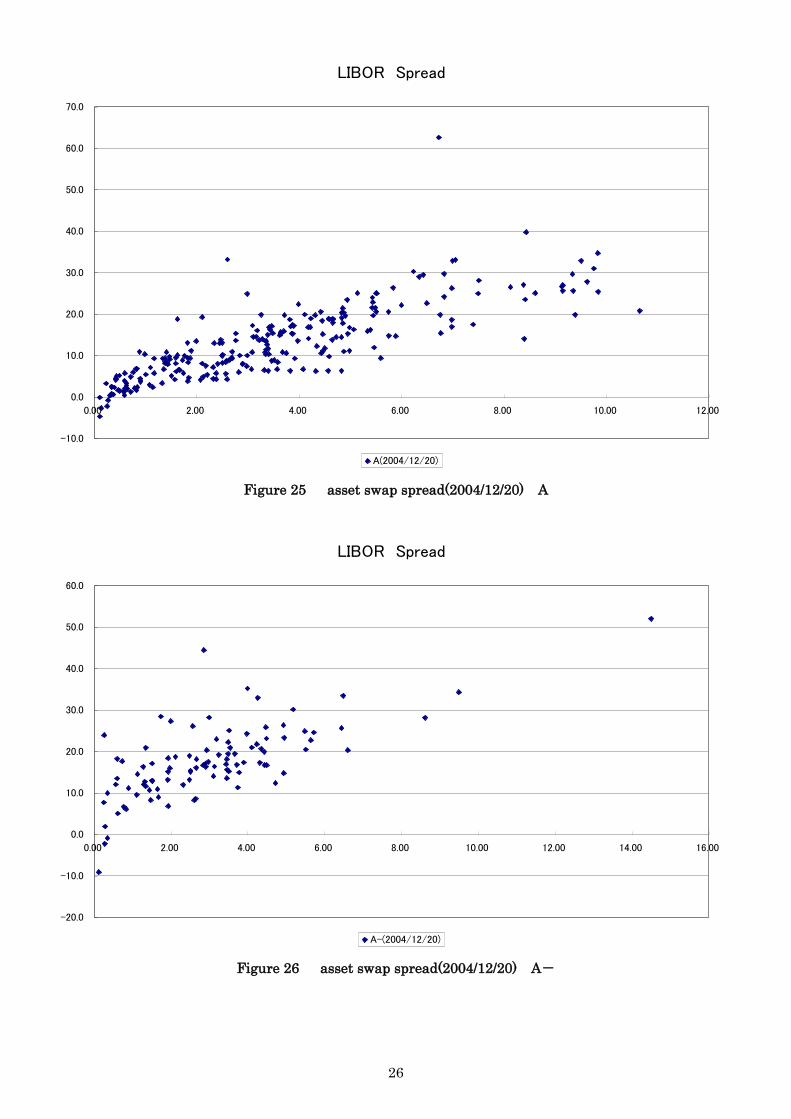
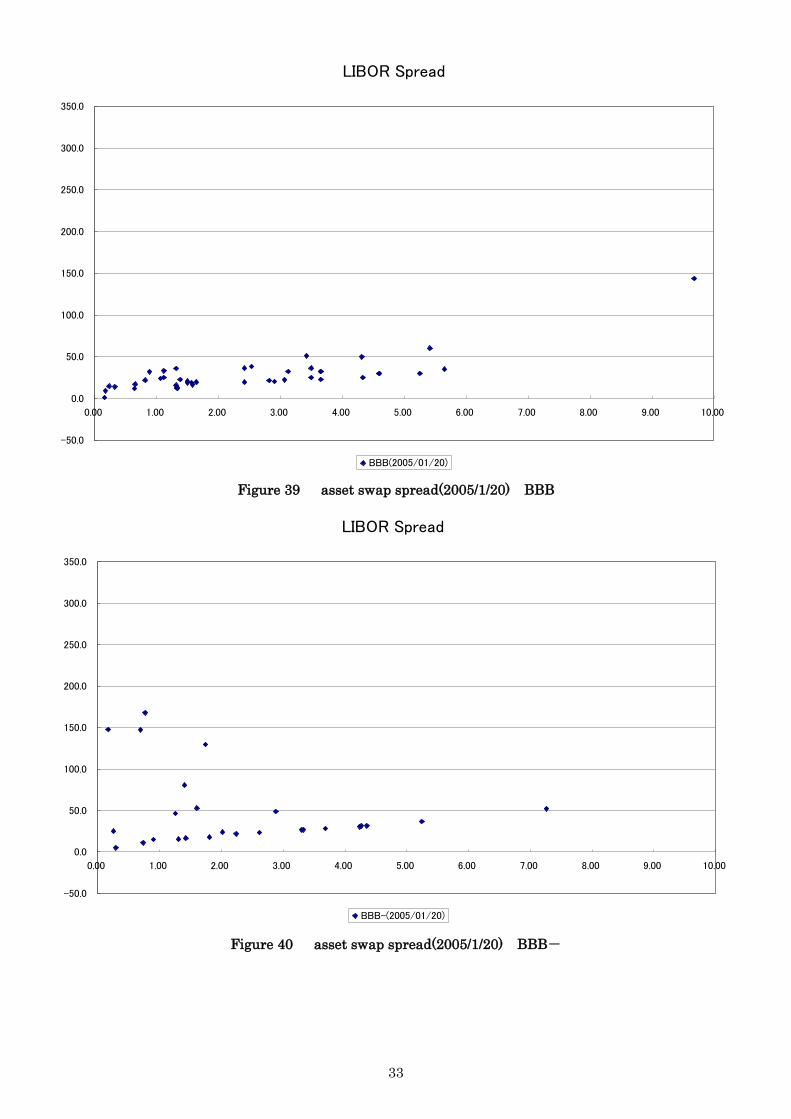
Figure 7 shows asset swap spreads for the period of Jan 2004 to Dec 2005.
Horizontal axis is in the years to maturity (Years) and vertical axis is the asset swap
spreads (bps), and shows asset swap spreads of every individual bonds. We also show
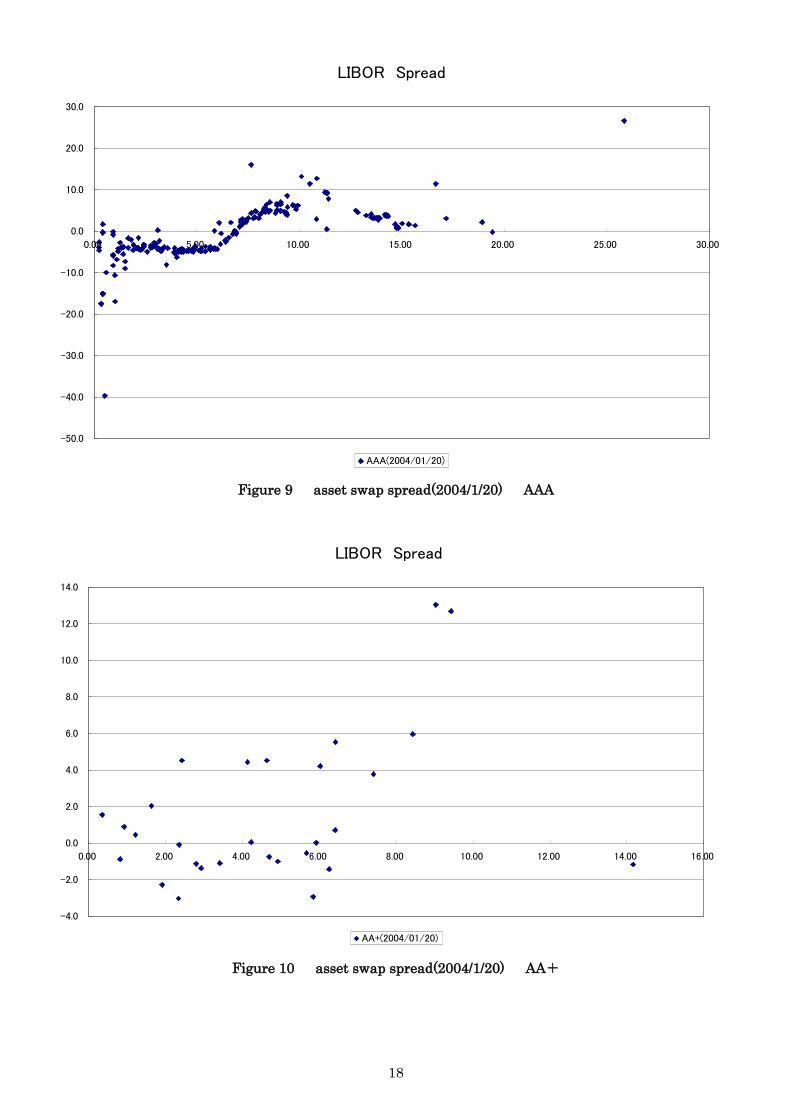
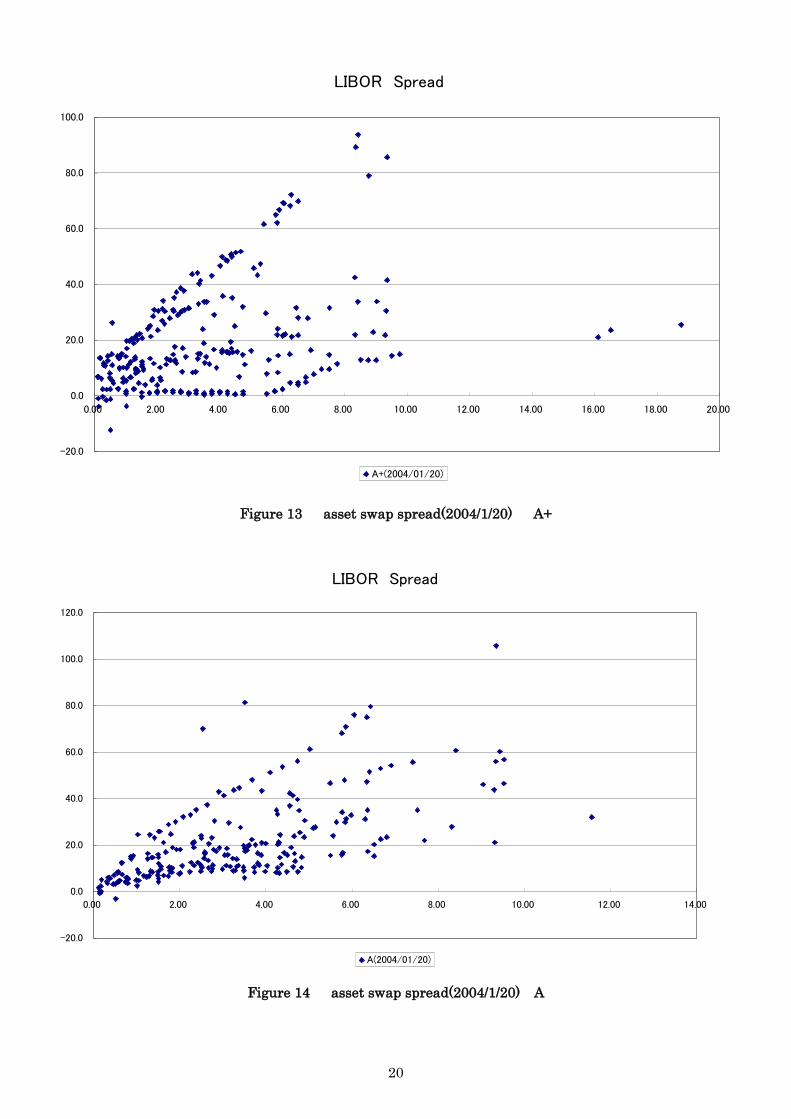
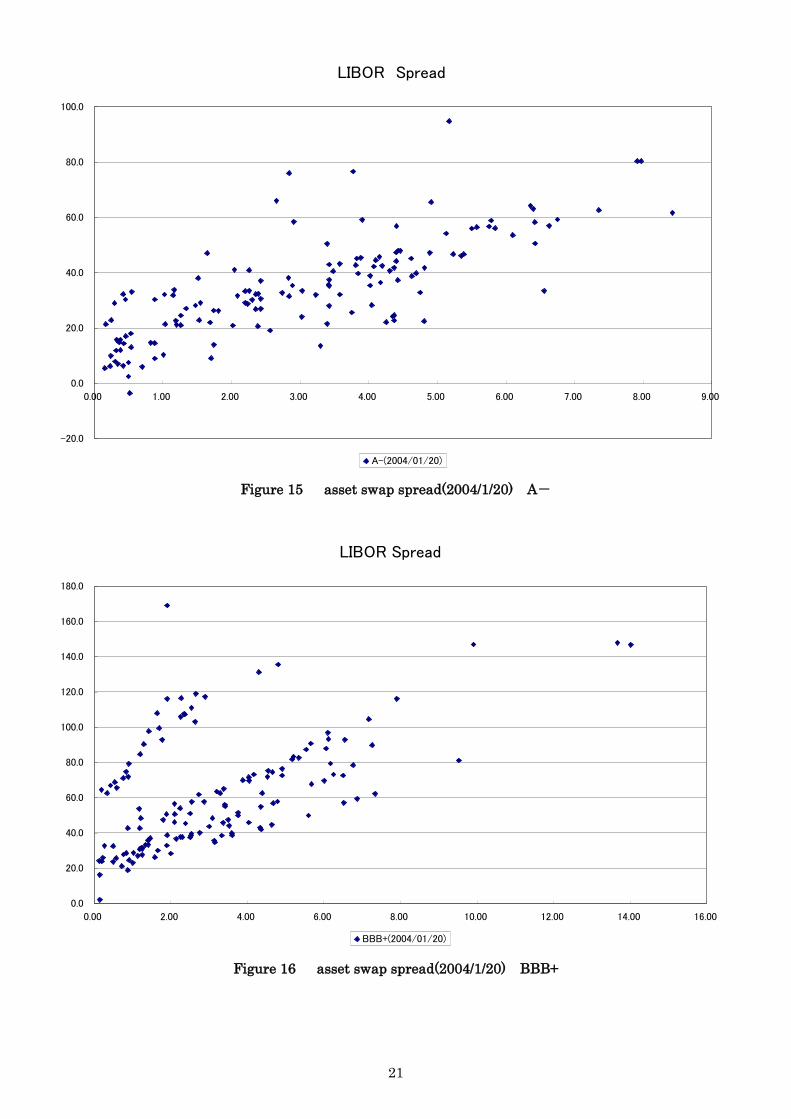
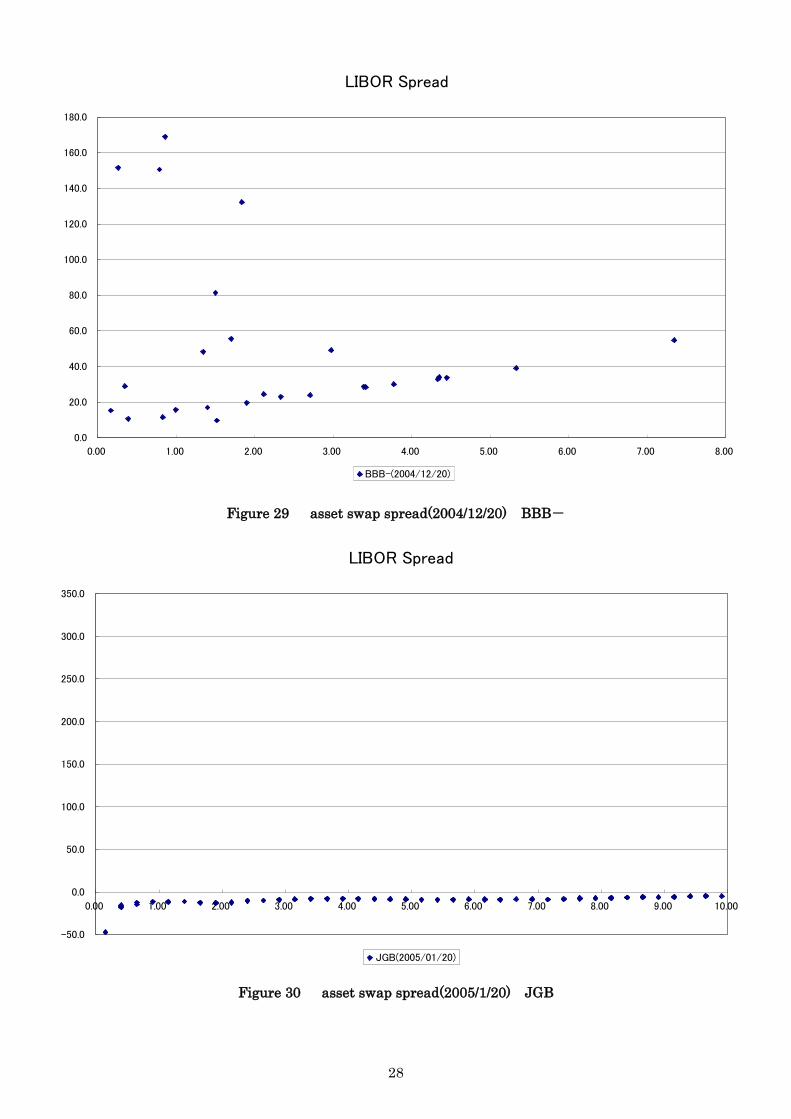
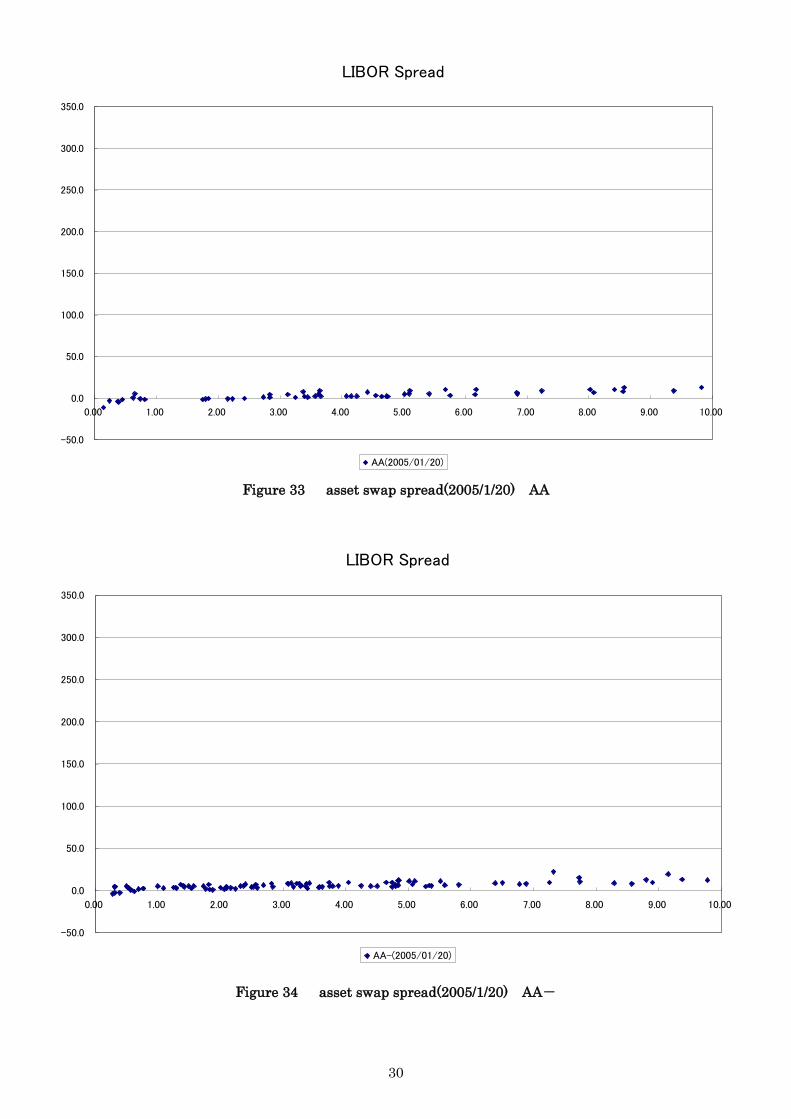
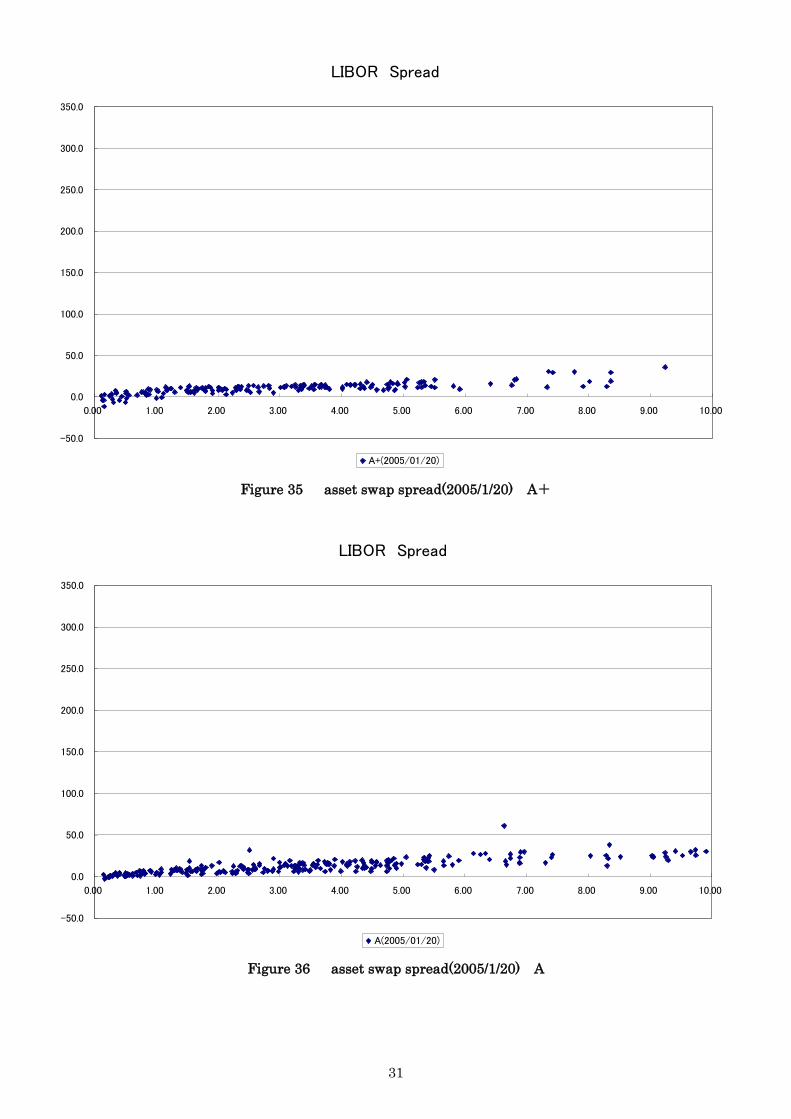
these spreads separately by date and credit rating. For the asset swap spreads on 20
Jan 2004, we show separately by the credit rating from Figure 8 to Figure 18. On 20 Dec
2004, from Figure 19 to Figure 29, on 20 Jan 2005 from Figure 30 to Figure 40,
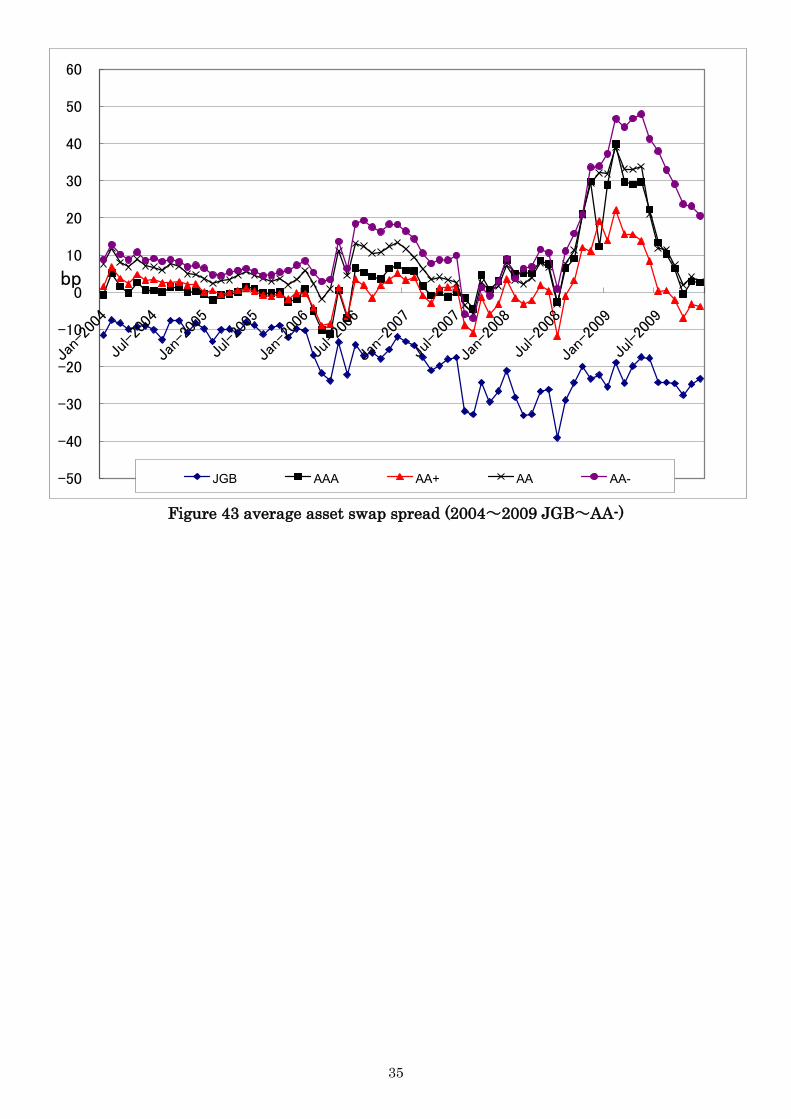
respectively. Figure 41 to Figure 43 shows the time series movement of average asset
swap spread for each credit rating.
<Figure 8> to <Figure 43>
These figures show that if the ratings become lower, asset swap spreads seem to be
higher and its volatility also be higher.
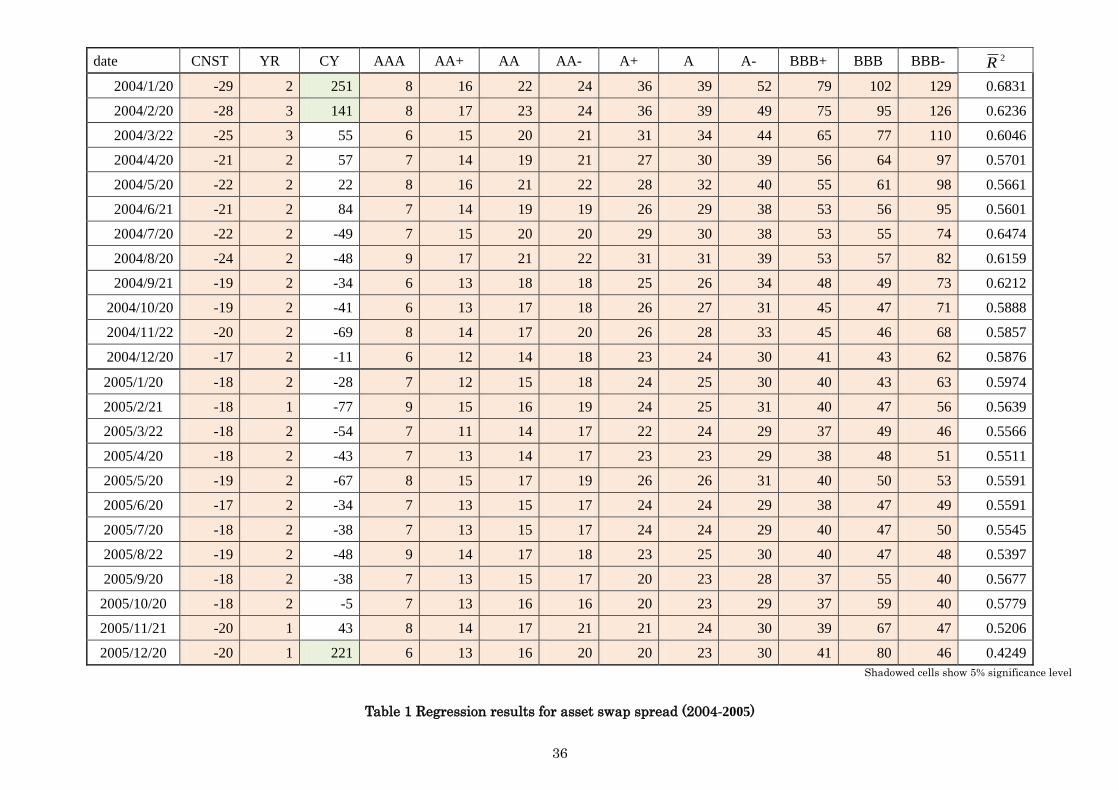
4.2 Regression analysis
We try to investigate the drivers for the asset swap spreads by cross sectional
regression more precisely. The drivers we thought were years to maturity (YR), current
yield (CY), and credit rating. We used dummy variable for each credit including + or –
sub-notches. As we mentioned earlier, when the years to maturity became longer, the
credit for bonds might be lower, so the investors need higher return i.e. higher asset
swap spreads, because the probability to default will be higher, if other things are being
6 BBA stands for British Bankers Association and TSR for Tokyo Swap Reference Rate.
We estimated the JPY discount factor from the real cash flow data, using linear
interpolation estimation method for market data and discount factors. See
Takahashi[2002] for the details of the estimation method. 7 The results are shown only those that has BBB-(2004-2005) or BB+(2008-2009) or
higher ratings.
8
equal. This will lead the coefficient for YR positive. Current yield shows the rate of
coupon return from bond investments, coupon payment divided by the market price of
the bonds. Usually, coupon payment will set higher for the lower grade bonds issued in
the same period, current yields tend to be higher. And lower credit bonds will have
higher asset swap spreads, the coefficient for CY will be positive. Credit ratings are, of
course, shows directly the default level. This will lead the coefficient for credit rating
dummy will be positive.
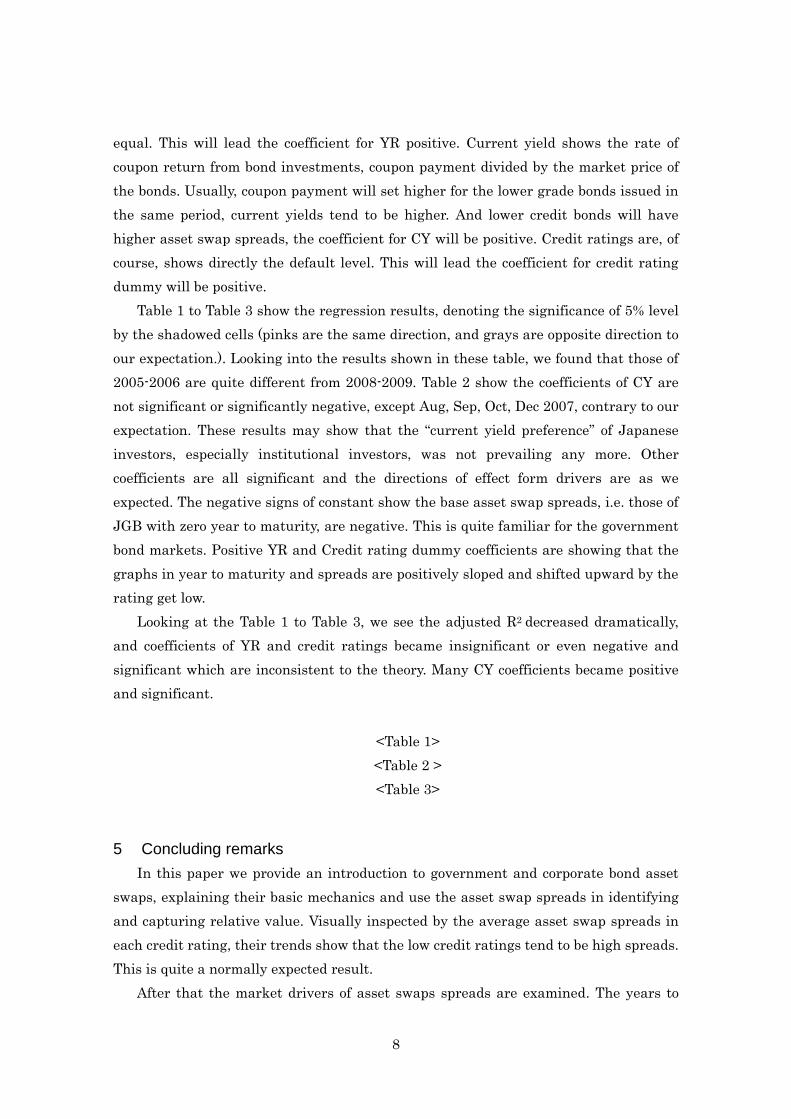
Table 1 to Table 3 show the regression results, denoting the significance of 5% level
by the shadowed cells (pinks are the same direction, and grays are opposite direction to
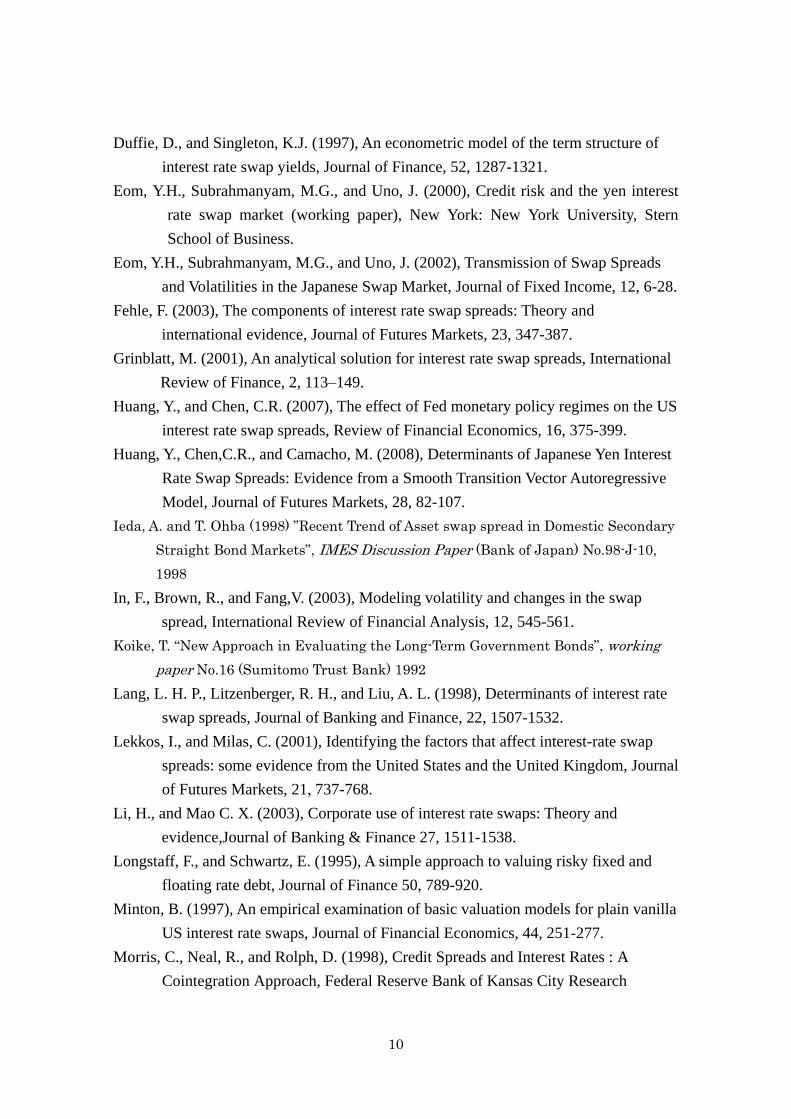
our expectation.). Looking into the results shown in these table, we found that those of
2005-2006 are quite different from 2008-2009. Table 2 show the coefficients of CY are
not significant or significantly negative, except Aug, Sep, Oct, Dec 2007, contrary to our
expectation. These results may show that the “current yield preference” of Japanese
investors, especially institutional investors, was not prevailing any more. Other
coefficients are all significant and the directions of effect form drivers are as we
expected. The negative signs of constant show the base asset swap spreads, i.e. those of
JGB with zero year to maturity, are negative. This is quite familiar for the government
bond markets. Positive YR and Credit rating dummy coefficients are showing that the
graphs in year to maturity and spreads are positively sloped and shifted upward by the
rating get low.
Looking at the Table 1 to Table 3, we see the adjusted R2 decreased dramatically,
and coefficients of YR and credit ratings became insignificant or even negative and
significant which are inconsistent to the theory. Many CY coefficients became positive
and significant.
<Table 1>
<Table 2 >
<Table 3>
5 Concluding remarks
In this paper we provide an introduction to government and corporate bond asset
swaps, explaining their basic mechanics and use the asset swap spreads in identifying
and capturing relative value. Visually inspected by the average asset swap spreads in
each credit rating, their trends show that the low credit ratings tend to be high spreads.
This is quite a normally expected result.
After that the market drivers of asset swaps spreads are examined. The years to

9
maturities, current yields, and credit rating (in dummy variables) are used as a
dependent variables in cross-sectional regressions. The result coefficients are quite
different between 2005-2006and 2008-2009.
In 2005-2006 results, years to maturities are positive and significant in all periods,
as we expected. And those of current yields are positive and significant only on Jan and
Feb 2004 and Dec 2005. These results may show that the “current yield preference” of
Japanese investors, especially institutional investors, was not prevailing any more.
Other coefficients are all significant and the directions of effect form drivers are as we
expected. Credit ratings affected positive and significant to the asset swap spreads. The
negative signs of constant show the base asset swap spreads, i.e. those of JGB with zero
year to maturity, are negative. This is quite familiar for the government bond markets.
Positive YR and Credit rating dummy coefficients are showing that the graphs in year
to maturity and spreads are positively sloped and shifted upward by the rating get low.
For the estimated coefficients of 2008-2009, we see the adjusted R2 decreased
dramatically, and coefficients of YR and credit ratings became insignificant or even
negative and significant which are inconsistent to the theory. Many CY coefficients
became positive and significant.
We make an investigation to the markets as a whole in this paper. Looking much
closer, we can find interesting sub-groups in each credit rating groups, especially in the
low grade. This could be a interesting source of arbitrage and should be investigated
carefully. These are for our future research topics.
References
Afonso, A., and Strauch,R. (2007), Fiscal policy events and interest rate swap spreads:
Evidence from the EU, Journal of International Financial Markets, Institutions
and Money, 17, 261-276.
Blanco, R., Brennan, S., and Marsh, I.W. (2005), An Empirical Analysis of the
Dynamic Relation between Investment-Grade Bonds and Credit Default Swaps,
Journal of Finance, 60, 2255-2281.
Brown, K. C., Harlow, W. V., and Smith, D. J. (1994), An empirical analysis of interest
rate swap spreads, Journal of Fixed Income, 3, 61–78.
Cooper, I., and Mello, A. S. (1991), The default risk on swaps. Journal of Finance, 46,
597–620.
Duffie, D., and Huang, M. (1996), Swap rates and credit quality. Journal of Finance 51,
921-949.
10
Duffie, D., and Singleton, K.J. (1997), An econometric model of the term structure of
interest rate swap yields, Journal of Finance, 52, 1287-1321.
Eom, Y.H., Subrahmanyam, M.G., and Uno, J. (2000), Credit risk and the yen interest
rate swap market (working paper), New York: New York University, Stern
School of Business.
Eom, Y.H., Subrahmanyam, M.G., and Uno, J. (2002), Transmission of Swap Spreads
and Volatilities in the Japanese Swap Market, Journal of Fixed Income, 12, 6-28.
Fehle, F. (2003), The components of interest rate swap spreads: Theory and
international evidence, Journal of Futures Markets, 23, 347-387.
Grinblatt, M. (2001), An analytical solution for interest rate swap spreads, International
Review of Finance, 2, 113–149.
Huang, Y., and Chen, C.R. (2007), The effect of Fed monetary policy regimes on the US
interest rate swap spreads, Review of Financial Economics, 16, 375-399.
Huang, Y., Chen,C.R., and Camacho, M. (2008), Determinants of Japanese Yen Interest
Rate Swap Spreads: Evidence from a Smooth Transition Vector Autoregressive
Model, Journal of Futures Markets, 28, 82-107.
Ieda, A. and T. Ohba (1998) ”Recent Trend of Asset swap spread in Domestic Secondary
Straight Bond Markets”, IMES Discussion Paper (Bank of Japan) No.98-J-10,
1998
In, F., Brown, R., and Fang,V. (2003), Modeling volatility and changes in the swap
spread, International Review of Financial Analysis, 12, 545-561.
Koike, T. “New Approach in Evaluating the Long-Term Government Bonds”, working
paper No.16 (Sumitomo Trust Bank) 1992
Lang, L. H. P., Litzenberger, R. H., and Liu, A. L. (1998), Determinants of interest rate
swap spreads, Journal of Banking and Finance, 22, 1507-1532.
Lekkos, I., and Milas, C. (2001), Identifying the factors that affect interest-rate swap
spreads: some evidence from the United States and the United Kingdom, Journal
of Futures Markets, 21, 737-768.
Li, H., and Mao C. X. (2003), Corporate use of interest rate swaps: Theory and
evidence,Journal of Banking & Finance 27, 1511-1538.
Longstaff, F., and Schwartz, E. (1995), A simple approach to valuing risky fixed and
floating rate debt, Journal of Finance 50, 789-920.
Minton, B. (1997), An empirical examination of basic valuation models for plain vanilla
US interest rate swaps, Journal of Financial Economics, 44, 251-277.
Morris, C., Neal, R., and Rolph, D. (1998), Credit Spreads and Interest Rates : A
Cointegration Approach, Federal Reserve Bank of Kansas City Research

11
Working Paper, RWP 98-08.
Miyakoshi, T., and Tsukuda, Y. (2007), Assessments of the Program for Financial
Revival of the Japanese Banks, Applied Financial Economics, 17, 901-912.
Rockinger, M., and Urga, G. (2000), The Evolution of Stock Markets in Transition
Economies, Journal of Comparative Economics, 28, 456-472.
Rockinger, M., and Urga, G. (2001), A Time-Varying Parameter Model to Test for
Predictability and Integration in the Stock Markets of Transition Economies,
Journal of Business and Economic Statistics, 19, 1, 73-84.
Shimada, J., Takahasi T., Miyakoshi, T., and Tsukuda Y.,(2010) “Japanese Interest Rate
Swap Pricing” paper presented at the 18the Annual Conference on PBFEAM
Sorensen, E. H., and Bollier, T. F. (1994), Pricing swap default risk. Financial Analysts
Journal, 50, 23-33.
Takahashi, T. (1997) “The JGB valuation and the main characteristics in the JGB
markets” Studies in Financial Management vol.9.
Takahashi, T. (2002) “Bond Market Analysis Using the Data from the Swap Market
Information” in Ohno, Ogawa, Sasaki, and Takahashi ed. Financial Market in
the Pacific Basin Economies Research Institute, Takachiho University, TRI01-28,
Takahashi, T. (2007) “Recent Trend of the LIBOR spreads in the Japanese Bond
Markets”, Chuo Business Review 11
Titman, S. (1992), “Interest rate swaps and corporate financing choices”. Journal of
Finance 47, 1503-1516.
Tonge, D. (2001) “CEEMEA Fixed Income Strategy ---Using asset swap spreads to
identify government bond relative-value ---” Citibank
Ueki, S. (1999) “Corporate bond spreads in secondary bond markets” Working paper
No.99-J-5 Bank of Japan
12
Figures and Tables
Figure 1 Trading Volume of Over-the-Counter Bonds
source: The Japan securities dealers association http://www.jsda.or.jp/html/toukei/index.html
0
10,000
20,000
30,000
40,000
50,000
60,000
70,000
80,000
90,000
100,000
0
2,000,000
4,000,000
6,000,000
8,000,000
10,000,000
12,000,000
14,000,000
100mil Yen100mil Yen
Government Bonds Public Offering Municipal Govt. Guaranteed FILP-Agency Bonds
Transportation&NHK Bank Debentures Corporate Specified Asset Backed Securities
Convertible Bonds Yen-Denominated Foreign Private Offering
13
Figure 2 Share of JGB in the trade of bond markets
source: The Japan securities dealers association http://www.jsda.or.jp/html/toukei/index.html
0
500,000
1,000,000
1,500,000
2,000,000
2,500,000
3,000,000
3,500,000
4,000,000
4,500,000
100milion yen
Interest-bearing Long-term (over 10-year) Interest-bearing Long-term Interest-bearing Medium-term
Zero-Coupon Treasury Bills TreasuryDiscount Bills
14
Figure 3 Share in trading volume in bond markets
source: The Japan securities dealers association http://www.jsda.or.jp/html/toukei/index.html
86%
88%
90%
92%
94%
96%
98%
100%
Government Bonds Public Offering Municipal Govt. Guaranteed FILP-Agency Bonds
Transportation&NHK Bank Debentures Corporate Specified Asset Backed Securities
Convertible Bonds Yen-Denominated Foreign Private Offering
15
Figure 4 Share in trading volume (other than JGBs)
source: The Japan securities dealers association http://www.jsda.or.jp/html/toukei/index.html
0%
10%
20%
30%
40%
50%
60%
70%
80%
90%
100%
Public Offering Municipal Govt. Guaranteed FILP-Agency Bonds
Transportation&NHK Bank Debentures Corporate
Specified Asset Backed Securities Convertible Bonds Yen-Denominated Foreign
Private Offering

16
Figure 5 Synthetic FRN cash flow
Figure 6 asset swap for synthetic FRN
17
Figure 7 asset swap spread(2004/1~2005/12)overall
Figure 8 asset swap spread(2004/1/20) JGB
LIBOR Spread
-40.0
-35.0
-30.0
-25.0
-20.0
-15.0
-10.0
-5.0
0.0
0.00 2.00 4.00 6.00 8.00 10.00 12.00
JGB(2004/01/20)
Asset s
wap s
pre
ad
Year to maturity
18
Figure 9 asset swap spread(2004/1/20) AAA
Figure 10 asset swap spread(2004/1/20) AA+
LIBOR Spread
-50.0
-40.0
-30.0
-20.0
-10.0
0.0
10.0
20.0
30.0
0.00 5.00 10.00 15.00 20.00 25.00 30.00
AAA(2004/01/20)
LIBOR Spread
-4.0
-2.0
0.0
2.0
4.0
6.0
8.0
10.0
12.0
14.0
0.00 2.00 4.00 6.00 8.00 10.00 12.00 14.00 16.00
AA+(2004/01/20)

19
Figure 11 asset swap spread(2004/1/20) AA
Figure 12 asset swap spread(2004/1/20) AA-
LIBOR Spread
-10.0
-5.0
0.0
5.0
10.0
15.0
20.0
25.0
30.0
0.00 2.00 4.00 6.00 8.00 10.00 12.00
AA(2004/01/20)
LIBOR Spread
-10.0
-5.0
0.0
5.0
10.0
15.0
20.0
25.0
30.0
35.0
0.00 2.00 4.00 6.00 8.00 10.00 12.00 14.00 16.00
AA-(2004/01/20)
20
Figure 13 asset swap spread(2004/1/20) A+
Figure 14 asset swap spread(2004/1/20) A
LIBOR Spread
-20.0
0.0
20.0
40.0
60.0
80.0
100.0
0.00 2.00 4.00 6.00 8.00 10.00 12.00 14.00 16.00 18.00 20.00
A+(2004/01/20)
LIBOR Spread
-20.0
0.0
20.0
40.0
60.0
80.0
100.0
120.0
0.00 2.00 4.00 6.00 8.00 10.00 12.00 14.00
A(2004/01/20)
21
Figure 15 asset swap spread(2004/1/20) A-
Figure 16 asset swap spread(2004/1/20) BBB+
LIBOR Spread
-20.0
0.0
20.0
40.0
60.0
80.0
100.0
0.00 1.00 2.00 3.00 4.00 5.00 6.00 7.00 8.00 9.00
A-(2004/01/20)
LIBOR Spread
0.0
20.0
40.0
60.0
80.0
100.0
120.0
140.0
160.0
180.0
0.00 2.00 4.00 6.00 8.00 10.00 12.00 14.00 16.00
BBB+(2004/01/20)
22
Figure 17 asset swap spread(2004/1/20) BBB
Figure 18 asset swap spread(2004/1/20) BBB-
LIBOR Spread
0.0
50.0
100.0
150.0
200.0
250.0
0.00 1.00 2.00 3.00 4.00 5.00 6.00 7.00
BBB(2004/01/20)
LIBOR Spread
0.0
50.0
100.0
150.0
200.0
250.0
300.0
350.0
0.00 1.00 2.00 3.00 4.00 5.00 6.00 7.00 8.00 9.00
BBB-(2004/01/20)
23
Figure 19 asset swap spread(2004/12/20) JGB
Figure 20 asset swap spread(2004/12/20) AAA
LIBOR Spread
-40.0
-35.0
-30.0
-25.0
-20.0
-15.0
-10.0
-5.0
0.0
0.00 2.00 4.00 6.00 8.00 10.00 12.00
JGB(2004/12/20)
LIBOR Spread
-60.0
-50.0
-40.0
-30.0
-20.0
-10.0
0.0
10.0
20.0
30.0
40.0
0.00 5.00 10.00 15.00 20.00 25.00 30.00
AAA(2004/12/20)
24
Figure 21 asset swap spread(2004/12/20) AA+
Figure 22 asset swap spread (2004/12/20) AA
LIBOR Spread
-10.0
-5.0
0.0
5.0
10.0
15.0
20.0
0.00 2.00 4.00 6.00 8.00 10.00 12.00 14.00
AA+(2004/12/20)
LIBOR Spread
-10.0
-5.0
0.0
5.0
10.0
15.0
20.0
0.00 5.00 10.00 15.00 20.00 25.00
AA(2004/12/20)
25
Figure 23 asset swap spread(2004/12/20) AA-
Figure 24 asset swap spread(2004/12/20) A+
LIBOR Spread
-5.0
0.0
5.0
10.0
15.0
20.0
25.0
30.0
0.00 2.00 4.00 6.00 8.00 10.00 12.00 14.00 16.00
AA-(2004/12/20)
LIBOR Spread
-30.0
-20.0
-10.0
0.0
10.0
20.0
30.0
40.0
50.0
0.00 1.00 2.00 3.00 4.00 5.00 6.00 7.00 8.00 9.00 10.00
A+(2004/12/20)
26
Figure 25 asset swap spread(2004/12/20) A
Figure 26 asset swap spread(2004/12/20) A-
LIBOR Spread
-10.0
0.0
10.0
20.0
30.0
40.0
50.0
60.0
70.0
0.00 2.00 4.00 6.00 8.00 10.00 12.00
A(2004/12/20)
LIBOR Spread
-20.0
-10.0
0.0
10.0
20.0
30.0
40.0
50.0
60.0
0.00 2.00 4.00 6.00 8.00 10.00 12.00 14.00 16.00
A-(2004/12/20)

27
Figure 27 asset swap spread(2004/12/20) BBB+
Figure 28 asset swap spread(2004/12/20) BBB
LIBOR Spread
0.0
20.0
40.0
60.0
80.0
100.0
120.0
140.0
0.00 2.00 4.00 6.00 8.00 10.00 12.00 14.00
BBB+(2004/12/20)
LIBOR Spread
-40.0
-20.0
0.0
20.0
40.0
60.0
80.0
100.0
120.0
140.0
160.0
0.00 2.00 4.00 6.00 8.00 10.00 12.00
BBB(2004/12/20)
28
Figure 29 asset swap spread(2004/12/20) BBB-
Figure 30 asset swap spread(2005/1/20) JGB
LIBOR Spread
0.0
20.0
40.0
60.0
80.0
100.0
120.0
140.0
160.0
180.0
0.00 1.00 2.00 3.00 4.00 5.00 6.00 7.00 8.00
BBB-(2004/12/20)
LIBOR Spread
-50.0
0.0
50.0
100.0
150.0
200.0
250.0
300.0
350.0
0.00 1.00 2.00 3.00 4.00 5.00 6.00 7.00 8.00 9.00 10.00
JGB(2005/01/20)

29
Figure 31 asset swap spread(2005/1/20) AAA
Figure 32 asset swap spread(2005/1/20) AA+
LIBOR Spread
-50.0
0.0
50.0
100.0
150.0
200.0
250.0
300.0
350.0
0.00 1.00 2.00 3.00 4.00 5.00 6.00 7.00 8.00 9.00 10.00
AAA(2005/01/20)
LIBOR Spread
-50.0
0.0
50.0
100.0
150.0
200.0
250.0
300.0
350.0
0.00 1.00 2.00 3.00 4.00 5.00 6.00 7.00 8.00 9.00 10.00
AA+(2005/01/20)
30
Figure 33 asset swap spread(2005/1/20) AA
Figure 34 asset swap spread(2005/1/20) AA-
LIBOR Spread
-50.0
0.0
50.0
100.0
150.0
200.0
250.0
300.0
350.0
0.00 1.00 2.00 3.00 4.00 5.00 6.00 7.00 8.00 9.00 10.00
AA(2005/01/20)
LIBOR Spread
-50.0
0.0
50.0
100.0
150.0
200.0
250.0
300.0
350.0
0.00 1.00 2.00 3.00 4.00 5.00 6.00 7.00 8.00 9.00 10.00
AA-(2005/01/20)
31
Figure 35 asset swap spread(2005/1/20) A+
Figure 36 asset swap spread(2005/1/20) A
LIBOR Spread
-50.0
0.0
50.0
100.0
150.0
200.0
250.0
300.0
350.0
0.00 1.00 2.00 3.00 4.00 5.00 6.00 7.00 8.00 9.00 10.00
A+(2005/01/20)
LIBOR Spread
-50.0
0.0
50.0
100.0
150.0
200.0
250.0
300.0
350.0
0.00 1.00 2.00 3.00 4.00 5.00 6.00 7.00 8.00 9.00 10.00
A(2005/01/20)

32
Figure 37 asset swap spread(2005/1/20) A-
Figure 38 asset swap spread(2005/1/20) BBB+
LIBOR Spread
-50.0
0.0
50.0
100.0
150.0
200.0
250.0
300.0
350.0
0.00 1.00 2.00 3.00 4.00 5.00 6.00 7.00 8.00 9.00 10.00
A-(2005/01/20)
LIBOR Spread
-50.0
0.0
50.0
100.0
150.0
200.0
250.0
300.0
350.0
0.00 1.00 2.00 3.00 4.00 5.00 6.00 7.00 8.00 9.00 10.00
BBB+(2005/01/20)
33
Figure 39 asset swap spread(2005/1/20) BBB
Figure 40 asset swap spread(2005/1/20) BBB-
LIBOR Spread
-50.0
0.0
50.0
100.0
150.0
200.0
250.0
300.0
350.0
0.00 1.00 2.00 3.00 4.00 5.00 6.00 7.00 8.00 9.00 10.00
BBB(2005/01/20)
LIBOR Spread
-50.0
0.0
50.0
100.0
150.0
200.0
250.0
300.0
350.0
0.00 1.00 2.00 3.00 4.00 5.00 6.00 7.00 8.00 9.00 10.00
BBB-(2005/01/20)

34
Figure 41 average asset swap spread (2004~2009 JGB~BBB-)
Figure 42 average asset swap spread (2004~2009 JGB~A-)
-200
0
200
400
600
800
1000
1200
bp
JGB AAA AA+ AA AA- A+
A A- BBB+ BBB BBB-
-100
-50
0
50
100
150
200
250
bp
JGB AAA AA+ AA AA- A+ A A-
35
Figure 43 average asset swap spread (2004~2009 JGB~AA-)
-50
-40
-30
-20
-10
0
10
20
30
40
50
60
bp
JGB AAA AA+ AA AA-
36
date CNST YR CY AAA AA+ AA AA- A+ A A- BBB+ BBB BBB- 2R
2004/1/20 -29 2 251 8 16 22 24 36 39 52 79 102 129 0.6831
2004/2/20 -28 3 141 8 17 23 24 36 39 49 75 95 126 0.6236
2004/3/22 -25 3 55 6 15 20 21 31 34 44 65 77 110 0.6046
2004/4/20 -21 2 57 7 14 19 21 27 30 39 56 64 97 0.5701
2004/5/20 -22 2 22 8 16 21 22 28 32 40 55 61 98 0.5661
2004/6/21 -21 2 84 7 14 19 19 26 29 38 53 56 95 0.5601
2004/7/20 -22 2 -49 7 15 20 20 29 30 38 53 55 74 0.6474
2004/8/20 -24 2 -48 9 17 21 22 31 31 39 53 57 82 0.6159
2004/9/21 -19 2 -34 6 13 18 18 25 26 34 48 49 73 0.6212
2004/10/20 -19 2 -41 6 13 17 18 26 27 31 45 47 71 0.5888
2004/11/22 -20 2 -69 8 14 17 20 26 28 33 45 46 68 0.5857
2004/12/20 -17 2 -11 6 12 14 18 23 24 30 41 43 62 0.5876
2005/1/20 -18 2 -28 7 12 15 18 24 25 30 40 43 63 0.5974
2005/2/21 -18 1 -77 9 15 16 19 24 25 31 40 47 56 0.5639
2005/3/22 -18 2 -54 7 11 14 17 22 24 29 37 49 46 0.5566
2005/4/20 -18 2 -43 7 13 14 17 23 23 29 38 48 51 0.5511
2005/5/20 -19 2 -67 8 15 17 19 26 26 31 40 50 53 0.5591
2005/6/20 -17 2 -34 7 13 15 17 24 24 29 38 47 49 0.5591
2005/7/20 -18 2 -38 7 13 15 17 24 24 29 40 47 50 0.5545
2005/8/22 -19 2 -48 9 14 17 18 23 25 30 40 47 48 0.5397
2005/9/20 -18 2 -38 7 13 15 17 20 23 28 37 55 40 0.5677
2005/10/20 -18 2 -5 7 13 16 16 20 23 29 37 59 40 0.5779
2005/11/21 -20 1 43 8 14 17 21 21 24 30 39 67 47 0.5206
2005/12/20 -20 1 221 6 13 16 20 20 23 30 41 80 46 0.4249
Shadowed cells show 5% significance level
Table 1 Regression results for asset swap spread (2004-2005)

37
date CNST YR CY AAA AA+ AA AA- A+ A A- BBB+ BBB BBB- 2R
2006/1/20 -21 2 158 9 14 19 22 24 27 31 44 84 51 0.4502
2006/2/20 -24 1 151 10 16 21 24 27 31 35 49 89 58 0.4776
2006/3/20 -29 1 181 11 15 21 27 28 32 37 63 109 75 0.4518
2006/4/20 -30 0 277 12 16 26 29 38 44 39 64 100 79 0.3921
2006/5/20 -23 1 185 12 17 27 30 40 44 43 66 102 80 0.3924
2006/6/20 -30 1 238 14 18 28 31 38 42 40 59 101 73 0.4008
2006/7/20 -24 1 168 19 21 29 36 43 46 43 66 106 75 0.4059
2006/8/21 -25 2 16 20 22 31 39 46 48 48 70 114 83 0.5015
2006/9/20 -26 2 68 18 19 29 37 44 47 45 72 114 83 0.5201
2006/10/20 -28 1 181 19 24 31 37 45 46 48 70 71 139 0.5546
2006/11/20 -26 2 154 19 23 30 37 45 46 48 69 70 139 0.5313
2006/12/20 -24 2 233 17 21 27 34 42 43 45 71 66 139 0.5061
2007/1/22 -24 2 203 17 21 27 33 43 45 46 70 68 140 0.5219
2007/2/20 -26 2 114 17 23 26 32 41 44 46 67 67 127 0.5222
2007/3/20 -29 2 253 16 20 26 31 40 40 45 71 65 124 0.5424
2007/4/20 -31 1 166 18 22 26 31 41 40 47 69 66 123 0.5147
2007/5/21 -29 1 196 18 24 25 31 41 38 46 66 68 119 0.4986
2007/6/20 -25 1 261 15 21 22 28 38 35 44 60 60 112 0.4717
2007/7/20 -28 1 324 15 21 21 30 40 36 44 63 63 115 0.4760
2007/8/20 -38 2 -130 24 22 27 26 38 40 55 48 66 100 0.4502
2007/9/20 -36 1 -211 24 21 26 27 36 38 52 53 73 75 0.4788
2007/10/20 -31 2 -80 22 21 25 26 35 39 68 53 75 75 0.3648
2007/11/20 -36 1 84 25 22 28 28 39 49 73 54 76 81 0.3614
2007/12/20 -31 1 -144 24 22 26 30 43 50 76 53 78 80 0.8462
Shadowed cells show 5% significance level
Table 2 Regression results for asset swap spread (2006-2007)

38
date CNST YR CY AAA AA+ AA AA- A+ A A- BBB+ BBB BBB- 2R
2008/1/22 -31 1 206 24 22 26 30 42 51 77 53 80 89 0.3942
2008/2/20 -54 2 756 28 24 32 38 62 73 107 67 103 122 0.3546
2008/3/21 -54 2 756 28 24 32 38 62 73 107 67 103 122 0.3229
2008/4/21 -51 1 884 31 26 35 38 60 77 112 69 104 121 0.2893
2008/5/20 -43 1 781 30 25 33 37 54 68 109 68 100 119 0.2885
2008/6/20 -58 0 2119 28 19 31 33 49 67 106 66 97 326 0.2674
2008/7/22 -399 -17 30251 45 -46 41 -14 13 2 84 -28 -26 -9390 0.2038
2008/8/20 -51 0 1590 33 23 36 37 61 74 143 76 108 74 0.2342
2008/9/22 -52 0 2044 31 22 35 36 64 68 152 77 107 71 0.2144
2008/10/20 -60 0 2640 34 23 38 35 80 76 174 81 136 90 0.2173
2008/11/20 -74 1 3185 36 21 47 48 90 83 184 93 158 98 0.2364
2008/12/22 -79 1 3681 18 24 46 45 114 136 216 132 194 151 0.3054
2009/1/20 -89 0 4298 38 27 53 53 120 144 228 143 227 155 0.2986
2009/2/20 -76 1 3582 40 29 53 58 121 112 169 176 383 176 0.3704
2009/3/23 -75 0 3357 40 30 53 61 134 121 183 198 370 187 0.3954
2009/4/20 -70 1 3238 34 25 48 59 125 116 183 209 355 213 0.3976
2009/5/20 -68 1 3194 30 20 46 57 117 105 167 197 375 224 0.3878
2009/6/22 -71 1 3377 23 15 34 52 99 92 150 176 422 205 0.3534
2009/7/21 -89 -1 4755 25 12 33 51 92 90 154 163 484 200 0.3171
2009/8/20 -116 -4 7647 28 9 34 43 82 88 139 147 635 438 0.2631
2009/9/24 -54 2 1474 17 16 28 49 85 79 99 148 204 433 0.4071
2009/10/20 -53 1 1562 18 15 27 48 84 74 96 131 182 450 0.3647
2009/11/20 -52 1 1571 17 15 26 44 56 98 92 114 156 1069 0.5228
2009/12/21 -73 -1 3770 17 10 23 38 50 88 113 200 151 1132 0.4208
Shadowed cells show 5% significance level
Table 3 Regression results for asset swap spread (2008-2009)
Related Documents