Price volatility in agricultural markets: drivers and implications 18 December 2012 DG Agriculture and Rural Development European Commission

Welcome message from author
This document is posted to help you gain knowledge. Please leave a comment to let me know what you think about it! Share it to your friends and learn new things together.
Transcript
Price volatility in agricultural markets: drivers and implications
18 December 2012
DG Agriculture and Rural Development
European Commission
Outline
1. Driver(s) of price volatility: no "smoking gun"?
2. What people says. What data shows
3. Implications
2
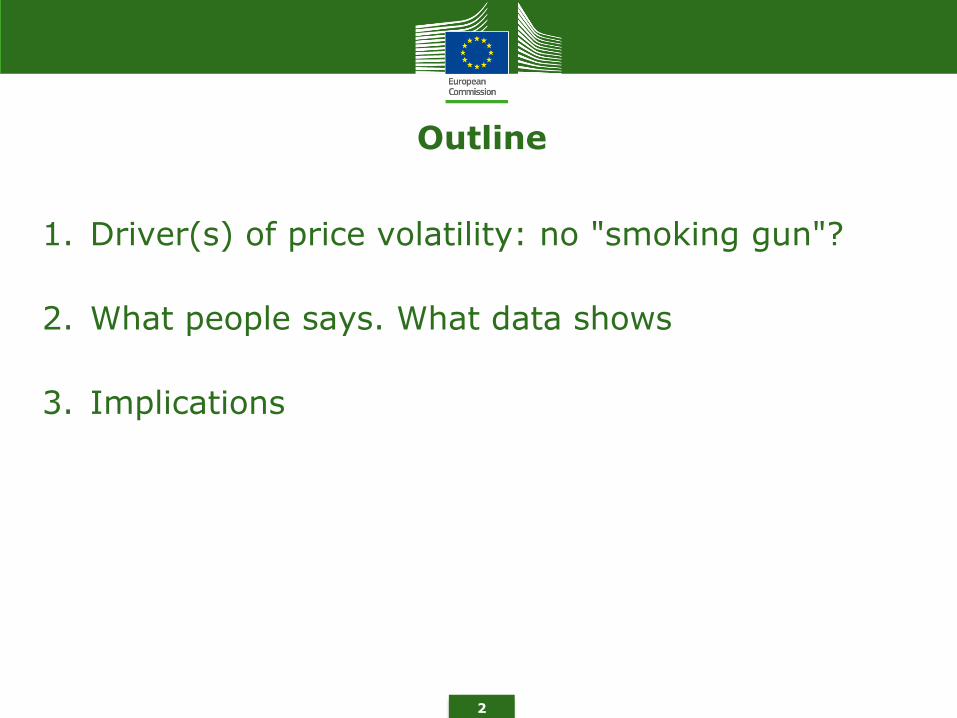
Long term commodity price trends
0
50
100
150
200
250
300
350
400
450
1948
1950
1952
1954
1956
1958
1960
1962
1964
1966
1968
1970
1972
1974
1976
1978
1980
1982
1984
1986
1988
1990
1992
1994
1996
1998
2000
2002
2004
2006
2008
2010
2012
(World Bank MUV-deflated indices, 2005 = 100)
Agriculture Fertilizers Energy Metals
Source: World Bank. Note: 2012 figures are forecasts as of September 2012.
3

4
While the commodity price boom has been attributed to many factors…
Common/macro factors
• Economic growth
• Weak dollar
• Fiscal expansion
• Low cost of capital
• Financialisation of commodities
Sector-specific factors
Exogenous to agriculture
• Energy prices
• Weather
• Food demand
• Biofuels
Endogenous to agriculture
• Policies
• Underinvestment
• Low stocks
5
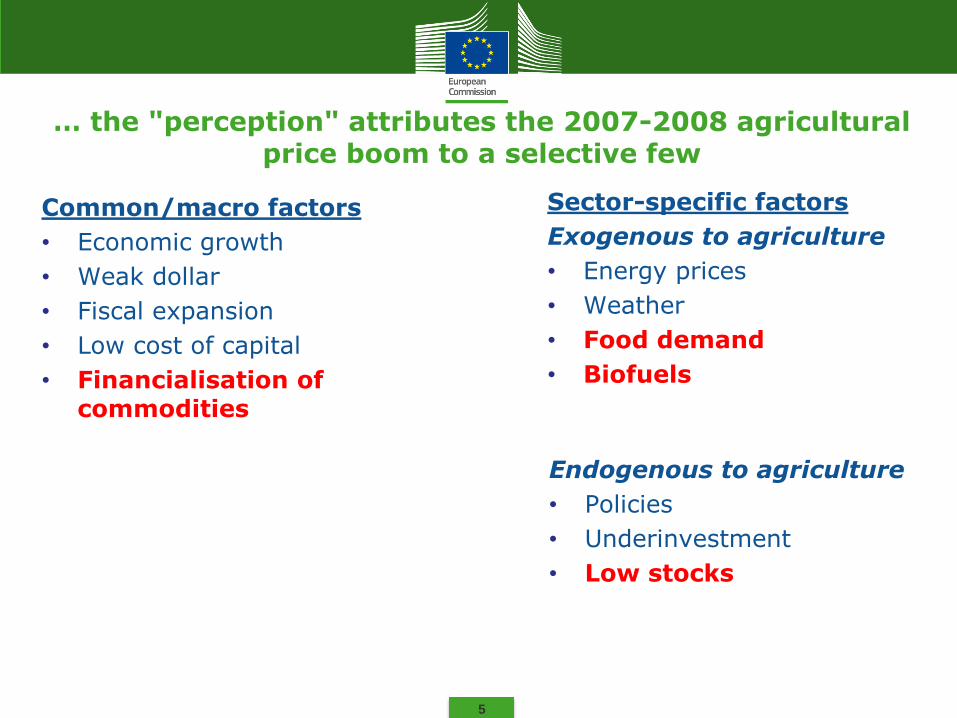
… the "perception" attributes the 2007-2008 agricultural price boom to a selective few
Common/macro factors
• Economic growth
• Weak dollar
• Fiscal expansion
• Low cost of capital
• Financialisation of commodities
Sector-specific factors
Exogenous to agriculture
• Energy prices
• Weather
• Food demand
• Biofuels
Endogenous to agriculture
• Policies
• Underinvestment
• Low stocks

6
Four basic questions to understand high and volatile commodity prices
1. Is price volatility higher than in the past?
2. Is this driven by higher yield variability?
3. Is it due to a sharp increase in food demand?
4. Are agricultural prices more sensitive to stock changes?
7
1. Is price volatility higher than in the past?
The analysis over the last 50 years shows:
• Price volatility higher in recent decade for most products, but lower lately
• Exception only for beef, poultry, sugar (higher in the 70s)
• EU price volatility was higher than at world level (CAP reform process of market orientation)

8
Long term price developments for key agricultural commodities
Source: World Bank
USD/mt in current USD
0
200
400
600
800
1000
1200
1400
1600
1960
1962
1964
1966
1968
1970
1972
1974
1976
1978
1980
1982
1984
1986
1988
1990
1992
1994
1996
1998
2000
2002
2004
2006
2008
2010
2012
Wheat (HRW) Soybeans Maize Soybean oil Rice
9
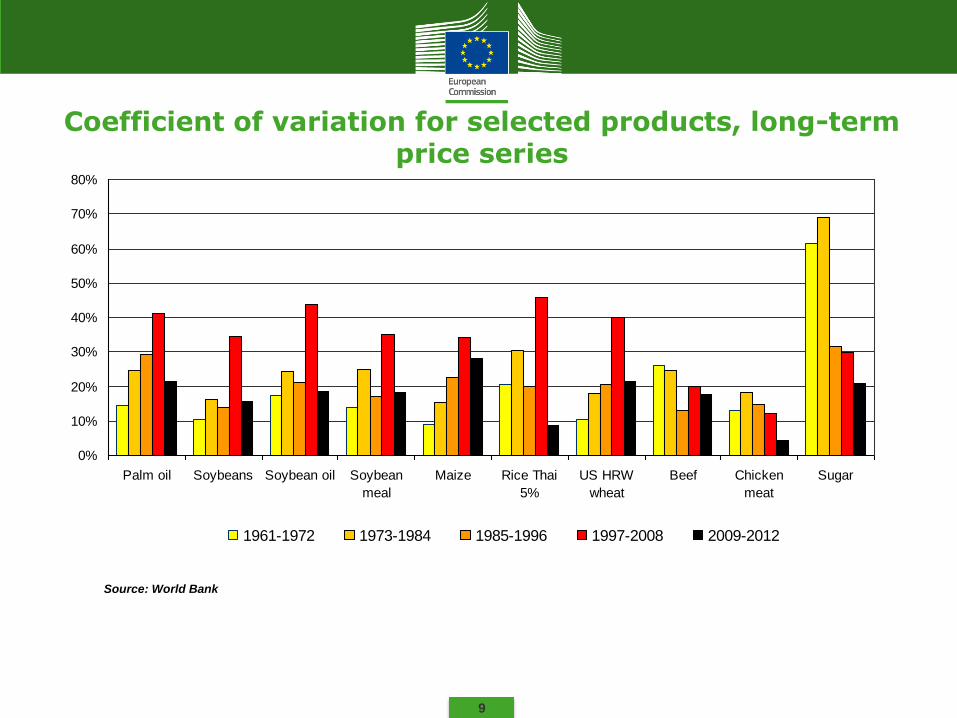
Coefficient of variation for selected products, long-term price series
Source: World Bank
0%
10%
20%
30%
40%
50%
60%
70%
80%
Palm oil Soybeans Soybean oil Soybean
meal
Maize Rice Thai
5%
US HRW
wheat
Beef Chicken
meat
Sugar
1961-1972 1973-1984 1985-1996 1997-2008 2009-2012
10
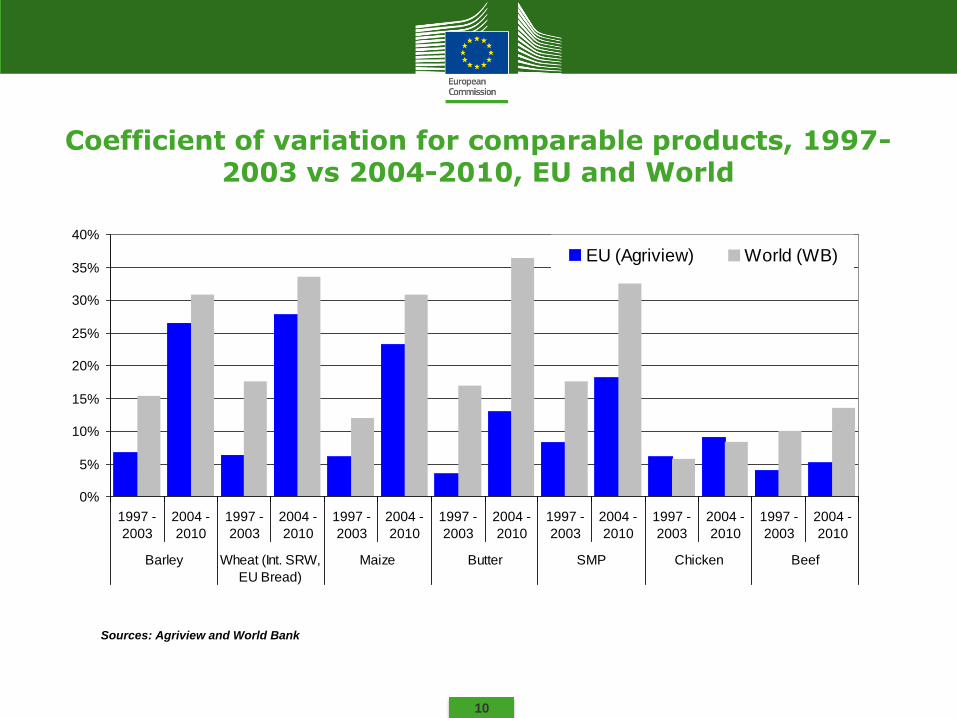
Coefficient of variation for comparable products, 1997-2003 vs 2004-2010, EU and World
Sources: Agriview and World Bank
0%
5%
10%
15%
20%
25%
30%
35%
40%
1997 -
2003
2004 -
2010
1997 -
2003
2004 -
2010
1997 -
2003
2004 -
2010
1997 -
2003
2004 -
2010
1997 -
2003
2004 -
2010
1997 -
2003
2004 -
2010
1997 -
2003
2004 -
2010
Barley Wheat (Int. SRW,
EU Bread)
Maize Butter SMP Chicken Beef
EU (Agriview) World (WB)
11
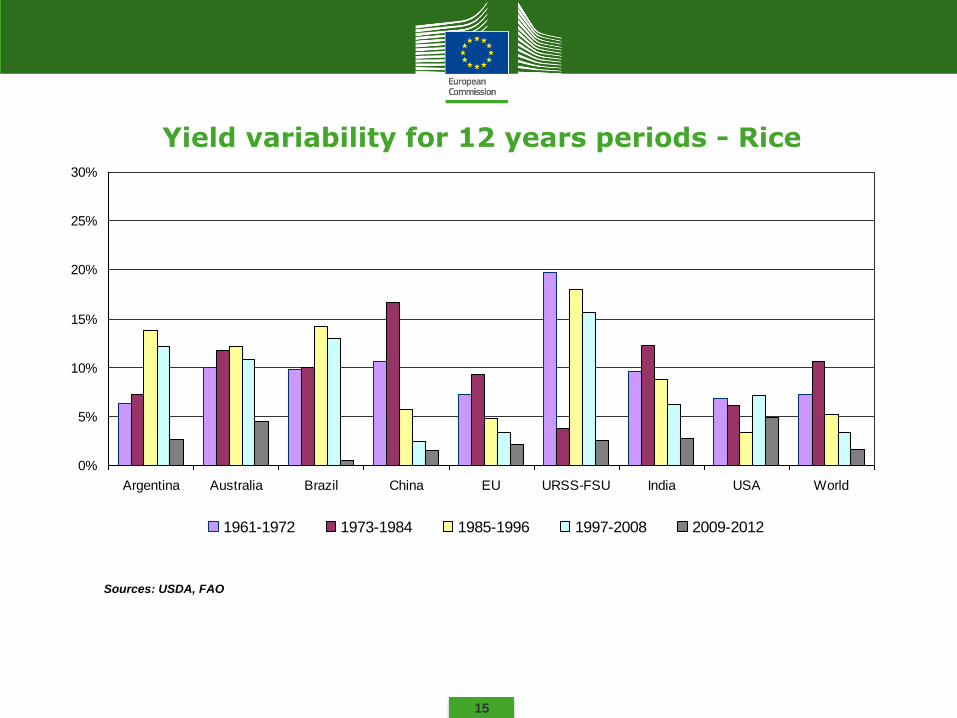
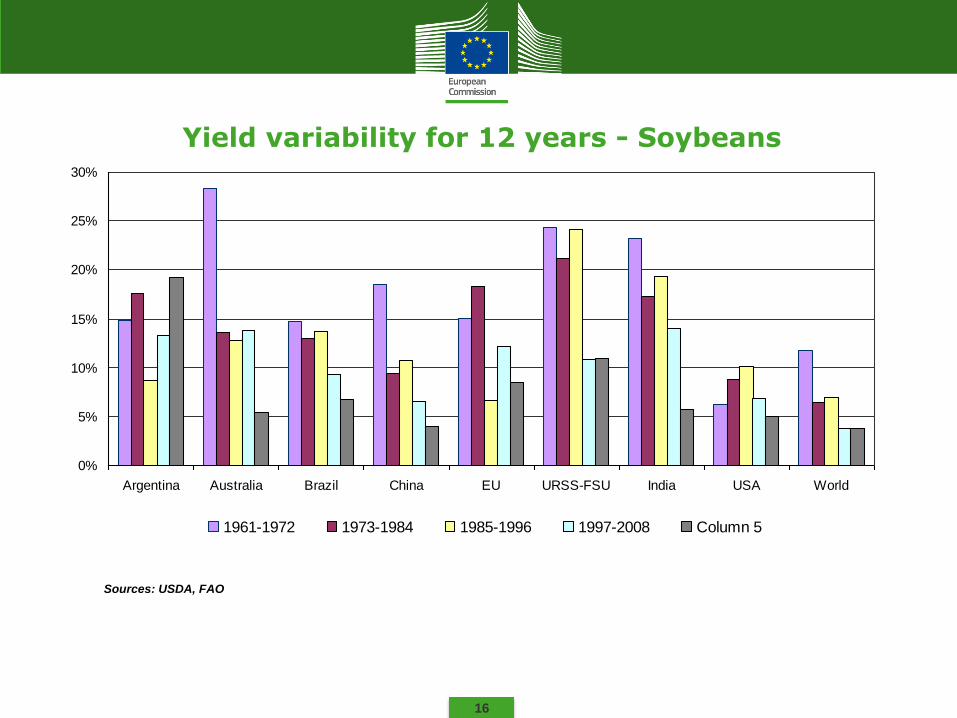
2. Is higher price volatility driven by higher yield variability?
The analysis shows:
• No straightforward conclusions can be drawn
• Different between countries and commodities
12
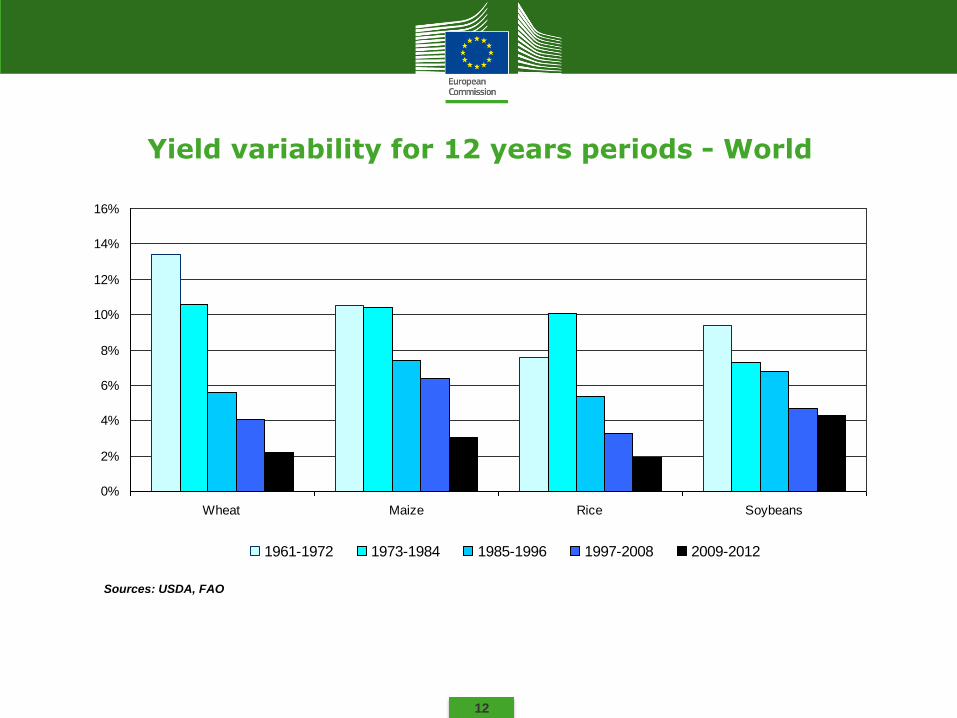
Yield variability for 12 years periods - World
Sources: USDA, FAO
0%
2%
4%
6%
8%
10%
12%
14%
16%
Wheat Maize Rice Soybeans
1961-1972 1973-1984 1985-1996 1997-2008 2009-2012
13
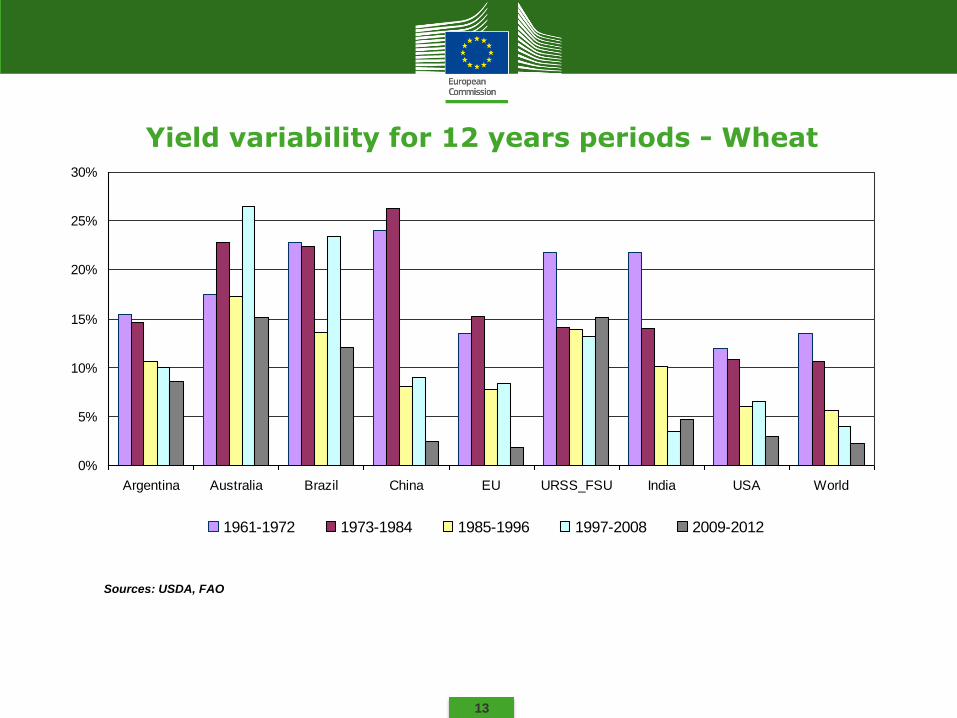
Yield variability for 12 years periods - Wheat
0%
5%
10%
15%
20%
25%
30%
Argentina Australia Brazil China EU URSS_FSU India USA World
1961-1972 1973-1984 1985-1996 1997-2008 2009-2012
Sources: USDA, FAO
14
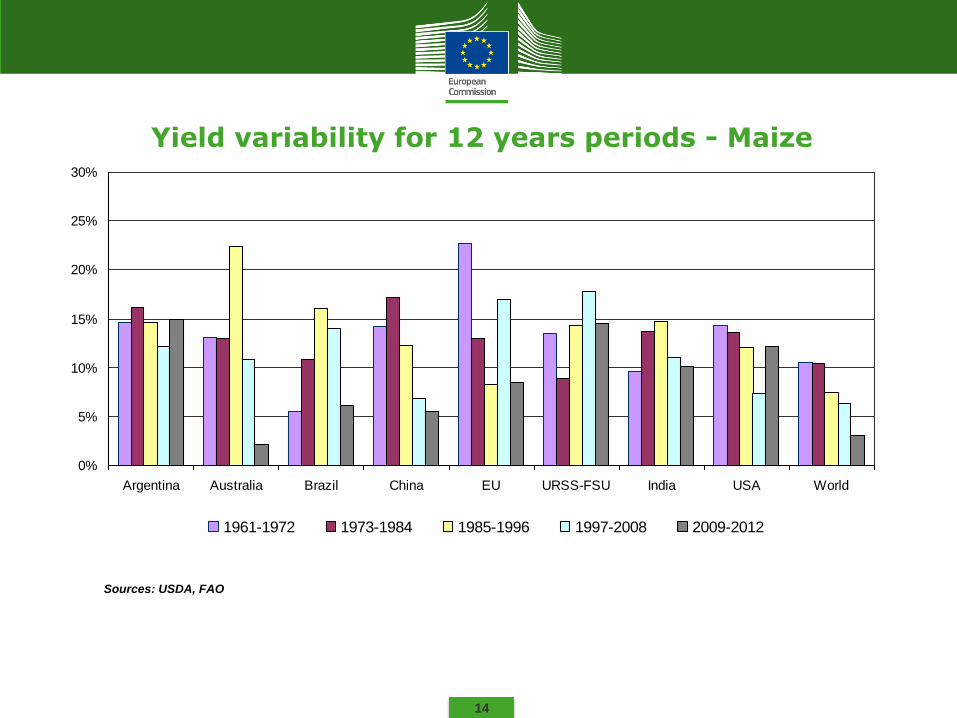
Yield variability for 12 years periods - Maize
0%
5%
10%
15%
20%
25%
30%
Argentina Australia Brazil China EU URSS-FSU India USA World
1961-1972 1973-1984 1985-1996 1997-2008 2009-2012
Sources: USDA, FAO
15
Yield variability for 12 years periods - Rice
0%
5%
10%
15%
20%
25%
30%
Argentina Australia Brazil China EU URSS-FSU India USA World
1961-1972 1973-1984 1985-1996 1997-2008 2009-2012
Sources: USDA, FAO
16
Yield variability for 12 years - Soybeans
0%
5%
10%
15%
20%
25%
30%
Argentina Australia Brazil China EU URSS-FSU India USA World
1961-1972 1973-1984 1985-1996 1997-2008 Column 5
Sources: USDA, FAO

17
Yield variability for 12 years - Sugar
0%
5%
10%
15%
20%
25%
30%
Australia
(cane)
Brazil (cane) China (cane) EU (beet) USSR-FSU
(beet)
USA (cane) India (cane) World (cane) World (beet)
1961-1972 1973-1984 1985-1996 1997-2008
Sources: USDA, FAO
18
3. Is higher price volatility driven by sharp increase in food demand?
The analysis shows:
• Agricultural products: Demand growth has decreased over the last 50 years for most products and countries (exception veg. oils and dairy products)
• Energy and minerals/metals: Demand growth is on the increase since mid 80s (iron, aluminium) and mid 90s (crude oil)

19
Growth rates for main agricultural products, crude oil and selected minerals/metals
-4%
-2%
0%
2%
4%
6%
8%
10%
Grains Grains for
feed
Vegetable
oils
Meats Dairy
products
Iron ore Aluminium Crude oil
1961-1972
1973-1984
1985-1996
1997-2008
World per capita demand growth for agricultural commodities, USDA, FAO. World production growth for crude oil (International Energy Agency) and Metals/minerals (U.S. Geological Survey)

20
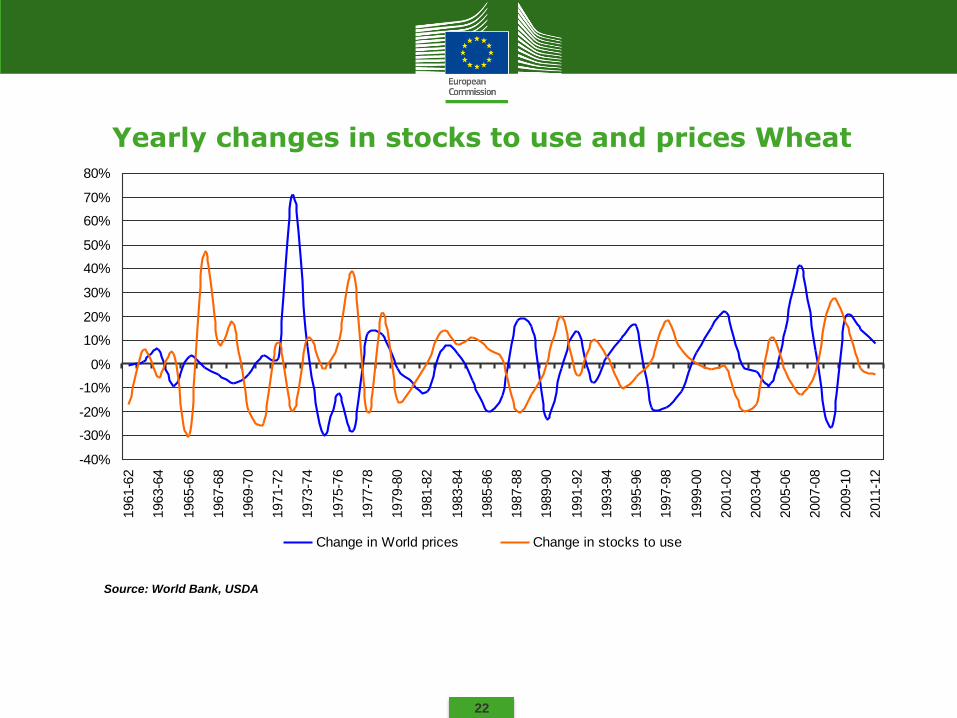
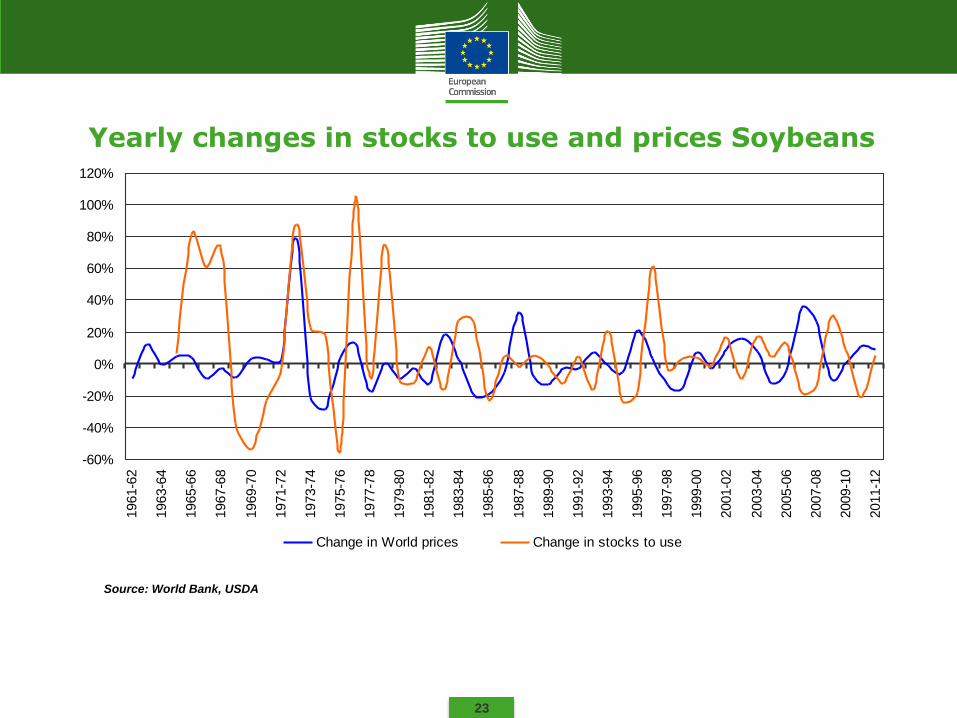
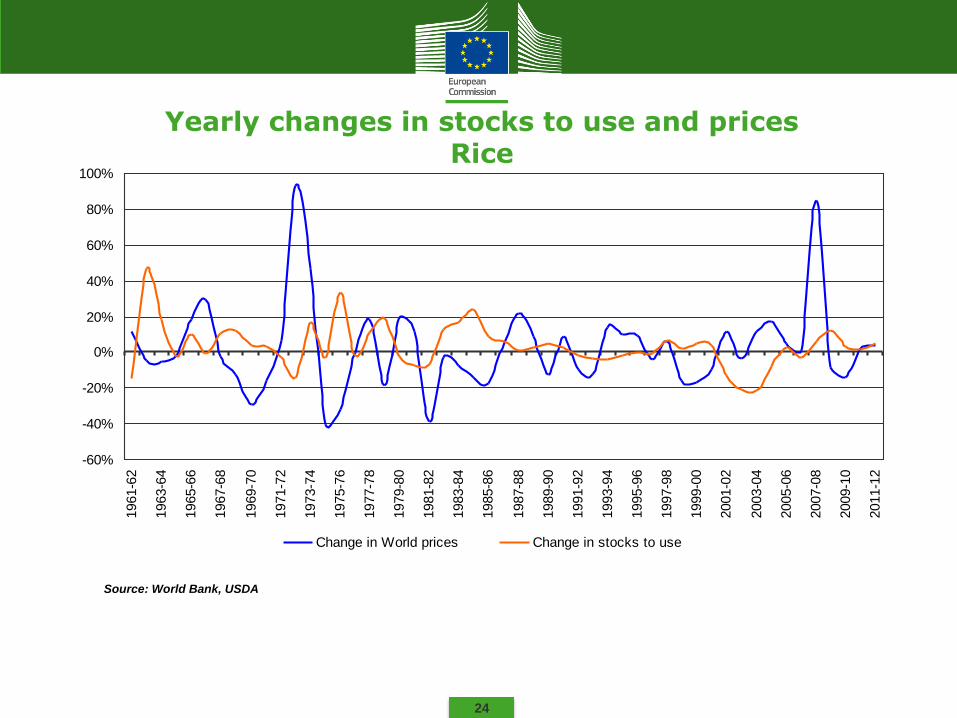
4. Are agricultural prices more sensitive to stock changes?
The analysis shows:
• The relationship between stock-to-use and world prices did not change much over the last 50 years.
• A certain increase in responsiveness can be observed for the main crops (wheat, maize, soybean) in the two past decades.
• Sugar prices on the other hand were more sensitive to stock changes in the 70s and 80s than recently (link with oil price).
• No significant linkage for rice and vegetable oils.

21
Yearly changes in stocks to use and prices Maize
Source: World Bank, USDA
-40%
-30%
-20%
-10%
0%
10%
20%
30%
40%
50%
60%
1961-6
2
1963-6
4
1965-6
6
1967-6
8
1969-7
0
1971-7
2
1973-7
4
1975-7
6
1977-7
8
1979-8
0
1981-8
2
1983-8
4
1985-8
6
1987-8
8
1989-9
0
1991-9
2
1993-9
4
1995-9
6
1997-9
8
1999-0
0
2001-0
2
2003-0
4
2005-0
6
2007-0
8
2009-1
0
2011-1
2
Change in World prices Change in stocks to use
22
Yearly changes in stocks to use and prices Wheat
Source: World Bank, USDA
-40%
-30%
-20%
-10%
0%
10%
20%
30%
40%
50%
60%
70%
80%
1961-6
2
1963-6
4
1965-6
6
1967-6
8
1969-7
0
1971-7
2
1973-7
4
1975-7
6
1977-7
8
1979-8
0
1981-8
2
1983-8
4
1985-8
6
1987-8
8
1989-9
0
1991-9
2
1993-9
4
1995-9
6
1997-9
8
1999-0
0
2001-0
2
2003-0
4
2005-0
6
2007-0
8
2009-1
0
2011-1
2
Change in World prices Change in stocks to use
23
Yearly changes in stocks to use and prices Soybeans
Source: World Bank, USDA
-60%
-40%
-20%
0%
20%
40%
60%
80%
100%
120%
1961-6
2
1963-6
4
1965-6
6
1967-6
8
1969-7
0
1971-7
2
1973-7
4
1975-7
6
1977-7
8
1979-8
0
1981-8
2
1983-8
4
1985-8
6
1987-8
8
1989-9
0
1991-9
2
1993-9
4
1995-9
6
1997-9
8
1999-0
0
2001-0
2
2003-0
4
2005-0
6
2007-0
8
2009-1
0
2011-1
2
Change in World prices Change in stocks to use
24
Yearly changes in stocks to use and prices Rice
Source: World Bank, USDA
-60%
-40%
-20%
0%
20%
40%
60%
80%
100%
1961-6
2
1963-6
4
1965-6
6
1967-6
8
1969-7
0
1971-7
2
1973-7
4
1975-7
6
1977-7
8
1979-8
0
1981-8
2
1983-8
4
1985-8
6
1987-8
8
1989-9
0
1991-9
2
1993-9
4
1995-9
6
1997-9
8
1999-0
0
2001-0
2
2003-0
4
2005-0
6
2007-0
8
2009-1
0
2011-1
2
Change in World prices Change in stocks to use
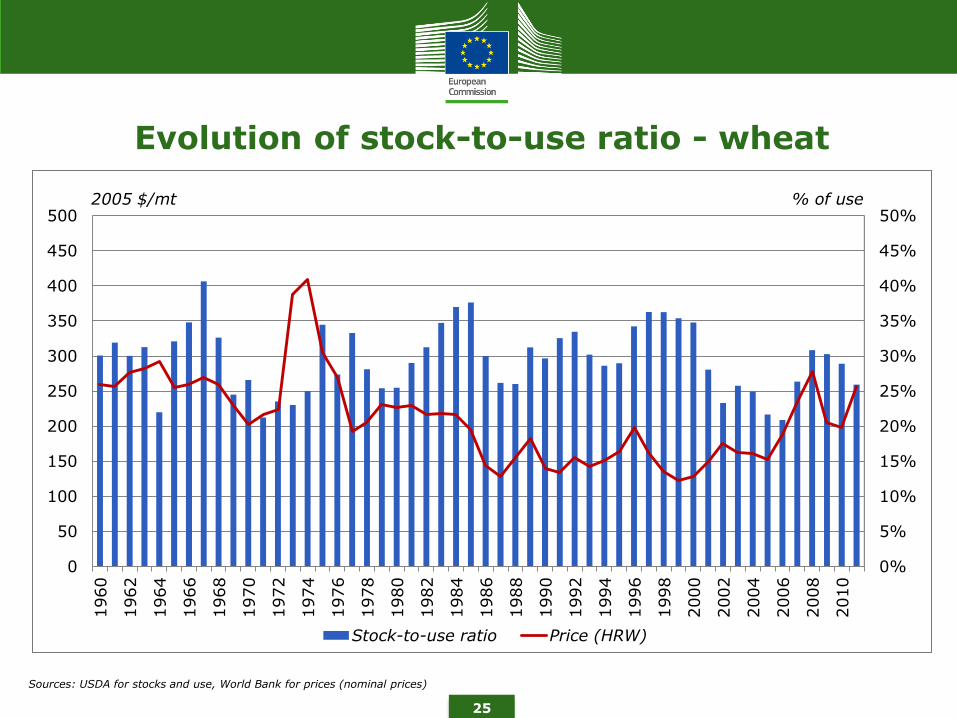
Evolution of stock-to-use ratio - wheat
0
50
100
150
200
250
300
350
400
450
500
1960
1962
1964
1966
1968
1970
1972
1974
1976
1978
1980
1982
1984
1986
1988
1990
1992
1994
1996
1998
2000
2002
2004
2006
2008
2010
0%
5%
10%
15%
20%
25%
30%
35%
40%
45%
50%2005 $/mt % of use
Stock-to-use ratio Price (HRW)
25
Sources: USDA for stocks and use, World Bank for prices (nominal prices)
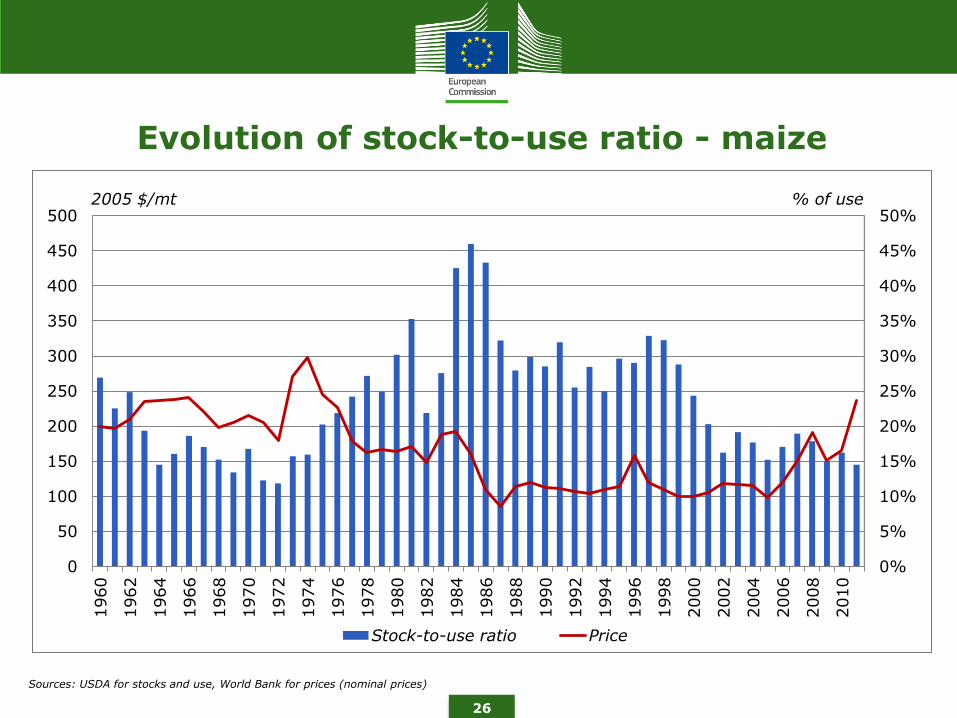
Evolution of stock-to-use ratio - maize
0
50
100
150
200
250
300
350
400
450
500
1960
1962
1964
1966
1968
1970
1972
1974
1976
1978
1980
1982
1984
1986
1988
1990
1992
1994
1996
1998
2000
2002
2004
2006
2008
2010
0%
5%
10%
15%
20%
25%
30%
35%
40%
45%
50%2005 $/mt % of use
Stock-to-use ratio Price
26
Sources: USDA for stocks and use, World Bank for prices (nominal prices)
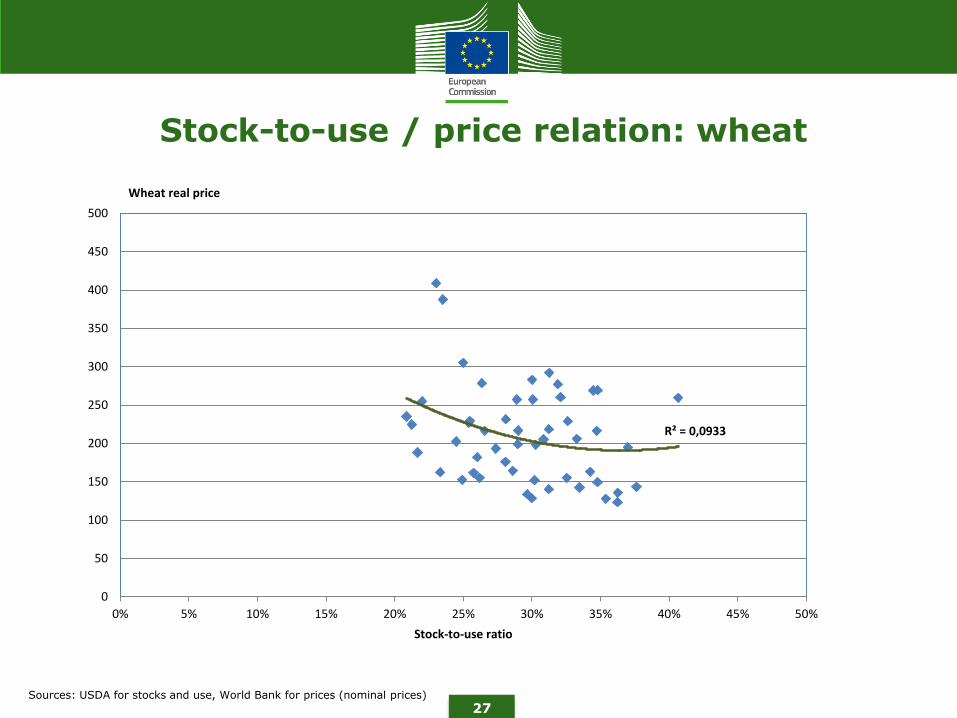
Stock-to-use / price relation: wheat
27 Sources: USDA for stocks and use, World Bank for prices (nominal prices)
R² = 0,0933
0
50
100
150
200
250
300
350
400
450
500
0% 5% 10% 15% 20% 25% 30% 35% 40% 45% 50%
Stock-to-use ratio
Wheat real price

Stock-to-use / price relation: maize
28 Sources: USDA for stocks and use, World Bank for prices (nominal prices)
R² = 0,3448
0
50
100
150
200
250
300
350
400
450
500
0% 5% 10% 15% 20% 25% 30% 35% 40% 45% 50%
Stock-to-use ratio
Maize real price

29
What matters most for what prices?
Source: World Bank Global Economic Prospects January 2012 – Commodity Annex

30
Ongoing research: are there distortions?
Spot market
Futures market
Options market
Convergence close to maturity
• High frequency volatility estimation
• Historical vs risk neutral measure for put&call pricing

31
Implications
• Higher prices for agricultural commodities will not necessarily result in higher income for farmers, especially if their margins are squeezed by increased costs
• With higher output prices expected, there is less and less scope for "traditional" intervention tools, such as price support
• Excessive price volatility affects profitability and hinders investments in the agricultural sector
• Ad-hoc policy intervention in agriculture to address volatility may be questionable if volatility is "imported" from outside agriculture
Related Documents