Price Projections For Selected Grades of Douglas-fir Lumber United States Department of Agriculture Forest Service Pacific Northwest esearch Station R Research Note PNW-RN-473 May 1988 Richard W. Haynes, Thomas D. Fahey, and Roger D. Fight Abstract Introduction Grade-specific price projections were developed for Douglas-fir lumber produced in the Douglas-fir region. These grade-specific price projections can be used as an aid in evaluating management practices that will affect the quality of saw logs that are produced. Keywords: Lumber prices, Douglas-fir. A comprehensive analysis of silvicultural decisions requires that differences in timber quality be recognized, differences both in the value of products produced and in the costs of producing those products. Acknowledgment of these differences results in a financial evaluation of silvicultural decisions that recognizes the importance of price and cost effects. The available data for product prices by grade for Douglas-fir {Pseudotsuga menziesii (Mirb.) Franco) are either summarized in a way that is not desirable for financial evaluation or detailed in so many categories that analysts have difficulty understanding and using the data. The financial evaluations for silvicultural decisions are also difficult to make because of their long-term nature; evaluations require projections of prices for 30 or more years, and no such projections of Douglas-fir product prices by grade have been published. The purpose of this note is to rectify these problems for Douglas-fir lumber prices. To do this, we first combined the detailed lumber prices into meaningful grade cate- gories. We then disaggregated existing projections of Douglas-fir lumber prices into these grade categories. The aggregation of the numerous grades into a workable set of grade categories is a principal issue in developing grade-specific prices for lumber. These categories must be relevant to the analytical requirements for assessing the financial effects of forest management decisions that affect quality of saw logs. Forest management decisions can affect the quality of saw logs by changing the relative proportions of lumber in different grades that can be sawn from the logs. Shifts between grades of similar value have little effect on total value. Hence, grades of similar value can be com- bined into one category unless a divergence in their relative values is expected in the future. For example, over the period 1971-86 the prices of D selects and shops have consistently moved together. In this analysis, we combined these grades into the same grade category. Grades with dissimilar values can be combined if the relative volumes in those grades do not vary with the management decisions being evalu- ated. Guidelines such as these were used to compress the number of grades to seven categories. RICHARD W. HAYNES, THOMAS D. FAHEY, and ROGER D. FIGHT are research foresters, Forestry Sciences Laboratory, P.O. Box 3890, Portland, Oregon 97208. 1

Welcome message from author
This document is posted to help you gain knowledge. Please leave a comment to let me know what you think about it! Share it to your friends and learn new things together.
Transcript
Price Projections For Selected Grades of Douglas-fir Lumber
United States Department of Agriculture Forest Service Pacific Northwest
esearch Station R Research Note PNW-RN-473 May 1988
Richard W. Haynes, Thomas D. Fahey, and Roger D. Fight
Abstract
Introduction
Grade-specific price projections were developed for Douglas-fir lumber produced in the Douglas-fir region. These grade-specific price projections can be used as an aid in evaluating management practices that will affect the quality of saw logs that are produced.
Keywords: Lumber prices, Douglas-fir.
A comprehensive analysis of silvicultural decisions requires that differences in timber quality be recognized, differences both in the value of products produced and in the costs of producing those products. Acknowledgment of these differences results in a financial evaluation of silvicultural decisions that recognizes the importance of price and cost effects. The available data for product prices by grade for Douglas-fir {Pseudotsuga menziesii (Mirb.) Franco) are either summarized in a way that is not desirable for financial evaluation or detailed in so many categories that analysts have difficulty understanding and using the data. The financial evaluations for silvicultural decisions are also difficult to make because of their long-term nature; evaluations require projections of prices for 30 or more years, and no such projections of Douglas-fir product prices by grade have been published.
The purpose of this note is to rectify these problems for Douglas-fir lumber prices. To do this, we first combined the detailed lumber prices into meaningful grade cate-gories. We then disaggregated existing projections of Douglas-fir lumber prices into these grade categories.
The aggregation of the numerous grades into a workable set of grade categories is a principal issue in developing grade-specific prices for lumber. These categories must be relevant to the analytical requirements for assessing the financial effects of forest management decisions that affect quality of saw logs. Forest management decisions can affect the quality of saw logs by changing the relative proportions of lumber in different grades that can be sawn from the logs. Shifts between grades of similar value have little effect on total value. Hence, grades of similar value can be com-bined into one category unless a divergence in their relative values is expected in the future. For example, over the period 1971-86 the prices of D selects and shops have consistently moved together. In this analysis, we combined these grades into the same grade category. Grades with dissimilar values can be combined if the relative volumes in those grades do not vary with the management decisions being evalu-ated. Guidelines such as these were used to compress the number of grades to seven categories.
RICHARD W. HAYNES, THOMAS D. FAHEY, and ROGER D. FIGHT are research foresters, Forestry Sciences Laboratory, P.O. Box 3890, Portland, Oregon 97208.
1
Clay Ramsdell
USDA-DISCLAIM
Data And Method Two main sources of data were used in this study. First, historical data on Douglas-fir lumber production and prices were obtained from Western Wood Products Associa- tion (1986) reports. The second source of data was projections of lumber prices.
The data from the Western Wood Products Association was compiled into seven grade categories: C selects, D selects and shop, structural items, utility, light framing, heavy framing, and economy. Compiling the grades into these final groupings was a matter of assessing probable end use of the lumber and of combining items with similar end uses and price patterns. Appearance grades were combined into two classes. The high-valued export clears and C and better selects were grouped into the C select, whereas D select and shops were put into another group.
The largest single group of Douglas-fir lumber is light framing; it includes stud grade, standard and better random-length light framing, and 2 by 6 and 2 by 8 structural joists and planks. These items are most affected by the housing market and are in competition with all other species groups. Structural items include laminating stock, machine stress rated (MSR) lumber, scaffold plank, crossarms, and select structural and number 1 beams and timbers. This material is graded for strength properties and is sold in a specific market where other species or products are not as competitive. Heavy framing includes number 2 and better, 2 by 10 and wider structural joist and plank, beams, timbers, mine timbers, and railroad ties. These items are produced from the same quality of log as light framing but require a large log to produce them efficiently.
Utility and economy are produced mostly in 2 by 6 and smaller pieces, but all sizes were grouped for each grade. The appendix shows the individual grades that went into each of these grade categories.
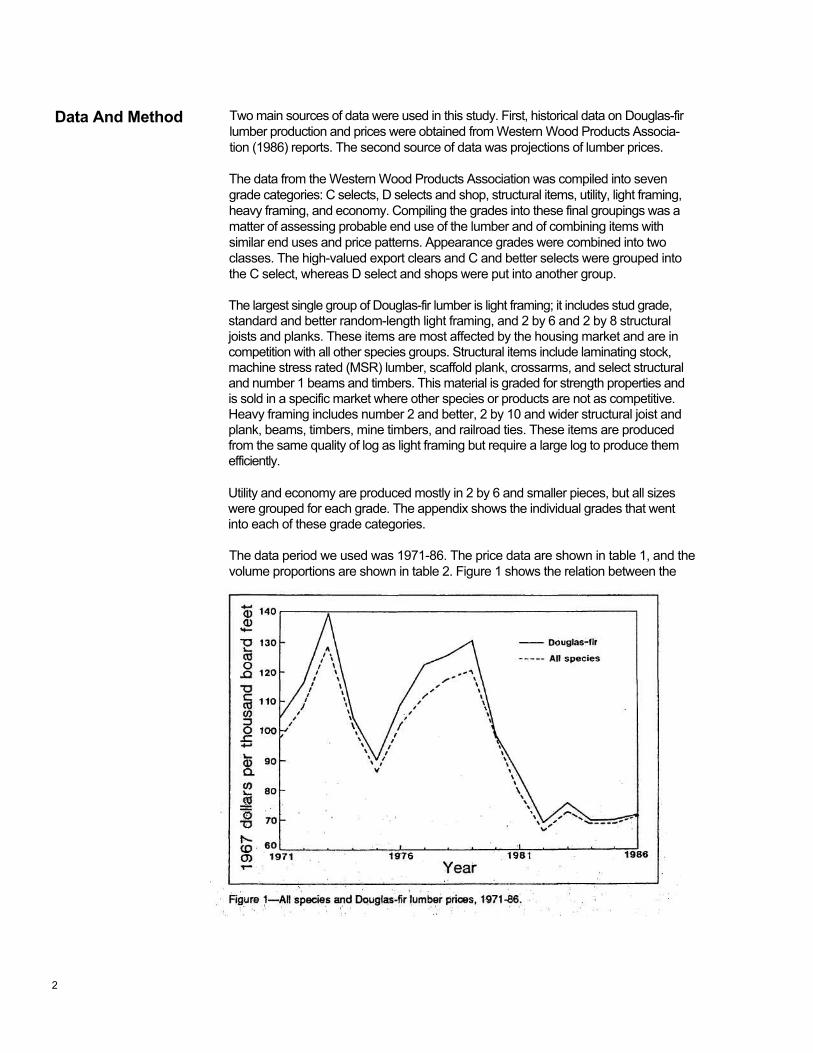
The data period we used was 1971-86. The price data are shown in table 1, and the volume proportions are shown in table 2. Figure 1 shows the relation between the
2

weighted average of all Douglas-fir prices (st) and the all-species regional average (Pt). During the data period, Douglas-fir lumber prices averaged 5.2 percent more than the all-species average. This price premium for Douglas-fir lumber persisted through the late 1970's but since 1980 has diminished and now averages 2.8 percent.
Table 1—Douglas-fir prices by lumber grade, 1971-86
Table 2—Historical production proportions of Douglas-fir lumber by grade, 1971-86
3
4
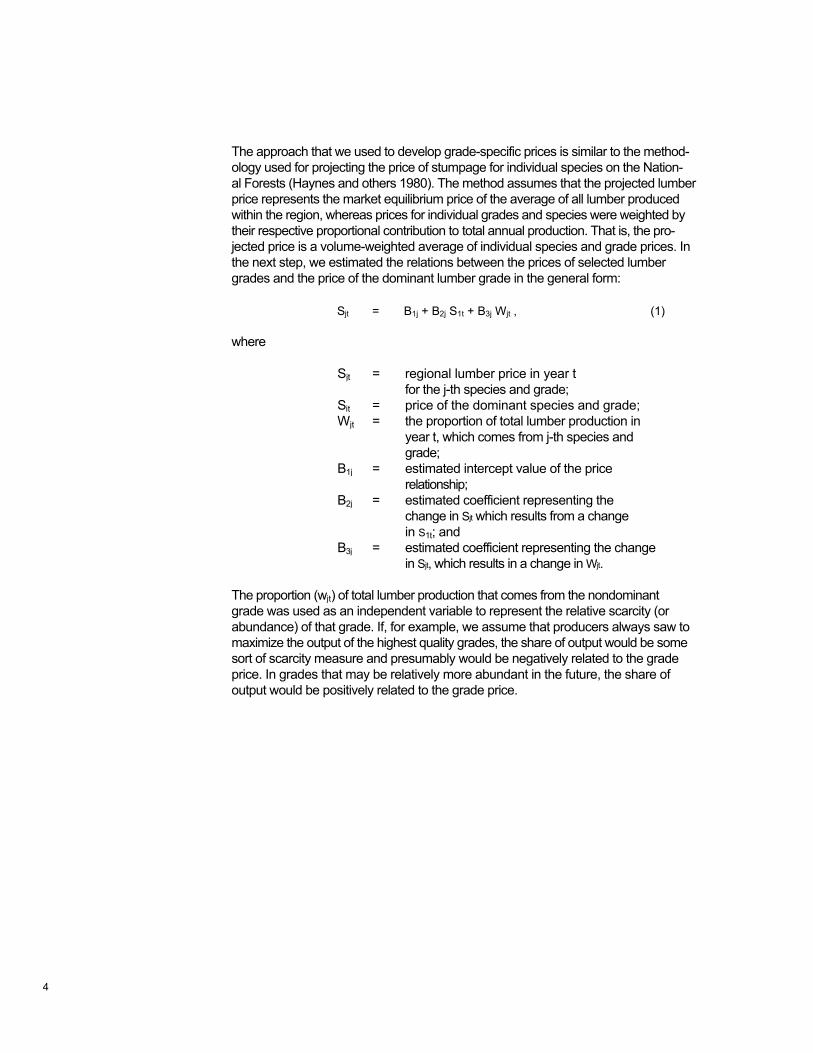
The approach that we used to develop grade-specific prices is similar to the method- ology used for projecting the price of stumpage for individual species on the Nation- al Forests (Haynes and others 1980). The method assumes that the projected lumber price represents the market equilibrium price of the average of all lumber produced within the region, whereas prices for individual grades and species were weighted by their respective proportional contribution to total annual production. That is, the pro- jected price is a volume-weighted average of individual species and grade prices. In the next step, we estimated the relations between the prices of selected lumber grades and the price of the dominant lumber grade in the general form:
Sjt = B1j + B2j S1t + B3j Wjt , (1)
where
Sjt = regional lumber price in year t for the j-th species and grade;
Sit = price of the dominant species and grade; Wjt = the proportion of total lumber production in
year t, which comes from j-th species and grade;
B1j = estimated intercept value of the price relationship;
B2j = estimated coefficient representing the change in Sjt which results from a change in S1t; and
B3j = estimated coefficient representing the change in Sjt, which results in a change in Wjt.
The proportion (wjt) of total lumber production that comes from the nondominant grade was used as an independent variable to represent the relative scarcity (or abundance) of that grade. If, for example, we assume that producers always saw to maximize the output of the highest quality grades, the share of output would be some sort of scarcity measure and presumably would be negatively related to the grade price. In grades that may be relatively more abundant in the future, the share of output would be positively related to the grade price.

If we assume that these estimated relationships hold for the projection period, then the predicted price for each grade can be developed from a projection of the price for the dominant grade. The relationship between the price for the dominant grade (s1t) and the all-grade average Douglas-fir price is given by: where
St = regional Douglas-fir lumber price for year t and W1t = the proportion of total lumber production in
year t, which comes from the dominant species and grade.
The data in tables 1 and 2 were used both to develop the relationships between individual grade prices and the price of the dominant grade and to develop the trends in shares of production by grade. The data in table 1 were used to estimate relation- ships of the form shown in equation 1. The light-framing category was selected as being the dominant grade. This category has accounted for roughly 40 percent of total production for the 15 years covered by the data set. Given its volume, prices for light framing closely follow the average price for Douglas-fir lumber.
The estimated relationships between prices are shown in table 3. The estimated forms of most equations differed from the general form shown in equation 1.1For most grades, the share of total lumber was not a significant variable, which reflects among other things the relative stability of shares during the sample period. This was not the case for the two higher quality grades for which the B3 coefficients were sig- nificant and had signs consistent with the individual trends in production shares. In three of the equations, the constant terms were also insignificant, implying that those grade prices were some constant proportion of the price for the dominant grade. Finally, the original equations for structural items and heavy framing were corrected for dependencies in the error structures of the equations. Theil (1971) describes this problem and the correction process.
1These equations were also estimated as a system of equations to see if partial correlation between the co-efficients would result in different price projections. This general approach is called "seemingly unrelated regres-sions" and is described by Theil (1971). The resulting system produced the same estimated prices for 2030 as did the individually estimated equations. Individual equa tions of the system also exhibited some of the same serial correlation problems as did the individually estimated equations. We used the individually estimated equations in this study because they allow correction for serial correlation.
5
6
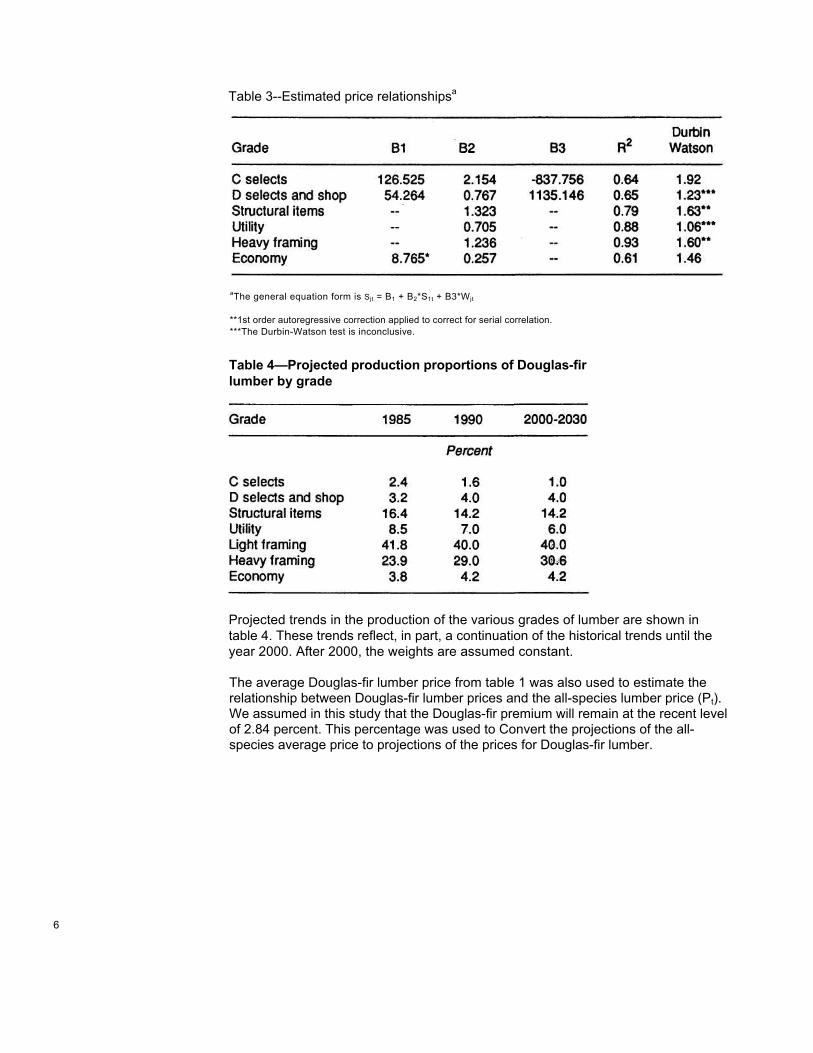
Table 3--Estimated price relationshipsa
aThe general equation form is Sjt = B1 + B2*S + B3*Wjt 1t
*Significant at less than the 95-percent level. **1st order autoregressive correction applied to correct for serial correlation. ***The Durbin-Watson test is inconclusive.
Table 4—Projected production proportions of Douglas-fir lumber by grade
Projected trends in the production of the various grades of lumber are shown in table 4. These trends reflect, in part, a continuation of the historical trends until the year 2000. After 2000, the weights are assumed constant.
The average Douglas-fir lumber price from table 1 was also used to estimate the relationship between Douglas-fir lumber prices and the all-species lumber price (Pt). We assumed in this study that the Douglas-fir premium will remain at the recent level of 2.84 percent. This percentage was used to Convert the projections of the all-species average price to projections of the prices for Douglas-fir lumber.
Results
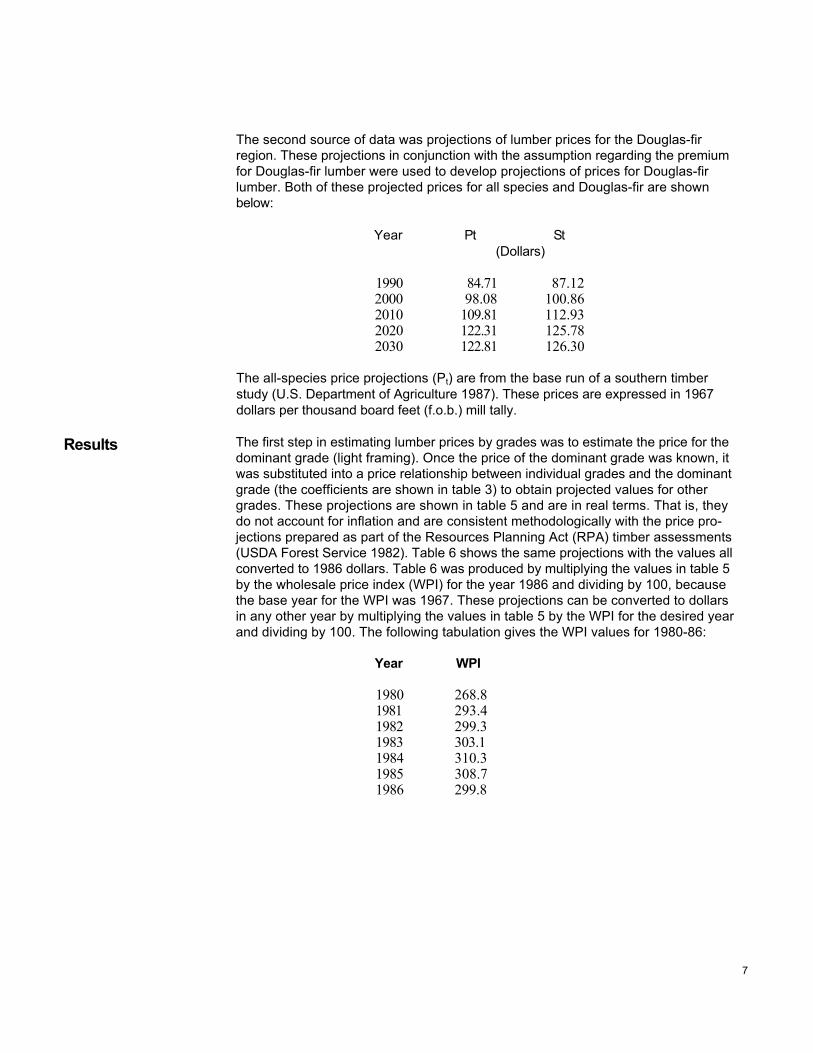
The second source of data was projections of lumber prices for the Douglas-fir region. These projections in conjunction with the assumption regarding the premium for Douglas-fir lumber were used to develop projections of prices for Douglas-fir lumber. Both of these projected prices for all species and Douglas-fir are shown below:
Year Pt St (Dollars)
1990 84.71 87.12 2000 98.08 100.86 2010 109.81 112.93 2020 122.31 125.78 2030 122.81 126.30
The all-species price projections (Pt) are from the base run of a southern timber study (U.S. Department of Agriculture 1987). These prices are expressed in 1967 dollars per thousand board feet (f.o.b.) mill tally.
The first step in estimating lumber prices by grades was to estimate the price for the dominant grade (light framing). Once the price of the dominant grade was known, it was substituted into a price relationship between individual grades and the dominant grade (the coefficients are shown in table 3) to obtain projected values for other grades. These projections are shown in table 5 and are in real terms. That is, they do not account for inflation and are consistent methodologically with the price pro-jections prepared as part of the Resources Planning Act (RPA) timber assessments (USDA Forest Service 1982). Table 6 shows the same projections with the values all converted to 1986 dollars. Table 6 was produced by multiplying the values in table 5 by the wholesale price index (WPI) for the year 1986 and dividing by 100, because the base year for the WPI was 1967. These projections can be converted to dollars in any other year by multiplying the values in table 5 by the WPI for the desired year and dividing by 100. The following tabulation gives the WPI values for 1980-86:
Year WPI
1980 268.8 1981 293.4 1982 299.3 1983 303.1 1984 310.3 1985 308.7 1986 299.8
7

8
Table 5—Historical and projected Douglas-fir lumber prices by lumber grade in 1967 dollars, 1971-2030
Table 6—Historical and projected Douglas-fir lumber prices by grade in 1986 dollars, 1971-2030
The prices in 1986 dollars for various grades of Douglas-fir lumber for 1986 and 2030 and the annual rates of price growth for the same grades of Douglas-fir lumber for the period 1986-2030 are shown below:

References
Appendix
Douglas-fir lumber is expected to maintain its price premium relative to other species. Among the Douglas-fir lumber grades, C selects and D selects and shops are ex-pected to maintain the highest prices. In general, the prices of C selects, structural items, and heavy framing all increase relative to light framing. The price premium (relative to light framing) for D selects and shop is expected to remain constant in real terms at roughly $220. Expected increases for Douglas-fir utility and economy lumber are less than that expected for all species.
The highest rates of price growth are for heavy framing and structural items. This latter grade also experiences the largest increases in proportion of production (table 4).
These results reinforce the intuitive argument that the increased scarcity of high-quality material and the increasing reliance on Douglas-fir for heavy timbers and structural items will result in higher than average price increases in those items and lower than average price increase for low-grade material. These increases strengthen the incentives to stumpage producers to modify management regimes to improve the quality of logs produced.
Haynes, Richard W.; Connaughton, Kent P.; Adams, Darius M. 1980. Stumpage price projections for selected western species. Res. Note PNW-367. Portland, OR: U.S. Department of Agriculture, Forest Service, Pacific Northwest Forest and Range Experiment Station. 14 p.
Thell, Henri. 1971. Principles of econometrics. New York: John Wiley & Sons. 736 p.
U.S. Department of Agriculture, Forest Service. 1982. An analysis of the timber situation in the United States: 1952-2030. For. Resour. Rep. 23. Washington, DC. 499 p.
U.S. Department of Agriculture. 1987. The South's fourth forest: alternatives for the future. For. Resour. Rep. 24 Washington, DC. 365 p.
Western Wood Products Association. 1986. Price summary past sales. Portland, OR: Western Wood Products Association. Monthly.
Grouping Grades and Items combined In group
C select C select; export clears D select and shop D select; D and better; all shop grades Structural items All laminating stock; all machine stress rated
lumber; 2-inch select structural, 2-inch number 1, 3-inch and thicker select structural; crossarms; scaffold planks; export commons
Heavy framing 2 by 10 and wider number 2 and better; 3-inch and thicker number 2 and better; ties
9
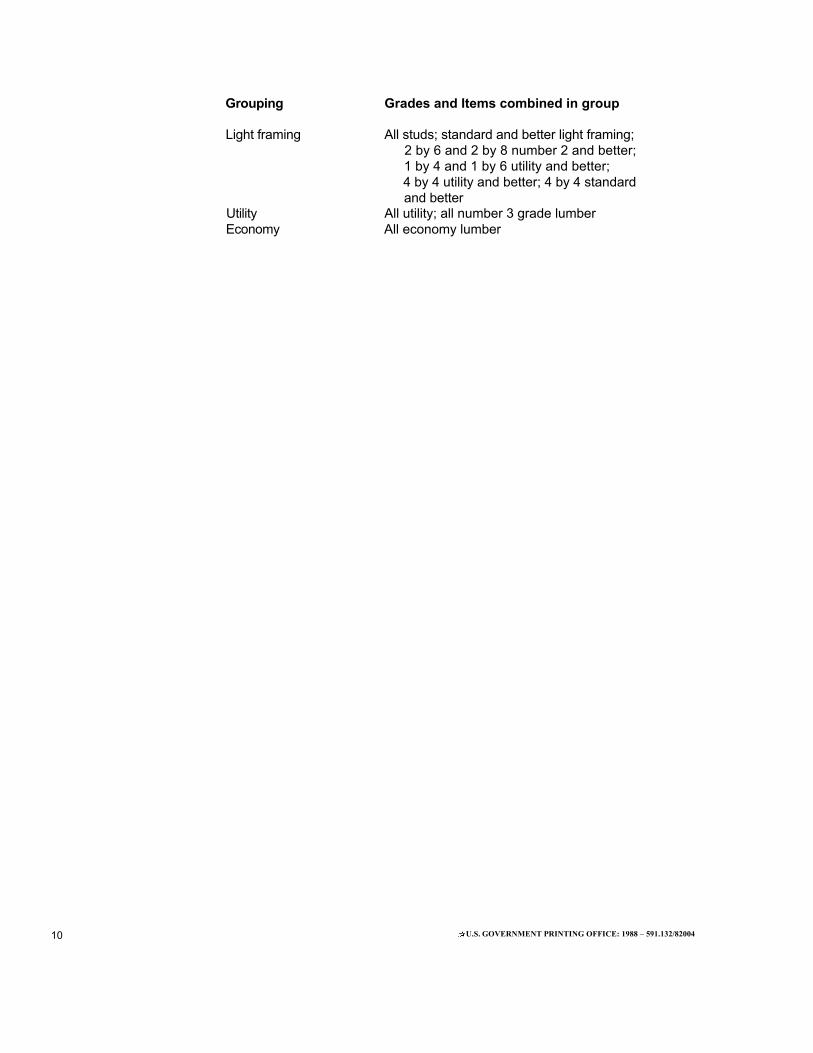
Grouping Grades and Items combined in group
Light framing All studs; standard and better light framing; 2 by 6 and 2 by 8 number 2 and better; 1 by 4 and 1 by 6 utility and better; 4 by 4 utility and better; 4 by 4 standard and better
Utility All utility; all number 3 grade lumber Economy All economy lumber
10 U.S. GOVERNMENT PRINTING OFFICE: 1988 – 591.132/82004
The Forest Service of the U.S. Department of Agriculture is dedicated to the principle of multiple use management of the Nation's forest resources for sustained yields of wood, water, forage, wildlife, and recreation. Through forestry research, cooperation with the States and private forest owners, and management of the National Forests and National Grasslands, it strives — as directed by Congress — to provide increasingly greater service to a growing Nation. The U.S. Department of Agriculture is an Equal Opportunity Employer. Applicants for all Department programs will be given equal consideration without regard to age, race, color, sex, religion, or national origin.
Pacific Northwest Research Station 319 S.W. Pine St. P.O. Box 3890 Portland, Oregon 97208

U.S. Department of Agriculture Pacific Northwest Research Station 319 S.W. Pine Street P.O. BOX 3890 Portland, Oregon 97208
BULK RATE POSTAGE + FEES PAID USDA-FS
PERMIT No. G-40
Official Business Penalty for Private Use, $300
do NOT detach label
Related Documents