See end of the paper for authors’ affiliations Correspondence to : K.C. Gummagolmath National Institute of Agricultural Extension Management, (MANAGE), Hyderabad ( Telangana) India Email: kcgum123@gmail. com ABSTRACT : Onion is an important vegetable crop grown and consumed widely across the world. Even though India is the second largest producer of onion, its production in 2019 is nearly halved in comparison to 2018. There is a deficit of about 40 per cent in onion supply and hence supply is unable to cope up with the demand which resulted in the skyrocketing of prices. It is learnt that the prices of onion were hovering around Rs. 100 per kg. The sudden rise in prices of onion can be attributed to reduced sowings on account of delayed monsoons followed by excessive rainfall, mainly during harvesting season. Moreover, as per the media reports, few onion traders are trying to make a short term gain by creating artificial scarcity. The sharp rise in prices can be checked by releasing the stock available with the government agencies in short run and there is a dire need for a long term policy for stabilization of onion prices. KEY WORDS : Prices, Scarcity, Stabilization, Trends HOW TO CITE THIS PAPER : Gummagolmath, K.C., Lakshmi, S.B. Ramya, Patra, Priyanka and Ronitha, A. (2020). Price instability of onion in India – An analysis. Internat. Res. J. Agric. Eco. & Stat., 11 (1) : 1-11, DOI : 10.15740/HAS/IRJAES/11.1/1-11. Copyright@2020:Hind Agri-Horticultural Society. Paper History : Received : 04.01.2020; Revised : 01.02.2020; Accepted : 08.02.2020 Price instability of onion in India – An analysis K.C. Gummagolmath, S.B. Ramya Lakshmi, Priyanka Patra and A. Ronitha Research Paper HIND AGRICULTURAL RESEARCH AND TRAINING INSTITUTE INTRODUCTION : Off late, the ghost of rising prices of food articles, vegetables in particular is again haunting the policy makers. A delay in arrival of monsoon and result of widespread excess rainfall, thereafter, has created a chaos in Indian agriculture more specifically rise in prices of vegetables. Among the vegetables, onion is one such vegetable which is catching the attention of all stakeholders as it is an invariable part of dietary system of every household in the country. It also plays an important role in earning foreign exchange due to increased exports in the recent decades, owing to increased production and higher demand in the international market. Onion is one of the most market sensitive commodities that creates ripples in the trade as International Research Journal of Agricultural Economics and Statistics Visit us - www.researchjournal.co.in DOI : 10.15740/HAS/IRJAES/11.1/1-11 Volume 11 | Issue 1 | March, 2020 | 1-11 ISSN-2229-7278 well as in political arena. Its significant position in the diets across all income groups and an important ingredient in many Indian recipes, causes wide ranging effects if there is any significant change in price. It is the poor and the lower middle class who are hit hard in the event of rise inprice and so also the middle class. And at the same time, during rise in the price, though farmers are getting benefitted, but producer share in consumer rupee was least due to presence of long chain of intermediaries (Gummagolmath, 2013). High price variability in case of primary products affects both producers as well as consumers through a spill over effect to the other sectors, thereby leading to high inflation in the economy. Onions have a weight of 0.6 per cent in the overall inflation and contribute about 10 per cent to the change in inflation of vegetable basket. Thus, it is a major concern if any change

Welcome message from author
This document is posted to help you gain knowledge. Please leave a comment to let me know what you think about it! Share it to your friends and learn new things together.
Transcript
See end of the paper forauthors’ affiliationsCorrespondence to :
K.C. GummagolmathNational Institute ofAgricultural ExtensionManagement, (MANAGE),Hyderabad (Telangana)IndiaEmail: [email protected]
ABSTRACT : Onion is an important vegetable crop grown and consumed widely across the world.Even though India is the second largest producer of onion, its production in 2019 is nearly halved incomparison to 2018. There is a deficit of about 40 per cent in onion supply and hence supply is unableto cope up with the demand which resulted in the skyrocketing of prices. It is learnt that the prices ofonion were hovering around Rs. 100 per kg. The sudden rise in prices of onion can be attributed toreduced sowings on account of delayed monsoons followed by excessive rainfall, mainly duringharvesting season. Moreover, as per the media reports, few onion traders are trying to make a shortterm gain by creating artificial scarcity. The sharp rise in prices can be checked by releasing the stockavailable with the government agencies in short run and there is a dire need for a long term policy forstabilization of onion prices.
KEYWORDS : Prices, Scarcity, Stabilization, Trends
HOW TO CITE THIS PAPER : Gummagolmath, K.C., Lakshmi, S.B. Ramya, Patra, Priyanka and Ronitha, A.(2020). Price instability of onion in India – An analysis. Internat. Res. J. Agric. Eco. & Stat., 11 (1) : 1-11, DOI: 10.15740/HAS/IRJAES/11.1/1-11. Copyright@2020:Hind Agri-Horticultural Society.
Paper History :Received : 04.01.2020;Revised : 01.02.2020;Accepted : 08.02.2020
Price instability of onion in India – An analysis
K.C. Gummagolmath, S.B. Ramya Lakshmi, Priyanka Patra and A. Ronitha
Research Paper
HIND AGRICULTURAL RESEARCH AND TRAINING INSTITUTE
INTRODUCTION :
Off late, the ghost of rising prices of food articles,vegetables in particular is again haunting the policymakers. A delay in arrival of monsoon and result ofwidespread excess rainfall, thereafter, has created achaos in Indian agriculture more specifically rise in pricesof vegetables. Among the vegetables, onion is one suchvegetable which is catching the attention of allstakeholders as it is an invariable part of dietary systemof every household in the country. It also plays animportant role in earning foreign exchange due toincreased exports in the recent decades, owing toincreased production and higher demand in theinternational market. Onion is one of the most marketsensitive commodities that creates ripples in the trade as
International Research Journal of Agricultural Economics and Statistics
Visit us - www.researchjournal.co.in DOI : 10.15740/HAS/IRJAES/11.1/1-11
Volume 11 | Issue 1 | March, 2020 | 1-11 ISSN-2229-7278
well as in political arena. Its significant position in thediets across all income groups and an important ingredientin many Indian recipes, causes wide ranging effects ifthere is any significant change in price. It is the poor andthe lower middle class who are hit hard in the event ofrise inprice and so also the middle class. And at the sametime, during rise in the price, though farmers are gettingbenefitted, but producer share in consumer rupee wasleast due to presence of long chain of intermediaries(Gummagolmath, 2013). High price variability in case ofprimary products affects both producers as well asconsumers through a spill over effect to the other sectors,thereby leading to high inflation in the economy. Onionshave a weight of 0.6 per cent in the overall inflation andcontribute about 10 per cent to the change in inflation ofvegetable basket. Thus, it is a major concern if any change
HIND AGRICULTURAL RESEARCH AND TRAINING INSTITUTEInternat. Res. J. Agric. Eco.& Stat., 11 (1) Mar., 2020 :2
in the onion prices for the politicians, policy makers andexperts. Among the agricultural products, prices of onionsare more volatile than other vegetables due to low priceand income elasticity and inherently unstable production.Additionally, market inefficiencies, hoarding of stocks (asreported by Competition Commission of India, 2012),weak supply chains and traders cartels in the market arealso responsible for fluctuations in the onion prices.
It all started with skyrocketing of prices for the firsttime in the year 1998 due to low production on accountof drought in the major producing states. Besides, duringthe same period, the Indian onion witnessed high demandin the international market and hence, Government ofIndia came up with a policy of Minimum Export Price(MEP) for promoting and regulating exports of onion.
This scenario of skyrocketing of prices was repeatedafter a gap of seven years i.e. in the year 2005 and thirdtime with an interval of another five years in 2010.Thereafter almost every alternate year, volatility in onionprices was noticed across major markets in the country.
Hence an attempt has been made in this study toascertain the reasons for such an unruly behaviour ofonion prices in the country.
MATERIALS AND METHODS :
Study area :In this study, major onion producing states and
marketing centres located in Maharashtra, Karnataka,Rajasthan and Tamil Nadu in India were selected foranalysing the arrival pattern, price trend and its volatilityin major markets for the time period of 2000 to 2019.
Sources of data:For understanding the Indian scenario of onion crop,
data pertaining to area, production and yield in majorproducing states in India for the years of high prices i.e.2005, 2011, 2013, 2015-19 were collected fromDirectorate of Economics and Statistics (DES) andState’s Season Crop Reports. Information on Indian onionexports for various periods from 1950-51 to 2017-18,were collected from Directorate General of CommercialIntelligence and Statistics (DGCIS), Agricultural andProcessed food Products Export Development Authority(APEDA) and National Agricultural Co-operativeMarketing Federation of India Ltd. (NAFED).
In order to analyse the trend in arrivals and prices,
monthly wholesale prices and arrivals during 2010 to 2019in major markets in India were also collected fromNational Horticultural Research and DevelopmentFoundation (NHRDF) official website. Monthly retailprices for the year 2019 were collected from NationalHorticultural Board (NHB) to analyse the retail mark-up. The data collected from different sources wasanalysed by using suitable quantitative statistical methods.
Data analysis:– For studying the growth in area and production of
onion in India during various periods in major producingstates, percentages were calculated.
– For analysing the seasonal trends in prices, arrivalsseasonal indices were calculated using wholesale pricesand arrivals in seven major markets in India.
– Co-efficient of variations were worked out to studythe volatility in prices in different periods using theformula:
x100C.V.AMSD
where, SD = Standard deviation, AM = Arithmeticmean of the prices.
Present scenario:India is the second largest producer of onion in the
world next to China with a share of 22.92 per cent during2017-18 as compared to 19 per cent during 2008-09. InIndia, onion is largely grown in the western, southernand northern parts both in Rabi and Kharif seasons. Itssupply is available throughout the year albeit with differentvolumes. India produces all three varieties of onion –red, yellow and white.
It is cultivated in almost all the states in the countryand the major producing states are Maharashtra,Karnataka, Madhya Pradesh, Gujarat, Rajasthan, AndhraPradesh, Uttar Pradesh, Odisha and Tamil Nadu.Maharashtra is the leading producer of onion in thecountry accounting for 30.03 per cent of total productionfollowed by Madhya Pradesh (16.59 %), Karnataka(13.60 %) and Gujarat (5.2%) (2016-17). All Indiaproduction during 2017-18 was 12 per cent higher ascompared to the past five years. In spite of increase inproduction over a period of time, onion is subjected tohigh volatility in terms of prices due to various reasonslike change in arrival pattern, weather conditions, exportpolicies, artificial hoarding by the market functionariesetc.
K.C. Gummagolmath, S.B. Ramya Lakshmi, Priyanka Patra and A. Ronitha
1-11

HIND AGRICULTURAL RESEARCH AND TRAINING INSTITUTEInternat. Res. J. Agric. Eco.& Stat., 11 (1) Mar., 2020 : 3
RESULTSAND DATA ANALYSIS :
The results obtained from the present investigationas well as relevant discussion have been summarizedunder following heads :
Area, production and productivity of onions in India:Onion is grown in all the three seasons i.e. Kharif
(summer), late Kharif and Rabi (winter) ensuring yearround availability. In the northern part of the country, onionis usually grown in the winter (Rabi) season. However,in the southern and western states of Andhra Pradesh,
Table 1: State wise area, production and yield of onions in India -Major statesState/UT 2005 2011 2013 2015 2016 2017 % change over previous year
Area ('000 Ha)
Maharashtra 177 382 468 522.4 481.1 508 5.59
Madhya Pradesh 76 177.2 117.3 118.2 150.8 150.9 0.07
Karnataka 151 88.1 136.6 190.2 217.8 195.3 -10.33
Bihar 36 61.3 72.8 86.3 51.6 53.8 4.26
Rajasthan 37.8 53.8 54.3 53.2 54.1 64.8 19.78
Andhra Pradesh 44.5 48.5 55.8 54 62.5 42 -32.80
Haryana 25.5 73.5 57.5 45 41.7 29.9 -28.30
Gujarat 15.5 27.5 30.2 34 31 22.5 -27.42
Uttar Pradesh 26.8 37.1 40 25 29 26.9 -7.24
Odisha 29.2 35.2 35.8 36.7 25.6 33.5 30.86
Tamil Nadu 15.9 23.7 24.3 23.5 33.4 28.4 -14.97
Total 661.9 1087.3 1203.6 1320.1 1305.6 1285 -1.58
Production ('000 MT)
Maharashtra 2469 5638 5864 6529.3 6734.7 8854.1 31.47
Madhya Pradesh 2128 2451.2 2826 2848 3721.6 3701 -0.55
Karnataka 870 1957 2065.2 2696 3049.5 2986.6 -2.06
Bihar 696 1562.2 1851.2 1435.1 1290.2 1240.6 -3.84
Rajasthan 572 1236.7 1304.2 1355.8 1249 996.7 -20.20
Andhra Pradesh 427.2 824.8 1004.6 1247.3 1149.3 915.7 -20.33
Haryana 328.2 664.2 705 885.4 916.4 701.5 -23.45
Gujarat 317.7 589.8 672.2 544.6 682.9 546.2 -20.02
Uttar Pradesh 243.9 556.5 472.7 422.8 465.5 439.6 -5.56
Odisha 233.8 419 432.1 381 422.1 379.3 -10.14
Tamil Nadu 128.1 383.5 410 376 378.6 301.1 -20.47
Total 8682.6 17511.1 19401.7 20931.3 22427.4 23262.3 3.72
State/UT 2005 2011 2013 2015 2016 2017
Yield (Ton/Ha)
Maharastra 14.0 14.8 12.5 12.5 14.0 17.4
Madhya Pradesh 28.0 13.8 24.1 24.1 24.7 24.5
Karnataka 5.8 22.2 15.1 14.2 14.0 15.3
Bihar 19.3 25.5 25.4 16.6 25.0 23.1
Rajasthan 15.1 23.0 24.0 25.5 23.1 15.4
Andhra Pradesh 9.6 17.0 18.0 23.1 18.4 21.8
Haryana 12.9 9.0 12.3 19.7 22.0 23.4
Gujarat 20.5 21.5 22.3 16.0 22.0 24.3
Uttar Pradesh 9.1 15.0 11.8 16.9 16.1 16.4
Odisha 8.0 11.9 12.1 10.4 16.5 11.3
Tamil Nadu 8.1 16.2 16.9 16.0 11.3 10.6
Total 13.1 16.1 16.1 15.9 17.2 18.1
Price instability of onion in India
1-11

HIND AGRICULTURAL RESEARCH AND TRAINING INSTITUTEInternat. Res. J. Agric. Eco.& Stat., 11 (1) Mar., 2020 :4
Karnataka, Tamil Nadu, Gujarat and Maharashtra, it isgrown in winter (Rabi) as well as in the rainy (Kharif)seasons. Currently Kharif onion is gaining ground in thenorthern part of the country as well. Thus, it is cultivatedand is available to domestic consumers, as well as forexport throughout the year.
During the year 2017-18, onions were grown in anarea of 1285 thousand hectares with a production of23262 thousand tonnes in the country (Table 1). It wasobserved that the Odisha recorded a positive growth inarea (30.86 %) during 2017-18 over 2016-17. This wasfollowed by Rajasthan (19.78 %), Maharashtra (5.59 %),Bihar (4.26 %) and Madhya Pradesh (0.07 %). On thecontrary in the case of remaining states there was anegative growth that lead to the overall decline in area inIndia by 1.58 per cent in 2017-18 as compared to 2016-17.
With respect to the production, Maharashtra staterecorded more than 31.47 per cent increase despite ofits low growth in area due to higher yields. Whereas, incase of other states,a negative growth was recorded.Thedecline in production of other states was compensatedby Maharashtra state that reflected in increase in overallproduction by 3.72 per cent at all India level.
All in all, in the past two decades, area and productionof onion witnessed positive growth with fluctuations dueto weather, yield and responsiveness of onion to theprices.
Temporal behaviour of arrivals and prices in India:Depending on the production of onion, there is a
seasonality in arrivals and prices every year. The changesin arrivals may occur due to a rise or fall in production,unseasonal or heavy rainfall, poor storage, earlyharvesting, lack of retention power by growers andexports etc. Keeping in view the recent spurt in onionprices, the trend of monthly arrivals and prices of onionin India were analysed during 2018 and upto the latestmonth of 2019 for which data was availableand the resultsof the same are presented in the Table 2 and Fig. 1.
Fig. 1 : Seasonal indices of arrivals and prices of onion inIndia during 2018
250.00
200.00
150.00
100.00
50.00
0.00
Janu
ary
Febr
uary
Mar
chA
pril
May
June
July
Aug
ust
Sept
embe
rO
ctob
erN
ovem
ber
Dec
embe
r
140.00120.00100.0080.0060.0040.0020.000.00
Prices Arrivals
Table 2: Seasonal indices of arrivals and prices of onion in India during 2018 and 20192018 2019
MonthArrivals Prices Arrivals Prices
January 114.77 225.87 163.13 55.53
February 115.60 149.79 131.78 49.78
March 95.03 88.34 105.71 52.76
April 87.97 69.24 116.60 58.29
May 111.51 61.62 91.50 66.15
June 94.83 76.55 98.79 82.45
July 79.79 98.95 79.01 94.17
August 85.66 92.82 81.44 125.17
September 91.70 81.73 66.05 198.31
October 113.79 98.24 65.98 217.38
November 98.12 89.12
December 111.23 67.75
In order to study the arrival and price pattern, allthe markets both consuming and markets located inproduction centre in India were included. During 2018, itwas evident that the arrivals were higher in the monthsof January, February, May, October and December asthese months are coinciding with harvesting seasonacross the country. On the contrary, prices recorded weremaximum in January (225.87), February (149.79) and
K.C. Gummagolmath, S.B. Ramya Lakshmi, Priyanka Patra and A. Ronitha
1-11

HIND AGRICULTURAL RESEARCH AND TRAINING INSTITUTEInternat. Res. J. Agric. Eco.& Stat., 11 (1) Mar., 2020 : 5
(a)
40000
30000
20000
10000
0
1-Ja
n-18
3-Ja
n-18
5-Ja
n-18
8-Ja
n-18
10-J
an-1
812
-Jan
-18
17-J
an-1
819
-Jan
-18
22-J
an-1
824
-Jan
-18
27-J
an-1
8
4000
3000
2000
1000
0
Prices (Rs./q)Arrival (q)
30-J
an-1
8
Bangalore
(b)
Prices (Rs./q)Arrival (q)
Pimpalgoan
(c)
Prices (Rs./q)Arrival (q)
Delhi
(d)
Prices (Rs./q)Arrival (q)
Chennai
(e)
Prices (Rs./q)Arrival (q)
Mumbai
(f)
Prices (Rs./q)Arrival (q)
Lasalgoan
(g)
Prices (Rs./q)Arrival (q)
Jaipur
Fig. 2 a to g: Arrivals and prices of onion in major markets during January, 2018
Price instability of onion in India
1-11
HIND AGRICULTURAL RESEARCH AND TRAINING INSTITUTEInternat. Res. J. Agric. Eco.& Stat., 11 (1) Mar., 2020 :6
then declined for rest of the months. However, it isinteresting to note that there was an increase in the pricesof onion during January to February despite increase inarrivals. This might be due to higher MEP during thesemonths and hence, traders resorted for large scalepurchase of onion. On the contrary, during 2019, for thesame months, there was a decline in prices with increasein arrivals. The trend of arrivals and prices during thepeak months of 2018 in major markets were presentedin Fig. 2a. to 2g.
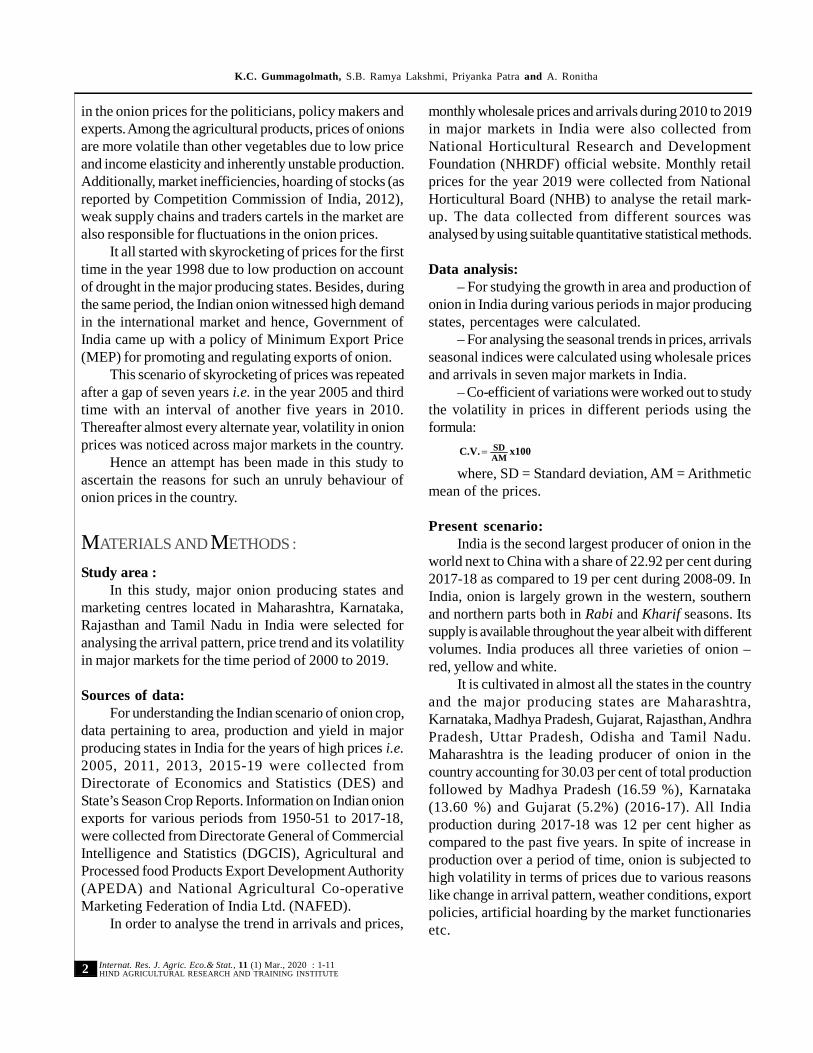
A peculiar trend can be observed in 2019 whichdepicts the current behaviour of onions in India. It isrevealed from Table 2 and Fig. 3, that during 2019, witha gradual decline in arrivals from May to July, the pricesincreased marginally. However, there was a sudden jumpin the prices of onion from August 2019 and the sametrend continued till November, 2019. This trend may beattributed to the lower arrivals on account of decline inproduction by major producing states.
Fig. 3 : Seasonal indices of arrivals and prices of onion inIndia during 2019
250.00
200.00
150.00
100.00
50.00
0.00
Jan.
200.0
150.0
100.0
50.00
0.00
Prices Arrivals
Feb. Mar. Apr. May. Jun. Jul. Aug. Sep. Oct.
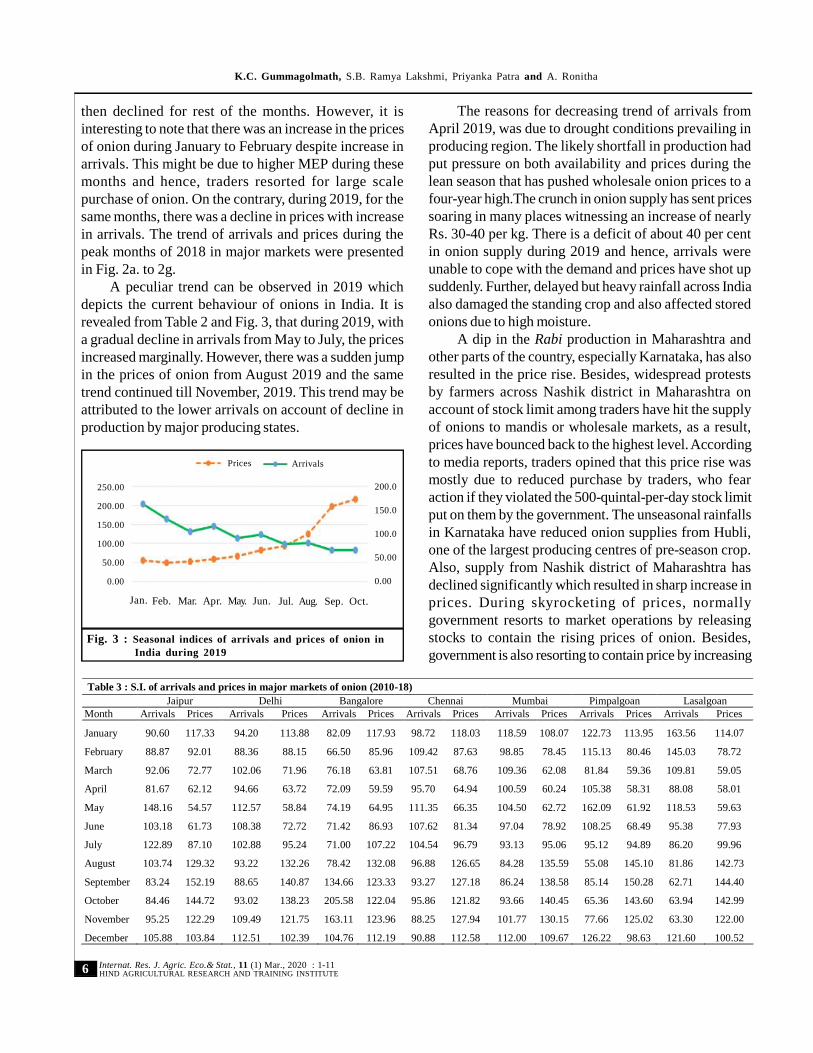
Table 3 : S.I. of arrivals and prices in major markets of onion (2010-18)Jaipur Delhi Bangalore Chennai Mumbai Pimpalgoan Lasalgoan
Month Arrivals Prices Arrivals Prices Arrivals Prices Arrivals Prices Arrivals Prices Arrivals Prices Arrivals Prices
January 90.60 117.33 94.20 113.88 82.09 117.93 98.72 118.03 118.59 108.07 122.73 113.95 163.56 114.07
February 88.87 92.01 88.36 88.15 66.50 85.96 109.42 87.63 98.85 78.45 115.13 80.46 145.03 78.72
March 92.06 72.77 102.06 71.96 76.18 63.81 107.51 68.76 109.36 62.08 81.84 59.36 109.81 59.05
April 81.67 62.12 94.66 63.72 72.09 59.59 95.70 64.94 100.59 60.24 105.38 58.31 88.08 58.01
May 148.16 54.57 112.57 58.84 74.19 64.95 111.35 66.35 104.50 62.72 162.09 61.92 118.53 59.63
June 103.18 61.73 108.38 72.72 71.42 86.93 107.62 81.34 97.04 78.92 108.25 68.49 95.38 77.93
July 122.89 87.10 102.88 95.24 71.00 107.22 104.54 96.79 93.13 95.06 95.12 94.89 86.20 99.96
August 103.74 129.32 93.22 132.26 78.42 132.08 96.88 126.65 84.28 135.59 55.08 145.10 81.86 142.73
September 83.24 152.19 88.65 140.87 134.66 123.33 93.27 127.18 86.24 138.58 85.14 150.28 62.71 144.40
October 84.46 144.72 93.02 138.23 205.58 122.04 95.86 121.82 93.66 140.45 65.36 143.60 63.94 142.99
November 95.25 122.29 109.49 121.75 163.11 123.96 88.25 127.94 101.77 130.15 77.66 125.02 63.30 122.00
December 105.88 103.84 112.51 102.39 104.76 112.19 90.88 112.58 112.00 109.67 126.22 98.63 121.60 100.52
The reasons for decreasing trend of arrivals fromApril 2019, was due to drought conditions prevailing inproducing region. The likely shortfall in production hadput pressure on both availability and prices during thelean season that has pushed wholesale onion prices to afour-year high.The crunch in onion supply has sent pricessoaring in many places witnessing an increase of nearlyRs. 30-40 per kg. There is a deficit of about 40 per centin onion supply during 2019 and hence, arrivals wereunable to cope with the demand and prices have shot upsuddenly. Further, delayed but heavy rainfall across Indiaalso damaged the standing crop and also affected storedonions due to high moisture.
A dip in the Rabi production in Maharashtra andother parts of the country, especially Karnataka, has alsoresulted in the price rise. Besides, widespread protestsby farmers across Nashik district in Maharashtra onaccount of stock limit among traders have hit the supplyof onions to mandis or wholesale markets, as a result,prices have bounced back to the highest level. Accordingto media reports, traders opined that this price rise wasmostly due to reduced purchase by traders, who fearaction if they violated the 500-quintal-per-day stock limitput on them by the government. The unseasonal rainfallsin Karnataka have reduced onion supplies from Hubli,one of the largest producing centres of pre-season crop.Also, supply from Nashik district of Maharashtra hasdeclined significantly which resulted in sharp increase inprices. During skyrocketing of prices, normallygovernment resorts to market operations by releasingstocks to contain the rising prices of onion. Besides,government is also resorting to contain price by increasing
K.C. Gummagolmath, S.B. Ramya Lakshmi, Priyanka Patra and A. Ronitha
1-11

HIND AGRICULTURAL RESEARCH AND TRAINING INSTITUTEInternat. Res. J. Agric. Eco.& Stat., 11 (1) Mar., 2020 : 7
MEP and thereby ensuring availability of onion fordomestic market. This knee jerk approach of thegovernment is hurting the farmers as compared to tradersand consumers. Because during low prices, farmers feelthat the same action of stabilizing the prices is not seen.Many times, the prices are so low that the farmers areunable to cover even the cost of cultivation.
The seasonal indices of the arrivals and prices ofonions in major markets of the country from 2010 to 2018were also calculated to throw more light on the issue(Table 3).
Maharashtra markets:Maharashtra which produces 35 per cent of India’s
total 23.5 million tones of onion is a major market in India(Economic Times). Depending on the time oftransplantation and harvest, onion growers in the stateclassify their crop as Kharif (May- July transplant andharvesting in October- November), late Kharif(September- November transplant and harvest postJanuary) and Rabi (December- January transplant andharvest post April). These three crops feed the marketround the year.
Lasalgoan market:Lasalgaon mandi, Asia’s largest onion selling market
sets the tone for sales of the kitchen staple in the country.As indicated in Table 3. The arrivals started increasingfrom the month of December, reaches peak in January(163.56) and then declined. The prices recorded highest(144.40) during the lean period of arrivals (62.71) i.e.during September month. Even during the peak period ofarrivals the prices were more or less high (114.07).
Pimpalgoan market :The behaviour of prices in Pimpalgoan market was
found to be similar to that of Lasalgoan market whichrecorded maximum in the month of September (150.28).The arrivals were found to be peak in May (126.22) andstarted declining. Also increase in arrivals can be observedin December and January.
Mumbai market:An increasing trend in arrivals was observed from
November till January (111.89). Also prices exhibited anincreasing trend from August till October (140.45) andthen declined.
Jaipur market:The arrivals were found to be maximum during the
month of May as indicated by the seasonal index 148.16as the onion is grown in Rabi season in Rajasthan andhence, major arrivals will be reaching the market duringApril and May. Also during the same period the pricesrecorded lowest (54.57) which showed a negativecorrelation between arrivals and prices.
Delhi market:Arrivals in Delhi market exhibited a different trend
where in maximum arrivals can be observed during May(112.57) and December (112.51). But prices recordedlowest in May (58.84) and highest in the month ofSeptember (140.87). However, the prices were higherduring August to January.
Bangalore market:A peculiar situation could be observed from the trend
in arrivals and prices of onion in Bangalore market andcontinued to increase during November-December. Thevalues of arrivals started increasing from September andtouched peak during October. It is stated that during higharrivals, more number of traders operated in this marketand thus due to competitive situation there was increasein prices, even during high arrivals. Similarly, pricesstarted increasing during July month and recorded peakin August during which the arrivals started increasing.Probable reason might be the increasing trends in theprices attracted farmers to bring more and more produceinto the market.
Chennai market:Major fluctuations were not observed in the arrivals
but prices revealed an increasing trend from June till theyreached peak in November.
However, more or less negative relation can beobserved between arrivals and prices in Jaipur, Delhi,Chennai, Lasalgoan markets.
The seasonal behaviour of arrivals and prices ofonions during 2019 in major markets of the country during2019 are presented in Table 4. The results clearlyindicated that in almost all the markets under study exceptin Jaipur and Chennai, the prices exhibited an increasingtrend from January to October. The spurt in the priceswas mainly due to the shortage of supply following a dipin sowing of summer onions in Maharashtra and latearrival of Kharif produce from Karnataka. The
Price instability of onion in India
1-11

HIND AGRICULTURAL RESEARCH AND TRAINING INSTITUTEInternat. Res. J. Agric. Eco.& Stat., 11 (1) Mar., 2020 :8
Table 4 : S.I of arrivals and prices in major markets of onion during 2019Jaipur Delhi Bangalore Chennai Mumbai Pimpalgoan Lasalgoan
MonthsArrivals Prices Arrivals Prices Arrivals Prices Arrivals Prices Arrivals Prices Arrivals Prices Arrivals Prices
January 115.30 47.37 96.03 7.50 144.14 55.73 109.86 66.59 111.82 43.35 127.88 40.83 120.35 37.76
February 104.74 47.97 104.34 8.15 108.25 50.68 110.02 50.83 108.71 35.30 106.69 30.43 149.30 30.00
March 79.15 51.88 114.67 8.95 123.82 48.89 106.52 51.87 111.35 43.48 51.38 43.30 122.76 41.30
April 148.03 56.49 98.19 7.67 127.62 56.58 105.69 64.17 120.25 56.73 161.75 63.41 116.09 59.10
May 140.44 59.69 111.32 8.69 98.27 69.19 106.30 66.96 86.32 68.03 150.01 66.37 93.50 66.27
June 62.06 69.85 112.03 8.75 98.88 81.82 95.16 93.40 94.23 91.80 106.67 84.02 104.05 86.96
July 70.02 89.46 83.16 6.49 96.58 88.24 88.63 102.89 81.01 91.24 82.60 89.52 107.16 89.12
August 73.91 95.71 103.46 8.08 106.90 124.65 84.07 119.40 121.81 129.13 93.89 129.34 111.21 133.78
September 63.78 239.39 87.69 6.85 78.81 212.49 90.83 194.81 92.60 220.92 74.34 231.31 56.27 234.21
October 142.56 242.20 89.10 6.96 16.72 211.74 102.92 189.07 71.90 220.02 44.79 221.47 19.31 221.51
Table 5 : Volatility of arrivals and prices of onions in major marketsJaipur Bangalore Delhi Lasalgoan
Months C.V. ofarrivals
C.V. ofwholesale
prices
C.V. ofarrivals
C.V. ofwholesale
prices
C.V. ofarrivals
C.V. ofwholesale
prices
C.V. ofarrivals
C.V. ofwholesale
prices
November,2013 13.45 19.29 27.07 24.30 40.51 17.88 44.86 29.84
December,2013 19.80 24.94 39.09 26.64 33.44 25.42 25.53 24.35
November,2015 27.23 13.04 51.67 8.40 41.39 14.43 50.32 14.17
December,2015 20.51 14.56 30.73 8.02 35.64 12.40 38.51 18.77
November,2016 63.44 13.57 46.75 6.12 39.50 23.68 49.91 13.58
December,2016 34.82 20.73 39.37 14.84 44.28 6.70 46.24 21.32
November,2017 32.42 15.26 48.00 13.72 29.91 13.42 41.19 15.05
December,2017 36.28 12.05 49.25 9.07 37.69 8.84 22.38 9.05
November,2018 38.82 22.03 57.34 23.99 38.06 13.41 39.78 24.86
December,2018 39.43 12.79 30.26 10.90 40.19 11.03 47.11 15.41
October,2019 24.57 6.71 45.80 12.37 42.46 6.56 49.49 17.69
November,2019 68.86 20.76 55.23 24.73 42.34 10.85 57.14 13.44
corresponding indices of arrivals were low during themonths of September and October which can be due tothe stock limits imposed on thewholesalers and retailersnot exceeding 500 quintals and 100 quintals, respectivelyper day.
Volatility of arrivals and prices in major markets:To measure volatility in arrivals and prices of onion,
Co-efficient of variation was calculated in major marketsfor the months of November 2013-19 and October 2019(Table 5). As these markets are having significance inthe trading of onion, the magnitude of volatility wascalculated. It was found that, the magnitude of co-efficientof variation for arrivals was higher during November2019. At the same time, compared to October 2019, thevolatility in prices was higher during November 2019.
This indicates that the fluctuations in the supply ofonion are causing rise or fall in the prices on daily basis.Hence, farmer is caught unaware of as to what pricewill be fetched to him on a given day. This phenomenoncoupled with realization of meagre proportion ofconsumer price due to long value chain is hurting thefarmers.
Retail versus wholesale prices:As evident from the Table 6 and 7, among India’s
eight largest metros, consumers in Delhi are the mostshort-changed by retailers of onions with margins betweenthe wholesale and retail prices being much higher thanother cities. Retail mark-up from Jan. 2016 to Aug. 2019shows that retail prices prevailing in Delhi were 2.5 timesmore than the wholesale prices followed by Pune.
K.C. Gummagolmath, S.B. Ramya Lakshmi, Priyanka Patra and A. Ronitha
1-11
HIND AGRICULTURAL RESEARCH AND TRAINING INSTITUTEInternat. Res. J. Agric. Eco.& Stat., 11 (1) Mar., 2020 : 9
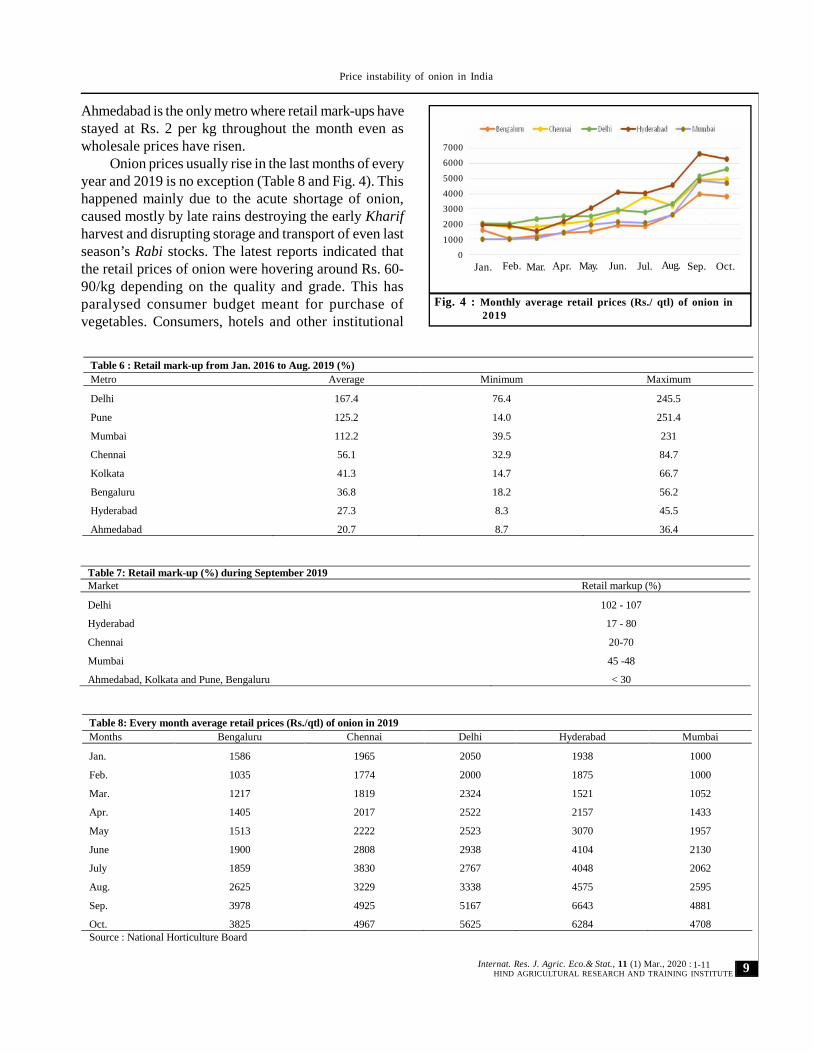
Table 8: Every month average retail prices (Rs./qtl) of onion in 2019Months Bengaluru Chennai Delhi Hyderabad Mumbai
Jan. 1586 1965 2050 1938 1000
Feb. 1035 1774 2000 1875 1000
Mar. 1217 1819 2324 1521 1052
Apr. 1405 2017 2522 2157 1433
May 1513 2222 2523 3070 1957
June 1900 2808 2938 4104 2130
July 1859 3830 2767 4048 2062
Aug. 2625 3229 3338 4575 2595
Sep. 3978 4925 5167 6643 4881
Oct. 3825 4967 5625 6284 4708Source : National Horticulture Board
Table 6 : Retail mark-up from Jan. 2016 to Aug. 2019 (%)Metro Average Minimum Maximum
Delhi 167.4 76.4 245.5
Pune 125.2 14.0 251.4
Mumbai 112.2 39.5 231
Chennai 56.1 32.9 84.7
Kolkata 41.3 14.7 66.7
Bengaluru 36.8 18.2 56.2
Hyderabad 27.3 8.3 45.5
Ahmedabad 20.7 8.7 36.4
Table 7: Retail mark-up (%) during September 2019Market Retail markup (%)
Delhi 102 - 107
Hyderabad 17 - 80
Chennai 20-70
Mumbai 45 -48
Ahmedabad, Kolkata and Pune, Bengaluru < 30
Ahmedabad is the only metro where retail mark-ups havestayed at Rs. 2 per kg throughout the month even aswholesale prices have risen.
Onion prices usually rise in the last months of everyyear and 2019 is no exception (Table 8 and Fig. 4). Thishappened mainly due to the acute shortage of onion,caused mostly by late rains destroying the early Kharifharvest and disrupting storage and transport of even lastseason’s Rabi stocks. The latest reports indicated thatthe retail prices of onion were hovering around Rs. 60-90/kg depending on the quality and grade. This hasparalysed consumer budget meant for purchase ofvegetables. Consumers, hotels and other institutional
Fig. 4 : Monthly average retail prices (Rs./ qtl) of onion in2019
7000
6000
5000
4000
3000
2000
1000
0Jan. Feb. Mar. Apr. May. Jun. Jul. Aug. Sep. Oct.
Price instability of onion in India
1-11

HIND AGRICULTURAL RESEARCH AND TRAINING INSTITUTEInternat. Res. J. Agric. Eco.& Stat., 11 (1) Mar., 2020 :10
Table 9: Trend in exports of onion in IndiaYear Qty. (MT) Value (Rs.Lakh) Price (Rs./Tonne)
1951-52 56,986 106.69 187.22
1961-62 1,14,023 291.3 255.47
1971-72 54,866 227.56 414.76
1981-82 1,69,771 2,943.81 1,733.99
1990-91 2,89,380 11,803.00 4,078.72
1991-92 4,06,135 16,296.86 4,012.67
1996-97 5,12,879 33,163.40 6,466.13
2001-02 5,06,924 41,140.53 8,115.72
2008-09 17,83,820 2,24,312.30 12,578.63
2009-10 18,73,002 2,83,428.50 15,132.31
2017-18 21,35,421 4,38,436 20531.59Source: NAFED, DGCIS
buyers are hit hard to cope-up with the situation.
Trend in exports of onion in India:India is a traditional exporter of fresh onions (Mathur,
2001). Soon after Independence in 1951-52 the countrywas exporting over 5,000 tonnes of onions worth Rs.106.69 lakh. Over the years there has been aprogressive increase in the exports of onion from Indiatouched a level of 21,35,421 tonnes during the financialyear of 2017-18 (Table 9 and Fig. 5). The large exportis also one of the reasons for sudden spurt in the pricesof onion during December 2010. During the financialyear 2018-19, India had exported 21.82 lakh tonnesof the bulb.
However, it is apparent from Table 9 that althoughthere has been an increasing trend in the quantum andvalue of exports of onions from the country, the exportsare subject to wide fluctuations from year to year. Thismay be attributed to the fact that the exports of onions
have not been free but are canalised through NationalAgricultural Co-operative Marketing Federation(NAFED) and now through some other agencies. Suchagencies are protecting the domestic consumer andproducer from unduly high prices and gluts as well. Thecause of fluctuations in the exports may be due to theoccasional restriction put on exports (Sudhir, 2004),keeping in mind the domestic requirement. No doubt,exports of onion have fetched the country valuable foreignexchange and at the same time have been the reason forhigh domestic prices.
Conclusion:Onion prices being a highly volatile, in the event of
a high rise in the prices affect both consumer as well asfarmers on account of high margin in the value chainbeing taken away by intermediaries. Hence,government is resorting to control the prices byreleasing the stocks available with outlets of NAFED.The corrective measures for arresting rising prices inthe form releasing the stocks in open market andincreasing the MEP have always been resulted inlowering of prices in subsequent period. However, theimpact of these measures lowers the prices of onionto such an extent they become uneconomical to thefarmers. These policies seldom help the farmers andhave not been able to contain the volatility of onionprices. Hence, there is a need for comprehensivepolicies which were going to benefit both producer aswell as consumer. Extension adversaries for staggeredsowing and intervention of procurement agencieseither for releasing the stock during high rise andmarket operations during glut in a more plannedmanner
K.C. Gummagolmath, S.B. Ramya Lakshmi, Priyanka Patra and A. Ronitha
Fig. 5 : Trend in exports of onion in India
2,500,000
2,000,000
1,500,000
1,000,000
500,000
0
1951
-52
Qua
ntit
y (M
T)
1961
-62
1971
-72
1981
-82
1990
-91
1991
-92
1996
-97
2001
-02
2008
-09
2009
-10
2017
-18
Year
1-11

HIND AGRICULTURAL RESEARCH AND TRAINING INSTITUTEInternat. Res. J. Agric. Eco.& Stat., 11 (1) Mar., 2020 : 11
will act as a panacea for volatility in onion prices.In the recent media reports, there was a news on
raids by I-T sleuths on onion traders for want of propermaintenance of the records. This suggest that few oniontraders are indulged in creating artificial scarcity of onionand make a quick profit taking the advantage of rise inthe price.This matter of curtailing by traders, hoardingof stocks and concentration of onion trade in the fewhands was reported by Competition Commission ofIndia in their report during 2012. Hence, there is aneed for regulating onion trade and trade practices.Therecent marketing reforms, providing alternativemarketing systems and making onion as a part ofPublic Distribution System (PDS) may help inminimising volatility of onion prices.
Authors’ affiliations:S.B. Ramya Lakshmi, Priyanka Patra and A. Ronitha, NationalInstitute of Agricultural Extension Management, (MANAGE),Hyderabad (Telangana) India
LITERATURECITED :
Gummagolmath, K.C. (2013). Research report on trends inmarketing and export of onion in India, NationalInstitute of Agricultural Marketing (NIAM), Jaipur,Rajasthan, India.
Mathur, V. C. (2001). Export potential of onion: A case studyof India, paper presented in “Regional Workshop onCommodity Export Diversification and Poverty Reductionin South and South-East Asia, held from 3-5 April 2001, atBangkok, Thailand by UNCTAD and ESCAP.
Sudhir, B. (2004). Onion prices and state intervention, Econ. &Politi. Weekly, 14 August, 3684-3686.
Price instability of onion in India
1-11
11 t h
of ExcellenceYear
Related Documents