Price Developments – Evaluating Sector Attractiveness Dr Adam Kent - Maritime Strategies International (MSI) 7th Annual Marine Money London Ship Finance Forum – 27 th Jan 2016

Welcome message from author
This document is posted to help you gain knowledge. Please leave a comment to let me know what you think about it! Share it to your friends and learn new things together.
Transcript
Price Developments –
Evaluating Sector Attractiveness
Dr Adam Kent - Maritime Strategies International (MSI)
7th Annual Marine Money London Ship Finance Forum – 27th Jan 2016
Agenda
© Maritime Strategies International www.msiltd.com2
Price Developments – Evaluating Sector Attractiveness
1. What determines secondhand prices
2. Newbuilding prices
3. Scrap prices
4. Earnings
5. Secondhand prices
6. Forecast Maritime eValuator (FMV)
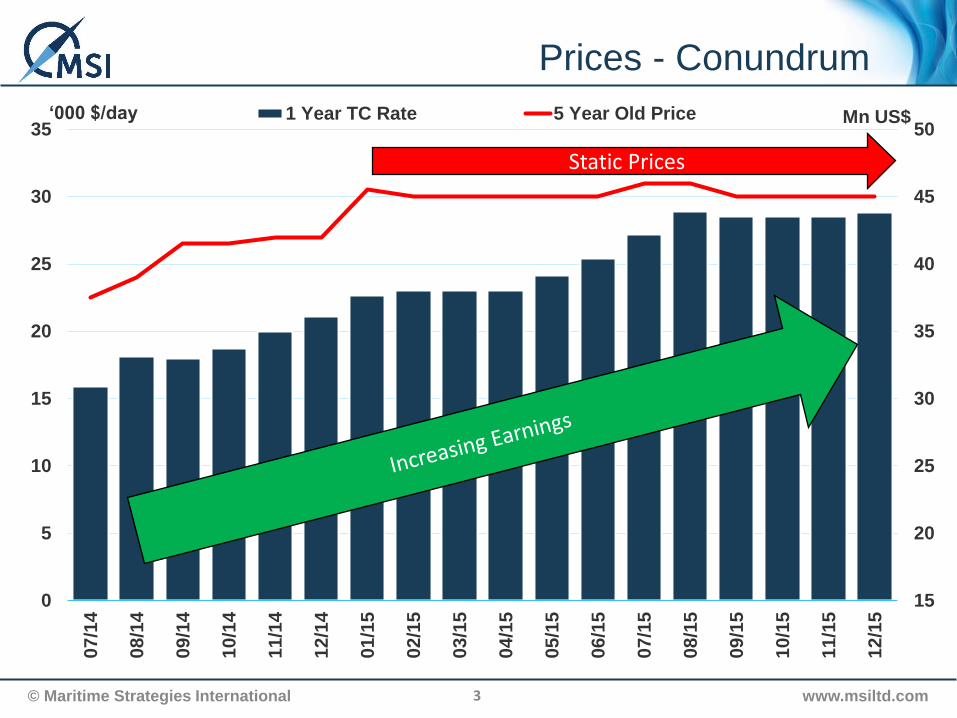
Prices - Conundrum
© Maritime Strategies International www.msiltd.com3
15
20
25
30
35
40
45
50
0
5
10
15
20
25
30
35
07
/14
08
/14
09
/14
10
/14
11
/14
12
/14
01
/15
02
/15
03
/15
04
/15
05
/15
06
/15
07
/15
08
/15
09
/15
10
/15
11
/15
12/1
5
Mn US$‘000 $/day 1 Year TC Rate 5 Year Old Price
Static Prices

Break Even v Earnings
© Maritime Strategies International www.msiltd.com4
-80%
-60%
-40%
-20%
0%
20%
40%
60%
80%
100%
120%
-60
-40
-20
0
20
40
60
Ha
nd
y
Afr
am
ax
Su
ezm
ax
VL
CC
Ha
nd
y
Pa
na
max
Ca
pe
siz
e
1.7
k T
EU
3.6
k T
EU
4.4
k T
EU
8 k
TE
U
‘000 $/day
BreakevenTC Rate% Net Cash Flow (RH Axis)
Based on 60% financing

The Complete Pricing Jigsaw
© Maritime Strategies International www.msiltd.com5
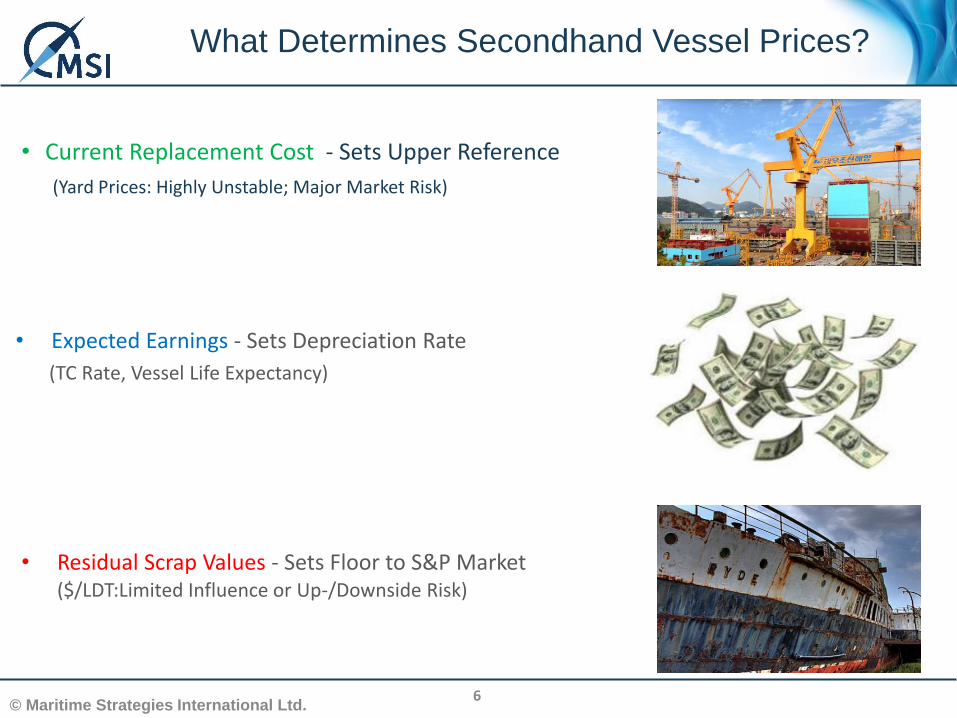
What Determines Secondhand Vessel Prices?
• Current Replacement Cost - Sets Upper Reference
(Yard Prices: Highly Unstable; Major Market Risk)
6© Maritime Strategies International Ltd.
• Residual Scrap Values - Sets Floor to S&P Market ($/LDT:Limited Influence or Up-/Downside Risk)
• Expected Earnings - Sets Depreciation Rate
(TC Rate, Vessel Life Expectancy)

Newbuilding Prices
© Maritime Strategies International www.msiltd.com
Price Developments

MSI’s Shipbuilding Model
8© Maritime Strategies International Ltd.
Sector Specific
Freight RatesSector Specific
Contracting
Global
Orderbook
Forward Berth
Cover
(years)Regional Yard
Developments &
Capacity
Global Yard
Capacity
Global Cost Components
(steel & machinery price,
exchange rates)Weighted
Average of Yard
Costs
Regional Cost Components
(wage, inflation, productivity)
Average Yard
Price Index
($ CGT)
Newbuilding
Price
(by vessel
type by size)
Forward Cover = Pricing Power
Costs = Pricing Floor

Are the Yards Panicking Yet?
© Maritime Strategies International www.msiltd.com9
0%
20%
40%
60%
80%
100%
120%
0
5
10
15
20
25
30
2016
2017
2018
2019
2016
2017
2018
2019
2016
2017
2018
2019
% CapacityMn CGT Mn CGT Historical Max % of Max Historical Output (RH Axis)
South Korea Japan China
Beyond 2016 yards are significantly
underemployed
EmptyCapacity
EmptyCapacity
EmptyCapacity

Chinese Orderbook – Whose Responsible?
© Maritime Strategies International www.msiltd.com10
2017+ Bulker orderbook low
Domestic orders are low
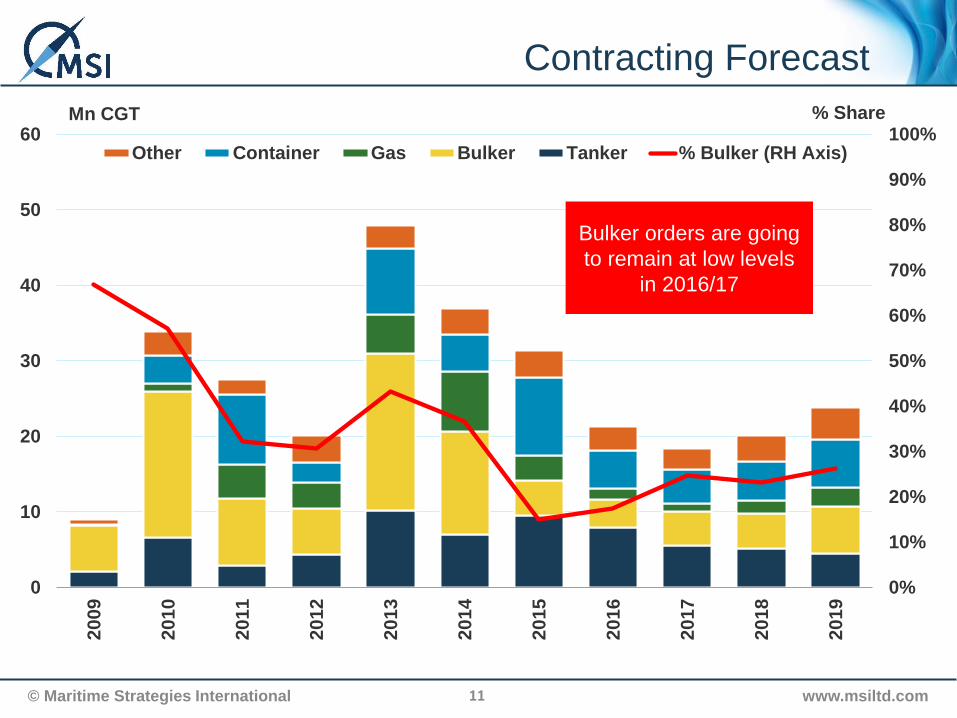
Contracting Forecast
© Maritime Strategies International www.msiltd.com11
0%
10%
20%
30%
40%
50%
60%
70%
80%
90%
100%
0
10
20
30
40
50
60
2009
2010
2011
2012
2013
2014
2015
2016
2017
2018
2019
% ShareMn CGT
Other Container Gas Bulker Tanker % Bulker (RH Axis)
Bulker orders are going
to remain at low levels
in 2016/17
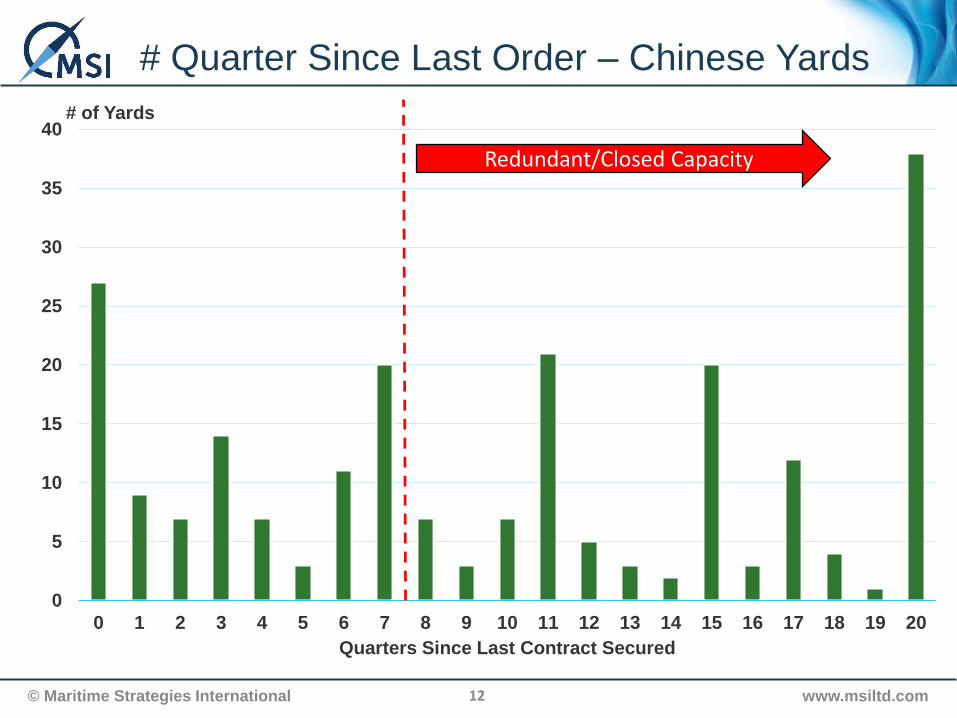
# Quarter Since Last Order – Chinese Yards
© Maritime Strategies International www.msiltd.com12
0
5
10
15
20
25
30
35
40
0 1 2 3 4 5 6 7 8 9 10 11 12 13 14 15 16 17 18 19 20
# of Yards
Quarters Since Last Contract Secured
Redundant/Closed Capacity

Diversified Portfolio Route to Survival
© Maritime Strategies International www.msiltd.com13

Shipyard Turmoil
14© Maritime Strategies International Ltd.

Effective Shipyard Capacity (Merchant)
© Maritime Strategies International www.msiltd.com15
0
10
20
30
40
50
60
2000
2001
2002
2003
2004
2005
2006
2007
2008
2009
2010
2011
2012
2013
2014
2015
2016
2017
2018
Mn CGT Other Europe China Korea Japan

Shipyard Capacity – Déjà Vu
© Maritime Strategies International www.msiltd.com16
0
2
4
6
8
10
12
14
16
18
20
1970
1971
1972
1973
1974
1975
1976
1977
1978
1979
1980
1981
1982
1983
1984
1985
1986
1987
Mn CGT Other Europe China South Korea Japan

Cost Index
© Maritime Strategies International www.msiltd.com17
40
60
80
100
120
140
160
180
2002
2003
2004
2005
2006
2007
2008
2009
2010
2011
2012
2013
2014
2015
2016
2017
2018
Index 2002= 100 Weighted Average Index Korea Index Japan Index China Index
Exchange rate movements and zero
inflation/wage growth now means Japanese
costs are significantly below Korea
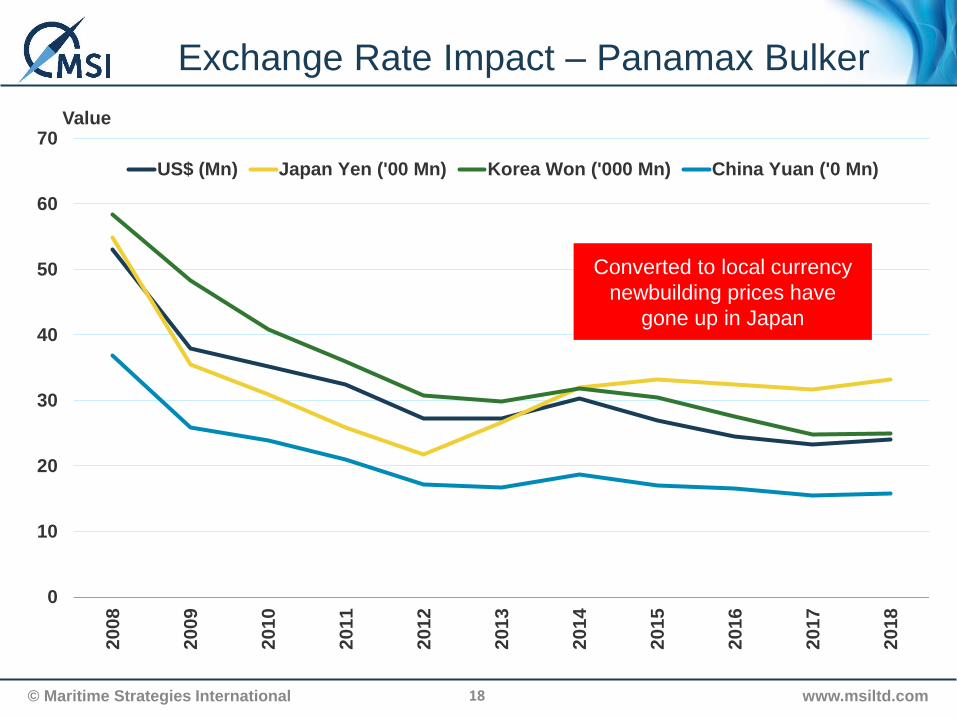
Exchange Rate Impact – Panamax Bulker
© Maritime Strategies International www.msiltd.com18
0
10
20
30
40
50
60
70
2008
2009
2010
2011
2012
2013
2014
2015
2016
2017
2018
Value
US$ (Mn) Japan Yen ('00 Mn) Korea Won ('000 Mn) China Yuan ('0 Mn)
Converted to local currency
newbuilding prices have
gone up in Japan

Scrap Price
© Maritime Strategies International www.msiltd.com
Price Developments

20 Year Old Price - % Above Scrap
© Maritime Strategies International www.msiltd.com20
0%
100%
200%
300%
400%
500%
600%
20
k S
R L
PG
5/8
SR
LP
G
VL
GC
LP
G
6k
CE
U P
CT
C
9k
Ch
em
ical
20k C
hem
ical
MR
Ta
nk
er
VL
CC
Ta
nk
er
1.7
kT
EU
FC
C
Su
ezm
ax
Ta
nke
r
LR
2 T
an
ke
r
12
.5k
MP
P
Afr
am
ax
Tan
ker
6.1
kT
EU
FC
C
20
k M
PP
4.3
kT
EU
FC
C
Ca
pe
Bu
lke
r
Su
pra
Bu
lke
r
Pa
na
max
Bu
lker
%
Scrap prices heavily impacting old
tonnage at this end of the spectrum
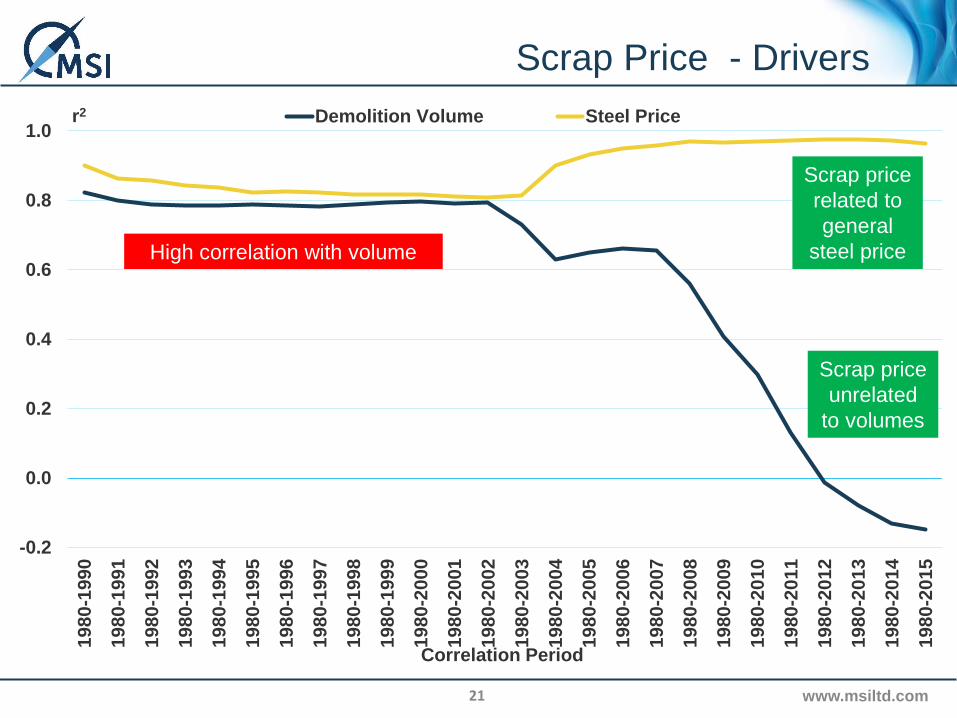
Scrap Price - Drivers
www.msiltd.com21
-0.2
0.0
0.2
0.4
0.6
0.8
1.0
19
80
-19
90
19
80
-19
91
19
80
-19
92
19
80
-19
93
19
80
-19
94
19
80
-19
95
19
80
-19
96
19
80
-19
97
19
80
-19
98
19
80
-19
99
19
80
-20
00
19
80
-20
01
19
80
-20
02
1980-2
003
19
80
-20
04
19
80
-20
05
19
80
-20
06
19
80
-20
07
19
80
-20
08
1980-2
009
19
80
-20
10
19
80
-20
11
19
80
-20
12
19
80
-20
13
19
80
-20
14
19
80
-20
15
r2
Correlation Period
Demolition Volume Steel Price
Scrap price
unrelated
to volumes
Scrap price
related to
general
steel priceHigh correlation with volume
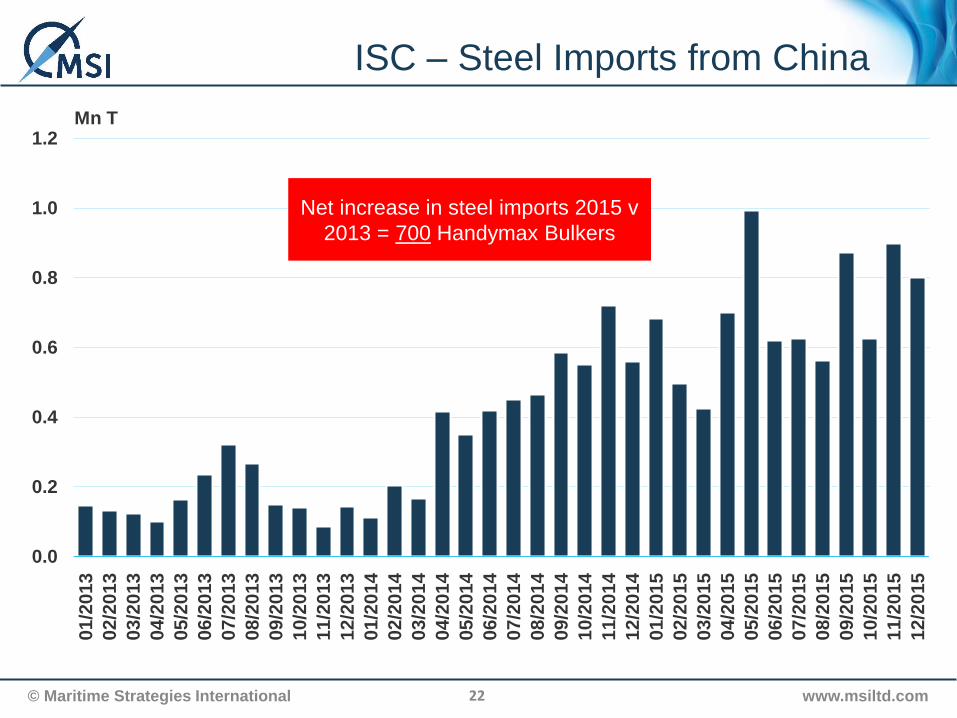
ISC – Steel Imports from China
© Maritime Strategies International www.msiltd.com22
0.0
0.2
0.4
0.6
0.8
1.0
1.2
01
/20
13
02/2
013
03
/20
13
04
/20
13
05
/20
13
06
/20
13
07
/20
13
08
/20
13
09
/20
13
10
/20
13
11
/20
13
12
/20
13
01/2
014
02
/20
14
03
/20
14
04
/20
14
05
/20
14
06
/20
14
07
/20
14
08
/20
14
09
/20
14
10
/20
14
11
/20
14
12/2
014
01
/20
15
02
/20
15
03
/20
15
04
/20
15
05
/20
15
06
/20
15
07
/20
15
08
/20
15
09
/20
15
10
/20
15
11/2
015
12
/20
15
Mn T
Net increase in steel imports 2015 v
2013 = 700 Handymax Bulkers

Earnings
© Maritime Strategies International www.msiltd.com
Price Developments

Where on the Earnings Cycle Are We?
© Maritime Strategies International www.msiltd.com24
Cru
de a
nd P
roduct T
anker
LP
G C
arr
ier
OS
Vs
PC
TC
Bulk
er
LN
G
MP
P
Conta
iner
Chem
ical T
anker
RoR
o
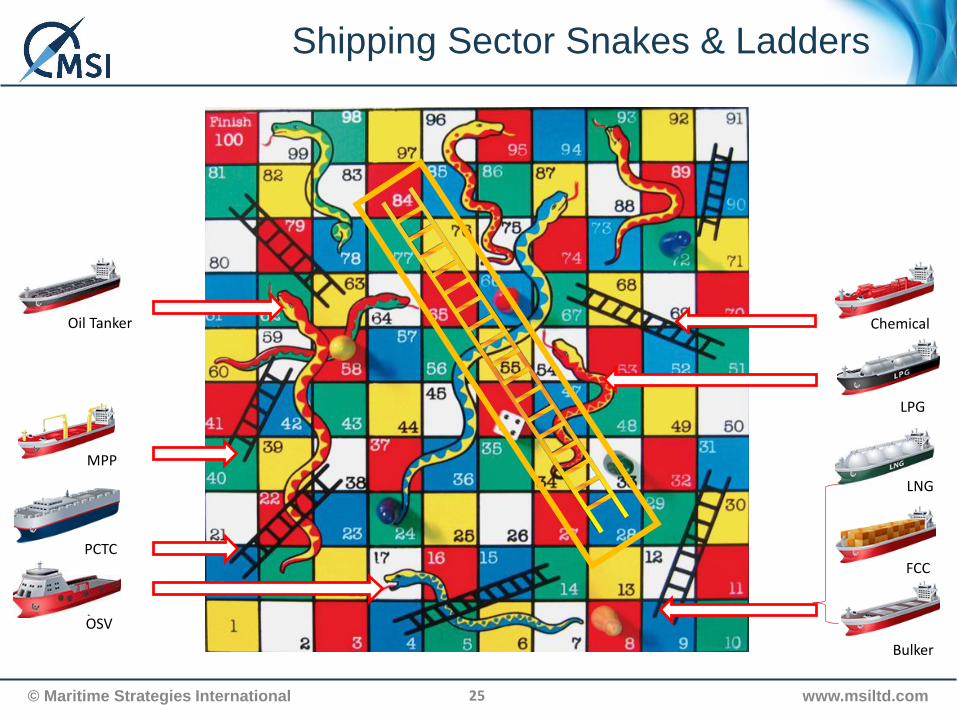
Shipping Sector Snakes & Ladders
© Maritime Strategies International www.msiltd.com25
Oil Tanker
OSV
LPG
PCTC
Bulker
MPP
FCC
LNG
Chemical
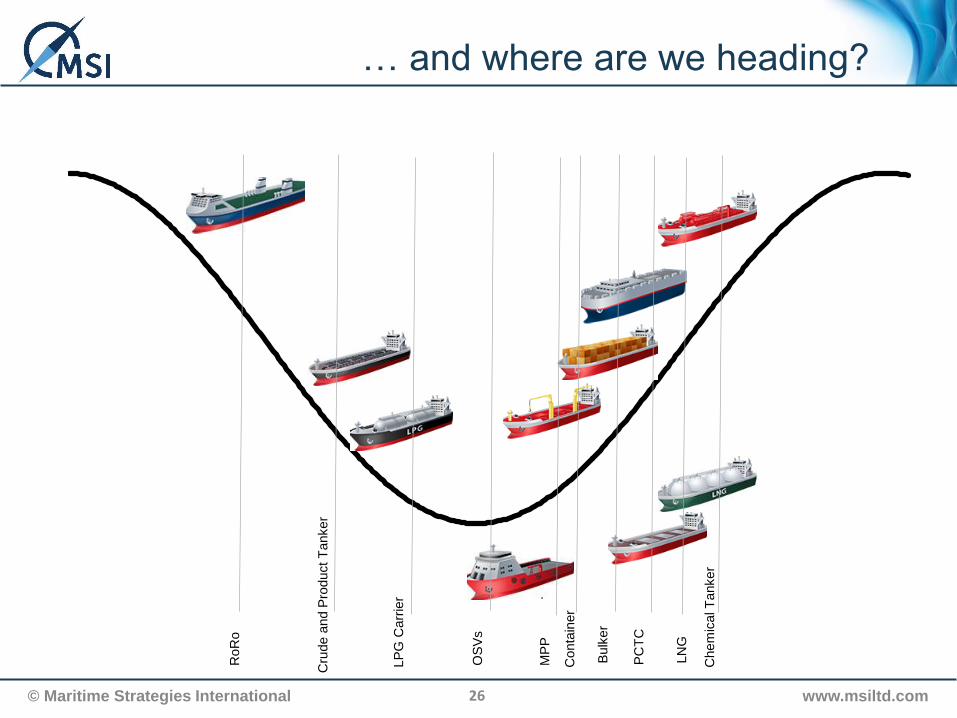
… and where are we heading?
© Maritime Strategies International www.msiltd.com26
Cru
de a
nd P
roduct T
anker
LP
G C
arr
ier
OS
Vs
PC
TC
Bulk
er
LN
G
MP
P
Conta
iner
Chem
ical T
anker
RoR
o

Secondhand Prices
© Maritime Strategies International www.msiltd.com
Price Developments
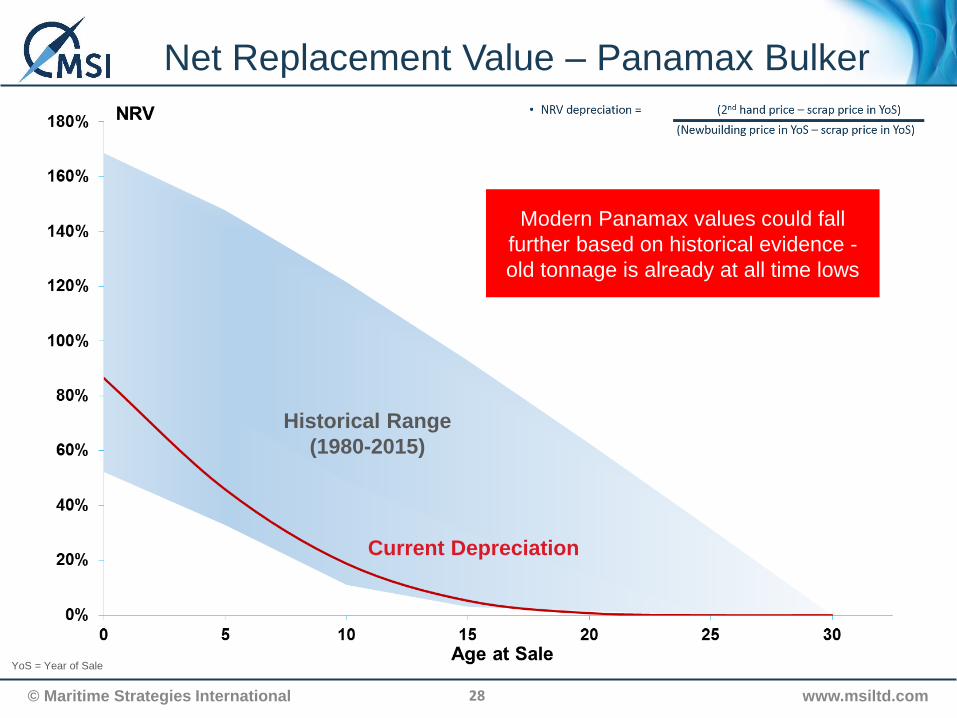
Net Replacement Value – Panamax Bulker
© Maritime Strategies International www.msiltd.com28
Modern Panamax values could fall
further based on historical evidence -
old tonnage is already at all time lows
Historical Range
(1980-2015)
YoS = Year of Sale
Current Depreciation

Net Replacement Value – VLCC Tanker
© Maritime Strategies International www.msiltd.com29
VLCCs are approaching their maximum
historical depreciation
Historical Range
(1980-2015)
YoS = Year of Sale
Current Depreciation
MSI - FMV
© Maritime Strategies International www.msiltd.com30
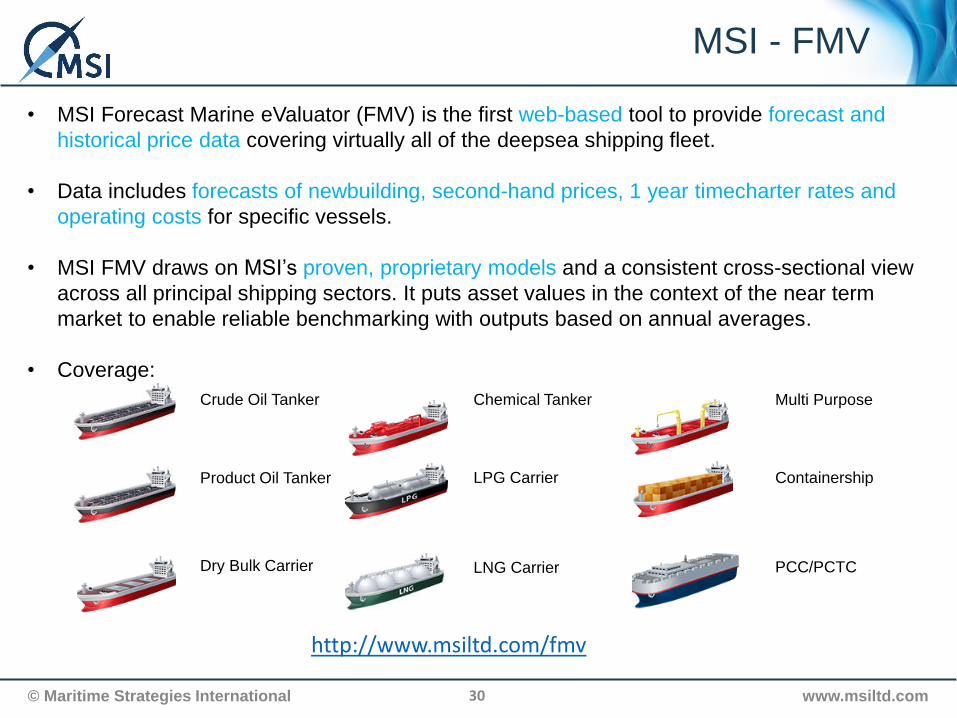
• MSI Forecast Marine eValuator (FMV) is the first web-based tool to provide forecast and
historical price data covering virtually all of the deepsea shipping fleet.
• Data includes forecasts of newbuilding, second-hand prices, 1 year timecharter rates and
operating costs for specific vessels.
• MSI FMV draws on MSI’s proven, proprietary models and a consistent cross-sectional view
across all principal shipping sectors. It puts asset values in the context of the near term
market to enable reliable benchmarking with outputs based on annual averages.
• Coverage:
Crude Oil Tanker
Product Oil Tanker
Dry Bulk Carrier
Chemical Tanker
LPG Carrier
LNG Carrier
Multi Purpose
Containership
PCC/PCTC
http://www.msiltd.com/fmv
FMV Output
© Maritime Strategies International www.msiltd.com31
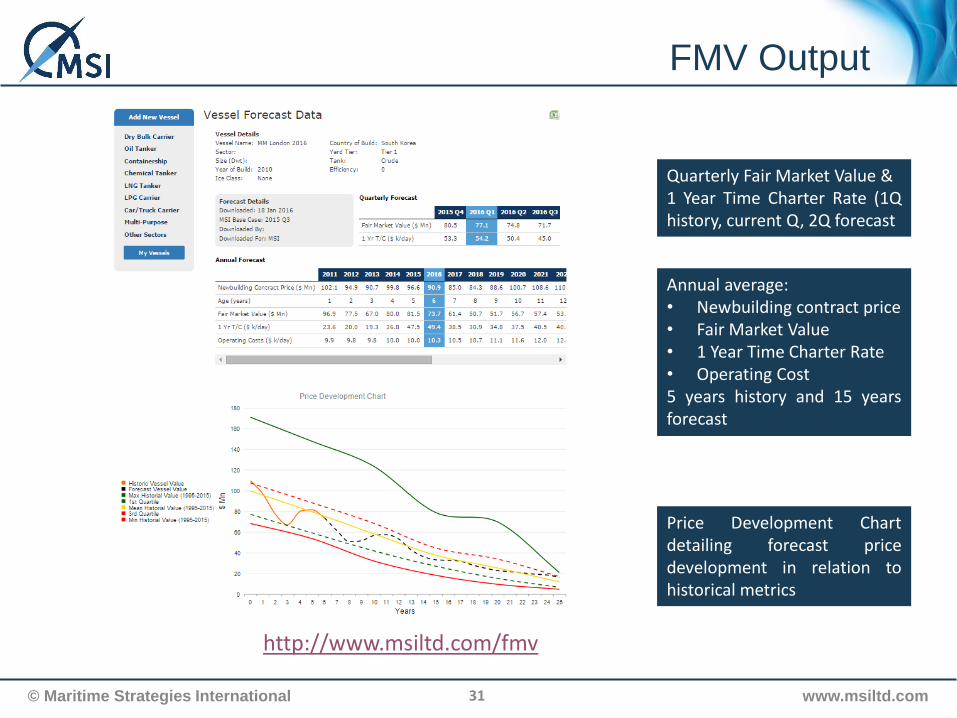
Quarterly Fair Market Value &1 Year Time Charter Rate (1Qhistory, current Q, 2Q forecast
Annual average:• Newbuilding contract price• Fair Market Value• 1 Year Time Charter Rate• Operating Cost5 years history and 15 yearsforecast
Price Development Chartdetailing forecast pricedevelopment in relation tohistorical metrics
http://www.msiltd.com/fmv
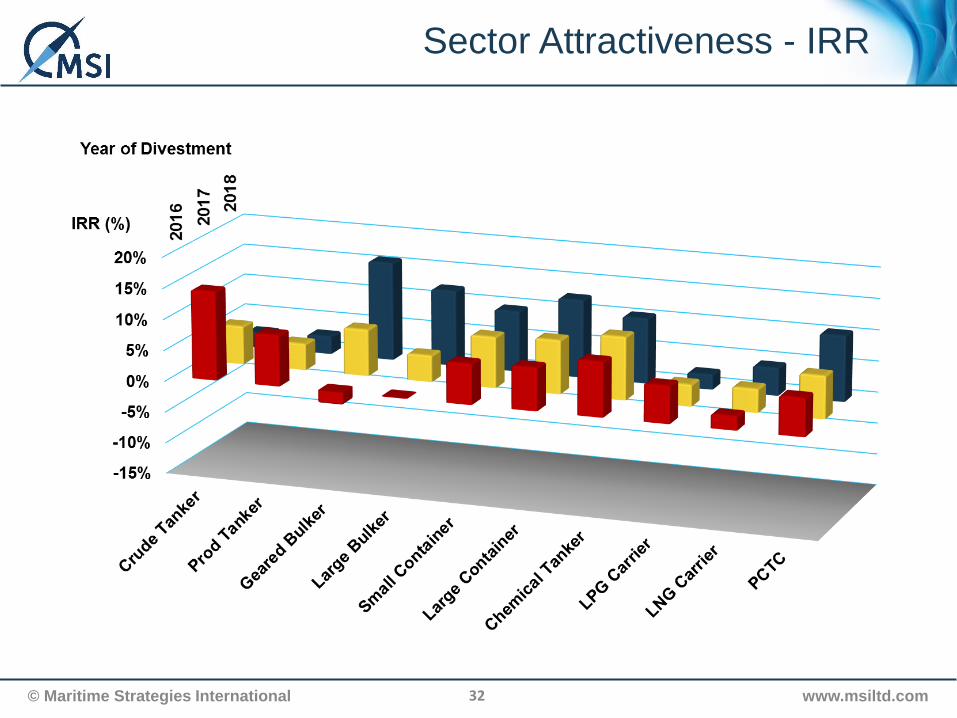
Sector Attractiveness - IRR
© Maritime Strategies International www.msiltd.com32

Summary
© Maritime Strategies International www.msiltd.com33
• Current secondhand prices only make sense if all drivers are viewed together
• Many shipyards will be underemployed in 2017, especially those yards bulkers
focus
• There will be further yard capacity closures, this will help support newbuilding prices
in the medium term
• Costs and exchange rates will help determine what yards survive
• Scrap prices will not recover whilst ISC imports cheap Chinese steel
• Shipping remains cyclical and what goes down must go up (eventually!)
• Bulker and Tanker depreciations are currently at historical extremes
• MSI’s Forecast Marine eValuator (FMV) online product can show the attractiveness
of a specific vessel, in terms of both value and cash flow projections

© Maritime Strategies International www.msiltd.com34
Thank you

For over 30 years, MSI has developed integrated relationships with a diverse clientbase of financial institutions, ship owners, shipyards, brokers, investors, insurersand equipment and service providers.
MSI’s expertise covers a broad range of shipping sectors, providing clients with acombination of sector reports, forecasting models, vessel valuations and bespokeconsultancy services.
MSI is staffed by economists and scientists offering a structured quantitativeperspective to shipping analysis combined with a wide range of industryexperience.
MSI balances analytical power with service flexibility, offering a comprehensivesupport structure and a sound foundation on which to build investment strategiesand monitor/assess exposure to market risks.
MSI Background
© Maritime Strategies International www.msiltd.com35
While this document has been prepared, and is presented, in good faith, MaritimeStrategies International assumes no responsibility for errors of fact, opinion ormarket changes, and cannot be held responsible for any losses incurred or actionarising as a result of information contained in this document.
The copyright and other intellectual property rights in data, information or advicecontained in this document are and will at all times remain the property ofMaritime Strategies International.
Disclaimer
© Maritime Strategies International www.msiltd.com36
6 Baden Place
Crosby Row
London SE1 1YW
United Kingdom
Tel: +44 (0)207 940 0070
Fax: +44 (0)207 940 0071
Email: [email protected]
www.msiltd.com
Maritime Strategies International Ltd
Related Documents