Review Article Prevalence of Microorganisms of Public Health Significance in Ready-to-Eat Foods Sold in Developing Countries: Systematic Review and Meta-Analysis Dechasa Adare Mengistu and Sina Temesgen Tolera Department of Environmental Health, College of Health and Medical Science, Haramaya University, Harar, PO. Box 235 Dire Dawa, Ethiopia Correspondence should be addressed to Dechasa Adare Mengistu; [email protected] Received 9 August 2020; Revised 17 September 2020; Accepted 19 October 2020; Published 2 November 2020 Academic Editor: Alejandro Castillo Copyright © 2020 Dechasa Adare Mengistu and Sina Temesgen Tolera. This is an open access article distributed under the Creative Commons Attribution License, which permits unrestricted use, distribution, and reproduction in any medium, provided the original work is properly cited. Background. The issue of microbial quality and safety of ready-to-eat foods has become a public health concern that needs to be addressed to protect the consumer’s health. Contamination of ready-to-eat foods by enteric pathogens such as Escherichia coli, Salmonella, and Staphylococcus aureus bacteria is associated with potential health risks and can cause foodborne outbreaks. Thus, the systematic review and meta-analysis aimed at determining the overall evidence on the prevalence of microorganisms of public health significance in ready-to-eat foods based on previous studies. Methods. The articles published from 2015 to 2020 were searched from multiple electronic databases such as PubMed, Google Scholar, MEDLINE, CINAHL, Science Direct, Web of Science, and the Directory of Open Access Journals. The JBI critical appraisal tool was applied to the included articles. To determine the heterogeneity among the included articles, I 2 statistics were used while publication bias was evaluated using the visual funnel plot. A Forest plot using the random effect model for meta-analysis was used to estimate the pooled prevalence of E. coli, Salmonella, and S. aureus in ready to eat foods. Results. The pooled prevalence of E. coli, Salmonella, and S. aureus in ready to eat foods was 33.8% (95% CI: 19.9, 51.2; Q value = 67:080, I 2 = 89:56%), 26.0% (95% CI: 13.8, 43.6%; Q value = 83:67, I 2 = 91:63%), and 46.3% (95% CI: 24.8, 69.4%, I 2 = 94:9%), respectively. Conclusion. The findings show that contamination of ready-to-eat foods with pathogenic microorganisms continues to be a public health risk. Thus, effective food hygiene and safety systems are necessary to protect the health of the consumers and the public as a whole. 1. Background Ready-to-eat foods (RTF) are defined as foods being ready for consumption that could be raw or cooked, hot, or chilled and can be consumed without further treatment or any processing [1, 2]. The consumption of various types of ready-to-eat foods in public places has become common worldwide. Due to the vital role of foods in human exis- tence, it is important to maintain food safety to ensure that human being is safe from foodborne diseases or other related health hazards [3]. Ready-to-eat foods play a vital role in meeting the food requirements of many inhabitants and being appreciated by consumers for their affordability, accessibility, variety, and unique organoleptic properties [4–6]. However, unless they are handled under hygienic conditions and safety, ready-to- eat foods can serve as a good medium for the growth and multiplication of various pathogenic microorganisms of public health concern. The World Health Organization estimated more than 200 various types of diseases or ill- nesses caused or spread by foods [7]. However, the most common foodborne pathogen includes but is not limited to Bacillus cereus, Clostridium botulinum, Escherichia coli, Shigella spp., Salmonella spp., Staphylococcus aureus, and Campylobacter [8]. Currently, the incidence of foodborne illness involving a broad range of diseases caused by pathogenic microorgan- isms is rising worldwide and becomes a public health concern Hindawi International Journal of Food Science Volume 2020, Article ID 8867250, 9 pages https://doi.org/10.1155/2020/8867250

Welcome message from author
This document is posted to help you gain knowledge. Please leave a comment to let me know what you think about it! Share it to your friends and learn new things together.
Transcript
Review ArticlePrevalence of Microorganisms of Public Health Significance inReady-to-Eat Foods Sold in Developing Countries: SystematicReview and Meta-Analysis
Dechasa Adare Mengistu and Sina Temesgen Tolera
Department of Environmental Health, College of Health and Medical Science, Haramaya University, Harar,PO. Box 235 Dire Dawa, Ethiopia
Correspondence should be addressed to Dechasa Adare Mengistu; [email protected]
Received 9 August 2020; Revised 17 September 2020; Accepted 19 October 2020; Published 2 November 2020
Academic Editor: Alejandro Castillo
Copyright © 2020 Dechasa Adare Mengistu and Sina Temesgen Tolera. This is an open access article distributed under the CreativeCommons Attribution License, which permits unrestricted use, distribution, and reproduction in any medium, provided theoriginal work is properly cited.
Background. The issue of microbial quality and safety of ready-to-eat foods has become a public health concern that needs to beaddressed to protect the consumer’s health. Contamination of ready-to-eat foods by enteric pathogens such as Escherichia coli,Salmonella, and Staphylococcus aureus bacteria is associated with potential health risks and can cause foodborne outbreaks. Thus,the systematic review and meta-analysis aimed at determining the overall evidence on the prevalence of microorganisms of publichealth significance in ready-to-eat foods based on previous studies. Methods. The articles published from 2015 to 2020 weresearched from multiple electronic databases such as PubMed, Google Scholar, MEDLINE, CINAHL, Science Direct, Web ofScience, and the Directory of Open Access Journals. The JBI critical appraisal tool was applied to the included articles. Todetermine the heterogeneity among the included articles, I2 statistics were used while publication bias was evaluated using thevisual funnel plot. A Forest plot using the random effect model for meta-analysis was used to estimate the pooled prevalence of E.coli, Salmonella, and S. aureus in ready to eat foods. Results. The pooled prevalence of E. coli, Salmonella, and S. aureus in ready toeat foods was 33.8% (95% CI: 19.9, 51.2; Q value = 67:080, I2 = 89:56%), 26.0% (95% CI: 13.8, 43.6%; Q value = 83:67, I2 = 91:63%),and 46.3% (95% CI: 24.8, 69.4%, I2 = 94:9%), respectively. Conclusion. The findings show that contamination of ready-to-eat foodswith pathogenic microorganisms continues to be a public health risk. Thus, effective food hygiene and safety systems arenecessary to protect the health of the consumers and the public as a whole.
1. Background
Ready-to-eat foods (RTF) are defined as foods being readyfor consumption that could be raw or cooked, hot, or chilledand can be consumed without further treatment or anyprocessing [1, 2]. The consumption of various types ofready-to-eat foods in public places has become commonworldwide. Due to the vital role of foods in human exis-tence, it is important to maintain food safety to ensurethat human being is safe from foodborne diseases or otherrelated health hazards [3].
Ready-to-eat foods play a vital role in meeting the foodrequirements of many inhabitants and being appreciated byconsumers for their affordability, accessibility, variety, and
unique organoleptic properties [4–6]. However, unless theyare handled under hygienic conditions and safety, ready-to-eat foods can serve as a good medium for the growth andmultiplication of various pathogenic microorganisms ofpublic health concern. The World Health Organizationestimated more than 200 various types of diseases or ill-nesses caused or spread by foods [7]. However, the mostcommon foodborne pathogen includes but is not limitedto Bacillus cereus, Clostridium botulinum, Escherichia coli,Shigella spp., Salmonella spp., Staphylococcus aureus, andCampylobacter [8].
Currently, the incidence of foodborne illness involving abroad range of diseases caused by pathogenic microorgan-isms is rising worldwide and becomes a public health concern
HindawiInternational Journal of Food ScienceVolume 2020, Article ID 8867250, 9 pageshttps://doi.org/10.1155/2020/8867250

[9, 10]. And foodborne illnesses are an important challengeto public health and cause a significant economic problemin many countries [11]. In developed countries, an esti-mated one-third of the population is affected by foodbornediseases each year. However, foodborne diseases are com-mon and leading causes of illness in developing countriesbecause of the prevailing poor hygienic and sanitationconditions or practices, weak food safety and regulatorysystems, lack of resources, and lack of education [12, 13].In response to these problems, health and other concernedorganizations are increasing their effort to improve thequality and safety of foods and to prevent foodbornedisease [14]. Thus, it is essential to provide the overall evi-dence on the prevalence of microorganisms of publichealth concern in ready-to-eat foods.
2. Objective
The study aimed to systematically review and provide theoverall current evidence on the prevalence of microorgan-isms of public health concerns in ready-to-eat foods in devel-oping countries.
3. Method
This systematic review and meta-analysis was conductedunder the Preferred Reporting Items for Systematic Reviewsand Meta-Analysis (PRISMA) guidelines [15].
3.1. Eligibility Criteria. The articles that met the followinginclusion criteria were included in the systematic reviewand meta-analysis:
(i) Study Area. Research articles conducted in develop-ing countries.
(ii) Study Design. Cross-sectional studies reported theprevalence of microorganisms of public health con-cern in ready-to-eat foods such as Salmonella, S.aureus, and E. coli.
(iii) Language. Full-text articles published in the Englishlanguage.
(iv) Population. Articles conducted on any type of ready-to-eat foods in developing countries.
(v) Publication Issue. Primary research articles pub-lished in peer-reviewed journals from 2015 to 2020.
3.2. Outcome Measure. The outcome of this systematicreview and meta-analysis is to determine the pooled preva-lence of Escherichia coli, Salmonella, and Staphylococcusaureus in ready-to-eat foods in developing countries. Theprevalence of selected microorganisms was calculated bydividing the number of positive ready-to-eat foods samplesto the total number of ready-to-eat foods samples investi-gated or analyzed (total sample size) multiplied by 100.
3.3. Information Sources and Search Strategy. The articlespublished from 2015 to 2020 were identified through a liter-ature search of electronic databases such as Google Scholar,
PubMed, MEDLINE, CINAHL, Science Direct, Web of Sci-ence, and the Directory of Open Access Journals. FromPubMed databases, articles were searched using a combina-tion of Boolean logic operators (AND, OR, and NOT), Med-ical Subject Headings (MeSH), and keywords. The searcheswere done using the keywords and Boolean logic operatorsas following: (Prevalence∗ OR Occurrence∗ OR frequency∗OR Contamination) AND (Microorganisms∗OR Bacterial∗
OR Microbial∗ OR foodborne pathogens) AND (Public∗
OR Health∗ OR Public health) AND (significance∗ OR con-cern∗ OR hazards∗ OR risk) AND (ready to eat∗ OR street ∗
OR fast∗ OR cooked∗ OR processed∗ OR prepared∗ ORpacked) AND (foods∗ OR meal∗ OR meat∗ OR fruit∗ ORfruit products ∗OR dairy product∗ OR vegetable ∗OR vegeta-ble products, etc..) AND (Sub-Saharan ∗OR Developing∗ ORlow income ∗ORmiddle income) AND (Countries∗ OR ∗ ORregion, Africa, etc.).
The identified keywords and index terms were checkedby authors (Mengistu DA and Tolera ST) across the includedelectronic databases. Additionally, manual searching for fur-ther studies was done by authors (Mengistu DA and ToleraST) to cover other published articles. The last search wasdone on April 20, 2020.
3.4. Study Selection. Duplicated studies were removed usingthe ENDNOTE software version X5 (Thomson Reuters,USA). The authors (Mengistu DA and Tolera ST) individu-ally screened all identified articles based on their titles andabstracts by applying the eligibility criteria. Disagreementswere solved by taking the mean score of the two reviewers(Mengistu DA and Tolera ST) after discussing the rationaleon differences and repeating the review procedure.
3.5. Data Extraction. All required and relevant data wereextracted from the included articles using a predetermineddata abstraction form by authors (Mengistu DA and ToleraST) independently. The extracted data include the name ofthe authors, sample size, the primary outcome (prevalenceof selected microorganisms of public health significance),countries where the article was carried out, year of publica-tion, and study design.
3.6. Quality Assessment. For articles met inclusion criteria,abstracts were checked to establish their relevance for thestudy. The quality of the included articles was assessed usingindependent appraisal tools (JBI Critical Appraisal tools)[16]. Then, the score was taken across all the studies andgraded as high (75% and above score), moderate (50-75%score), and low (<50% score) quality. High quality in thiswork indicates a low risk of bias. Disagreements made amongauthors (Mengistu DA and Tolera ST) on what is to beextracted were solved by discussion. Finally, the authorsfound all articles with a low risk of bias.
3.7. Statistical Procedure. The required data were extractedusing a Microsoft Excel format, 2016. After the extraction,the data were imported to the Comprehensive Meta-Analysis (CMA) V3 statistical package (software). Then,the characteristics of the original articles were describedusing texts, tables, and forest plots. Heterogeneity among
2 International Journal of Food Science
the reported prevalence was checked by using a heteroge-neity I2 test.
The random-effect model of meta-analysis and forest plotwas used to estimate the pooled prevalence of microorgan-isms of public health concern in ready-to-eat foods with95% confidence intervals. The possibility of publication biaswas assessed by visual funnel plots, and a p value of < 0.05was considered as the evidence for publication bias. More-over, subgroup analysis was done based on the countrieswhere the included articles were conducted and publicationyear to minimize the random variations (heterogeneity)between the point estimates of the included articles.
4. Result
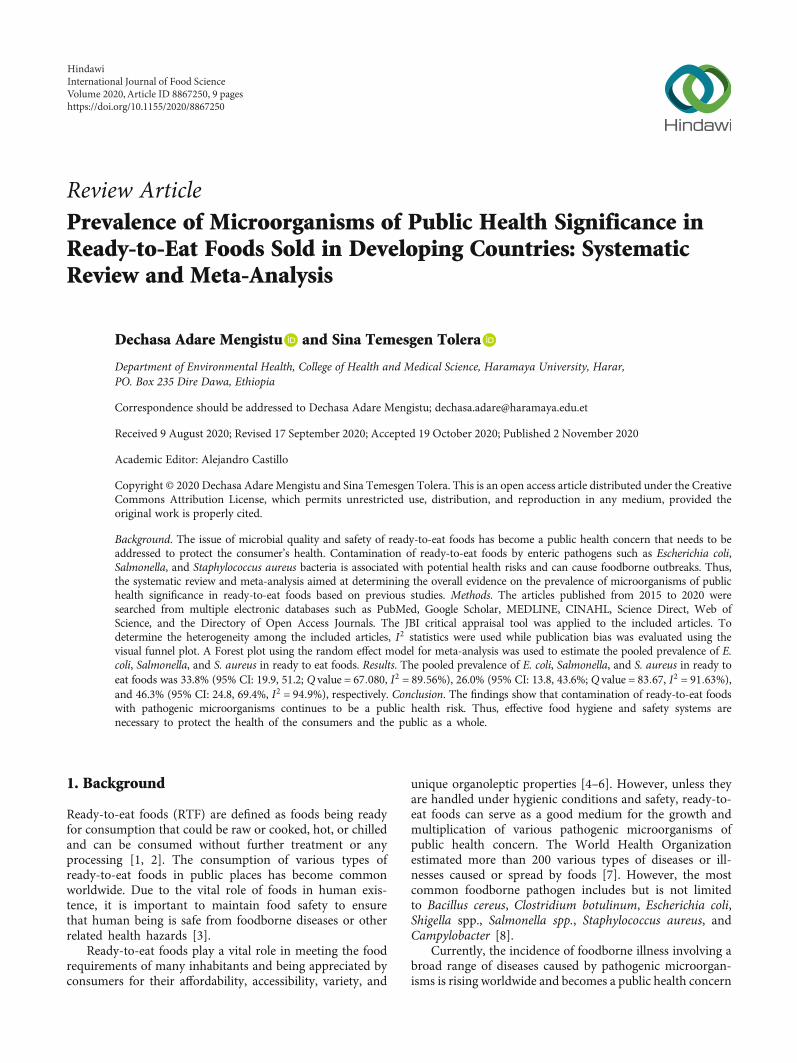
4.1. Study Selection. A total of 1221 articles published from2012 to 2020 were identified using electronic databases andhand searching. After an initial screening of articles by theirtitles and abstracts, 149 duplicate articles were excluded,while 1044 studies were excluded based on the predeter-mined inclusion and exclusion criteria. Then, the full textsof the remaining 28 articles were further assessed to deter-mine their eligibility for the systematic review and meta-analysis. Additionally, 16 articles were excluded as they failedto report the prevalence of selected microorganisms of publichealth concern. Twelve original articles that meet the prede-termined inclusion criteria were included in the systematicreview, of which 8 articles were included in quantitative anal-ysis (meta-analysis) (Figure 1).
4.2. Study Characteristics. In this study, a total of 625 ready-to-eat food samples were included in eight articles publishedfrom 2015 to 2020 that were conducted in seven differentdeveloping countries: one in Ethiopia, two in Nigeria, onein India, one in Pakistan, one in Sudan, one in Namibia,and one in South Africa. All the included articles werecross-sectional studies with a sample size ranging from 15
to 205 ready-to-eat foods. In addition, based on JBI CriticalAppraisal tool [16], all the included articles had a low riskof bias (Table 1).
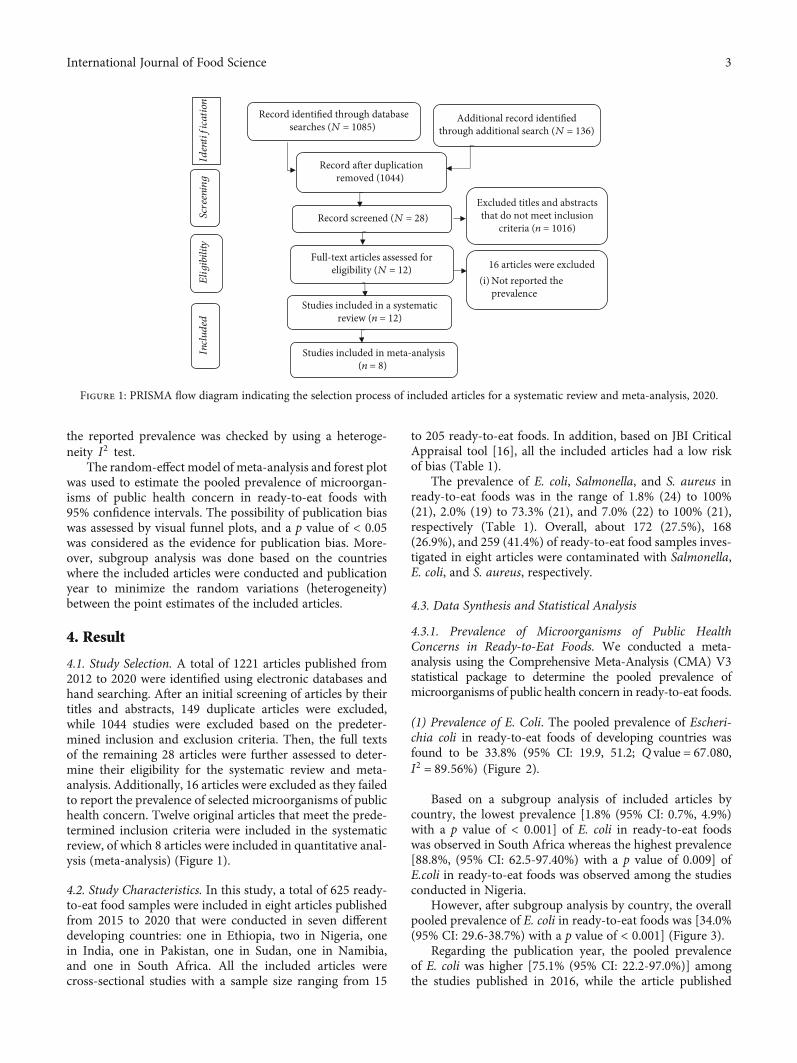
The prevalence of E. coli, Salmonella, and S. aureus inready-to-eat foods was in the range of 1.8% (24) to 100%(21), 2.0% (19) to 73.3% (21), and 7.0% (22) to 100% (21),respectively (Table 1). Overall, about 172 (27.5%), 168(26.9%), and 259 (41.4%) of ready-to-eat food samples inves-tigated in eight articles were contaminated with Salmonella,E. coli, and S. aureus, respectively.
4.3. Data Synthesis and Statistical Analysis
4.3.1. Prevalence of Microorganisms of Public HealthConcerns in Ready-to-Eat Foods. We conducted a meta-analysis using the Comprehensive Meta-Analysis (CMA) V3statistical package to determine the pooled prevalence ofmicroorganisms of public health concern in ready-to-eat foods.
(1) Prevalence of E. Coli. The pooled prevalence of Escheri-chia coli in ready-to-eat foods of developing countries wasfound to be 33.8% (95% CI: 19.9, 51.2; Q value = 67:080,I2 = 89:56%) (Figure 2).
Based on a subgroup analysis of included articles bycountry, the lowest prevalence [1.8% (95% CI: 0.7%, 4.9%)with a p value of < 0.001] of E. coli in ready-to-eat foodswas observed in South Africa whereas the highest prevalence[88.8%, (95% CI: 62.5-97.40%) with a p value of 0.009] ofE.coli in ready-to-eat foods was observed among the studiesconducted in Nigeria.
However, after subgroup analysis by country, the overallpooled prevalence of E. coli in ready-to-eat foods was [34.0%(95% CI: 29.6-38.7%) with a p value of < 0.001] (Figure 3).
Regarding the publication year, the pooled prevalenceof E. coli was higher [75.1% (95% CI: 22.2-97.0%)] amongthe studies published in 2016, while the article published
Included
Identification
Screening
Eligibility
Record a�er duplicationremoved (1044)
Excluded titles and abstractsthat do not meet inclusion
criteria (n = 1016)Record screened (N = 28)
Full-text articles assessed foreligibility (N = 12) 16 articles were excluded
(i) Not reported theprevalence
Studies included in a systematicreview (n = 12)
Additional record identifiedthrough additional search (N = 136)
Record identified through databasesearches (N = 1085)
Studies included in meta-analysis(n = 8)
Figure 1: PRISMA flow diagram indicating the selection process of included articles for a systematic review and meta-analysis, 2020.
3International Journal of Food Science
in 2020 reported lower [1.8% (95% CI: 0.7%, 4.9%) with pvalue of < 0.001] prevalence (Figure 4).
(2) Prevalence of Salmonella. The pooled prevalence ofSalmonella in ready-to-eat foods of developing countries
was found to be 26.0% (95% CI: 13.8, 43.6%; Q value =83:67, I2 = 91:63%) (Figure 5).
Among all countries, the lowest prevalence [2.0% (95%CI: 0.2%, 15.7%) with a p value of = 0.001] of Salmonella in
Table 1: Overall characteristics of included articles in systematic review and meta-analysis, 2020.
AuthorsPublication
YearN Study design
Prevalence of selectedmicroorganisms Country Risk of bias References
E. coli Salmonella S. aureus
Temesgen et al. 2016 71 Cross-sectional 29.6% 12.7% 9.9% Ethiopia Low [17]
Reddi et al. 2015 150 Cross-sectional 42.6% 48.6% 73.3% India Low [18]
Asghar et al. 2018 40 Cross-sectional 30% 2.0% 70.0% Pakistan Low [19]
Elhag et al. 2015 30 Cross-sectional 26.7% 13.3% 55% Sudan Low [20]
Ire and Imuh 2016 15 Cross-sectional 100% 73.3% 100% Nigeria Low [21]
Shiningeni et al. 2019 96 Cross-sectional 35.0% 11.0% 7.0% Namibia Low [22]
Okechukwu et al. 2016 17 Cross-sectional 83.3% 66.7% 66.7% Nigeria Low [23]
Asiegbu et al. 2020 205 Cross-sectional 1.8% 21.8% 31.8% South Africa Low [24]
N : sample size; E. coli: Escherichia Coli; S. aureus: Staphylococcus aureus.
Study name
Statistics for each study Event rate and 95% CI
Lowerlimit
Upperlimit
Eventrate Z-value p-value
Temesgen et al. 0.296 0.202 0.412 –3.333 0.001Reddi et al. 0.426 0.349 0.506 –1.806 0.071Asghar et al. 0.300 0.179 0.457 –2.456 0.014Elhag et al. 0.267 0.140 0.450 –2.447 0.014Ire and Imuh 0.969 0.650 0.998 2.390 0.017Shiningeni et al. 0.350 0.261 0.450 –2.893 0.004Okechukwu et al. 0.833 0.582 0.947 2.471 0.013Asiegbu et al. 0.018 0.007 0.049 –7.613 0.000
0.338 0.199 0.512 –1.828 0.068
–1.00 –0.50 0.00 0.50 1.00I squared = 89.565%, p-value = 0.000Random model
Figure 2: Forest plot shows the pooled prevalence of E. coli in ready-to-eat foods in developing countries, 2020.
Group bystudy area Study name
Statistics for each study Event rate and 95% CIEventrate
Lowerlimit
Upperlimit Z-value p-value
Ethiopia Temesgen et al. 0.296 0.202 0.412 –3.333 0.001Ethiopia 0.296 0.202 0.412 –3.333 0.001India Reddi et al. 0.426 0.349 0.506 –1.806 0.071India 0.426 0.349 0.506 –1.806 0.071Namibia Shiningeni et al. 0.350 0.261 0.450 –2.893 0.004Namibia 0.350 0.261 0.450 –2.893 0.004Nigeria Ire and Imuh 0.969 0.650 0.998 2.390 0.017Nigeria Okechukwu et al. 0.833 0.582 0.947 2.471 0.013Nigeria 0.888 0.625 0.974 2.604 0.009Pakistan Asghar et al. 0.300 0.179 0.457 –2.456 0.014Pakistan 0.300 0.179 0.457 –2.456 0.014South Africa Asiegbu et al. 0.018 0.007 0.049 –7.613 0.000South Africa 0.018 0.007 0.049 –7.613 0.000Sudan Elhag et al. 0.267 0.140 0.450 –2.447 0.014Sudan 0.267 0.140 0.450 –2.447 0.014Overall 0.340 0.296 0.387 –6.389 0.000
–1.00 –0.50 0.00 0.50 1.00Random model
Figure 3: Subgroup analysis of the pooled prevalence of E. coli in ready-to-eat foods based on countries of developing countries, 2020.
4 International Journal of Food Science
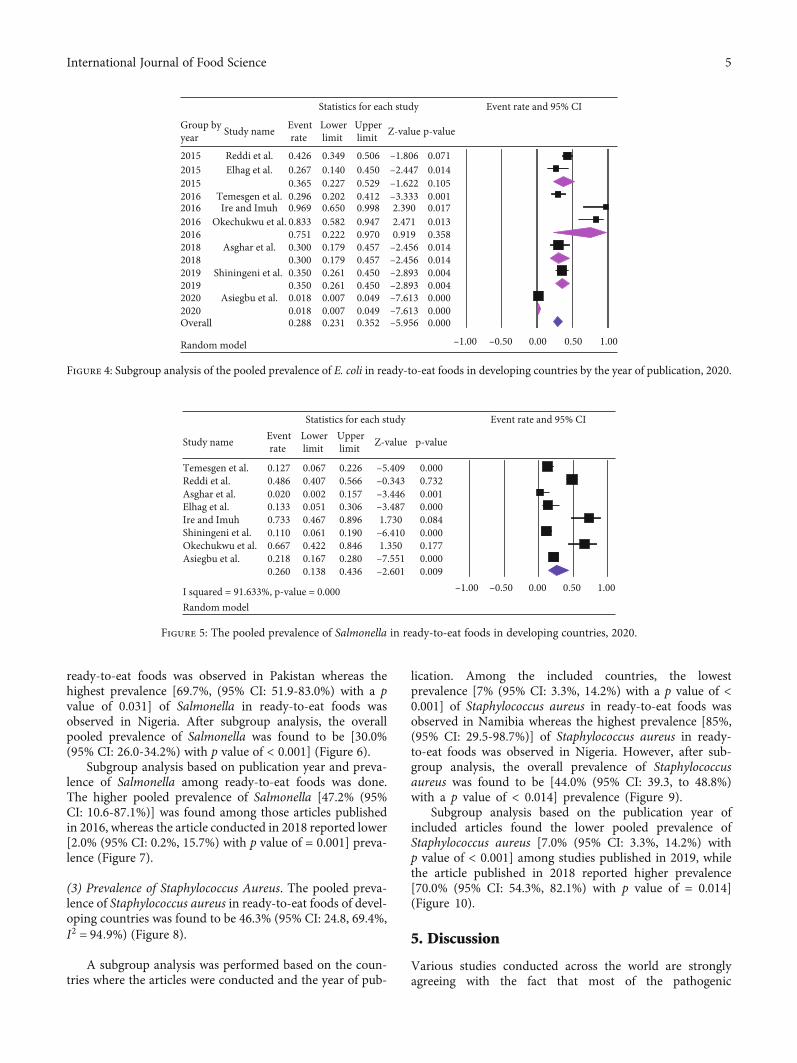
ready-to-eat foods was observed in Pakistan whereas thehighest prevalence [69.7%, (95% CI: 51.9-83.0%) with a pvalue of 0.031] of Salmonella in ready-to-eat foods wasobserved in Nigeria. After subgroup analysis, the overallpooled prevalence of Salmonella was found to be [30.0%(95% CI: 26.0-34.2%) with p value of < 0.001] (Figure 6).
Subgroup analysis based on publication year and preva-lence of Salmonella among ready-to-eat foods was done.The higher pooled prevalence of Salmonella [47.2% (95%CI: 10.6-87.1%)] was found among those articles publishedin 2016, whereas the article conducted in 2018 reported lower[2.0% (95% CI: 0.2%, 15.7%) with p value of = 0.001] preva-lence (Figure 7).
(3) Prevalence of Staphylococcus Aureus. The pooled preva-lence of Staphylococcus aureus in ready-to-eat foods of devel-oping countries was found to be 46.3% (95% CI: 24.8, 69.4%,I2 = 94:9%) (Figure 8).
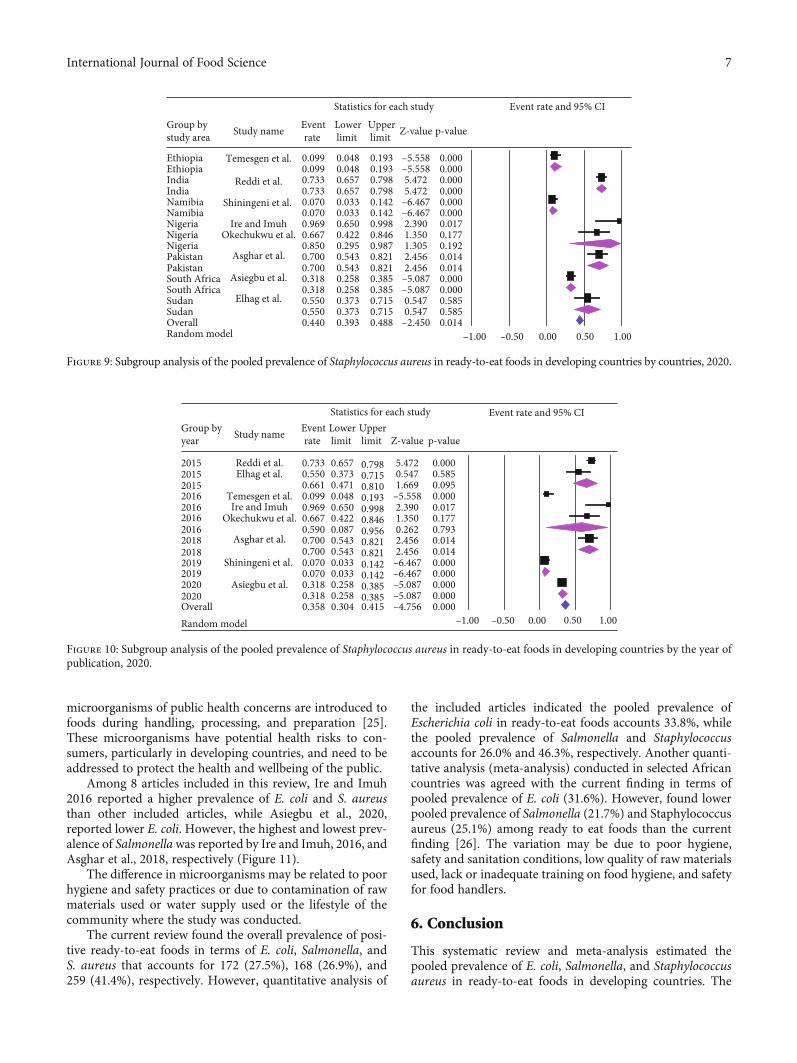
A subgroup analysis was performed based on the coun-tries where the articles were conducted and the year of pub-
lication. Among the included countries, the lowestprevalence [7% (95% CI: 3.3%, 14.2%) with a p value of <0.001] of Staphylococcus aureus in ready-to-eat foods wasobserved in Namibia whereas the highest prevalence [85%,(95% CI: 29.5-98.7%)] of Staphylococcus aureus in ready-to-eat foods was observed in Nigeria. However, after sub-group analysis, the overall prevalence of Staphylococcusaureus was found to be [44.0% (95% CI: 39.3, to 48.8%)with a p value of < 0.014] prevalence (Figure 9).
Subgroup analysis based on the publication year ofincluded articles found the lower pooled prevalence ofStaphylococcus aureus [7.0% (95% CI: 3.3%, 14.2%) withp value of < 0.001] among studies published in 2019, whilethe article published in 2018 reported higher prevalence[70.0% (95% CI: 54.3%, 82.1%) with p value of = 0.014](Figure 10).
5. Discussion
Various studies conducted across the world are stronglyagreeing with the fact that most of the pathogenic
Group byyear Study name
Statistics for each study Event rate and 95% CI
Eventrate
Lowerlimit
Upperlimit Z-value p-value
2015 Reddi et al. 0.426 0.349 0.506 –1.806 0.0712015 Elhag et al. 0.267 0.140 0.450 0.0142015 0.365 0.227 0.529 –1.622 0.1052016 Temesgen et al. 0.296 0.202 0.412 –3.333 0.0012016 Ire and Imuh 0.969 0.650 0.998 2.390 0.0172016 Okechukwu et al. 0.833 0.582 0.947 2.471 0.0132016 0.751 0.222 0.970 0.919 0.3582018 Asghar et al. 0.300 0.179 0.457 –2.456 0.0142018 0.300 0.179 0.457 –2.456 0.0142019 Shiningeni et al. 0.350 0.261 0.450 –2.893 0.0042019 0.350 0.261 0.450 –2.893 0.0042020 Asiegbu et al. 0.018 0.007 0.049 –7.613 0.0002020 0.018 0.007 0.049 –7.613 0.000Overall 0.288 0.231 0.352 –5.956 0.000
–1.00 –0.50 0.00 0.50 1.00
–2.447
Random model
Figure 4: Subgroup analysis of the pooled prevalence of E. coli in ready-to-eat foods in developing countries by the year of publication, 2020.
Study name
Statistics for each study Event rate and 95% CIEventrate
Lowerlimit
Upperlimit Z-value p-value
Temesgen et al. 0.127 0.067 0.226 –5.409 0.000Reddi et al. 0.486 0.407 0.566 –0.343 0.732Asghar et al. 0.020 0.002 0.157 –3.446 0.001Elhag et al. 0.133 0.051 0.306 –3.487 0.000Ire and Imuh 0.733 0.467 0.896 1.730 0.084Shiningeni et al. 0.110 0.061 0.190 –6.410 0.000Okechukwu et al. 0.667 0.422 0.846 1.350 0.177Asiegbu et al. 0.218 0.167 0.280 –7.551 0.000
0.260 0.138 0.436 –2.601 0.009–1.00 –0.50 0.00 0.50 1.00I squared = 91.633%, p-value = 0.000
Random model
Figure 5: The pooled prevalence of Salmonella in ready-to-eat foods in developing countries, 2020.
5International Journal of Food Science

Group bystudy area Study name
Statistics for each study Event rate and 95% CI
Eventrate
Lowerlimit
Upperlimit Z-value p-value
Ethiopia Temesgen et al. 0.127 0.067 0.226 –5.409 0.000Ethiopia 0.127 0.067 0.226 –5.409 0.000India Reddi et al. 0.486 0.407 0.566 –0.343 0.732India 0.486 0.407 0.566 –0.343 0.732Namibia Shiningeni et al. 0.110 0.061 0.190 –6.410 0.000Namibia 0.110 0.061 0.190 –6.410 0.000Nigeria Ire and Imuh 0.733 0.467 0.896 1.730 0.084Nigeria Okechukwu et al. 0.667 0.422 0.846 1.350 0.177Nigeria 0.697 0.519 0.830 2.157 0.031Pakistan Asghar et al. 0.020 0.002 0.157 –3.446 0.001Pakistan 0.020 0.002 0.157 –3.446 0.001South Africa Asiegbu et al. 0.218 0.167 0.280 –7.551 0.000South Africa 0.218 0.167 0.280 –7.551 0.000Sudan Elhag et al. 0.133 0.051 0.306 –3.487 0.000Sudan 0.133 0.051 0.306 –3.487 0.000Overall 0.300 0.260 0.342 –8.524 0.000
–1.00 –0.50 0.00 0.50 1.00Random model
Figure 6: Subgroup analysis of the pooled prevalence of Salmonella in ready-to-eat foods in developing countries by countries, 2020.
Group byyear Study name
Statistics for each study Event rate and 95% CI
Eventrate
Lowerlimit
Upperlimit Z-value p-value
2015 Reddi et al. 0.486 0.407 0.566 –0.343 0.7322015 Elhag et al. 0.133 0.051 0.306 –3.487 0.0002015 0.290 0.065 0.708 –0.985 0.3242016 Temesgen et al. 0.127 0.067 0.226 –5.409 0.0002016 Ire and Imuh 0.733 0.467 0.896 1.730 0.0842016 Okechukwu et al. 0.667 0.422 0.846 1.350 0.1772016 0.472 0.106 0.871 –0.107 0.9152018 Asghar et al. 0.020 0.002 0.157 –3.446 0.0012018 0.020 0.002 0.157 –3.446 0.0012019 Shiningeni et al. 0.110 0.061 0.190 –6.410 0.0002019 0.110 0.061 0.190 –6.410 0.0002020 Asiegbu et al. 0.218 0.167 0.280 –7.551 0.0002020 0.218 0.167 0.280 –7.551 0.000Overall 0.190 0.150 0.238 –9.966 0.000
–1.00 –0.50 0.00 0.50 1.00Random model
Figure 7: Subgroup analysis of the pooled prevalence of Salmonella in ready-to-eat foods in developing countries by the year ofpublication, 2020.
Study name
Statistics for each study Event rate and 95% CI
Eventrate
Lowerlimit
Upperlimit Z-value p-value
Temesgen et al. 0.099 0.048 0.193 –5.558 0.000Reddi et al. 0.733 0.657 0.798 5.472 0.000Asghar et al. 0.700 0.543 0.821 2.456 0.014Elhag et al. 0.550 0.373 0.715 0.547 0.585Ire and Imuh 0.969 0.650 0.998 2.390 0.017Shiningeni et al. 0.070 0.033 0.142 –6.467 0.000Okechukwu et al. 0.667 0.422 0.846 1.350 0.177Asiegbu et al. 0.318 0.258 0.385 –5.087 0.000
0.463 0.248 0.694 –0.299 0.765–1.00 –0.50 0.00 0.50 1.00I squared = 94.929%, p-value = 0.000
Random model
Figure 8: The pooled prevalence of Staphylococcus aureus in ready-to-eat foods in developing countries, 2020.
6 International Journal of Food Science
microorganisms of public health concerns are introduced tofoods during handling, processing, and preparation [25].These microorganisms have potential health risks to con-sumers, particularly in developing countries, and need to beaddressed to protect the health and wellbeing of the public.
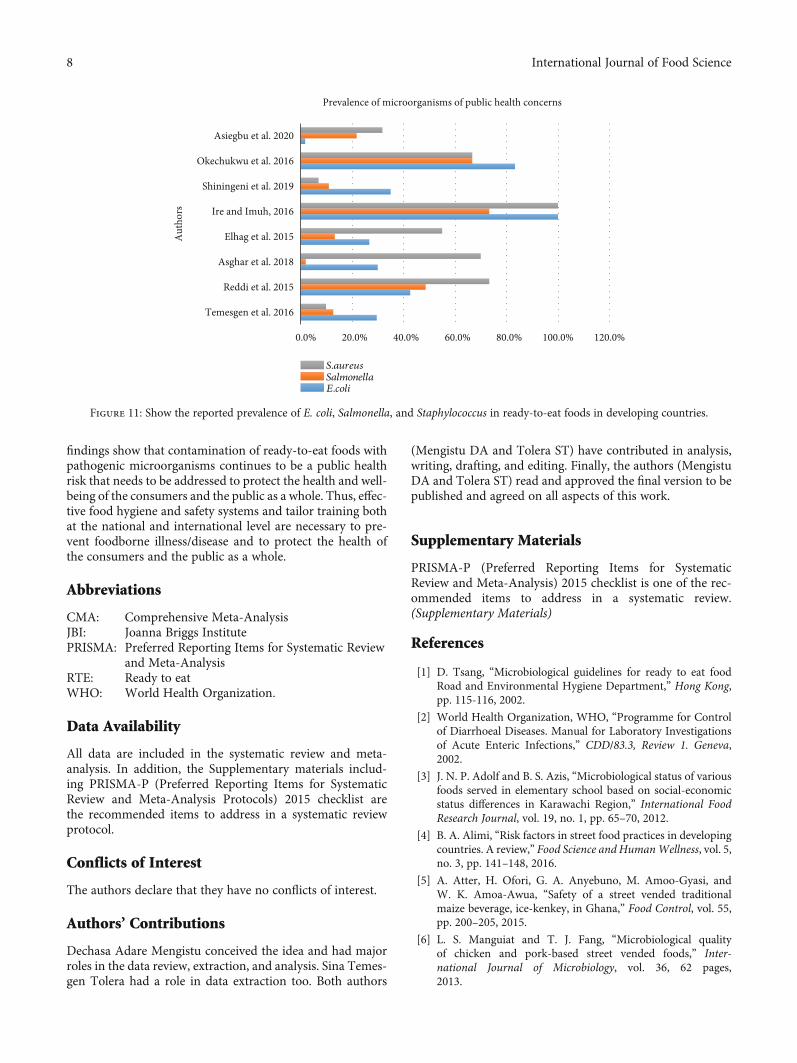
Among 8 articles included in this review, Ire and Imuh2016 reported a higher prevalence of E. coli and S. aureusthan other included articles, while Asiegbu et al., 2020,reported lower E. coli. However, the highest and lowest prev-alence of Salmonellawas reported by Ire and Imuh, 2016, andAsghar et al., 2018, respectively (Figure 11).
The difference in microorganisms may be related to poorhygiene and safety practices or due to contamination of rawmaterials used or water supply used or the lifestyle of thecommunity where the study was conducted.
The current review found the overall prevalence of posi-tive ready-to-eat foods in terms of E. coli, Salmonella, andS. aureus that accounts for 172 (27.5%), 168 (26.9%), and259 (41.4%), respectively. However, quantitative analysis of
the included articles indicated the pooled prevalence ofEscherichia coli in ready-to-eat foods accounts 33.8%, whilethe pooled prevalence of Salmonella and Staphylococcusaccounts for 26.0% and 46.3%, respectively. Another quanti-tative analysis (meta-analysis) conducted in selected Africancountries was agreed with the current finding in terms ofpooled prevalence of E. coli (31.6%). However, found lowerpooled prevalence of Salmonella (21.7%) and Staphylococcusaureus (25.1%) among ready to eat foods than the currentfinding [26]. The variation may be due to poor hygiene,safety and sanitation conditions, low quality of raw materialsused, lack or inadequate training on food hygiene, and safetyfor food handlers.
6. Conclusion
This systematic review and meta-analysis estimated thepooled prevalence of E. coli, Salmonella, and Staphylococcusaureus in ready-to-eat foods in developing countries. The
Group bystudy area Study name
Statistics for each study Event rate and 95% CI
Eventrate
Lowerlimit
Upperlimit Z-value p-value
Ethiopia Temesgen et al. 0.099 0.048 0.193 –5.558 0.000Ethiopia 0.099 0.048 0.193 –5.558 0.000India Reddi et al. 0.733 0.657 0.798 5.472 0.000India 0.733 0.657 0.798 5.472 0.000Namibia Shiningeni et al. 0.070 0.033 0.142 –6.467 0.000Namibia 0.070 0.033 0.142 –6.467 0.000Nigeria Ire and Imuh 0.969 0.650 0.998 2.390 0.017Nigeria Okechukwu et al. 0.667 0.422 0.846 1.350 0.177Nigeria 0.850 0.295 0.987 1.305 0.192Pakistan Asghar et al. 0.700 0.543 0.821 2.456 0.014Pakistan 0.700 0.543 0.821 2.456 0.014South Africa Asiegbu et al. 0.318 0.258 0.385 –5.087 0.000South Africa 0.318 0.258 0.385 –5.087 0.000Sudan Elhag et al. 0.550 0.373 0.715 0.547 0.585Sudan 0.550 0.373 0.715 0.547 0.585Overall 0.440 0.393 0.488 –2.450 0.014
–1.00 –0.50 0.00 0.50 1.00Random model
Figure 9: Subgroup analysis of the pooled prevalence of Staphylococcus aureus in ready-to-eat foods in developing countries by countries, 2020.
Group byyear Study name
Statistics for each study Event rate and 95% CIEventrate
Lowerlimit
Upperlimit Z-value p-value
2015 Reddi et al. 0.733 0.657 0.798 5.472 0.0002015 Elhag et al. 0.550 0.373 0.715 0.547 0.5852015 0.661 0.471 0.810 1.669 0.0952016 Temesgen et al. 0.099 0.048 0.193 –5.558 0.0002016 Ire and Imuh 0.969 0.650 0.998 2.390 0.0172016 Okechukwu et al. 0.667 0.422 0.846 1.350 0.1772016 0.590 0.087 0.956 0.262 0.7932018 Asghar et al. 0.700 0.543 0.821 2.456 0.0142018 0.700 0.543 0.821 2.456 0.0142019 Shiningeni et al. 0.070 0.033 0.142 –6.467 0.0002019 0.070 0.033 0.142 –6.467 0.0002020 Asiegbu et al. 0.318 0.258 0.385 –5.087 0.0002020 0.318 0.258 0.385 –5.087 0.000Overall 0.358 0.304 0.415 –4.756 0.000
–1.00 –0.50 0.00 0.50 1.00Random model
Figure 10: Subgroup analysis of the pooled prevalence of Staphylococcus aureus in ready-to-eat foods in developing countries by the year ofpublication, 2020.
7International Journal of Food Science
findings show that contamination of ready-to-eat foods withpathogenic microorganisms continues to be a public healthrisk that needs to be addressed to protect the health and well-being of the consumers and the public as a whole. Thus, effec-tive food hygiene and safety systems and tailor training bothat the national and international level are necessary to pre-vent foodborne illness/disease and to protect the health ofthe consumers and the public as a whole.
Abbreviations
CMA: Comprehensive Meta-AnalysisJBI: Joanna Briggs InstitutePRISMA: Preferred Reporting Items for Systematic Review
and Meta-AnalysisRTE: Ready to eatWHO: World Health Organization.
Data Availability
All data are included in the systematic review and meta-analysis. In addition, the Supplementary materials includ-ing PRISMA-P (Preferred Reporting Items for SystematicReview and Meta-Analysis Protocols) 2015 checklist arethe recommended items to address in a systematic reviewprotocol.
Conflicts of Interest
The authors declare that they have no conflicts of interest.
Authors’ Contributions
Dechasa Adare Mengistu conceived the idea and had majorroles in the data review, extraction, and analysis. Sina Temes-gen Tolera had a role in data extraction too. Both authors
(Mengistu DA and Tolera ST) have contributed in analysis,writing, drafting, and editing. Finally, the authors (MengistuDA and Tolera ST) read and approved the final version to bepublished and agreed on all aspects of this work.
Supplementary Materials
PRISMA-P (Preferred Reporting Items for SystematicReview and Meta-Analysis) 2015 checklist is one of the rec-ommended items to address in a systematic review.(Supplementary Materials)
References
[1] D. Tsang, “Microbiological guidelines for ready to eat foodRoad and Environmental Hygiene Department,” Hong Kong,pp. 115-116, 2002.
[2] World Health Organization, WHO, “Programme for Controlof Diarrhoeal Diseases. Manual for Laboratory Investigationsof Acute Enteric Infections,” CDD/83.3, Review 1. Geneva,2002.
[3] J. N. P. Adolf and B. S. Azis, “Microbiological status of variousfoods served in elementary school based on social-economicstatus differences in Karawachi Region,” International FoodResearch Journal, vol. 19, no. 1, pp. 65–70, 2012.
[4] B. A. Alimi, “Risk factors in street food practices in developingcountries. A review,” Food Science and HumanWellness, vol. 5,no. 3, pp. 141–148, 2016.
[5] A. Atter, H. Ofori, G. A. Anyebuno, M. Amoo-Gyasi, andW. K. Amoa-Awua, “Safety of a street vended traditionalmaize beverage, ice-kenkey, in Ghana,” Food Control, vol. 55,pp. 200–205, 2015.
[6] L. S. Manguiat and T. J. Fang, “Microbiological qualityof chicken and pork-based street vended foods,” Inter-national Journal of Microbiology, vol. 36, 62 pages,2013.
0.0% 20.0% 40.0% 60.0% 80.0% 100.0% 120.0%
Temesgen et al. 2016
Reddi et al. 2015
Asghar et al. 2018
Elhag et al. 2015
Ire and Imuh, 2016
Shiningeni et al. 2019
Okechukwu et al. 2016
Asiegbu et al. 2020
Aut
hors
Prevalence of microorganisms of public health concerns
S.aureusSalmonellaE.coli
Figure 11: Show the reported prevalence of E. coli, Salmonella, and Staphylococcus in ready-to-eat foods in developing countries.
8 International Journal of Food Science
[7] WHO/FAO, “Assuring Food Safety and Quality: Guidelinesfor Strengthening National Food Control Systems,” Food andNutrition Paper, no. 76, 2015.
[8] T. Rahman, S. Hasan, and R. Noor, “An assessment of micro-biological quality of some commercially packed and fresh fruitjuice available in Dhaka city: A comparative study,” StamfordJournal of Microbiology, vol. 1, no. 1, pp. 13–18, 2011.
[9] WHO, “Food Safety and Nutrition during Pregnancy andInfant Feeding,” INFOSAN Information Note, no. 3, 2008.
[10] R. De Vogli, A. Kouvonen, and D. Gimeno, “The influence ofmarket deregulation on fast food consumption and bodymass index: a cross-national time-series analysis,” Bulletinof the World Health Organization, vol. 92, no. 99, p. 107,2014.
[11] WHO, “WHO’s first-ever global estimates of foodborne dis-eases,” http://journals.plos.org/plosmedicine/article?id=10.1371/journal?.
[12] G. Andargie, A. Kassu, F. Moges, M. Tiruneh, and K. Huruy,“Prevalence of bacteria and intestinal parasites among foodhandlers in Gondar town, northwest Ethiopia,” Journal ofHealth, Population and Nutrition, vol. 26, pp. 451–454, 2009.
[13] WHO, 10 Facts on Food Safety2015, http://www.who.int/features/factfiles/food_safety/facts/en/index.html.
[14] J. C. Heaton and K. Jones, “Microbial contamination of fruitand vegetables and behavior of enteropathogens in the phyllo-sphere: a review,” Journal of Applied Microbiology, vol. 104,pp. 613–626, 2008.
[15] PRISMA-P Group, D. Moher, L. Shamseer et al., “Preferredreporting items for systematic review and meta-analysis proto-cols (PRISMA-P) 2015 statement,” Systematic Reviews, vol. 4,no. 1, 2015.
[16] The Joanna Briggs Institute, Critical appraisal tools for use inthe JBI systematic reviews checklist for prevalence studies, TheUniversity of Adelaide, 2016, https://joannabriggs.org/sites/default/files/2019-05/JBI_ Critical_Appraisal Checklist_for_Prevalence_Studies2017_0.pdf.
[17] T. Eromo, H. Tassew, D. Daka, and G. Kibru, “Bacteriologicalquality of street foods and antimicrobial resistance of isolatesin Hawassa,” Ethiopia, Ethiopian Journal of Health Sciences,vol. 26, no. 6, pp. 533–542.
[18] S. G. Reddi, R. N. Kumar, N. Balakrishna, and V. S. Rao,“Microbiological quality of street vended fruit juices in Hyder-abad, India, and their association between food safety knowl-edge and practices of fruit juice vendors,” InternationalJournal of Current Microbiology and Applied Sciences, vol. 4,no. 1, pp. 970–982, 2015.
[19] U. Asghar, M. Nadeem, R. Nelofer, S. Mazhar, Q. Syed, andM. Irfan, “Microbiological assessment of fresh juices vendedin different areas of Lahore City,” Electronic Journal Biology,vol. 14, no. 4.
[20] N. B. Elhag, M. J. Remaz, and E. R. B. Babiker, “Characteriza-tion of some pathogenic bacteria associated with fresh juicessold in the central bus station at Khartoum State,” Sudan.International Journal of Science and Research (IJSR), vol. 6,no. 6, pp. 1351–1359, 2017.
[21] F. Ire and V. Imuh, “Bacteriological quality evaluation andsafety of randomly selected ready-to-eat foods sold in PortHarcourt City, Nigeria,” Journal of Applied Life Sciences Inter-national, vol. 7, no. 1, pp. 1–10, 2016.
[22] D. Shiningeni, P. Chimwamurombe, R. Shilangale, andJ. Misihairabgwi, “Prevalence of pathogenic bacteria in street
vended ready-to-eat meats in Windhoek, Namibia,” Meat Sci-ence, vol. 148, pp. 223–228, 2019.
[23] O. J. Okechukwu, I. Orinya Chinedu, O. Okonkwo Euchariaet al., “The microbial contamination of ready-to-eat vendedfruits in Abakpa Main Market, Abakaliki, Ebonyi State, Nige-ria,” IOSR Journal of Pharmacy and Biological Sciences,vol. 11, no. 6, pp. 71–80, 2016.
[24] C. V. Asiegbu, S. L. Lebelo, and F. T. Tabit, “Microbial qualityof ready-to-eat street vended food groups sold in the Johannes-burg Metropolis, South Africa,” Journal of Food Quality andHazards Control, vol. 7, pp. 18–26, 2020.
[25] S. Rane, “Street vended food in developing world: hazard anal-yses,” Indian Journal of Microbiology, vol. 51, no. 1, pp. 100–106, 2011.
[26] N. Paudyal, V. Anihouvi, J. Hounhouigan et al., “Prevalence offoodborne pathogens in food from selected African countries–a meta-analysis,” International Journal of Food Microbiology,vol. 249, pp. 35–43, 2017.
9International Journal of Food Science
Related Documents