Prevalence of Metabolic Syndrome: Association with Risk Factors and Cardiovascular Complications in an Urban Population Gisela Cipullo Moreira, Jose ´ Paulo Cipullo, Luiz Alberto Souza Ciorlia, Cla ´ udia Bernardi Cesarino, Jose ´ Fernando Vilela-Martin* Internal Medicine Department, Hypertension Clinic, State Medical School in Sa ˜o Jose ´ do Rio Preto (FAMERP), Sa ˜o Paulo, Brazil Abstract Introduction: Metabolic syndrome (MS) is a set of cardiovascular risk factors and type 2 diabetes, responsible for a 2.5-fold increased cardiovascular mortality and a 5-fold higher risk of developing diabetes. Objectives: 1-to evaluate the prevalence of MS in individuals over 18 years associated with age, gender, socioeconomic status, educational levels, body mass index (BMI), HOMA index and physical activity; moreover, to compare it to other studies; 2-to compare the prevalence of elevated blood pressure (BP), high triglycerides and plasma glucose levels, low HDL cholesterol and high waist circumference among individuals with MS also according to gender; 3-to determine the number of risk factors in subjects with MS and prevalence of complications in individuals with and without MS aged over 40 years. Methods: A cross-sectional study of 1369 Individuals, 667 males (48.7%) and 702 females (51.3%) was considered to evaluate the prevalence of MS and associated factors in the population. Results: The study showed that 22.7% (95% CI: 19.4% to 26.0%) of the population has MS, which increases with age, higher BMI and sedentary lifestyle. There was no significant difference between genders until age $70 years and social classes. Higher prevalence of MS was observed in lower educational levels and higher prevalence of HOMA positive among individuals with MS. The most prevalent risk factors were elevated blood pressure (85%), low HDL cholesterol (83.1%) and increased waist circumference (82.5%). The prevalence of elevated BP, low HDL cholesterol and plasma glucose levels did not show significant difference between genders. Individuals with MS had higher risk of cardiovascular complications over 40 years. Conclusion: The prevalence of MS found is similar to that in developed countries, being influenced by age, body mass index, educational levels, physical activity, and leading to a higher prevalence of cardiovascular complications after the 4th decade of life. Citation: Moreira GC, Cipullo JP, Ciorlia LAS, Cesarino CB, Vilela-Martin JF (2014) Prevalence of Metabolic Syndrome: Association with Risk Factors and Cardiovascular Complications in an Urban Population. PLoS ONE 9(9): e105056. doi:10.1371/journal.pone.0105056 Editor: Noel Christopher Barengo, University of Tolima, Colombia Received January 31, 2014; Accepted July 20, 2014; Published September 2, 2014 Copyright: ß 2014 Moreira et al. This is an open-access article distributed under the terms of the Creative Commons Attribution License, which permits unrestricted use, distribution, and reproduction in any medium, provided the original author and source are credited. Funding: The authors have no support or funding to report. Competing Interests: The authors have declared that no competing interests exist. * Email: [email protected] Introduction Metabolic syndrome (MS) is a set of metabolic disorders that represent risk factors for cardiovascular disease (CVD), athero- sclerosis and diabetes mellitus type 2 (DM-2). High blood pressure (BP) is a frequent component of MS, often associated with insulin resistance and central obesity [1,2] and MS is an independent predictor of cardiovascular risk in hypertensive patients [3]. Over 85% of individuals with MS have high BP or systemic arterial hypertension (SAH). Hypertensive patients without clinical evidence of CVD show event rates directly related to the number of risk factors for MS. Therefore the presence of MS increases the risk of cardiovascular events by 2-fold and the risk of developing DM-2 [4,5] by 5-fold. Insulin resistance is a determining factor in the association among obesity, diabetes, metabolic syndrome and atherosclerotic cardiovascular disease [6,7]. Obesity, especially visceral fat, is an important link among the components of the syndrome [8], because visceral fat is highly active considering the metabolic aspect. It is also more susceptible to lipolysis compared with subcutaneous fat and is associated with systemic inflammatory response [9]. The HOMA index (Homeostatic Model Assessment) is an alternative for the assessment of insulin resistance, mainly because it is a fast, easily applicable in epidemiological studies and low-cost method. The HOMA index has proved be a robust clinical and epidemiological tool in descriptions of the pathophys- iology of diabetes. HOMA analysis allows assessment of inherent PLOS ONE | www.plosone.org 1 September 2014 | Volume 9 | Issue 9 | e105056

Welcome message from author
This document is posted to help you gain knowledge. Please leave a comment to let me know what you think about it! Share it to your friends and learn new things together.
Transcript

Prevalence of Metabolic Syndrome: Association with RiskFactors and Cardiovascular Complications in an UrbanPopulationGisela Cipullo Moreira, Jose Paulo Cipullo, Luiz Alberto Souza Ciorlia, Claudia Bernardi Cesarino,
Jose Fernando Vilela-Martin*
Internal Medicine Department, Hypertension Clinic, State Medical School in Sao Jose do Rio Preto (FAMERP), Sao Paulo, Brazil
Abstract
Introduction: Metabolic syndrome (MS) is a set of cardiovascular risk factors and type 2 diabetes, responsible for a 2.5-foldincreased cardiovascular mortality and a 5-fold higher risk of developing diabetes.
Objectives: 1-to evaluate the prevalence of MS in individuals over 18 years associated with age, gender, socioeconomicstatus, educational levels, body mass index (BMI), HOMA index and physical activity; moreover, to compare it to otherstudies; 2-to compare the prevalence of elevated blood pressure (BP), high triglycerides and plasma glucose levels, low HDLcholesterol and high waist circumference among individuals with MS also according to gender; 3-to determine the numberof risk factors in subjects with MS and prevalence of complications in individuals with and without MS aged over 40 years.
Methods: A cross-sectional study of 1369 Individuals, 667 males (48.7%) and 702 females (51.3%) was considered toevaluate the prevalence of MS and associated factors in the population.
Results: The study showed that 22.7% (95% CI: 19.4% to 26.0%) of the population has MS, which increases with age, higherBMI and sedentary lifestyle. There was no significant difference between genders until age $70 years and social classes.Higher prevalence of MS was observed in lower educational levels and higher prevalence of HOMA positive amongindividuals with MS. The most prevalent risk factors were elevated blood pressure (85%), low HDL cholesterol (83.1%) andincreased waist circumference (82.5%). The prevalence of elevated BP, low HDL cholesterol and plasma glucose levels didnot show significant difference between genders. Individuals with MS had higher risk of cardiovascular complications over40 years.
Conclusion: The prevalence of MS found is similar to that in developed countries, being influenced by age, body massindex, educational levels, physical activity, and leading to a higher prevalence of cardiovascular complications after the 4thdecade of life.
Citation: Moreira GC, Cipullo JP, Ciorlia LAS, Cesarino CB, Vilela-Martin JF (2014) Prevalence of Metabolic Syndrome: Association with Risk Factors andCardiovascular Complications in an Urban Population. PLoS ONE 9(9): e105056. doi:10.1371/journal.pone.0105056
Editor: Noel Christopher Barengo, University of Tolima, Colombia
Received January 31, 2014; Accepted July 20, 2014; Published September 2, 2014
Copyright: � 2014 Moreira et al. This is an open-access article distributed under the terms of the Creative Commons Attribution License, which permitsunrestricted use, distribution, and reproduction in any medium, provided the original author and source are credited.
Funding: The authors have no support or funding to report.
Competing Interests: The authors have declared that no competing interests exist.
* Email: [email protected]
Introduction
Metabolic syndrome (MS) is a set of metabolic disorders that
represent risk factors for cardiovascular disease (CVD), athero-
sclerosis and diabetes mellitus type 2 (DM-2).
High blood pressure (BP) is a frequent component of MS, often
associated with insulin resistance and central obesity [1,2] and MS
is an independent predictor of cardiovascular risk in hypertensive
patients [3]. Over 85% of individuals with MS have high BP or
systemic arterial hypertension (SAH). Hypertensive patients
without clinical evidence of CVD show event rates directly related
to the number of risk factors for MS. Therefore the presence of
MS increases the risk of cardiovascular events by 2-fold and the
risk of developing DM-2 [4,5] by 5-fold.
Insulin resistance is a determining factor in the association
among obesity, diabetes, metabolic syndrome and atherosclerotic
cardiovascular disease [6,7]. Obesity, especially visceral fat, is an
important link among the components of the syndrome [8],
because visceral fat is highly active considering the metabolic
aspect. It is also more susceptible to lipolysis compared with
subcutaneous fat and is associated with systemic inflammatory
response [9]. The HOMA index (Homeostatic Model Assessment)
is an alternative for the assessment of insulin resistance, mainly
because it is a fast, easily applicable in epidemiological studies and
low-cost method. The HOMA index has proved be a robust
clinical and epidemiological tool in descriptions of the pathophys-
iology of diabetes. HOMA analysis allows assessment of inherent
PLOS ONE | www.plosone.org 1 September 2014 | Volume 9 | Issue 9 | e105056
b-cell function and insulin sensitivity and can characterize the
pathophysiology in those with abnormal glucose tolerance [10].
It has been demonstrated that the prevalence of MS is
increasing worldwide, and for the adult population is estimated
to be about 20 to 25% [11], largely due to several factors, such as
ageing of the population, increased life expectancy and obesity,
sedentarism and inadequate nutrition [12]. Studies performed in
Latin American populations showed a high prevalence of MS
which ranged from 12.3% to 42.7%, depending on the criteria for
clinical diagnosis and the characteristics of the study population
[13].
Despite of the importance of MS in the context of metabolic
and cardiovascular disease, in Brazil, few studies have described
the prevalence of MS and its determinants. Thus, we found scarce
information on the importance of this problem in our country.
Therefore, this study aimed to evaluate the prevalence of
metabolic syndrome in an urban adult population, relating it to
demographic, anthropometric and biochemical parameters and
comparing it to national and international studies. Moreover, it
studied association of MS with risk factors and cardiovascular
complications.
Materials and Methods
This project was approved by the Research Ethics Committee
of the State Medical School in Sao Jose do Rio Preto, Sao Paulo
State, Brazil [14]. All participants were informed about the
purpose of the work and provided informed consent before they
participated in the study. This was a cross-sectional, population-
based study with simple random sampling and stratified by age
group in an urban population, with the objective to estimate the
prevalence of metabolic syndrome and associated factors in the
adult population ($18 years).
This study was performed in the period of 2004 and 2005.
Participants answered a questionnaire with personal data,
socioeconomic levels, number of years of schooling, lifestyle,
cardiovascular complications (angina, stroke, myocardial infarc-
tion, heart failure, coronary bypass). The sample was stratified by
age groups of 18–39, 40–49, 50–59, 60–69 and over 70 years old.
A total of 1,369 individuals who were submitted to the interviews
and laboratory tests were selected from the original sample of
1,717 individuals. 667 of them were men (48.7%) with average age
55.1614.9 years and 702 of them were women (51.3%) with
average age 55.0614.4 years [14]. The parameters used to
calculate the strata sample sizes were number of inhabitants,
expected prevalence of hypertension and MS for each age group,
maximum allowed 95% confidence interval with semi amplitude
of 3% [14].
The urban area was divided into census sectors and the number
of individuals studied from each sector was proportional to the
population of that area. In each sector, the district, street, and
house an adult (resident for more than 6 months) was chosen at
random observing the inclusion and exclusion criteria of the study.
After the visit to the first house, houses on alternating sides of the
street, skipping two residences, were visited. In cases of refusal to
participate in the study, an adult resident in the neighboring house
was randomly chosen. Exclusion criteria included pregnancy,
severe degenerative diseases, incapacitating mental disorders,
severe psychiatric diseases, mental deficiency and bedridden
patients [14].
Physicians subsequently evaluated the interviews, measured
pulse rate and BP, and assessed anthropometric data (weight,
stature).
Blood pressure was measured in compliance with standard
techniques of the Joint National Committee and Brazilian
Guidelines for Hypertension [15,16].
After 12 hours fasting, blood samples were taken for biochem-
ical tests of blood glucose, total cholesterol (TC), high density
lipoprotein cholesterol (HDL-c), triglycerides (TG) and plasma
insulin [14].
The socioeconomic level was initially classified as A, B, C, D
and E according to the family’s possessions and income. Later, 3
levels were adopted for statistical analysis [17]: AB (A+B), C and
DE (D+E). The educational level was classified into two groups:
NMI: no education to incomplete secondary education (0 to ,11
years of schooling); NMCS: complete secondary or higher
education ($11 years of schooling).
Physical activity was assessed by means of a modified
International Physical Activity Questionnaire (IPAQ); classifying
individuals as active and very active (if they exercised more than
150 minutes per week, including walking, running, swimming and
cycling) and inactive or minimally active (if they did not exercised
at all or exercised up to 150 minutes per week).
Individuals were also classified according to alcohol consump-
tion into the following categories: no alcohol consumption,
moderate alcohol consumption (consumption of ethanol #210
grams/week) and high alcohol consumption (consumption ex-
ceeding 210 grams/week).
Body mass index (BMI) was calculated as weight in kilograms
divided by the square of the height in meters (kg/m2). A calibrated
portable weighing scale was used to measure the weight. The
height was measured using a metric tape. The participants were
classified according to their BMI as following: normal weight
(BMI,25), overweight (BMI$25–29.9) and obese (BMI$30 kg/
m2). The waist circumference was measured with a tape measure
using half the distance between the iliac crest and the lower costal
margin [18]. HOMA-IR was calculated by using the following
formula:
HOMA� IR :
fasting insulin mcU=mLð Þ|fasting glucose mmol=L�ð Þ22:5
Insulin resistance was defined as a value greater than 2.71 [19].
The HOMA index was evaluated in 840 individuals, which were
submitted to dosage of insulin. The insulin evaluation was not
performed in another subjects for technical reasons.
The classification adopted for the MS study was defined by the
National Cholesterol Education Program-Adult Treatment Panel
III (NCEP-ATP III) [5] and updated in 2009, with the following
diagnostic criteria: waist circumference (ethnic-specific criteria),
TG$150 mg/dl, HDL-c [,40 mg/dL (male) and ,50 mg/dL
(female)], BP (SBP$130 or DBP$85 mmHg), fasting glucose ($
100 mg/dL or DM-2), or in use of specific treatment for these
conditions [20].
The cutoff points for waist circumference utilized were: men $
102 cm and women $88 cm because Caucasians constitute the
majority of the studied population (71.58%) [21], and there is no
clear classification of the Brazilian population in racial terms.
Therefore, the prevalence of MS and its distribution was
evaluated according to age, gender, socioeconomic status,
education, physical activity, body mass index (BMI), high waist
circumference and MS diagnostic criteria. The relationship among
MS and dyslipidemia (changes in TG and HDL-c levels), alcohol
consumption, blood glucose, blood pressure, HOMA index and
cardiovascular complications were also evaluated.
Metabolic Syndrome and Risk Factors
PLOS ONE | www.plosone.org 2 September 2014 | Volume 9 | Issue 9 | e105056

Statistical methodThe results of this study were corrected for the population. To
assess the association between age and MS in both genders, with/
without complications, and overall, the likelihood ratio test for
independent samples was applied. The comparison between two
age levels was performed using the Bonferroni correction for the
significance level (a= 0.05/10 = 0.005 comparisons/comparison),
i.e., the a Bonferroni = 0.005 [22].
At the population level, sampling was done by age. We also used
the method of weighted least squares to analyze the association
between MS with all variables (hypertension, cardiovascular
complications, socioeconomic status, education level, gender, high
waist circumference, BMI, physical activity, number of factors of
metabolic syndrome in individuals with the syndrome, HOMA,
triglycerides, glucose, HDL-c) were analyzed.
The analysis of HDL-c in relation to alcohol consumption was
performed by means of bootstrap simulation method of convex
combinations with the same weights used for the analysis of
frequencies, where 1000 bootstrap samples were generated for
each comparison. The level of significance was a= 0.05 [23].
Results
The results for the different parameters evaluated are presented
by age and corrected for the population, as shown in Table 1.
The prevalence of MS was 22.7% (95% CI: 19.4% to 26.0%),
increasing with aging years, without a linear increase; but with a
significant difference among age groups (p,0.0005). The
percentage of individuals with MS in each age group was: 18–
39 years (14.2%), 40–49 years (25.6%), 50–59 years (38.2%), 60–
69 years (40.4%) and those aged $70 years 42.6%. The
prevalence was 3 times greater among elderly compared to
younger patients. The figure 1 shows the prevalence of MS
according to age.
GenderThe prevalence of MS in women was 22.7% (95% CI: 18.6% to
27.8%) in men and 23.3% (95% CI: 18.8% to 28.9%). The
women/men prevalence ratio was 0.98 (95% CI: 0.72 to 1.32;
p = 0.44), with no significant differences among different age
groups, except for age $70 years (65.4% in women and 34.6% in
men; p = 0.0005).
Socioeconomic LevelThe prevalence of MS according to socioeconomic status was:
class AB 22.2% (95% CI: 16.9% to 29.2%), class C 21.5% (95%
CI: 17.1% to 27.1%) and class DE 25.2% (95% CI: 19.6% to
32.4%). The prevalence ratios were: C/AB: 0.97 (95% CI: 0.67 to
1.39; p = 0.87), DE/AB: 1.14 (95% CI: 0.78 to 1.65; p = 0.51), and
DE/C: 1.17 (95% CI: 0.83 to 1.65; p = 0.37).
EducationThe prevalence of MS according to the level of education was:
27.7% (95% CI: 23.4% to 32.6%) up to incomplete secondary
level and 15.9% (95% CI: 11.8% to 21.5%) for complete
secondary level or higher. The prevalence ratio between NMI/
NMCS was: 1.73 (95% CI: 1.23 to 2.45; p = 0.002). It was also
observed 73% higher prevalence of MS in individuals with lower
educational level.
BMIThe prevalence of MS according to BMI was: 7.6% (95% CI:
5.1% to 11.3%) in normal-weight subjects, 23.7% (95% CI: 19.0%
to 29.5%) in overweight individuals and 51.6% (95% CI: 42.9% to
62.1%) in obese subjects. The prevalence ratios were overweight/
normal weight: 3.13 (95% CI: 1.96 to 4.98; p,0.0005), obese/
normal weight: 6.8 (95% CI: 4.36 to 10.7; p,0.0005) and obese/
overweight: 1.63 (95% CI: 2.91 to 5.28; p,0.0005).
HOMA-IndexThe calculation of the HOMA index was performed in 841
individuals, because not all subjects showed insulin value. The
prevalence of positive HOMA index was: 26.5% (95% CI: 21.0%
to 33.5%) in subjects with MS, and in individuals without MS
6.7% (95% CI: 4.7% to 9.5%). The prevalence ratio between
positive and negative MS was: 3.96 (95% CI: 2.60 to 6.05; p,
0.0001), almost 4 times higher in subjects with MS compared to
those without MS. The figure 2 shows the prevalence of positive
Homa index and metabolic syndrome.
Table 1. Demographic, anthropometric and lifestyle characteristics of studied population.
Characteristics N % N% corrected for thepopulation
Gender Male 667 49.7 211 23.3
Female 702 50.3 256 22.7
Socioeconomic status AB 288 17.8 92 22.2
C 584 45.4 195 21.5
DE 497 36.8 180 25.2
Education (schooling years) ,11 years 989 60.4 363 27.7
$11 years 380 39.6 104 15.9
BMI Normal-weight 538 44.2 75 7.6
Overweight 511 32.7 196 23.7
Obese 320 23.1 196 51.6
Physical Activity Inactive 924 66.9 353 26.1
Active 445 33.1 114 16.7
All the data are corrected for the total population of city. MS = Metabolic Syndrome; BMI = Body Mass Index.doi:10.1371/journal.pone.0105056.t001
Metabolic Syndrome and Risk Factors
PLOS ONE | www.plosone.org 3 September 2014 | Volume 9 | Issue 9 | e105056

Physical ActivityThe prevalence of MS in the active or very active was 16.7%
(95% CI: 12.3% to 22.7%) and minimally active or inactive:
26.1% (95% CI: 22.1% to 30.9%), with prevalence ratios inactive/
active 1.56 (95% CI: 1.10 to 2.23; p = 0.007).
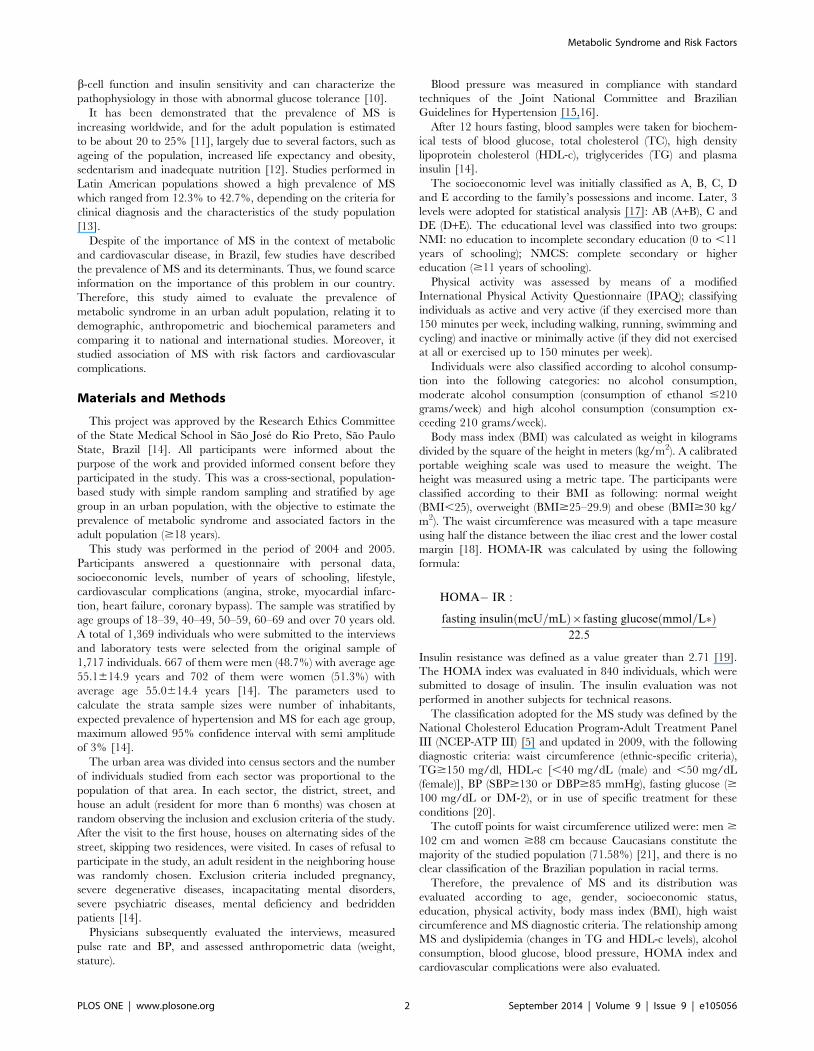
Alcohol and MSRegarding the consumption of alcohol, higher consumption was
observed in males (p,0.0005). There was an association between
moderate and/or high alcohol consumption with HDL-c normal
or higher (p,0.0005) (figure 3). Individuals who did not consume
alcohol showed a higher percentage of low HDL-c (60.0%).
Among subjects who consumed .210 g/week of alcohol, the
prevalence of hypertriglyceridemia was 47.8%, and in consumer
groups with #210 g/week or abstainers, the prevalence was 22.7
and 25.3%, respectively (p,0.0005), with evidence of an
association between high alcohol consumption with hypertriglyc-
eridemia.
MS in hypertensive and normotensiveIn this study, the prevalence of MS was 60.4% (95% CI: 54.2%
to 67.2%) among hypertensive patients, while only 9.5% (95% CI:
7.0% to 13.0%) of normotensive individuals were affected by the
syndrome. The MS prevalence ratio in hypertensive/normoten-
sive patients was 6.32 (95% CI: 4.57 to 8.75; p,0.0005).
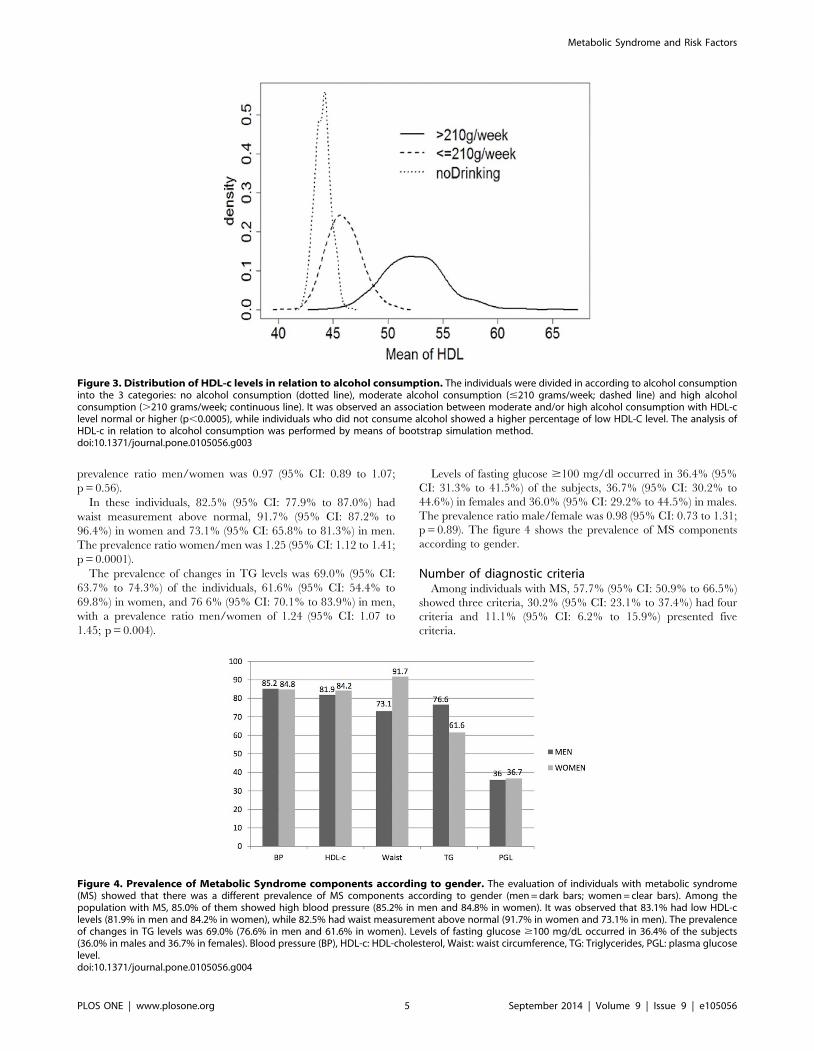
MS componentsThe evaluation of individuals with MS showed that there was a
prevalence of MS components according to gender. Among the
population with MS, 85.0% (95% CI: 80.6% to 89.4%) of them
showed high blood pressure, 84.8% (95% CI: 79.4% to 90.6%) of
whom were women and 85.2% (95% CI: 78.6% to 92.3%) were
men, with no difference between genders. The prevalence ratio
men/women was 1.00 (95% CI: 0, 91 to 1.11; p = 0.94).
It was observed that 83.1% (95% CI: 79.4% to 86.8%) had
levels of lower HDL-c, being 84.2% (95% CI: 79.9% to 88.8%) in
women and 81.9% (95% CI: 76.1% to 88.2%) in men. The
Figure 1. Prevalence of Metabolic Syndrome according to age. It was observed that the prevalence of MS increased with aging years withouta linear increase, but with a significant difference among age groups (p,0.0005). The percentage of individuals with MS in each age group was:14.2% for 18–39 years, 25.6% for 40–49 years, 38.2% for 50–59 years, 40.4% for 60–69 years and 42.6% for those aged $70 years.doi:10.1371/journal.pone.0105056.g001
Figure 2. Prevalence of Homa Index+ and Metabolic Syndrome. The figure shows the prevalence of positive HOMA index according to age inindividuals with (MS+ = clear bars) and without (MS2 = dark bars) metabolic syndrome. The calculation of the HOMA index was performed in 841individuals, because the insulin value was not determined in all the participants. It was observed that in subjects with MS+, in all the ages, theprevalence of positive HOMA index was always higher than in individuals without MS. MS: Metabolic Syndrome.doi:10.1371/journal.pone.0105056.g002
Metabolic Syndrome and Risk Factors
PLOS ONE | www.plosone.org 4 September 2014 | Volume 9 | Issue 9 | e105056
prevalence ratio men/women was 0.97 (95% CI: 0.89 to 1.07;
p = 0.56).
In these individuals, 82.5% (95% CI: 77.9% to 87.0%) had
waist measurement above normal, 91.7% (95% CI: 87.2% to
96.4%) in women and 73.1% (95% CI: 65.8% to 81.3%) in men.
The prevalence ratio women/men was 1.25 (95% CI: 1.12 to 1.41;
p = 0.0001).
The prevalence of changes in TG levels was 69.0% (95% CI:
63.7% to 74.3%) of the individuals, 61.6% (95% CI: 54.4% to
69.8%) in women, and 76 6% (95% CI: 70.1% to 83.9%) in men,
with a prevalence ratio men/women of 1.24 (95% CI: 1.07 to
1.45; p = 0.004).
Levels of fasting glucose $100 mg/dl occurred in 36.4% (95%
CI: 31.3% to 41.5%) of the subjects, 36.7% (95% CI: 30.2% to
44.6%) in females and 36.0% (95% CI: 29.2% to 44.5%) in males.
The prevalence ratio male/female was 0.98 (95% CI: 0.73 to 1.31;
p = 0.89). The figure 4 shows the prevalence of MS components
according to gender.
Number of diagnostic criteriaAmong individuals with MS, 57.7% (95% CI: 50.9% to 66.5%)
showed three criteria, 30.2% (95% CI: 23.1% to 37.4%) had four
criteria and 11.1% (95% CI: 6.2% to 15.9%) presented five
criteria.
Figure 3. Distribution of HDL-c levels in relation to alcohol consumption. The individuals were divided in according to alcohol consumptioninto the 3 categories: no alcohol consumption (dotted line), moderate alcohol consumption (#210 grams/week; dashed line) and high alcoholconsumption (.210 grams/week; continuous line). It was observed an association between moderate and/or high alcohol consumption with HDL-clevel normal or higher (p,0.0005), while individuals who did not consume alcohol showed a higher percentage of low HDL-C level. The analysis ofHDL-c in relation to alcohol consumption was performed by means of bootstrap simulation method.doi:10.1371/journal.pone.0105056.g003
Figure 4. Prevalence of Metabolic Syndrome components according to gender. The evaluation of individuals with metabolic syndrome(MS) showed that there was a different prevalence of MS components according to gender (men = dark bars; women = clear bars). Among thepopulation with MS, 85.0% of them showed high blood pressure (85.2% in men and 84.8% in women). It was observed that 83.1% had low HDL-clevels (81.9% in men and 84.2% in women), while 82.5% had waist measurement above normal (91.7% in women and 73.1% in men). The prevalenceof changes in TG levels was 69.0% (76.6% in men and 61.6% in women). Levels of fasting glucose $100 mg/dL occurred in 36.4% of the subjects(36.0% in males and 36.7% in females). Blood pressure (BP), HDL-c: HDL-cholesterol, Waist: waist circumference, TG: Triglycerides, PGL: plasma glucoselevel.doi:10.1371/journal.pone.0105056.g004
Metabolic Syndrome and Risk Factors
PLOS ONE | www.plosone.org 5 September 2014 | Volume 9 | Issue 9 | e105056

MS prevalence in the population $40 years, according tocomplications
The presence of cardiovascular complications was 11.4% (95%
CI: 8.6% to 15.0%) in individuals with the syndrome and 6.1%
(95% CI: 4.6% to 8.2%) in those individuals without MS. The
prevalence ratios of complications among individuals with and
without metabolic syndrome were 1.85 (95% CI: 1.24 to 2.74;
p = 0.002).
Discussion
In this study, it was used the updated NCEP-ATP III criteria as
a useful, simple and inexpensive guideline for MS diagnosis, to
describe the prevalence of MS in adults according with age,
gender, socioeconomic status, educational levels, BMI, HOMA
index and physical activity [5]. Another classification usually
utilized for definition of MS is based in The International Diabetes
Federation (IDF) criteria; however, IDF and ATPIII criteria show
a good agreement, reason why was used the updated ATP III
classification, without comparisons between them [20]. The
population prevalence of MS (22.7%) was very similar to that
seen in the American study NHANES (23.7%) [24], maybe
because it adopted similar criteria for age distribution and
included the urban population only. In Brazil, a systematic review
showed a mean prevalence of MS of 29.6% (range: 14.9%–65.3%)
[25]. However, the studies were performed in little population
samples [25]. Despite the methodological differences (half of these
studies used the definition proposed by NCEP-ATP III) and the
lack of consensus on criteria for MS diagnosis, this review
indicated a high prevalence of MS in the healthy Brazilian adult
population. As mentioned in the literature, increased prevalence of
MS with age [24,26] was also observed in the present study.
There were no significant differences between genders in all age
groups, except for individuals aged $70 years, in which there was
a predominance of females (65.4%). Ervin noted that men and
women aged 40–59 years were three times more likely to have MS
compared with those ranging in age from 20–39 years. In men
aged $60 years, this probability was 4 times higher, and in women
of the same age, the chance was increased by 6 times [27].
In the present study, the prevalence of MS was 3 times higher in
elderly subjects ($60 years) in relation to the group ,60 years. It
was also 4 times higher among females and 2.2 higher among
males. These differences can be explained because in individuals
with less than 60 years of age, there were differences regarding
susceptibility of MS components among genders, including
obesity, insulin resistance, SAH and CVD. The differences in
insulin resistance seem to be related to differences in the
anatomical distribution of fat: men have a greater amount of
visceral fat, linked to insulin resistance, whereas subcutaneous fat is
more predominant in women [28].
The prevalence of higher MS in classes DE (25.2%) compared
to class AB (22.2%) and C (21.5%), although not statistically
significant, shows a trend of higher prevalence in lower
socioeconomic levels. Ramsay et al. observed inverse relation
between social class and MS in adults, which can be explained by
several factors, such as physical activity, alcohol consumption and
smoking [29]. Cesarino and colleagues demonstrated in Sao Jose
do Rio Preto (Brazil) that hypertensive adults belonging to working
age population are mostly Caucasians and married, have low level
of education and belong to the lower social classes [30]. In the
present study, the prevalence of MS was 73% higher in individuals
with lower educational level. In a Brazilian study, educational level
was significantly associated with MS components, hyperglycemia,
higher waist circumference and hypertension in women. The level
of education is considered a reliable and relevant indicator of
social status, especially in relation to women whose housework
schedules are not always paid. The biological basis for the
association with educational disparities in SM remains unclear. It
has been suggested that socioeconomic status influences nutrition
and sedentary habits, which are highly related to MS components
[31].
It can also be observed, in all age groups, a higher prevalence of
MS in overweight and obese individuals. Prevalence of the obesity
and the MS is quickly increasing in developing countries, leading
to higher morbidity and mortality, according to studies realized in
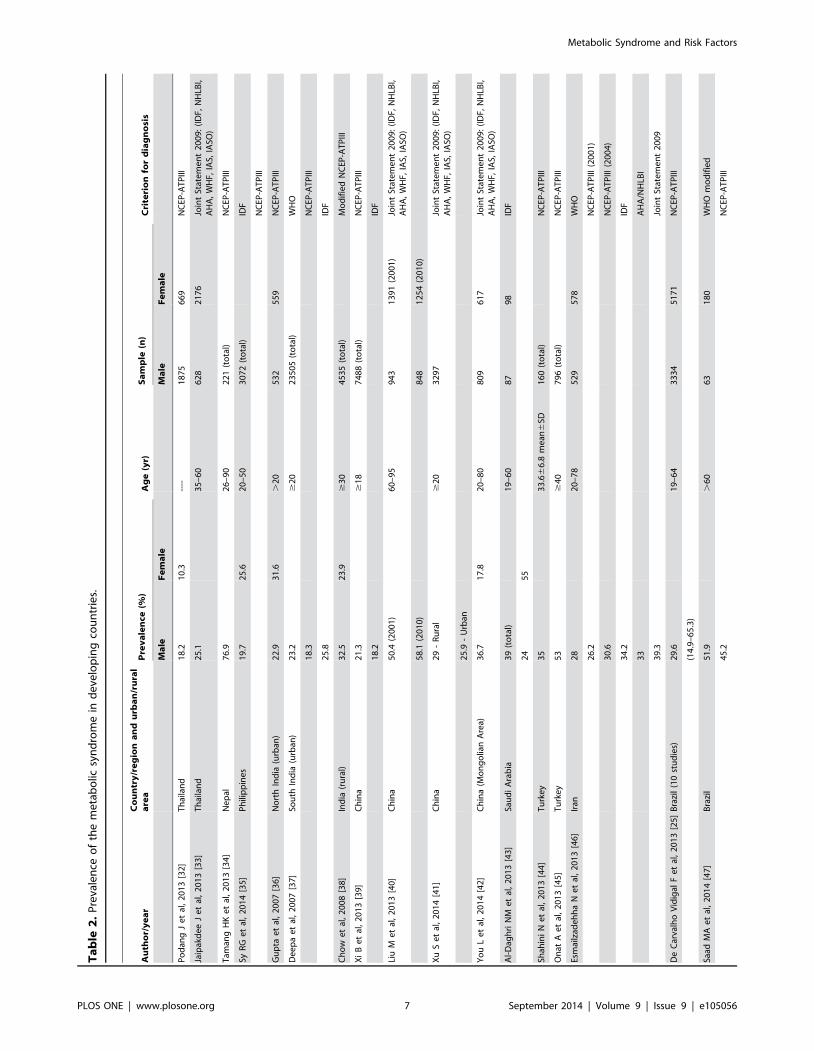
several populations, as shows the table 2. This table presents
essential information on MS from similar studies performed in
developing countries (prevalence of MS according to different
criteria diagnosis, numbers of patients and age range, and
comparison among diagnosis criteria of MS used in the studies)
[25,32–48]. The burden of overweight and obesity seems to be
related to nutrition transition in the last decades. In Brazil,
between the periods 1974/75 to 2008/09, it has been observed a
reduction of underweight individuals and an increase in the rate of
overweight (18.6% to 50.1% in men and 28.6 to 48.0% in women)
and obesity (2.8% to 12.8% in men and 7.8 to 16.9% in women).
Perhaps this can be explained by a reduction in the consumption
of basic foods and increased participation of ultra processed foods
in the diet used [49]. So, overweight and obesity is a natural
consequence of nutrition and sedentary lifestyle. Increasing
burden of obesity, MS, DM-2 and CVD in developing countries
has created an urgent need to strategize health policies and mass
interventions programs [50]. Thus, the determination of insulin
resistance levels is of clinical importance to identifying individuals
with high risk of metabolic diseases and atherosclerosis [19]. In this
study, the prevalence ratio among individuals with MS/without
metabolic syndrome (3.96) shows a lot higher prevalence of
positive HOMA index in individuals with MS. The values of
insulin resistance are predictors of cardiovascular and atheroscle-
rotic events. Surrogate measures of insulin sensitivity such as
HOMA index can be used to measure the levels of glucose and
insulin [19].
In this study, the prevalence of MS was 6 times higher in the
hypertensive population, with 14 times greater risk of MS in
hypertensive compared with non-hypertensive individuals, indi-
cating a clear association between SAH and other risk factors for
CVD. The presence of MS in hypertensive patients significantly
increases the risk for CVD, DM-2 and mortality. The NCEP-ATP
III classification was used in three European countries and a high
prevalence of MS in hypertensive patients was found in 61% of
patients in Germany, 22% in Spain and 21% in Italy. The
incidence of CVD and mortality was 2 times higher in individuals
with MS, and the prevalence of DM-2 was 6 times higher [51].
A study by Franco et al. found a high prevalence of MS among
hypertensive patients in the city of Cuiaba, significantly associated
with BMI.25 Kg/m2, with insulin resistance (HOMA index) and
especially with a family history of hypertension in the multiple
regression analysis [52]. The order of prevalence of MS
components in the studied population was: high BP (85.0%),
HDL-c (83.1%), high waist circumference (82.5%), TG (69.0%),
and blood glucose (36.4%), observing significant differences
between genders only in waist circumference values and TG
values. Among men, the prevalence order of factors was: high BP
(85.2%), HDL-c (81.9%), TG (76.6%), waist circumference
(73.1%) and blood glucose (36.0%), and among women: waist
circumference (91.7%), high BP (84.8%), HDL-c (84.2%), TG
(61.6%) and blood glucose (36.7%). Evaluating the prevalence
ratios of MS components between genders, significant differences
Metabolic Syndrome and Risk Factors
PLOS ONE | www.plosone.org 6 September 2014 | Volume 9 | Issue 9 | e105056
Ta
ble
2.
Pre
vale
nce
of
the
me
tab
olic
syn
dro
me
ind
eve
lop
ing
cou
ntr
ies.
Au
tho
r/y
ea
rC
ou
ntr
y/r
eg
ion
an
du
rba
n/r
ura
la
rea
Pre
va
len
ce(%
)A
ge
(yr)
Sa
mp
le(n
)C
rite
rio
nfo
rd
iag
no
sis
Ma
leF
em
ale
Ma
leF
em
ale
Po
dan
gJ
et
al,
20
13
[32
]T
hai
lan
d1
8.2
10
.3--
--1
87
56
69
NC
EP-A
TP
III
Jaip
akd
ee
Je
tal
,2
01
3[3
3]
Th
aila
nd
25
.13
5–
60
62
82
17
6Jo
int
Stat
em
en
t2
00
9:
(ID
F,N
HLB
I,A
HA
,W
HF,
IAS,
IASO
)
Tam
ang
HK
et
al,
20
13
[34
]N
ep
al7
6.9
26
–9
02
21
(to
tal)
NC
EP-A
TP
III
SyR
Ge
tal
,2
01
4[3
5]
Ph
ilip
pin
es
19
.72
5.6
20
–5
03
07
2(t
ota
l)ID
F
NC
EP-A
TP
III
Gu
pta
et
al,
20
07
[36
]N
ort
hIn
dia
(urb
an)
22
.93
1.6
.2
05
32
55
9N
CEP
-AT
PIII
De
ep
ae
tal
,2
00
7[3
7]
Sou
thIn
dia
(urb
an)
23
.2$
20
23
50
5(t
ota
l)W
HO
18
.3N
CEP
-AT
PIII
25
.8ID
F
Ch
ow
et
al,
20
08
[38
]In
dia
(ru
ral)
32
.52
3.9
$3
04
53
5(t
ota
l)M
od
ifie
dN
CEP
-AT
PIII
Xi
Be
tal
,2
01
3[3
9]
Ch
ina
21
.3$
18
74
88
(to
tal)
NC
EP-A
TP
III
18
.2ID
F
Liu
Me
tal
,2
01
3[4
0]
Ch
ina
50
.4(2
00
1)
60
–9
59
43
13
91
(20
01
)Jo
int
Stat
em
en
t2
00
9:
(ID
F,N
HLB
I,A
HA
,W
HF,
IAS,
IASO
)
58
.1(2
01
0)
84
81
25
4(2
01
0)
Xu
Se
tal
,2
01
4[4
1]
Ch
ina
29
-R
ura
l$
20
32
97
Join
tSt
ate
me
nt
20
09
:(I
DF,
NH
LBI,
AH
A,
WH
F,IA
S,IA
SO)
25
.9-
Urb
an
Yo
uL
et
al,
20
14
[42
]C
hin
a(M
on
go
lian
Are
a)3
6.7
17
.82
0–
80
80
96
17
Join
tSt
ate
me
nt
20
09
:(I
DF,
NH
LBI,
AH
A,
WH
F,IA
S,IA
SO)
Al-
Dag
hri
NM
et
al,
20
13
[43
]Sa
ud
iA
rab
ia3
9(t
ota
l)1
9–
60
87
98
IDF
24
55
Shah
ini
Ne
tal
,2
01
3[4
4]
Tu
rke
y3
53
3.6
66
.8m
ean
6SD
16
0(t
ota
l)N
CEP
-AT
PIII
On
atA
et
al,
20
13
[45
]T
urk
ey
53
$4
07
96
(to
tal)
NC
EP-A
TP
III
Esm
ailz
ade
hh
aN
et
al,
20
13
[46
]Ir
an2
82
0–
78
52
95
78
WH
O
26
.2N
CEP
-AT
PIII
(20
01
)
30
.6N
CEP
-AT
PIII
(20
04
)
34
.2ID
F
33
AH
A/N
HLB
I
39
.3Jo
int
Stat
em
en
t2
00
9
De
Car
valh
oV
idig
alF
et
al,
20
13
[25
]B
razi
l(1
0st
ud
ies)
29
.61
9–
64
33
34
51
71
NC
EP-A
TP
III
(14
.9–
65
.3)
Saad
MA
et
al,
20
14
[47
]B
razi
l5
1.9
.6
06
31
80
WH
Om
od
ifie
d
45
.2N
CEP
-AT
PIII
Metabolic Syndrome and Risk Factors
PLOS ONE | www.plosone.org 7 September 2014 | Volume 9 | Issue 9 | e105056

in waist circumference (more prevalent among women) and TG
levels (more prevalent among men) were observed. A study by
Ervin found that more prevalent components of MS were high
waist circumference, SAH and high TG. Among men, high TG,
high BP and blood glucose was found; whereas among women,
high waist circumference and low HDL-c [27]. These findings
were very similar to present study. In a Swedish study, high BP
was the most common component in both sexes, followed by high
waist circumference among women and changes in TG levels
among men [53]. In China, the prevalence of individual
components of MS was in order: high BP, TG, plasma glucose,
central obesity and HDL-c in men and high BP, central obesity,
TG, HDL-c and plasma glucose in women [54]. In a Brazilian
systematic review, the most frequent MS components were low
HDL-c (59.3%) and high BP (52.5%) [25].
In order to investigate the association of two components of MS
(HDL-c and TG) with alcohol use in both genders, 3 levels of
alcohol consumption were compared in studied individuals. In
individuals with MS, it was found that moderate or high
consumption of alcohol was related to higher prevalence of
HDL-c normal or increased when compared to abstainers.
Prevalence of hypertriglyceridemia was higher among individuals
with high alcohol consumption (47.8%) compared with those with
moderate consumption (22.7%) and abstainers (25.3%) (p,
0.0005); therefore, a higher alcohol consumption in males could
explain a higher prevalence of hypertriglyceridemia, as well as the
association between moderate/high consumption alcohol with
normal or high HDL-c. Despite higher plasma levels of HDL-c
with alcohol consumption and the clear prevalence of alcohol
consumption among men, there was no significant difference in
HDL-c between genders. Epidemiologic studies demonstrate
higher levels of HDL-c in alcohol consumers. Alcohol affects
lipoprotein metabolism in several stages. Regular consumption
may be associated with increased synthesis of lipoproteins,
decreased degradation of HDL-c, greater hepatic metabolism of
LDL-cholesterol, further increase of triglycerides, with the
inhibition of the oxidation of free fatty acids. Alcohol consumption
is also responsible for modifying the dynamic metabolism of HDL-
c [55]. In South Korean, a study observed significantly higher TG
levels among excessive drinkers men. Such high consumption of
alcohol was associated with high risk of MS due to high BP,
impaired fasting glucose, abdominal obesity and TG [56].
Patients over 50 years showed a higher prevalence of increased
mass index (overweight and obese) in women (63.1%) compared to
men (36.9%) (p = 0.01), which may explain the highest prevalence
of increased waist circumference in women. Ervin also noted
greater abdominal obesity in patients over 40 years old [27].
Metabolic syndrome becomes more common with age and body
weight increase.
In this study, after analyzing the prevalence ratio between
inactive/active patients, it was concluded that inactive individuals
were 56% more likely to have MS. A Japanese study showed that
moderate-vigorous physical activity was sufficient to reduce the
prevalence and risk to develop metabolic syndrome among
middle-aged men and women [57]. In Norway, HUNT 2 study
demonstrated that among individuals with MS, even low level of
physical activity was associated with reduced mortality due to all
causes, including cardiovascular diseases [58].
In the studied population, 57.7% of individuals with MS had 3
risk factors, 30.2% of them had four risks and 11.1% of them
showed five factors. Kokubo et al. showed that the incidence risk
for CVD increased according to the number of MS components.
The risk was similar among individuals with the same number of
components [59].
Ta
ble
2.
Co
nt.
Au
tho
r/y
ea
rC
ou
ntr
y/r
eg
ion
an
du
rba
n/r
ura
la
rea
Pre
va
len
ce(%
)A
ge
(yr)
Sa
mp
le(n
)C
rite
rio
nfo
rd
iag
no
sis
Ma
leF
em
ale
Ma
leF
em
ale
64
.1ID
F
69
.1Jo
int
Stat
em
en
t2
00
9
De
lB
rutt
oO
He
tal
,2
01
3[4
8]
Ecu
ado
r5
5.7
$4
05
17
(to
tal)
IDF
Mo
reir
aG
Ce
tal
,2
01
4*
Bra
zil
23
.32
2.7
$4
06
67
70
2Jo
int
Stat
em
en
t2
00
9
NC
EP-A
TP
III=
Nat
ion
alC
ho
lest
ero
lEd
uca
tio
nP
rog
ram
-Ad
ult
Tre
atm
en
tP
ane
lIII
;WH
O=
Wo
rld
He
alth
Org
aniz
atio
n;I
DF
=In
tern
atio
nal
Dia
be
tes
Fed
era
tio
n;
AH
A=
Am
eri
can
He
art
Ass
oci
atio
n;
NH
LBI=
Nat
ion
alH
ear
t,Lu
ng
,Blo
od
Inst
itu
te;
WH
F=
Wo
rld
He
art
Fed
era
tio
n;
IAS
=In
tern
atio
nal
Ath
ero
scle
rosi
sSo
cie
ty;
and
IASO
=In
tern
atio
nal
Ass
oci
atio
nfo
rth
eSt
ud
yo
fO
be
sity
.Jo
int
Stat
em
en
t2
00
9:
(ID
F,N
HLB
I,A
HA
,W
HF,
IAS,
IASO
).SD
=st
and
ard
de
viat
ion
.*
pre
sen
tst
ud
y.d
oi:1
0.1
37
1/j
ou
rnal
.po
ne
.01
05
05
6.t
00
2
Metabolic Syndrome and Risk Factors
PLOS ONE | www.plosone.org 8 September 2014 | Volume 9 | Issue 9 | e105056

The prevalence of cardiovascular complications was evaluated
in subjects $40 years, due to the larger number of events among
this age group. Among individuals with MS, 11.4% were affected
by complications compared to 6.1% without the syndrome. By
analyzing the prevalence ratios of complications among individ-
uals with and without MS, it is concluded that individuals with MS
are 50% more likely to be affected by complications. Evidence
shows that metabolic and hemodynamic abnormalities of MS are
associated with the prevalence of subclinical damage in various
organs, as well as with increased risk of fatal cardiovascular events
[60]. Individuals with MS have cardiovascular risk 50–60% higher
than those without the syndrome [61]. A meta-analysis of 87
studies (951,083 patients) showed that MS was associated with a 2-
fold increase in risk for CVD and 1.5-fold increase in all-cause
mortality [62]. Patients with MS, but without diabetes, also had
high cardiovascular risk.
Limitations of the studySome limitations of this study should be mentioned. Firstly, the
guidelines of the American Diabetes Association recommend the
confirmation of hyperglycemia through a second blood glucose
measurement, which was not performed in this study. However, in
the epidemiological studies, including NHANES, used almost
exclusively a single blood glucose measurement for the diagnosis of
DM. Secondly, we did not assess the interference of antilipemic
drugs in the lipid values determination. Thirdly, the calculation of
HOMA index was not performed in the total samples as not all
subjects showed insulin values. Finally, data concerning compli-
cations were obtained from the clinical history, without conducting
specific tests which evidence that the organic lesion occurred.
On the other hand, this population-based, age-stratified study,
with a normotensive control group, is unique as it gathers different
demographic, epidemiologic and risk factors involved in the
genesis of hypertension and CVD in a single sample with a
population assessment calculation, which might be extrapolated to
other hypertensive populations.
Conclusions
The prevalence of MS in this study is similar to that of
developed countries: it increases with age, shows no significant
differences between sex and among social classes. However, lower
levels of education are associated with higher prevalence of MS.
Metabolic syndrome is more prevalent in individuals with higher
BMI (especially obese) and inactive or minimally active. The
positive HOMA Index is more prevalent in individuals with MS.
The diagnostic criteria for MS with a higher prevalence are: high
blood pressure, low HDL-C and high waist circumference.
Diagnostic criteria - high BP, low HDL-C and changes in blood
glucose - similarly affect both genders, with no significant
differences. There was a higher prevalence of high waist
circumference in women, and high TG in men. Individuals aged
$40 years with MS have a higher prevalence of cardiovascular
complications. Therefore, we understand that this is one of the first
studies conducted in Brazil addressing different aspects involved in
the metabolic syndrome and may serve as a warning for public
authorities to control and prevent obesity and hypertension.
Author Contributions
Conceived and designed the experiments: JPC JFVM. Performed the
experiments: JPC LASC CBC JFVM. Analyzed the data: GCM JPC
JFVM. Contributed reagents/materials/analysis tools: GCM JPC LASC
CBC JFVM. Wrote the paper: GCM JPC JFVM.
References
1. Moller DE, Kaufman KD (2005) Metabolic syndrome: a clinical and molecular
perspective. Annu Rev Med 56: 45–62.
2. Afonso LC, Edelson GW, Sowers JR (1997) Metabolic abnormalities in
hypertension. Curr Opin Nephrol Hypertens 6: 219–223.
3. Pierdomenico SD, Lapenna D, Di Tommaso R, Di Carlo S, Caldarella MP,
et al. (2007) Prognostic relevance of metabolic syndrome in hypertensive patients
at low-to-medium risk. Am J Hypertens 20: 1291–1296.
4. Franklin SS (2006) Hypertension in the metabolic syndrome. Metab Syndr Relat
Disord 4: 287–298.
5. Grundy SM, Cleeman JI, Daniels SR, Donato KA, Eckel RH, Franklin BA,
et al. (2005) Diagnosis and management of the metabolic syndrome: An
American Heart Association/National Heart, Lung, and Blood Institute
Scientific Statement. Circulation 112: 2735–52.
6. Savage DB, Petersen KF, Shulman GI (2005) Mechanisms of insulin resistance
in humans and possible links with inflammation. Hypertension 45: 828–833.
7. Balkau B, Valensi P, Eschwege E, Slama G (2007) A review of the metabolic
syndrome. Diabetes Metab 33: 405–413.
8. Mehta NN, Reilly MP (2004) Mechanisms of the metabolic syndrome. Drug
Discovery Today: Disease Mechanisms 1: 187–194.
9. Bahceci M, Gokalp D, Bahceci S, Tuzcu A, Atmaca S, et al. (2007) The
correlation between adiposity and adiponectin, tumor necrosis factor a,
interleukin-6 and high sensitivity C-reactive protein levels. Is adipocyte size
associated with inflammation in adults? J Endocrinol Invest 30: 210–214.
10. Vasques AC, Rosado LE, Alfenas RCG, Geloneze B (2008) Critical analysis on
the use of the homeostasis model assessment (HOMA) indexes in the evaluation
of the insulin resistance and the pancreatic beta cells functional capacity. Arq
Bras Endocrinol Metabol 52: 32–39.
11. International Diabetes Federation. Information on the IDF consensus worldwide
definition of the metabolic syndrome. Available: http://www.idf.org/webdata/
docs/IDF_Meta_def_final.pdf. Accessed 2014 Apr 10.
12. Xavier HT, Monte O (2005) Atherosclerosis prevention in metabolic syndrome
patients: from physiopathology to the farmacoeconomics of statins treatment.
Rev Bras Med 62: 197–204.
13. Marquez-Sandoval F, Macedo-Ojeda G, Viramontes-Horner D, Fernandez
Ballart JD, Salas Salvado J, et al. (2011) The prevalence of metabolic syndrome
in Latin America: a systematic review. Public Health Nutr 14: 1702–1713.
14. Cipullo JP, Martin JF, Ciorlia LA, Godoy MR, Cacao JC, et al. (2010)
Hypertension prevalence and risk factors in a Brazilian urban population. Arq
Bras Cardiol 94: 488–494.
15. Chobanian AV, Bakris GI, Black HR, Cushman WC, Green LA, et al. (2003)
The seventh report of the Joint National Committee on Prevention, Detection,
Evaluation, and Treatment of High Blood Pressure. The JNC 7 Report. JAMA
289: 2560–2572.
16. VI Diretrizes Brasileiras de Hipertensao (2010) Information on Brazilian
Guidelines for Hypertension. Available: http://publicacoes.cardiol.br/
consenso/2010/Diretriz_hipertensao_ERRATA.pdf. Accessed 2013 Sep 07.
17. Krieger N, Williams DR, Moss NE (1997) Measuring social class in U.S. public
health research: concepts, methodologies, and guidelines. Annu Rev Publ Health
18: 341–378.
18. Associacao Brasileira para o Estudo da Obesidade e da Sındrome Metabolica
(Abeso). Information on Obesity and Metabolic Syndrome in Brazil. Available:
http://www.abeso.org.br. Accessed 2013 Sep 09.
19. Geloneze B, Repetto EM, Geloneze SR, Tambascia MA, Ermetice MN (2006)
The threshold value for insulin resistance (HOMA-IR) in an admixtured
population. IR in the Brazilian Metabolic Syndrome Study. Diabetes Res Clin
Pract 72: 219–220.
20. Alberti KGM, Eckel RH, Grundy SM, Zimmet PZ, Cleeman JI, et al. (2009)
Harmonizing the metabolic syndrome. A Joint Interim Statement of the
International Diabetes Federation Task Force on Epidemiology and Prevention;
National Heart, Lung, and Blood Institute; American Heart Association; World
Heart Federation; International Atherosclerosis Society; and International
Association for the Study of Obesity. Circulation 120: 1640–1645.
21. Brazilian Institute for Geography and Statistics (IBGE). Information on
population census. Available: http://www.ibge.gov.br/censo/. Accessed 2013
Aug 19.
22. Bland JM, Altman DG (1995) Multiple significance tests: the Bonferroni method.
BMJ 310: 170.
23. Efron B, Tibshirami RJ (1993) An introduction to the bootstrap. Monographs on
statistics and applied probability. New York: Chapman & Hall.
24. Ford ES, Giles WH, Dietz WH (2002) Prevalence of the metabolic syndrome
among US adults: findings from the Third National Health and Nutrition
Examination Survey. JAMA 287: 356–359.
Metabolic Syndrome and Risk Factors
PLOS ONE | www.plosone.org 9 September 2014 | Volume 9 | Issue 9 | e105056

25. De Carvalho Vidigal F, Bressan J, Babio N, Salas-Salvado J (2013) Prevalence of
metabolic syndrome in Brazilian adults: a systematic review. BMC Public Health13: 1198.
26. Grundy SM (2008) Metabolic syndrome pandemic. Arterioscler Thromb Vasc
Biol 28: 629–636.27. Ervin RB (2009) Prevalence of metabolic syndrome among adults 20 years of age
and over, by sex, age, race and ethnicity, and body mass index: United States,2003–2006. National Health Statistics Reports 13: 1–7.
28. Luses AL, Attie AD, Reue K (2008) Metabolic syndrome: from epidemiology to
systems biology. Nat Rev Genet 9: 819–830.29. Ramsay SE, Whinaup PH, Morris R, Lennon L, Wannamethee SG (2008) Is
socioeconomic position related to the prevalence of metabolic syndrome?Influence of social class across the life course in a population-based study of older
men. Diabetes Care 31: 2380–2382.30. Cesarino CB, Cipullo JP, Martin JF, Ciorlia LA, Godoy MR, et al. (2008)
Prevalence and Sociodemographic Factors in a Hypertensive Population in Sao
Jose do Rio Preto, Sao Paulo, Brazil. Arq Bras Cardiol 91: 29–33.31. Gronner MF, Bosi PL, Carvalho AM, Casale G, Contrera D, et al. (2011)
Prevalence of metabolic syndrome and its association with educationalinequalities among Brazilian adults: a population-based study. Braz J Med Biol
Res 44: 713–719.
32. Podang J, Sritara P, Narksawat K (2013) Prevalence and factors associated withmetabolic syndrome among a group of Thai working population: a cross
sectional study. J Med Assoc Thai 96: 33–41.33. Jaipakdee J, Jiamjarasrangsri W, Lohsoonthorn V, Lertmaharit S (2013)
Prevalence of metabolic syndrome and its association with serum uric acidlevels in Bangkok Thailand. Southeast Asian J Trop Med Public Health 44:
512–522.
34. Tamang HK, Timilsina U, Thapa S, Singh KP, Shrestha S, et al. (2013)Prevalence of metabolic syndrome among Nepalese type 2 diabetic patients.
Nepal Med Coll J 15: 50–55.35. Sy RG, Llanes EJ, Reganit PF, Castillo-Carandang N, Punzalan FE, et al. (2014)
Socio-demographic factors and the prevalence of metabolic syndrome among
Filipinos from the LIFECARE cohort. J Atheroscler Thromb 21 Suppl 1: S9–17.
36. Gupta R, Sarna M, Thanvi J, Sharma V, Gupta VP (2007) Fasting glucose andcardiovascular risk factors in an urban population. J Assoc Physicians India 55:
705–709.37. Deepa M, Farooq S, Datta M, Deepa R, Mohan V (2007) Prevalence of
metabolic syndrome using WHO, ATPIII and IDF definitions in Asian Indians:
the Chennai Urban Rural Epidemiology Study (CURES-34). Diabetes MetabRes Rev 23: 127–134.
38. Chow CK, Naidu S, Raju K, Raju R, Joshi R, et al. (2008) Significant lipid,adiposity and metabolic abnormalities amongst 4535 Indians from a developing
region of rural Andhra Pradesh. Atherosclerosis 196: 943–952.
39. Xi B, He D, Hu Y, Zhou D (2013) Prevalence of metabolic syndrome and itsinfluencing factors among the Chinese adults: the China Health and Nutrition
Survey in 2009. Prev Med 57: 867–871.40. Liu M, Wang J, Jiang B, Sun D, Wu L, et al. (2013) Increasing prevalence of
metabolic syndrome in a chinese elderly population: 2001–2010. PLoS One 8:e66233.
41. Xu S, Ming J, Yang C, Gao B, Whan Y, et al. (2014) Urban, semi-urban and
rural difference in the prevalence of metabolic syndrome in Shaanxi province,northwestern China: a population-based survey. BMC Public Health 14: 104.
42. You L, Liu A, Wuyun G, Wu H, Wang P (2014) Prevalence of hyperuricemiaand the relationship between serum uric acid and metabolic syndrome in the
Asian Mongolian area. J Atheroscler Thromb 21: 355–365.
43. Al-Daghri NM, Khan N, Alkharfy KM, Al-Attas OS, Alokail MS, et al. (2013)Selected dietary nutrients and the prevalence of metabolic syndrome in adult
males and females in Saudi Arabia: a pilot study. Nutrients 5: 4587–4604.
44. Shahini N, Shahini I, Marjani A (2013) Prevalence of metabolic syndrome in
turkmen ethnic groups in gorgan. J Clin Diagn Res 7: 1849–1851.
45. Onat A, Yuksel M, Koroglu B, Gumrukcuoglu HA, Aydın M, et al. (2013)
Turkish Adult Risk Factor Study survey 2012: overall and coronary mortality
and trends in the prevalence of metabolic syndrome. Turk Kardiyol Dern Ars
41: 373–378.
46. Esmailzadehha N, Ziaee A, Kazemifar AM, Ghorbani A, Oveisi S (2013)
Prevalence of metabolic syndrome in Qazvin Metabolic Diseases Study
(QMDS), Iran: a comparative analysis of six definitions. Endocr Regul 47:
111–120.
47. Saad MA, Cardoso GP, Martins W de A, Velarde LG, da Cruz Filho RA (2014)Prevalence of metabolic syndrome in elderly and agreement among four
diagnostic criteria. Arq Bras Cardiol 102: 263–269.
48. Del Brutto OH, Zambrano M, Penaherrera E, Montalvan M, Pow-Chon-Long
F, et al. (2013) Prevalence of the metabolic syndrome and its correlation with the
cardiovascular health status in stroke- and ischemic heart disease-freeEcuadorian natives/mestizos aged $40 years living in Atahualpa: A popula-
tion-based study. Diabetes Metab Syndr 7: 218–222.
49. Jaime PC, Ministerio da Saude (2013) A Nova Polıtica Nacional de Alimentacao
e Nutricao e os desafios na Promocao da Alimentacao Adequada e Saudavel no
SUS. Information on Brazilian food policy. Available: http://www.cve.saude.sp.gov.br. Accessed 2014 Jun 26.
50. Misra A, Khurana L (2008) Obesity and the metabolic syndrome in developing
countries. J Clin Endocrinol Metab 93 11 Suppl 1: S9–S30.
51. Scholze J, Alegria E, Ferri C, Langham S, Stevens W, et al. (2010)
Epidemiological and economic burden of metabolic syndrome and its
consequences in patients with hypertension in Germany, Spain and Italy; a
prevalence-based model. BMC Public Health 10: 529–540.
52. Franco GP, Scala LC, Alves CJ, Franca GV, Cassanelli T, et al. (2009)Metabolic syndrome in patients with high blood pressure in Cuiaba-Mato
Grosso State: prevalence and associated factors. Arq Bras Cardiol 92: 472–478.
53. Novak M, Bjorck L, Welin L, Welin C, Manhem K, et al. (2013) Gender
differences in the prevalence of metabolic syndrome in 50-year-old Swedish men
and women with hypertension born in 1953. J Hum Hypertens 27: 56–61.
54. Zhao Y, Yan H, Yang R, Li Q, Dang S, et al. (2014) Prevalence and
determinants of metabolic syndrome among adults in a rural area of Northwest
China. PLoS One 9: e91578.
55. Park H, Kim K (2012) Association of Alcohol Consumption with Lipid Profile in
Hypertensive Men. Alcohol and Alcohol 47: 282–287.
56. Kim J, Chu SK, Kim K, Moon JR (2011) Alcohol use behaviors and risk of
metabolic syndrome in South Korean middle-aged men. BMC Public Health 11:
489–496.
57. Kim J, Tanabe K, Yokoyama N, Zempo H, Kuno S (2011) Association between
physical activity and metabolic syndrome in middle-aged Japanese: a cross-
sectional study. BMC Public Health 11: 624–631.
58. Stensvold D, Nauman J, Nilsen TI, Wisløff U, Slørdahl SA, et al. (2011) Evenlow level of physical activity is associated with reduced mortality among people
with metabolic syndrome, a population based study (the HUNT 2 study,
Norway). BMC Med 9: 109–116.
59. Kokubo Y, Okamura T, Yoshimosa Y, Miyamoto Y, Kawanishi K, et al. (2008)
Impact of metabolic syndrome components on the incidence of cardiovasculardisease in a general urban Japanese population: the Suita study. Hypertens Res
31: 2027–2035.
60. Cuspidi C, Sala C, Zanchetti A (2008) Metabolic syndrome and target organ
damage: role of blood pressure. Expert Rev Cardiovasc Ther 6: 731–743.
61. Qiao Q, Gao W, Zhang L, Nyamdorj R, Tuomilehto J (2007) Metabolic
syndrome and cardiovascular disease. Ann Clin Biochem 44: 232–263.
62. Mottillo S, Filion KB, Genest J, Joseph L, Pilote L, et al. (2010) The metabolic
syndrome and cardiovascular risk. J Am Coll Cardiol 56: 1113–1132.
Metabolic Syndrome and Risk Factors
PLOS ONE | www.plosone.org 10 September 2014 | Volume 9 | Issue 9 | e105056
Related Documents


