OBESITY/INSULIN RESISTANCE, TYPE 2 DIABETES Prevalence of different states of glucose intolerance in Sri Lankan children and adolescents with obesity and its relation to other comorbidities Iris Ciba 1,2 | Loretta S. Warnakulasuriya 3 | Adikaram V. N. Adikaram 4 | Peter Bergsten 1,2,5 | Marie Dahlbom 1,2 | Manel M. A. Fernando 6 | Elisabet Rytter 7 | Dulani L. Samaranayake 8 | K. D. Renuka Ruchira Silva 9 | V. Pujitha Wickramasinghe 10 | Anders H. Forslund 1,2 1 Department of Women's and Children's Health, Uppsala University, Uppsala, Sweden 2 Uppsala University Children's Hospital, Uppsala, Sweden 3 Postgraduate Institute of Medicine, University of Colombo, Colombo, Sri Lanka 4 Health Unit, Bandaranaike International Airport, Katunayake, Sri Lanka 5 Department of Medical Cell Biology, Uppsala University, Uppsala, Sweden 6 Colombo North Teaching Hospital, Ragama, Sri Lanka 7 Clinical Nutrition and Metabolism, Department of Public Health and Caring Science, Faculty of Medicine, Uppsala University, Uppsala, Sweden 8 Department of Community Medicine, University of Colombo, Colombo, Sri Lanka 9 Department of Applied Nutrition, Wayamba University of Sri Lanka, Makandura, Sri Lanka 10 Department of Paediatrics, Faculty of Medicine, University of Colombo, Colombo, Sri Lanka Correspondence Iris Ciba, Department of Women's and Children's Health, Uppsala University, Uppsala, Sweden. Email: [email protected] Funding information Diabetesförbundet; European Commission, Grant/Award Number: 279153; Gillbergska Abstract Background: South Asian adults have higher prevalence of obesity comorbidities than other ethnic groups. Whether this also is true for Sri Lankan children with obe- sity has rarely been investigated. Objective: To investigate prevalence of glucose intolerance and other comorbidities in Sri Lankan children with obesity and compare them with Swedish children. To identify risk factors associated with glucose intolerance. Subjects: A total of 357 Sri Lankan children (185 boys), aged 7 to 17 years with BMI- SDS ≥2.0 from a cross-sectional school screening in Negombo. A total of 167 subjects from this study population were matched for sex, BMI-SDS and age with 167 Swedish subjects from the ULSCO cohort for comparison. Methods: After a 12 hour overnight fast, blood samples were collected and oral glu- cose tolerance test was performed. Body fat mass was assessed by bioelectrical impedance assay. Data regarding medical history and socioeconomic status were obtained from questionnaires. Results: Based on levels of fasting glucose (FG) and 2 hours-glucose (2 hours-G), Sri Lankan subjects were divided into five groups: normal glucose tolerance (77.5%, n = 276), isolated impaired fasting glucose according to ADA criteria (9.0%, n = 32), isolated impaired glucose tolerance (8.4%, n = 30), combined impaired fasting glucose (IFG) + impaired glucose tolerance (IGT) (3.1%, n = 11) and type 2 diabetes mellitus (2.0%, n = 7). FG, 2 hours-insulin and educational status of the father independently increased the Odds ratio to have elevated 2 hours-G. Sri Lankan subjects had higher percentage of body fat, but less abdominal fat than Swedish subjects. Iris Ciba and Loretta S. Warnakulasuriya are considered joint first author. V. Pujitha Wickramasinghe and Anders H. Forslund are considered joint last author. Received: 15 June 2020 Revised: 29 September 2020 Accepted: 16 October 2020 DOI: 10.1111/pedi.13145 This is an open access article under the terms of the Creative Commons Attribution-NonCommercial-NoDerivs License, which permits use and distribution in any medium, provided the original work is properly cited, the use is non-commercial and no modifications or adaptations are made. © 2020 The Authors. Pediatric Diabetes published by John Wiley & Sons Ltd. 168 Pediatr Diabetes. 2021;22:168–181. wileyonlinelibrary.com/journal/pedi

Welcome message from author
This document is posted to help you gain knowledge. Please leave a comment to let me know what you think about it! Share it to your friends and learn new things together.
Transcript
OB E S I T Y / I N S U L I N R E S I S T AN C E , T Y P E 2 D I A B E T E S
Prevalence of different states of glucose intolerance inSri Lankan children and adolescents with obesity and itsrelation to other comorbidities
Iris Ciba1,2 | Loretta S. Warnakulasuriya3 | Adikaram V. N. Adikaram4 |
Peter Bergsten1,2,5 | Marie Dahlbom1,2 | Manel M. A. Fernando6 |
Elisabet Rytter7 | Dulani L. Samaranayake8 | K. D. Renuka Ruchira Silva9 |
V. Pujitha Wickramasinghe10 | Anders H. Forslund1,2
1Department of Women's and Children's
Health, Uppsala University, Uppsala, Sweden
2Uppsala University Children's Hospital,
Uppsala, Sweden
3Postgraduate Institute of Medicine,
University of Colombo, Colombo, Sri Lanka
4Health Unit, Bandaranaike International
Airport, Katunayake, Sri Lanka
5Department of Medical Cell Biology, Uppsala
University, Uppsala, Sweden
6Colombo North Teaching Hospital, Ragama,
Sri Lanka
7Clinical Nutrition and Metabolism,
Department of Public Health and Caring
Science, Faculty of Medicine, Uppsala
University, Uppsala, Sweden
8Department of Community Medicine,
University of Colombo, Colombo, Sri Lanka
9Department of Applied Nutrition, Wayamba
University of Sri Lanka, Makandura, Sri Lanka
10Department of Paediatrics, Faculty of
Medicine, University of Colombo, Colombo,
Sri Lanka
Correspondence
Iris Ciba, Department of Women's and
Children's Health, Uppsala University, Uppsala,
Sweden.
Email: [email protected]
Funding information
Diabetesförbundet; European Commission,
Grant/Award Number: 279153; Gillbergska
Abstract
Background: South Asian adults have higher prevalence of obesity comorbidities
than other ethnic groups. Whether this also is true for Sri Lankan children with obe-
sity has rarely been investigated.
Objective: To investigate prevalence of glucose intolerance and other comorbidities
in Sri Lankan children with obesity and compare them with Swedish children. To
identify risk factors associated with glucose intolerance.
Subjects: A total of 357 Sri Lankan children (185 boys), aged 7 to 17 years with BMI-
SDS ≥2.0 from a cross-sectional school screening in Negombo. A total of 167 subjects
from this study population were matched for sex, BMI-SDS and age with 167 Swedish
subjects from the ULSCO cohort for comparison.
Methods: After a 12 hour overnight fast, blood samples were collected and oral glu-
cose tolerance test was performed. Body fat mass was assessed by bioelectrical
impedance assay. Data regarding medical history and socioeconomic status were
obtained from questionnaires.
Results: Based on levels of fasting glucose (FG) and 2 hours-glucose (2 hours-G), Sri
Lankan subjects were divided into five groups: normal glucose tolerance (77.5%,
n = 276), isolated impaired fasting glucose according to ADA criteria (9.0%, n = 32),
isolated impaired glucose tolerance (8.4%, n = 30), combined impaired fasting glucose
(IFG) + impaired glucose tolerance (IGT) (3.1%, n = 11) and type 2 diabetes mellitus
(2.0%, n = 7). FG, 2 hours-insulin and educational status of the father independently
increased the Odds ratio to have elevated 2 hours-G. Sri Lankan subjects had higher
percentage of body fat, but less abdominal fat than Swedish subjects.
Iris Ciba and Loretta S. Warnakulasuriya are considered joint first author.
V. Pujitha Wickramasinghe and Anders H. Forslund are considered joint last author.
Received: 15 June 2020 Revised: 29 September 2020 Accepted: 16 October 2020
DOI: 10.1111/pedi.13145
This is an open access article under the terms of the Creative Commons Attribution-NonCommercial-NoDerivs License, which permits use and distribution in any
medium, provided the original work is properly cited, the use is non-commercial and no modifications or adaptations are made.
© 2020 The Authors. Pediatric Diabetes published by John Wiley & Sons Ltd.
168 Pediatr Diabetes. 2021;22:168–181.wileyonlinelibrary.com/journal/pedi
stiftelsen; Medicinska Forskningsrådet, Grant/
Award Number: 72X-14019; Swedish
Radiohjälpen ‘‘Children of the World’’; UppsalaRegional Research Council; Uppsala University
Innovation
Conclusion: High prevalence in Sri Lankan children with obesity shows that screening
for glucose intolerance is important even if asymptomatic.
K E YWORD S
pediatric obesity, glucose intolerance, diabetes mellitus, type 2, Sri Lanka, Sweden
1 | INTRODUCTION
Rising childhood obesity rates worldwide lead to an increase in the
prevalence of obesity-related complications, such as type 2 diabetes
mellitus (T2DM), non-alcoholic fatty liver disease (NAFLD), hyperten-
sion and other non-communicable diseases, and to a decrease in the
age of onset. The World Obesity Federation estimated in a report,
using data from the Global Burden of Disease collaborative, that by
2025 globally some 268 million children aged 5 to 17 years may be
overweight, including 91 million with obesity. They also estimated the
likely numbers of children in 2025 with obesity-related comorbidities
like impaired glucose tolerance (IGT, 12 million) and T2DM
(4 million).1
Disturbances of glucose metabolism, such as impaired fasting glu-
cose (IFG) or impaired glucose tolerance (IGT), are common among
children and adolescents with obesity all over the world. High preva-
lence rates of IGT in children and adolescents with obesity between
15% and 25% have been reported from the United States,2
Bangladesh,3,4 Thailand5 and Iran.6 Prevalence rates of IGT in Europe
are generally lower with rates between 3% and 5%, for example, in
Italy7-10 and the Netherlands,11 but reported prevalence varies signifi-
cantly with higher rates of 15% to 19% observed in some studies from
Spain12 and Montenegro,13 and 11% reported from Austria.14 Some
Scandinavian studies also observed high prevalence of both IGT14 and
especially IFG, which seems to be more common in northern
European countries than in other parts of Europe.15,16 There are only
sparse data regarding the prevalence of glucose intolerance in South
Asian and especially in Sri Lankan children with obesity, but one
recent study in 202 children with obesity from Colombo reported a
prevalence of 11.4% for IGT and 10.9% for IFG (according to ADA
criteria).17
Among Sri Lankan adults, the prevalence of T2DM was about
10.3% in a study conducted from 2005 to 2006, and some form of
dysglycemia was present in 21.8% of the participants.18 The same
study claimed a projected diabetes prevalence of 13.9% in Sri Lanka
for the year 2030. Compared with many other ethnic groups, South
Asian populations are, due to their fast economic growth and genetic
predisposition, prone to develop many adverse metabolic conse-
quences at an earlier degree of obesity, including insulin resistance,19
glucose intolerance, and T2DM.20 A WHO expert consultation
concluded that the proportion of Asian people with a high risk of
developing T2DM and cardiovascular disease is substantial at BMI
values lower than the existing WHO cut-off point for overweight
(> 25 kg/m2).21 Furthermore, people born in the Indian sub-continent
who had migrated to England and Wales were found to have higher
mortality from both ischemic heart disease and cerebrovascular
disease than the national average.22 Another study compared the rela-
tionship between obesity and prevalent diabetes across ethnic groups
in the UK Biobank cohort and found that for the equivalent preva-
lence of diabetes at 30 kg/m2 in white participants, BMI equated to
22.0 kg/m2 in South Asians.23
The overall observation is that South Asian adults have higher
prevalence of comorbidities at the same BMI compared with other
ethnic groups. Whether this also is true for Sri Lankan children with
obesity particularly compared to obese children of other origins has
rarely been investigated. One previous study examined whether
British South Asian children differ in insulin resistance, adiposity, and
cardiovascular risk profile from white children, and found that the ten-
dency to develop insulin resistance observed in British South Asian
adults was also apparent in children.24 Another study in 6 to 11 year
old randomly selected South Indian children with different weight sta-
tus showed an overall prevalence of prediabetes or diabetes of 3.7%,
with the highest prevalence of 12.7% in girls with abdominal obe-
sity.25 A recent study in 5 to 15 year old randomly selected Sri Lankan
children from the Colombo district found that insulin resistance
among Sri Lankan children was high in all groups of weight status,
even if many children were able to control glucose levels within nor-
mal limits.26 Even if these studies suggest a relatively high prevalence
of glucose intolerance in South Indian and Sri Lankan children with
obesity, the data has not been compared with data from children with
obesity of other ethnic origins.
The aim of the present study was to investigate the prevalence of
different states of glucose intolerance in Sri Lankan children and ado-
lescents with obesity and its relation to other metabolic and anthro-
pometric parameters. Furthermore, this study compared body
composition and prevalence of obesity comorbidities among Sri
Lankan and Swedish children with the same degree of obesity
expressed as BMI-SDS.
2 | METHODS
2.1 | Study design and setting
All children identified as having obesity (BMI-SDS ≥ +2SD according
to WHO, 2007) in a cross-sectional survey carried out in Sri Lankan
schools27 were invited to the Diabetes Screening and Vocational
Training Centre of the Lions Club of Negombo Host for further exami-
nation and possible treatment. Children with chronic diseases, sec-
ondary causes for obesity or on long term medication were excluded
according to judgment of the clinical examiner. The original school
screening was conducted between July 2013 and March 2014 in eight
CIBA ET AL. 169
schools in the Negombo educational zone of the Western Province of
Sri Lanka. The assessments of children with obesity at the Diabetes
Screening and Vocational Training Centre of the Lions Club of
Negombo Host were carried out between July and September 2014.
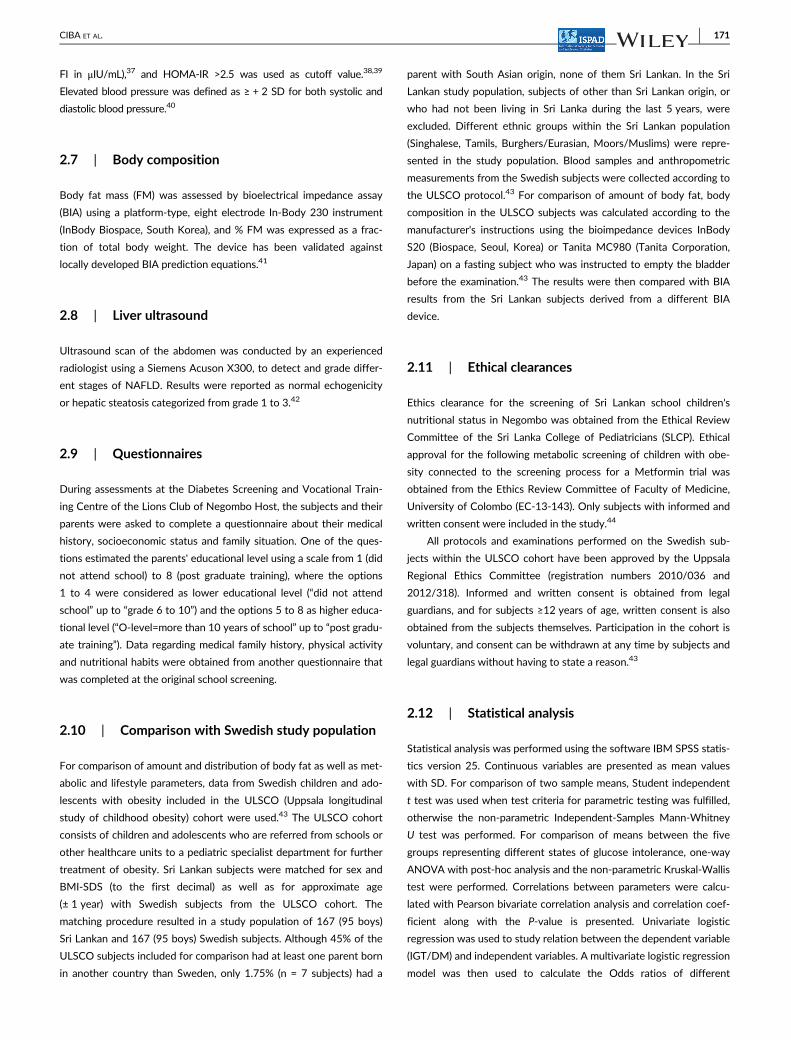
2.2 | Study population
Out of 13 688 children participating in the school screening, 667 were
identified as having obesity at screening, and the 500 that were
7 years or older were invited to the Diabetes Screening Centre. Of
the 500 invited children with obesity, 430 came for assessments at
the centre. Out of these 430 children, 404 completed baseline assess-
ments, whereas 26 of them could not complete them due to difficul-
ties to go through oral glucose tolerance test (OGTT). In the analysis,
357 children with complete OGTT and fulfilling the WHO criteria for
obesity (BMI-SDS ≥ +2SD) were included (Figure 1).
2.3 | Baseline assessments
Baseline assessment at the Diabetes Screening and Vocational Train-
ing Centre of the Lions Club of Negombo Host was done after a
12 hour overnight fast. Height, weight,28 waist circumference (WC),29
and blood pressure were measured by trained research assistants
using a standardized protocol. To limit the impact of inter-operator
variability, the same six assistants who had undergone the same
training conducted all the measurements. Height (cm) was assessed
using a standardized, calibrated stadiometer and weight (kg) was
assessed using a standardized, calibrated scale with the patient wear-
ing light clothing and no shoes. WC (cm) was measured with a flexible
tape midway between the superior border of the iliac crest and the
lowest rib on the standing patient. BMI was calculated by weight
(kg) divided by height squared (m2) and BMI-SDS was calculated using
the software Microsoft Excel with the plugin LMSGrowth and the ref-
erence WHO 2007. The same software was used to calculate SDS for
both systolic and diastolic blood pressure. Waist-height-ratio (WHtR)
was calculated by dividing WC (cm)/height (cm). Pubertal staging was
assessed using visual charts,30 and wherever subject and parents were
not certain of the staging, with consent, the examiner assessed the
correct pubertal stage. In boys, testis size was assessed by the exam-
iner using Prader orchidometer.31
2.4 | Blood sampling
Blood was drawn, after applying lidocaine/prilocaine (Emla) anesthetic
cream, to assess fasting glucose (FG), fasting insulin (FI), total choles-
terol (TC), low-density lipoprotein cholesterol (LDL), high-density lipo-
protein cholesterol (HDL), triglycerides (TG), alanine transaminase
(ALT), aspartate transaminase (AST), and highly sensitive C-reactive
protein (hs-CRP). Serum was separated immediately and stored at
−20�C and analysis was conducted in batches at the biochemical labo-
ratory of the same centre.
2.5 | Oral glucose tolerance test
OGTT was performed after administering anhydrous glucose 1.75 g/kg
body weight to a maximum of 75 g and blood was drawn 2 hours later
for glucose (2 hours-G) and insulin (2 hours-I) measurements.
2.6 | Validation of glucose tolerance and metabolicderangements
IFG was defined by FG 100 to 125 mg/dL according to ADA
(American Diabetes Association) criteria.32 IGT was defined by
2 hours-G between 140 and 199 mg/dL. T2DM was defined by
2 hours-G ≥ 200 mg/dL and/or FG ≥126 mg/dL. Based on levels of
FG and 2 hours-G, the subjects were divided into five groups (rep-
resenting states of glucose intolerance from NGT to T2DM) as having
normal glucose tolerance (NGT), isolated impaired fasting glucose (iso-
IFG), isolated impaired glucose tolerance (iso-IGT), combined IFG
+ IGT (comb IFG + IGT) or T2DM.
Other metabolic derangements were identified as: FI ≥12 μIU/mL,33
TC ≥200 mg/dL (≥5.17 mmol/L), LDL ≥130 mg/dL (≥3.36 mmol/L),
HDL <40 mg/dL (<1.03 mmol/L), TG ≥150 mg/dL (≥1.69 mmol/L),34
AST >40 IU/L, ALT >40 IU/L,35 hs-CRP >1 mg/dL.36 To assess insulin
resistance, HOMA-IR was calculated as (FGxFI)/22.5 (FG in mmol/L,F IGURE 1 Flow chart of subject numbers throughout thescreening procedure
170 CIBA ET AL.
FI in μIU/mL),37 and HOMA-IR >2.5 was used as cutoff value.38,39
Elevated blood pressure was defined as ≥ + 2 SD for both systolic and
diastolic blood pressure.40
2.7 | Body composition
Body fat mass (FM) was assessed by bioelectrical impedance assay
(BIA) using a platform-type, eight electrode In-Body 230 instrument
(InBody Biospace, South Korea), and % FM was expressed as a frac-
tion of total body weight. The device has been validated against
locally developed BIA prediction equations.41
2.8 | Liver ultrasound
Ultrasound scan of the abdomen was conducted by an experienced
radiologist using a Siemens Acuson X300, to detect and grade differ-
ent stages of NAFLD. Results were reported as normal echogenicity
or hepatic steatosis categorized from grade 1 to 3.42
2.9 | Questionnaires
During assessments at the Diabetes Screening and Vocational Train-
ing Centre of the Lions Club of Negombo Host, the subjects and their
parents were asked to complete a questionnaire about their medical
history, socioeconomic status and family situation. One of the ques-
tions estimated the parents' educational level using a scale from 1 (did
not attend school) to 8 (post graduate training), where the options
1 to 4 were considered as lower educational level (“did not attend
school” up to “grade 6 to 10”) and the options 5 to 8 as higher educa-
tional level (“O-level=more than 10 years of school” up to “post gradu-
ate training”). Data regarding medical family history, physical activity
and nutritional habits were obtained from another questionnaire that
was completed at the original school screening.
2.10 | Comparison with Swedish study population
For comparison of amount and distribution of body fat as well as met-
abolic and lifestyle parameters, data from Swedish children and ado-
lescents with obesity included in the ULSCO (Uppsala longitudinal
study of childhood obesity) cohort were used.43 The ULSCO cohort
consists of children and adolescents who are referred from schools or
other healthcare units to a pediatric specialist department for further
treatment of obesity. Sri Lankan subjects were matched for sex and
BMI-SDS (to the first decimal) as well as for approximate age
(± 1 year) with Swedish subjects from the ULSCO cohort. The
matching procedure resulted in a study population of 167 (95 boys)
Sri Lankan and 167 (95 boys) Swedish subjects. Although 45% of the
ULSCO subjects included for comparison had at least one parent born
in another country than Sweden, only 1.75% (n = 7 subjects) had a
parent with South Asian origin, none of them Sri Lankan. In the Sri
Lankan study population, subjects of other than Sri Lankan origin, or
who had not been living in Sri Lanka during the last 5 years, were
excluded. Different ethnic groups within the Sri Lankan population
(Singhalese, Tamils, Burghers/Eurasian, Moors/Muslims) were repre-
sented in the study population. Blood samples and anthropometric
measurements from the Swedish subjects were collected according to
the ULSCO protocol.43 For comparison of amount of body fat, body
composition in the ULSCO subjects was calculated according to the
manufacturer's instructions using the bioimpedance devices InBody
S20 (Biospace, Seoul, Korea) or Tanita MC980 (Tanita Corporation,
Japan) on a fasting subject who was instructed to empty the bladder
before the examination.43 The results were then compared with BIA
results from the Sri Lankan subjects derived from a different BIA
device.
2.11 | Ethical clearances
Ethics clearance for the screening of Sri Lankan school children's
nutritional status in Negombo was obtained from the Ethical Review
Committee of the Sri Lanka College of Pediatricians (SLCP). Ethical
approval for the following metabolic screening of children with obe-
sity connected to the screening process for a Metformin trial was
obtained from the Ethics Review Committee of Faculty of Medicine,
University of Colombo (EC-13-143). Only subjects with informed and
written consent were included in the study.44
All protocols and examinations performed on the Swedish sub-
jects within the ULSCO cohort have been approved by the Uppsala
Regional Ethics Committee (registration numbers 2010/036 and
2012/318). Informed and written consent is obtained from legal
guardians, and for subjects ≥12 years of age, written consent is also
obtained from the subjects themselves. Participation in the cohort is
voluntary, and consent can be withdrawn at any time by subjects and
legal guardians without having to state a reason.43
2.12 | Statistical analysis
Statistical analysis was performed using the software IBM SPSS statis-
tics version 25. Continuous variables are presented as mean values
with SD. For comparison of two sample means, Student independent
t test was used when test criteria for parametric testing was fulfilled,
otherwise the non-parametric Independent-Samples Mann-Whitney
U test was performed. For comparison of means between the five
groups representing different states of glucose intolerance, one-way
ANOVA with post-hoc analysis and the non-parametric Kruskal-Wallis
test were performed. Correlations between parameters were calcu-
lated with Pearson bivariate correlation analysis and correlation coef-
ficient along with the P-value is presented. Univariate logistic
regression was used to study relation between the dependent variable
(IGT/DM) and independent variables. A multivariate logistic regression
model was then used to calculate the Odds ratios of different
CIBA ET AL. 171
covariates regarding to the risk of having IGT/DM or IFG. P values
<.05 were considered statistically significant.
3 | RESULTS
3.1 | Characteristics of the Sri Lankan studypopulation according to state of glucose intolerance
Of the 357 subjects included, 51.8% (n = 185) were boys and 48.2%
(n = 172) were girls. Mean age was 11.9 years (±2.32 SD) and mean
BMI-SDS was 2.6 (±0.44 SD).
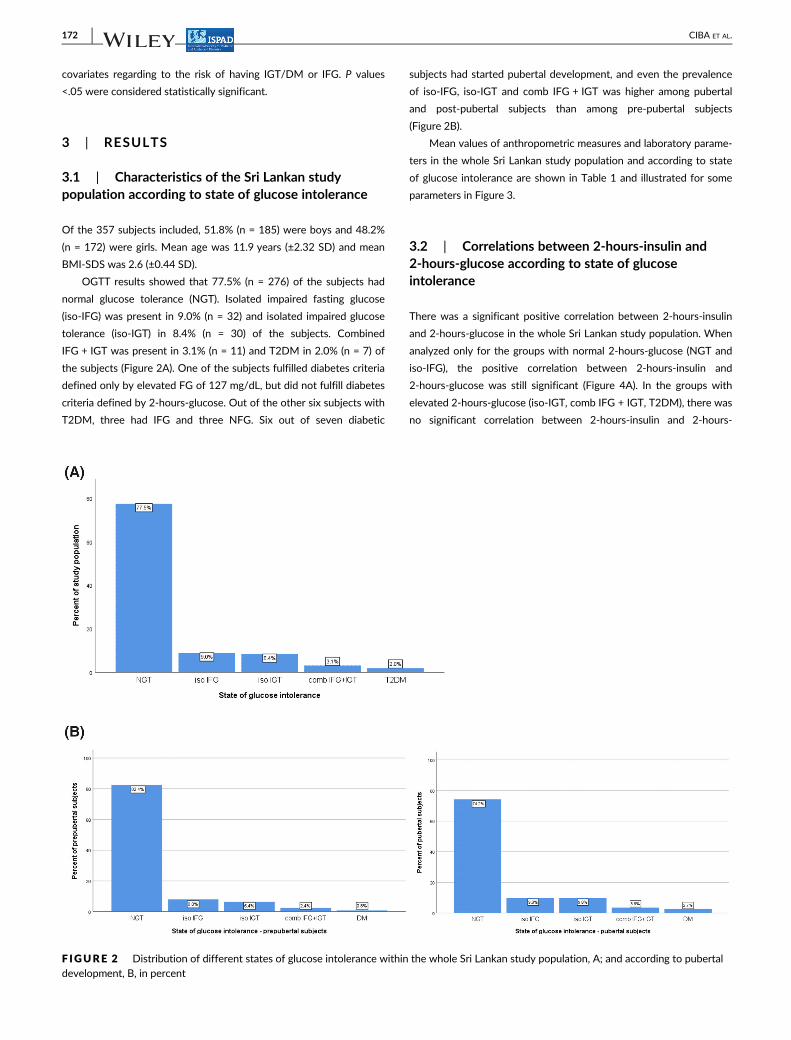
OGTT results showed that 77.5% (n = 276) of the subjects had
normal glucose tolerance (NGT). Isolated impaired fasting glucose
(iso-IFG) was present in 9.0% (n = 32) and isolated impaired glucose
tolerance (iso-IGT) in 8.4% (n = 30) of the subjects. Combined
IFG + IGT was present in 3.1% (n = 11) and T2DM in 2.0% (n = 7) of
the subjects (Figure 2A). One of the subjects fulfilled diabetes criteria
defined only by elevated FG of 127 mg/dL, but did not fulfill diabetes
criteria defined by 2-hours-glucose. Out of the other six subjects with
T2DM, three had IFG and three NFG. Six out of seven diabetic
subjects had started pubertal development, and even the prevalence
of iso-IFG, iso-IGT and comb IFG + IGT was higher among pubertal
and post-pubertal subjects than among pre-pubertal subjects
(Figure 2B).
Mean values of anthropometric measures and laboratory parame-
ters in the whole Sri Lankan study population and according to state
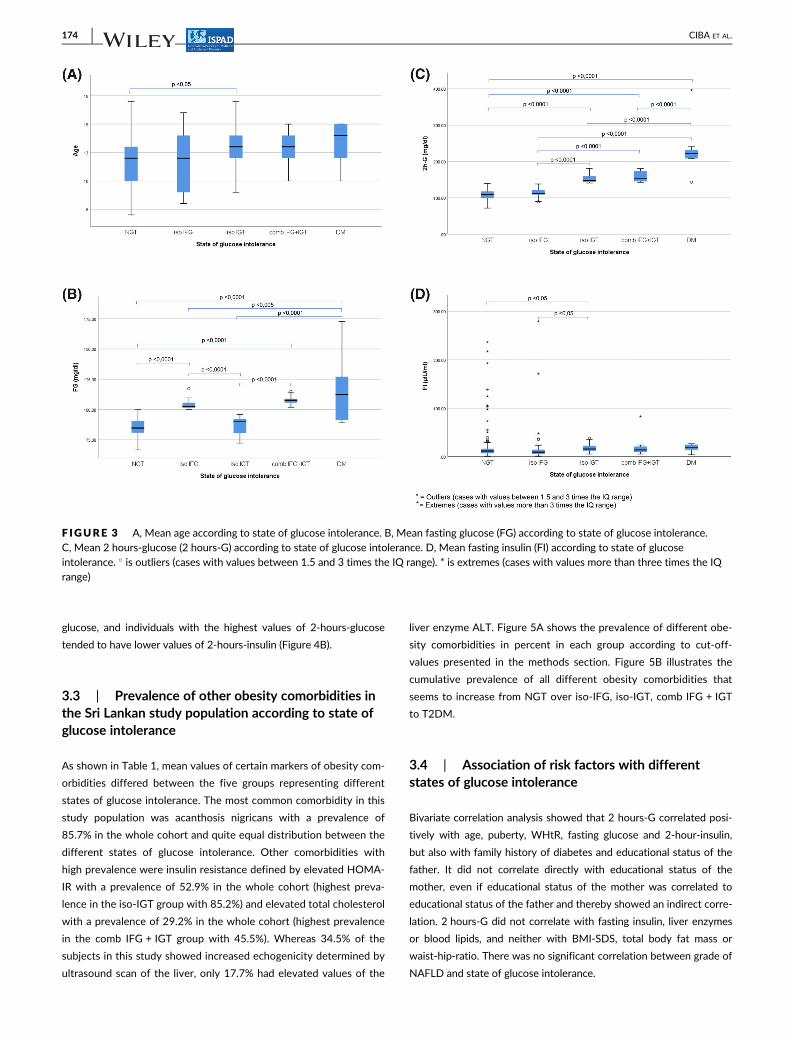
of glucose intolerance are shown in Table 1 and illustrated for some
parameters in Figure 3.
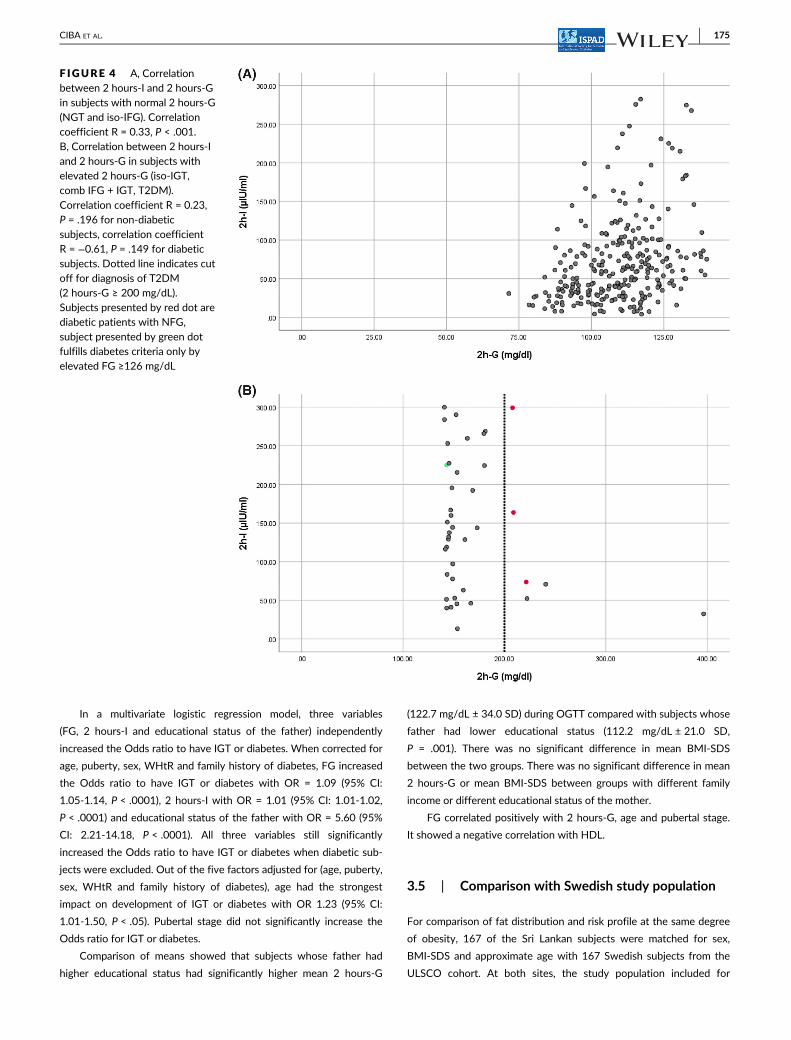
3.2 | Correlations between 2-hours-insulin and2-hours-glucose according to state of glucoseintolerance
There was a significant positive correlation between 2-hours-insulin
and 2-hours-glucose in the whole Sri Lankan study population. When
analyzed only for the groups with normal 2-hours-glucose (NGT and
iso-IFG), the positive correlation between 2-hours-insulin and
2-hours-glucose was still significant (Figure 4A). In the groups with
elevated 2-hours-glucose (iso-IGT, comb IFG + IGT, T2DM), there was
no significant correlation between 2-hours-insulin and 2-hours-
F IGURE 2 Distribution of different states of glucose intolerance within the whole Sri Lankan study population, A; and according to pubertaldevelopment, B, in percent
172 CIBA ET AL.
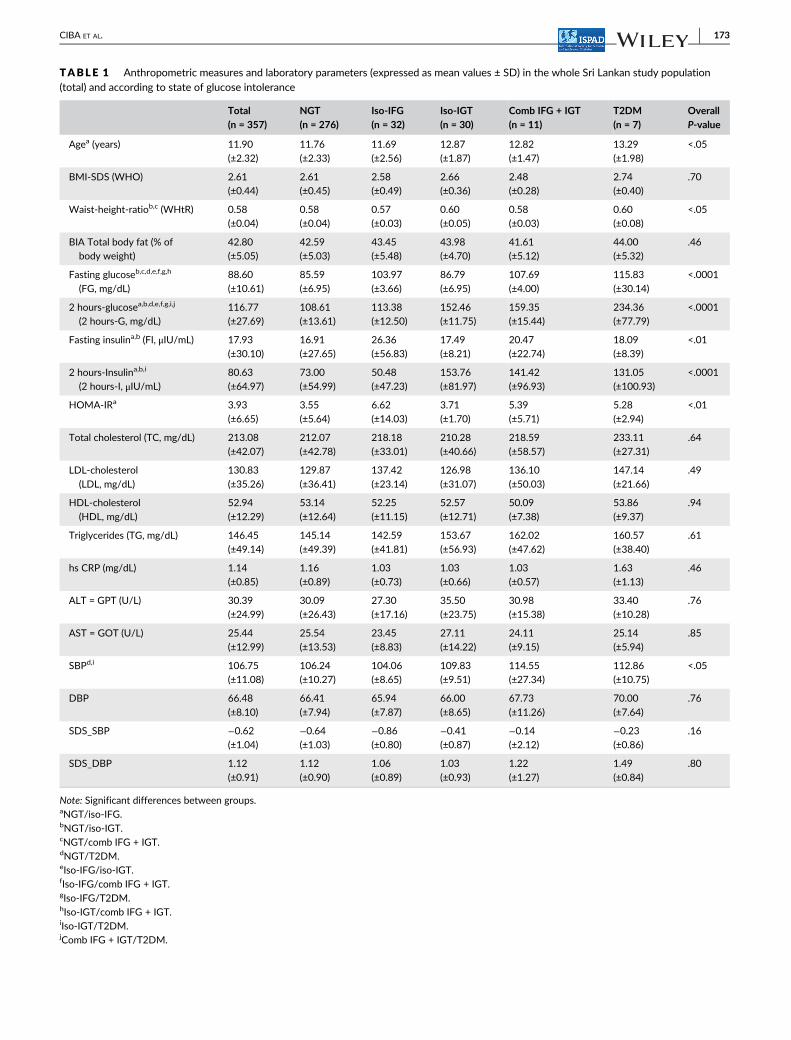
TABLE 1 Anthropometric measures and laboratory parameters (expressed as mean values ± SD) in the whole Sri Lankan study population(total) and according to state of glucose intolerance
Total
(n = 357)
NGT
(n = 276)
Iso-IFG
(n = 32)
Iso-IGT
(n = 30)
Comb IFG + IGT
(n = 11)
T2DM
(n = 7)
Overall
P-value
Agea (years) 11.90
(±2.32)
11.76
(±2.33)
11.69
(±2.56)
12.87
(±1.87)
12.82
(±1.47)
13.29
(±1.98)
<.05
BMI-SDS (WHO) 2.61
(±0.44)
2.61
(±0.45)
2.58
(±0.49)
2.66
(±0.36)
2.48
(±0.28)
2.74
(±0.40)
.70
Waist-height-ratiob,c (WHtR) 0.58
(±0.04)
0.58
(±0.04)
0.57
(±0.03)
0.60
(±0.05)
0.58
(±0.03)
0.60
(±0.08)
<.05
BIA Total body fat (% of
body weight)
42.80
(±5.05)
42.59
(±5.03)
43.45
(±5.48)
43.98
(±4.70)
41.61
(±5.12)
44.00
(±5.32)
.46
Fasting glucoseb,c,d,e,f,g,h
(FG, mg/dL)
88.60
(±10.61)
85.59
(±6.95)
103.97
(±3.66)
86.79
(±6.95)
107.69
(±4.00)
115.83
(±30.14)
<.0001
2 hours-glucosea,b,d,e,f,g,i,j
(2 hours-G, mg/dL)
116.77
(±27.69)
108.61
(±13.61)
113.38
(±12.50)
152.46
(±11.75)
159.35
(±15.44)
234.36
(±77.79)
<.0001
Fasting insulina,b (FI, μIU/mL) 17.93
(±30.10)
16.91
(±27.65)
26.36
(±56.83)
17.49
(±8.21)
20.47
(±22.74)
18.09
(±8.39)
<.01
2 hours-Insulina,b,i
(2 hours-I, μIU/mL)
80.63
(±64.97)
73.00
(±54.99)
50.48
(±47.23)
153.76
(±81.97)
141.42
(±96.93)
131.05
(±100.93)
<.0001
HOMA-IRa 3.93
(±6.65)
3.55
(±5.64)
6.62
(±14.03)
3.71
(±1.70)
5.39
(±5.71)
5.28
(±2.94)
<.01
Total cholesterol (TC, mg/dL) 213.08
(±42.07)
212.07
(±42.78)
218.18
(±33.01)
210.28
(±40.66)
218.59
(±58.57)
233.11
(±27.31)
.64
LDL-cholesterol
(LDL, mg/dL)
130.83
(±35.26)
129.87
(±36.41)
137.42
(±23.14)
126.98
(±31.07)
136.10
(±50.03)
147.14
(±21.66)
.49
HDL-cholesterol
(HDL, mg/dL)
52.94
(±12.29)
53.14
(±12.64)
52.25
(±11.15)
52.57
(±12.71)
50.09
(±7.38)
53.86
(±9.37)
.94
Triglycerides (TG, mg/dL) 146.45
(±49.14)
145.14
(±49.39)
142.59
(±41.81)
153.67
(±56.93)
162.02
(±47.62)
160.57
(±38.40)
.61
hs CRP (mg/dL) 1.14
(±0.85)
1.16
(±0.89)
1.03
(±0.73)
1.03
(±0.66)
1.03
(±0.57)
1.63
(±1.13)
.46
ALT = GPT (U/L) 30.39
(±24.99)
30.09
(±26.43)
27.30
(±17.16)
35.50
(±23.75)
30.98
(±15.38)
33.40
(±10.28)
.76
AST = GOT (U/L) 25.44
(±12.99)
25.54
(±13.53)
23.45
(±8.83)
27.11
(±14.22)
24.11
(±9.15)
25.14
(±5.94)
.85
SBPd,i 106.75
(±11.08)
106.24
(±10.27)
104.06
(±8.65)
109.83
(±9.51)
114.55
(±27.34)
112.86
(±10.75)
<.05
DBP 66.48
(±8.10)
66.41
(±7.94)
65.94
(±7.87)
66.00
(±8.65)
67.73
(±11.26)
70.00
(±7.64)
.76
SDS_SBP −0.62(±1.04)
−0.64(±1.03)
−0.86(±0.80)
−0.41(±0.87)
−0.14(±2.12)
−0.23(±0.86)
.16
SDS_DBP 1.12
(±0.91)
1.12
(±0.90)
1.06
(±0.89)
1.03
(±0.93)
1.22
(±1.27)
1.49
(±0.84)
.80
Note: Significant differences between groups.aNGT/iso-IFG.bNGT/iso-IGT.cNGT/comb IFG + IGT.dNGT/T2DM.eIso-IFG/iso-IGT.fIso-IFG/comb IFG + IGT.gIso-IFG/T2DM.hIso-IGT/comb IFG + IGT.iIso-IGT/T2DM.jComb IFG + IGT/T2DM.
CIBA ET AL. 173
glucose, and individuals with the highest values of 2-hours-glucose
tended to have lower values of 2-hours-insulin (Figure 4B).
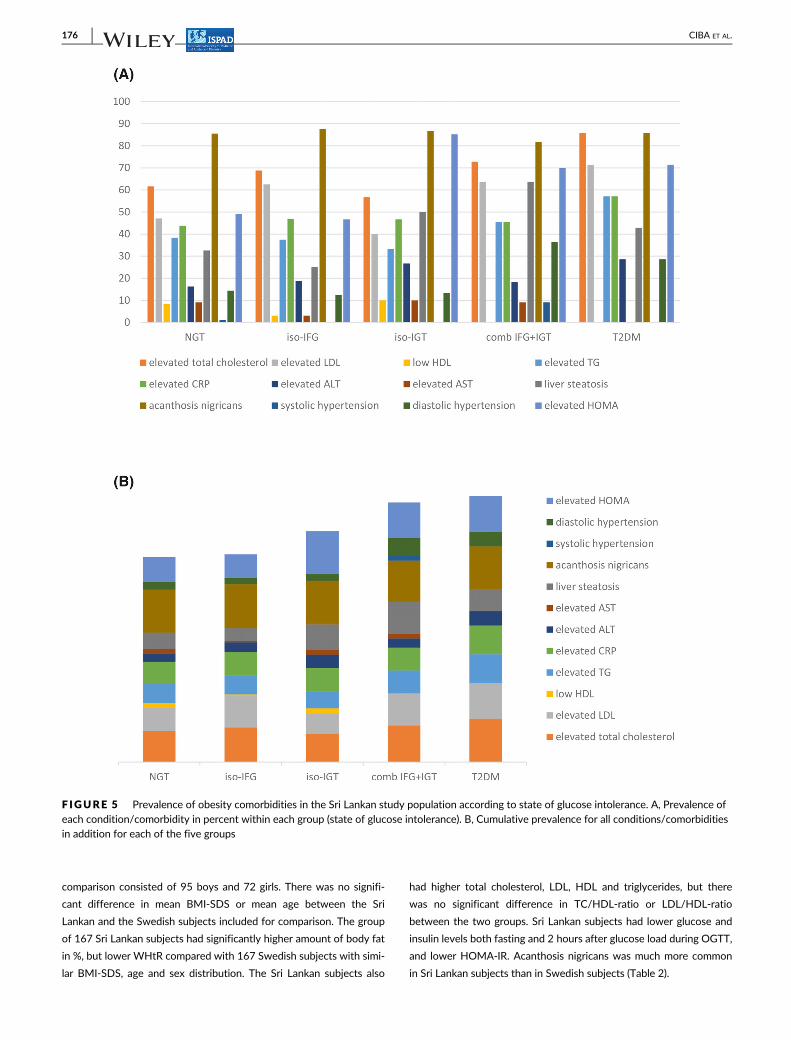
3.3 | Prevalence of other obesity comorbidities inthe Sri Lankan study population according to state ofglucose intolerance
As shown in Table 1, mean values of certain markers of obesity com-
orbidities differed between the five groups representing different
states of glucose intolerance. The most common comorbidity in this
study population was acanthosis nigricans with a prevalence of
85.7% in the whole cohort and quite equal distribution between the
different states of glucose intolerance. Other comorbidities with
high prevalence were insulin resistance defined by elevated HOMA-
IR with a prevalence of 52.9% in the whole cohort (highest preva-
lence in the iso-IGT group with 85.2%) and elevated total cholesterol
with a prevalence of 29.2% in the whole cohort (highest prevalence
in the comb IFG + IGT group with 45.5%). Whereas 34.5% of the
subjects in this study showed increased echogenicity determined by
ultrasound scan of the liver, only 17.7% had elevated values of the
liver enzyme ALT. Figure 5A shows the prevalence of different obe-
sity comorbidities in percent in each group according to cut-off-
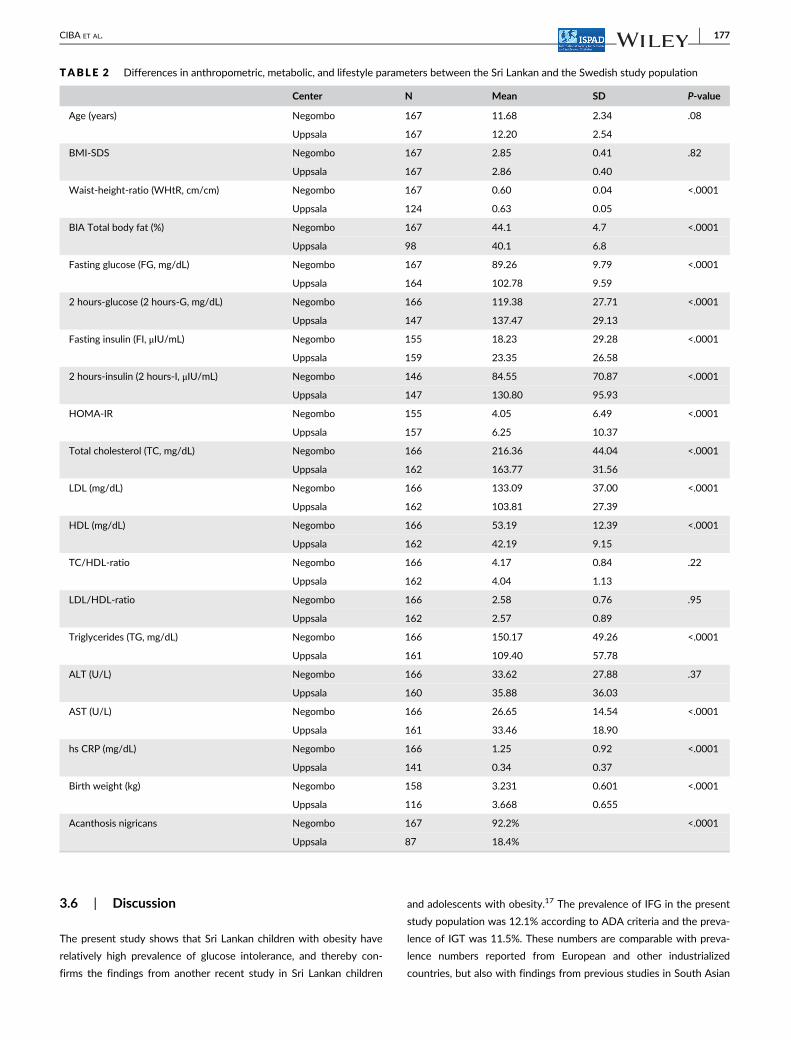
values presented in the methods section. Figure 5B illustrates the
cumulative prevalence of all different obesity comorbidities that
seems to increase from NGT over iso-IFG, iso-IGT, comb IFG + IGT
to T2DM.
3.4 | Association of risk factors with differentstates of glucose intolerance
Bivariate correlation analysis showed that 2 hours-G correlated posi-
tively with age, puberty, WHtR, fasting glucose and 2-hour-insulin,
but also with family history of diabetes and educational status of the
father. It did not correlate directly with educational status of the
mother, even if educational status of the mother was correlated to
educational status of the father and thereby showed an indirect corre-
lation. 2 hours-G did not correlate with fasting insulin, liver enzymes
or blood lipids, and neither with BMI-SDS, total body fat mass or
waist-hip-ratio. There was no significant correlation between grade of
NAFLD and state of glucose intolerance.
F IGURE 3 A, Mean age according to state of glucose intolerance. B, Mean fasting glucose (FG) according to state of glucose intolerance.C, Mean 2 hours-glucose (2 hours-G) according to state of glucose intolerance. D, Mean fasting insulin (FI) according to state of glucoseintolerance. � is outliers (cases with values between 1.5 and 3 times the IQ range). * is extremes (cases with values more than three times the IQrange)
174 CIBA ET AL.
In a multivariate logistic regression model, three variables
(FG, 2 hours-I and educational status of the father) independently
increased the Odds ratio to have IGT or diabetes. When corrected for
age, puberty, sex, WHtR and family history of diabetes, FG increased
the Odds ratio to have IGT or diabetes with OR = 1.09 (95% CI:
1.05-1.14, P < .0001), 2 hours-I with OR = 1.01 (95% CI: 1.01-1.02,
P < .0001) and educational status of the father with OR = 5.60 (95%
CI: 2.21-14.18, P < .0001). All three variables still significantly
increased the Odds ratio to have IGT or diabetes when diabetic sub-
jects were excluded. Out of the five factors adjusted for (age, puberty,
sex, WHtR and family history of diabetes), age had the strongest
impact on development of IGT or diabetes with OR 1.23 (95% CI:
1.01-1.50, P < .05). Pubertal stage did not significantly increase the
Odds ratio for IGT or diabetes.
Comparison of means showed that subjects whose father had
higher educational status had significantly higher mean 2 hours-G
(122.7 mg/dL ± 34.0 SD) during OGTT compared with subjects whose
father had lower educational status (112.2 mg/dL ± 21.0 SD,
P = .001). There was no significant difference in mean BMI-SDS
between the two groups. There was no significant difference in mean
2 hours-G or mean BMI-SDS between groups with different family
income or different educational status of the mother.
FG correlated positively with 2 hours-G, age and pubertal stage.
It showed a negative correlation with HDL.
3.5 | Comparison with Swedish study population
For comparison of fat distribution and risk profile at the same degree
of obesity, 167 of the Sri Lankan subjects were matched for sex,
BMI-SDS and approximate age with 167 Swedish subjects from the
ULSCO cohort. At both sites, the study population included for
F IGURE 4 A, Correlationbetween 2 hours-I and 2 hours-Gin subjects with normal 2 hours-G(NGT and iso-IFG). Correlationcoefficient R = 0.33, P < .001.B, Correlation between 2 hours-Iand 2 hours-G in subjects withelevated 2 hours-G (iso-IGT,comb IFG + IGT, T2DM).
Correlation coefficient R = 0.23,P = .196 for non-diabeticsubjects, correlation coefficientR = −0.61, P = .149 for diabeticsubjects. Dotted line indicates cutoff for diagnosis of T2DM(2 hours-G ≥ 200 mg/dL).Subjects presented by red dot arediabetic patients with NFG,subject presented by green dotfulfills diabetes criteria only byelevated FG ≥126 mg/dL
CIBA ET AL. 175
comparison consisted of 95 boys and 72 girls. There was no signifi-
cant difference in mean BMI-SDS or mean age between the Sri
Lankan and the Swedish subjects included for comparison. The group
of 167 Sri Lankan subjects had significantly higher amount of body fat
in %, but lower WHtR compared with 167 Swedish subjects with simi-
lar BMI-SDS, age and sex distribution. The Sri Lankan subjects also
had higher total cholesterol, LDL, HDL and triglycerides, but there
was no significant difference in TC/HDL-ratio or LDL/HDL-ratio
between the two groups. Sri Lankan subjects had lower glucose and
insulin levels both fasting and 2 hours after glucose load during OGTT,
and lower HOMA-IR. Acanthosis nigricans was much more common
in Sri Lankan subjects than in Swedish subjects (Table 2).
F IGURE 5 Prevalence of obesity comorbidities in the Sri Lankan study population according to state of glucose intolerance. A, Prevalence ofeach condition/comorbidity in percent within each group (state of glucose intolerance). B, Cumulative prevalence for all conditions/comorbiditiesin addition for each of the five groups
176 CIBA ET AL.
3.6 | Discussion
The present study shows that Sri Lankan children with obesity have
relatively high prevalence of glucose intolerance, and thereby con-
firms the findings from another recent study in Sri Lankan children
and adolescents with obesity.17 The prevalence of IFG in the present
study population was 12.1% according to ADA criteria and the preva-
lence of IGT was 11.5%. These numbers are comparable with preva-
lence numbers reported from European and other industrialized
countries, but also with findings from previous studies in South Asian
TABLE 2 Differences in anthropometric, metabolic, and lifestyle parameters between the Sri Lankan and the Swedish study population
Center N Mean SD P-value
Age (years) Negombo 167 11.68 2.34 .08
Uppsala 167 12.20 2.54
BMI-SDS Negombo 167 2.85 0.41 .82
Uppsala 167 2.86 0.40
Waist-height-ratio (WHtR, cm/cm) Negombo 167 0.60 0.04 <.0001
Uppsala 124 0.63 0.05
BIA Total body fat (%) Negombo 167 44.1 4.7 <.0001
Uppsala 98 40.1 6.8
Fasting glucose (FG, mg/dL) Negombo 167 89.26 9.79 <.0001
Uppsala 164 102.78 9.59
2 hours-glucose (2 hours-G, mg/dL) Negombo 166 119.38 27.71 <.0001
Uppsala 147 137.47 29.13
Fasting insulin (FI, μIU/mL) Negombo 155 18.23 29.28 <.0001
Uppsala 159 23.35 26.58
2 hours-insulin (2 hours-I, μIU/mL) Negombo 146 84.55 70.87 <.0001
Uppsala 147 130.80 95.93
HOMA-IR Negombo 155 4.05 6.49 <.0001
Uppsala 157 6.25 10.37
Total cholesterol (TC, mg/dL) Negombo 166 216.36 44.04 <.0001
Uppsala 162 163.77 31.56
LDL (mg/dL) Negombo 166 133.09 37.00 <.0001
Uppsala 162 103.81 27.39
HDL (mg/dL) Negombo 166 53.19 12.39 <.0001
Uppsala 162 42.19 9.15
TC/HDL-ratio Negombo 166 4.17 0.84 .22
Uppsala 162 4.04 1.13
LDL/HDL-ratio Negombo 166 2.58 0.76 .95
Uppsala 162 2.57 0.89
Triglycerides (TG, mg/dL) Negombo 166 150.17 49.26 <.0001
Uppsala 161 109.40 57.78
ALT (U/L) Negombo 166 33.62 27.88 .37
Uppsala 160 35.88 36.03
AST (U/L) Negombo 166 26.65 14.54 <.0001
Uppsala 161 33.46 18.90
hs CRP (mg/dL) Negombo 166 1.25 0.92 <.0001
Uppsala 141 0.34 0.37
Birth weight (kg) Negombo 158 3.231 0.601 <.0001
Uppsala 116 3.668 0.655
Acanthosis nigricans Negombo 167 92.2% <.0001
Uppsala 87 18.4%
CIBA ET AL. 177
children and adolescents.24,25 At the same time, the prevalence of
childhood overweight and obesity is still lower in Sri Lanka compared
to most industrialized countries.45 A possible explanation for the find-
ing that Sri Lankan children with obesity have a comparable preva-
lence of comorbidities at a lower mean degree of obesity could be
that they have a higher vulnerability to obesity related complications
compared with other ethnic groups.
To be able to distinguish different forms of glucose intolerance
and analyze characteristics of subjects presenting the different forms,
subjects in this study were divided into five groups, representing five
different states of glucose intolerance from normal glucose tolerance
(NGT) over isolated impaired fasting glucose (iso-IFG), isolated
impaired glucose tolerance (iso-IGT) and combined IFG + IGT (comb
IFG + IGT) to type 2 diabetes mellitus (T2DM). All states of glucose
intolerance (besides NGT) were more common in pubertal and post-
pubertal subjects than in prepubertal subjects (Figure 2B). Further-
more, there was an increase in mean age between the five groups in
the mentioned order (Figure 3A) indicating a possible progression dur-
ing childhood and adolescence from NGT over the isolated and then
combined forms of IFG and IGT to T2DM. Even if age showed a posi-
tive correlation with more advanced states of glucose intolerance, and
significantly increased the Odds ratio to have IGT or diabetes, the pre-
sent study was not able to statistically define a cut-off age for screen-
ing for glucose intolerance, which might depend on the low number of
subjects in the younger age groups. Nevertheless, there were no cases
of IGT under the age of 9 years, and the first cases of combined
IFG + IGT and diabetes occurred at the age of 10 years in this sample.
This might lead to the suggestion to recommend screening for glucose
intolerance from the age of approximately 10 years, which then
should be validated in a larger sample also including more subjects in
the younger age groups. The fact that other variables (eg, family his-
tory of diabetes and educational level of the father) had greater
impact on the risk of developing IGT or diabetes than age in this study
illustrates the multifactorial genesis of obesity itself and its com-
orbidities, leading to difficulties in defining simple and easy accessible
fasting parameters for the selection of subjects that should undergo
the more elaborate OGTT to screen for glucose intolerance. Whereas
there was a positive correlation between 2 hours-G and 2 hours-I in
the groups with normal 2 hours-G (NGT and iso-IFG, Figure 4A), this
correlation could no longer be found in the groups with elevated
2 hours-G (iso-IGT, comb IFG + IGT and T2DM, Figure 4B). Further-
more, in subjects with the highest values of 2 hours-G, levels of
2 hours-I showed a trend to decrease with increasing levels of
2 hours-G. One possible explanation for this finding might be that it
reflects the capacity of the beta-cell to respond to increasing glucose
levels with increased insulin production, showing that the beta-cell
has efficient capacity to compensate for increasing levels of 2 hours-G
in the lower states of glucose intolerance, whereas the capacity starts
to decline in the more advanced states of glucose intolerance (mainly
comb IFG + IGT and T2DM). The finding that the cumulative preva-
lence of different obesity comorbidities seems to increase from NGT
over iso-IFG, iso-IGT, comb IFG + IGT to T2DM (Figure 5) is another
indicator that these five states of glucose intolerance in the men-
tioned order might reflect progression of disease.
In the present study, the risk to have come further in the progress
of disease and to present a more advanced state of glucose intoler-
ance was not only determined by age, but also by educational status
of the father. Previous studies have found that overweight and obe-
sity are more prevalent among lower socioeconomic groups in indus-
trialized countries, whereas the prevalence of overweight and obesity
is higher in higher socioeconomic groups in developing countries.46 In
the present study, there was no significant difference in the preva-
lence of obesity itself between different socioeconomic groups, but
the level of education of the father correlated positively with glucose
levels at 2 hours of OGTT. Furthermore, the risk of having IGT or dia-
betes was higher for children to parents with higher educational level
compared with those with lower educational level. These findings
indicate that the risk for certain metabolic complications of obesity is
higher for individuals belonging to higher socioeconomic groups in Sri
Lanka, as well as in other developing countries.
The prevalence of hypercholesterolemia was high with 62.7% in
this study population of Sri Lankan children with obesity, and has
been described to be relatively high even in normal weight Sri Lankan
school children.47 Whereas 34.5% of the subjects in this study
showed increased echogenicity determined by ultrasound scan of the
liver, only 17.7% had elevated values of the liver enzyme ALT
(Figure 5). This indicates a discrepancy in the estimation of liver
steatosis depending on the method chosen. However, prevalence
numbers of different comorbidities should be interpreted with cau-
tion, taking into account that different reference values are used in
different countries and that reference values often are generated
from studies in adults.
The present study confirmed findings from previous studies
claiming that Sri Lankan children with obesity have higher amount of
body fat compared with children of other origin with the same degree
of obesity.48 The fact that Sri Lankan children in the present study not
only had higher percentage of total body fat than Swedish children
with the same degree of obesity, but lower WHtR at the same time
indicates that they have a different fat distribution with lower amount
of abdominal fat. Compared with Swedish children, Sri Lankan chil-
dren with obesity had higher levels of total cholesterol, LDL and tri-
glycerides, but even HDL cholesterol. They also had lower HOMA,
which indicates a lower degree of insulin resistance in Sri Lankan chil-
dren compared with Swedish children. Caution should be exerted in
interpreting these results, as Swedish subjects included in the ULSCO
cohort are referred from other caregivers and thereby likely to have
received previous treatment for obesity, whereas subjects at the Sri
Lankan study site were included from a school screening without any
previous treatment for obesity. Furthermore, it should be taken into
account that blood samples were taken at two different centres and
analyzed under different conditions. Also, the use of different BIA
devices for measuring body composition is a potential limitation of
the study, as it might lead to inaccuracy in the comparison of subjects
from the two different sites.
178 CIBA ET AL.
Further studies under more standardized conditions are needed
to explain which of the factors testing conditions, referral routines,
different lifestyle parameters or biological factors that have the stron-
gest impact on the observed differences in body composition and
prevalence of comorbidities between South Asian and European chil-
dren and adolescents with obesity.
Nevertheless, differences in blood indicators of comorbidities
between South Asian and European children have been described in
other studies. One previous study compared British children of South
Asian origin with white children and found that mean waist circumfer-
ence and waist-hip-ratio were similar, but South Asian children had
higher triglycerides and insulin levels (both fasting and after glucose
load), though glucose concentrations were similar. Total cholesterol,
LDL and HDL levels were similar in the two groups in the same
study.24 The results of the present study only partly confirm these
findings and other findings from previous literature comparing South
Asian children with children of other ethnic origin, as Sri Lankan chil-
dren in this study showed higher amount of total body fat and higher
levels of blood lipids, but lower degree of abdominal obesity and insu-
lin resistance compared with Swedish children. Discrepancies in
results from studies comparing prevalence of different comorbidities
in children with obesity and different ethnic backgrounds indicate a
need of future multicentre studies with well harmonized study
settings.
Besides potential differences in laboratory methods between the
Sri Lankan and the Swedish study site, another weakness of the pre-
sent study is that only subjects with BMI-SDS >2 were considered
having obesity, as recent data shows that lower cut-offs might be rec-
ommended in Sri Lankan children.41 Furthermore, there was a time
gap of up to 14 months between the school screening and the bio-
chemical assessments at the centre. Even if anthropometric measure-
ments were conducted at both events, lifestyle patterns such as
physical activity and nutritional habits were only evaluated at screen-
ing and might have changed until the assessments at the centre, possi-
bly even due to the knowledge of the child having obesity.
Nevertheless, the present study is one of the first to present data
on glucose intolerance in a bigger sample of Sri Lankan children and
adolescents with obesity, and it provides detailed information not only
on metabolic and anthropometric, but also on socioeconomic and life-
style parameters. Furthermore, it adds knowledge about the metabolic
risk profile of Sri Lankan children and adolescents in comparison with
Swedish children and adolescents with the same degree of obesity.
The fact that glucose intolerance was common in Sri Lankan children
and adolescents with obesity in this study, and that other risk factors
besides age increased the risk of having more advanced states of glu-
cose intolerance, indicates that screening for glucose intolerance is
important even in asymptomatic subjects to avoid progression
to T2DM.
ACKNOWLEDGEMENTS
The authors thank all the children and their parents/legal guardians
for participating in this study. For the Sri Lankan study site: The
authors also thank Dr B.K.T.P. Dayanath, Consultant Chemical
Pathologist, for supervising the function of the laboratory, Dr Sumudu
Palihawadana, Consultant Radiologist, for carrying out the ultrasound
examination of the abdomen for hepatic steatosis, and Mr M. Sheran
Weerasinghe for managing the entire project. They also thank the fol-
lowing members of the research team for their participation in con-
ducting the study: Dr T.M.C.L.B. Thennakoon, Dr C. Jayalath, Dr
G.L.D.L. Pradeepani, Dr L.D.A.C. Arawwawala, Dr N.S. Jayasinghe, Ms
S.A.N.M. Fernando, Ms R.R.M.S. Sewwandi, Ms H.A.I. Sandamali, Ms
W.C. Kumari, Ms B.L.S. Prasadini, Mr R.S.R. Ranathunga, Mr
T.L. Kanth, Ms N.Y. Watawala, Ms K.B.G.S. Sankalpani, Ms S. Silva
Antonypulle, Ms S.N.I. Fernando, Mr W.G. Thusith, and Ms
S.U.S. Fernando. For the Swedish study site: The authors want to
thank Malte Lidström, pediatric nurse, for conducting a majority of
the examinations including OGTT within the ULSCO cohort, Roger
Olsson, nutritionist, for conducting nutritional and anthropometric
assessments, Johan Staaf, MD, PhD, for his involvement in the plan-
ning and formation of ULSCO and his contribution to ethics applica-
tions and various analysis, and Hannes Manell, MD, PhD, for assisting
in blood sampling and conducting various laboratory analysis.
CONFLICT OF INTEREST
The authors declare no potential conflict of interest.
AUTHOR CONTRIBUTIONS
Loretta S. Warnakulasuriya, Adikaram V. N. Adikaram, Manel M. A.
Fernando, Dulani L. Samaranayake, K. D. Renuka Ruchira Silva, and
V. Pujitha Wickramasinghe were involved in the planning and forma-
tion of the study at the Sri Lankan site in Negombo. Loretta
S. Warnakulasuriya, Adikaram V. N. Adikaram, and Manel M. A.
Fernando conducted and K. D. Renuka Ruchira Silva and V. Pujitha
Wickramasinghe supervised the study. Elisabet Rytter was involved in
the planning and conduction of the Sri Lankan study on behalf of the
Swedish Radiohjälpen “Children of the World” and Lions Sweden. Iris
Ciba, Peter Bergsten, Marie Dahlbom, and Anders H. Forslund were
involved in the planning and formation of the Uppsala Longitudinal
Study of Childhood Obesity (ULSCO). Iris Ciba analyzed the data and
drafted the manuscript. Loretta S. Warnakulasuriya, Peter Bergsten,
Marie Dahlbom, Elisabet Rytter, V. Pujitha Wickramasinghe, and
Anders H. Forslund coauthored, revised, and critically reviewed the
final manuscript as submitted. All authors have critically reviewed and
approved the final manuscript as submitted.
PEER REVIEW
The peer review history for this article is available at https://publons.
com/publon/10.1111/pedi.13145.
ETHICS STATEMENT
Ethics clearance for the screening of Sri Lankan school children's
nutritional status in Negombo was obtained from the Ethical Review
Committee of the Sri Lanka College of Pediatricians (SLCP). Ethical
approval for the following metabolic screening of children with obe-
sity connected to the screening process for a Metformin trial was
obtained from the Ethics Review Committee of Faculty of Medicine,
CIBA ET AL. 179
University of Colombo (EC-13-143). All protocols and examinations
performed on the Swedish subjects within the ULSCO cohort have
been approved by the Uppsala Regional Ethics Committee (registra-
tion numbers 2010/036 and 2012/318).
ORCID
Iris Ciba https://orcid.org/0000-0002-5062-8192
REFERENCES
1. Lobstein T, Jackson-Leach R. Planning for the worst: estimates of
obesity and comorbidities in school-age children in 2025. Pediatr
Obes. 2016;11(5):321-325. https://doi.org/10.1111/ijpo.12185.
2. Sinha R, Fisch G, Teague B, et al. Prevalence of impaired glucose toler-
ance among children and adolescents with marked obesity. N Engl J
Med. 2002;346(11):802-810. https://doi.org/10.1056/NEJMoa012578.
3. Mohsin F, Mahbuba S, Begum T, Azad K, Nahar N. Prevalence of
impaired glucose tolerance among children and adolescents with obe-
sity. Mymensingh Med J. 2012;21(4):684-690.
4. Mahbuba S, Mohsin F, Rahat F, Nahar J, Begum T, Nahar N. Descrip-
tive epidemiology of metabolic syndrome among obese adolescent
population. Diabetes Metab Syndr. 2018;12(3):369-374. https://doi.
org/10.1016/j.dsx.2017.12.026.
5. Jaruratanasirikul S, Thammaratchuchai S, Puwanant M, Mo-Suwan L,
Sriplung H. Progression from impaired glucose tolerance to type 2 dia-
betes in obese children and adolescents: a 3-6-year cohort study in
southern Thailand. J Pediatr Endocrinol Metab. 2016;29(11):1267-
1275. https://doi.org/10.1515/jpem-2016-0195.
6. Ghergherechi R, Tabrizi A. Prevalence of impaired glucose tolerance
and insulin resistance among obese children and adolescents. Ther
Clin Risk Manag. 2010;6:345-349.
7. Invitti C, Guzzaloni G, Gilardini L, Morabito F, Viberti G. Prevalence
and concomitants of glucose intolerance in European obese children
and adolescents. Diabetes Care. 2003;26(1):118-124.
8. Morandi A, Maschio M, Marigliano M, et al. Screening for impaired
glucose tolerance in obese children and adolescents: a validation and
implementation study. Pediatr Obes. 2014;9(1):17-25. https://doi.org/
10.1111/j.2047-6310.2012.00136.x.
9. Cambuli VM, Incani M, Pilia S, et al. Oral glucose tolerance test in Ital-
ian overweight/obese children and adolescents results in a very high
prevalence of impaired fasting glycaemia, but not of diabetes. Diabe-
tes Metab Res Rev. 2009;25(6):528-534. https://doi.org/10.1002/
dmrr.980.
10. Di Bonito P, Pacifico L, Chiesa C, et al. Impaired fasting glucose and
impaired glucose tolerance in children and adolescents with
overweight/obesity. J Endocrinol Invest. 2017;40(4):409-416. https://
doi.org/10.1007/s40618-016-0576-8.
11. Karnebeek K, Thapar S, Willeboordse M, Schayck OCP,
Vreugdenhil ACE. Comorbidities in primary versus secondary school
children with obesity and responsiveness to lifestyle intervention.
J Clin Endocrinol Metab. 2019;18:3803-3811. https://doi.org/10.
1210/jc.2018-02318.
12. Bahíllo-Curieses MP, Hermoso-López F, Martínez-Sopena MJ,
et al. Prevalence of insulin resistance and impaired glucose toler-
ance in a sample of obese Spanish children and adolescents.
Endocrine. 2012;41(2):289-295. https://doi.org/10.1007/s12020-
011-9540-8.
13. Rakocevi�c L, Rakocevi�c V. Incidence of cardiovascular risk factors in
obese children. Acta Clin Croat. 2016;55(3):407-413. https://doi.org/
10.20471/acc.2016.55.03.09.
14. Ciba I, Weghuber D, Manell H, et al. Development of glucose intoler-
ance in obese children studied in the beta-JUDO cohort. Acta
Paediatr. 2015;104:12.
15. Ek AE, Rössner SM, Hagman E, Marcus C. High prevalence of predia-
betes in a Swedish cohort of severely obese children. Pediatr Diabe-
tes. 2015;16(2):117-128. https://doi.org/10.1111/pedi.12136.
16. Hagman E, Reinehr T, Kowalski J, Ekbom A, Marcus C, Holl RW.
Impaired fasting glucose prevalence in two nationwide cohorts of
obese children and adolescents. Int J Obes 2005. 2014;38(1):40-45.
https://doi.org/10.1038/ijo.2013.124.
17. Adikaram SGS, Samaranayake DBDL, Atapattu N, Kendaragama
KMDLD, Senevirathne JTN, Wickramasinghe VP. Prevalence of vita-
min D deficiency and its association with metabolic derangements
among children with obesity. BMC Pediatr. 2019;19:186. https://doi.
org/10.1186/s12887-019-1558-8.
18. Katulanda P, Constantine GR, Mahesh JG, et al. Prevalence and pro-
jections of diabetes and pre-diabetes in adults in Sri Lanka–Sri Lankadiabetes, cardiovascular study (SLDCS). Diabet Med J Br Diabet Assoc.
2008;25(9):1062-1069. https://doi.org/10.1111/j.1464-5491.2008.
02523.x.
19. Yajnik CS. Early life origins of insulin resistance and type 2 diabetes in
India and other Asian countries. J Nutr. 2004;134(1):205-210.
https://doi.org/10.1093/jn/134.1.205.
20. Gujral UP, Mohan V, Pradeepa R, et al. Ethnic variations in diabetes
and prediabetes prevalence and the roles of insulin resistance and
β-cell function: the CARRS and NHANES studies. J Clin Transl
Endocrinol. 2016;4:19-27. https://doi.org/10.1016/j.jcte.2016.
02.004.
21. WHO Expert Consultation. Appropriate body-mass index for Asian
populations and its implications for policy and intervention strategies.
Lancet. 2004;363(9403):157-163. https://doi.org/10.1016/S0140-
6736(03)15268-3.
22. Wild SH, Fischbacher C, Brock A, Griffiths C, Bhopal R. Mortality
from all causes and circulatory disease by country of birth in England
and Wales 2001-2003. J Public Health Oxf Engl. 2007;29(2):191-198.
https://doi.org/10.1093/pubmed/fdm010.
23. Ntuk UE, Gill JMR, Mackay DF, Sattar N, Pell JP. Ethnic-specific obe-
sity cutoffs for diabetes risk: cross-sectional study of 490,288
UKbiobank participants. Diabetes Care. 2014;37(9):2500-2507.
https://doi.org/10.2337/dc13-2966.
24. Whincup PH, Gilg JA, Papacosta O, et al. Early evidence of ethnic dif-
ferences in cardiovascular risk: cross sectional comparison of British
south Asian and white children. BMJ. 2002;324(7338):635. https://
doi.org/10.1136/bmj.324.7338.635.
25. Ranjani H, Sonya J, Anjana RM, Mohan V. Prevalence of glucose intol-
erance among children and adolescents in urban South India
(ORANGE-2). Diabetes Technol Ther. 2013;15(1):13-19. https://doi.
org/10.1089/dia.2012.0236.
26. Wickramasinghe VP, Arambepola C, Bandara P, et al. Insulin resis-
tance in a cohort of 5-15 year old children in urban Sri Lanka. BMC
Res Notes. 2017;10(1):347. https://doi.org/10.1186/s13104-017-
2658-x.
27. Warnakulasuriya LS, Fernando MAM, Adikaram AVN, et al. Assess-
ment of nutritional status in Sri Lankan children: validity of current
anthropometry cutoffs? Asia Pac J Public Health. 2019;31(7):633-642.
https://doi.org/10.1177/1010539519872061.
28. Lohman TG. Assessment of body composition in children. Pediatr
Exerc Sci. 1989;1(1):19-30. https://doi.org/10.1123/pes.1.1.19.
29. Katzmarzyk PT, Srinivasan SR, Chen W, Malina RM, Bouchard C,
Berenson GS. Body mass index, waist circumference, and clustering
of cardiovascular disease risk factors in a biracial sample of children
and adolescents. Pediatrics. 2004;114(2):e198-e205. https://doi.org/
10.1542/peds.114.2.e198.
30. Morris NM, Udry JR. Validation of a self-administered instrument to
assess stage of adolescent development. J Youth Adolesc. 1980;9(3):
271-280. https://doi.org/10.1007/BF02088471.
31. Prader A. Testicular size: assessment and clinical importance. Triangle.
1966;7(6):240-243.
180 CIBA ET AL.
32. American Diabetes Association. 2. Classification and Diagnosis of
DiabetesStandards of medical Care in Diabetes-2020. Diabetes Care.
2020;43(suppl 1):S14-S31. https://doi.org/10.2337/dc20-S002.
33. Hettihawa LM et al Comparison of insulin resistance by indirect
methods-HOMA, QUICKI and McAuley - with fasting insulin in
patients with type 2 diabetes in Galle, Sri Lanka: A Pilot Study.
Accessed August 6, 2020. https://www.ojhas.org/issue17/2006-1-
2.htm.
34. Zimmet P, Alberti G, Kaufman F, et al. The metabolic syndrome in
children and adolescents. Lancet. 2007;369(9579):2059-2061.
https://doi.org/10.1016/S0140-6736(07)60958-1.
35. Neuschwander-Tetri BA, Ünalp A, Creer MH. The upper limits of nor-
mal for serum ALT levels reported by clinical laboratories depend on
local reference populations. Arch Intern Med. 2004;168(6):663-666.
https://doi.org/10.1001/archinternmed.2007.131.
36. Johns I, Moschonas KE, Medina J, Ossei-Gerning N, Kassianos G,
Halcox JP. Risk classification in primary prevention of CVD according
to QRISK2 and JBS3 'heart age', and prevalence of elevated high-
sensitivity C reactive protein in the UKcohort of the EURIKA study.
Open Heart. 2018;5(2):e000849. https://doi.org/10.1136/openhrt-
2018-000849.
37. Matthews DR, Hosker JP, Rudenski AS, Naylor BA, Treacher DF,
Turner RC. Homeostasis model assessment: insulin resistance and
beta-cell function from fasting plasma glucose and insulin concentra-
tions in man. Diabetologia. 1985;28(7):412-419. https://doi.org/10.
1007/bf00280883.
38. MIS A, de Oliveira JS, Leal VS, et al. Identification of cutoff points for
homeostatic model assessment for insulin resistance index in adoles-
cents: systematic review. Rev Paul Pediatr. 2016;34(2):234-242.
https://doi.org/10.1016/j.rpped.2015.08.006.
39. Singh Y, Garg MK, Tandon N, Marwaha RK. A study of insulin resis-
tance by HOMA-IR and its cut-off value to identify metabolic syn-
drome in urban Indian adolescents. J Clin Res Pediatr Endocrinol. 2013;
5(4):245-251. https://doi.org/10.4274/Jcrpe.1127.
40. Jackson LV, Thalange NKS, Cole TJ. Blood pressure centiles for Great
Britain. Arch Dis Child. 2007;92(4):298-303. https://doi.org/10.1136/
adc.2005.081216.
41. Wickramasinghe VP, Arambepola C, Bandara DMPS, et al. Validity of
newly-developed BMI and waist cut-off values for Sri Lankan
children. Ann Hum Biol. 2013;40(3):280-285. https://doi.org/10.
3109/03014460.2013.769629.
42. Shannon A, Alkhouri N, Carter-Kent C, et al. Ultrasonographic quanti-
tative estimation of hepatic steatosis in children with NAFLD.
J Pediatr Gastroenterol Nutr. 2011;53(2):190-195. https://doi.org/10.
1097/MPG.0b013e31821b4b61.
43. Forslund A, Staaf J, Kullberg J, Ciba I, Dahlbom M, Bergsten P. Upp-
sala longitudinal study of childhood obesity: protocol description.
Pediatrics. 2014;133(2):e386-e393. https://doi.org/10.1542/peds.
2013-2143.
44. Warnakulasuriya LS, Fernando MMA, Adikaram AVN, et al. Metfor-
min in the management of childhood obesity: a randomized control
trial. Child Obes Print. 2018;14(8):553-565. https://doi.org/10.1089/
chi.2018.0043.
45. Global Health Observatory. Last accessed 25 February, 2019. Publi-
shed online 2017. www.who.int/gho/ncd/risk_factors/overweight_
obesity/obesity_adolescents/en.
46. Lobstein T, Baur L, Uauy R. Obesity in children and young people: a
crisis in public health. Obes Rev. 2004;5(s1):4-85. https://doi.org/10.
1111/j.1467-789X.2004.00133.x.
47. Wickramasinghe VP, Arambepola C, Bandara P, et al. Distribution of
obesity-related metabolic markers among 5-15 year old children from
an urban area of Sri Lanka. Ann Hum Biol. 2013;40(2):168-174.
https://doi.org/10.3109/03014460.2012.753109.
48. Wickramasinghe VP, Lamabadusuriya SP, Cleghorn GJ, Davies PSW.
Defining anthropometric cut-off levels related to metabolic risk in a
group of Sri Lankan children. Ann Hum Biol. 2011;38(5):537-543.
https://doi.org/10.3109/03014460.2011.573505.
How to cite this article: Ciba I, Warnakulasuriya LS,
Adikaram AVN, et al. Prevalence of different states of glucose
intolerance in Sri Lankan children and adolescents with
obesity and its relation to other comorbidities. Pediatr
Diabetes. 2021;22:168–181. https://doi.org/10.1111/pedi.
13145
CIBA ET AL. 181
Related Documents


![Review Article The Relationship between Type 2 Diabetes … · 2019. 7. 31. · tion of glucose intolerance, and development of peripheral insulinresistance[ ]. Glucose tolerance](https://static.cupdf.com/doc/110x72/60af3089f4ef2a780648cded/review-article-the-relationship-between-type-2-diabetes-2019-7-31-tion-of-glucose.jpg)


