A Population-Based Study on Comorbidity in Children with Severe Motor and Intellectual Disabilities: Focus on Feasibility and Prevalence

Welcome message from author
This document is posted to help you gain knowledge. Please leave a comment to let me know what you think about it! Share it to your friends and learn new things together.
Transcript
A Population-Based Study on Comorbidity in Children with
Severe Motor and Intellectual Disabilities:
Focus on Feasibility and Prevalence
The study described in this thesis was supported (without any restrictions) by:
• The Netherlands Organisation for scientific research (NWO) (grant number 940-
33-050)
• The David Fervat foundation
• PT Medical
• Boehringer Ingelheim Lopital
• MMS
• GlaxoSmithKline
ISBN: 90-8559-236-4
Copyright: R. Veugelers
Erasmus MC, leerstoel Geneeskunde voor Verstandelijk Gehandicapten
Cover: Jan van Lierop
Comorbidity in children with severe motor and intellectual disabilities is a heavy
burden symbolized as a large rock. They try to express their problems in many
different ways (ropes). The communication however, is difficult which cages them.
Medicine tries to lift their burden using research and therapy. Research is the knot
that tries to bind all the pieces together. This way we can hopefully improve their
communication and take some load of their lives.
Printed by: Optima Grafische Communicatie, Rotterdam
A Population-Based Study on Comorbidity in Children
with Severe Motor and Intellectual Disabilities:
Focus on Feasibility and Prevalence
Een populatiestudie naar co-morbiditeit bij kinderen met
ernstige motorische en verstandelijke beperkingen:
Focus op toepasbaarheid en prevalentie
Proefschrift
ter verkrijging van de graad van doctor
aan de Erasmus Universiteit Rotterdam
op gezag van de rector magnificus Prof.dr. S.W.J. Lamberts
en volgens besluit van het College voor Promoties.
De openbare verdediging zal plaatsvinden op
woensdag 22 november 2006 om 11:45 uur
door
Rebekka Veugelers
geboren te Vlissingen

Promotiecommissie
Promotoren: Prof.dr. H.M. Evenhuis
Prof.dr. D. Tibboel
Overige leden: Prof.dr. J.C. de Jongste
Prof.dr. A.J. van der Heijden
Dr. E.W. Steyerberg
Copromotor: Dr. C. Penning
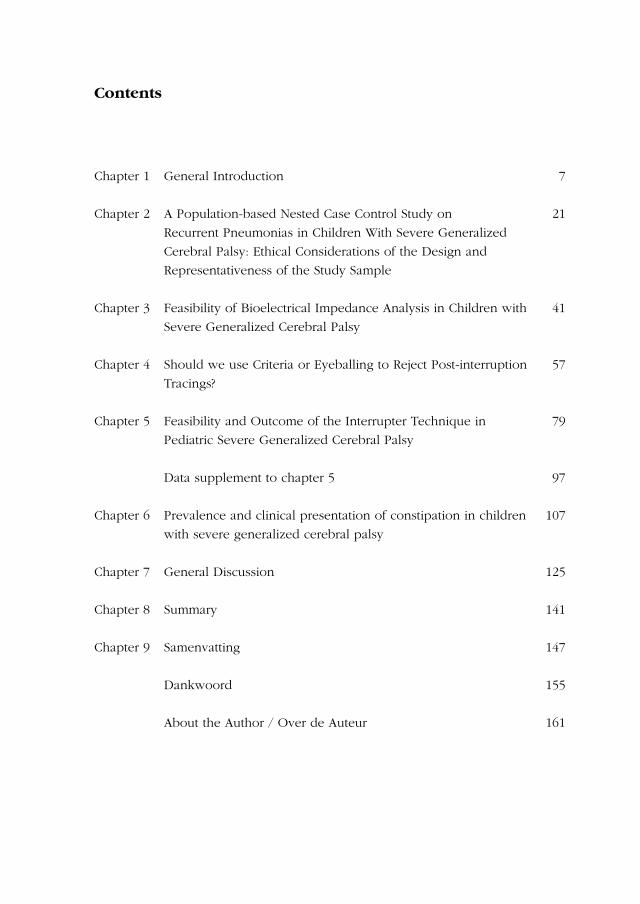
Contents
Chapter 1 General Introduction 7
Chapter 2 A Population-based Nested Case Control Study on
Recurrent Pneumonias in Children With Severe Generalized
Cerebral Palsy: Ethical Considerations of the Design and
Representativeness of the Study Sample
21
Chapter 3 Feasibility of Bioelectrical Impedance Analysis in Children with
Severe Generalized Cerebral Palsy
41
Chapter 4 Should we use Criteria or Eyeballing to Reject Post-interruption
Tracings?
57
Chapter 5 Feasibility and Outcome of the Interrupter Technique in
Pediatric Severe Generalized Cerebral Palsy
79
Data supplement to chapter 5 97
Chapter 6 Prevalence and clinical presentation of constipation in children
with severe generalized cerebral palsy
107
Chapter 7 General Discussion 125
Chapter 8 Summary 141
Chapter 9 Samenvatting
Dankwoord
About the Author / Over de Auteur
147
155
161

Chapter 1
General Introduction

General Introduction 9
CHILDREN WITH SEVERE MOTOR AND INTELLECTUAL DISABILITIES
In literature and in health care, a wide variety of terms are used to describe
children with a combination of Severe Motor and Intellectual Disabilities. The
terminology applied by the IASSID (International Association for the Scientific
Study of Intellectual Disabilities) for these children is Profound Intellectual
and Multiple Disabilities (PIMD). However, since multiple does not necessarily
indicate motor and intellectual disabilities, we prefer the term Severe Motor and
Intellectual Disabilities (SMID).
In the publications of which this thesis is compiled, we have chosen to ap-
ply the term Severe Generalized Cerebral Palsy instead. This term does not
cover all children with SMID (excluding children with progressive or acquired
disabilities), but also includes children with only mild intellectual disabilities.
However, we chose to use this term in our manuscripts because it is regularly
applied internationally for this population, and therefore enhances recognition of
our manuscripts in literature databases.
Cerebral palsy was first studied by the British orthopedist William John Little,
who in 1861 held a historical oral presentation on the influence of premature birth
and asphyxia neonatorum on the mental and physical condition of the child. He
introduced the term cerebral palsy, which definition and characteristics have been
revised and discussed often since then. To date, it is most commonly specified as
“an umbrella term covering a group of non-progressive, but often changing, motor
impairment syndromes secondary to lesions or anomalies of the brain arising in
the early stages of its development” 1. Intellectual disabilities are often associ-
ated with cerebral palsy, but intellect may vary between normal and profoundly
disabled.
This thesis focuses on health-related problems of children with SMID. Most of
them have a severe generalized form of cerebral palsy, resulting from abnormal
brain development or brain damage in early development (pre- or peri-natally).
Others have acquired brain damage during childhood (for instance due to near
drowning accidents or as a result from severe meningitis) or otherwise due to
progressive disease such as Rett’s syndrome or metabolic disease such as Alpers’
syndrome.
Although the etiology of this combination of severe motor and intellectual dis-
abilities can be diverse, comorbidity and clinical characteristics are often similar.
Therefore, the inclusion criteria we have used for the population-based cohort
10
Cha
pte
r 1
presented in this thesis were based on clinical presentation and severity of the
disabilities rather than etiology, and were defined as follows:
Children (2 to 18 years) with a combination of moderate to profound intellectual
disabilities and a severe motor disability.
We defined moderate to profound intellectual disability as an IQ value below 55.
If IQ was not recorded in the medical files, it was estimated:
IQ = (developmental age / calendar age) * 100.
We defined severe motor disability as hypertonic or hypotonic generalized cere-
bral palsy or a motor developmental delay to such an extent that a child could at
best crawl.
EPIDEMIOLOGY
Since a central registry for people with intellectual disabilities is not available in
the Netherlands, prevalence and incidence rates of combined severe motor and
intellectual disabilities can only be estimated from scientific studies or national
surveys.
The prevalence of cerebral palsy is estimated at approximately 1.5-2.8 per
1000 neonatal survivors in western countries 2-4. For the Dutch population, the
prevalence was estimated at 0.8 per 1000 live births in 1977-1979, and increased
to 2.4 in 1986-1988 3.
The observed increase of the prevalence of cerebral palsy from the mid 1960’s till
the late 1980’s can mainly be ascribed to the increased survival of preterm infants 4-7. Since the last decade however, the incidence rates are declining, especially due
to the reduced prevalence of brain damage in preterm infants 4-6. This positive
trend however was not observed among infants less than 25 weeks estimated
gestational age, despite intensive obstetric and neonatal input 8.
Approximately a quarter of the children with cerebral palsy have has moderate
to profound intellectual disabilities 9,10. Therewith the prevalence of children with
SMID is estimated at 0.6 per 1000 live births. With an annual total number of
approximately 194.000 live births in the Netherlands 11, this implies an incidence
of SMID of approximately 117 children per year. According to an evaluation of
quality of care for people with multiple disabilities in 2000, approximately 2100
General Introduction 11
children and adolescents with SMID lived In the Netherlands. Nowadays, most
of them live with their parents and visit a day-care centre during weekdays 12.
ETIOLOGY
The etiology of severe generalized cerebral palsy (the majority of children with
SMID) remains unclear. Similar to milder forms of cerebral palsy the developing
brain is, by definition, injured prenatally, perinatally or postnatally 13,14. Approxi-
mately 24% of children with moderate or severe spastic quadriplegia are thought
to have been affected by intrapartum events 13. The most important risk factor
for cerebral palsy seems to be prematurity and low birth weight. Other risk
factors include infections, teratogenic exposures, placental complications, mul-
tiple births, maternal diseases, intracranial hemorrhage, seizures, hypoglycemia,
hyperbilirubinemia, birth asphyxia, ischemic stroke, trauma and coagulopathies.
In a large number of cases however, the etiology of the disabilities remains
unknown 14.
In contrast, when SMID is acquired during childhood, the etiology is usually
known, including (severe) trauma, near-drowning accidents and meningitis. In
addition, in SMID children with progressive brain damage, the causal syndrome
is usually identified. Finally, etiology can be multi-factorial, including congenital
and acquired disorders.
COMORBIDITY
Apart from their cognitive and motor impairments, children with SMID are at
risk of developing several additional health problems. Frequently observed health
problems are epilepsy, sensory impairment, recurrent pulmonary infections 15-22,
poor nutritional state 23-29, growth retardation 30,31, dysphagia 32-37, gastro-oesopha-
geal reflux 32,38-44, constipation 21,42,45, delayed gastric emptying 46, osteoporosis 47, scoliosis, hip displacement 48 and/or contractures. In addition, side-effects of
multiple drug use occur often. In these children life expectancy is reduced 49-59,
with respiratory disease as one of the leading causes of death. 49-51,56,58,60
Some disorders are most likely primary results from brain damage, such as epilepsy,
dysphagia, gastro-oesophageal reflux 27 and visual and hearing impairment.
12
Cha
pte
r 1
These primary problems can be negatively influenced by secondary problems
as well. For example the severity of dysphagia, primarily due to motor and sen-
sory impairment, might increase due to epilepsy, medication side-effects, irritated
mucosa and due to gastro-oesophageal reflux. Or more indirectly, dysphagia can
be worsened due to an altered oesophageal pressure gradient caused by increased
abdominal pressure due to constipation.
Due to the above-mentioned concomitant health problems, children with severe
generalized cerebral palsy are especially prone to develop two major life-threaten-
ing disorders: malnutrition and/or recurrent pulmonary infections. Malnutrition
can be the result of dysphagia, prolonged meal times, frequent vomiting (due to
gastro-oesophageal reflux), decreased appetite (due to delayed gastric emptying),
recurrent periods of illness and increased energy expenditure (due to epilepsy or
spasms). In addition, children are prone to develop recurrent pulmonary infec-
tions due to aspiration 23,24,27,61,62 (as a result of dysphagia and gastro-oesophageal
reflux 63), poor airway clearance (due to primary slow cilial movement or resulting
from previous pulmonary problems), poor or absent cough reflex 15,64 (idem),
inefficient cough (due to motor impairment), poor ventilation (due to lack of deep
breaths and due to thoracic deformities) but also immunological defence can be
compromised due to malnutrition 65. Although both malnutrition and recurrent
lower respiratory tract infections are very commonly observed in these children,
the influence of co-morbid disorders on these disorders have not been studied
previously.
Due to the increased chance of developing several concomitant health prob-
lems, children with SMID are at risk of entering a downward spiral. Dysphagia
for example interferes with the ability to ingest food and thus might put children
at risk to develop malnutrition. Malnutrition might eventually lead to decreased
alertness and fatigue during the meal, which will further deteriorate dysphagia
and will increase the risk of choking and aspiration. Aspiration might induce
pneumonia, which may result in hospital admissions and even early death. In-
terventions at the top of the spiral might prevent secondary or tertiary results:
it was for example demonstrated that nutritional intervention in children with
developmental disabilities significantly reduced the frequency of acute care
hospitalization 32.
General Introduction 13
SCIENTIFIC RESEARCH IN CHILDREN WITH SMID
During the last decades, general care for people with intellectual disabilities (ID)
is developing rapidly. In general, the integration of intellectually disabled people
into the non-disabled society is promoted. In the Netherlands, it used to be com-
mon for people with intellectual disabilities to live in residential facilities. The
process of decentralization increased the visibility of intellectually disabled people
and their health needs to the non-disabled general population.
The need for better medical resources and for the increase of scientific evidence
was for example expressed by the foundation of the Chair for Intellectual Disabil-
ity Medicine at the Erasmus University in 2000, and the start of specialist education
for medical doctors in 2001.
Nowadays, health care professionals are well aware of the serious health problems
of children with SMID. However, scientific studies on prevention and treatment of
these health problems, and therewith evidence-based guidelines, are still lacking.
The need for these guidelines became painfully obvious at the start of the study
described in this thesis. We were overwhelmed with questions from healthcare
professionals and our hypothesis regarding the possible risk factors of recurrent
lower respiratory infections triggered many of them to start diagnostics for the
supposed risk factors in their own patients.
Although there is a need for evidence-based guidelines in ID-medicine, prevalence
data are usually not available yet. Therefore, population-based studies are the first
necessary step.
As a research chair, we take special interest in comorbidity in children and
adolescents with SMID, because they suffer from many co-morbidities. We do not
focus on adults, since the life expectancy of people with SMID is limited, and the
onset of co-morbid disorders is often during childhood. When the major child-
hood disorders are properly studied, adequate preventive and treatment options
can be developed and their use can be extrapolated to adults.
PREVALENCE AND RISK FACTOR STUDY ON RECURRENT PULMONARY
INFECTIONS
The main focus of the study presented in this thesis, was studying the prevalence
and risk factors of recurrent lower respiratory infections and malnutrition. The
14
Cha
pte
r 1
initiation of this study resulted from lack of knowledge in medical practice for
these children. A previous inventory in two separate day-care centres for SMID
children (n=40) in 2000 had indicated high prevalence rates of epilepsy (80%),
gastro-oesophageal reflux (48%), dysphagia (78%), visual impairment (68%), hear-
ing impairment (18%), chronic constipation (68%) and recurrent lower respiratory
tract infections (40%). Most of those children visited several medical specialists.
Treatment of motor impairment was organized relatively well. Diagnosis and treat-
ment of sensory impairment was less optimal, where diagnostics and treatment of
gastro-oesophageal reflux were inadequate (unpublished data of Prof. Dr. H.M.
Evenhuis 1999).
An inventory by the Dutch Society of Physicians for Persons with Intellectual
Disabilities (NVAVG) among its members indicated that recurrent lower respiratory
tract infections were more frequently observed in people with severe intellectual
disabilities than in more mildly affected people. They expressed the need for
information on the prevalence of comorbidity (such as gastro-oesophageal reflux)
for diagnostic and treatment purposes and the need for information on risk factors
and prevention options for chronic and recurrent lower respiratory tract infections.
To our experience, many children’s physicians experience the same issues.
Preceding the study presented in this thesis, a pilot study was performed in
a residential facility. In the medical records, diagnosed lower respiratory tract
infections were studied retrospectively in 37 children, resulting in an incidence
of 43%. An additional conclusion of that study was that it is difficult to study this
incidence in retrospect, due to lack of standardization and poor documentation of
the diagnostic and treatment methods.
STRUCTURE OF THIS THESIS
This thesis is the first of two, both based on the results of a population-based
nested case control study on recurrent lower respiratory infections and malnutri-
tion in children with SMID. In chapter 2 the design of this study is presented and
accompanying ethical considerations are discussed. It also presents an overview
of the included study population and its representativeness. In chapter 3 we
describe a pilot study on the feasibility of a nutritional assessment method, Bio-
electric Impedance Analysis (BIA), in these children. In chapter 4 we focus on the
development and additive value of objective rejection criteria for interpretation of
the results of the interruption technique, a pulmonary function test that measures
respiratory resistance. Its feasibility in children with SMID is discussed in chapter

General Introduction 15
5. In this chapter the results are compared to those of a non-disabled population
as well. This was the first published study on feasibility of a pulmonary function
test in children with SMID. Chapter 6 focuses on the definition, prevalence and
risk factors of constipation. In Chapter 7 the results of this thesis are discussed. In
addition, we will focus on the future implications of the present study for medical
scientific research in this population. This thesis ends with a summary in English
and in Dutch (chapter 8).
16
Cha
pte
r 1
REFERENCES
1. Mutch, L., et al., Cerebral palsy epidemiology: where are we now and where are we going? Dev Med Child Neurol, 1992. 34(6): p. 547-51.
2. Parkes, J., et al., Cerebral palsy in Northern Ireland: 1981-93. Paediatr Perinat Epidemiol, 2001. 15(3): p. 278-86.
3. Wichers, M.J., et al., Prevalence of cerebral palsy in The Netherlands (1977-1988). Eur J Epidemiol, 2001. 17(6): p. 527-32.
4. Keogh, J.M. and N. Badawi, The origins of cerebral palsy. Curr Opin Neurol, 2006. 19(2): p. 129-34.
5. Himmelmann, K., et al., The changing panorama of cerebral palsy in Sweden. IX. Prevalence and origin in the birth-year period 1995-1998. Acta Paediatr, 2005. 94(3): p. 287-94.
6. Doyle, L.W. and P.J. Anderson, Improved neurosensory outcome at 8 years of age of extremely low birthweight children born in Victoria over three distinct eras. Arch Dis Child Fetal Neonatal Ed, 2005. 90(6): p. F484-8.
7. Wilson-Costello, D., et al., Improved survival rates with increased neurodevelopmental disability for extremely low birth weight infants in the 1990s. Pediatrics, 2005. 115(4): p. 997-1003.
8. Hintz, S.R., et al., Changes in neurodevelopmental outcomes at 18 to 22 months’ corrected age among infants of less than 25 weeks’ gestational age born in 1993-1999. Pediatrics, 2005. 115(6): p. 1645-51.
9. Pharoah, P.O., et al., Epidemiology of cerebral palsy in England and Scotland, 1984-9. Arch Dis Child Fetal Neonatal Ed, 1998. 79(1): p. F21-5.
10. Hammal, D., S.N. Jarvis, and A.F. Colver, Participation of children with cerebral palsy is influenced by where they live. Dev Med Child Neurol, 2004. 46(5): p. 292-8.
11. Beets GCN (NIDI) and B.S. (RIVM), Wat is de huidige situatie? Bevolking\ Geboorte. Volksgezond-heid Toekomst Verkenning, Nationaal Kompas Volksgezondheid, 2005.
12. IGZ, Ernstig Meervoudig gehandicapt en dán? Een onderzoek naar de kwaliteit van zorg voor mensen met meervoudige complexe handicaps, Inspectie voor de Gezondheidszorg i.s.m. minis-terie van VWS. 2000: Den Haag, The Netherlands.
13. MacLennan, A., A template for defining a causal relation between acute intrapartum events and cerebral palsy: international consensus statement. Bmj, 1999. 319(7216): p. 1054-9.
14. Sankar, C. and N. Mundkur, Cerebral palsy-definition, classification, etiology and early diagnosis. Indian J Pediatr, 2005. 72(10): p. 865-8.
15. Seddon, P.C. and Y. Khan, Respiratory problems in children with neurological impairment. Arch Dis Child, 2003. 88(1): p. 75-8.
16. Couriel, J., Respiratory complications of neurological disease in children. Current Medical Litera-ture: Respiratory Medicine, 1997. 10: p. 70-5.
17. Morton, R.E., R. Wheatley, and J. Minford, Respiratory tract infections due to direct and reflux aspiration in children with severe neurodisability. Dev Med Child Neurol, 1999. 41(5): p. 329-34.
18. Liptak, G.S., et al., Health status of children with moderate to severe cerebral palsy. Dev Med Child Neurol, 2001. 43(6): p. 364-70.
19. Mahon, M. and M.S. Kibirige, Patterns of admissions for children with special needs to the paedi-atric assessment unit. Arch Dis Child, 2004. 89(2): p. 165-9.
General Introduction 17
20. Saito, N., et al., Natural history of scoliosis in spastic cerebral palsy. Lancet, 1998. 351(9117): p. 1687-92.
21. Sullivan, P.B., et al., Prevalence and severity of feeding and nutritional problems in children with neurological impairment: Oxford Feeding Study. Dev Med Child Neurol, 2000. 42(10): p. 674-80.
22. Fischer-Brandies, H., C. Avalle, and G.J. Limbrock, Therapy of orofacial dysfunctions in cerebral palsy according to Castillo-Morales: first results of a new treatment concept. Eur J Orthod, 1987. 9(2): p. 139-43.
23. Bax, M., Eating is important. Dev Med Child Neurol, 1989. 31(3): p. 285-6.
24. Jones, P.M., Feeding disorders in children with multiple handicaps. Dev Med Child Neurol, 1989. 31(3): p. 404-6.
25. Gisel, E.G. and J. Patrick, Identification of children with cerebral palsy unable to maintain a normal nutritional state. Lancet, 1988. 1(8580): p. 283-6.
26. Patrick, J., et al., Rapid correction of wasting in children with cerebral palsy. Dev Med Child Neurol, 1986. 28(6): p. 734-9.
27. Couriel, J.M., et al., Assessment of feeding problems in neurodevelopmental handicap: a team approach. Arch Dis Child, 1993. 69(5): p. 609-13.
28. Dahl, M., et al., Feeding and nutritional characteristics in children with moderate or severe cerebral palsy. Acta Paediatr, 1996. 85(6): p. 697-701.
29. Gonzalez, L., C.M. Nazario, and M.J. Gonzalez, Nutrition-related problems of pediatric patients with neuromuscular disorders. P R Health Sci J, 2000. 19(1): p. 35-8.
30. Stevenson, R.D., et al., Clinical correlates of linear growth in children with cerebral palsy. Dev Med Child Neurol, 1994. 36(2): p. 135-42.
31. Stallings, V.A., et al., Nutrition-related growth failure of children with quadriplegic cerebral palsy. Dev Med Child Neurol, 1993. 35(2): p. 126-38.
32. Schwarz, S.M., et al., Diagnosis and treatment of feeding disorders in children with developmental disabilities. Pediatrics, 2001. 108(3): p. 671-6.
33. Reilly, S., D. Skuse, and X. Poblete, Prevalence of feeding problems and oral motor dysfunction in children with cerebral palsy: a community survey. J Pediatr, 1996. 129(6): p. 877-82.
34. Del Giudice, E., et al., Gastrointestinal manifestations in children with cerebral palsy. Brain Dev, 1999. 21(5): p. 307-11.
35. Waterman, E.T., et al., Swallowing disorders in a population of children with cerebral palsy. Int J Pediatr Otorhinolaryngol, 1992. 24(1): p. 63-71.
36. Gangil, A., et al., Feeding problems in children with cerebral palsy. Indian Pediatr, 2001. 38(8): p. 839-46.
37. Mutch, L. and A. Leyland, Growth and nutrition in children with cerebral palsy. Lancet, 1990. 336(8714): p. 569-70.
38. Gangil, A., et al., Gastroesophageal reflux disease in children with cerebral palsy. Indian Pediatr, 2001. 38(7): p. 766-70.
39. Gustafsson, P.M. and L. Tibbling, Gastro-oesophageal reflux and oesophageal dysfunction in chil-dren and adolescents with brain damage. Acta Paediatr, 1994. 83(10): p. 1081-5.
40. Sondheimer, J.M. and B.A. Morris, Gastroesophageal reflux among severely retarded children. J Pediatr, 1979. 94(5): p. 710-4.
18
Cha
pte
r 1
41. Reyes, A.L., et al., Gastrooesophageal reflux in children with cerebral palsy. Child Care Health Dev, 1993. 19(2): p. 109-18.
42. Staiano, A., et al., Disorders of oesophageal motility in children with psychomotor retardation and gastro-oesophageal reflux. Eur J Pediatr, 1991. 150(9): p. 638-41.
43. Wang, J.H., et al., Epidemiology of gastroesophageal reflux disease: a general population-based study in Xi’an of Northwest China. World J Gastroenterol, 2004. 10(11): p. 1647-51.
44. Booth, I.W., Silent gastro-oesophageal reflux: how much do we miss? Arch Dis Child, 1992. 67(11): p. 1325-7.
45. Frame, P.S., et al., Use of colchicine to treat severe constipation in developmentally disabled patients. J Am Board Fam Pract, 1998. 11(5): p. 341-6.
46. Spiroglou, K., et al., Gastric emptying in children with cerebral palsy and gastroesophageal reflux. Pediatr Neurol, 2004. 31(3): p. 177-82.
47. Henderson, R.C., et al., Predicting low bone density in children and young adults with quadriplegic cerebral palsy. Dev Med Child Neurol, 2004. 46(6): p. 416-9.
48. Soo, B., et al., Hip displacement in cerebral palsy. J Bone Joint Surg Am, 2006. 88(1): p. 121-9.
49. Katz, R.T., Life expectancy for children with cerebral palsy and mental retardation: implications for life care planning. NeuroRehabilitation, 2003. 18(3): p. 261-70.
50. Blair, E., et al., Life expectancy among people with cerebral palsy in Western Australia. Dev Med Child Neurol, 2001. 43(8): p. 508-15.
51. Reddihough, D.S., G. Baikie, and J.E. Walstab, Cerebral palsy in Victoria, Australia: mortality and causes of death. J Paediatr Child Health, 2001. 37(2): p. 183-6.
52. Shavelle, R.M., D.J. Straus, and S.M. Day, Comparison of survival in cerebral palsy between coun-tries. Dev Med Child Neurol, 2001. 43(8): p. 574.
53. Strauss, D., W. Cable, and R. Shavelle, Causes of excess mortality in cerebral palsy. Dev Med Child Neurol, 1999. 41(9): p. 580-5.
54. Hutton, J.L., A.F. Colver, and P.C. Mackie, Effect of severity of disability on survival in north east England cerebral palsy cohort. Arch Dis Child, 2000. 83(6): p. 468-74.
55. Singer, R.B., D. Strauss, and R. Shavelle, Comparative mortality in cerebral palsy patients in Cali-fornia, 1980-1996. J Insur Med, 1998. 30(4): p. 240-6.
56. Plioplys, A.V., et al., Survival rates among children with severe neurologic disabilities. South Med J, 1998. 91(2): p. 161-72.
57. Strauss, D.J., R.M. Shavelle, and T.W. Anderson, Life expectancy of children with cerebral palsy. Pediatr Neurol, 1998. 18(2): p. 143-9.
58. Hollins, S., et al., Mortality in people with learning disability: risks, causes, and death certification findings in London. Dev Med Child Neurol, 1998. 40(1): p. 50-6.
59. Strauss, D. and R. Shavelle, Life expectancy of adults with cerebral palsy. Dev Med Child Neurol, 1998. 40(6): p. 369-75.
60. Williams, K. and E. Alberman, Survival in cerebral palsy: the role of severity and diagnostic labels. Dev Med Child Neurol, 1998. 40(6): p. 376-9.
61. Loughlin, G.M., Respiratory consequences of dysfunctional swallowing and aspiration. Dysphagia, 1989. 3(3): p. 126-30.
62. Rogers, B., M. Msall, and D. Shucard, Hypoxemia during oral feedings in adults with dysphagia and severe neurological disabilities. Dysphagia, 1993. 8(1): p. 43-8.

General Introduction 19
63. Berquist, W.E., et al., Gastroesophageal reflux-associated recurrent pneumonia and chronic asthma in children. Pediatrics, 1981. 68(1): p. 29-35.
64. Toder, D.S., Respiratory problems in the adolescent with developmental delay. Adolesc Med, 2000. 11(3): p. 617-31.
65. Martin, T.R., The relationship between malnutrition and lung infections. Clin Chest Med, 1987. 8(3): p. 359-72.

Chapter 2
A Population-Based Nested Case Control Study on
Recurrent Pneumonias in Children with Severe
Generalized Cerebral Palsy: Ethical Considerations of the
Design and Representativeness of the Study Sample
R. Veugelers, E.A.C. Calis, C. Penning, A.Verhagen, R. Bernsen,
J. Bouquet, M.A. Benninga, P.J.F.M. Merkus, H.G.M. Arets, D.
Tibboel, H. M. Evenhuis
BMC Pediatr 2005;5(1):25.
22
Cha
pte
r 2
ABSTRACT
Background In children with severe generalized cerebral palsy, pneumonias are
a major health issue. Malnutrition, dysphagia, gastro-oesophageal reflux, impaired
respiratory function and constipation are hypothesized risk factors. Still, no data
are available on the relative contribution of these possible risk factors in the
described population. This paper describes the initiation of a study in 194 children
with severe generalized cerebral palsy, on the prevalence and on the impact of
these hypothesized risk factors of recurrent pneumonias.
Methods/Design A nested case-control design with 18 months follow-up was
chosen. Dysphagia, respiratory function and constipation will be assessed at base-
line, malnutrition and gastro-oesophageal reflux at the end of the follow-up. The
study population consists of a representative population sample of children with
severe generalized cerebral palsy. Inclusion was done through care centres in a
predefined geographical area and not through hospitals. All measurements will
be done on-site which sets high demands on all measurements. If these demands
were not met in “gold standard” methods, other methods were chosen. Although
the inclusion period was prolonged, the desired sample size of 300 children was
not met. With a consent rate of 33%, nearly 10% of all eligible children in the
Netherlands are included (n=194). The study population is subtly different from
the non-participants with regard to severity of dysphagia and prevalence rates of
pneumonias and gastro-oesophageal reflux.
Discussion Ethical issues complicated the study design. Assessment of malnutri-
tion and gastro-oesophageal reflux at baseline was considered unethical, since
these conditions can be easily treated. Therefore, we postponed these diagnos-
tics until the end of the follow-up. In order to include a representative sample,
all eligible children in a predefined geographical area had to be contacted. To
increase the consent rate, on-site measurements are of first choice, but timely
inclusion is jeopardized. The initiation of this first study among children with
severe neurological impairment led to specific, unexpected problems. Despite
small differences between participants and non-participating children, our sample
is as representative as can be expected from any population-based study and will
provide important, new information to bring us further towards effective interven-
tions to prevent pneumonias in this population.
Study Design and Representativeness 23
BACKGROUND
Children with severe generalized cerebral palsy often have a combination of mo-
tor and intellectual disabilities. They frequently experience comorbidity and their
life expectancy is low 1-11 with respiratory disease as a main cause of death 1-3,8,10,12.
Although it is common clinical knowledge that children with neurological impair-
ment often have respiratory problems 13-17, get hospitalized for this 18 with a major
impact on their quality of life and life expectancy 14, prevalence rates have not
been studied prospectively. Retrospective prevalence estimates of pneumonias
range from 31% per 6 months; 38% single episodes to 19% recurrent pneumonias
per year 19,20. Although several clinical specialists presume several conditions to be
risk factors for pneumonias, population-based studies on this subject are lacking.
Epidemiological identification of such risk factors will bring us further towards
effective interventions to prevent pneumonias.
Hypothesized risk factors of respiratory disease in children / adolescents with neu-
rological impairment / intellectual disabilities from the literature are listed in Table
1. These factors may co-exist and interact with each other. On top of this, normal
childhood factors may exist, such as asthma or passive smoking. Pneumonias can
be infectious or chemical of nature. To prevent pneumonias, adequate function
of the protection mechanisms of the airways is essential. But in children with
severe generalized cerebral palsy this protection system is often compromised or
endangered due to several conditions 14,15,20-29.
Table 1: Hypothesized risk factors of pulmonary disease in children with neurological impairment / intellectual disabilities
recurrent aspiration (dysphagia, gastro-oesophageal reflux) 14-16, 20, 28, 53, 54
inefficient cough / poor cough reflex 14, 15, 28
poor airway clearance (immobility and retained secretions) 14, 15
respiratory muscle weakness and in-coordination 14, 15, 28
chest wall or spinal deformities (poor pulmonary reserve) 14, 15, 28
inadequate nutritional status (feeding problems, gastro-oesophageal reflux) 14, 15
miscellaneous factors 2, 8, 10, 14-17
bronchopulmonary dysplasia in preterm survivors
immune problems (Down’s syndrome)
lipid aspiration in mineral oil treatment of constipation
reduced lung growth in skeletal dysplasias
normal childhood factors (e.g. asthma, passive smoking) 14, 15
immobility 3, 10, 27, 28, 55, 56
24
Cha
pte
r 2
We hypothesize that malnutrition, dysphagia, gastro-oesophageal reflux, decreased
respiratory function and constipation are the most relevant risk factors for recurrent
pneumonias. Since scientific evidence for a relationship between these disorders
and the occurrence of pneumonias is lacking, we aim to evaluate this in a large-
scale epidemiological study. Our research questions are the following: (1) What is
the prevalence of pneumonias in children with severe generalized cerebral palsy?
(2) Are malnutrition, dysphagia, gastro-oesophageal reflux, decreased respiratory
function and constipation risk factors for pneumonias in this group of children?
The design of the study also allows us to determine the prevalence and presenta-
tion of the studied hypothesized risk factors.
This article describes the study design, diagnostic methods and the study popula-
tion. Attention is paid to adaptations in the study design arising from ethical
considerations as well as from the diagnostic methods required to study medical
conditions in children with severe generalized cerebral palsy.
METHODS / DESIGN
Study design
This study has a nested case-control design and will be conducted in a rep-
resentative group of children with severe generalized cerebral palsy, recruited
through care centres (specialized day-care centres and residential facilities) and
through specialized schools. In our study population, the hypothesized risk fac-
tors dysphagia, respiratory function and constipation will be assessed at baseline.
However, for ethical reasons explained in the discussion paragraph, malnutrition
and gastro-oesophageal reflux will be assessed at the end of the follow-up period.
Cases are defined as children with recurrent pneumonias, and controls as children
without pneumonias during a follow-up of 18 months. Cases and controls are
matched on age, gender and GMFCS level. A duration of the follow-up period of
18 months was considered sufficient, since we defined recurrent pneumonias as 2
or more episodes within a year. The study will not interfere with common medical
practice and interventions in the study population during the follow-up period.
Thus, children might be diagnosed and treated by their own physicians during the
course of the study. The study design is depicted in Figure 1.
Setting
All diagnostic assessments in this study will be carried out on-site at the different
care centres and specialized schools. In order to obtain a complete inclusion and
Study Design and Representativeness 25
therewith a representative study population, we had to keep the burden for the
participants as small as possible. Hospital visits were considered an obstacle for
participation. Furthermore, performing measurements in a familiar setting might
improve cooperation of the children.
Sample size
Calculating a required sample size for this study was hampered, since valid preva-
lence numbers of both pneumonias and most of the supposed risk factors in this
population, were lacking in the literature. Prevalence numbers were estimated based
on the available literature and on clinical experience. We calculated the required
sample size for a univariate analysis, since the number of children required for a
multivariate analysis including five separate variables will probably be quite large.
In addition, we estimated that for logistical purposes a maximum number of 300
children could be included in this study. Required sample size was calculated for
each possible risk factor separately, assuming a prevalence rate of recurrent pneu-
monias of 30% with a required power of 0.80 and an alpha of 0.05. The analysis for
dysphagia, based on an estimated prevalence of dysphagia of 19% in the controls
and 38% in the cases, resulted in the highest sample size (n=260). Assuming a loss-
to-follow-up rate of 13%, recruitment numbers were set to 300 participants.
Inclusion criteria
In this study we aimed to include children (2 to 18 years), who have a combi-
nation of moderate to profound intellectual disabilities and a severe motor dis-
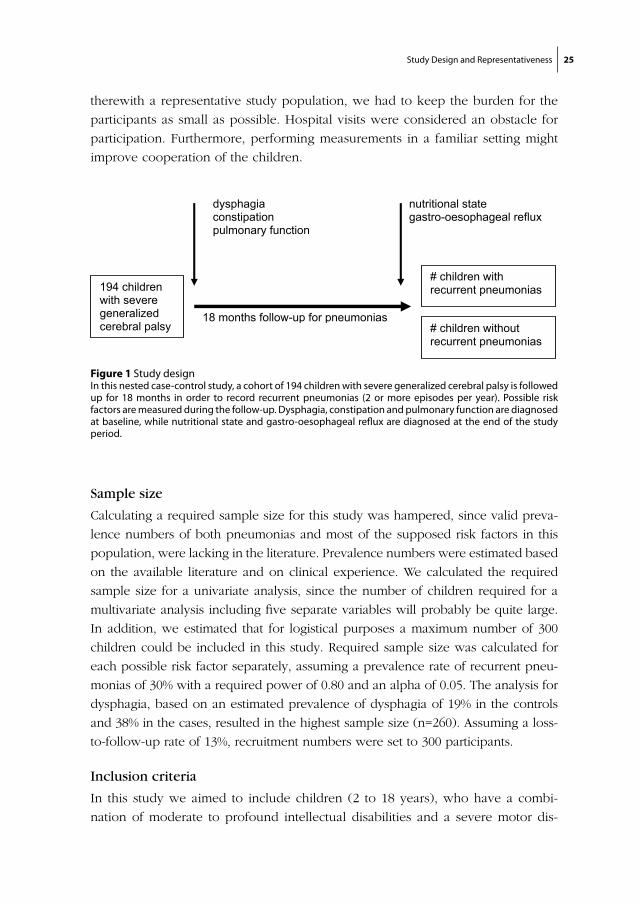
Figure 1 Study designIn this nested case-control study, a cohort of 194 children with severe generalized cerebral palsy is followed up for 18 months in order to record recurrent pneumonias (2 or more episodes per year). Possible risk factors are measured during the follow-up. Dysphagia, constipation and pulmonary function are diagnosed at baseline, while nutritional state and gastro-oesophageal reflux are diagnosed at the end of the study period.
chapter 2/ figure 1:
dysphagia constipation pulmonary function
nutritional state gastro-oesophageal reflux
194 children with severe generalized cerebral palsy
# children with recurrent pneumonias
# children without recurrent pneumonias
18 months follow-up for pneumonias
26
Cha
pte
r 2
ability. The intellectual disability was defined as an IQ below 55 (or estimated
by dividing the developmental age by the calendar age times 100). The motor
disability was defined by hypertonic or hypotonic generalized cerebral palsy or a
motor developmental delay to such an extent that a child can at best crawl. This
corresponds to a Gross Motor Function Classification Scale (GMFCS) score IV
or V 30. These broad criteria, resulting in a heterogeneous cohort with regard to
etiology and disabilities, was chosen deliberately, because in daily practice, it is
this heterogeneous group that causes a lot of concern for parents and physicians
regarding the studied illnesses. Furthermore, the inclusion criteria had to be clear
to non-medical personnel, to ascertain they could identify the eligible children.
Consent procedure
We approached all children with severe generalized cerebral palsy in a certain geo-
graphical area, an important prerequisite when studying a prevalence rate, to obtain
a representative sample of the total population. For pragmatic reasons, we chose
an area of 50 kilometres around the cities of Rotterdam and Utrecht. We estimated
that we could reach 500 children in this area. With an assumed consent rate of
0.60, this would provide the desired 300 participants. Within this area, we traced all
facilities that might provide care to children and adolescents with severe generalized
cerebral palsy, using the Dutch address guide for disability care. These centres were
contacted and asked to participate in the study if they indeed provided care for such
children. In the participating centres, parents or guardians of all children that met
the inclusion criteria were informed, unless children were in a critical health status,
when home situations were considered very unstable, or if parents were known to
have a strong aversion to research. Information for parents was available in Dutch,
English, and Turkish. For Moroccan families, a spoken introductory compact disc
was available, since Berber is only a spoken language. Because gastro-oesophageal
reflux can only be measured properly using an invasive method, parents had the
opportunity to give consent with or without this measurement.
Inclusion period
Of the 93 care centres and specialized schools that had been contacted, 61 pro-
vided care for one or more children with severe generalized cerebral palsy. Fifty-
six of these centres agreed to participate in our study. The other centres did not
cooperate due to personnel shortage and besides this, one centre also considered
the burden of the study for parents, children and personnel too large.
Study Design and Representativeness 27
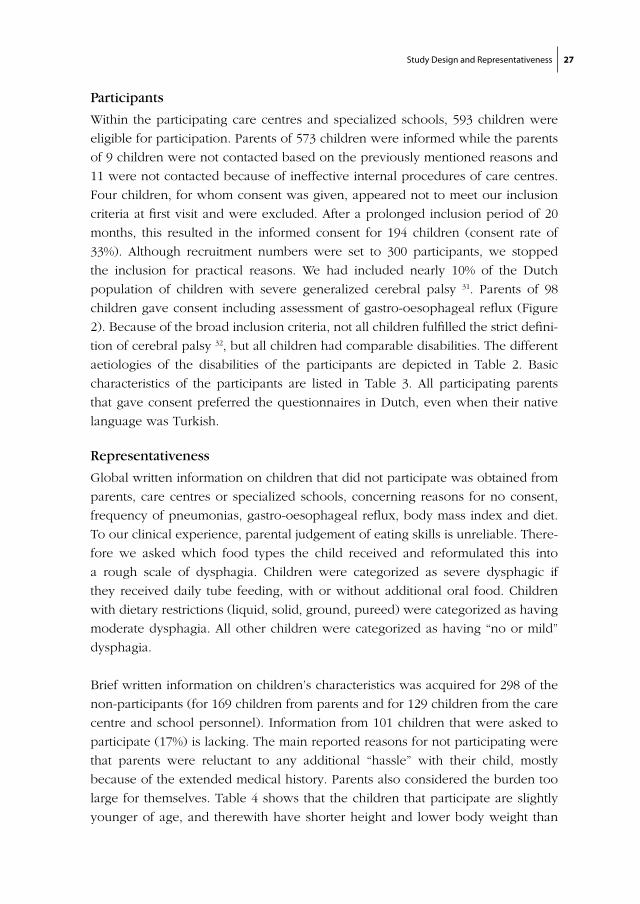
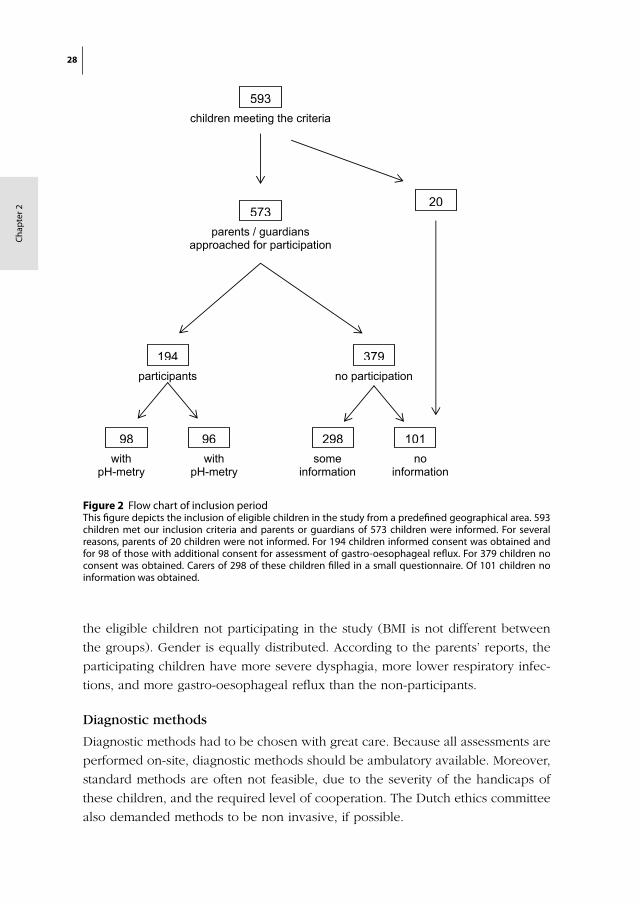
Participants
Within the participating care centres and specialized schools, 593 children were
eligible for participation. Parents of 573 children were informed while the parents
of 9 children were not contacted based on the previously mentioned reasons and
11 were not contacted because of ineffective internal procedures of care centres.
Four children, for whom consent was given, appeared not to meet our inclusion
criteria at first visit and were excluded. After a prolonged inclusion period of 20
months, this resulted in the informed consent for 194 children (consent rate of
33%). Although recruitment numbers were set to 300 participants, we stopped
the inclusion for practical reasons. We had included nearly 10% of the Dutch
population of children with severe generalized cerebral palsy 31. Parents of 98
children gave consent including assessment of gastro-oesophageal reflux (Figure
2). Because of the broad inclusion criteria, not all children fulfilled the strict defini-
tion of cerebral palsy 32, but all children had comparable disabilities. The different
aetiologies of the disabilities of the participants are depicted in Table 2. Basic
characteristics of the participants are listed in Table 3. All participating parents
that gave consent preferred the questionnaires in Dutch, even when their native
language was Turkish.
Representativeness
Global written information on children that did not participate was obtained from
parents, care centres or specialized schools, concerning reasons for no consent,
frequency of pneumonias, gastro-oesophageal reflux, body mass index and diet.
To our clinical experience, parental judgement of eating skills is unreliable. There-
fore we asked which food types the child received and reformulated this into
a rough scale of dysphagia. Children were categorized as severe dysphagic if
they received daily tube feeding, with or without additional oral food. Children
with dietary restrictions (liquid, solid, ground, pureed) were categorized as having
moderate dysphagia. All other children were categorized as having “no or mild”
dysphagia.
Brief written information on children’s characteristics was acquired for 298 of the
non-participants (for 169 children from parents and for 129 children from the care
centre and school personnel). Information from 101 children that were asked to
participate (17%) is lacking. The main reported reasons for not participating were
that parents were reluctant to any additional “hassle” with their child, mostly
because of the extended medical history. Parents also considered the burden too
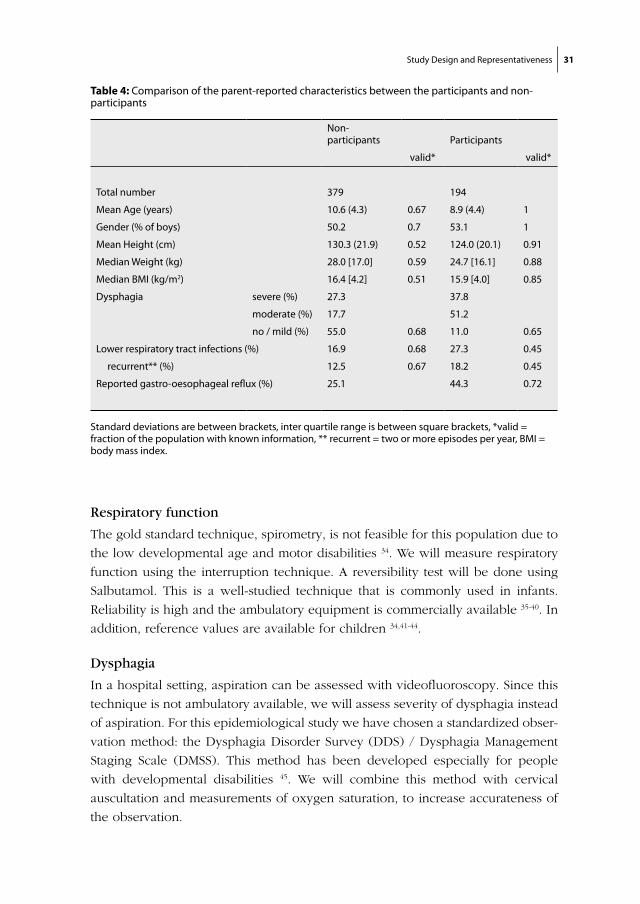
large for themselves. Table 4 shows that the children that participate are slightly
younger of age, and therewith have shorter height and lower body weight than
28
Cha
pte
r 2
Figure 2 Flow chart of inclusion periodThis figure depicts the inclusion of eligible children in the study from a predefined geographical area. 593 children met our inclusion criteria and parents or guardians of 573 children were informed. For several reasons, parents of 20 children were not informed. For 194 children informed consent was obtained and for 98 of those with additional consent for assessment of gastro-oesophageal reflux. For 379 children no consent was obtained. Carers of 298 of these children filled in a small questionnaire. Of 101 children no information was obtained.
chapter 2/ figure 2:
children meeting the criteria
parents / guardians approached for participation
participants no participation
withpH-metry
withpH-metry
someinformation
noinformation
593
573
194
98 96 298 101
379
20
the eligible children not participating in the study (BMI is not different between
the groups). Gender is equally distributed. According to the parents’ reports, the
participating children have more severe dysphagia, more lower respiratory infec-
tions, and more gastro-oesophageal reflux than the non-participants.
Diagnostic methods
Diagnostic methods had to be chosen with great care. Because all assessments are
performed on-site, diagnostic methods should be ambulatory available. Moreover,
standard methods are often not feasible, due to the severity of the handicaps of
these children, and the required level of cooperation. The Dutch ethics committee
also demanded methods to be non invasive, if possible.
Study Design and Representativeness 29
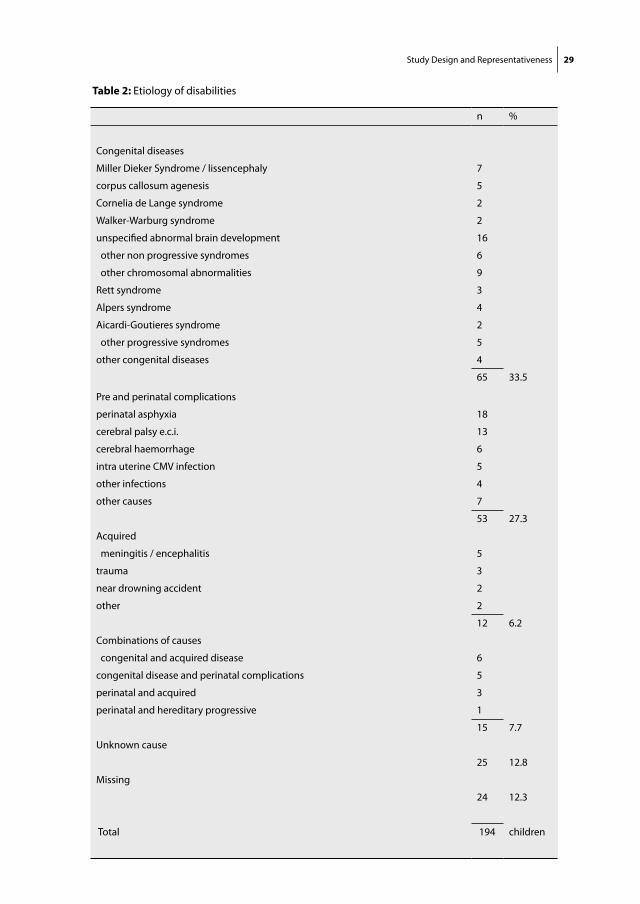
Table 2: Etiology of disabilities
n %
Congenital diseases
Miller Dieker Syndrome / lissencephaly 7
corpus callosum agenesis 5
Cornelia de Lange syndrome 2
Walker-Warburg syndrome 2
unspecified abnormal brain development 16
other non progressive syndromes 6
other chromosomal abnormalities 9
Rett syndrome 3
Alpers syndrome 4
Aicardi-Goutieres syndrome 2
other progressive syndromes 5
other congenital diseases 4
65 33.5
Pre and perinatal complications
perinatal asphyxia 18
cerebral palsy e.c.i. 13
cerebral haemorrhage 6
intra uterine CMV infection 5
other infections 4
other causes 7
53 27.3
Acquired
meningitis / encephalitis 5
trauma 3
near drowning accident 2
other 2
12 6.2
Combinations of causes
congenital and acquired disease 6
congenital disease and perinatal complications 5
perinatal and acquired 3
perinatal and hereditary progressive 1
15 7.7
Unknown cause
25 12.8
Missing
24 12.3
Total 194 children
30
Cha
pte
r 2
Pneumonia
In clinical practice, pneumonia is diagnosed based on a chest X-ray together with
symptoms and signs. In the present study however, we needed to use a definition
that could be used without requiring extra diagnostic procedures. A previous
study showed that retrospective examination of medical files was not accurate for
detection of pneumonias 33. Therefore, the research team agreed upon the follow-
ing definition for an episode of pneumonia: fever (> 38.5 °C, or 1,5°C above basal
temperature) during more than 24 hours, likely due to a pneumonia, character-
ized by: (increase of) dyspnoea (tachypnoea, use of assistant respiratory muscles,
wheezing) during the last 6 hours, and/or (increase of) hyper secretion of mucus,
and/or, tachypnoea and regular coughing. In addition, no other explanation for
fever (such as middle ear infection or a urinary tract infection) should be present.
Because this is a population-based study, participating children all have their own
treating physicians. To limit the number of people that are involved in gathering
data on pneumonias, parents were asked to complete a questionnaire whenever
their child has a fever and airway symptoms. If a physician is contacted, parents
ask him or her to fill in a questionnaire for physicians. Every 4 months, parents
will be reminded to complete the questionnaires if their child was ill.
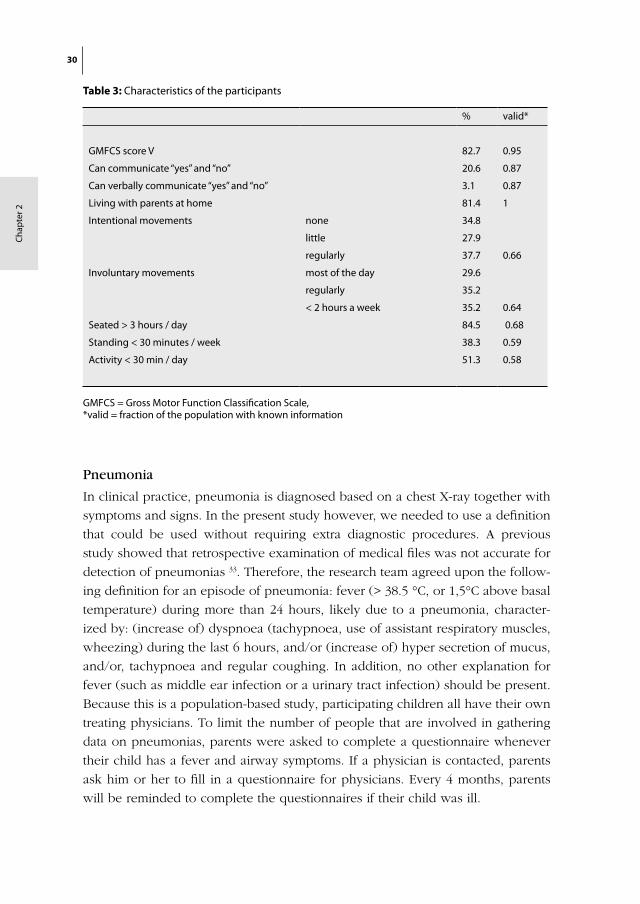
Table 3: Characteristics of the participants
% valid*
GMFCS score V 82.7 0.95
Can communicate “yes” and “no” 20.6 0.87
Can verbally communicate “yes” and “no” 3.1 0.87
Living with parents at home 81.4 1
Intentional movements none 34.8
little 27.9
regularly 37.7 0.66
Involuntary movements most of the day 29.6
regularly 35.2
< 2 hours a week 35.2 0.64
Seated > 3 hours / day 84.5 0.68
Standing < 30 minutes / week 38.3 0.59
Activity < 30 min / day 51.3 0.58
GMFCS = Gross Motor Function Classification Scale, *valid = fraction of the population with known information
Study Design and Representativeness 31
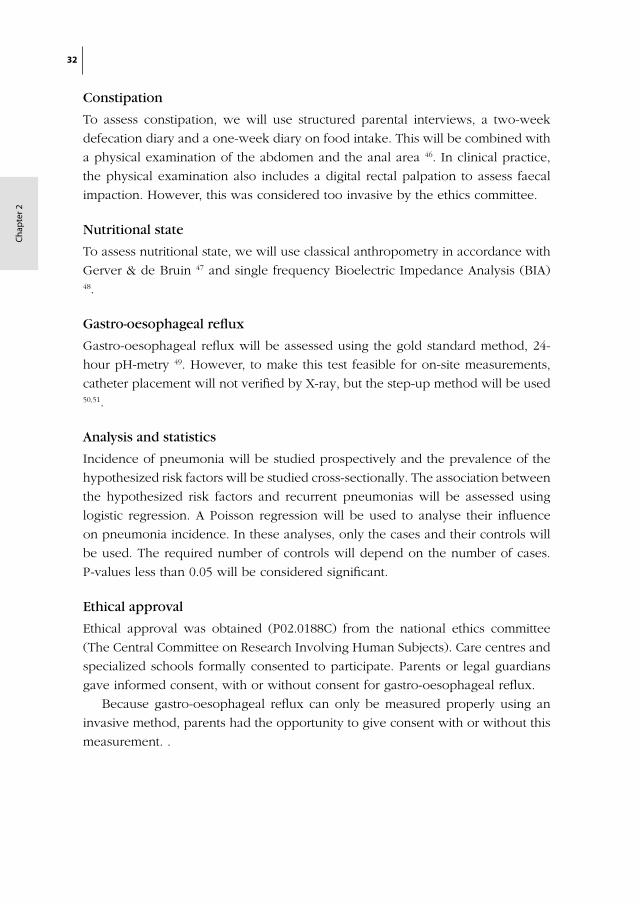
Respiratory function
The gold standard technique, spirometry, is not feasible for this population due to
the low developmental age and motor disabilities 34. We will measure respiratory
function using the interruption technique. A reversibility test will be done using
Salbutamol. This is a well-studied technique that is commonly used in infants.
Reliability is high and the ambulatory equipment is commercially available 35-40. In
addition, reference values are available for children 34,41-44.
Dysphagia
In a hospital setting, aspiration can be assessed with videofluoroscopy. Since this
technique is not ambulatory available, we will assess severity of dysphagia instead
of aspiration. For this epidemiological study we have chosen a standardized obser-
vation method: the Dysphagia Disorder Survey (DDS) / Dysphagia Management
Staging Scale (DMSS). This method has been developed especially for people
with developmental disabilities 45. We will combine this method with cervical
auscultation and measurements of oxygen saturation, to increase accurateness of
the observation.
Table 4: Comparison of the parent-reported characteristics between the participants and non-participants
Non-participants Participants
valid* valid*
Total number 379 194
Mean Age (years) 10.6 (4.3) 0.67 8.9 (4.4) 1
Gender (% of boys) 50.2 0.7 53.1 1
Mean Height (cm) 130.3 (21.9) 0.52 124.0 (20.1) 0.91
Median Weight (kg) 28.0 [17.0] 0.59 24.7 [16.1] 0.88
Median BMI (kg/m2) 16.4 [4.2] 0.51 15.9 [4.0] 0.85
Dysphagia severe (%) 27.3 37.8
moderate (%) 17.7 51.2
no / mild (%) 55.0 0.68 11.0 0.65
Lower respiratory tract infections (%) 16.9 0.68 27.3 0.45
recurrent** (%) 12.5 0.67 18.2 0.45
Reported gastro-oesophageal reflux (%) 25.1 44.3 0.72
Standard deviations are between brackets, inter quartile range is between square brackets, *valid = fraction of the population with known information, ** recurrent = two or more episodes per year, BMI = body mass index.
32
Cha
pte
r 2
Constipation
To assess constipation, we will use structured parental interviews, a two-week
defecation diary and a one-week diary on food intake. This will be combined with
a physical examination of the abdomen and the anal area 46. In clinical practice,
the physical examination also includes a digital rectal palpation to assess faecal
impaction. However, this was considered too invasive by the ethics committee.
Nutritional state
To assess nutritional state, we will use classical anthropometry in accordance with
Gerver & de Bruin 47 and single frequency Bioelectric Impedance Analysis (BIA) 48.
Gastro-oesophageal reflux
Gastro-oesophageal reflux will be assessed using the gold standard method, 24-
hour pH-metry 49. However, to make this test feasible for on-site measurements,
catheter placement will not verified by X-ray, but the step-up method will be used 50,51.
Analysis and statistics
Incidence of pneumonia will be studied prospectively and the prevalence of the
hypothesized risk factors will be studied cross-sectionally. The association between
the hypothesized risk factors and recurrent pneumonias will be assessed using
logistic regression. A Poisson regression will be used to analyse their influence
on pneumonia incidence. In these analyses, only the cases and their controls will
be used. The required number of controls will depend on the number of cases.
P-values less than 0.05 will be considered significant.
Ethical approval
Ethical approval was obtained (P02.0188C) from the national ethics committee
(The Central Committee on Research Involving Human Subjects). Care centres and
specialized schools formally consented to participate. Parents or legal guardians
gave informed consent, with or without consent for gastro-oesophageal reflux.
Because gastro-oesophageal reflux can only be measured properly using an
invasive method, parents had the opportunity to give consent with or without this
measurement. .
Study Design and Representativeness 33
DISCUSSION
Designing and conducting an epidemiological study in children with severe gen-
eralized cerebral palsy is associated with characteristic difficulties. Even though
we have considerable experience with research through care organisations 52, the
initiation of this first study in children lead to specific, not always anticipated,
problems, which caused a substantial delay. In the present study several obstacles
needed to be overcome, which will most likely be encountered in future studies as
well. This started with the design of a realistic, ethically acceptable study, includ-
ing the choice of feasible diagnostic assessment methods and was followed by the
recruitment of a representative cohort. In addition, one should bear in mind that
on-site measurements and therewith inclusion through care centres (specialized
day-care centres and residential facilities) and specialized schools can jeopardise
timely inclusion due to potential lengthy procedures.
Dealing with encountered obstacles
Designing the study was complicated by ethical issues, which were resolved by a
limited concession in the study design. In standard (nested) case-control studies,
hypothesized risk factors are determined at baseline. In the present study, indeed,
we will determine respiratory function, constipation and dysphagia at the start of
the study, as risk factors. However, gastro-oesophageal reflux and malnutrition are
disorders that are likely to cause a considerable loss of quality of life, apart from
their possible effects on pneumonias, and both can easily be treated. Therefore, it
was considered ethically unacceptable to determine the presence of these condi-
tions at the start of the follow-up and then postponing treatment until the study
would be finished. For that reason, we decided to perform the diagnostic tests
for these conditions at the end of the follow-up period. This theoretically reduces
the power of the analysis, but this reduction is relative since both conditions have
a chronic character. We consider this design ethically acceptable, even though
we purposely will not assess gastro-oesophageal reflux and nutritional state at
baseline, because we will not interfere with common medical practice. Therefore,
medical diagnosing and treatment of these disorders will not be hampered.
To conduct this study, a group of children with recurrent pneumonias needed
to be identified prospectively. It would make sense to do this retrospectively.
However, a previously conducted pilot study indicated that medical records, even
when combined with interviews of paediatricians and intellectual disability physi-
cians, provided incomplete and therefore unreliable information on pneumonias
in these children 33.
34
Cha
pte
r 2
Getting informed consent of the carers of all eligible children in a geographical
area within a reasonable time span was difficult. Firstly, there was no clear registra-
tion of the centres that provide care for this specific population in the Netherlands,
which resulted in a search amongst a range of organisations. Secondly, centres all
had their own procedure to decide on cooperation with a study, often including
management, medical staff, other personnel, parent boards and ethics committees.
In some centres no standard procedure existed, since they had never been asked
to participate in a study before. Thirdly, the national ethics committee considered
this study as a multi-centre study and required a consent-form from each centre
in advance of their final approval. Although this procedure works well in studies
with 2 or 3 participating hospitals, for the present study it meant that 56 centres
needed to decide on participation in advance. The resulting delay was a new
and unsatisfying experience for the national ethics committee as well. Fourthly,
privacy regulations lead to great dependence on willingness and organizational
skills of the participating centres. The selection of eligible children had to be done
by care centre personnel, and information brochures were sent while researchers
were blinded for names and addresses. Despite these encountered difficulties,
we have approached a representative sample of children with severe generalized
cerebral palsy.
All diagnostic measurements should be ambulatory available and require no active
cooperation. Therefore, not all diagnostic methods in this study are “gold-standard”
methods. To date, only few diagnostic tests are available, validated for this specific
population. Some diagnostic tests used in the present study are applied for the first
time in this population, resulting in valuable feasibility data for future validation
studies. Since ethical regulations also required methods to be non-invasive when
possible, assessment of constipation need to be done without the rectal digital
examination, which will therefore provide less information in comparison to the
normal diagnostic procedure.
To ensure that people of different nationalities participate in a prevalence study,
information needs to be provided in several languages. However, our experience
is that there is no need for translated written information brochures and question-
naires. A spoken introduction on compact disc can provide an introduction and
interested parents will ask a family member for translation of the brochure and
questionnaires.
Finally, the inclusion period was stopped before target sample size was reached,
due to delay because of practical reasons discussed above. By the end of our

Study Design and Representativeness 35
inclusion period, almost a quarter of the children with severe generalized cerebral
palsy in the Netherlands had been approached and nearly 10% of the Dutch
population of these children participates. Even with less power than desired, this
study will be able to put a subject on the map that got little attention up to now.
Representativeness
To stay close to clinical practice, we used inclusion criteria based on disabilities
rather than on etiology, resulting in a heterogeneous group of children. Obviously,
this might also cause more heterogeneity of the results.
The participating children are slightly younger of age than the eligible children
that did not participate. However, we do not regard an age difference of less than
2 years with a standard deviation of over 4 years, as a clinical relevant discrepancy.
Height and weight differences can be explained by age, since BMI is not different
between both groups. A relevant discrepancy does seem to be present between
the groups with regard to the reported severity of dysphagia, the frequency of
lower respiratory tract infections and the presence of gastro-oesophageal reflux.
We assume that the parents of the children with more severe health problems
were more likely to recognize the health issues of their child in the informa-
tion brochure and therefore decided to participate more often. Since swallowing
strongly depends on motor skills, it seems likely that participants have poorer
motor skills in general than the non-participants. Another part of the discrepancy
might be explained by the selection of non-eligible children by staff of the centres.
On first visit, we had to exclude four children whose motor or intellectual skills
were of a higher level than those defined by our inclusion criteria. This might also
have been the case in the group that did not consent to participate. Because of the
slight discrepancies in characteristics, the final results, especially prevalence rates,
have to be interpreted with caution. Despite the discrepancies, our sample is as
representative as can be expected in population-based research.
Implication for future studies
Preventive medicine needs to play a major role in the healthcare for children with
severe neurological impairment. Consequently, intervention studies are needed
in which effects can be measured in a valid and reproducible way, and reference
values need to be established. As in any discipline, intervention studies should
be based on epidemiological data. To avoid complex epidemiological studies, a
health register seems to be a requisite. In such a registry, data on health status,
diagnostic assessments and applied medical treatments of children with severe
36
Cha
pte
r 2
neurological impairment should be recorded. This would also enable specialists to
combine knowledge and to monitor trends.
For every study question, one should contemplate on the choice between diag-
nostic assessments in hospital or on-site. When a representative cohort of children
with severe generalized cerebral palsy is required, one should perform a com-
munity-based study to keep the burden low and therewith the consent rate as
high as possible, but one can expect to encounter the discussed obstacles. The
main disadvantage of a hospital-based study is that a selective population will
be recruited, even when performed through an outpatient clinic. Furthermore,
one should consider that feasibility of diagnostic assessments might be better
on-site, due to the fact that the setting is familiar to the child. On the other hand,
in hospital-based studies, logistics are less complicated and hospital assessments,
such as X-rays, are easily applied.
In conclusion, this study will fill in some of the lacunas in the knowledge of the
health status of these children such as prevalence numbers of several health con-
ditions, associations with recurrent pneumonias. It will also provide new informa-
tion on the diagnostic tools available for these children, and provide experience
in performing scientific studies in this specific field.
Study Design and Representativeness 37
REFERENCES
1. Katz, R.T., Life expectancy for children with cerebral palsy and mental retardation: implications for life care planning. NeuroRehabilitation, 2003. 18(3): p. 261-70.
2. Blair, E., et al., Life expectancy among people with cerebral palsy in Western Australia. Dev Med Child Neurol, 2001. 43(8): p. 508-15.
3. Reddihough, D.S., G. Baikie, and J.E. Walstab, Cerebral palsy in Victoria, Australia: mortality and causes of death. J Paediatr Child Health, 2001. 37(2): p. 183-6.
4. Shavelle, R.M., D.J. Straus, and S.M. Day, Comparison of survival in cerebral palsy between coun-tries. Dev Med Child Neurol, 2001. 43(8): p. 574.
5. Strauss, D., W. Cable, and R. Shavelle, Causes of excess mortality in cerebral palsy. Dev Med Child Neurol, 1999. 41(9): p. 580-5.
6. Hutton, J.L., A.F. Colver, and P.C. Mackie, Effect of severity of disability on survival in north east England cerebral palsy cohort. Arch Dis Child, 2000. 83(6): p. 468-74.
7. Singer, R.B., D. Strauss, and R. Shavelle, Comparative mortality in cerebral palsy patients in Cali-fornia, 1980-1996. J Insur Med, 1998. 30(4): p. 240-6.
8. Plioplys, A.V., et al., Survival rates among children with severe neurologic disabilities. South Med J, 1998. 91(2): p. 161-72.
9. Strauss, D.J., R.M. Shavelle, and T.W. Anderson, Life expectancy of children with cerebral palsy. Pediatr Neurol, 1998. 18(2): p. 143-9.
10. Hollins, S., et al., Mortality in people with learning disability: risks, causes, and death certification findings in London. Dev Med Child Neurol, 1998. 40(1): p. 50-6.
11. Strauss, D. and R. Shavelle, Life expectancy of adults with cerebral palsy. Dev Med Child Neurol, 1998. 40(6): p. 369-75.
12. Williams, K. and E. Alberman, Survival in cerebral palsy: the role of severity and diagnostic labels. Dev Med Child Neurol, 1998. 40(6): p. 376-9.
13. Fischer-Brandies, H., C. Avalle, and G.J. Limbrock, Therapy of orofacial dysfunctions in cerebral palsy according to Castillo-Morales: first results of a new treatment concept. Eur J Orthod, 1987. 9(2): p. 139-43.
14. Seddon, P.C. and Y. Khan, Respiratory problems in children with neurological impairment. Arch Dis Child, 2003. 88(1): p. 75-8.
15. Couriel, J., Respiratory complications of neurological disease in children. Current Medical Litera-ture: Respiratory Medicine, 1997. 10: p. 70-5.
16. Morton, R.E., R. Wheatley, and J. Minford, Respiratory tract infections due to direct and reflux aspiration in children with severe neurodisability. Dev Med Child Neurol, 1999. 41(5): p. 329-34.
17. Liptak, G.S., et al., Health status of children with moderate to severe cerebral palsy. Dev Med Child Neurol, 2001. 43(6): p. 364-70.
18. Mahon, M. and M.S. Kibirige, Patterns of admissions for children with special needs to the paedi-atric assessment unit. Arch Dis Child, 2004. 89(2): p. 165-9.
19. Saito, N., et al., Natural history of scoliosis in spastic cerebral palsy. Lancet, 1998. 351(9117): p. 1687-92.
20. Sullivan, P.B., et al., Prevalence and severity of feeding and nutritional problems in children with neurological impairment: Oxford Feeding Study. Dev Med Child Neurol, 2000. 42(10): p. 674-80.

38
Cha
pte
r 2
21. Couriel, J.M., et al., Assessment of feeding problems in neurodevelopmental handicap: a team approach. Arch Dis Child, 1993. 69(5): p. 609-13.
22. Fung, C.W., et al., Video-fluoroscopic study of swallowing in children with neurodevelopmental disorders. Pediatr Int, 2004. 46(1): p. 26-30.
23. Berquist, W.E., et al., Gastroesophageal reflux-associated recurrent pneumonia and chronic asthma in children. Pediatrics, 1981. 68(1): p. 29-35.
24. Gangil, A., et al., Gastroesophageal reflux disease in children with cerebral palsy. Indian Pediatr, 2001. 38(7): p. 766-70.
25. Booth, I.W., Silent gastro-oesophageal reflux: how much do we miss? Arch Dis Child, 1992. 67(11): p. 1325-7.
26. Gisel, E.G. and J. Patrick, Identification of children with cerebral palsy unable to maintain a normal nutritional state. Lancet, 1988. 1(8580): p. 283-6.
27. Loughlin, G.M., Respiratory consequences of dysfunctional swallowing and aspiration. Dysphagia, 1989. 3(3): p. 126-30.
28. Toder, D.S., Respiratory problems in the adolescent with developmental delay. Adolesc Med, 2000. 11(3): p. 617-31.
29. Martin, T.R., The relationship between malnutrition and lung infections. Clin Chest Med, 1987. 8(3): p. 359-72.
30. Palisano, R.J., et al., Validation of a model of gross motor function for children with cerebral palsy. Phys Ther, 2000. 80(10): p. 974-85.
31. IGZ, Ernstig Meervoudig gehandicapt en dán? Een onderzoek naar de kwaliteit van zorg voor mensen met meervoudige complexe handicaps, Inspectie voor de Gezondheidszorg i.s.m. minis-terie van VWS. 2000: Den Haag, The Netherlands.
32. Bax, M.C., Terminology and Classification of Cerebral Palsy. Dev Med Child Neurol, 1964. 11: p. 295-7.
33. Huisman, S., Een pilotonderzoek naar luchtweginfecties bij mensen met mcg problematiek. TVAZ, tijdschrift van de vereniging van artsen in de zorg voor mensen met een verstandelijke handicap, 2001. nr. 4: p. 9-11.
34. Merkus, P.J., et al., Interrupter resistance in preschool children: measurement characteristics and reference values. Am J Respir Crit Care Med, 2001. 163(6): p. 1350-5.
35. Arets, H.G., H.J. Brackel, and C.K. van der Ent, Applicability of interrupter resistance measure-ments using the MicroRint in daily practice. Respir Med, 2003. 97(4): p. 366-74.
36. Beelen, R.M., et al., Short and long term variability of the interrupter technique under field and standardized conditions in 3-6 year old children. Thorax, 2003. 58(9): p. 761-4.
37. Bridge, P.D., S. Ranganathan, and S.A. McKenzie, Measurement of airway resistance using the interrupter technique in preschool children in the ambulatory setting. Eur Respir J, 1999. 13(4): p. 792-6.
38. Child, F., et al., How should airways resistance be measured in young children: mask or mouth-piece? Eur Respir J, 2001. 17(6): p. 1244-9.
39. Hadjikoumi, I., A. Hassan, and A.D. Milner, Effects of respiratory timing and cheek support on resistance measurements, before and after bronchodilation in asthmatic children using the inter-rupter technique. Pediatr Pulmonol, 2003. 36(6): p. 495-501.
Study Design and Representativeness 39
40. Phagoo, S.B., N.M. Wilson, and M. Silverman, Evaluation of the interrupter technique for measur-ing change in airway resistance in 5-year-old asthmatic children. Pediatr Pulmonol, 1995. 20(6): p. 387-95.
41. Beydon, N., et al., Pre/postbronchodilator interrupter resistance values in healthy young children. Am J Respir Crit Care Med, 2002. 165(10): p. 1388-94.
42. Merkus, P.J., et al., Measurements of interrupter resistance: reference values for children 3-13 yrs of age. Eur Respir J, 2002. 20(4): p. 907-11.
43. Lombardi, E., et al., Reference values of interrupter respiratory resistance in healthy preschool white children. Thorax, 2001. 56(9): p. 691-5.
44. McKenzie, S.A., et al., Airway resistance measured by the interrupter technique: normative data for 2-10 year olds of three ethnicities. Arch Dis Child, 2002. 87(3): p. 248-51.
45. Sheppard, J.J. and R. Hochman, Dysphagic disorders in a large residential setting. 1988, Washing-ton, D.C.: Paper presented at the 112th Annual Meeting of the American Association on Mental Retardation.
46. Benninga, M.A., W.P. Voskuijl, and J.A. Taminiau, Childhood constipation: is there new light in the tunnel? J Pediatr Gastroenterol Nutr, 2004. 39(5): p. 448-64.
47. Gerver, W.J. and R. de Bruin, Body composition in children based on anthropometric data. A presentation of normal values. Eur J Pediatr, 1996. 155(10): p. 870-6.
48. NIH Consensus statement. Bioelectrical impedance analysis in body composition measurement. National Institutes of Health Technology Assessment Conference Statement. December 12-14, 1994. Nutrition, 1996. 12(11-12): p. 749-62.
49. A standardized protocol for the methodology of esophageal pH monitoring and interpretation of the data for the diagnosis of gastroesophageal reflux. Working Group of the European Society of Pediatric Gastroenterology and Nutrition. J Pediatr Gastroenterol Nutr, 1992. 14(4): p. 467-71.
50. Pehl, C., et al., pH probe positioning for 24-hour pH-metry by manometry or pH step-up. Eur J Gastroenterol Hepatol, 2004. 16(4): p. 375-82.
51. Klauser, A.G., N.E. Schindlbeck, and S.A. Muller-Lissner, Esophageal 24-h pH monitoring: is prior manometry necessary for correct positioning of the electrode? Am J Gastroenterol, 1990. 85(11): p. 1463-7.
52. Evenhuis, H., et al., Obstacles in large-scale epidemiological assessment of sensory impairments in a Dutch population with intellectual disabilities. J Intellect Disabil Res, 2004. 48(Pt 8): p. 708-18.
53. Loughlin, G.M. and M.A. Lefton-Greif, Dysfunctional swallowing and respiratory disease in chil-dren. Adv Pediatr, 1994. 41: p. 135-62.
54. Sheikh, S., et al., Chronic aspiration without gastroesophageal reflux as a cause of chronic respira-tory symptoms in neurologically normal infants. Chest, 2001. 120(4): p. 1190-5.
55. Evans, P.M. and E. Alberman, Certified cause of death in children and young adults with cerebral palsy. Arch Dis Child, 1991. 66(3): p. 325-9.
56. Maudsley, G., J.L. Hutton, and P.O. Pharoah, Cause of death in cerebral palsy: a descriptive study. Arch Dis Child, 1999. 81(5): p. 390-4.

Chapter 3
Feasibility of Bioelectrical Impedance Analysis in
Children with Severe Generalized Cerebral Palsy
R. Veugelers, C. Penning, M.E. van Gulik, D. Tibboel,
H.M. Evenhuis
Nutrition 2006;22(1):16-22.
42
Cha
pte
r 3
ABSTRACT
Objective The need is high for an accurate and easy to perform test to evaluate
the nutritional state of children with a severe generalized cerebral palsy, defined
as both a severe motor handicap and intellectual disability. For that purpose,
we determined the feasibility of bioelectrical impedance analysis (BIA) in these
children and evaluated their nutritional state.
Methods BIA recordings were done in 35 children with a severe generalized
cerebral palsy using a single-frequency BIA device. In addition, arm span and
body weight were determined. Components of feasibility were whether the chil-
dren tolerated the recording, felt comfortable and whether the recording could
be performed in a reproducible way (prescribed body position, stable Rz and Xc
values). All recordings were performed at specialized children’s daycare centres
or schools.
Results One child (3%) did not tolerate the recording, while most (71%) of the 34
remaining children felt comfortable. The majority of the children (74%) could be
placed in the prescribed position, but stability of Rz values was low. Stability of Rz
values was positively influenced by older age, a quiet location for the recording,
feeling comfortable and a low number of people in the room. For 29 children, we
were able to calculate values for total body water and fat-free mass. Compared to
age-matched reference values, these values were significantly reduced in all age
groups.
Conclusions The present pilot study has demonstrated that the BIA recording
is a feasible nutritional assessment method in children with severe generalized
cerebral palsy. Since the test procedure was well tolerated by most children, its
value for use in this specific population deserves further investigation.
Feasibility of BIA 43
INTRODUCTION
In children with a severe generalized cerebral palsy and intellectual disability
(CP) comorbidity is high. The etiology of CP may differ considerably: underlying
disorders are for example chromosomal defects, cerebral hemorrhage, infantile
encephalopathy or metabolic disorders. In these children, feeding difficulties,
such as gastro-oesophageal reflux (GER) and dysphagia, are frequently observed.
The prevalence of gastro-ooesophageal reflux (GER), a disorder associated with
vomiting and food refusal 1, varies from 61 to 96 percent 2-5, while dysphagia, a
disorder of neurological origin that limits food intake, has been observed in 19
to 38 percent 6,7 of these children. Other disorders limiting food intake are hyper-
sensitivity of the oropharynx 8 and poor appetite 9, which might be enhanced by
chronic constipation 10,11. These feeding difficulties, in combination with an altered
energy metabolism, might lead to problems with the nutritional state. Indeed, the
prevalence of malnutrition in these children is high: when comparing their results
of nutritional assessment tests to reference values for school children or values
obtained from a control group of non-handicapped children, approximately 40%
of children with severe generalized CP are undernourished 12-15. Since malnutrition
has a profound negative effect on health and quality of life, early diagnosis of
malnutrition in these children is desirable.
Several methods are available for evaluation of the nutritional state. However,
sophisticated methods such as the deuterium dilution technique or dual energy
x-ray absorptiometry (DEXA) are not applicable for routine evaluation of the nu-
tritional state, since such methods are very expensive or only available in special-
ized hospitals. In addition, the value of methods that are commonly applied by
pediatricians or outside the hospital, such as anthropometry, remains unclear and
the results have to be interpreted with caution. Due to contractures and scoliosis
for example, standing height can often not be measured in a reliable way and
therefore the use of alternative measures, such as lower leg length, has been
recommended for this population 16. In addition, most children with CP suffer
from growth retardation 17,18, thereby limiting the use of growth charts that include
weight or height for age. Furthermore, the value of skin fold measurements might
be limited in these children, due to a different distribution of subcutaneous fat 19,20.
As a result, professionals involved in the medical care for these children, such as
intellectual disability physicians, pediatricians, pediatric surgeons and dietitians,
are in need of an easy to perform and accurate technique to monitor the nutri-
tional state and evaluate the effect of surgical procedures such as gastrostomy or
antireflux surgery.

44
Cha
pte
r 3
Compared to the deuterium dilution technique, bioelectrical impedance analysis
(BIA) is a valid 21,22 method to determine the nutritional state in non-handicapped
children. This inexpensive, quick and non-invasive method determines aspects
of body composition, such as fat-free mass and total body water, by measur-
ing its reactance and resistance 23. In clinical practice, the determination of body
composition is an accepted measure for theinvestigation of growth in children and
adolescents irrespective of their standing height and is an alternative for the use
of growth charts 24. The BIA equipment is portable and can easily be connected
to the body. Furthermore, BIA has a low intra- and interobserver variability 25. The
value of BIA in children with severe generalized CP has not been investigated
in detail yet: a previous study suggested that BIA is a useful technique in this
population 26, but the number of children in that study was limited (n=13) and
feasibility data had not been recorded. During a BIA recording, patients should be
in a supine position with their arms and legs abducted from the body. Since these
children cannot be instructed, often have contractures of the limbs and some are
very uncomfortable when lying on their back, a study of the technical feasibility
of BIA in these children would be useful.
Thus, the main objective of the present pilot study was to investigate the
feasibility of BIA in a representative subset of children with severe generalized CP
and also, if possible, to evaluate their nutritional state.
MATERIALS AND METHODS
Subjects
This study is a part of a large-scale epidemiological study investigating the preva-
lence and risk factors of recurrent lower respiratory tract infections and malnutrition
in 200 children with severe generalized CP. Inclusion criteria for that study were
a moderate to profound intellectual disability (IQ < 55), a severe motor handicap
(hyper- or hypotonic generalized cerebral palsy or a severe motor developmental
delay), corresponding with the functional levels 4 or 5 on theGross Motor Func-
tional Classification Scale (GMFCS) 27, and age between 2-18 years. There were
no specific exclusion criteria. Verbal communication with these children is very
limited due to their disabilities. In order to obtain a representative study popula-
tion, children were not selected through hospitals. Instead, since 95% of these
children visit a specialized children’s daycare centre or school, we selected the
cohort through 54 participating daycare centres and schools in the western and
middle part of the Netherlands. Informed consent was obtained from the parents
of each child. The first 35 children for whom informed consent was obtained, par-
Feasibility of BIA 45
ticipated in the present feasibility pilot. This sample was a representative subset
of the cohort, since general characteristics such as mean age, gender, standing
height and weight were similar between these children and the total cohort (data
not shown). The Dutch Central Committee on Research Involving Human Subjects
had approved the study protocol.
BIA
All BIA recordings 28 were performed once in each child at the daycare centres
or schools. First, body temperature was recorded using an ear thermometer (IRT
3020, Braun GmbH, Kronberg, Germany) in order to exclude children with fever,
since fever influences the impedance of the body 29. Then, we determined body
weight and a measure for standing height. Kyphosis and scoliosis are common
in children with severe generalized CP 30 and therefore we decided to measure
arm span instead of standing height. While sitting, the child’s arms were gently
stretched and positioned so that the arms had a 90º angle to the trunk. Then the
distance between the tips of both middle fingers was determined using a flex-
ible tape measure. Body weight was determined using a portable digital weight
plateau (096200, Lopital Nederland B.V., Oisterwijk, The Netherlands), suitable for
wheelchair placement.
While in the supine position, the child’s shoes and socks and, if present, support-
ive calf or ankle braces were removed. According to the BIA manual, we aimed
to keep the children in a resting supine position for 10 minutes before starting the
recording. During that period, four electrodes (LecTec resting electrodes, LecTec
corporation, Minnetonka, USA) were attached to the child’s wrist and ankle on one
side of the body and connected to a tetrapolar single-frequency BIA-device with
a three-digit display (STA/BIA Soft Tissue Analyzer, Akern Bioresearch, Florence,
Italy) and a maximum measurable value for Rz (resistance) of 999 Ω. The child
was then gently put into the prescribed position, with its arms and legs stretched
and 30º abducted from the trunk 31. If necessary, the investigator fixed the limbs
during the recording using a flannel blanket.
Components of feasibility were: 1) whether the children tolerated the recording
and felt comfortable, 2) accuracy and effects of the child’s body position during
the recording, and 3) stability of the Rz and Xc values.
The number of people in the room during the measurement and the location
(classroom or separate room) were logged. Since these children are unable to
communicate verbally, the investigator carefully observed the children during the
46
Cha
pte
r 3
recording for signs of emotional stress, such as protest behavior, fear or crying, to
estimate whether they felt comfortable. A child was supposedly uncomfortable if it
showed signs of emotional stress, such as protest behavior, fear or crying. In order
to prevent interobserver variability of the subjective feasibility data, all children
were observed by the same person. In addition, we recorded whether the children
were in the correct position during the recording.
During the recording, the most stable values for Rz and Xc (reactance) were
logged. Since a previous study had reported fluctuating Rz and Xc values in this
population 26, we measured the duration of stability of Rz and Xc values and
subdivided them into 3 categories: stable for over 5 sec, 2-5 sec or less than 2
sec. Since fluctuations of Rz and Xc influence the outcome of the recording, we
considered this a relatively important aspect of feasibility.
Demographic factors and comorbidity (presence of spasticity and/or hypoto-
nia, age and sex) were logged from the medical records, in order to determine
their influence on feasibility.
Analysis and statistics
Arm span was converted to standing height according to the graph “arm span
for standing height” for Dutch children 32. Body mass index (BMI) was calculated
by dividing weight in kilograms by height in meters squared. Total body water
(TBW) and fat-free mass (FFM) were calculated according to the cross-validated
equations of Horlick 33:
TBW = 0.725 + 0.475 H2/ Rz + 0.140 W
FFM = (3.474 + 0.459 H2/ Rz + 0.064 W) / (0.769 – 0.009 A – 0.016 S)
Whereas H is standing height (cm), Rz is resistance (Ω), W is weight (kg), A is age
(years) and S is sex (1 for males, 0 for females). Children were subdivided into age
groups 4-8 (n=16), 9-12 (n=12), 13-15 (n=3) and 16-18 years (n=3), so that group
means of TBW and FFM could be statistically compared to age-matched refer-
ence values obtained from non-handicapped American children 33 using Student’s
unpaired t-test.
In addition, we calculated percentage of body fat contributing to body weight
according to the following formula:
Body fat (%) = ((weight – FFM) / weight) * 100
Feasibility parameters were statistically compared between the children using
Pearson’s chi-square test or Student’s unpaired t-test where appropriate. The influ-
Feasibility of BIA 47
ence of age on feasibility and the relationship between BMI and body fat percent-
age were determined using linear regression analysis. Results are expressed as
mean ± SD (standard deviation). A p-value below 0.05 was considered statistically
significant.
RESULTS
Clinical characteristics of the children are listed in Table 1.
Table 1: Clinical characteristics
General Etiology Motor handicap
Total number
Mean age (years)
Gender
Mean height (cm)
Mean weight (kg)
Mean BMI (kg/m2)
n = 35
8.7 ± 4.0
19 m, 16 f
127 ± 20
26 ± 10
16.2 ± 3.1
Syndromes
Brain anomalies
Perinatal problems
Metabolic diseases
Meningitis Unknown
10 (29%)
4 (11%)
12 (34%)
5 (14%)
1 (3%)
3 (9%
Hypertonia
Hypertonia + hypotonia
Hypotonia
Unknown
11 (31%)
8 (23%)
12 (34%)
4 (12%)
Data are represented as mean ± SD. BMI = body mass index. The percentage of children is between parentheses.
Feasibility
None of the children had a body temperature ≥ 38°C. Due to motor activity, 11
children (31%) were unable to maintain a supine resting position for at least 10
minutes preceding the BIA-recording. We aimed to keep these children as long
as possible in the supine position before starting the BIA-recording. After the rest
period, the children were gently put into the prescribed position. Due to protest
behavior during positioning, the recording in one child was aborted. Nine of the
34 remaining children (26%) were in an incorrect position during the recording
due to one or more contractures of the limbs. In these children, the limbs were
gently stretched as far as possible.
We observed considerable fluctuation of the Rz and Xc values: in 16 / 34 (47%)
children values were stable for less than 2 sec, in 8 / 34 (24%) they were stable
from 2 – 5 sec and in 10 / 34 (29%) they were stable for over 5 sec. Rz showed
significantly less fluctuation if the recording was performed in a separate room
instead of in the classroom: in 73% of the recordings performed in the classroom,
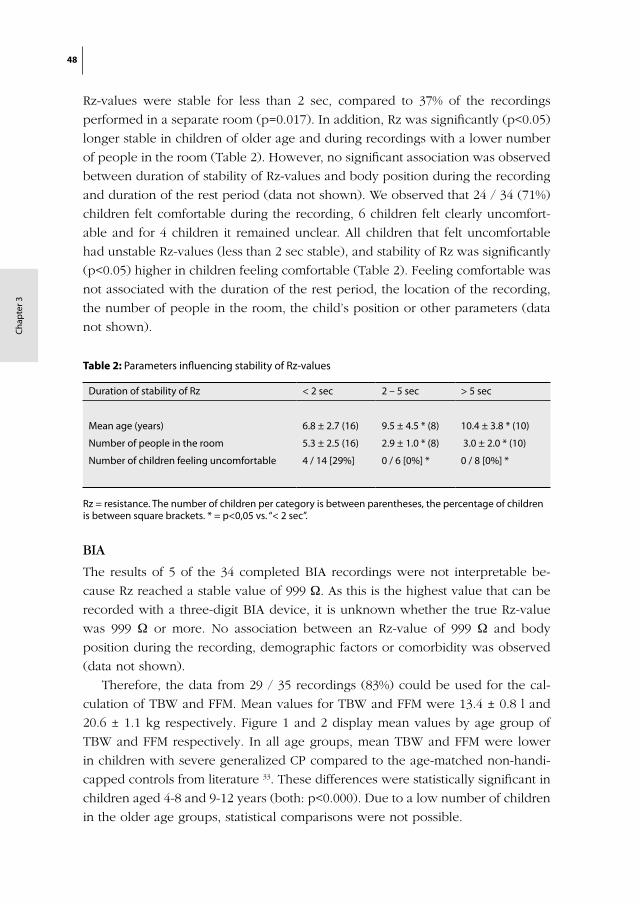
48
Cha
pte
r 3
Rz-values were stable for less than 2 sec, compared to 37% of the recordings
performed in a separate room (p=0.017). In addition, Rz was significantly (p<0.05)
longer stable in children of older age and during recordings with a lower number
of people in the room (Table 2). However, no significant association was observed
between duration of stability of Rz-values and body position during the recording
and duration of the rest period (data not shown). We observed that 24 / 34 (71%)
children felt comfortable during the recording, 6 children felt clearly uncomfort-
able and for 4 children it remained unclear. All children that felt uncomfortable
had unstable Rz-values (less than 2 sec stable), and stability of Rz was significantly
(p<0.05) higher in children feeling comfortable (Table 2). Feeling comfortable was
not associated with the duration of the rest period, the location of the recording,
the number of people in the room, the child’s position or other parameters (data
not shown).
Table 2: Parameters influencing stability of Rz-values
Duration of stability of Rz < 2 sec 2 – 5 sec > 5 sec
Mean age (years) 6.8 ± 2.7 (16) 9.5 ± 4.5 * (8) 10.4 ± 3.8 * (10)
Number of people in the room 5.3 ± 2.5 (16) 2.9 ± 1.0 * (8) 3.0 ± 2.0 * (10)
Number of children feeling uncomfortable 4 / 14 [29%] 0 / 6 [0%] * 0 / 8 [0%] *
Rz = resistance. The number of children per category is between parentheses, the percentage of children is between square brackets. * = p<0,05 vs. “< 2 sec”.
BIA
The results of 5 of the 34 completed BIA recordings were not interpretable be-
cause Rz reached a stable value of 999 Ω. As this is the highest value that can be
recorded with a three-digit BIA device, it is unknown whether the true Rz-value
was 999 Ω or more. No association between an Rz-value of 999 Ω and body
position during the recording, demographic factors or comorbidity was observed
(data not shown).
Therefore, the data from 29 / 35 recordings (83%) could be used for the cal-
culation of TBW and FFM. Mean values for TBW and FFM were 13.4 ± 0.8 l and
20.6 ± 1.1 kg respectively. Figure 1 and 2 display mean values by age group of
TBW and FFM respectively. In all age groups, mean TBW and FFM were lower
in children with severe generalized CP compared to the age-matched non-handi-
capped controls from literature 33. These differences were statistically significant in
children aged 4-8 and 9-12 years (both: p<0.000). Due to a low number of children
in the older age groups, statistical comparisons were not possible.
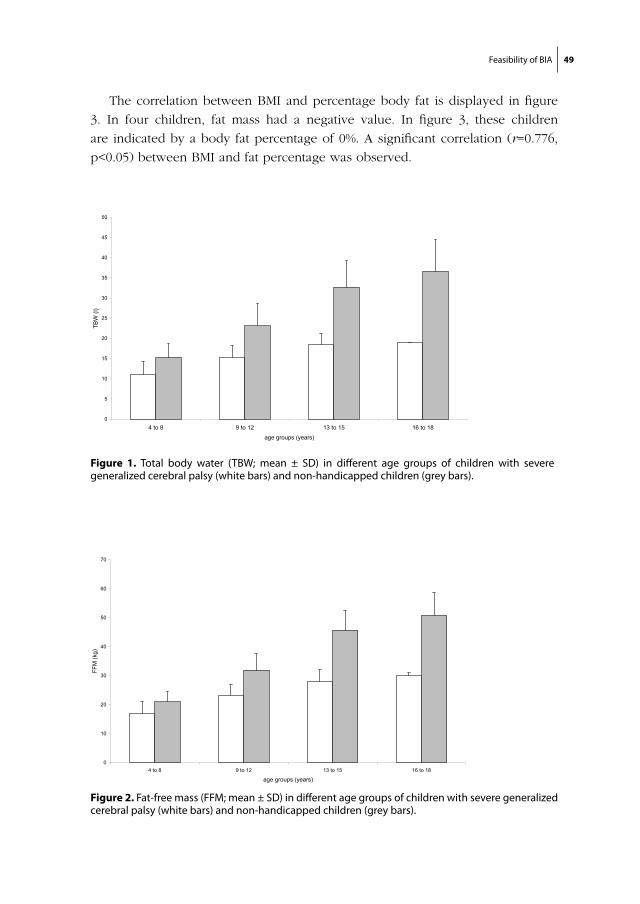
Feasibility of BIA 49
The correlation between BMI and percentage body fat is displayed in figure
3. In four children, fat mass had a negative value. In figure 3, these children
are indicated by a body fat percentage of 0%. A significant correlation (r=0.776,
p<0.05) between BMI and fat percentage was observed.
Figure 1. Total body water (TBW; mean ± SD) in different age groups of children with severe generalized cerebral palsy (white bars) and non-handicapped children (grey bars).
chapter 3/ figure 1
0
5
10
15
20
25
30
35
40
45
50
4 to 8 9 to 12 13 to 15 16 to 18
age groups (years)
TBW
(l)
Figure 2. Fat-free mass (FFM; mean ± SD) in different age groups of children with severe generalized cerebral palsy (white bars) and non-handicapped children (grey bars).
chapter 3/ figure 2:
0
10
20
30
40
50
60
70
4 to 8 9 to 12 13 to 15 16 to 18
age groups (years)
FFM
(kg)
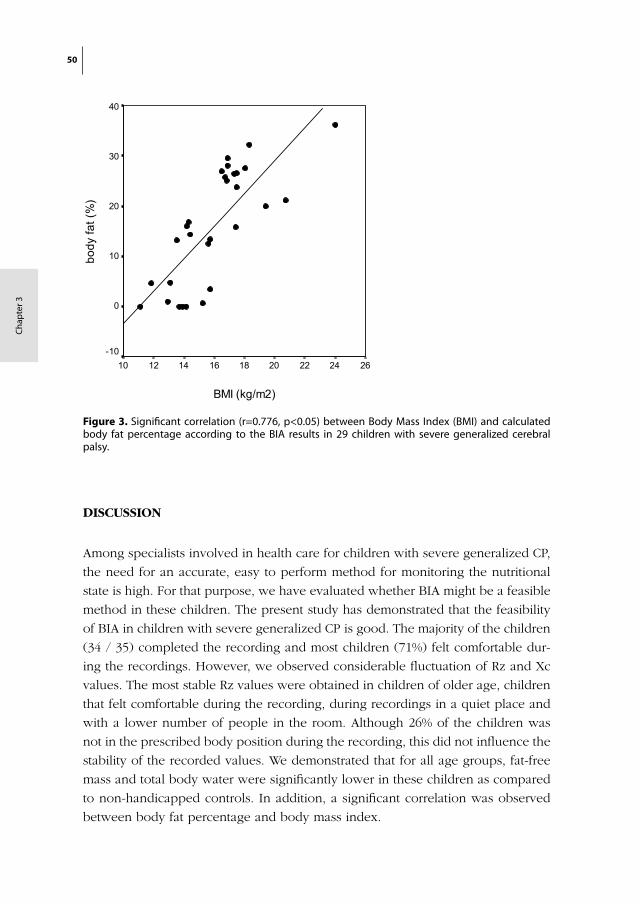
50
Cha
pte
r 3
DISCUSSION
Among specialists involved in health care for children with severe generalized CP,
the need for an accurate, easy to perform method for monitoring the nutritional
state is high. For that purpose, we have evaluated whether BIA might be a feasible
method in these children. The present study has demonstrated that the feasibility
of BIA in children with severe generalized CP is good. The majority of the children
(34 / 35) completed the recording and most children (71%) felt comfortable dur-
ing the recordings. However, we observed considerable fluctuation of Rz and Xc
values. The most stable Rz values were obtained in children of older age, children
that felt comfortable during the recording, during recordings in a quiet place and
with a lower number of people in the room. Although 26% of the children was
not in the prescribed body position during the recording, this did not influence the
stability of the recorded values. We demonstrated that for all age groups, fat-free
mass and total body water were significantly lower in these children as compared
to non-handicapped controls. In addition, a significant correlation was observed
between body fat percentage and body mass index.
Figure 3. Significant correlation (r=0.776, p<0.05) between Body Mass Index (BMI) and calculated body fat percentage according to the BIA results in 29 children with severe generalized cerebral palsy.
chapter 3/ figure 3:
BMI (kg/m2)
262422201816141210
body
fat (
%)
40
30
20
10
0
-10

Feasibility of BIA 51
Although we were able to calculate values for fat-free mass (FFM) and total body
water (TBW) for 83% of the participating children, we have to take into account
that several aspects of the present test conditions might have had a negative
influence on the reliability of these values. For example, food intake prior to the
recording might influence the recorded values of Rz and Xc 34,35. However, for
logistical purposes it was not possible in the present study to keep the children in
the fasting state. For future studies it is therefore recommended to record the time
of meal intake or, if possible, to perform the recordings under fasting conditions.
In addition, a correct body position for BIA recordings was not obtained in 26%
of the children due to contractures of the limbs. However, the influence of an
incorrect position on the outcome of the recording seems to be less pronounced,
since a previous study in these children has reported a good correlation between
BIA and the deuterium dilution technique regardless the presence of fixed con-
tractures 26. In that study, the interpretation of BIA recordings in children with
generalized CP was severely limited by the children’s continuous motor activity
and involuntary movements. As a result, fluctuation of Rz and Xc was prominent,
resulting in a high coefficient of variation in these children 26. This was confirmed
by the findings of the present study, as only in 29% of all children Rz values
were stable for over 5 sec. Rz values were most stable in children of older age
and in children feeling comfortable. In order to increase stability of these values,
performing the test in a quiet room with a low number of people in the room
should be considered. Due to the lack of a validated prediction equation for this
specific population, it is not yet possible to determine the clinical implications of
fluctuating Rz and Xc values. However, it has been reported that the reproduc-
ibility of BIA recordings can be augmented by performing repeated measurements
of Rz and Xc during a period of 10 minutes 36-38. Therefore we advise to measure
Rz and Xc for at least three times in order to reduce the negative influence of
instable values in this population. In addition, we recommend the use of a 4-digit
BIA device for this group, since in 12% of the recordings Rz reached a stable value
of 999 Ω. Thus, with the present equipment it was unsure whether Rz had a real
value of 999 Ω or higher. Increased resistance values have also been observed in
patients with myotonic dystrophy 39, in dehydrated patients and in patients with a
reduced lean body mass 40. The clinical significance of the high resistance values
in children with generalized CP has to be investigated in more detail. Finally, since
we demonstrated that a supine period shorter than the 10 minutes recommended
by the manual did not influence the outcome of the recordings, this rest period
might be omitted in future studies since for some of these children an obliged
supine period is uncomfortable. The additional value of the supine period preced-
ing the recording has also been questioned by others 41.
52
Cha
pte
r 3
Thus, BIA recordings in children with generalized CP should be performed in a
quiet place with a low number of people in the room, while efforts should be
made to make the child feel comfortable. In addition, it should be considered
to perform the recording under fasting conditions if possible. Furthermore, we
recommend repeated measurements of Rz and Xc and also the use of a 4-digit
device.
We are well aware that a feasibility study is only the first step in the evalua-
tion process of applicability of BIA in this handicapped population. In order to
determine the nutritional status of children with generalized CP using BIA, several
additional aspects, apart from test validity, have to be determined. It is well known
that the growth pattern of children with generalized CP is often disturbed 42: in
combination with long-term immobility this might be the cause of a different
body composition. A previous study reported an increased internal fat deposit
and a different distribution of subcutaneous fat in these children 20. In addition,
resting energy expenditure seems to be reduced 26,43. As a consequence, the avail-
able prediction equations 44 and reference values for non-handicapped children
may not apply to this special group. This is illustrated by the finding of negative
values of percentage body fat in 4 children. The present study has demonstrated
reduced values for TBW and FFM in children with generalized CP compared to
non-handicapped children, but there is no clinical implication to this finding yet,
since these values might even be normal for these children. First, objective criteria
for malnutrition in these children have to be established by performing a large-
scale comparative study comparing several methods for nutritional assessment,
including the deuterium dilution technique 45. When comparing the outcome of
the BIA recordings to those of the deuterium dilution technique, a specific, vali-
dated BIA prediction equation may be developed for these children. After that, test
reproducibility should be evaluated with the help of precision studies to determine
whether in this population, BIA can be used at the individual or at the group level.
Since the BIA recording was well tolerated by the majority of the studied children,
further research into its clinical value in this special group is justified.

Feasibility of BIA 53
REFERENCES
1. Field D, Garland M, Williams K. Correlates of specific childhood feeding problems. J Paediatr Child Health 2003;39:299-304.
2. Böhmer CJ, Niezen-de Boer MC, Klinkenberg-Knol EC, et al. The prevalence of gastroesopha-geal reflux disease in institutionalized intellectually disabled individuals. Am J Gastroenterol 1999;94:804-10.
3. Gustafsson PM, Tibbling L. Gastro-oesophageal reflux and oesophageal dysfunction in children and adolescents with brain damage. Acta Paediatr 1994;83:1081-5.
4. Reyes AL, Cash AJ, Green SH, Booth IW. Gastro-oesophageal reflux in children with cerebral palsy. Child Care Health Dev 1993;19:109-18.
5. Gangil A, Patwari AK, Bajaj P, Kashyap R, Anand VK. Gastroesophageal reflux disease in children with cerebral palsy. Indian Pediatr 2001;38:766-70.
6. Waterman ET, Koltai PJ, Downey JC, Cacace AT. Swallowing disorders in a population of children with cerebral palsy. Int J Pediatr Otorhinolaryngol 1992;24:63-71.
7. Reilly S, Skuse D, Poblete X. Prevalence of feeding problems and oral motor dysfunction in children with cerebral palsy: a community survey. J Pediatr 1996;129:877-82.
8. Reid JA, King PL, Kilpatrick NM. Desensitization of the gag reflex in an adult with cerebral palsy: a case report. Spec Care Dentist 2000;20:56-60.
9. Thommessen M, Heiberg A, Kase BF, Larsen S, Riis G. Feeding problems, height and weight in different groups of disabled children. Acta Paediatr Scand 1991;80:527-33.
10. Böhmer CJM, Taminiau JA, Klinkenberg-Knol EC, Meuwissen SG. The prevalence of constipation in institutionalized people with intellectual disability. J Intellect Disabil Res 2001;45:212-8.
11. Sullivan PB. Gastrointestinal problems in the neurologically impaired child. Baillieres Clin Gastro-enterol 1997;11:529-46.
12. Sanchez-Lastres J, Eiris-Punal J, Otero-Cepeda JL, Pavon-Belinchon P, Castro-Gago M. Nutritional status of mentally retarded children in north-west Spain. I. Anthropometric indicators. Acta Paediatr 2003;92:747-53.
13. Sanchez-Lastres J, Eiris-Punal J, Otero-Cepeda JL, Pavon-Belinchon P, Castro-Gago M. Nutritional status of mentally retarded children in northwest spain: II. Biochemical indicators. Acta Paediatr 2003;92:928-34.
14. Sullivan PB, Lambert B, Rose M, et al. Prevalence and severity of feeding and nutritional prob-lems in children with neurological impairment: Oxford Feeding Study. Dev Med Child Neurol 2000;42:674-80.
15. Dahl M, Thommessen M, Rasmussen M, Selberg T. Feeding and nutritional characteristics in chil-dren with moderate or severe cerebral palsy. Acta Paediatr 1996;85:697-701.
16. Spender QW, Cronk CE, Charney EB, Stallings VA. Assessment of linear growth of children with cerebral palsy: use of alternative measures to height or length. Dev Med Child Neurol 1989;31:206-14.
17. Samson-Fang L, Stevenson RD. Linear growth velocity in children with cerebral palsy. Dev Med Child Neurol 1998;40:689-92.
18. Stevenson RD, Hayes RP, Cater LV, Blackman JA. Clinical correlates of linear growth in children with cerebral palsy. Dev Med Child Neurol 1994;36:135-42.
19. Spender QW, Cronk CE, Stallings VA, Hediger ML. Fat distribution in children with cerebral palsy. Ann Hum Biol 1988;15:191-6.
54
Cha
pte
r 3
20. Berg-Emons RJvd, Baak MAv, Westerterp KR. Are skinfold measurements suitable to compare body fat between children with spastic cerebral palsy and healthy controls? Dev Med Child Neurol 1998;40:335-9.
21. Leman CR, Adeyemo AA, Schoeller DA, Cooper RS, Luke A. Body composition of children in south-western Nigeria: validation of bio-electrical impedance analysis. Ann Trop Paediatr 2003;23:61-7.
22. Wabitsch M, Braun U, Heinze E, et al. Body composition in 5-18-y-old obese children and ado-lescents before and after weight reduction as assessed by deuterium dilution and bioelectrical impedance analysis. Am J Clin Nutr 1996;64:1-6.
23. Kyle UG, Piccoli A, Pichard C. Body composition measurements: interpretation finally made easy for clinical use. Curr Opin Clin Nutr Metab Care 2003;6:387-93.
24. Sakate T. Relationship between body composition of school children and their growth. Ann Physiol Anthropol 1984;3:142-3.
25. Gregory JW, Greene SA, Scrimgeour CM, Rennie MJ. Body water measurement in growth disorders: a comparison of bioelectrical impedance and skinfold thickness techniques with isotope dilution. Arch Dis Child 1991;66:220-2.
26. Azcue MP, Zello GA, Levy LD, Pencharz PB. Energy expenditure and body composition in children with spastic quadriplegic cerebral palsy. J Pediatr 1996;129:870-6.
27. Palisano R, Rosenbaum P, Walter S, et al. Development and reliability of a system to classify gross motor function in children with cerebral palsy. Dev Med Child Neurol 1997;39:214-23.
28. Bioelectrical impedance analysis in body composition measurement. NIH Technol Assess State-ment 1994 Dec 12-14; 1-35. Nutrition 1996;12:749-62.
29. Di Iorio BR, Terracciano V, Bellizzi V. Bioelectrical impedance measurement: errors and artifacts. J Ren Nutr 1999;9:192-7.
30. Saito N, Ebara S, Ohotsuka K, Kumeta H, Takaoka K. Natural history of scoliosis in spastic cerebral palsy. Lancet 1998;351:1687-92.
31. Nakadomo F, Watanabe K, Nakajima T, Shinya H, Tanaka K. Factors affecting the measurement of bioelectrical impedance - with special reference to limb position. Bull Osaka Pref Coll of Nurs 1993;15:9-13.
32. Gerver WJM, de Bruin R. Paediatric Morphometrics. Utrecht: Wetenschappelijke uitgeverij Bunge, 1996.
33. Horlick M, Arpadi SM, Bethel J, et al. Bioelectrical impedance analysis models for prediction of total body water and fat-free mass in healthy and HIV-infected children and adolescents. Am J Clin Nutr 2002;76:991-9.
34. Gallagher M, Walker KZ, O’Dea K. The influence of a breakfast meal on the assessment of body composition using bioelectrical impedance. Eur J Clin Nutr 1998;52:94-7.
35. Gualdi-Russo E, Toselli S. Influence of various factors on the measurement of multifrequency bioimpedance. Homo 2002;53:1-16.
36. Lukaski HC, Johnson PE, Bolonchuk WW, Lykken GI. Assessment of fat-free mass using bioelectri-cal impedance measurements of the human body. Am J Clin Nutr 1985;41:810-7.
37. Deurenberg P, Weststrate JA, Paymans I, van der Kooy K. Factors affecting bioelectrical impedance measurements in humans. Eur J Clin Nutr 1988;42:1017-22.
38. Kushner RF, Schoeller DA. Estimation of total body water by bioelectrical impedance analysis. Am J Clin Nutr 1986;44:417-24.

Feasibility of BIA 55
39. Johansson A, Andrew R, Forsberg H, et al. Glucocorticoid metabolism and adrenocortical reactivity to ACTH in myotonic dystrophy. J Clin Endocrinol Metab 2001;86:4276-83.
40. Arkouche W, Fouque D, Pachiaudi C, et al. Total body water and body composition in chronic peritoneal dialysis patients. J Am Soc Nephrol 1997;8:1906-14.
41. Demura S, Yamaji S, Goshi F, Nagasawa Y. The influence of posture change on measurements of relative body fat in the bioimpedance analysis method. J Physiol Anthropol Appl Human Sci 2001;20:29-35.
42. Krick J, Murphy-Miller P, Zeger S, Wright E. Pattern of growth in children with cerebral palsy. J Am Diet Assoc 1996;96:680-5.
43. Stallings VA, Zemel BS, Davies JC, Cronk CE, Charney EB. Energy expenditure of children and adolescents with severe disabilities: a cerebral palsy model. Am J Clin Nutr 1996;64:627-34.
44. Kyle UG, Bosaeus I, De Lorenzo AD, et al. Bioelectrical impedance analysis-part I: review of principles and methods. Clin Nutr 2004;23:1226-43.
45. Hills AP, Leyell L, Byrne NM. An evaluation of the methodology for the assessment of body composition in children and adolescents. Med Sport Sci 2001;44:1-13.

Chapter 4
Should we use Criteria or Eyeballing to reject Post-
Interruption Tracings?
R. Veugelers, C. Penning, S.P.J. Grootscholten, P.J.F.M. Merkus,
H.G.M. Arets, R. Rieken, J.E. Brussee, M. Jilderda-Janssen,
D.Tibboel, H.M. Evenhuis
Pediatr Pulmonol. 2006 Oct;41(10):937-46
58
Cha
pte
r 4
ABSTRACT
Objective During the analysis of interrupter resistance (Rint)-measurements, most
authors reject post-interruption tracings based on the shape of the pressure-time
and flow-time curves. However, objective criteria for rejection are lacking. We
aimed to formulate explicit rejection criteria that correspond to eyeballing the
curve pattern (daily practice), in order to simplify the analysis. Inter-observer
agreement within and between both methods was studied.
Methods Results obtained with the developed rejection criteria were compared to
those of current practice (eyeballing) using 54 measurements (807 interruptions)
of children with severe neurological impairment.
Results Inter-observer agreement on rejection was similar using the criteria or
eyeballing (85.6% versus 82.8%). Using the criteria, more individual interrup-
tions were rejected (43.4% versus 29.8% using eyeballing), while discarding total
measurements (<5 remaining interruptions) was similar (9.2% versus 7.4% using
eyeballing). Results using only the criteria for pressure-time curves were compa-
rable to eyeballing. Outcome values were comparable between any of the used
rejection methods and not rejecting at all.
Discussion In this first detailed study on rejection of post-interruption tracings,
explicit rejection criteria were developed. None of the rejection methods influ-
enced the outcome value relevantly. However, rejection criteria can contribute to
the standardisation of the Rint technique and simplify decision-making in daily
practice.
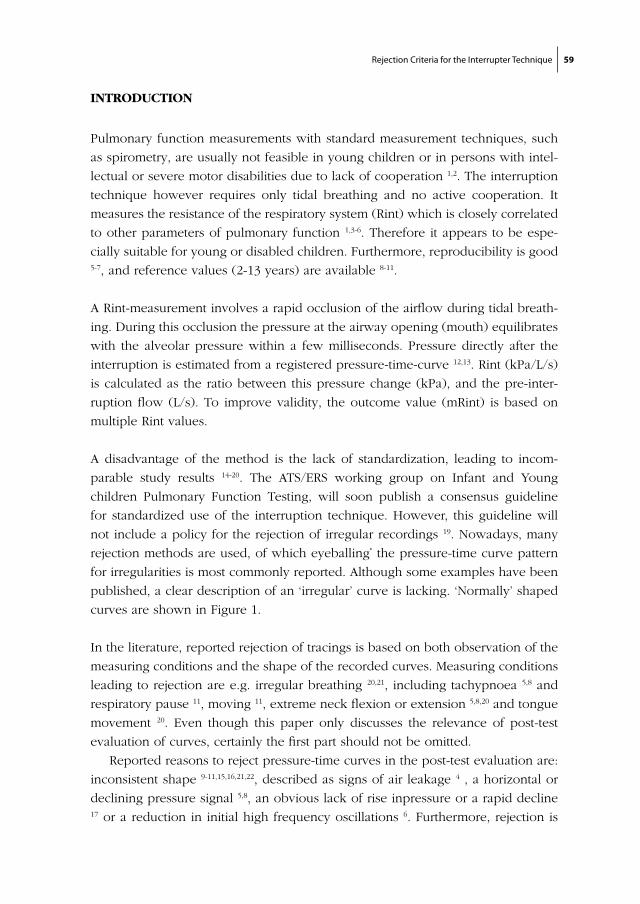
Rejection Criteria for the Interrupter Technique 59
INTRODUCTION
Pulmonary function measurements with standard measurement techniques, such
as spirometry, are usually not feasible in young children or in persons with intel-
lectual or severe motor disabilities due to lack of cooperation 1,2. The interruption
technique however requires only tidal breathing and no active cooperation. It
measures the resistance of the respiratory system (Rint) which is closely correlated
to other parameters of pulmonary function 1,3-6. Therefore it appears to be espe-
cially suitable for young or disabled children. Furthermore, reproducibility is good 5-7, and reference values (2-13 years) are available 8-11.
A Rint-measurement involves a rapid occlusion of the airflow during tidal breath-
ing. During this occlusion the pressure at the airway opening (mouth) equilibrates
with the alveolar pressure within a few milliseconds. Pressure directly after the
interruption is estimated from a registered pressure-time-curve 12,13. Rint (kPa/L/s)
is calculated as the ratio between this pressure change (kPa), and the pre-inter-
ruption flow (L/s). To improve validity, the outcome value (mRint) is based on
multiple Rint values.
A disadvantage of the method is the lack of standardization, leading to incom-
parable study results 14-20. The ATS/ERS working group on Infant and Young
children Pulmonary Function Testing, will soon publish a consensus guideline
for standardized use of the interruption technique. However, this guideline will
not include a policy for the rejection of irregular recordings 19. Nowadays, many
rejection methods are used, of which eyeballing* the pressure-time curve pattern
for irregularities is most commonly reported. Although some examples have been
published, a clear description of an ‘irregular’ curve is lacking. ‘Normally’ shaped
curves are shown in Figure 1.
In the literature, reported rejection of tracings is based on both observation of the
measuring conditions and the shape of the recorded curves. Measuring conditions
leading to rejection are e.g. irregular breathing 20,21, including tachypnoea 5,8 and
respiratory pause 11, moving 11, extreme neck flexion or extension 5,8,20 and tongue
movement 20. Even though this paper only discusses the relevance of post-test
evaluation of curves, certainly the first part should not be omitted.
Reported reasons to reject pressure-time curves in the post-test evaluation are:
inconsistent shape 9-11,15,16,21,22, described as signs of air leakage 4 , a horizontal or
declining pressure signal 5,8, an obvious lack of rise inpressure or a rapid decline 17 or a reduction in initial high frequency oscillations 6. Furthermore, rejection is
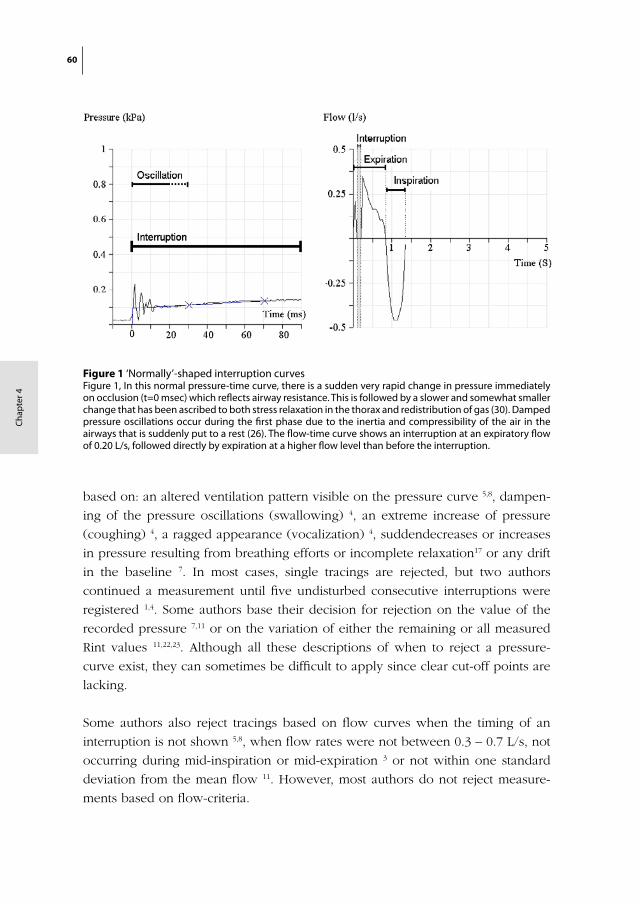
60
Cha
pte
r 4
based on: an altered ventilation pattern visible on the pressure curve 5,8, dampen-
ing of the pressure oscillations (swallowing) 4, an extreme increase of pressure
(coughing) 4, a ragged appearance (vocalization) 4, suddendecreases or increases
in pressure resulting from breathing efforts or incomplete relaxation17 or any drift
in the baseline 7. In most cases, single tracings are rejected, but two authors
continued a measurement until five undisturbed consecutive interruptions were
registered 1,4. Some authors base their decision for rejection on the value of the
recorded pressure 7,11 or on the variation of either the remaining or all measured
Rint values 11,22,23. Although all these descriptions of when to reject a pressure-
curve exist, they can sometimes be difficult to apply since clear cut-off points are
lacking.
Some authors also reject tracings based on flow curves when the timing of an
interruption is not shown 5,8, when flow rates were not between 0.3 – 0.7 L/s, not
occurring during mid-inspiration or mid-expiration 3 or not within one standard
deviation from the mean flow 11. However, most authors do not reject measure-
ments based on flow-criteria.
chapter 4/ figure 1:
Figure 1 ‘Normally’-shaped interruption curvesFigure 1, In this normal pressure-time curve, there is a sudden very rapid change in pressure immediately on occlusion (t=0 msec) which reflects airway resistance. This is followed by a slower and somewhat smaller change that has been ascribed to both stress relaxation in the thorax and redistribution of gas (30). Damped pressure oscillations occur during the first phase due to the inertia and compressibility of the air in the airways that is suddenly put to a rest (26). The flow-time curve shows an interruption at an expiratory flow of 0.20 L/s, followed directly by expiration at a higher flow level than before the interruption.
Rejection Criteria for the Interrupter Technique 61
To our experience, it is difficult to evaluate measurements without the use of
explicit criteria, especially in difficult-to-test groups in which measurements show
a large variety of shapes. We therefore aimed to formulate explicit rejection crite-
ria, but in such a way, that the results correspond to the current daily practice of
eyeballing the curve pattern. Therewith, evaluation should become easier due to
clear cut-off points between normal and abnormal, especially in slightly irregular
curves which are difficult to evaluate.
Our research aims were: (1) To formulate explicit rejection criteria based on the
existing eyeballing method (2) To compare inter-observer agreement between
rejection using explicit criteria and the eyeballing technique (3) To assess the
agreement rate between the formulated rejection criteria and eyeballing (4) To
evaluate the effect of the rejection methods on the outcome value (median Rint
(mRint)). We hypothesize that explicit rejection criteria improve inter-observer
agreement without significantly affecting the mean outcome value, as compared
to the commonly used eyeballing technique.
This study was performed children with severe generalized cerebral palsy. This
population was considered favourable for the development and evaluation of
rejection criteria because, to our experience, interrupter resistance curves of these
children show a large variety of shapes. These shapes vary from ‘normally’ shaped
to large irregularities corresponding to obvious measurement errors. However,
since no reference data and reproducibility studies are available, results are pre-
sented on a group level only.
METHODS
Dataset
This study was part of a large-scale evaluation of pulmonary function in a popula-
tion-based sample of children with severe generalized cerebral palsy 24, for which
ethical approval was obtained from the Dutch ethical committee (Central Com-
mittee on Research Involving Human Subjects). Directly after the interrupter mea-
surements, the investigators subjectively labelled the measurements based on the
behaviour of the child during the measurement as “easy to perform”, “acceptable”
or “most likely failed”. Of the first category, 27 measurements were randomly
selected and form Set 1. Set 2 consists of 27 randomly selected measurements (405
interruptions) from the “acceptable” category. The measurement data of these 54

62
Cha
pte
r 4
Table 1 Criteria for rejecting pressure-time curves
Decline criterion After t = 30 msec, the pressure curve shows no continuing increase of pressure (exception: a horizontal end phase).
Characteristic for a leakage of air.
- reject when the slope is negative at any time interval after t=30 msec. (appendix 1: example 1 and 4)
- reject when the curve is horizontal starting at t= 30 msec and onward (appendix 1: example 2)
- Note: if the pressure curve only ends with a horizontal phase, do not reject.
- also reject if the slope is only negative after t= 70 msec (example 3)
- also reject if the slope is negative at or after t=30 due to prolonged oscillation.
Fluctuation criterion After t = 30 msec, the curve shows a fluctuation ≥ 0.05 kPa around the regression line of the curve.
Characteristic for vocalisation. The airway resistance is likely to be increased due to using of the vocal cords, and measurement errors are likely to occur.
- reject when a fluctuation ≥ 0.05 kPa around the regression line of the curve
- at any time point after t=30 msec
- Note: the regression line should be used, not the line drawn for back-extrapolation
Hollow-criterion After the period of oscillation, pressure shows a growing increase resulting in a hollow curve.
A normal curve shows an gradually lowering increase in the second phase due to stress relaxation in the thorax and redistribution of gas
- reject when the curve shows a increasing slope,
- Note, this is easily seen since the pressure-line is then visible under the extrapolation line.
- at any time interval after t=30 msec
- also if this only occurs after t= 70 msec (appendix 1: example 2)
Rejection Criteria for the Interrupter Technique 63
children were used to formulate rejection criteria for post-interruption pressure-
time and flow-time curves and to estimate inter-observer agreement.
Measurement protocol
The interruption measurements were performed on-site (day care or specialized
school), to prevent anxiety and distress. Similar to Arets et al. and Merkus et
al. 5,8, Rint measurements were performed during the expiratory phase of tidal
breathing using a commercially available, ambulatory device (MicroRint, v 1.113,
Micromedical, UK). The trigger method was random with a continuous operating
mode while cheek support was applied. The device automatically rejects indi-
vidual interruptions if an apparent artifact on the pressure curve occurs (Rint=0,00,
Pt=30
> Pt=70
, Pt=30
or Pt=70
> measuring range). Back-extrapolation to t = 15 ms after
shutter closure (100 ms) is used to calculate Rint. Children were abstained from
anti-asthmatic medication during 8 hours prior to the measurement.
A fitting non-compliant facemask (Intersurgical, Uden, The Netherlands) that
covers the nose and mouth was used, because these children are unable to close
their lips intentionally around a mouthpiece. We aimed to record 15 separate
tracings per measurement with a trigger level of 0.20 L/s. Measurements were
imported into the RIDA software (Micro Medical Ltd, RintBase 5, version 1.002 for
Windows 2002). The median value of at least 5 interruptions was used as outcome
value (mRint).
Maximum-criterion Pressure values at t + 30 ms and/or t + 70 ms exceed the range of registration.
The measurement points are needed for a correct back-extrapolation.
- reject if the pressure at t=30 and/or at t=70 msec exceeds the maximum range of registration
Empty No registration of pressure.
If no pressure is registered the device will set the Rint value at 0,00 kPa/L/s.
- reject when no pressure curve is registered
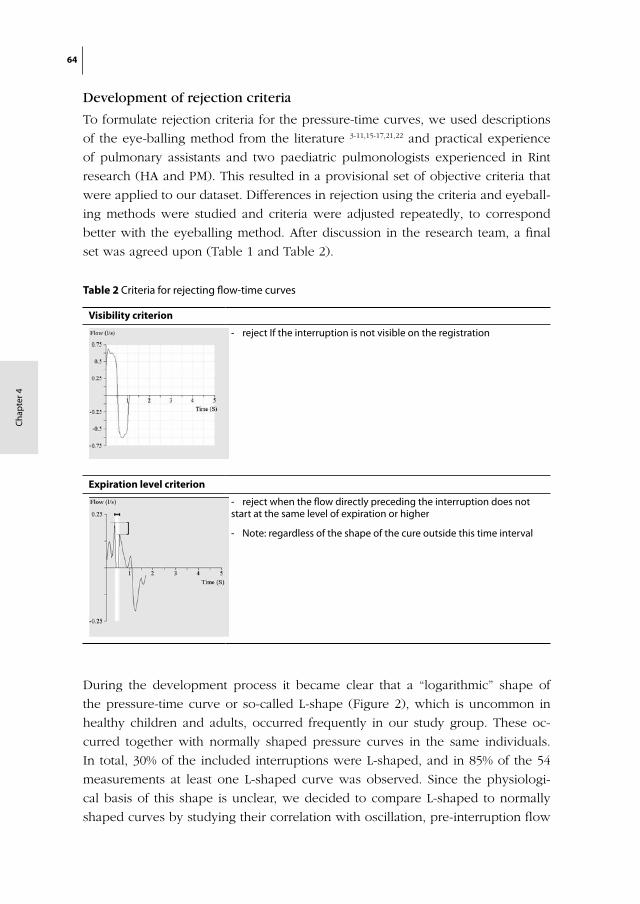
64
Cha
pte
r 4
Development of rejection criteria
To formulate rejection criteria for the pressure-time curves, we used descriptions
of the eye-balling method from the literature 3-11,15-17,21,22 and practical experience
of pulmonary assistants and two paediatric pulmonologists experienced in Rint
research (HA and PM). This resulted in a provisional set of objective criteria that
were applied to our dataset. Differences in rejection using the criteria and eyeball-
ing methods were studied and criteria were adjusted repeatedly, to correspond
better with the eyeballing method. After discussion in the research team, a final
set was agreed upon (Table 1 and Table 2).
During the development process it became clear that a “logarithmic” shape of
the pressure-time curve or so-called L-shape (Figure 2), which is uncommon in
healthy children and adults, occurred frequently in our study group. These oc-
curred together with normally shaped pressure curves in the same individuals.
In total, 30% of the included interruptions were L-shaped, and in 85% of the 54
measurements at least one L-shaped curve was observed. Since the physiologi-
cal basis of this shape is unclear, we decided to compare L-shaped to normally
shaped curves by studying their correlation with oscillation, pre-interruption flow
Table 2 Criteria for rejecting flow-time curves
Visibility criterion
- reject If the interruption is not visible on the registration
Expiration level criterion
- reject when the flow directly preceding the interruption does not start at the same level of expiration or higher
- Note: regardless of the shape of the cure outside this time interval
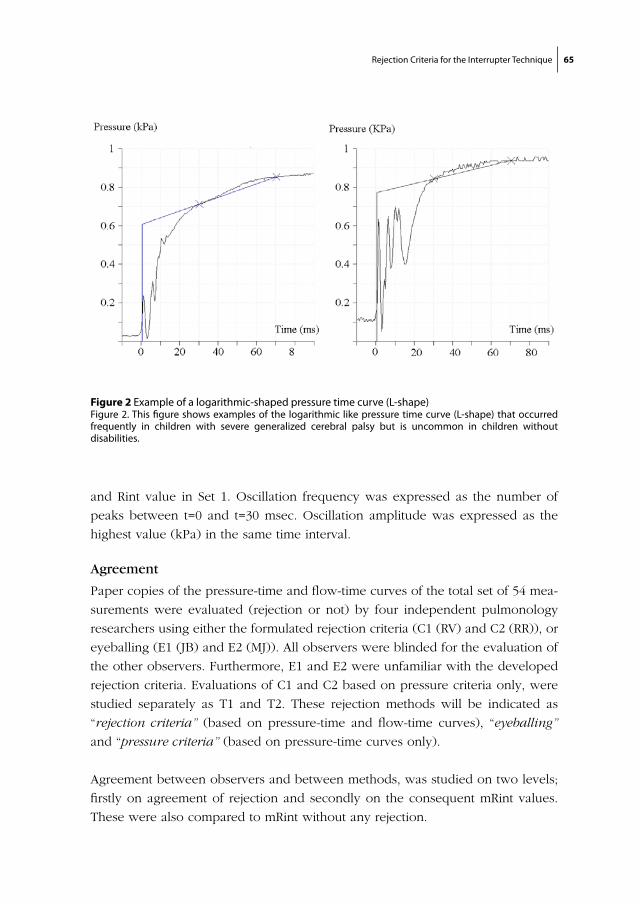
Rejection Criteria for the Interrupter Technique 65
and Rint value in Set 1. Oscillation frequency was expressed as the number of
peaks between t=0 and t=30 msec. Oscillation amplitude was expressed as the
highest value (kPa) in the same time interval.
Agreement
Paper copies of the pressure-time and flow-time curves of the total set of 54 mea-
surements were evaluated (rejection or not) by four independent pulmonology
researchers using either the formulated rejection criteria (C1 (RV) and C2 (RR)), or
eyeballing (E1 (JB) and E2 (MJ)). All observers were blinded for the evaluation of
the other observers. Furthermore, E1 and E2 were unfamiliar with the developed
rejection criteria. Evaluations of C1 and C2 based on pressure criteria only, were
studied separately as T1 and T2. These rejection methods will be indicated as
“rejection criteria” (based on pressure-time and flow-time curves), “eyeballing”
and “pressure criteria” (based on pressure-time curves only).
Agreement between observers and between methods, was studied on two levels;
firstly on agreement of rejection and secondly on the consequent mRint values.
These were also compared to mRint without any rejection.
Figure 2 Example of a logarithmic-shaped pressure time curve (L-shape)Figure 2. This figure shows examples of the logarithmic like pressure time curve (L-shape) that occurred frequently in children with severe generalized cerebral palsy but is uncommon in children without disabilities.
chapter 4/ figure 2:

66
Cha
pte
r 4
Sample size
Sample size was calculated for the within-method and the between-method agree-
ment (rejection criteria versus eyeballing) using Epi6 software (Epi Info version
6.04d, 2001, CDC and WHO). Assuming a Cohen’s kappa of 0.50 (0.45-0.55), we
required a sample of 400 interrupter-tracings.
Data analysis
The relations between L-shape and oscillation, flow and Rint value were tested
using the Mann-Whitney test since the normality assumption was not met. A
p-value of <0.05 was considered significant. The inter-observer agreement
within each method (rejection criteria, eyeballing and pressure criteria only)
was calculated using percentile agreement and Cohen’s Kappa (SPSS 11.0.1, SPSS
Inc. Chicago, Illinois, USA). The between-method agreement was expressed as
intraclass correlation coefficient (ICC) using a general linear model (SAS version
8.02, SAS institute inc, Cary, NC, USA) to allow two levels (observer and method).
Within each method, the differences in mRint between observers were expressed
as the median difference with 95% confidence intervals, using a 1000 replica-
tions bootstrap (Stata SE 8.2, StataCorp LP, Collage Station, USA). Only successful
measurements (> 5 remaining interruptions) were used. Differences between
the methods (rejection criteria, eyeballing and pressure criteria) were calculated
similarly, using the results of one randomly selected observer per method if
the differences between both observers within each method were negligible.
Comparisons to a situation without rejection were analysed similarly. Differences
were not expressed as Z-scores 25 to avoid comparison with reference values from
non-disabled children.
RESULTS
Patient characteristics (age, gender, height and weight) from Set 1 and 2 were
comparable (Table 3).
Rejection criteria
The developmental phase resulted in a final set of five rejection criteria for pres-
sure-curves (Table 2) and two rejection criteria for flow-curves (Table 3). The
appendices show examples of the application of these criteria during the study.
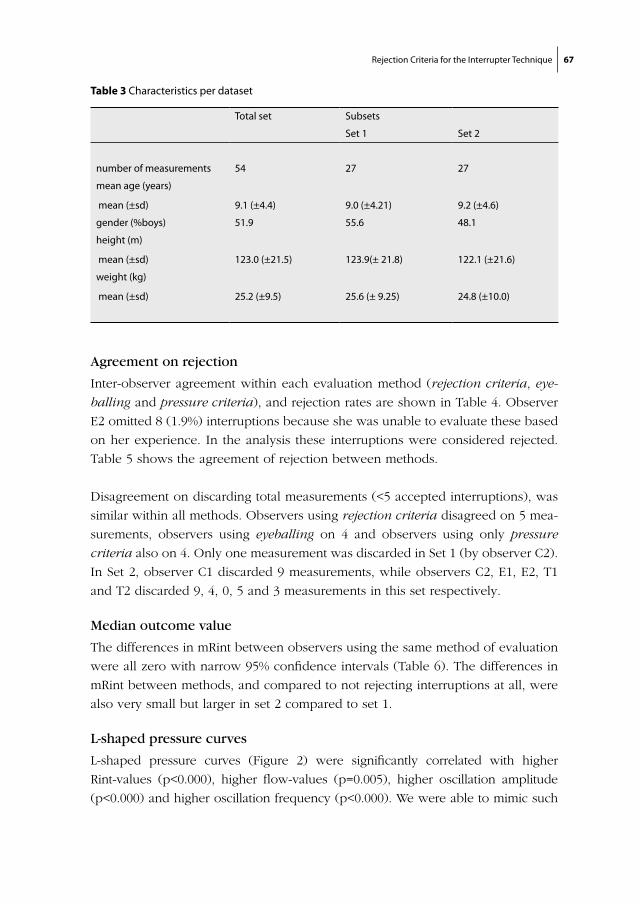
Rejection Criteria for the Interrupter Technique 67
Agreement on rejection
Inter-observer agreement within each evaluation method (rejection criteria, eye-
balling and pressure criteria), and rejection rates are shown in Table 4. Observer
E2 omitted 8 (1.9%) interruptions because she was unable to evaluate these based
on her experience. In the analysis these interruptions were considered rejected.
Table 5 shows the agreement of rejection between methods.
Disagreement on discarding total measurements (<5 accepted interruptions), was
similar within all methods. Observers using rejection criteria disagreed on 5 mea-
surements, observers using eyeballing on 4 and observers using only pressure
criteria also on 4. Only one measurement was discarded in Set 1 (by observer C2).
In Set 2, observer C1 discarded 9 measurements, while observers C2, E1, E2, T1
and T2 discarded 9, 4, 0, 5 and 3 measurements in this set respectively.
Median outcome value
The differences in mRint between observers using the same method of evaluation
were all zero with narrow 95% confidence intervals (Table 6). The differences in
mRint between methods, and compared to not rejecting interruptions at all, were
also very small but larger in set 2 compared to set 1.
L-shaped pressure curves
L-shaped pressure curves (Figure 2) were significantly correlated with higher
Rint-values (p<0.000), higher flow-values (p=0.005), higher oscillation amplitude
(p<0.000) and higher oscillation frequency (p<0.000). We were able to mimic such
Table 3 Characteristics per dataset
Total set Subsets
Set 1 Set 2
number of measurements 54 27 27
mean age (years)
mean (±sd) 9.1 (±4.4) 9.0 (±4.21) 9.2 (±4.6)
gender (%boys) 51.9 55.6 48.1
height (m)
mean (±sd) 123.0 (±21.5) 123.9(± 21.8) 122.1 (±21.6)
weight (kg)
mean (±sd) 25.2 (±9.5) 25.6 (± 9.25) 24.8 (±10.0)
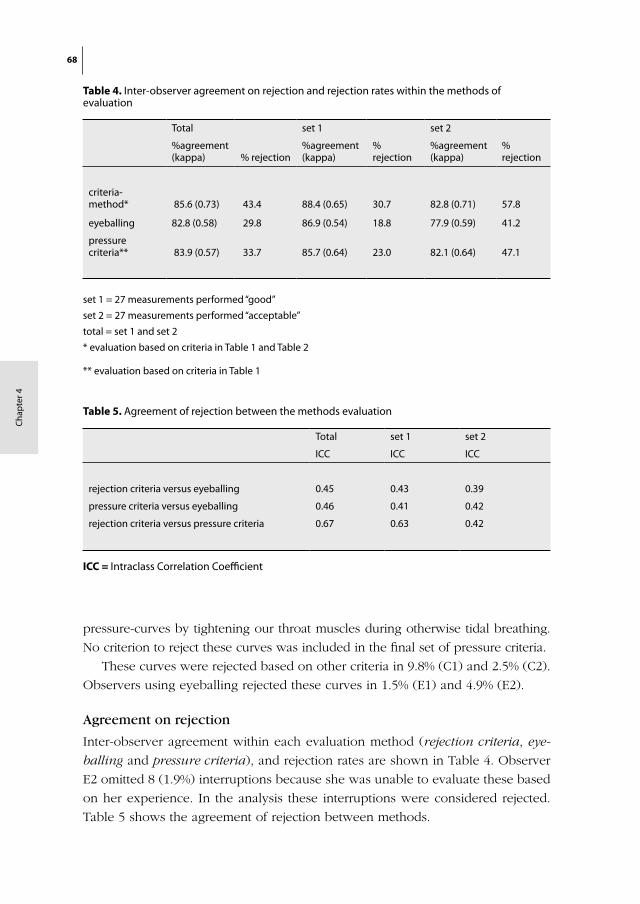
68
Cha
pte
r 4
pressure-curves by tightening our throat muscles during otherwise tidal breathing.
No criterion to reject these curves was included in the final set of pressure criteria.
These curves were rejected based on other criteria in 9.8% (C1) and 2.5% (C2).
Observers using eyeballing rejected these curves in 1.5% (E1) and 4.9% (E2).
Agreement on rejection
Inter-observer agreement within each evaluation method (rejection criteria, eye-
balling and pressure criteria), and rejection rates are shown in Table 4. Observer
E2 omitted 8 (1.9%) interruptions because she was unable to evaluate these based
on her experience. In the analysis these interruptions were considered rejected.
Table 5 shows the agreement of rejection between methods.
Table 5. Agreement of rejection between the methods evaluation
Total set 1 set 2
ICC ICC ICC
rejection criteria versus eyeballing 0.45 0.43 0.39
pressure criteria versus eyeballing 0.46 0.41 0.42
rejection criteria versus pressure criteria 0.67 0.63 0.42
ICC = Intraclass Correlation Coefficient
Table 4. Inter-observer agreement on rejection and rejection rates within the methods of evaluation
Total set 1 set 2
%agreement (kappa) % rejection
%agreement (kappa)
% rejection
%agreement (kappa)
% rejection
criteria-method* 85.6 (0.73) 43.4 88.4 (0.65) 30.7 82.8 (0.71) 57.8
eyeballing 82.8 (0.58) 29.8 86.9 (0.54) 18.8 77.9 (0.59) 41.2
pressure criteria** 83.9 (0.57) 33.7 85.7 (0.64) 23.0 82.1 (0.64) 47.1
set 1 = 27 measurements performed “good”
set 2 = 27 measurements performed “acceptable”
total = set 1 and set 2
* evaluation based on criteria in Table 1 and Table 2
** evaluation based on criteria in Table 1
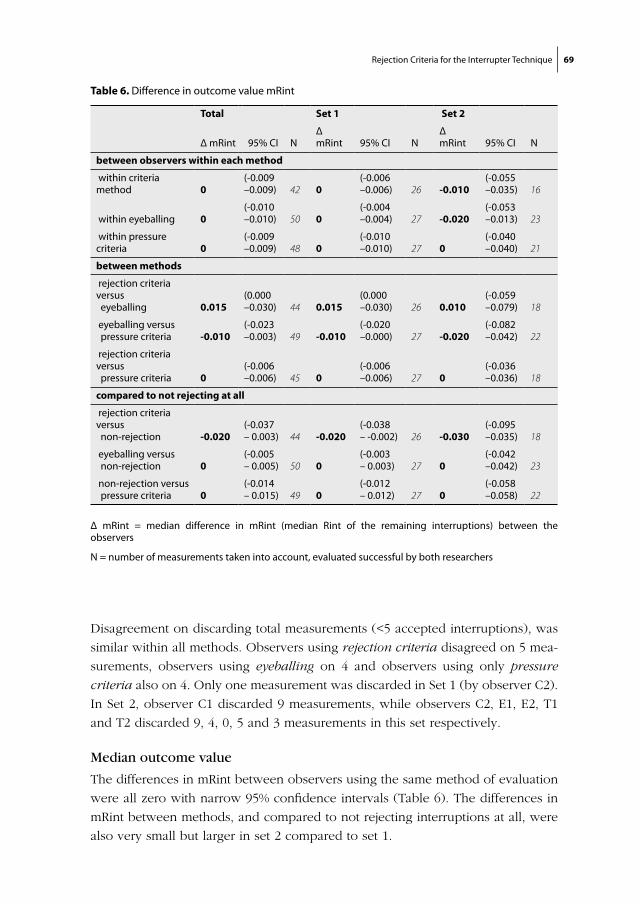
Rejection Criteria for the Interrupter Technique 69
Disagreement on discarding total measurements (<5 accepted interruptions), was
similar within all methods. Observers using rejection criteria disagreed on 5 mea-
surements, observers using eyeballing on 4 and observers using only pressure
criteria also on 4. Only one measurement was discarded in Set 1 (by observer C2).
In Set 2, observer C1 discarded 9 measurements, while observers C2, E1, E2, T1
and T2 discarded 9, 4, 0, 5 and 3 measurements in this set respectively.
Median outcome value
The differences in mRint between observers using the same method of evaluation
were all zero with narrow 95% confidence intervals (Table 6). The differences in
mRint between methods, and compared to not rejecting interruptions at all, were
also very small but larger in set 2 compared to set 1.
Total Set 1 Set 2
Δ mRint 95% CI NΔ mRint 95% CI N
Δ mRint 95% CI N
between observers within each method
within criteria method 0
(-0.009 –0.009) 42 0
(-0.006 –0.006) 26 -0.010
(-0.055 –0.035) 16
within eyeballing 0(-0.010 –0.010) 50 0
(-0.004 –0.004) 27 -0.020
(-0.053 –0.013) 23
within pressure criteria 0
(-0.009 –0.009) 48 0
(-0.010 –0.010) 27 0
(-0.040 –0.040) 21
between methods
rejection criteria versus eyeballing 0.015
(0.000 –0.030) 44 0.015
(0.000 –0.030) 26 0.010
(-0.059 –0.079) 18
eyeballing versus pressure criteria -0.010
(-0.023 –0.003) 49 -0.010
(-0.020 –0.000) 27 -0.020
(-0.082 –0.042) 22
rejection criteria versus pressure criteria 0
(-0.006 –0.006) 45 0
(-0.006 –0.006) 27 0
(-0.036 –0.036) 18
compared to not rejecting at all
rejection criteria versus non-rejection -0.020
(-0.037 – 0.003) 44 -0.020
(-0.038 – -0.002) 26 -0.030
(-0.095 –0.035) 18
eyeballing versus non-rejection 0
(-0.005 – 0.005) 50 0
(-0.003 – 0.003) 27 0
(-0.042 –0.042) 23
non-rejection versus pressure criteria 0
(-0.014 – 0.015) 49 0
(-0.012 – 0.012) 27 0
(-0.058 –0.058) 22
Δ mRint = median difference in mRint (median Rint of the remaining interruptions) between the observers
N = number of measurements taken into account, evaluated successful by both researchers
Table 6. Difference in outcome value mRint
70
Cha
pte
r 4
L-shaped pressure curves
L-shaped pressure curves (Figure 2) were significantly correlated with higher
Rint-values (p<0.000), higher flow-values (p=0.005), higher oscillation amplitude
(p<0.000) and higher oscillation frequency (p<0.000). We were able to mimic such
pressure-curves by tightening our throat muscles during otherwise tidal breath-
ing. No criterion to reject these curves was included in the final set of pressure
criteria.
These curves were rejected based on other criteria in 9.8% (C1) and 2.5% (C2).
Observers using eyeballing rejected these curves in 1.5% (E1) and 4.9% (E2).
DISCUSSION
This is the first detailed report on rejection of interrupter resistance measurements
based on post-interruption curve patterns. We developed a valid set of rejection
criteria based on the current standard of eyeballing the curve-pattern. In contrast
to our hypothesis, application of these explicit rejection criteria versus eyeballing
did not improve inter-observer agreement. Similar outcomes were found, although
the rejection percentage of tracings was higher using these rejection criteria.
When only the pressure criteria were applied, the rejection percentage and the
inter-observer agreement were comparable to the eyeballing method. As was
hypothesised, similar Rint values were obtained using either one of the methods.
All methods had the same inter-observer agreement on discarding unsuccessful
measurements. A remarkable finding was that rejecting curves using either one
of the rejection methods, had no real effect on the value of mRint. Although this
implies that one could do without rejecting any interruptions (as long as at least 5
interruptions per measurement are obtained), this is not the case. Measurements
consisting of mostly incorrect interruptions should be rejected based on common
sense. Although this study was performed in a disabled population, results should
be applicable to a non-disabled population, since the outcome is likely to be more
favourable in such a population. However, this study does not provide data to
confirm this.
For this study, measurements of children with severe generalized cerebral palsy
were used, which show more irregularities than those of non-disabled children.
Possible explanations include limb or tongue movement or non-optimal posture
as well as intrinsic factors such as involuntary changes in muscle tone, or shifting
of mucus. In these children, this is more likely to occur to a measurable extent.
However, until the corresponding effects on shape and mRint can be explained
Rejection Criteria for the Interrupter Technique 71
in more detail, consensus should be reached on which shapes are considered
acceptable and which are not.
The formulated pressure-criteria
In the developed criteria, cut-off points were chosen for both physiological and
practical reasons. In the ‘decline-criterion’ the difference between a horizontal
line due to leakage and a normal horizontal end phase needed to be defined. We
chose “from t=30 ms and onward” because it was easy to judge since this point
was marked for back-extrapolation. For the ‘fluctuation-criterion’ we defined
a maximal fluctuation based on current practice in our clinic, without further
physiological arguments. For the ‘hollow-criterion’ we chose “hollow to any
extent” for practical reasons. Other options e.g. ‘curve degree within a certain
time frame’ would be harder to work with and lacks physiological arguments
as well.
Clear criteria should also define the time interval for each criterion. For these
three criteria ‘any time interval after t=30 ms’ was set, except for a horizontal end
phase. This is based on the assumption that any irregularity after the last point for
back-extrapolation (t=70 ms) could have started earlier and therewith could have
affected the course of the pressure curve.
The formulated flow criteria
Rejection rates were more comparable between eyeballing and the pressure cri-
teria, than between eyeballing and the total set of rejection criteria. This can be
explained by the fact that rejection of measurements based on flow-criteria only
plays a minor role in the literature and therefore in daily practice (eyeballing). The
‘expiration-level-criterion’ is based on the assumption that during interruption,
pressure on the shutter increases because the air supply continues undiminish-
edly. After opening, the airflow should be at least as fast or faster than before
the interruption. This can also be seen in the flow-tracings of Mead 13. Reduced
airflow after interruption may be explained by leakage. In our dataset 46.0% of
the interruptions rejected by the ‘expiration level criterion’ are also rejected on
the ‘decline criterion’. Of the total set of interruptions, 20.5% were rejected by the
“decline criterion”, which confirms this assumption.
L-shape
The pressure change after interruption depends on compliance, resistance and
inertia of the thoraco-pulmonary system 26, but evidence to explain the L-shape
is lacking. L-shape was significantly correlated with higher values of Rint, flow,
72
Cha
pte
r 4
oscillation amplitude and frequency. The correlation with high Rint values does
not explain the fast equilibration into a plateau-phase, since in asthmatic patients
with severe obstruction a plateau is often not established 27. Higher oscillation
amplitude might be explained by the increase in kinetic energy with higher flow
values. However, in Frey’s mechanical model, oscillatory pattern is not influenced
by flow or compliance 26. Increased oscillation frequency can occur due to de-
creased thoracic gas volume 26, or low upper airway compliance 28. The closest
resemblance of the L-shape we found in the literature, is the curve of infants
measured in supine position with interruption duration of 500 ms published by
Hall 17. We hypothesize that an L-shape in our population might result from a tem-
porary increased resistance in the upper airway (mouth to pharynx), due to e.g.
abnormal muscle tone or increased sputum retention. In our opinion, L-shaped
pressure curves should not be rejected because these are presumably not due
to measurement error but caused by a true varying resistance of the respiratory
system. If this is true, the contribution of the peripheral airways to mRint is smaller
in measurements with several L-shaped curves, and will consequently be less
sensitive to peripheral airway problems.
Agreement statistics
In this study a face-mask was used in stead of a mouthpiece. However, scientific
data on how this affects the pressure-time and flow-time curves is lacking. Al-
though the use of a face-mask has not influenced inter-observer agreement, an
effect on the difference in median outcome value can not be ruled out. However,
the small effect on the total Rint of rejecting tracings in general leads us to believe
that this overall effect might be small.
We base our statement on inter-observer agreement (acceptable within all evalu-
ated methods) on the percentile agreement rather than on Cohen’s kappa value.
Cohen’s kappa statistic adjusts the agreement based on the proportion of rejec-
tions, to adjust for agreement based on chance alone 29. This was less suitable,
since rejection rates were different when evaluating the same measurements.
The ICC also is less suitable to compare the rejection methods, since it is
based on the individual interruption values and therefore the within-measurement
variability is incorporated in this outcome value. As a result, ICC values were
relatively low.
Effect of rejection on mRint
We found a striking lack of effect on mRint of all rejection methods, as compared
to not rejecting at all. The median difference between results using the formulated
rejection criteria and eyeballing was 0.015 (0.000, 0.030) kPa/L/s. This implies
Rejection Criteria for the Interrupter Technique 73
a 95% certainty that the real difference in mRint between these methods, is at
most 0.030 kPa/L/s. Considering the large within-measurement variation of this
technique, this difference is negligible.
In conclusion
We have developed an accurate set of rejection criteria that can support deci-
sion-making in the evaluation process of the post-interruption tracings. Although
it only slightly improves inter-observer agreement and the effects of rejection
on mRint are minimal in general, this set provides support for the evaluation of
measurements that are difficult to judge and for investigators with little experi-
ence. This set of criteria can be applied in any Rint measurement regardless of the
population under study.
To compare feasibility in a certain population with published studies, one
should realize that the rejection rate using these criteria is higher. One could
consider using only the pressure criteria since this corresponds nicely to the cur-
rent eyeballing standards, although the flow criteria are based on physiological
considerations.
In general, authors should make rejections in a reproducible way and should
always describe the used method in detail. These criteria provide a clear method
to establish this.
74
Cha
pte
r 4
REFERENCES
1. Bisgaard, H. and B. Klug, Lung function measurement in awake young children. Eur Respir J, 1995. 8(12): p. 2067-75.
2. Crenesse, D., et al., Spirometry in children aged 3 to 5 years: reliability of forced expiratory maneuvers. Pediatr Pulmonol, 2001. 32(1): p. 56-61.
3. Carter, E.R., et al., Evaluation of the interrupter technique for the use of assessing airway obstruc-tion in children. Pediatr Pulmonol, 1994. 17(4): p. 211-7.
4. Klug, B. and H. Bisgaard, Measurement of lung function in awake 2-4-year-old asthmatic children during methacholine challenge and acute asthma: a comparison of the impulse oscillation tech-nique, the interrupter technique, and transcutaneous measurement of oxygen versus whole-body plethysmography. Pediatr Pulmonol, 1996. 21(5): p. 290-300.
5. Arets, H.G., H.J. Brackel, and C.K. van der Ent, Applicability of interrupter resistance measure-ments using the MicroRint in daily practice. Respir Med, 2003. 97(4): p. 366-74.
6. Chowienczyk, P.J., et al., A flow interruption device for measurement of airway resistance. Eur Respir J, 1991. 4(5): p. 623-8.
7. Phagoo, S.B., N.M. Wilson, and M. Silverman, Evaluation of a new interrupter device for measuring bronchial responsiveness and the response to bronchodilator in 3 year old children. Eur Respir J, 1996. 9(7): p. 1374-80.
8. Merkus, P.J., et al., Measurements of interrupter resistance: reference values for children 3-13 yrs of age. Eur Respir J, 2002. 20(4): p. 907-11.
9. Lombardi, E., et al., Reference values of interrupter respiratory resistance in healthy preschool white children. Thorax, 2001. 56(9): p. 691-5.
10. McKenzie, S.A., et al., Airway resistance measured by the interrupter technique: normative data for 2-10 year olds of three ethnicities. Arch Dis Child, 2002. 87(3): p. 248-51.
11. Beydon, N., et al., Pre/postbronchodilator interrupter resistance values in healthy young children. Am J Respir Crit Care Med, 2002. 165(10): p. 1388-94.
12. Jackson, A.C., H.T. Milhorn, Jr., and J.R. Norman, A reevaluation of the interrupter technique for airway resistance measurement. J Appl Physiol, 1974. 36(2): p. 264-8.
13. Mead, J. and J.L. Whittenberger, Evaluation of airway interruption technique as a method for measuring pulmonary airflow resistance. J Appl Physiol, 1954. 6(7): p. 408-16.
14. Hadjikoumi, I., A. Hassan, and A.D. Milner, Effects of respiratory timing and cheek support on resistance measurements, before and after bronchodilation in asthmatic children using the inter-rupter technique. Pediatr Pulmonol, 2003. 36(6): p. 495-501.
15. Pao, C.S., M.J. Healy, and S.A. McKenzie, Airway resistance by the interrupter technique: which algorithm for measuring pressure? Pediatr Pulmonol, 2004. 37(1): p. 31-6.
16. Child, F., et al., How should airways resistance be measured in young children: mask or mouth-piece? Eur Respir J, 2001. 17(6): p. 1244-9.
17. Hall, G.L., et al., Evaluation of the interrupter technique in healthy, unsedated infants. Eur Respir J, 2001. 18(6): p. 982-8.
18. Bridge, P.D. and S.A. McKenzie, Airway resistance measured by the interrupter technique: expira-tion or inspiration, mean or median? Eur Respir J, 2001. 17(3): p. 495-8.
19. Carter, E.R., It is time to consider standardizing the interrupter technique. Eur Respir J, 1997. 10(6): p. 1428-9.
Rejection Criteria for the Interrupter Technique 75
20. Sly, P.D. and E. Lombardi, Measurement of lung function in preschool children using the inter-rupter technique. Thorax, 2003. 58(9): p. 742-4.
21. Bridge, P.D., S. Ranganathan, and S.A. McKenzie, Measurement of airway resistance using the interrupter technique in preschool children in the ambulatory setting. Eur Respir J, 1999. 13(4): p. 792-6.
22. Klug, B., K.G. Nielsen, and H. Bisgaard, Observer variability of lung function measurements in 2-6-yr-old children. Eur Respir J, 2000. 16(3): p. 472-5.
23. Chan, E.Y., et al., Repeatability of airway resistance measurements made using the interrupter technique. Thorax, 2003. 58(4): p. 344-7.
24. Veugelers, R., et al., A population-based nested case control study on recurrent pneumonias in children with severe generalized cerebral palsy: ethical considerations of the design and represen-tativeness of the study sample. BMC Pediatr, 2005. 5(1): p. 25.
25. Gappa, M., S.C. Ranganathan, and J. Stocks, Lung function testing in infants with cystic fibrosis: lessons from the past and future directions. Pediatr Pulmonol, 2001. 32(3): p. 228-45.
26. Frey, U., A. Schibler, and R. Kraemer, The interrupter technique--a renaissance of a non-invasive approach for lung function testing in infants and children. Agents Actions Suppl, 1993. 40: p. 64-72.
27. Frey, U. and R. Kraemer, Interrelationship between postocclusional oscillatory pressure transients and standard lung function in healthy and asthmatic children. Pediatr Pulmonol, 1995. 19(6): p. 379-88.
28. Bates, J.H., et al., The effect of a proximal compliance on interrupter measurements of resistance. Respir Physiol, 1987. 70(3): p. 301-12.
29. Cohen, J., A coefficient of agreement for nominal scales. Educational and Psychological Measure-ment, 1960. 20: p. 37– 46.
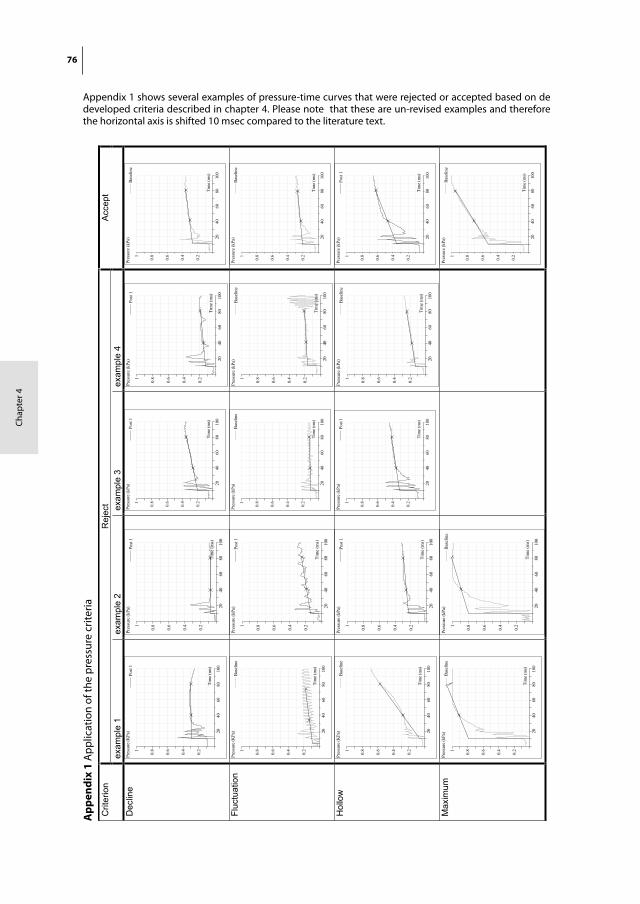
76
Cha
pte
r 4
Ap
pen
dix
1 A
pp
licat
ion
of th
e p
ress
ure
crite
riach
apte
r 4/ a
ppen
dix
1:R
ejec
tC
riter
ion
exam
ple
1 ex
ampl
e 2
exam
ple
3 ex
ampl
e 4
Acce
pt
Dec
line
2040
6080
100
0.2
0.4
0.6
0.81
Pres
sure
(KPa
)
Tim
e (m
s)
Post
1
2040
6080
100
0.2
0.4
0.6
0.81
Pres
sure
(kPa
)
Tim
e (m
s)
Post
1
2040
6080
100
0.2
0.4
0.6
0.81
Pres
sure
(kPa
)
Tim
e (m
s)
Post
1
2040
6080
100
0.2
0.4
0.6
0.81
Pres
sure
(kPa
)
Tim
e (m
s)
Post
1
2040
6080
100
0.2
0.4
0.6
0.81
Pres
sure
(kPa
)
Tim
e (m
s)
Base
line
Fluc
tuat
ion
2040
6080
100
0.2
0.4
0.6
0.81
Pres
sure
(KPa
)
Tim
e (m
s)
Base
line
2040
6080
100
0.2
0.4
0.6
0.81
Pres
sure
(kPa
)
Tim
e (m
s)
Post
1
2040
6080
100
0.2
0.4
0.6
0.81
Pres
sure
(kPa
)
Tim
e (m
s)
Base
line
2040
6080
100
0.2
0.4
0.6
0.81
Pres
sure
(kPa
)
Tim
e (m
s)
Base
line
2040
6080
100
0.2
0.4
0.6
0.81
Pres
sure
(kPa
)
Tim
e (m
s)
Base
line
Hol
low
2040
6080
100
0.2
0.4
0.6
0.81
Pres
sure
(KPa
)
Tim
e (m
s)
Base
line
2040
6080
100
0.2
0.4
0.6
0.81
Pres
sure
(kPa
)
Tim
e (m
s)
Post
1
2040
6080
100
0.2
0.4
0.6
0.81
Pres
sure
(kPa
)
Tim
e (m
s)
Post
1
2040
6080
100
0.2
0.4
0.6
0.81
Pres
sure
(kPa
)
Tim
e (m
s)
Base
line
2040
6080
100
0.2
0.4
0.6
0.81
Pres
sure
(kPa
)
Tim
e (m
s)
Post
1
Max
imum
2040
6080
100
0.2
0.4
0.6
0.81
Pres
sure
(kPa
)
Tim
e (m
s)
Base
line
2040
6080
100
0.2
0.4
0.6
0.81
Pres
sure
(kPa
)
Tim
e (m
s)
Base
line
2040
6080
100
0.2
0.4
0.6
0.81
Pres
sure
(kPa
)
Tim
e (m
s)
Base
line
Appendix 1 shows several examples of pressure-time curves that were rejected or accepted based on de developed criteria described in chapter 4. Please note that these are un-revised examples and therefore the horizontal axis is shifted 10 msec compared to the literature text.
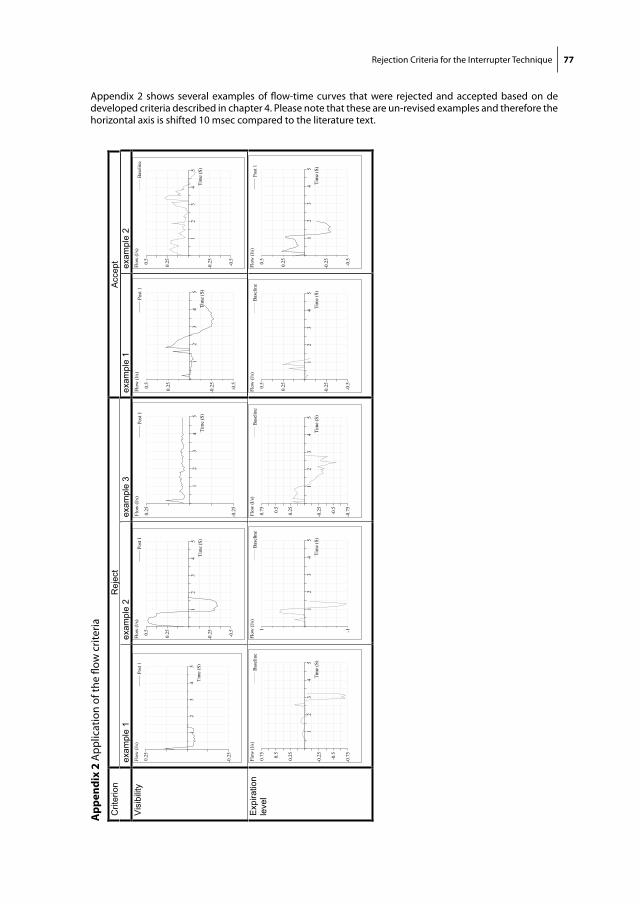
Rejection Criteria for the Interrupter Technique 77
chap
ter 4
/ app
endi
x 2:
Rej
ect
Acce
ptC
riter
ion
exam
ple
1 ex
ampl
e 2
exam
ple
3 ex
ampl
e 1
exam
ple
2 V
isib
ility
12
34
5
0.25
-0.2
5
Flow
(l/s
)
Tim
e (S
)
Post
1
12
34
5
0.250.5
-0.2
5
-0.5
Flow
(l/s)
Tim
e (S
)
Post
1
12
34
5
0.25
-0.2
5
Flow
(l/s)
Tim
e (S
)
Post
1
12
34
5
0.250.5
-0.2
5
-0.5
Flow
(l/s)
Tim
e (S
)
Post
1
12
34
5
0.250.5
-0.2
5
-0.5
Flow
(l/s)
Tim
e (S
)
Base
line
Exp
iratio
nle
vel
12
34
5
0.250.5
0.75
-0. 2
5
-0. 5
-0. 7
5
Flow
(l/s)
Tim
e ( S
)
Base
line
12
34
5
1 -1
Flow
(l/s)
Tim
e (S
)
Base
line
12
34
5
0.250.5
0.75
-0.2
5
-0. 5
-0.7
5
Flow
(l/s)
Tim
e (S
)
Base
line
12
34
5
0.250.5
-0. 2
5
-0.5
Flow
(l/s)
Tim
e ( S
)
Base
line
12
34
5
0.250.5
-0. 2
5
-0.5
Flow
(l/s)
Tim
e ( S
)
Post
1
Ap
pen
dix
2 A
pp
licat
ion
of th
e flo
w c
riter
iaAppendix 2 shows several examples of flow-time curves that were rejected and accepted based on de developed criteria described in chapter 4. Please note that these are un-revised examples and therefore the horizontal axis is shifted 10 msec compared to the literature text.

Chapter 5
Feasibility and Outcome of the Interrupter Technique in
Pediatric Severe Generalized Cerebral Palsy
R. Veugelers, C. Penning, R. Rieken, P.J.F.M. Merkus,
H.G.M. Arets, R. Bernsen, D. Tibboel, H.M. Evenhuis
submitted
80 Chapter 5
Cha
pte
r 5
ABSTRACT
Rationale In children with severe neurological impairment, respiratory problems
are common. Conventional pulmonary function tests cannot be used due to lack
of cooperation.
Objectives To assess reproducibility, feasibility, outcome values and measurement
characteristics of the interrupter technique in children with severe generalized
cerebral palsy.
Methods In Part 1, short-term (one hour) and long-term (two weeks) reproduc-
ibility was assessed in 35 children. The other objectives were studied in Part 2,
in a representative population-based sample of 175 children. Measurements were
performed on site, in the expiratory phase of tidal breathing using a non-compli-
ant facemask.
Main results Reproducibility appeared moderate but acceptable (ICC=0.58 (short
term) / 0.56 (long-term)). Recordings were tolerated by 86% and were successful
in 73%. The reversibility test (bronchodilation) was successful in 63%. Median
interrupter resistance (Rint) values were significantly related to age, height and
bronchorrhea during the measurement. Median Rint values corresponded to refer-
ence data from non-disabled children. However, in young children, Rint values
were decreased and in older children increased, as compared to reference values.
Within-measurement and within-population variability were considerable. Bron-
chodilation decreased Rint (>2 standard deviation) in 3% of the children (sugges-
tive of asthma), but increased Rint in 28% of the children.
Conclusions Measuring respiratory resistance was possible in most children with
severe generalized cerebral palsy, but precision was less than in a healthy popula-
tion. To our view, feasibility and usefulness should be monitored over time to
further prove its clinical value. Despite its limitations, the interrupter technique
could be considered for these children.
Feasibility of the Interrupter Technique 81
INTRODUCTION
Respiratory problems are a major concern in children with severe generalized
cerebral palsy: 59% of all deaths result from respiratory disease, predominantly
pulmonary infections 1-3. However, studies on epidemiology and etiology of respi-
ratory problems are lacking. It is commonly presumed that in this population re-
spiratory problems are an indirect result of neurological damage 1. Both restrictive
and obstructive respiratory disorders are likely to occur. Restrictive disorders might
result from a dysfunction of the diaphragm, increased abdominal and thoracic
muscle tone, scoliosis or other thoracic deformities. Obstructive disorders might
result from a combination of excessive mucus secretion and impaired clearance
due to secondary ciliary dyskinesia, altered mucus consistency, poor or absent
cough reflex, medication side effects, pulmonary damage (effects of recurrent of
chronic pulmonary disease), malnutrition or a combination of these. Low inflation
levels might further increase the risk of respiratory problems, in case of common
lying position and immobility. Together with dysphagia and gastro-esophageal
reflux, these respiratory disorders are likely to increase the risk of aspiration pneu-
monias and consecutive pulmonary damage. In addition, allergic asthma might
also contribute to poor respiratory function.
Despite these common respiratory problems, objective methods to study respi-
ratory function are neither routinely applied, nor well studied in severely dis-
abled children. Conventional respiratory tests such as spirometry and peak-flow
measurement, are not applicable in very young children 4,5 or severely disabled
children. The interrupter technique however, requires only tidal breathing and no
active cooperation. Its reproducibility in healthy and asthmatic children is satisfac-
tory 6-8, and reference values for healthy children (2-13 years) are available 9-12.
The technique measures resistance of the respiratory system (Rint; kPa/L/s), which
correlates closely to other parameters of pulmonary function 4,7,8,13,14.
During tidal breathing, a shutter interrupts the airflow for 100 msec, during which
mouth pressure equilibrates to the alveolar pressure. Rint is the ratio between this
pressure change and the preceding flow. Pressure directly after the interruption is
estimated from the registered pressure-time-curve 8,15,16. To improve validity, the
outcome value is based on multiple Rint values. In (non-disabled) children the
within-subject variability is sufficiently small to assess the response to broncho-
dilating agents 4,6,17. This, together with the quick and noninvasive nature of the
method, suggests that the technique is a potentially useful diagnostic tool to evalu-
ate respiratory function and treatment effectiveness in disabled children too.
82 Chapter 5
Cha
pte
r 5
The present study in children with a combination of severe motor and intellectual
disabilities consists of two Parts. Part 1 evaluates reproducibility of Rint values,
and Part 2 evaluates feasibility (tolerance, success and its determinants) and out-
come values (Rint, reversibility, precision, determinants of Rint and z-scores) of
the interrupter technique.
METHODS
Study population
Reproducibility (Part 1) was evaluated in 35 children (2–18 years) with a combina-
tion of moderate to profound intellectual disabilities and severe motor impairment
(GMFCS-level IV or V 18).
Part 2 was performed as part of a large population-based cohort study of 194
children with similar disabilities, representative for the total population in the
Netherlands 19. It consisted of 175 measurements, since the first 12 measurements
were used as a pilot-study and therefore discarded, the parents of 2 children did
not give consent for this specific measurement and 5 children dropped out earlier.
To keep the burden in this extensive cohort-study to a minimum, participants for
Part 1 were recruited elsewhere. Inclusion criteria for both groups were identi-
cal.
Legal representatives of all participants gave written informed consent. The
national ethical committee (Central Committee on Research Involving Human
Subjects) approved the study.
Measurement procedure
Interruption measurements were performed on-site (daycare centre or specialized
school), to prevent anxiety and distress. Measurements were performed in the
expiratory phase of tidal breathing using a commercially available, ambulatory
device (MicroRint, v1.113, Micro Medical, Rochester UK) 7,9. The trigger method
was random with a continuous operating mode while cheek support was applied.
Children abstained from anti-asthmatic medication during eight hours prior to the
measurement.
Because these children are unable to close their lips intentionally around a mouth-
piece, a fitting non-compliant facemask (Intersurgical, Uden, The Netherlands),
covering the nose and mouth, was used. Per measurement, we aimed to record 15
separate tracings with a trigger level of 0.20 L/s.
Feasibility of the Interrupter Technique 83
In Part 1, three identical Rint measurements (3x15 interruptions) were performed
on day 1, with intervals of approximately one hour. A fourth measurement was
performed two weeks later.
In Part 2, baseline measurements were obtained, followed by bronchodilator
administration and a postbronchodilator measurement 15 minutes later. Measure-
ments were identical to Part 1 measurements. The procedure was stopped if either
baseline measurement or bronchodilator administration failed. Bronchodilation
was evaluated after administering 800 µg Salbutamol aerosol (Ventolin, GlaxoS-
mithKline B.V., Zeist, The Netherlands) using a spacer (AeroChamber Plus, Boeh-
ringer Ingelheim, Alkmaar, The Netherlands).
A significant response to Salbutamol was defined as a sensitivity index (SI)
(change/standard deviation of the individual baseline measurement) over 2 17; SI
< -2 indicates reversible airway obstruction.
Determinants
To identify possible determinants of a successful measurement, we recorded: age,
Body Mass Index (BMI), gender, scoliosis, level of intellectual disability, Gross-
Motor-Function-Classification-Scale (GMFCS) level, estimated level of involuntary
and aimed movements; as well as measuring conditions: bronchorrhea (distinctly
audible without a stethoscope), positioning, physical activity, state of mind (calm
or not), setting and the number of people present.
These variables (except the last four) and height were assessed to identify
predictors of Rint value.
Measurement analysis
Rejection of incorrect pressure-time curves was done by one researcher, using
strict rejection criteria, to improve reproducibility of the analysis (Table 1). The
median values of the remaining interruptions per measurement were calculated. A
measurement was considered successful if at least 5 interruptions remained.
The success rate is the percentage of successful measurements to the total
number of measurements.
The data supplement provides additional information on the measurement proce-
dure, measuring device, data gathering and statistical analysis.

84 Chapter 5
Cha
pte
r 5
RESULTS
The characteristics of the two studied populations are shown in Table 2.
Table 1 Criteria used for the manual rejection of interruptions
An interruption was rejected for the analysis when in the pressure-time curve:
- After t = 30 msec, the pressure curve showed no continuing increase of pressure (exception: a horizontal end phase).
- After t = 30 msec, the curve shows a fluctuation ≥ 0.05 kPa around the regression line of the curve.
- After t = 30 msec, the curve shows a growing increase of pressure resulting in a hollow curve
- Pressure values at t + 30 ms and/or t + 70 ms exceeded the range of registration.
- If no pressure-curve was registered.
Table 2 Children’s characteristics
Part 1 Part 2
Cohort size number 35 175
Age (years) mean (sd) 12,3 (4,0) 9.5 (4.4)
Gender % boys 69,2 53.7
Intellectual disability % mild 2.9 0.0
% moderate 35.3 10.4
% severe 20.6 40.0
% profound 41.2 49.6
GMFCS % level III 8.0 0.0
% level IV 10.0 17.4
% level V 82.0 82.6
Full chest during measurement % yes 12.8 24.5
Positioning at measurement % optimal 69.8 65.8
GMFCS = Gross Motor Function Classification Scale, optimal positioning = upright in an upright positioned wheel chair, valid = fraction of the population with known information.
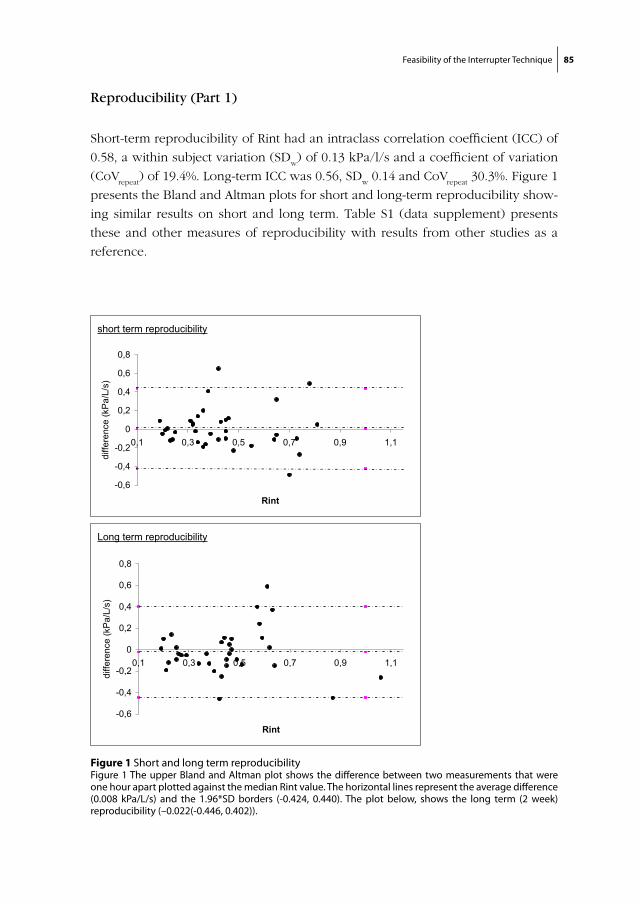
Feasibility of the Interrupter Technique 85
Reproducibility (Part 1)
Short-term reproducibility of Rint had an intraclass correlation coefficient (ICC) of
0.58, a within subject variation (SDw) of 0.13 kPa/l/s and a coefficient of variation
(CoVrepeat
) of 19.4%. Long-term ICC was 0.56, SDw 0.14 and CoV
repeat 30.3%. Figure 1
presents the Bland and Altman plots for short and long-term reproducibility show-
ing similar results on short and long term. Table S1 (data supplement) presents
these and other measures of reproducibility with results from other studies as a
reference.
Figure 1 Short and long term reproducibilityFigure 1 The upper Bland and Altman plot shows the difference between two measurements that were one hour apart plotted against the median Rint value. The horizontal lines represent the average difference (0.008 kPa/L/s) and the 1.96*SD borders (-0.424, 0.440). The plot below, shows the long term (2 week) reproducibility (–0.022(-0.446, 0.402)).
chapter 5/ figure 1 (bestaat uit 2 losse delen!):
short term reproducibility
-0,6
-0,4
-0,2
0
0,2
0,4
0,6
0,8
0,1 0,3 0,5 0,7 0,9 1,1
Rint
diffe
renc
e (k
Pa/
L/s)
Long term reproducibility
-0,6
-0,4
-0,2
0
0,2
0,4
0,6
0,8
0,1 0,3 0,5 0,7 0,9 1,1
Rint
diffe
renc
e (k
Pa/
L/s)

86 Chapter 5
Cha
pte
r 5
Feasibility (Part 2)
Tolerance
In 151/175 children (86,3%) we were able to perform a baseline measurement,
consisting of 15 (74.9%) or 5-14 interruptions (11.4%). Less than 5 interruptions
were obtained in 24 children (13.7%).
Postbronchodilator measurements were performed in 136 children (10 stopped
early, 5 stopped < 5 interruptions).
Measurement success
The performed measurements were analyzed using the criteria mentioned above
to reject irregular pressure-curves. This resulted in 128/175 (73,1%) successful
baseline measurements and 113/136 (83.1%) successful postbronchodilator mea-
surements. Success percentages (baseline measurements) per age category were
46.7% (2-5 years), 76.8% (5-12 years) and 82.4% (>12 years).
Figure 2 shows that although in some children the measurement was stopped
early, the absolute number of successful interruptions remains roughly similar.
In 111/175 children (63.4%) both baseline and postbronchodilator measure-
ment were successful.
Figure 2 Interruptions in chronological order; execution and success numbersFigure 2 The horizontal axis shows the sequential number of interruptions of the baseline measurements (with a maximum of 15 interruptions per measurement). The bars indicate in how many participants the corresponding interruption was attempted, while the dark parts indicate how many of these interruptions proved successful on analysis.
chapter 5/ figure 2:
020406080
100120140160
1 2 3 4 5 6 7 8 9 10 11 12 13 14 15
interruption number
part
icip
ants
successful performed interruptions

Feasibility of the Interrupter Technique 87
Table 3 Determinants of measurement success
Univariate Multivariate
measurement success % p-value OR CI
age years 0.005 * 1.15 1.04 – 1.27
BMI kg/ m 0.087 *
age category 2-5 years 46.7
5-12 years 76.8
> 12 years 82.4 <0.001*
gender boy 75.3
girl 71.3 X
scoliosis yes (41.7%) 67.2
no (58.3) 89.6 0.007*
intellectual moderate 71.4
disability severe 74.1
profound 77.6 0.841
GMFCS level IV 65.5
level V 76.1 0.237
involuntary < 2 hours a week 81.6
movements regularly 73.8
most of the day 68.4 0.190
aimed none 79.1
movements little 78.8
regularly 67.4 0.204
bronchorrhea yes 60.0
no 78.8 0.028 * 0.45 0.16 - 1.22
positioning optimal 76.5
not optimal 76.5 X
activity during not hindering (70.6%) 87.0
measurement measurement difficult (20.9%) 75.0
meas. not well possible (8.5%) 7.7 <0.001* 0.06 0.001 – 0.66
state of mind calm (58.2%) 92.1
not calm (41.8%) 57.8 <0.001* 0.22 0.06 - 0.76
room separate (58.7%) 77.4
classroom (41.3%) 74.6 0.423
number of people present 0.984
measurement success % = percentage of the measurements that proved successful (at least 5 remaining interruptions after analysis), BMI= Body Mass Index, * significant at an 0.05 level, using Chi square tests (linear by linear) for categorical variables and logistic regression for continue variables. GMFCS = gross motor function classification scale, X = not calculated
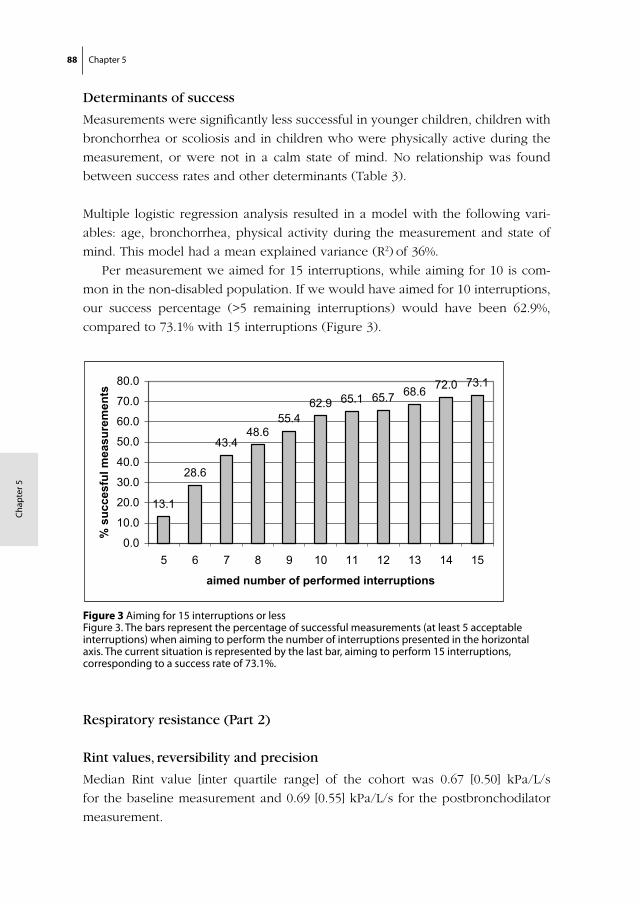
88 Chapter 5
Cha
pte
r 5
Determinants of success
Measurements were significantly less successful in younger children, children with
bronchorrhea or scoliosis and in children who were physically active during the
measurement, or were not in a calm state of mind. No relationship was found
between success rates and other determinants (Table 3).
Multiple logistic regression analysis resulted in a model with the following vari-
ables: age, bronchorrhea, physical activity during the measurement and state of
mind. This model had a mean explained variance (R2) of 36%.
Per measurement we aimed for 15 interruptions, while aiming for 10 is com-
mon in the non-disabled population. If we would have aimed for 10 interruptions,
our success percentage (>5 remaining interruptions) would have been 62.9%,
compared to 73.1% with 15 interruptions (Figure 3).
Respiratory resistance (Part 2)
Rint values, reversibility and precision
Median Rint value [inter quartile range] of the cohort was 0.67 [0.50] kPa/L/s
for the baseline measurement and 0.69 [0.55] kPa/L/s for the postbronchodilator
measurement.
Figure 3 Aiming for 15 interruptions or less Figure 3. The bars represent the percentage of successful measurements (at least 5 acceptable interruptions) when aiming to perform the number of interruptions presented in the horizontal axis. The current situation is represented by the last bar, aiming to perform 15 interruptions, corresponding to a success rate of 73.1%.
chapter 5/ figure 3:
13.1
28.6
43.448.6
55.462.9 65.1 65.7 68.6 72.0 73.1
0.0
10.0
20.0
30.0
40.0
50.0
60.0
70.0
80.0
5 6 7 8 9 10 11 12 13 14 15
aimed number of performed interruptions
% s
ucce
sful
mea
sure
men
ts
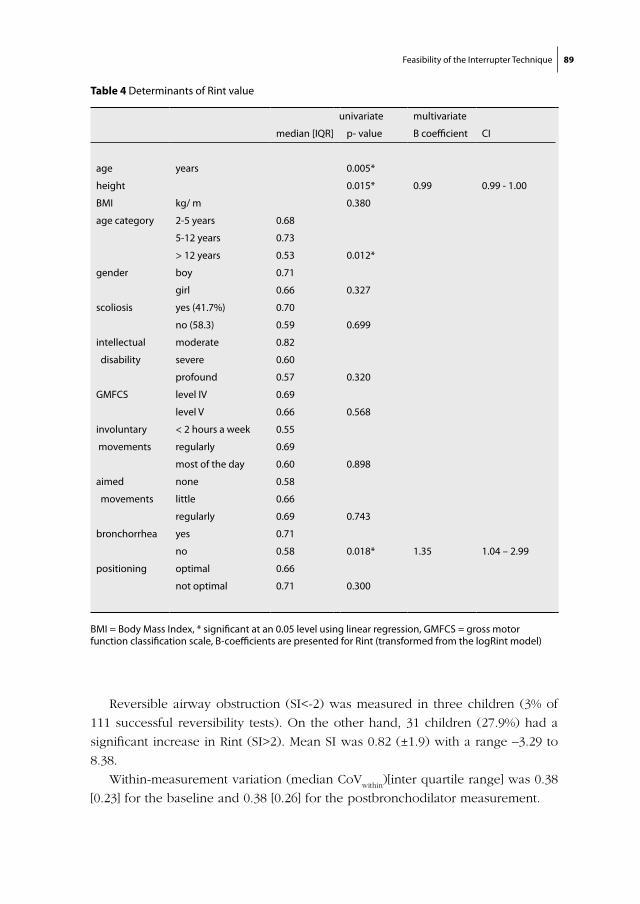
Feasibility of the Interrupter Technique 89
Reversible airway obstruction (SI<-2) was measured in three children (3% of
111 successful reversibility tests). On the other hand, 31 children (27.9%) had a
significant increase in Rint (SI>2). Mean SI was 0.82 (±1.9) with a range –3.29 to
8.38.
Within-measurement variation (median CoVwithin
)[inter quartile range] was 0.38
[0.23] for the baseline and 0.38 [0.26] for the postbronchodilator measurement.
Table 4 Determinants of Rint value
univariate multivariate
median [IQR] p- value B coefficient CI
age years 0.005*
height 0.015* 0.99 0.99 - 1.00
BMI kg/ m 0.380
age category 2-5 years 0.68
5-12 years 0.73
> 12 years 0.53 0.012*
gender boy 0.71
girl 0.66 0.327
scoliosis yes (41.7%) 0.70
no (58.3) 0.59 0.699
intellectual moderate 0.82
disability severe 0.60
profound 0.57 0.320
GMFCS level IV 0.69
level V 0.66 0.568
involuntary < 2 hours a week 0.55
movements regularly 0.69
most of the day 0.60 0.898
aimed none 0.58
movements little 0.66
regularly 0.69 0.743
bronchorrhea yes 0.71
no 0.58 0.018* 1.35 1.04 – 2.99
positioning optimal 0.66
not optimal 0.71 0.300
BMI = Body Mass Index, * significant at an 0.05 level using linear regression, GMFCS = gross motor function classification scale, B-coefficients are presented for Rint (transformed from the logRint model)
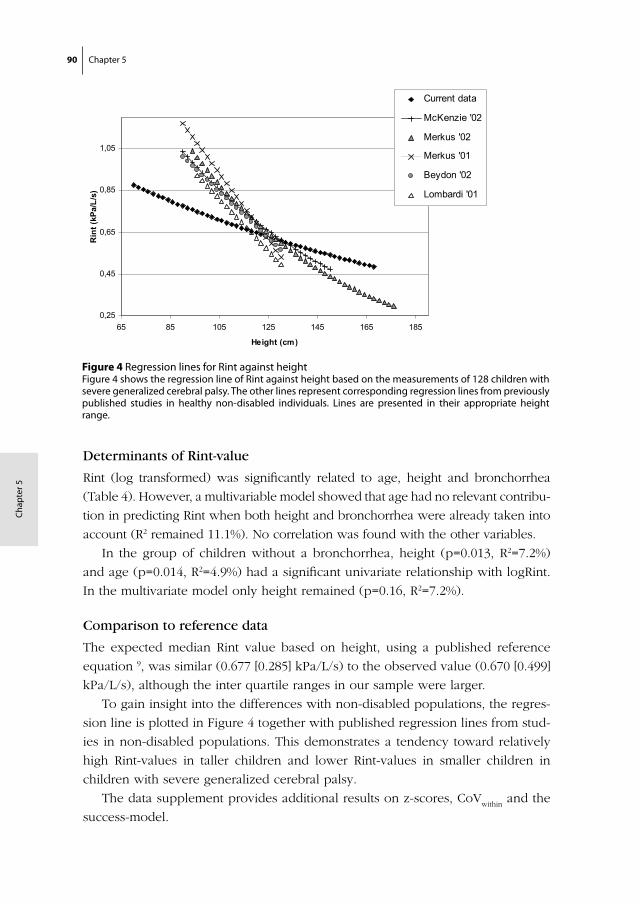
90 Chapter 5
Cha
pte
r 5
Determinants of Rint-value
Rint (log transformed) was significantly related to age, height and bronchorrhea
(Table 4). However, a multivariable model showed that age had no relevant contribu-
tion in predicting Rint when both height and bronchorrhea were already taken into
account (R2 remained 11.1%). No correlation was found with the other variables.
In the group of children without a bronchorrhea, height (p=0.013, R2=7.2%)
and age (p=0.014, R2=4.9%) had a significant univariate relationship with logRint.
In the multivariate model only height remained (p=0.16, R2=7.2%).
Comparison to reference data
The expected median Rint value based on height, using a published reference
equation 9, was similar (0.677 [0.285] kPa/L/s) to the observed value (0.670 [0.499]
kPa/L/s), although the inter quartile ranges in our sample were larger.
To gain insight into the differences with non-disabled populations, the regres-
sion line is plotted in Figure 4 together with published regression lines from stud-
ies in non-disabled populations. This demonstrates a tendency toward relatively
high Rint-values in taller children and lower Rint-values in smaller children in
children with severe generalized cerebral palsy.
The data supplement provides additional results on z-scores, CoVwithin
and the
success-model.
Figure 4 Regression lines for Rint against heightFigure 4 shows the regression line of Rint against height based on the measurements of 128 children with severe generalized cerebral palsy. The other lines represent corresponding regression lines from previously published studies in healthy non-disabled individuals. Lines are presented in their appropriate height range.
chapter 5/ figure 4:
0,25
0,45
0,65
0,85
1,05
65 85 105 125 145 165 185
Height (cm)
Rin
t (kP
a/L/
s)Current data
McKenzie '02
Merkus '02
Merkus '01
Beydon '02
Lombardi '01
Feasibility of the Interrupter Technique 91
DISCUSSION
This study is the first to measure respiratory function in a large group of children
with severe generalized cerebral palsy, using the interrupter technique. Measure-
ments were tolerated by 86% of the children, and successful in 73%. We found
that short and long-term reproducibility were similar and comparable to long-term
reproducibility under field conditions in a healthy population 20. Reversibility tests
were successful in 63.4%, showing a decreased Rint in 3% of the children, sug-
gestive of asthma, but an increased Rint in 27.9%. Median baseline Rint value was
similar to the predicted value based on the reference data of healthy children 9,
although Rint values were relatively low in small (younger) children, and relatively
high in tall (older) children. Rint was also influenced by bronchorrhea during the
measurement. Although these results were favorable, within-measurement and
within-population variability were larger in this population than in non-disabled
populations.
Reproducibility (Part 1)
In contrast to reports from other populations 10,20,21, short term reproducibility was
not better than long term reproducibility in this study. Only CoVrepeat
indicated a
better reproducibility on short versus long term.
On short term reproducibility was poorer than in other populations. Long
term reproducibility was comparable to reproducibility in a healthy population
measured under field conditions 20 and comparable to that of coughers and
wheezers 21 if based on ICC, and/or SDw. However, if based on CoV
repeat, long-term
reproducibility seemed poor in our sample. This can be explained by the large
CoVwithin
(0.38). The CoVrepeat
uses Rint-values of the separate interruptions, whereas
other reproducibility measures are based on the outcome (median Rint) values of
measurements. Although the CoVrepeat
provides information on the variation of
separate interruption-values, it is not the most appropriate measure to express
reproducibility.
We conclude, that reproducibility is acceptable, but within-measurement varia-
tion is large.
Feasibility (Part 1)
Tolerance
Measurements were not tolerated by 14% of our cohort. Reported refusal rates
in non-disabled populations vary between 0 and 44% 9,10,12,22,23. The relatively low
92 Chapter 5
Cha
pte
r 5
tolerance in our population was expected since these children are unable to fully
understand the measurement, the instructions and reassurement. Aversive reac-
tions may be worsened by visual impairment, hyper-sensibility of the mouth area
and unpleasant associations with hospital masks, which are more common in this
population.
Measurement success
As in other pediatric populations, success rate of Rint measurements was age
dependent 22,23. Our success rates are somewhat lower than reported success rates
for non-disabled populations which vary between 80 and 100% in children over
3 years of age 7,10,12,21,22,24-28. This was most likely due to limited comprehension,
anxiety, hyper sensibility and motor impairment.
We have shown that the success rate (73%) was raised by increasing the num-
ber of aimed interruptions to 15 (Figure 3). Based on the observed trend, we
do not expect that a further increase in the aimed number of interruptions will
increase the success rate further. However, some children might benefit from an
adjustment period to get used to the device. In clinical practice, it might thus be
considered to repeat the measurement in for the child acceptable intervals, until
enough acceptable interruptions have been obtained.
Respiratory resistance (Part 2)
Rint reversibility and precision
Increased Rint after bronchodilation was observed in 27.9% of the children. This
may be explained by sputum release that was not expectorated before the post
measurement, due to decreased cough reflex and decreased motor abilities for an
efficient cough. Increasing the time interval between baseline and postbronchodi-
lator test might resolve this.
The precision of a single measurement was expressed as CoVwithin
. In our
population median CoVwithin
was 38%, which is poor compared to 11.4 – 14.4%,
described by others 12,28-30. CoVwithin
is a measure of variation in single interruption
values within a measurement. It is not a measure of reliability of the outcome,
which should be judged based on the repeatability of the outcome value (studied
in Part 1).
We conclude that within measurement variation is large; therefore it is impor-
tant to take the median of several Rint values as outcome measure.
Feasibility of the Interrupter Technique 93
Determinants of Rint-value
As in studies in non-handicapped children we found a relationship between Rint
and age (both strongly related to height). Unlike other populations we measured
children with bronchorrhea, which increased Rint: increased amounts of sputum
in the airways will narrow the passage and therefore increase the resistance.
Comparison to reference data
Over the total group (median), Rint values were almost equal to the predicted
Rint values for non-disabled children. However, in smaller children, Rint values
were low compared to non-disabled populations, whereas and in taller children
values were relatively high (Figure 4). We hypothesize that deviation from refer-
ence values of healthy populations can be explained by (subclinical) bronchitis,
abnormal muscle tone and the use of a facemask. Muscle tone tends to increase
with age 31,32, possibly resulting in a relative increase in respiratory resistance.
Chronic bronchitis, poor/absent cough reflexes or pulmonary damage (recurrent
pulmonary disease) might further explain the relatively high Rint values seen
in older children. Especially when combined with scoliosis and other thoracic
malformations, these factors might contribute to the smaller decrease in resistance
with age, compared to healthy populations.
The data supplement provides additional discussion on COV, z-scores, bronchor-
rhea and the comparison to reference data.
Implications for future use
Based on our results, we expect that measurements using the interrupter tech-
nique are possible in the majority of children with severe generalized cerebral
palsy. There are three main areas in which its use could be considered. Firstly, to
study Rint longitudinally in populations. For this purpose the technique could be
considered, because reproducibility on a group level proved favorable. Secondly,
reversibility testing of the individual child. Significant change has been shown.
Nevertheless, due to within-measurement variability, clinically relevant changes
will not always result in a measurable significant change. In daily practice, some
profit might be gained by introducing adjustment periods for the facemask.
Furthermore, we recommend a longer time interval (well over 15 minutes) be-
tween bronchodilator administration and post measurement. Thirdly, changes in
respiratory resistance of an individual child. Trends in respiratory resistance of a
child might provide valuable information, but individual measurements should be
handled with caution since the within-measurement variation is considerable and
repeatability moderate. In trend monitoring, repeated measurement should be
94 Chapter 5
Cha
pte
r 5
done over a period of time (variation is likely due to both non-optimal measure-
ment precision and health status), before and during/after a treatment. Hopefully,
respiratory function can be effectively monitored this way, but future studies need
to prove that this can be done. To monitor changes in respiratory resistance on
long term, the physiological changes due to growth should be taken into account.
Therefore population specific reference values should be available.
CONCLUSION
The need for a method to monitor short term and long term changes in pulmonary
function and treatment effects in children with severe generalized cerebral palsy
is evident.
We have shown that it is possible to measure respiratory resistance in this
population. Repeatability was moderate but in our view acceptable. Within-mea-
surement variation was relatively large. Compared to a non-disabled population,
Rint values were relatively low in small (young) children and high in tall (older)
children, which might be due to muscle tension development and chronic bron-
chitis or thoracic disorders.
Despite the limitations of this method, it is at this moment, the only (studied)
pulmonary function parameter method available. This lack of a reference standard
makes a proper validation impossible. To our view, feasibility and usefulness
should be monitored over time, to obtain insight into the clinical usefulness of this
pulmonary function test in neurologically impaired populations.
Feasibility of the Interrupter Technique 95
REFERENCES
1. Seddon, P.C. and Y. Khan, Respiratory problems in children with neurological impairment. Arch Dis Child, 2003. 88(1): p. 75-8.
2. Toder, D.S., Respiratory problems in the adolescent with developmental delay. Adolesc Med, 2000. 11(3): p. 617-31.
3. Blair, E., et al., Life expectancy among people with cerebral palsy in Western Australia. Dev Med Child Neurol, 2001. 43(8): p. 508-15.
4. Bisgaard, H. and B. Klug, Lung function measurement in awake young children. Eur Respir J, 1995. 8(12): p. 2067-75.
5. Crenesse, D., et al., Spirometry in children aged 3 to 5 years: reliability of forced expiratory maneuvers. Pediatr Pulmonol, 2001. 32(1): p. 56-61.
6. Phagoo, S.B., N.M. Wilson, and M. Silverman, Evaluation of a new interrupter device for measuring bronchial responsiveness and the response to bronchodilator in 3 year old children. Eur Respir J, 1996. 9(7): p. 1374-80.
7. Arets, H.G., H.J. Brackel, and C.K. van der Ent, Applicability of interrupter resistance measure-ments using the MicroRint in daily practice. Respir Med, 2003. 97(4): p. 366-74.
8. Chowienczyk, P.J., et al., A flow interruption device for measurement of airway resistance. Eur Respir J, 1991. 4(5): p. 623-8.
9. Merkus, P.J., et al., Measurements of interrupter resistance: reference values for children 3-13 yrs of age. Eur Respir J, 2002. 20(4): p. 907-11.
10. Lombardi, E., et al., Reference values of interrupter respiratory resistance in healthy preschool white children. Thorax, 2001. 56(9): p. 691-5.
11. McKenzie, S.A., et al., Airway resistance measured by the interrupter technique: normative data for 2-10 year olds of three ethnicities. Arch Dis Child, 2002. 87(3): p. 248-51.
12. Beydon, N., et al., Pre/postbronchodilator interrupter resistance values in healthy young children. Am J Respir Crit Care Med, 2002. 165(10): p. 1388-94.
13. Carter, E.R., et al., Evaluation of the interrupter technique for the use of assessing airway obstruc-tion in children. Pediatr Pulmonol, 1994. 17(4): p. 211-7.
14. Klug, B. and H. Bisgaard, Measurement of lung function in awake 2-4-year-old asthmatic children during methacholine challenge and acute asthma: a comparison of the impulse oscillation tech-nique, the interrupter technique, and transcutaneous measurement of oxygen versus whole-body plethysmography. Pediatr Pulmonol, 1996. 21(5): p. 290-300.
15. Jackson, A.C., H.T. Milhorn, Jr., and J.R. Norman, A reevaluation of the interrupter technique for airway resistance measurement. J Appl Physiol, 1974. 36(2): p. 264-8.
16. Mead, J. and J.L. Whittenberger, Evaluation of airway interruption technique as a method for measuring pulmonary airflow resistance. J Appl Physiol, 1954. 6(7): p. 408-16.
17. Bridge, P.D., H. Lee, and M. Silverman, A portable device based on the interrupter technique to measure bronchodilator response in schoolchildren. Eur Respir J, 1996. 9(7): p. 1368-73.
18. Palisano, R., et al., Development and reliability of a system to classify gross motor function in children with cerebral palsy. Dev Med Child Neurol, 1997. 39(4): p. 214-23.
19. Veugelers, R., et al., A population-based nested case control study on recurrent pneumonias in children with severe generalized cerebral palsy: ethical considerations of the design and represen-tativeness of the study sample. BMC Pediatr, 2005. 5(1): p. 25.

96 Chapter 5
Cha
pte
r 5
20. Beelen, R.M., et al., Short and long term variability of the interrupter technique under field and standardized conditions in 3-6 year old children. Thorax, 2003. 58(9): p. 761-4.
21. Chan, E.Y., et al., Repeatability of airway resistance measurements made using the interrupter technique. Thorax, 2003. 58(4): p. 344-7.
22. Merkus, P.J., et al., Interrupter resistance in preschool children: measurement characteristics and reference values. Am J Respir Crit Care Med, 2001. 163(6): p. 1350-5.
23. Bridge, P.D., S. Ranganathan, and S.A. McKenzie, Measurement of airway resistance using the interrupter technique in preschool children in the ambulatory setting. Eur Respir J, 1999. 13(4): p. 792-6.
24. Panagiotis, P., et al., Use of interrupter technique in assessment of bronchial responsiveness in normal subjects. BMC Pulm Med, 2004. 4(1): p. 11.
25. Beydon, N., et al., Pulmonary function tests in preschool children with asthma. Am J Respir Crit Care Med, 2003. 168(6): p. 640-4.
26. Hadjikoumi, I., A. Hassan, and A.D. Milner, Effects of respiratory timing and cheek support on resistance measurements, before and after bronchodilation in asthmatic children using the inter-rupter technique. Pediatr Pulmonol, 2003. 36(6): p. 495-501.
27. Klug, B. and H. Bisgaard, Specific airway resistance, interrupter resistance, and respiratory imped-ance in healthy children aged 2-7 years. Pediatr Pulmonol, 1998. 25(5): p. 322-31.
28. Child, F., et al., How should airways resistance be measured in young children: mask or mouth-piece? Eur Respir J, 2001. 17(6): p. 1244-9.
29. Bridge, P.D. and S.A. McKenzie, Airway resistance measured by the interrupter technique: expira-tion or inspiration, mean or median? Eur Respir J, 2001. 17(3): p. 495-8.
30. van Altena, R. and F. Gimeno, Respiratory resistance measured by flow-interruption in a normal population. Respiration, 1994. 61(5): p. 249-54.
31. Albright, A.L., Spasticity and movement disorders in cerebral palsy. J Child Neurol, 1996. 11 Suppl 1: p. S1-4.
32. Russman, B.S., Cerebral Palsy. Curr Treat Options Neurol, 2000. 2(2): p. 97-108.
Data Supplement to Chapter 5
Feasibility and Outcome of the Interrupter Technique in
Pediatric Severe Generalized Cerebral Palsy
R. Veugelers, C. Penning, R. Rieken, P.J.F.M. Merkus,
H.G.M. Arets, R. Bernsen, D. Tibboel, H.M. Evenhuis
98 Chapter 5
Cha
pte
r 5
METHODS
Study population
Part 2 of this study was performed as part of a large-scale epidemiological cohort
study of pulmonary and feeding problems in children (2 – 18 years) with a com-
bination of moderate to profound intellectual disabilities (ID) and severe motor
impairment in the Netherlands 1. The intellectual disability was defined as an IQ
below 55 (or estimated by dividing the developmental age by the calendar age
times 100). ID was categorized as moderate (IQ= 35-55), severe (IQ=25-35) or
profound (IQ <25). The motor disability was defined by hypertonic or hypotonic
generalized cerebral palsy or a motor developmental delay to such an extent that
a child could at best crawl. This corresponds to a Gross Motor Function Classifica-
tion Scale (GMFCS) score IV or VModerate.
Measurement procedure
All measurements were performed by two researchers, in a group setting or in a
quiet room, depending on preferences of the care centre. Caregivers were invited
to be present at each measurement. Stop criteria were explained in advance. If
the child did not tolerate the recording, the measurement was paused or stopped
immediately. One researcher sat in front of the child and briefly explained the
procedure to the child. The facemask and the sound of the occlusions were dem-
onstrated before the start of the measurement. The other researcher stood behind
the child and fixated the child’s head during the measurement while supporting
the cheeks, holding the facemask in place at the same time. The researcher in
front observed the child and held the arms of the child if necessary.
The MicroRint automatically rejects an interruption if an apparent artifact on the
pressure curve occurs, and uses back-extrapolation to t = 15 ms after shutter
closure (100 ms) to calculate Rint. Measurements were imported into the RIDA
software (Micro Medical Ltd, RintBase 5, version 1.002 for Windows 2002).
Part 2
Salbutamol aerosol (Ventolin, GlaxoSmithKline B.V., Zeist, The Netherlands) was
administered after the baseline session, in 4 subsequent doses of 200 µg using a
spacer (AeroChamber Plus, Boehringer Ingelheim, Alkmaar, The Netherlands).
The first 3 doses were inhaled in 5 breaths and the last dose in 10 breaths.
Data Supplement to Chapter 5 99
Additional information on determinants
Arm span and standing height were measured using a flexible tape measure.
Because height is sometimes difficult to measure due to contractures, arm span
was converted to height if necessary (9 children) 2. In 166 children both arm span
and height were measured. The median difference [inter quartile range] between
measured height and height calculated from arm span was 0.0 [6.0] cm.
Measuring conditions were recorded. Positioning was scored ‘optimal’ if the child was
(supported) upright in an upright positioned wheel chair. Researchers also recorded
whether the child had a full chest, which was scored positive if it was apparent
without using a stethoscope. Level of intellectual disability (ID) (the developmental
age or the IQ) was noted from the school or day care file. Information on scoliosis,
aimed and involuntary movement was gathered from questionnaires. Scoliosis was
scored positive if the child visited an orthopedic specialist for this condition.
Analysis, part 1
Short and long-term reproducibility were expressed by intraclass correlation coef-
ficient (ICC), within subject variation (SDw) 3, Coefficient of variation (CoV
repeat) and
shown in a Bland and Altman plot 4.
In current literature on reproducibility of Rint, several different measures are used.
To allow comparison with several studies, several measures of reproducibility
were calculated. Besides the ICC, SDw and CoV
repeat mentioned in the print version,
we also calculated the mean difference ± SD (range) and the repeatability (vari-
ance of the mean difference between pairs of measurements).
CoVrepeat
was calculated as: SD of the Rint-value of the single interruptions of 2 re-
peated measurements divided by the mean of those interruptions. These individual
measures were averaged for the population. The individual mean differences with
SD (and the corresponding “repeatability”) were also averaged to one population
measure. The other measures ICC, SDw and Bland and Altmann plots directly result
in one summarizing result for the population. ICC is the only measure without a
dimension; the other reproducibility measures are expressed in kPa/L/s.
Two of the three measurements from day 1 were randomly chosen to represent
the short-term reproducibility in a Bland and Altman plot 4. For long-term re-
producibility, the difference between the last day measurement and a randomly
chosen measurement of day 1 were used.
100 Chapter 5
Cha
pte
r 5
Analysis, part 2
Rint precision
Precision of a measurement was expressed as median within-measurement coef-
ficient of variation CoVwithin
(CoV = SD/mean) CoVwithin
was calculated using the
Rint values of all acceptable individual occlusions.
Age, height and bronchodilation have been shown to affect this precision 5,6 there-
fore these relations were analyzed using linear regression. Differences in CoV
between base and post measurement were analyzed using the Wilcoxon Signed
Ranks test.
Determinants of success
Logistic regression was used to identify multivariable relationships between mea-
surement success and the previously described determinants. Individual determi-
nants with a univariate relationship with p<0.20 were used for stepwise logistic
regression, to identify most relevant variables. Results are compared with a model
in which missing variables are imputed using multiple imputations. For the impu-
tation procedure we used a multiple imputation technique with five imputed data
sets 7. Odds ratio’s (OR) 95% confidence intervals and p-values are presented.
The necessity of aiming for 15 interruptions (in non-disabled children it is com-
mon to aim for 10 interruptions) was assessed by calculating success rate for
fictive situations when only the first 5 to only the first 14 interruptions would have
been performed. For example: only the first performed 8 interruptions per child
were analyzed. For this (fictive) situation the success rate was calculated, which
represents what success rate we would have found, would we have aimed for
only 8 interruptions. This was done for all numbers from 5 to 14.
Determinants of Rint-value
To identify relationships between logRint-values and described determinants a
similar procedure was performed using linear regression. The log of the Rint
values was used in order to conform to assumptions underlying linear regression
(normal distribution of the residuals). This was performed for the total group and
for children without a distinct bronchorrhea separately. The predictive ability of
these models was expressed by the explained variances (R2).

Data Supplement to Chapter 5 101
Comparison to reference data
Z-scores were calculated 8. Z-scores reflect the deviation from reference values
adjusting for the predicted value and therefore allows comparison in deviation at
different ages 9. This equation 8 was most appropriate since it uses a log-scale and
our data were heteroscedastic (SD increased with increasing Rint value).
A p-value below 0.05 was considered statistically significant.
RESULTS
Determinants of success
In the multiple logistic regression analysis of determinants for measurement suc-
cess, the variable “physical activity during the measurement” was significant but
only for ‘not hindering’ versus ‘measurement not well possible’.
The multiple logistic regression analysis using multiple imputations resulted in a
model with a mean explained variance of R2=36%. Without imputation of missing
data a similar model was obtained with an R2of 45%.
Rint precision
CoVwithin
was not significantly related to age (p=0.418) or height (p=0.605), nor did
it differ between baseline and postbronchodilator measurement (p=0.292).
Comparison to reference data
Mean z-score (SD) was -0.016 (2.70), which was strongly related to Rint-value
(p=0.000, R2=64.7%) and log Rint (p=0.000, R2=71.7%). Z-score was also signifi-
cantly related to height (p=0.000, R2=10.8%) and age (p=0.000, R2=3.3%).
In Figure 4 the regression line for Rint to height was plotted according to the fol-
lowing model: logRint=0.125 - 0.0026 height (cm) (R2 of 4.6%; standard deviation
of the residuals (RSD)=0.23). Studies in non-disabled populations, which did not
use back-extrapolation to calculate Rint, were not plotted.
102 Chapter 5
Cha
pte
r 5
DISCUSSION
Reproducibility (Part 1)
Even though the mean difference (between two measurements from one child)
(Figure 5) on short term indicates a good reproducibility on a group level, the cor-
responding wide interval confirms a poor individual reproducibility on short term.
Feasibility (Part 1)
Tolerance
Motor impairment might either hamper or facilitate measurement execution: chil-
dren with continuous involuntary movements and resisting movements will be
more difficult to measure than healthy children or children without the ability to
move. However, a correlation between success rate and movement during the
measurement was univariately not statistically significant.
Respiratory resistance values (Part 2)
Rint reversibility and precision
Previous studies in non-disabled children showed a relationship between the
variation within a measurement (CoVwithin
) and age, height 5 or bronchodilation 6.
Theoretically, the first could explain the relatively high CoVwithin
found in this study,
since the average age (and height) is higher than in other studies. However analysis
showed no significant relationship between the CoVwithin
and age or height.
Bronchorrhea
Bronchorrhea (distinctly audible without a stethoscope) is not easily quantified.
Nevertheless, we chose to record and analyze this parameter. Main reason was,
that this manifestation of (chronic) sputum stasis is very common in these children.
To judge the applicability of the interrupter technique in these children, data on
the effect of sputum stasis on Rint measurements is necessary
Because bronchorrhea was recorded before the start of the measurement, misclas-
sification is likely to be random (underestimation of relationships). Missing data
were not random since difficult to judge cases, are more likely to be left blanc,
leaving them out of the analysis has most likely caused a small overestimation,
however, when missings were randomly allocated difference remained significant
(p=0.013). Based on this we feel our results represent a true effect of bronchor-
Data Supplement to Chapter 5 103
rhea, even though quantification is problematic.
Since a representative population-based sample (including children with symp-
toms) was included, results can be easily extrapolated to daily practice.
Comparison to reference data
For the total group (median), Rint values were almost equal to the predicted Rint val-
ues based on reference values of non-disabled children, but the inter-quartile range
(IQR) was larger. This has a three-fold explanation. Firstly, the repeatability values
indicate that our measurement precision is relatively low, thereby increasing the IQR.
Secondly, predicted values are by definition exactly on the regression line, whereas
observed data will scatter around it. Thirdly, Rint-values were influenced more often
by comorbidity (some had a history of severe respiratory and other illnesses) than in
non-disabled populations. The effects of these conditions on Rint-value could not be
analyzed properly in our sample without categorizing these conditions, which would
be very arbitrary and could therefore introduce chance findings.
The results of our study can also be compared with those of studies in non-disabled
populations, using regression lines of Rint against height. Rint-values in our popula-
tion are below those in non-disabled populations in smaller children and above these
in taller children (Figure 4). This was confirmed by the correlation of the z-scores
to age and height. Z-scores reflect the deviation from reference values adjusting for
the predicted value and therefore allow comparison in deviation at different ages 9.
Z-scores correlated to Rint values as well, indicating that the variation in Rint-values
was not solely based on variation in height. The regression line is plotted with those
of other studies to visualize the differences between this population with severe
generalized cerebral palsy and healthy children. Although we included a representa-
tive cohort of children with severe generalized cerebral palsy, our population is not
large enough to be used as reference for other children.
We should also bear in mind that our prediction model for Rint based on height
has a low predictive value (R2=4.6%, RSD=0.23), compared to the model of Merkus
(R2=63%, RSD=0.09 8 ). However, the predictive value of our model is comparable
with the precision of the other models (R2 =14% 10 and RSD=0.18 11). Another
measure used in literature, the standard error of the coefficient, is less informative
since it also depends on the number of participants (SEB=0.001 in our data versus
reported data SEB=0.002 - 0.13 10,12,13). We conclude that the low model precision
can be explained by the moderate reproducibility and the heterogeneity of the
study sample, including children with a history of respiratory problems.

104 Chapter 5
Cha
pte
r 5
Table S1 Reproducibility compared to studies in non-disabled populations
Measures of reproducibility
CoV (%) ICCRepeatability (kPa/L/s)‡
SDw (kPa/L/s)
mean difference ± SD (kPa/l/s)
Short term reproducibility
Current data 19.4# 0.58 0.43 0.13 0.008 ± 0.216
Arets ‘03 7,1# - 0.22º - -0.005 ± 0.11
Beelen ‘03 - - ± 0.28ºº 0.10 -
Chan ‘03 * 6,5 ## 0,97† 0.17 - -
Child ‘01 - 0.76†† 0.22º - -0.02 ± 0.11
- 0.77 0.34º - -0.01 ± 0.17
Lombardi ‘01 - 0.87 0.242 - 0.007 ± 0.12º
Nielsen ‘01 ‘00 - - - 0.078$ -
Klug ‘00** - - 0.24º 0.085$$ –0.03 ± 0.12
- - 0.18º 0.063 0.00 ± 0.09
Bridge ‘99 - - 0.21 - -
- - 0.17 - -
- - 0.15 - -
Oswald-mammoser ‘97* 9% - - - -
7% - - - -
Long term reproducibility
Current data 30.3 0.56 0.42 0.14 -0.0221 ± 0.212
Beelen ‘03 - - ± 0.36ºº 0.13 -
- - - 0.10 -
Chan ‘03 * 11 0,75 0.23 - -
16 0,56 0.38 - -
15 0,66 0.44 - -
Lombardi ‘01 - 0.91 0.208 - 0.034 ± 0.10‡‡
* measurements with CoV > 20 were excluded
** each interruption is within 15% of the mean value of 5 (inclusion criterion)
# sd of the Rint-value of single interruptions of 2 measurements / mean
## sd of the difference/√2/mean of the measurements
† 1-((sd difference between measurements/√2)2 / sd of the measurements2))
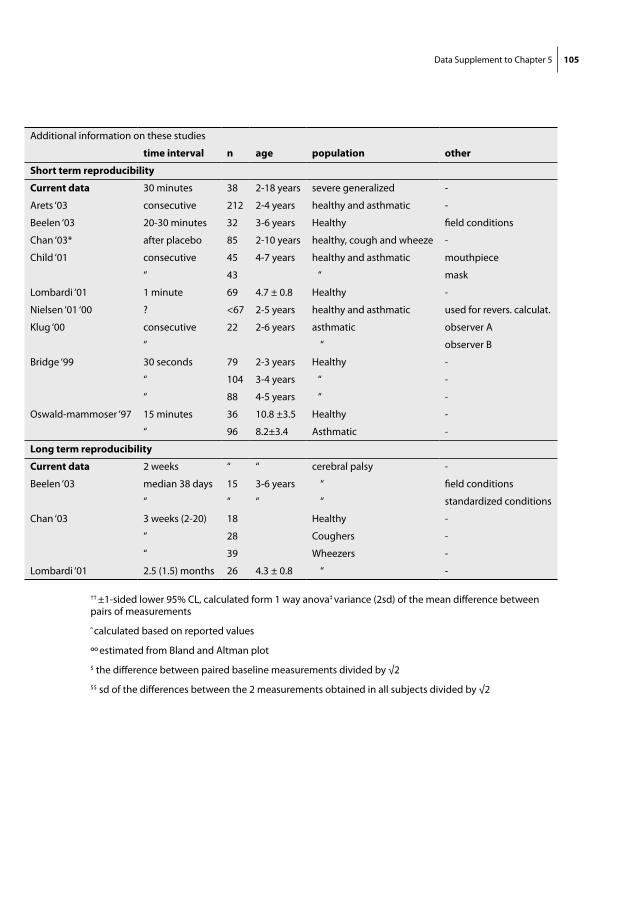
Data Supplement to Chapter 5 105
Additional information on these studies
time interval n age population other
Short term reproducibility
Current data 30 minutes 38 2-18 years severe generalized -
Arets ‘03 consecutive 212 2-4 years healthy and asthmatic -
Beelen ‘03 20-30 minutes 32 3-6 years Healthy field conditions
Chan ‘03* after placebo 85 2-10 years healthy, cough and wheeze -
Child ‘01 consecutive 45 4-7 years healthy and asthmatic mouthpiece
“ 43 “ mask
Lombardi ‘01 1 minute 69 4.7 ± 0.8 Healthy -
Nielsen ‘01 ‘00 ? <67 2-5 years healthy and asthmatic used for revers. calculat.
Klug ‘00 consecutive 22 2-6 years asthmatic observer A
“ “ observer B
Bridge ‘99 30 seconds 79 2-3 years Healthy -
“ 104 3-4 years “ -
“ 88 4-5 years “ -
Oswald-mammoser ‘97 15 minutes 36 10.8 ±3.5 Healthy -
“ 96 8.2±3.4 Asthmatic -
Long term reproducibility
Current data 2 weeks “ “ cerebral palsy -
Beelen ‘03 median 38 days 15 3-6 years “ field conditions
“ “ “ “ standardized conditions
Chan ‘03 3 weeks (2-20) 18 Healthy -
“ 28 Coughers -
“ 39 Wheezers -
Lombardi ‘01 2.5 (1.5) months 26 4.3 ± 0.8 “ -
†† ±1-sided lower 95% CL, calculated form 1 way anova‡ variance (2sd) of the mean difference between pairs of measurements
º calculated based on reported values
ºº estimated from Bland and Altman plot
$ the difference between paired baseline measurements divided by √2
$$ sd of the differences between the 2 measurements obtained in all subjects divided by √2
106 Chapter 5
Cha
pte
r 5
REFERENCES
1. Palisano, R., et al., Development and reliability of a system to classify gross motor function in children with cerebral palsy. Dev Med Child Neurol, 1997. 39(4): p. 214-23.
2. Gerver, W. and R. de Bruin, Paediatric Morphometrics: a reference manual. 1996, Utrecht, The Netherlands.
3. Chinn, S., Statistics in respiratory medicine. 2. Repeatability and method comparison. Thorax, 1991. 46(6): p. 454-6.
4. Bland, J.M. and D.G. Altman, Statistical methods for assessing agreement between two methods of clinical measurement. Lancet, 1986. 1(8476): p. 307-10.
5. Arets, H.G., H.J. Brackel, and C.K. van der Ent, Applicability of interrupter resistance measure-ments using the MicroRint in daily practice. Respir Med, 2003. 97(4): p. 366-74.
6. Beydon, N., et al., Pulmonary function tests in preschool children with cystic fibrosis. Am J Respir Crit Care Med, 2002. 166(8): p. 1099-104.
7. Rubin, D.B. and N. Schenker, Multiple imputation in health-care databases: an overview and some applications. Stat Med, 1991. 10(4): p. 585-98.
8. Merkus, P.J., et al., Measurements of interrupter resistance: reference values for children 3-13 yrs of age. Eur Respir J, 2002. 20(4): p. 907-11.
9. Gappa, M., S.C. Ranganathan, and J. Stocks, Lung function testing in infants with cystic fibrosis: lessons from the past and future directions. Pediatr Pulmonol, 2001. 32(3): p. 228-45.
10. Lombardi, E., et al., Reference values of interrupter respiratory resistance in healthy preschool white children. Thorax, 2001. 56(9): p. 691-5.
11. Beydon, N., et al., Pre/postbronchodilator interrupter resistance values in healthy young children. Am J Respir Crit Care Med, 2002. 165(10): p. 1388-94.
12. McKenzie, S.A., et al., Airway resistance measured by the interrupter technique: normative data for 2-10 year olds of three ethnicities. Arch Dis Child, 2002. 87(3): p. 248-51.
13. Merkus, P.J., et al., Interrupter resistance in preschool children: measurement characteristics and reference values. Am J Respir Crit Care Med, 2001. 163(6): p. 1350-5.
Chapter 6
Prevalence and Clinical Presentation of Constipation in
Children with Severe Generalized Cerebral Palsy
R. Veugelers, E.A.C. Calis, C. Penning, M.A. Benninga,
D. Tibboel, H.M. Evenhuis
108 Chapter 6
Cha
pte
r 6
ABSTRACT
Objective Constipation is a common problem in neurologically impaired children.
Nevertheless, studies concerning prevalence and clinical characteristics of consti-
pation in this population are scarce. This study aimed to determine the prevalence
and clinical presentation of constipation in neurologically impaired children.
Methods This cross-sectional study was done in a representative populationbased
cohort study, as part of a large-scale study on risk factors of pneumonia and on
nutritional state in neurologically impaired children. A symptom-based definition
of constipation was formulated and applied. Between 2002 and 2004, the research-
ers visited 152 children with severe generalized cerebral palsy attending day-care
centres. All participating children had a combination of moderate to profound
intellectual disability (ID) and a profound motor disability, mean age was 9.5±4.5
years, 53% boys, 52% had profound ID, 3.6% could say yes and no.
Results The prevalence of constipation was 22%. 54% of the children used laxa-
tives, which was successful in 64% of the children. Six percent of the children
without laxatives were constipated. Water intake was deficient in 86.5% of the
children and fibre intake in 53%. No causal factors of constipation were found.
Trends were observed between constipation and BMI (on average one higher in
constipated, p=0.102) and with level of intellectual disability (less constipation in
profoundly than in moderately-severely disabled, p=0.084), however these were
not statistically significant. In addition, defecation frequency was not significant
correlated to insufficient fibre intake, water intake, BMI (p=0.056) or age.
Discussion The formulated symptom-based definition was well applicable, a
validation should be recommended, before common application in daily prac-
tice. The found prevalence was low compared to the prevalence in non-disabled
children (0.3-29%) 20, however, a high percentage of the children were already
treated. Results indicated that laxative was not effective in all children, stressing
the importance of regular treatment re-evaluation. We were unable to establish
causal effects of life style factors, this could indicate that neurological factors are
causally more important. There are however many other explanations. As long as
the etiology remains unclear, possible influencing life-style factors should be man-
aged properly. In our view, consensus on defining constipation in children with
severe neurological impairments would be an important step in the improvement
of health care for these children.

Constipation 109
INTRODUCTION
Children with severe generalized cerebral palsy, often experience comorbidity,
amongst which constipation is common 1-4. In these children constipation is likely
to be caused by both neurological factors such as muscular tone and innervation
problems 5-10 and life-style factors such as dietary fibre intake, immobility and
drug side-effects 9,11-19. Prevalence estimates widely range from 26% to 62% 1,2,8,18,
depending on the definition used for constipation, the diagnostic method and
patient selection. However, population based data are lacking. In the general
pediatric population, the prevalence of constipation is 0.3-37% 20-23.
The aim of the present study is to determine the prevalence of constipation in a
representative group of children with severe generalized cerebral palsy, without
intervening in treatment or diet. Since this study is performed in care facilities, the
diagnosis was based on symptoms and defecation patterns rather than on hospital-
based diagnostic criteria. We will also study the correlation between constipation
and medication, diet, personal and demographic factors and evaluate the clinical
presentation of constipation and current laxative use.
Patients and methods
Study design
This cross sectional study on constipation was part of a large cohort study (n=194)
on risk factors of recurrent pneumonias and malnutrition. That study included a
representative sample of the Dutch population of children with severe general-
ized cerebral palsy. All diagnostic measurements of this study were carried out at
specialized care facilities (day-care centres and schools), in order to avoid visits to
hospital. Ethical approval was obtained from the national ethics committee (Cen-
tral Committee on Research Involving Human Subjects). Prior to the study, parents
or legal guardians had given informed consent. The design and characteristics of
the study sample have been described in detail elsewhere 24.
Study population
All children were 2 – 18 years of age at the time of inclusion in the cohort study
and had a combination of moderate to profound intellectual disabilities (ID) and
a severe motor disability. This was defined by an IQ below 55 (or estimated by
dividing the developmental age by the calendar age times 100) and a hypertonic
or hypotonic generalized cerebral palsy or a developmental delay, maximally al-
lowing a child to crawl.
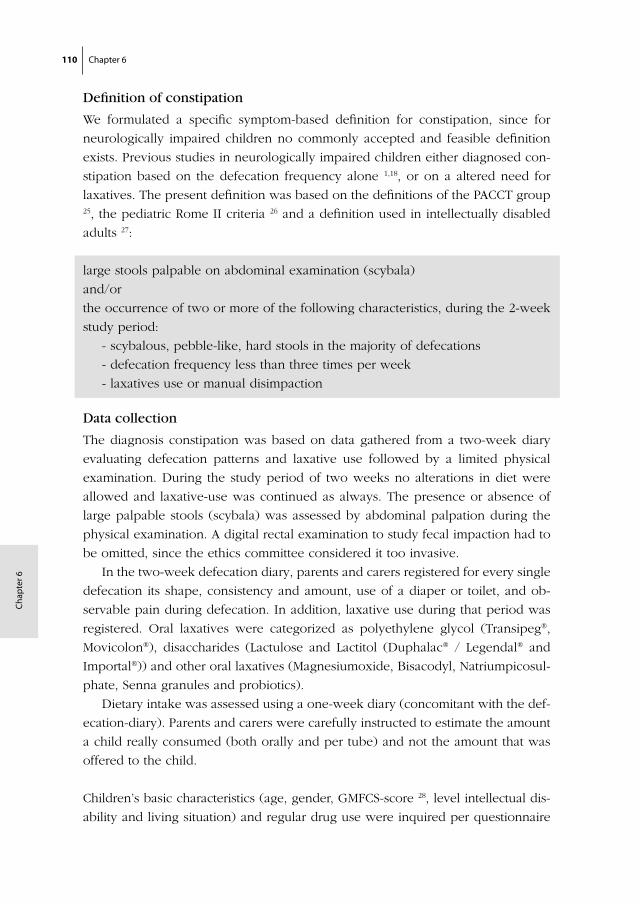
110 Chapter 6
Cha
pte
r 6
Definition of constipation
We formulated a specific symptom-based definition for constipation, since for
neurologically impaired children no commonly accepted and feasible definition
exists. Previous studies in neurologically impaired children either diagnosed con-
stipation based on the defecation frequency alone 1,18, or on a altered need for
laxatives. The present definition was based on the definitions of the PACCT group 25, the pediatric Rome II criteria 26 and a definition used in intellectually disabled
adults 27:
large stools palpable on abdominal examination (scybala)
and/or
the occurrence of two or more of the following characteristics, during the 2-week
study period:
- scybalous, pebble-like, hard stools in the majority of defecations
- defecation frequency less than three times per week
- laxatives use or manual disimpaction
Data collection
The diagnosis constipation was based on data gathered from a two-week diary
evaluating defecation patterns and laxative use followed by a limited physical
examination. During the study period of two weeks no alterations in diet were
allowed and laxative-use was continued as always. The presence or absence of
large palpable stools (scybala) was assessed by abdominal palpation during the
physical examination. A digital rectal examination to study fecal impaction had to
be omitted, since the ethics committee considered it too invasive.
In the two-week defecation diary, parents and carers registered for every single
defecation its shape, consistency and amount, use of a diaper or toilet, and ob-
servable pain during defecation. In addition, laxative use during that period was
registered. Oral laxatives were categorized as polyethylene glycol (Transipeg®,
Movicolon®), disaccharides (Lactulose and Lactitol (Duphalac® / Legendal® and
Importal®)) and other oral laxatives (Magnesiumoxide, Bisacodyl, Natriumpicosul-
phate, Senna granules and probiotics).
Dietary intake was assessed using a one-week diary (concomitant with the def-
ecation-diary). Parents and carers were carefully instructed to estimate the amount
a child really consumed (both orally and per tube) and not the amount that was
offered to the child.
Children’s basic characteristics (age, gender, GMFCS-score 28, level intellectual dis-
ability and living situation) and regular drug use were inquired per questionnaire
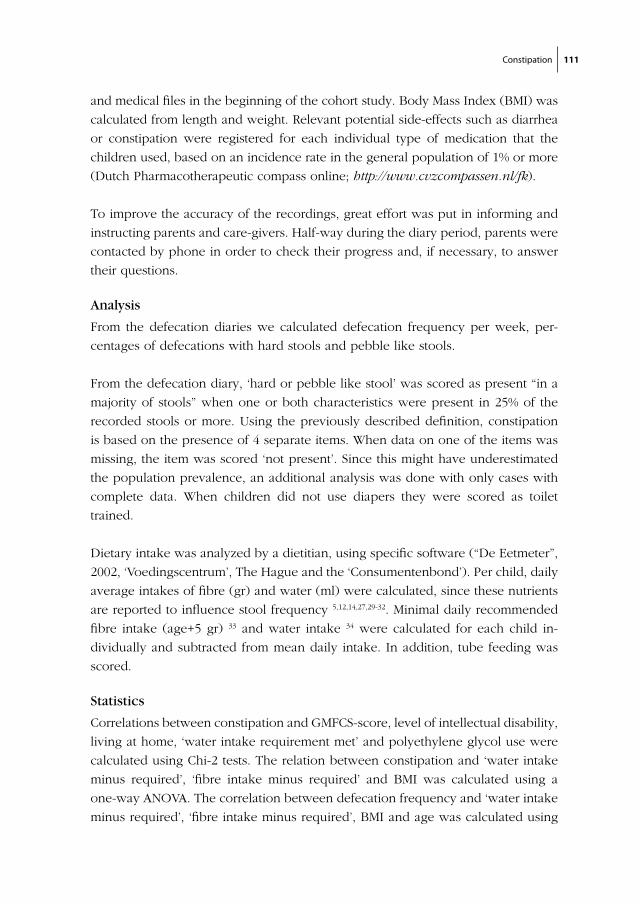
Constipation 111
and medical files in the beginning of the cohort study. Body Mass Index (BMI) was
calculated from length and weight. Relevant potential side-effects such as diarrhea
or constipation were registered for each individual type of medication that the
children used, based on an incidence rate in the general population of 1% or more
(Dutch Pharmacotherapeutic compass online; http://www.cvzcompassen.nl/fk).
To improve the accuracy of the recordings, great effort was put in informing and
instructing parents and care-givers. Half-way during the diary period, parents were
contacted by phone in order to check their progress and, if necessary, to answer
their questions.
Analysis
From the defecation diaries we calculated defecation frequency per week, per-
centages of defecations with hard stools and pebble like stools.
From the defecation diary, ‘hard or pebble like stool’ was scored as present “in a
majority of stools” when one or both characteristics were present in 25% of the
recorded stools or more. Using the previously described definition, constipation
is based on the presence of 4 separate items. When data on one of the items was
missing, the item was scored ‘not present’. Since this might have underestimated
the population prevalence, an additional analysis was done with only cases with
complete data. When children did not use diapers they were scored as toilet
trained.
Dietary intake was analyzed by a dietitian, using specific software (“De Eetmeter”,
2002, ‘Voedingscentrum’, The Hague and the ‘Consumentenbond’). Per child, daily
average intakes of fibre (gr) and water (ml) were calculated, since these nutrients
are reported to influence stool frequency 5,12,14,27,29-32. Minimal daily recommended
fibre intake (age+5 gr) 33 and water intake 34 were calculated for each child in-
dividually and subtracted from mean daily intake. In addition, tube feeding was
scored.
Statistics
Correlations between constipation and GMFCS-score, level of intellectual disability,
living at home, ‘water intake requirement met’ and polyethylene glycol use were
calculated using Chi-2 tests. The relation between constipation and ‘water intake
minus required’, ‘fibre intake minus required’ and BMI was calculated using a
one-way ANOVA. The correlation between defecation frequency and ‘water intake
minus required’, ‘fibre intake minus required’, BMI and age was calculated using
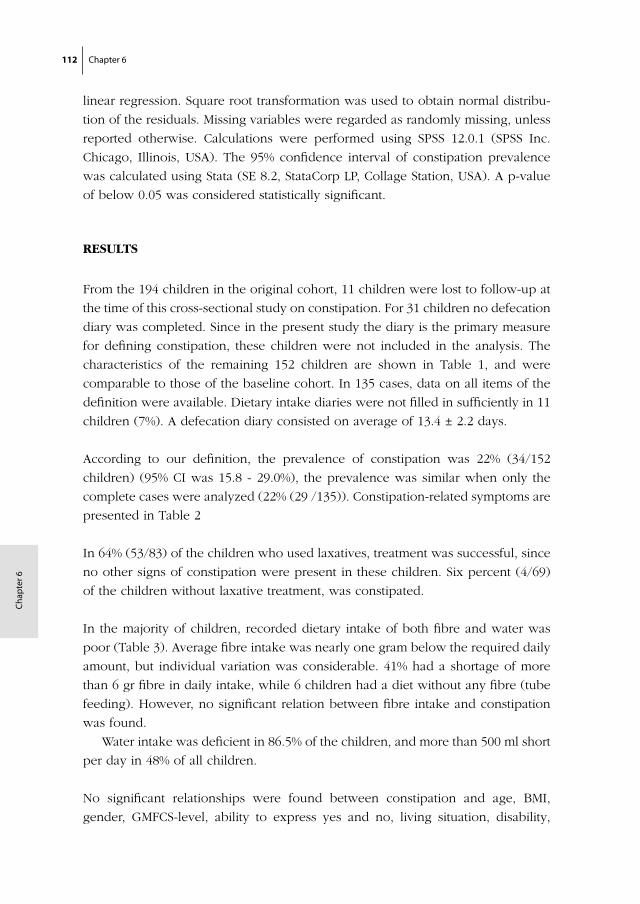
112 Chapter 6
Cha
pte
r 6
linear regression. Square root transformation was used to obtain normal distribu-
tion of the residuals. Missing variables were regarded as randomly missing, unless
reported otherwise. Calculations were performed using SPSS 12.0.1 (SPSS Inc.
Chicago, Illinois, USA). The 95% confidence interval of constipation prevalence
was calculated using Stata (SE 8.2, StataCorp LP, Collage Station, USA). A p-value
of below 0.05 was considered statistically significant.
RESULTS
From the 194 children in the original cohort, 11 children were lost to follow-up at
the time of this cross-sectional study on constipation. For 31 children no defecation
diary was completed. Since in the present study the diary is the primary measure
for defining constipation, these children were not included in the analysis. The
characteristics of the remaining 152 children are shown in Table 1, and were
comparable to those of the baseline cohort. In 135 cases, data on all items of the
definition were available. Dietary intake diaries were not filled in sufficiently in 11
children (7%). A defecation diary consisted on average of 13.4 ± 2.2 days.
According to our definition, the prevalence of constipation was 22% (34/152
children) (95% CI was 15.8 - 29.0%), the prevalence was similar when only the
complete cases were analyzed (22% (29 /135)). Constipation-related symptoms are
presented in Table 2
In 64% (53/83) of the children who used laxatives, treatment was successful, since
no other signs of constipation were present in these children. Six percent (4/69)
of the children without laxative treatment, was constipated.
In the majority of children, recorded dietary intake of both fibre and water was
poor (Table 3). Average fibre intake was nearly one gram below the required daily
amount, but individual variation was considerable. 41% had a shortage of more
than 6 gr fibre in daily intake, while 6 children had a diet without any fibre (tube
feeding). However, no significant relation between fibre intake and constipation
was found.
Water intake was deficient in 86.5% of the children, and more than 500 ml short
per day in 48% of all children.
No significant relationships were found between constipation and age, BMI,
gender, GMFCS-level, ability to express yes and no, living situation, disability,
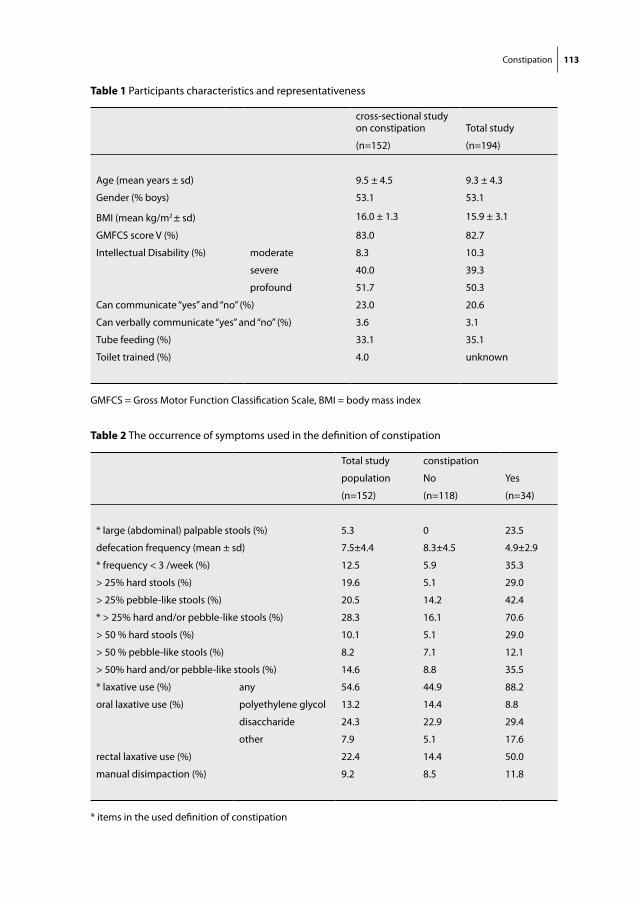
Constipation 113
Table 1 Participants characteristics and representativeness
cross-sectional study on constipation Total study
(n=152) (n=194)
Age (mean years ± sd) 9.5 ± 4.5 9.3 ± 4.3
Gender (% boys) 53.1 53.1
BMI (mean kg/m2 ± sd) 16.0 ± 1.3 15.9 ± 3.1
GMFCS score V (%) 83.0 82.7
Intellectual Disability (%) moderate 8.3 10.3
severe 40.0 39.3
profound 51.7 50.3
Can communicate “yes” and “no” (%) 23.0 20.6
Can verbally communicate “yes” and “no” (%) 3.6 3.1
Tube feeding (%) 33.1 35.1
Toilet trained (%) 4.0 unknown
GMFCS = Gross Motor Function Classification Scale, BMI = body mass index
Table 2 The occurrence of symptoms used in the definition of constipation
Total study constipation
population No Yes
(n=152) (n=118) (n=34)
* large (abdominal) palpable stools (%) 5.3 0 23.5
defecation frequency (mean ± sd) 7.5±4.4 8.3±4.5 4.9±2.9
* frequency < 3 /week (%) 12.5 5.9 35.3
> 25% hard stools (%) 19.6 5.1 29.0
> 25% pebble-like stools (%) 20.5 14.2 42.4
* > 25% hard and/or pebble-like stools (%) 28.3 16.1 70.6
> 50 % hard stools (%) 10.1 5.1 29.0
> 50 % pebble-like stools (%) 8.2 7.1 12.1
> 50% hard and/or pebble-like stools (%) 14.6 8.8 35.5
* laxative use (%) any 54.6 44.9 88.2
oral laxative use (%) polyethylene glycol 13.2 14.4 8.8
disaccharide 24.3 22.9 29.4
other 7.9 5.1 17.6
rectal laxative use (%) 22.4 14.4 50.0
manual disimpaction (%) 9.2 8.5 11.8
* items in the used definition of constipation
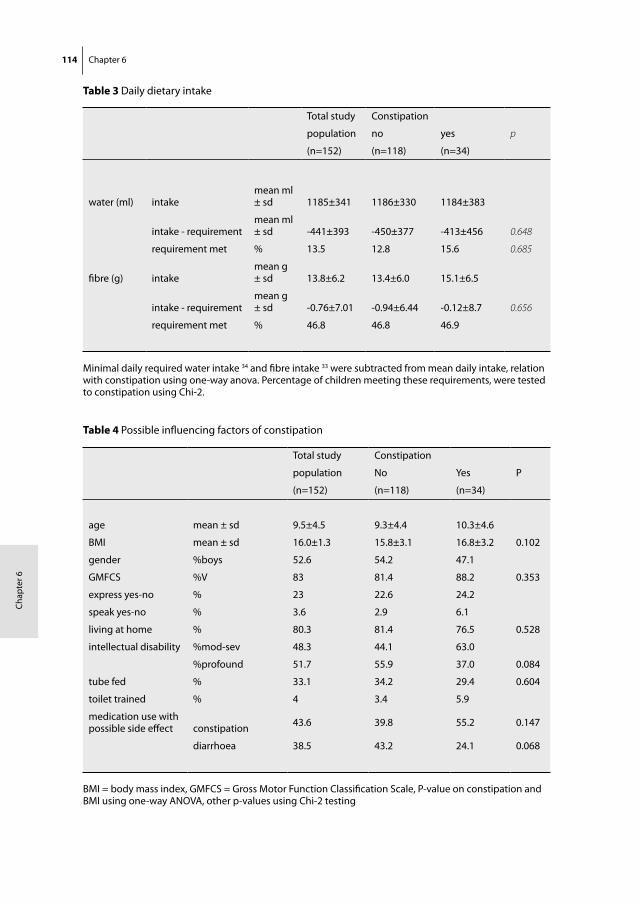
114 Chapter 6
Cha
pte
r 6
Table 3 Daily dietary intake
Total study Constipation
population no yes p
(n=152) (n=118) (n=34)
water (ml) intake mean ml ± sd 1185±341 1186±330 1184±383
intake - requirementmean ml ± sd -441±393 -450±377 -413±456 0.648
requirement met % 13.5 12.8 15.6 0.685
fibre (g) intakemean g ± sd 13.8±6.2 13.4±6.0 15.1±6.5
intake - requirement mean g ± sd -0.76±7.01 -0.94±6.44 -0.12±8.7 0.656
requirement met % 46.8 46.8 46.9
Minimal daily required water intake 34 and fibre intake 33 were subtracted from mean daily intake, relation with constipation using one-way anova. Percentage of children meeting these requirements, were tested to constipation using Chi-2.
Table 4 Possible influencing factors of constipation
Total study Constipation
population No Yes P
(n=152) (n=118) (n=34)
age mean ± sd 9.5±4.5 9.3±4.4 10.3±4.6
BMI mean ± sd 16.0±1.3 15.8±3.1 16.8±3.2 0.102
gender %boys 52.6 54.2 47.1
GMFCS %V 83 81.4 88.2 0.353
express yes-no % 23 22.6 24.2
speak yes-no % 3.6 2.9 6.1
living at home % 80.3 81.4 76.5 0.528
intellectual disability %mod-sev 48.3 44.1 63.0
%profound 51.7 55.9 37.0 0.084
tube fed % 33.1 34.2 29.4 0.604
toilet trained % 4 3.4 5.9
medication use with possible side effect constipation 43.6 39.8 55.2 0.147
diarrhoea 38.5 43.2 24.1 0.068
BMI = body mass index, GMFCS = Gross Motor Function Classification Scale, P-value on constipation and BMI using one-way ANOVA, other p-values using Chi-2 testing
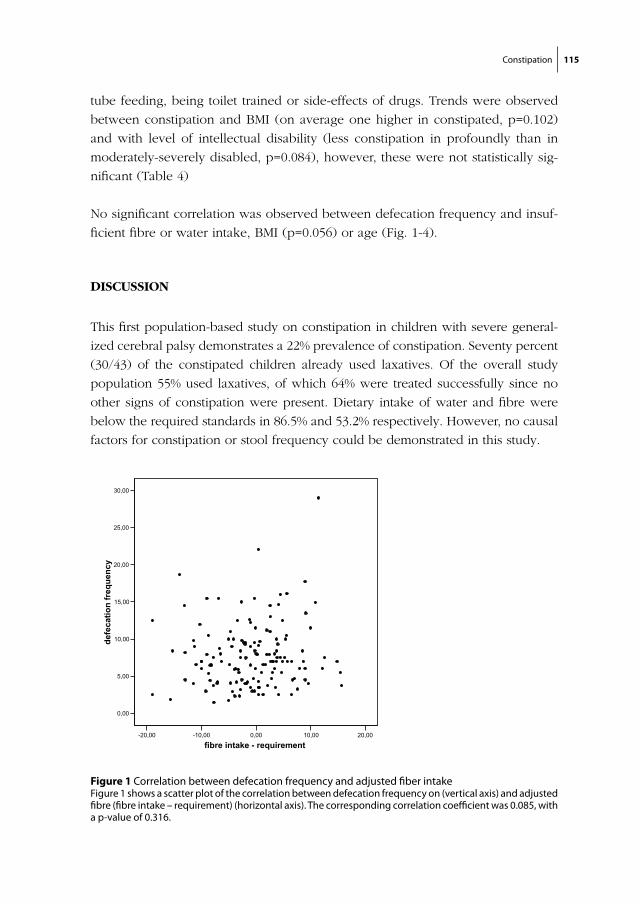
Constipation 115
tube feeding, being toilet trained or side-effects of drugs. Trends were observed
between constipation and BMI (on average one higher in constipated, p=0.102)
and with level of intellectual disability (less constipation in profoundly than in
moderately-severely disabled, p=0.084), however, these were not statistically sig-
nificant (Table 4)
No significant correlation was observed between defecation frequency and insuf-
ficient fibre or water intake, BMI (p=0.056) or age (Fig. 1-4).
DISCUSSION
This first population-based study on constipation in children with severe general-
ized cerebral palsy demonstrates a 22% prevalence of constipation. Seventy percent
(30/43) of the constipated children already used laxatives. Of the overall study
population 55% used laxatives, of which 64% were treated successfully since no
other signs of constipation were present. Dietary intake of water and fibre were
below the required standards in 86.5% and 53.2% respectively. However, no causal
factors for constipation or stool frequency could be demonstrated in this study.
Figure 1 Correlation between defecation frequency and adjusted fiber intake Figure 1 shows a scatter plot of the correlation between defecation frequency on (vertical axis) and adjusted fibre (fibre intake – requirement) (horizontal axis). The corresponding correlation coefficient was 0.085, with a p-value of 0.316.
chapter 6/figure 1
-20,00 -10,00 0,00 10,00 20,00
fibre intake - requirement
0,00
5,00
10,00
15,00
20,00
25,00
30,00
defe
catio
n fr
eque
ncy
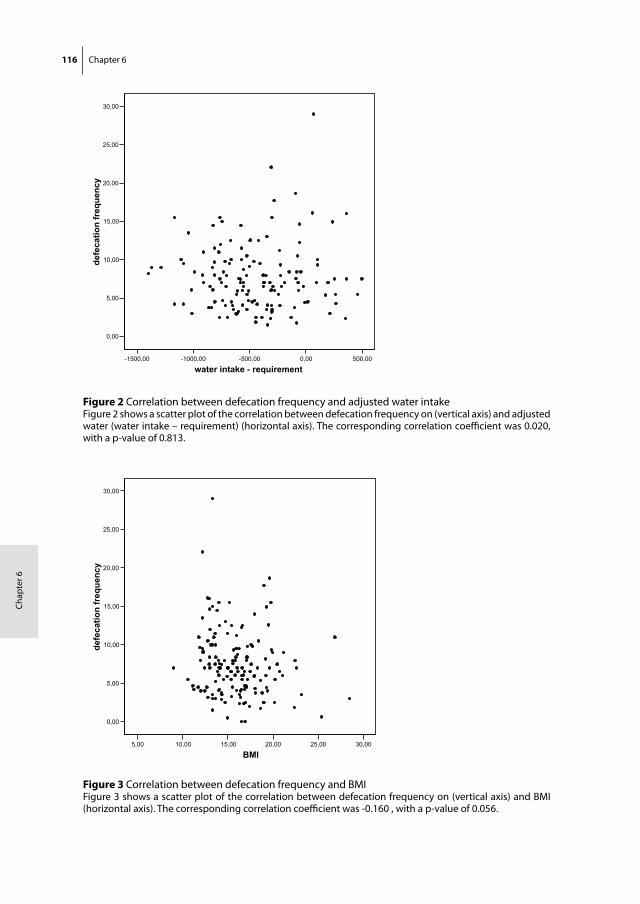
116 Chapter 6
Cha
pte
r 6
Figure 2 Correlation between defecation frequency and adjusted water intakeFigure 2 shows a scatter plot of the correlation between defecation frequency on (vertical axis) and adjusted water (water intake – requirement) (horizontal axis). The corresponding correlation coefficient was 0.020, with a p-value of 0.813.
chapter 6/figure 2
-1500,00 -1000,00 -500,00 0,00 500,00
water intake - requirement
0,00
5,00
10,00
15,00
20,00
25,00
30,00de
feca
tion
freq
uenc
y
Figure 3 Correlation between defecation frequency and BMIFigure 3 shows a scatter plot of the correlation between defecation frequency on (vertical axis) and BMI (horizontal axis). The corresponding correlation coefficient was -0.160 , with a p-value of 0.056.
chapter 6/figure 3
5,00 10,00 15,00 20,00 25,00 30,00
BMI
0,00
5,00
10,00
15,00
20,00
25,00
30,00
defe
catio
n fr
eque
ncy
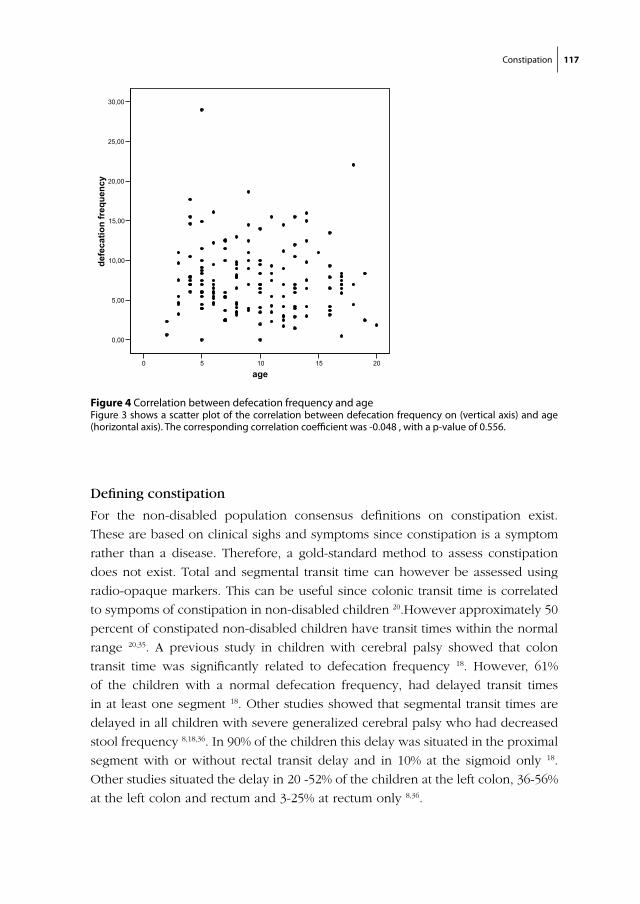
Constipation 117
Defining constipation
For the non-disabled population consensus definitions on constipation exist.
These are based on clinical sighs and symptoms since constipation is a symptom
rather than a disease. Therefore, a gold-standard method to assess constipation
does not exist. Total and segmental transit time can however be assessed using
radio-opaque markers. This can be useful since colonic transit time is correlated
to sympoms of constipation in non-disabled children 20.However approximately 50
percent of constipated non-disabled children have transit times within the normal
range 20,35. A previous study in children with cerebral palsy showed that colon
transit time was significantly related to defecation frequency 18. However, 61%
of the children with a normal defecation frequency, had delayed transit times
in at least one segment 18. Other studies showed that segmental transit times are
delayed in all children with severe generalized cerebral palsy who had decreased
stool frequency 8,18,36. In 90% of the children this delay was situated in the proximal
segment with or without rectal transit delay and in 10% at the sigmoid only 18.
Other studies situated the delay in 20 -52% of the children at the left colon, 36-56%
at the left colon and rectum and 3-25% at rectum only 8,36.
Figure 4 Correlation between defecation frequency and ageFigure 3 shows a scatter plot of the correlation between defecation frequency on (vertical axis) and age (horizontal axis). The corresponding correlation coefficient was -0.048 , with a p-value of 0.556.
chapter 6/figure 4
0 5 10 15 20
age
0,00
5,00
10,00
15,00
20,00
25,00
30,00de
feca
tion
freq
uenc
y

118 Chapter 6
Cha
pte
r 6
In our study we formulated and used a symptom-based definition. Not only does
this resemble the normal diagnostic procedure best, it can also be performed
on-site. The aim of our study was to determine a population-prevalence of con-
stipation. For that purpose it was necessary to include a representative cohort. By
performing all diagnostics at the day-care centres and specialized schools, hospital
visits were avoided, therewith increasing the inclusion rate. In addition, symptom-
based diagnosing also avoids radiation exposure and fulfils the need for a specific
symptom-based definition for neurologically impaired children.
Previous studies on constipation using symptom-based diagnosis in comparable
populations have compared defecation frequency or laxative use between groups
or following an intervention 5,12,14,31, based their diagnosis on defecation frequency
only 1,8,18,36, or used a combination of these 27. However, symptom-based defini-
tions for this population have never been based on the pediatric Rome criteria for
functional gastrointestinal disorders or the PACCT-definition.
Defining constipation based on symptoms is difficult in neurologically impaired
children because definitions for non-disabled children 25,26 include items that can
not be used, such as ‘with-holding behaviours’ and ‘no evidence of structural
disease’. In addition, faecal incontinence can not be assessed since most disabled
children use diapers.
The definition we have developed is a combination of the applicable items of
the definitions for non-disabled children combined with laxative use. We chose
a two-week observation period in accordance with the pediatric Rome II criteria,
which should be sufficient due to the usually chronic nature of constipation in
these children. For carers this period proved feasible: diaries were kept 13.4 days
on average and were filled out properly by most parents. Some concerns could
be raised on judging stool consistency in diapers (which nearly all children used),
however, most parents had no difficulty to distinguish this.
Overall, we conclude that the developed symptom-based definition is feasible in
daily practice. However, before using it in practice, we would recommend adding
faecal impaction to the definition, in accordance with the PACCT-definition. This
established sign of constipation is even more important in children with severe
generalized cerebral palsy since it is one of the few observable symptoms. We
would suggest the following:
Constipation 119
Large stools in the rectum or palpable on abdominal examination
and/or
the occurrence of two or more of the following characteristics, during the 2-week
study period:
• scybalous, pebble-like, hard stools for a majority of stools
• defecation frequency less than three times per week
• laxative use or manual disimpaction
Before common application, this definition should however be validated using
colon transit time. In our view, consensus on defining constipation in children
with severe neurological impairments would be an important step in the improve-
ment of health care for these children.
The prevalence of constipation
This study indicates that 22% of the children with severe generalized cerebral
palsy in the Netherlands are constipated, regardless laxative use. Compared to the
prevalence in non-disabled children (0.3-29%) 20, the problem appears to be lim-
ited. However, if the percentage of children that already used laxatives was added
to that of non-diagnosed constipation, this study would suggest a prevalence rate
of 57% (87/152).
Previous studies in disabled children found constipation in 26-90% of children 1,2,8,18,36. This large interval can be explained in many different ways. Firstly, by the
chosen study population. When studying severely disabled children from a gastro-
entrology out-patient clinic, the prevalence of constipation will be overestimated
due to selection bias of children with symptoms. In addition, the applied defini-
tion of constipation is of influence. Would we have defined constipation as only a
defecation frequency < 3 /week, the prevalence would be 12,5%.
Etiology and contributing factors
In children with neurological impairments constipation etiology is believed to be
due to a combination of neurological and life style factors. Aspects of this neu-
rological pathway include: decreased neuromuscular tone of the gastrointestinal
tract 5, defect in gut innervation 6, disruption of neural modulation due to central
structure damage 7-9, lack of conscious urge to defecate 10 and motor paralysis of
the abdominal and perineal muscles 10.
In addition, life style factors can contribute to a reduced defecation frequency.
Insufficient dietary fibre intake for example, is a generally accepted causal fac-
120 Chapter 6
Cha
pte
r 6
tor for the pathogenesis of constipation in disabled 27,29,30,37,38 and non-disabled 13
children. In children with severe generalized cerebral palsy, feeding problems are
common and therefore dietary intake is often problematic. In our study, nearly
53% of the children had an inadequate fibre intake.
Previous studies on the effects of increasing dietary fibre in severely handi-
capped children showed inconsistent results. A decrease in laxative use 12,14 and an
improved stool frequency 14,32 were demonstrated, although others only showed
improved consistency and stool size 31. Two other studies showed no relation
with colon transit time 14,18. Whereas others found no relationship between dietary
fibre and constipation 18,39,40, which is in accordance with our results. An other well
accepted cause of constipation in handicapped is insufficient fluid intake 5,27,29,30,
which is described as part of treatment as well 2,38. A study in non-disabled adults
showed that fluid deprivation decreases stool frequency and stool weight 16. In
the present study, nearly 87% had an inadequate intake of water. However, like
two previous studies 18,40, we found no relationship between constipation and fluid
intake.
Most likely the combination between both fibre and fluid intake is important. A
study in adults with chronic functional constipation showed that the effect of high
fibre intake on stool frequency was enhanced by increasing fluid intake as well.
An other possible influencing life style factor is immobility 9,18 which we did not
study. The studied GMFCS-score for motor impairment is a crude measure and
therefore not a good indicator. Also drug side effects 9, such as anticonvulsants
and antispasmodics 19 are known to affect constipation. In our population multi-
drug use was common, however no relation with constipation was found.
A trend was shown towards a higher prevalence of constipation in children with
milder intellectual disability. This is most likely a confounding effect due to related
motor impairment, prescribed drugs, dietary intake or tube feeding.
Since we were unable to establish causal effects of these life style factors, this
could indicate that neurological factors are causally more important. There are
however many other explanations. The definition might be inadequate since
proper validation is lacking, the group of constipated children was relatively small
for a proper risk factor analysis, in a multi-factorial etiology the use of laxatives
might have clouded the causal relations. As long as the etiology remains unclear,
possible influencing life-style factors should be managed properly.
Constipation 121
Treatment and recommendations
Laxatives were used in 55% of the children, of which 64% had no observable signs
of constipation and therefore we conclude that in those children treatment was
successful. For the remaining 36%, laxative treatment was not adequate, indicating
either insufficient dosage, inadequate usage or unresponsiveness to treatment.
Treatment might have been indicated in 6% (4/69) of the children who did not
receive laxatives.
To our clinical experience, physicians tend to be prudent in prescribing laxatives
in these children. Many articles have been published, speculating on the best
treatment of these children, however, the effects are barely studied. Most authors
argue that treatment should be conform the standards for non-disabled children 6,29.However, it has been previously suggested that constipation in neurologically
impaired children is often less responsive to treatment 22,30. Our study showed,
that many children were not treated with polyethylene glycol, although these are
nowadays often considered as the laxative of first choice in pediatric constipa-
tion41. To develop an optimal treatment of constipation in children with severe
generalized cerebral palsy, intention studies should be performed
Besides the prescription of effective laxatives, proper attention should also be
paid to a treatment plan regarding not only effectiveness but also feasibility and
clarity for the carers. Since many carers are involved with the care for one child,
and it is difficult to maintain a proper overview of the defecation pattern and the
treatment plan.
Furthermore, it is important that constipation and the effectiveness of prescribed
treatment is regularly re-evaluated. A validated symptom-based definition of con-
stipation could offer support for these evaluations.
However, the ultimate goal should be prevention of constipation. Although
our study failed to demonstrate a significant contribution of life style factors to
constipation, optimizing mobility, fibre and water intake should be promoted.
IN CONCLUSION
This study indicates that 22% of the children with severe generalized cerebral palsy
in the Netherlands are constipated, regardless the use of laxatives. Interpretation of
this prevalence rate is difficult since the diagnostic value of our definition has not
been established yet. Still, this is the first study on symptoms and signs regarding
122 Chapter 6
Cha
pte
r 6
constipation in a large, representative population of children with severe general-
ized cerebral palsy. Due to the specified definition and due to the publication of
the separate symptoms, this study is not only of great epidemiologic value, but
might contribute to future diagnosing and treatment evaluation of neurologically
impaired children.
No relation between life-style factors and constipation or defecation frequency
was shown, therefore many questions on etiology and prevention remain. Dietary
intake of water and fibres was poor in many children. Also many constipated
children use laxatives without it resolving their defecation problems. The effect
of laxatives should therefore be monitored properly. More importantly care-givers
should be instructed properly on how to adjust dosages when necessary.
For the future it is important to reach consensus on a symptom-based definition
of constipation in neurologically impaired children. Ideally this would be based
upon a validation study of the proposed definition using colonic transit times. Also
studies on primary causes of constipation, for example studying gastro-intestinal
motility problems in general, could learn us more on the etiology and therewith
on prevention and treatment of constipation in children with severe generalized
cerebral palsy.
Constipation 123
REFERENCES
1. Sullivan, P.B., et al., Prevalence and severity of feeding and nutritional problems in children with neurological impairment: Oxford Feeding Study. Dev Med Child Neurol, 2000. 42(10): p. 674-80.
2. Feldkamp, M., et al., [Vegetative disorders in children with cerebral palsy. Results of an inquiry of parents] Vegetative Storungen bei zerebralparetischen Kindern. Ergebnisse einer Elternbefragung. Monatsschr Kinderheilkd, 1976. 124(8): p. 583-9.
3. Klein, H., Constipation and fecal impaction. Med Clin North Am, 1982. 66(5): p. 1135-41.
4. Gonzalez, L., C.M. Nazario, and M.J. Gonzalez, Nutrition-related problems of pediatric patients with neuromuscular disorders. P R Health Sci J, 2000. 19(1): p. 35-8.
5. Frame, P.S., et al., Use of colchicine to treat severe constipation in developmentally disabled patients. J Am Board Fam Pract, 1998. 11(5): p. 341-6.
6. Sullivan, P.B., Gastrointestinal problems in the neurologically impaired child. Baillieres Clin Gas-troenterol, 1997. 11(3): p. 529-46.
7. Johanson, J.F., et al., Association of constipation with neurologic diseases. Dig Dis Sci, 1992. 37(2): p. 179-86.
8. Staiano, A. and E. Del Giudice, Colonic transit and anorectal manometry in children with severe brain damage. Pediatrics, 1994. 94(2 Pt 1): p. 169-73.
9. Del Giudice, E., Cerebral palsy and gut functions. J Pediatr Gastroenterol Nutr, 1997. 25 Suppl 1: p. S22-3.
10. Staiano, A., et al., Cisapride in neurologically impaired children with chronic constipation. Dig Dis Sci, 1996. 41(5): p. 870-4.
11. Burkitt, D.P., A.R. Walker, and N.S. Painter, Dietary fiber and disease. Jama, 1974. 229(8): p. 1068-74.
12. Tse, P.W., et al., Dietary fibre intake and constipation in children with severe developmental disabilities. J Paediatr Child Health, 2000. 36(3): p. 236-9.
13. Morais, M.B., et al., Measurement of low dietary fiber intake as a risk factor for chronic constipation in children. J Pediatr Gastroenterol Nutr, 1999. 29(2): p. 132-5.
14. Staiano, A., et al., Effect of the dietary fiber glucomannan on chronic constipation in neurologically impaired children. J Pediatr, 2000. 136(1): p. 41-5.
15. Anti, M., et al., Water supplementation enhances the effect of high-fiber diet on stool frequency and laxative consumption in adult patients with functional constipation. Hepatogastroenterology, 1998. 45(21): p. 727-32.
16. Klauser, A.G., et al., Low fluid intake lowers stool output in healthy male volunteers. Z Gastroen-terol, 1990. 28(11): p. 606-9.
17. Benson, J.A., Jr., Simple chronic constipation: pathophysiology and management. Postgrad Med, 1975. 57(1): p. 55-60.
18. Park, E.S., et al., Colonic transit time and constipation in children with spastic cerebral palsy. Arch Phys Med Rehabil, 2004. 85(3): p. 453-6.
19. Talley, N.J., et al., Risk factors for chronic constipation based on a general practice sample. Am J Gastroenterol, 2003. 98(5): p. 1107-11.
20. Benninga, M.A., W.P. Voskuijl, and J.A. Taminiau, Childhood constipation: is there new light in the tunnel? J Pediatr Gastroenterol Nutr, 2004. 39(5): p. 448-64.
124 Chapter 6
Cha
pte
r 6
21. Miele, E., et al., Functional gastrointestinal disorders in children: an Italian prospective survey. Pediatrics, 2004. 114(1): p. 73-8.
22. Loening-Baucke, V., Constipation in children. N Engl J Med, 1998. 339(16): p. 1155-6.
23. de Araujo Sant’Anna, A.M. and A.C. Calcado, Constipation in school-aged children at public schools in Rio de Janeiro, Brazil. J Pediatr Gastroenterol Nutr, 1999. 29(2): p. 190-3.
24. Veugelers, R., et al., A population-based nested case control study on recurrent pneumonias in children with severe generalized cerebral palsy: ethical considerations of the design and represen-tativeness of the study sample. BMC Pediatr, 2005. 5(1): p. 25.
25. Benninga, M., et al., The Paris Consensus on Childhood Constipation Terminology (PACCT) Group. J Pediatr Gastroenterol Nutr, 2005. 40(3): p. 273-5.
26. Rasquin-Weber, A., et al., Childhood functional gastrointestinal disorders. Gut, 1999. 45 Suppl 2: p. II60-8.
27. Bohmer, C.J., et al., The prevalence of constipation in institutionalized people with intellectual disability. J Intellect Disabil Res, 2001. 45(Pt 3): p. 212-8.
28. Palisano, R.J., et al., Validation of a model of gross motor function for children with cerebral palsy. Phys Ther, 2000. 80(10): p. 974-85.
29. Elawad, M.A. and P.B. Sullivan, Management of constipation in children with disabilities. Dev Med Child Neurol, 2001. 43(12): p. 829-32.
30. Chong, S.K., Gastrointestinal problems in the handicapped child. Curr Opin Pediatr, 2001. 13(5): p. 441-6.
31. Fischer, M., et al., The effects of dietary fibre in a liquid diet on bowel function of mentally retarded individuals. J Ment Defic Res, 1985. 29 ( Pt 4): p. 373-81.
32. Liebl, B.H., et al., Dietary fiber and long-term large bowel response in enterally nourished nonam-bulatory profoundly retarded youth. JPEN J Parenter Enteral Nutr, 1990. 14(4): p. 371-5.
33. Williams, C.L., M. Bollella, and E.L. Wynder, A new recommendation for dietary fiber in childhood. Pediatrics, 1995. 96(5 Pt 2): p. 985-8.
34. Guidelines for the use of parenteral and enteral nutrition in adult and pediatric patients. American Society for Parenteral and Enteral Nutrition. JPEN J Parenter Enteral Nutr, 1993. 17(4 Suppl): p. 1SA-52SA.
35. de Lorijn, F., et al., Prognosis of constipation: clinical factors and colonic transit time. Arch Dis Child, 2004. 89(8): p. 723-7.
36. Del Giudice, E., et al., Gastrointestinal manifestations in children with cerebral palsy. Brain Dev, 1999. 21(5): p. 307-11.
37. Laidler, J., Jr., Nutritional assessment of common problems found among the developmentally disabled. Ment Retard, 1976. 14(4): p. 24-8.
38. Bishop, P.R. and M.J. Nowicki, Defecation disorders in the neurologically impaired child. Pediatr Ann, 1999. 28(5): p. 322-9.
39. Mooren, G.C., et al., Het verband tussen inname van voedingsvezels en chronische obstipatie bij kinderen. Ned Tijdschr Geneeskd, 1996. 140(41): p. 2036-9.
40. Tolia, V., J. Ventimiglia, and L. Kuhns, Gastrointestinal tolerance of a pediatric fiber formula in developmentally disabled children. J Am Coll Nutr, 1997. 16(3): p. 224-8.
41. Voskuijl, W., et al., PEG 3350 (Transipeg) versus lactulose in the treatment of childhood functional constipation: a double blind, randomised, controlled, multicentre trial. Gut, 2004. 53(11): p. 1590-4.
Chapter 7
General Discussion
126 Chapter 7
Cha
pte
r 7
Non-orthopedic comorbidity in children with severe motor and intellectual dis-
abilities (SMID) has seldom been studied, and population-based data have been
lacking entirely. Healthcare professionals are often uncertain about the actions
needed to prevent and treat comorbidity in these children. Moreover, as long as
valid research data are not available, development of evidence-based guidelines
on the prevention and treatment of co-morbid disorders is not possible. After
having performed a population-based study, it is easier for our research group
to understand why such data are lacking, i.e. since this type of research in these
children is far from easy. Our population-based study in children with severe
generalized cerebral palsy has, however, not only provided a lot of data but has
also resulted in much practical experience, which future researchers studying this
complex population may benefit from.
This chapter consists of three main sections:
1 “Reflections on study results” places the results of this study within a time
perspective, and addresses the practical value of the diagnostic methods
used.
2 “Considerations for future research”, addresses decisions to be made when
preparing a study among children with SMID`, concerning study design,
measurement setting, and diagnostic methods.
3 “Recommendations for future research” are presented and discussed.
Reflections on study results
The chapters of this thesis addresses different topics, which are all related to
one major issue: comorbidity in children with SMID. The epidemiologic study
described in this thesis is one of the first steps towards compiling guidelines on
the prevention and treatment of these co-morbidities; however, many more steps
need to be taken. Historically, answers to clinical questions are obtained through
studies with increasing scientific value.
In most medical specialties, these steps were taken many decades ago, re-
sulting in highly sophisticated research and guideline development. However, in
Intellectual Disability Medicine, research is relatively new or even just starting.
Most of the literature in this field consists of case reports, retrospective studies,
clinical observational studies in small selected groups, and uncontrolled interven-
tion studies, all resulting in relevant preliminary information and ideas, but not in
robust scientific evidence.
However, well-designed epidemiological studies are needed to validly identify
the size of a problem and risk groups. Subsequently, well-designed intervention
studies should be performed, preferably with a double-blind randomized-con-
General Discussion 127
trolled design. Based on (meta-analysis of) such studies, practice guidelines may
then be developed.
Value of the diagnostic methods in practice
Most of the diagnostic methods used in the present study are not ‘gold standard’
methods. Such methods are often not feasible in children with SMID because their
motor and intellectual disabilities prevent them from meeting the required level
of cooperation. Furthermore, ethics committees stipulate that in persons unable to
give informed consent, the diagnostic methods must be non-invasive unless the
necessity of such a method is incontrovertible.
In addition, the present study was performed on-site (i.e. not in hospital)
requiring that all diagnostic methods be ambulatory available.
Bioelectrical Impedance Assessment (BIA)
Nutritional assessment is important in children with SMID, since nutritional sta-
tus is easily compromised due to many concomitant factors such as: dysphagia,
altered energy needs, gastro-oesophageal reflux, constipation, prolonged feeding
times and feeding dependency. A reference standard method for assessment of
nutritional state is available (deuterium dilution technique); however, this method
is laborious and very expensive. Therefore, we studied Bioelectrical Impedance
Assessment (BIA) as a possible easily applicable and reliable substitute. We have
demonstrated that BIA is a feasible method in most of these children, and that the
percentage body fat calculated with BIA was significantly related to BMI values.
However, some concerns remain about the fluctuating measurement values and
the high resistance (Rz) values. Our research team has already started a valida-
tion study to compare the outcome of BIA with that of the deuterium dilution
technique, and to develop population-specific equations to calculate percentages
of body fat and total body water. Furthermore reproducibility, and the additive
value to standard nutritional parameters (such as BMI) needs to be established.
In conclusion, the first results of BIA in children with SMID were promising;
nonetheless, the exact position of BIA in the diagnostic apparatus of nutritional
assessment still needs to be established.
Interrupter technique
Pulmonary problems are a major cause of concern in children with SMID, causing
considerable morbidity and mortality. However, no method that has been vali-
dated for disabled children was available to quantify pulmonary function in this
population. We demonstrated that the interrupter technique is feasible in most of
these children, and that reproducibility was similar to that of on-site measurements
128 Chapter 7
Cha
pte
r 7
in non-disabled children. It was possible to diagnose reversible airway obstruction
using the interrupter technique. However, for many children the time interval
used of 15 minutes between bronchodilator administration and the measurement
to test its effect was not long enough to expectorate their mucus. This may have
led to underdiagnosis of reversible airway resistance. Therefore, we suggest a
time interval of at least 30 minutes between bronchodilator administration and
reversibility testing in children with SMID.
Nevertheless, several aspects still need to be studied before clinical application
can be recommended. Some concerns exist over the pressure curves used to
estimate respiratory resistance. These frequently showed patterns that are seldom
seen in non-disabled children, which might be explained by impaired sputum
clearance or abnormal muscle tension.
Furthermore, each new diagnostic tool should be validated against a reference
standard. Unfortunately, such a standard does not exist for pulmonary function
in children with SMID. Measured respiratory resistance significantly declined with
age, which makes these results plausible since similar results were found in non-
disabled children.
To gain more insight into the diagnostic value of the interrupter technique, the
outcome values should be related to clinical signs of pulmonary function. In an
intervention study, applying for example aerosol or physical therapy, results can
be analysed both on clinical signs and interrupter resistance. Although this would
not be a high-quality validation, it could give an idea of the diagnostic value of
this measurement. As long as no population-adjusted reference values exist, this
tool is not yet suitable for the screening of pulmonary function, irrespective of its
precision.
In the meantime, pulmonology specialists might apply this method in children
with SMID for treatment evaluation, and reversibility testing. However, they should
be aware of its limitations and use the results only as support; from our study it
remains unclear whether the method is sensitive enough to detect small changes
in pulmonary function in children with SMID.
Defining constipation
Constipation is common in children with SMID, and many of these children receive
laxatives. For non-disabled children, international guidelines exist for the diagno-
sis of constipation, based on clinical signs. However, these are not applicable in
children with SMID, and no specific consensus definition exists.
General Discussion 129
In the present study, we formulated and applied an adapted definition and the
results show that it can be easily applied. According to this symptom-based defini-
tion, 22% of the children with SMID in the Netherlands were constipated (even
though 55% used laxatives). Interpretation of this prevalence rate is difficult since
the diagnostic value of our definition has not yet been established.
Because no relation was found between lifestyle factors and constipation or
defecation frequency, many questions concerning etiology and prevention re-
main. Dietary intake of water and fibres was poor in many children. Also, because
many constipated children used laxatives without resolution of their defecation
problems, the effect of laxatives should be monitored properly. Care-givers should
also receive appropriate instruction on how to adjust dosages when necessary.
We suggest that, in addition to the consensus definition used for non-disabled
children, a consensus definition of constipation in children with SMID should be
agreed upon. We recommend to use the definition employed in the present study,
after adding “large stools in the rectum” to it:
Large stools in the rectum or palpable on abdominal examination and/or the
occurrence of two or more of the following characteristics, during the 2-week
study period:
• scybalous, pebble-like, hard stools for a majority of stools
• defecation frequency less than three times per week
• laxative use or manual disimpaction
Future studies could relate such a symptom-based definition to colonic transit
times. Studies on the primary causes of constipation (e.g. gastro-intestinal motility
problems in general) could also help to elucidate the etiology and thereby the
prevention and treatment of constipation in children with SMID.
CONSIDERATIONS FOR FUTURE RESEARCH
Choice of study design and setting
In this population of severely handicapped children, many research questions still
need to be addressed. Based on the particular research question to be studied,
the following issues need to be considered: Is a representative population-based
cohort necessary? Should the study be performed on-site or in hospital?
130 Chapter 7
Cha
pte
r 7
Population-based cohort
Some questions can only be addressed using a population-based cohort with a
representative subset of a specific population. Examples of these are epidemio-
logical studies to determine prevalence rates, and some studies investigating the
feasibility of diagnostic methods. However, creating and maintaining a popula-
tion-based cohort of children with SMID is complicated.
In general, including a representative subset of a population requires all indi-
viduals in a specified area to be invited to participate. When studying individuals
with an intellectual disability this is complex since in most countries (including the
Netherlands) no registry of disabled persons exists. There are many ways to locate
and approach parents of children with SMID; for example, through hospitals,
outpatient clinics, patient organisations, and providers of specialized intellectual
disability or child rehabilitation services. For a representative cohort, only the
latter two may be suitable since most children with SMID need specialized care. In
the Netherlands, inclusion through specialized service providers is a time-consum-
ing process. Firstly the management of each care centre has to decide whether or
not to participate in the study, based on the judgement of local ethics committees,
parent boards, and healthcare professionals at each centre. Only then can the
informed consent procedure start. Thereafter, during the study period itself, all
people involved need to be kept informed and motivated, which is complicated
when there are frequent changes in staff. In addition, the more people involved,
the more complicated the measurement logistics become.
Only for those studies not requiring a representative subset of a population, is it
possible to include participants through one service provider or hospital, which
makes the inclusion procedure less complicated. Table 1 lists the advantages and
disadvantages of an inclusion procedure through specialized services versus hos-
pitals.
Another aspect of a population-based cohort is that a high participation rate with-
out selection bias is required in order to include a representative sample. This
implies that participation should be as effortless as realistically possible. If not,
only the most motivated parents and the parents who relate most to the topic
of interest will participate, resulting in a selection bias including relatively more
children with the comorbidity of interest.
A representative cohort requires the inclusion of children from different native
backgrounds. As a result, difficulties can arise due to both language and cultural
barriers. For example, in some non-western cultures it is uncommon to present
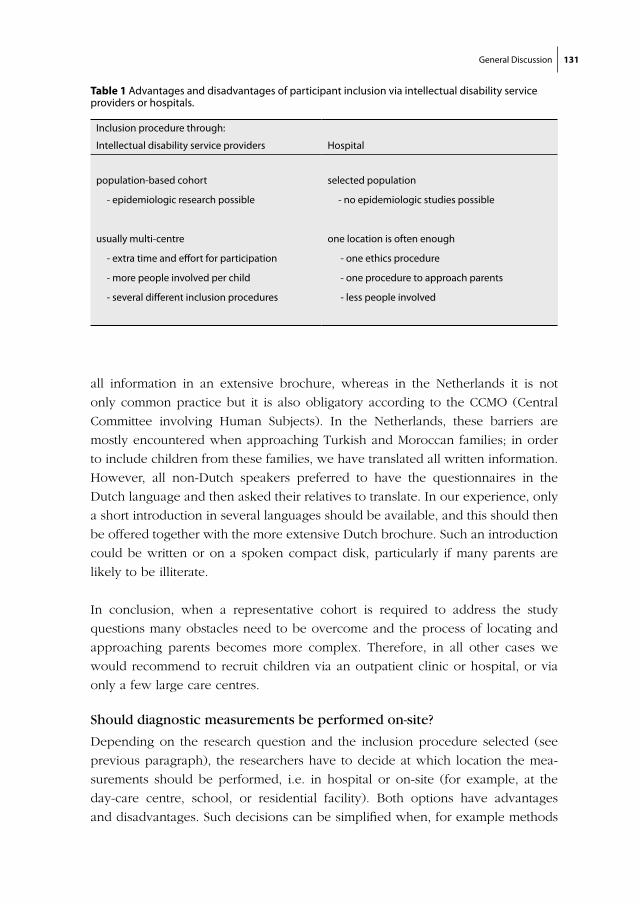
General Discussion 131
all information in an extensive brochure, whereas in the Netherlands it is not
only common practice but it is also obligatory according to the CCMO (Central
Committee involving Human Subjects). In the Netherlands, these barriers are
mostly encountered when approaching Turkish and Moroccan families; in order
to include children from these families, we have translated all written information.
However, all non-Dutch speakers preferred to have the questionnaires in the
Dutch language and then asked their relatives to translate. In our experience, only
a short introduction in several languages should be available, and this should then
be offered together with the more extensive Dutch brochure. Such an introduction
could be written or on a spoken compact disk, particularly if many parents are
likely to be illiterate.
In conclusion, when a representative cohort is required to address the study
questions many obstacles need to be overcome and the process of locating and
approaching parents becomes more complex. Therefore, in all other cases we
would recommend to recruit children via an outpatient clinic or hospital, or via
only a few large care centres.
Should diagnostic measurements be performed on-site?
Depending on the research question and the inclusion procedure selected (see
previous paragraph), the researchers have to decide at which location the mea-
surements should be performed, i.e. in hospital or on-site (for example, at the
day-care centre, school, or residential facility). Both options have advantages
and disadvantages. Such decisions can be simplified when, for example methods
Table 1 Advantages and disadvantages of participant inclusion via intellectual disability service providers or hospitals.
Inclusion procedure through:
Intellectual disability service providers Hospital
population-based cohort
- epidemiologic research possible
usually multi-centre
- extra time and effort for participation
- more people involved per child
- several different inclusion procedures
selected population
- no epidemiologic studies possible
one location is often enough
- one ethics procedure
- one procedure to approach parents
- less people involved

132 Chapter 7
Cha
pte
r 7
require a hospital setting (e.g. an X-ray), but sometimes decisions can be more
difficult, as discussed below.
The informed consent procedure and diagnostic measurements are usually
performed at the same location (hospital or care centre), but this is not always
necessary.
A major advantage of performing measurements in hospital is the wider range of
diagnostic options, since not all diagnostic methods are ambulatory available for
on-site measurements. In addition, logistics tend to be less complicated, research-
ers invest less time in travelling, and the measuring conditions remain constant
for each measurement. Another aspect in favour of performing measurements
in hospital is the more positive attitude towards research (notwithstanding the
positive attitude in a few care centres) and the relatively limited influence of
the personal opinions of staff members. Physicians and nurses are more used
to scientific research and can usually relate to the research questions more eas-
ily. Also, the relationship of physicians/nurses and the children is generally less
emotionally involved than that of the personnel of day-care centres or residential
facilities. In addition, parents need to be present during the measurements in
hospital, whereas on-site the children are often accompanied by the personnel
only. In contrast to the parents who gave informed consent, the on-site personnel
did not and can, therefore, have a negative attitude towards the study; this may
affect the participating children and consequently influence the feasibility of the
measurements.
In contrast to hospital-based studies, a major advantage of performing measure-
ments on-site is that children remain in a familiar setting, thus reducing the stress
due to a more ‘hostile’ environment and therefore, the burden of participation.
This may improve both the feasibility of the measurements and the participation
rate. Apart from being in a familiar environment, on-site measurements allow the
children to follow their own scheduled day programme (meals, naps, physio-
therapy, diaper changes, swimming, etc). On the other hand, when performing
a measurement on-site, parents and day-care personnel are likely to be more
demanding about interference with one or more of these activities.
Another important advantage of on-site measurement is that children and par-
ents do not need to travel to a hospital. For many children with SMID, travelling
is tiring, not only due to a prolonged time in their wheelchair, but also due to ad-
ditional and different stimuli and possible negative associations with the hospital
setting itself. As a result, the feasibility of diagnostic tests performed in hospital
might be reduced. In addition, when parents do not have to invest time and
General Discussion 133
money on transport, they are more likely to participate in the study thus increasing
the inclusion rate. When a study requires the use of hospital-based diagnostics,
it might be considered to combine study measurements with planned hospital
visits of the child. One should consider whether the burden of a specialist visit or
admission, together with the planned research, is bearable for the child.
When choosing a measurement setting for a study, it is important to realise that
some people in principle oppose on-site measurements because they believe that
the day-care should be a safe environment, which is undermined by performing
study measurements on-site. This issue can often be resolved by choosing an
appropriate room in the care centre that is not (or only occasionally) visited by the
child. In our study we chose to leave this decision to the day-care staff.
For each intended study and each measurement the most appropriate measure-
ment location should be chosen. No clear-cut recommendations can be given, but
one should weigh all the advantages and disadvantages to make a well-considered
choice. In case of hospital-based studies, always consider the option of combining
study measurements with regular hospital visits. Table 2 summarises the advan-
tages and disadvantages when choosing between hospital-based or on-site mea-
surements. We are aware that we may seem to be presenting a ‘black and white’
picture, and many creative options are available to overcome certain difficulties
(e.g. organising a mobile X-ray bus to avoid visiting the hospital). However, these
solutions are often costly and time consuming for the researchers.
Selecting diagnostic methods
Research in children with SMID is also complicated by the limited choice in diag-
nostic methods. Regular pediatric methods are usually not validated for children
with SMID, others are not feasible or adjustments have to be made, and for almost
all methods reference values for this population are lacking. For the parameter
of interest, if no diagnostic test is yet available for children with SMID, probably
the best choice is a method validated for infants. Due to these circumstances,
feasibility pilot studies are necessary. For this, extra time and funding should be
available.
In research, not all methods that are used in practice can be applied. An example
from our study is digital rectal examination. This procedure is part of any routine
assessment of constipation. Especially in children with SMID, information on fae-
cal impaction is important for the diagnosis of constipation, since signs such as
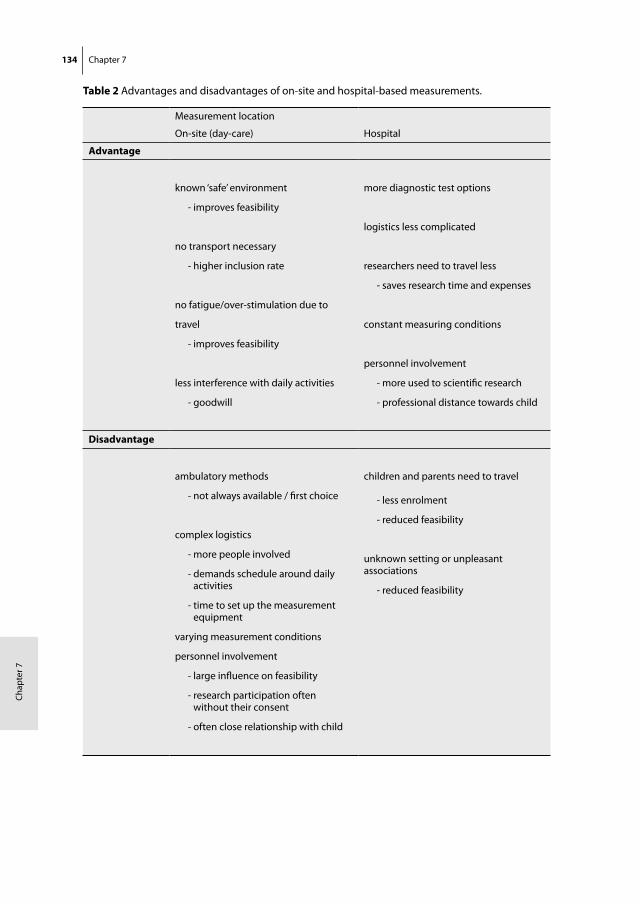
134 Chapter 7
Cha
pte
r 7
Table 2 Advantages and disadvantages of on-site and hospital-based measurements.
Measurement location
On-site (day-care) Hospital
Advantage
known ‘safe’ environment
- improves feasibility
no transport necessary
- higher inclusion rate
no fatigue/over-stimulation due to
travel
- improves feasibility
less interference with daily activities
- goodwill
more diagnostic test options
logistics less complicated
researchers need to travel less
- saves research time and expenses
constant measuring conditions
personnel involvement
- more used to scientific research
- professional distance towards child
Disadvantage
ambulatory methods
- not always available / first choice
complex logistics
- more people involved
- demands schedule around daily activities
- time to set up the measurement equipment
varying measurement conditions
personnel involvement
- large influence on feasibility
- research participation often without their consent
- often close relationship with child
children and parents need to travel - less enrolment
- reduced feasibility
unknown setting or unpleasant associations
- reduced feasibility
General Discussion 135
‘with-holding behaviour’ and ‘faecal incontinence’ can not be used. However, in
the preparation for our study, the ethics committee concluded that this method
was too invasive for research purposes only.
In our study, we chose methods that were ambulatory available and that were
validated for infants or children. Although none of the methods used had been
validated for use in children with SMID, these were the most appropriate methods
available. Therefore the studies described in this thesis have resulted in a large
amount of feasibility data.
RECOMMENDATIONS FOR FUTURE RESEARCH
In the Introduction of this thesis, we commented on the diversity of terms and
abbreviations used for children with a combination of motor and intellectual dis-
abilities in practice and in literature. Consensus on the terms and definitions used
to describe these children and the different levels of disabilities would not only
enhance comparability of study results, but could also be used for registration pur-
poses. An example of a well-accepted disability level is the Gross Motor Function
Classification Scale (GMFCS); however for the SMID population this scale does
not differentiate sufficiently. In the present study population, almost all children
scored level V, whereas their abilities differed greatly. Designing such a motor
disability score for children with SMID is challenging; it should be easy to apply
and include not only mobility, but also spasticity and muscle tone.
A national register for persons with disabilities could serve several purposes. It
could provide prevalence data on disabilities and data on morbidity and mortality
in children with SMID. Furthermore, approaches for future study participation
could be improved by providing data on eligible children, and prior study partici-
pation. However, many questions need to be addressed regarding privacy legisla-
tions, perusal, management, updates and funding. Even though we believe that
a national registry with access for scientific studies will offer major advantages,
its realisation is unlikely. In the Netherlands, a general care registration system is
likely to be realized in the near future (Zorg Identificatie Nummer, ZIN); however,
the way the systems would keep track of disabilities and comorbidity remains
unclear.
We also recommend the formation of collaborations between care centres in order
to review research proposals. For this purpose a review committee should be
136 Chapter 7
Cha
pte
r 7
formed. Together they can decide upon participation to the proposed study prior
to the informed consent procedure for parents and children. Nowadays, it is still
uncommon for many care centres to cooperate in, and review medical research,
and approval guidelines are generally lacking. All these individual procedures are
time consuming for both the research group and the care centres involved.
For the individual centres a review procedure usually includes management,
parent boards, ethics committees, care personnel and (para)medical staff. In
order to evaluate whether the study proposal is realistic, clinical relevant and
scientifically well-designed, a collaborative review committee could also include a
research methodologist, specialized physician, and a paramedical specialist when
appropriate.
Once a collaborative review committee approves a research proposal, the
informed consent procedure (from parents) could be started in the included care
centres. This will save time and facilitate appropriate judgement of the proposal.
Such collaboration will only function properly when the local management boards,
parents and ethics committees feel they are represented by this committee, other-
wise it might become yet another obstacle.
Another recommendation concerns the information given to parents and day-care
personnel or nursing staff. The success of a study depends on the level of their
cooperation and motivation; they should be well-informed prior to the study. We
recommend the use of information brochures as well as personal presentation
meetings. During the study those involved should be frequently informed about
the progress and preliminary results. Use every means necessary to keep them
involved, such as newsletters, posters, small lectures on relevant topics etcetera.
When performing on-site measurements, especially in multi-centre studies, the
logistics are complicated. In these studies, measurement planning is more time
consuming than is often acknowledged. Logistics concern planning the visits to
one or more centres (including travelling time), the time needed for individual
measurements and informing parents and care centre personnel of the definite
time schedule.
In non-disabled children measurements can usually take place during class
time or in a break; this is more difficult in children with SMID. Their days are often
filled with necessary actions including several therapies, (prolonged) meal times,
diaper changes, an afternoon nap and getting ready for the bus ride home. During
these actions a study-related measurement is often not possible. Furthermore,
carers often state that ‘fun-times’ (such as swimming or horseback riding), should
not be withheld from the child due to participation in a study. When these activi-
General Discussion 137
ties and preferences are taken into account, it is difficult to plan measurements
efficiently.
Additionally, it is important that parents have the opportunity to be present
during the measurements; this usually improves the feasibility of a measurement
and improves parental commitment to the study. However, having to take the
parents’ schedule into account complicates the logistics even further.
Once measurements are planned, it is essential to inform both parents and
care personnel in writing in order to prevent miscommunications. Even then, a
high percentage of cancelled appointments can be expected due to illness of the
participating children. A logistics employee is therefore essential; however, most
grants are not sufficient to employ such a person.
Our last recommendation is certainly not the least important and concerns the
clustering of measurements. When performing on-site measurements in multiple
centres it is important to perform all measurement in a centre in a short period of
time, to ensure a high level of involvement during the period that the researchers
are present. When measurements are done with a long interval in between, com-
mitment of day-care personnel can become problematic.
When several different measurements have to be done per child, we recom-
mend to cluster these as well. However, this is not always possible, for example
when a follow-up time between consecutive measurements is required. We even
recommend clustering if it means introducing a longer time period to gather one
type of study measurement. We believe this will reduce the loss to follow-up since
parents have to commit for only a short period of time, rather than several times
with a longer interval. Disadvantages are that the researchers have to perform dif-
ferent measurements on one day, and diagnostic tests (such as a wheel-chair scale
or a MicroRint©) have to be available for a longer period of time. In practice, such
reasons will often be decisive. Nevertheless, we strongly recommend to cluster
measurements (both per centre and per child) even though it does not always
seem the easiest approach at the time.
In this chapter several recommendations have been made to improve the feasibil-
ity of research in children with SMID; these are summarized in Table 3.
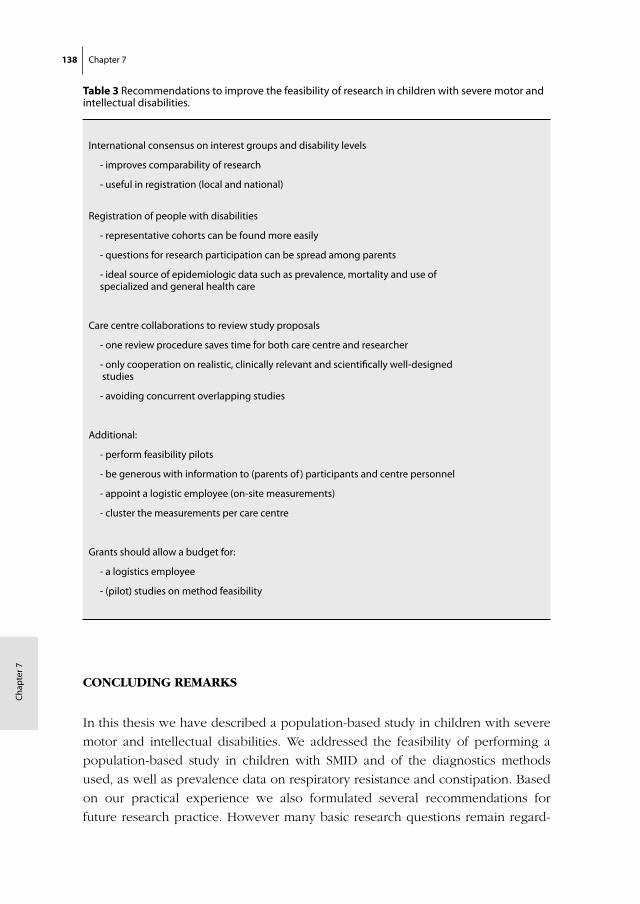
138 Chapter 7
Cha
pte
r 7
CONCLUDING REMARKS
In this thesis we have described a population-based study in children with severe
motor and intellectual disabilities. We addressed the feasibility of performing a
population-based study in children with SMID and of the diagnostics methods
used, as well as prevalence data on respiratory resistance and constipation. Based
on our practical experience we also formulated several recommendations for
future research practice. However many basic research questions remain regard-
Table 3 Recommendations to improve the feasibility of research in children with severe motor and intellectual disabilities.
International consensus on interest groups and disability levels
- improves comparability of research
- useful in registration (local and national)
Registration of people with disabilities
- representative cohorts can be found more easily
- questions for research participation can be spread among parents
- ideal source of epidemiologic data such as prevalence, mortality and use of specialized and general health care
Care centre collaborations to review study proposals
- one review procedure saves time for both care centre and researcher
- only cooperation on realistic, clinically relevant and scientifically well-designed studies
- avoiding concurrent overlapping studies
Additional:
- perform feasibility pilots
- be generous with information to (parents of ) participants and centre personnel
- appoint a logistic employee (on-site measurements)
- cluster the measurements per care centre
Grants should allow a budget for:
- a logistics employee
- (pilot) studies on method feasibility

General Discussion 139
ing comorbidity in children with SMID and its prevention and treatment. The
population-based study described here will, besides this thesis, result in another
thesis that focuses mainly on observational data on risk factors for recurrent pneu-
monias, gastro-oesophageal reflux and nutritional state in children with SMID.
Data on nutritional assessment in a hospital setting are also expected from our
research team in the future.

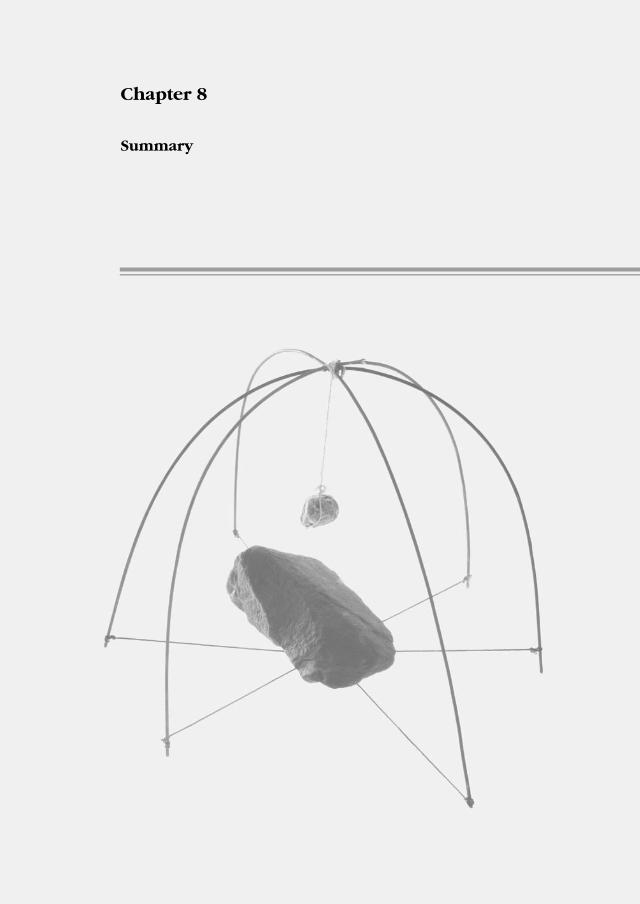
Chapter 8
Summary


Summary 143
SUMMARY
Children with severe motor and intellectual disabilities (SMID) often suffer many
co-morbidities. Their life expectancy is reduced, with respiratory disease as one
of the leading causes of death. Their concomitant health problems negatively
influence each other and put children with SMID at risk of developing other, or
increasingly severe health problems. Dysphagia for example, can be a primary
result of motor and sensory impairment due to the underlying brain damage.
Dysphagia puts children at risk of aspiration and hence of pneumonias. This risk
of developing pneumonias is further increased when a cough reflex is absent
(primarily or due to prior infections), cilial movement is slow, and/or the im-
mune system is compromised. This poor defence mechanism can be the result
of malnutrition due to dysphagia. This is only one of many possible pathways in
which disabilities and co-morbidities can interact with each other, compromising
the health status of children with SMID.
The study described in this thesis focuses on two major issues: lower respi-
ratory tract infections and malnutrition in children and adolescents with SMID.
Prevalence data on these issues is lacking, therefore we designed and conducted
the first population-based study for children with SMID in the Netherlands.
This thesis focuses on the feasibility of performing such a study, the feasibility
and outcome values of Bioelectric Impedance Analysis, the interrupter technique
and symptom-based diagnostics of constipation.
Chapter 1 focuses on the terminology, epidemiology and etiology of SMID. We
address the current stage of scientific research in this field of medicine, and ex-
plain the choice for the studied health issues.
In chapter 2 we have described the rationale, the study design and inclusion
period in more detail. We have commented on the choice for a nested case-control
design and presented the ethical considerations leading to some limited conces-
sions in the study design. An overview is given of how we have dealt with the
encountered obstacles in the design and realisation of this study.
The study population consisted of 194 participants recruited via 56 different
care centres. We have presented an overview of the etiology of their disabilities,
their basic characteristics and the flow-chart of the inclusion period. Basic charac-
teristics of the participants were compared to those of the eligible children that did
not participate. We concluded that the included population is slightly younger, and
that parents had reported slightly more comorbidity in the participants. Despite
144 Chapter 8
Cha
pte
r 8
these discrepancies, our study sample is as representative as can be expected in
population-based research.
Chapter 3 focused on the feasibility of Bioelectric Impedance Analysis (BIA), a
method to assess nutritional status. Nutritional problems are common in children
with SMID. In this population however, is not easy to assess the nutritional state.
The diagnostic value of commonly applied methods such as anthropometry re-
mains unclear. Anthropometry is often difficult to apply (e.g. due to contractures)
and values are difficult to interpret (e.g. due to growth retardation and a lack
of adjusted reference values). A gold standard method (deuterium dilution tech-
nique) exists, but is laborious and very expensive. A possible alternative is BIA.
This technique is valid and easy to apply in non-disabled children.
We studied the feasibility of BIA in 35 children with SMID, as part of the
epidemiologic study described in chapter 2. We demonstrated that BIA is a fea-
sible method in children with SMID (97% tolerated, 72% correct positioning) and
that the percentage body fat calculated with BIA was significantly related to BMI
values. We expressed our remaining concerns regarding the observed fluctuation
of the measurement values and the high resistance (Rz) values in these children.
We advise future study on the reproducibility, the additive value of this technique
to nutritional assessment and validation to the reference standard.
We concluded that the first results of BIA in children with SMID were promising;
nonetheless, the exact position of BIA in the diagnostic apparatus of nutritional
assessment still needs to be established.
Pulmonary problems are common in children with SMID, however, conventional
methods to objectify pulmonary problems are not applicable to children with
SMID because these methods require the ability to follow instructions as well as
good motor skills. In chapter 4 and 5 we focused on the interrupter technique.
It can measure respiratory resistance, requires only little cooperation and is reli-
able in infants. A measurements of this technique consists of several interruptions
(depicted in pressure- and flow-curves) that need to be evaluated by hand to
exclude measurement errors. In chapter 4 we describe criteria we have devel-
oped to evaluate these curves of the interrupter technique. We compare the results
obtained by the application of the criteria to the results using the conventional
method (eyeballing). Our aim was to simplify the evaluation and improve inter-
observer variability, without affecting the outcome values.
We showed that inter-observer agreement was similar using the criteria or
eyeballing. The rejection percentage was however higher when the criteria were
applied, although the number of succeeded measurements was similar using both
Summary 145
methods. The resulting respiratory resistance values were comparable between
the used rejection methods, and were similar to not rejecting any curves at all.
We concluded that none of the methods influenced the outcome value signifi-
cantly. However, it remains important to evaluate measurements, in order to reject
those consisting only of measurement errors. Although application of the criteria
did not improve inter-observer variability, these criteria can contribute to the stan-
dardisation of the Rint technique and simplify its evaluation in daily practice.
In chapter 5 we focussed on the reproducibility, feasibility and outcome values
of the interrupter technique in children with SMID.
In phase 1 we studied reproducibility of Rint in 35 children with SMID who
did not take part in the epidemiologic study. We showed that reproducibility was
moderate but acceptable on both short (one hour) and long term (two weeks).
Short-term reproducibility values were lower than in non-disabled children,
whereas long-term reproducibility was comparable to that of a previous study
under field conditions. In the data supplement to chapter 5, reproducibility val-
ues were compared with those of most previous studies in non-disabled children,
using several different statistical measures of reproducibility.
In phase 2 feasibility of the technique and Rint values were studied in 175
children with SMID, as part of the epidemiologic study described in chapter 2. We
showed that the measurement was tolerated by 86% of children with SMID and
was successful in 73%. In 63% we were able to perform a successful reversibility
test as well. The within-measurement variability was however considerable, and
some concerns were raised on a high percentage of irregular pressure curves.
We compared Rint values to the reference values for non-disabled children and
found that Rint values were relatively low in short (young) children and relatively
high in tall (older) children. This might be explained by muscle tension develop-
ment in children with SMID and with increasing age they might have developed
pulmonary damage due to recurrent pulmonary problems. Rint values were sig-
nificantly correlated to distinct bronchorrhea. In the data supplement details on
the measurement procedure, statistics and z-values are reported.
We concluded that the interrupter technique is feasible in most children with
SMID.
Nevertheless, several aspects still need to be studied before clinical applica-
tion can be recommended. Unfortunately, high-quality validation is not possible
because a feasible reference standard is lacking. The diagnostic value of this tech-
nique remains a topic of interest. Despite these limitations, pulmonology experts
could consider the use of the interrupter technique for treatment evaluation, and
reversibility testing in children with SMID.
146 Chapter 8
Cha
pte
r 8
In chapter 6 we focused on constipation in children with SMID. This common
problem has seldom been studied in these children, and data on population preva-
lence are scarce. A difficulty of studying constipation is its subjective nature; no
gold standard method is available. It is diagnosed based on consensus definitions.
For non-disabled children such definitions are available, however, these are not
applicable to children with SMID. Therefore, we developed a specific definition
based on the useful components of several pre-existing definitions of constipation.
We studied constipation in 152 children with SMID using diaries on defecation
and dietary intake, interviews with parents, and by performing a small physical
examination. We did not intervene in laxative use.
According to our definition, 22% of the children with SMID were constipated.
Laxatives were used by 54%, however, 36% of these children were constipated. Six
percent of the children that did not use laxatives were constipated.
We also studied dietary intake and demonstrated that water and fibre intake
were deficient in 87% and 53% of the children respectively. No causal factors
of constipation were demonstrated. Trends were observed between constipation
and BMI (higher BMI in constipated children, p=0.102) and between constipation
and level of intellectual disability (less constipation in profoundly than in moder-
ately-severely disabled, p=0.084), however these correlations were not statistically
significant. In addition, defecation frequency was not significant correlated to
insufficient fibre intake, water intake, BMI or age.
We concluded that the developed definition was applicable, however, due to
a lack of reference standard, its validity could not be established. The observed
prevalence rate was not higher than the prevalence in non-disabled children,
however, a high percentage of the children were already treated. Results indicated
that the use of laxatives was not effective in all children, stressing the importance
of regular treatment re-evaluation. We were unable to establish causal effects of
life style factors. As long as this etiology remains unclear, possible influencing
life-style factors (e.g fiber and water intake, immobility, drug side effects) should
be managed properly. Consensus on a definition of constipation in children with
severe neurological impairments should be reached.
Chapter 7 includes the general discussion of this thesis. It addresses the practical
value of the used diagnostic methods. We provide information on the preparation
of future studies in children with SMID (e.g., concerning study design, measure-
ment setting, and diagnostic methods). Based on our experience from the present
study, we also formulated several recommendations to improve feasibility of future
research in children with SMID.
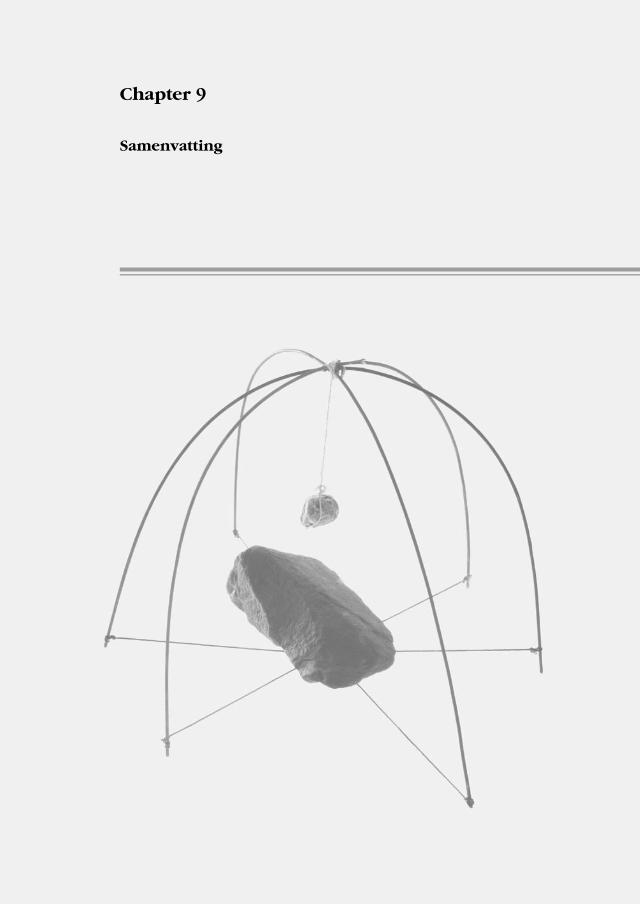
Chapter 9
Samenvatting

Samenvatting 149
SAMENVATTING
Comorbiditeit komt veel voor bij kinderen met ernstige motorische en verstan-
delijke beperkingen (Ernstige Meervoudige Beperkingen, EMB). Zij hebben een
lage levensverwachting met longziekten als de belangrijkste doodsoorzaak. De
simultaan aanwezige aandoeningen kunnen elkaar versterken, waardoor andere
gezondheidsproblemen kunnen verergeren. Een voorbeeld daarvan is dysfagie
(slikstoornis), wat primair het gevolg kan zijn van motorische en sensorische
problemen als gevolg van de onderliggende hersenbeschadiging. Hierdoor heb-
ben zij een vergroot risico op aspiratie (verslikking), waardoor de kans op lage
luchtweginfecties toeneemt. Het risico op dergelijke ontstekingen kan toenemen
door verminderde hoestreflex (primair, of als gevolg van eerdere ontstekingen),
verminderde werking van de cilia (trilharen) of door een verminderde immu-
nologische afweer. Een dergelijke verminderde afweer kan het gevolg zijn van
ondervoeding, wat weer een direct gevolg kan zijn van dysfagie. Dit is slechts
een van de vele mogelijke voorbeelden hoe verschillende aandoeningen elkaar
kunnen verergeren, en daarmee de gezondheidstoestand van kinderen met EMB
kunnen compromitteren.
Het onderzoek dat in dit proefschrift beschreven wordt richt zich op twee
belangrijke gezondheidsproblemen: lage luchtweginfecties en ondervoeding bij
kinderen en adolescenten met EMB. Cijfers over de prevalenties van deze aan-
doeningen ontbreken. ontbreekt. Om deze reden hebben wij de eerste Nederlandse
representatieve populatiestudie bij kinderen met EMB ontworpen en uitgevoerd.
Dit proefschrift richt zich met name op de toepasbaarheid en de meetwaarden
van de Bio-elektrische Impedantie Analyse (BIA), de interruptietechniek en de
diagnostiek van obstipatie op basis van symptomen.
In hoofdstuk 1 wordt nader ingegaan op de terminologie, de epidemiologie (het
vóórkomen) en de etiologie (de oorzaken) met betrekking tot kinderen met EMB.
Het huidige peil van het medisch wetenschappelijk onderzoek in deze doelgroep
wordt besproken alsmede de keuze van de te onderzoeken gezondheidsproble-
men.
In hoofdstuk 2 beschrijven we de rationale, de onderzoeksopzet (design) en de
inclusieperiode. De keuze voor een genest case-controle onderzoek en de ethis-
che overwegingen die geleid hebben tot minimale aanpassingen in de onderzoek-
sopzet, worden besproken. We geven een overzicht van hoe we zijn omgegaan
met de tegengekomen obstakels in de opzet en realisatie van de studie.
150
Cha
pte
r 9
Aan de studie namen 194 kinderen deel uit 56 verschillende zorginstellingen.
Een overzicht van de etiologie van hun beperkingen en de basiskarakteristieken
van de populatie worden gepresenteerd, alsook het stroomdiagram van de inclusie
periode. Enkele basiskarakteristieken van de deelnemers werden vergeleken met
die van de kinderen voor wie geen toestemming werd verkregen. Hieruit conclud-
eren wij dat de deelnemers iets jonger zijn en bovendien iets meer comorbiditeit
hebben volgens de rapportage van de ouders. Ondanks deze kleine verschillen
is de huidige studiepopulatie zo representatief als verwacht kan worden bij een
populatiestudie
Hoofdstuk 3 richt zich op de toepasbaarheid van de Bio-elektrische Impedan-
tie Analyse (BIA) welke een methode is om voedingstoestand te bepalen. Bij
kinderen met EMB komen vaak problemen met de voedingstoestand voor. Het
is bij hen echter niet gemakkelijk om de voedingstoestand te meten. De diag-
nostische waarde van veel gebruikte methoden zoals antropometrie (het meten
van o.a. lengte, omtrek, gewicht en huidplooien) in deze doelgroep is onbekend.
Antropometrie is vaak niet goed uitvoerbaar (o.a. door contracturen en scoliose)
en de resultaten zijn moeilijk te interpreteren (o.a. door groeiretardatie en het
ontbreken van specifieke referentiewaarden). De “gouden standaard” methode
voor het meten van de voedingstoestand (deuterium dilutie techniek) is echter
bewerkelijk en zeer kostbaar. BIA is een mogelijk alternatief. Deze techniek is bij
niet-gehandicapte kinderen valide en eenvoudig toepasbaar.
We onderzochten de toepasbaarheid van BIA bij 35 kinderen met EMB, als
onderdeel van de epidemiologische studie die beschreven wordt in hoofdstuk 2.
Uit de resultaten bleek dat BIA toepasbaar is bij kinderen met EMB (97% toler-
eerde de meting, bij 72% kon de meting in de voorgeschreven positie uitgevoerd
worden) en dat het met de methode berekende percentage lichaamsvet significant
correleerde met BMI waarden. Daarentegen bestaan er zorgen omtrent de geob-
serveerde fluctuatie van de meetwaarden en de hoge gemeten weerstandwaarden
(Rz) bij deze kinderen. Toekomstig onderzoek zou zich moeten richten op de re-
produceerbaarheid van de meetwaarden en validatie van de methode ten opzichte
van de gouden standaard.
We concluderen dat de eerste resultaten van BIA bij kinderen met EMB veelbe-
lovend zijn, echter, de exacte waarde van BIA bij het gestandaardiseerd bepalen
van de voedingstoestand moet nog worden bepaald.
Longproblemen komen veel voor bij kinderen met EMB, echter, conventionele
methoden om deze problemen te objectiveren zijn bij hen niet toepasbaar. Bij
dergelijke methoden moeten kinderen niet alleen instructies kunnen opvolgen, het
Samenvatting 151
vergt ook een behoorlijke motorische vaardigheid. In hoofdstuk 4 en 5 richten
wij ons op de interruptie techniek. Deze kan respiratoire weerstand meten, vereist
slechts beperkte medewerking en is bovendien een betrouwbare methode bij niet
gehandicapte kinderen. Een dergelijke meting bestaat uit meerdere interrupties
(afgebeeld als druk- en flowcurves) die handmatig beoordeeld moeten worden
om meetfouten te kunnen verwijderen. In hoofdtuk 4 beschrijven wij door ons
opgestelde criteria om deze curves te beoordelen. We vergeleken de resultaten
van het gebruik van deze criteria met beoordeling op de conventionele methode
(op basis van ervaring inschatten of een curve een normaal of afwijkend verloop
heeft (eyeballing)). Ons doel was om criteria op te stellen die de interbeoordelaar-
betrouwbaarheid zouden verbeteren en de beoordeling zouden vereenvoudigen
zonder dat hiermee de uitkomstwaarden beïnvloed zouden worden.
We hebben aangetoond dat de interbeoordelaarsbetrouwbaarheid vrijwel gelijk
was bij beide methoden. Bij toepassing van de criteria werden echter wel meer
curves afgekeurd, het aantal afgekeurde metingen verschilde echter nauwelijks.
Beide methoden (criteria en eyeballing) resulteerden in vergelijkbare uitkomst-
waarden (respiratoire weerstand, Rint). Deze waren ook vergelijkbaar met de
waarden wanneer er helemaal geen curves beoordeeld werden.
We concluderen dat het beoordelen van curves geen invloed heeft op de
uitkomstwaarde van de meting, ongeacht of hiervoor criteria of eyeballing ge-
bruikt wordt. Het beoordelen blijft echter wel van belang om mislukte metingen
te kunnen herkennen. Hoewel de criteria de interbeoordelaarsbetrouwbaarheid
niet verbeteren, kunnen deze criteria wel bijdragen aan de standaardisatie van
de interruptietechniek en het beoordelen van curves in de dagelijkse praktijk
vergemakkelijken.
In hoofdstuk 5 richten wij ons op de reproduceerbaarheid, toepasbaarheid en
uitkomstwaarden (Rint) van de interruptietechniek bij kinderen met EMB.
In fase 1 bestudeerden wij de reproduceerbaarheid van Rint bij 35 kinderen
met EMB die niet deelnamen aan het epidemiologische onderzoek beschreven in
hoofdstuk 2. We toonden aan dat de reproduceerbaarheid matig maar acceptabel
was op zowel korte (1 uur) als lange termijn (2 weken). In vergelijking met de
reproduceerbaarheid bij niet-gehandicapte kinderen was de korte termijn repro-
duceerbaarheid lager, terwijl de lange termijn reproduceerbaarheid vergelijkbaar
was met waarden uit een andere veldstudie. In het data supplement van hoofd-
stuk 5 wordt met verschillende statistische methoden de reproduceerbaarheid
vergeleken met de resultaten van eerdere studies bij niet-gehandicapte kinderen.
In fase 2 hebben wij de toepasbaarheid van de interruptietechniek en de Rint-
waarden bestudeerd bij 175 kinderen met EMB die deelnamen aan de epidemiolo-
152
Cha
pte
r 9
gische studie. De meting werd door 86% van de kinderen geaccepteerd, en was
geslaagd bij 73%. De reversibiliteit (reactie op een luchtwegverwijdend middel)
kon bij 63% met succes getest worden. De variabiliteit binnen de metingen was
echter aanzienlijk, en ook het hoge percentage irreguliere curves baart zorgen.
Wij hebben de Rint-waarden vervolgens vergeleken met de referentiewaarden
van niet-gehandicapte kinderen, hieruit bleek dat Rint relatief laag was in kleine
(jonge) kinderen en relatief hoog in lange (oudere) kinderen. Dit kan mogelijk
verklaard worden door de ontwikkeling van spierspanning en doordat oudere
kinderen reeds luchtwegschade opgelopen kunnen hebben door recidiverende
luchtwegproblematiek. De Rint-waarden waren naast lengte en leeftijd, ook
significant gecorreleerd aan hoorbaar ‘vol zitten’. In het datasupplement wordt
ingegaan op de details van de meetprocedure, de statistiek en z-waarden.
We concluderen dat de interruptietechniek toepasbaar is bij de meeste kin-
deren met EMB. Echter, voordat we het gebruik van deze methode in de dage-
lijkse praktijk kunnen aanraden, moeten diverse aspecten van de techniek nog
verder bestudeerd worden. Helaas is het valideren van de methode niet goed
mogelijk aangezien er voor deze groep geen toepasbare referentiemethode is. De
diagnostische waarde van deze techniek blijft hiermee onduidelijk. Ondanks deze
beperkingen zouden gespecialiseerde longartsen het gebruik van deze techniek
kunnen overwegen bij de evaluatie van het effect van medicatie en om reversibil-
iteit te onderzoeken bij kinderen met EMB.
In hoofdstuk 6 richten wij ons op obstipatie bij kinderen met EMB. Deze veel
voorkomende aandoening is in deze populatie weinig onderzocht en gegevens
over het vóórkomen van obstipatie bij deze kinderen zijn zeldzaam. Het bestuderen
van obstipatie wordt bemoeilijkt door het subjectieve karakter van de aandoening,
er is voor de diagnostiek hiervan geen gouden standaard beschikbaar. Obstipatie
wordt gediagnosticeerd op basis van consensus definities. Deze definities voor
niet-gehandicapte kinderen zijn echter niet toepasbaar bij kinderen met EMB. Wij
hebben daarom voor deze groep kinderen een definitie van obstipatie ontwik-
keld op basis van de reeds bestaande definities. Bij 152 kinderen met EMB werd
vervolgens onderzocht of zij obstipatie hadden met behulp van dagboeken over
ontlasting en voedingsinname, interviews met ouders en een beperkt lichamelijk
onderzoek. Het gebruik van laxantia werd hiervoor niet aangepast.
Volgens onze definitie had 22% van de kinderen met EMB obstipatie. Van de
152 kinderen gebruikte 54% laxantia, echter 36% van hen was nog geobstipeerd.
Van de kinderen die geen laxantia gebruikten had 6% obstipatie.
Tevens bleek dat de dagelijkse inname van water en voedingsvezel onvol-
doende was bij respectievelijk 87% en 53% van de kinderen. Wij hebben geen
Samenvatting 153
causale verbanden voor obstipatie aangetoond. Wel werden trends waargenomen
tussen obstipatie en BMI (hogere BMI bij kinderen met obstipatie, p=0.102) en
tussen obstipatie en de mate van verstandelijke beperking (minder vaak obstipatie
bij de kinderen met zeer ernstige ten opzichte van matig tot ernstige verstandeli-
jke beperkingen, p-0.084). Deze trends waren echter niet statistisch significant.
Tevens kon er geen relatie worden aangetoond tussen de ontlastingsfrequentie en
vezelinname, waterinname, BMI of leeftijd.
We concluderen dat de door ons ontwikkelde definitie toepasbaar is. Echter
door het gebrek aan een referentiemethode, kunnen er geen uitspraken gedaan
worden met betrekking tot de validiteit ervan. De gevonden prevalentie bij kin-
deren met EMB was niet hoger dan bij niet-gehandicapte kinderen, echter een
aanzienlijk deel van de kinderen met EMB werd al behandeld. De resultaten im-
pliceren dat de behandeling echter niet bij alle kinderen effectief was. Dit onder-
streept het belang van regelmatige her-evaluatie van medicamenteuze therapie.
We hebben geen relatie tussen obstipatie en levensstijl kunnen aantonen. Zolang
de etiologie niet opgehelderd is moeten er goed met de mogelijk beïnvloedende
levensstijl factoren (bijv. vezel en water inname, immobiliteit en bijwerkingen van
medicatie) omgesprongen worden. Zowel voor onderzoek als voor de praktijk is
het van belang dat er voor deze groep consensus bereikt wordt met betrekking tot
een werkdefinitie voor obstipatie.
Hoofdstuk 7 bevat de overkoepelende discussie van dit proefschrift. Hierin wordt
ingegaan op de praktische waarde van de gebruikte diagnostische methoden.
Tevens worden handvatten geboden voor de opzet van toekomstig onderzoek bij
kinderen met EMB (o.a. met betrekking tot de onderzoeksopzet, de meetlocatie
en de te gebruiken diagnostische methoden). Op basis van de ervaring die met
deze studie is opgedaan worden adviezen gegeven om de uitvoerbaarheid van
wetenschappelijk onderzoek bij kinderen met EMB te verbeteren.

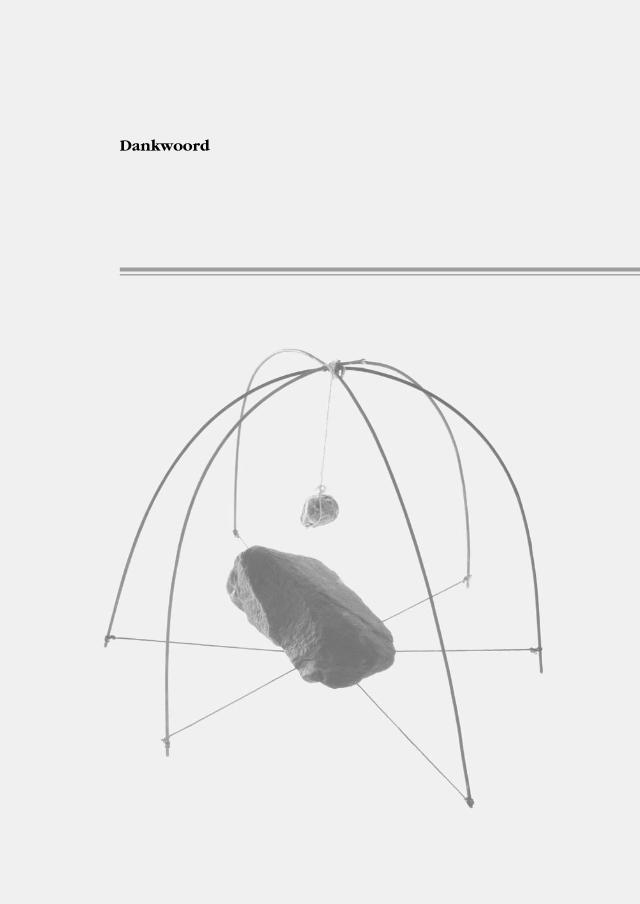
Dankwoord

157
DANKWOORD
Bij het schrijven van mijn dankwoord realiseer ik me dat dit het laatste stuk van
mijn proefschrift is. Hoewel ik natuurlijk blij ben dat dit boekje af is, vind ik het
ook jammer dat dit onderzoek zijn einde nadert. Het was namelijk een prachtig
(maar zeer ambitieus) project. Ik ben bijzonder trots op wat ik samen met de
mensen om mij heen bereikt heb. Ik hoop dat er nog velen zullen volgen die
zich sterk willen maken om de geneeskunde voor de meervoudig gehandicapte
kinderen verder op de rails te zetten.
Voor dit soort grootschalig onderzoek (speciaal in een pioniersfase) is niet alleen
een enorme interne motivatie noodzakelijk maar zijn ook mensen om je heen
onmisbaar om je te inspireren, te prikkelen en te steunen. Daarom wil ik enkele
mensen met naam noemen.
Om te beginnen mijn eerste promotor Prof. Dr. Evenhuis. Heleen, ik ben blij dat ik
de eerste stappen van de leerstoel mee heb mogen maken, en eraan heb kunnen
bijdragen. Ik heb bijzonder veel bewondering voor je interne motivatie, en de
manier waarop je ondanks tegenslagen altijd je eigen plan kan trekken en je doel
in het oog kan houden.
Mijn tweede promotor Prof. Dr. Dick Tibboel. Dick, we hebben elkaar niet vaak
gesproken maar jouw bijdragen waren zeer waardevol. Behalve je inzichten in
de materie heeft jouw kijk op de medische wereld en carrière me goed gemo-
tiveerd.
Corine als co-promotor en projectleider onderzoekslijn “comorbiditeit bij kinderen
met ernstige meervoudige beperkingen”. Na een lastige start bij de leerstoel
(waarbij iedereen verschillend beeld van jouw functie als post-doc had), heb je
je draai goed kunnen vinden. Met je aanstelling in het Sophia is er nu een start
gemaakt met de brug tussen twee werelden: ziekenhuis en leerstoel. Ik hoop dat
de onderzoekslijn die we met dit onderzoek gestart zijn, het vervolg zal krijgen
die het verdient. Ik ben onze samenwerking zeer op prijs gaan stellen, alsmede
je grote inzet en bereikbaarheid. Ik ga ervan uit dat wij na dit schrijven nog
regelmatig zullen samenwerken.
Prof. Dr. J.C. de Jongste, Prof Dr. A.J. van der Heijden en Dr. E.W. Steyerberg dank
voor uw snelle beoordeling van het manuscript en Prof. Dr. S. Thomas, Prof. Dr.

158
Cha
pte
r 9
H.N. Lafeber en Dr. H.M.J. van Schrojenstein-Lantman de Valk dank ik voor hun
bereidheid plaats te nemen in de grote commissie.
Tevens wil ik de onderzoeksgroep bedanken die betrokken was bij het tot stand
komen van het protocol: naast beide promotoren zijn dit: Dr. A. Verhagen, Dr. R.
Bernsen, Dr. J. Bouquet, Dr. M.A. Benninga, Dr. PJFM Merkus, en Dr. CK van der
Ent. I also want to acknowledge Joan Sheppard for her inspructions in swallowing
observations. Verder wil ik Marc Benninga en Bert Arets bedanken voor hun hulp
in de latere fasen en hun onvoorstelbare vermogen om mij te motiveren.
Elsbeth, fijn dat jij de volgende onderzoeker van de leerstoel geworden bent. Het
is me als onderzoeksteam goed bevallen, en vind het alleen jammer dat we niet
vanaf de start samen hebben kunnen werken. Bedankt dat je mijn paranimf wilt
zijn. Veel succes met de afronding van dit project.
Rob als (voorlopig) de laatste onderzoeker in de lijn “comorbiditeit bij kinderen
met ernstige meervoudige beperkingen”. Ik heb er alle vertrouwen in. Fijn dat je
mijn paranimf wilt zijn.
Elsbeth, Rob, Michiel & Ymie: Laat de wereld zien waar de leerstoel voor staat!
Veel succes.
Annelies, bedankt voor je inzet en de vele, vele kilometers die we samen afgelegd
hebben.
Jacques en Hanneke, fijn dat jullie mijn moppertirades tijdens het schrijven van het
protocol aangehoord hebben. Het was wat werk betreft niet de leukste fase, maar
het was wel de gezelligste kamer van de afdeling.
Willem, jouw inzet en motivatie voor zowel de Rotterdamse promovendi als voor
jouw onderzoek zijn altijd een inspiratie geweest.
Irene, ik ben blij dat je weer in Nederland bent, je snapt me altijd.
Joris, jij bent de enige die ik wil bedanken omdat je niks met het onderzoek te
maken hebt gehad. Bedankt dat je ceremoniemeester wilt zijn en ik hoop nog zeer
vele uren met je op de dansvloer maar ook daarbuiten door te brengen.
Er zijn nog een paar mensen die ik met naam wil bedanken voor hun hulp, of
hun vermogen om mij te motiveren: René Suurland (burocratie), Roos Bernsen
(statistiek), Miriam Vis (secretarieel), Edith Heintjes (compu), Boris Schouten

Dankwoord 159
(Roparun), Luc Zimmerman (discussies over geneeskunde) en Jan van Lierop
(coverfoto).
Verder alle (oud-)collega’s van de huisartsgeneeskunde die ik niet bij naam geno-
emd heb. Iedereen van de AVG-opleiding, ik ben benieuwd welke plaats AVG’s in
de geneeskunde jullie gaan innemen, veel succes!
Echter mijn grootste dank gaat uit naar alle kinderen, ouders en begeleiders die aan
het onderzoek meegewerkt hebben. Zonder jullie was het allemaal niet mogelijk!
Hopelijk zal u ook in de toekomst het belang van onderzoek in blijven zien, en
kan deze tak van de geneeskunde een inhaalslag maken zodat de medische zorg
voor meervoudig gehandicapten in Nederland een hoger niveau kan bereiken.
Ook had ik de steun van mijn vrienden in de afgelopen jaren niet willen missen.
Ik heb de meeste van jullie minder gezien en gesproken dan me lief is, maar
wellicht kunnen we dat nog goed maken.
Jeroen, jouw liefde, jouw rust, jouw balans en jou vertrouwen hebben mijn wereld
voorgoed veranderd. Je bent voor mij onmisbaar.
Van kleins af aan heb ik geleerd dat het belangrijk is om het beste uit jezelf te
halen, altijd je beste been voor te zetten en om te vertrouwen dat jij zelf in staat
bent om situaties te verbeteren. Ik had dit alles nooit kunnen doen zonder het
gezin waarin ik opgegroeid ben en de onvoorwaardelijke steun en liefde van mijn
ouders.


About the Author / Over de Auteur

163
ABOUT THE AUTHOR
Rebekka Veugelers was born on August 25, 1977 in
Vlissingen, the Netherlands. She passed secondary
school (HAVO, 1994) and pre-university education
(VWO, 1996) at the St Willibrord college, Goes. She
started her study in medicine at the Erasmus University
Rotterdam in September 1996. During the academic
year 1999-2000 she was a board member of one of
the students’ societies of Rotterdam (“Vice Praeses
Senaat” at the “Rotterdamsch Studenten Gezelschap”). In 2001 she received her
doctoral degree in medicine after a final project at the Chair of Intellectual Dis-
ability Medicine, department of General Practice at the Erasmus MC (“Feasibility
of the Rotterdam Activity Monitor in children with severe multiple disabilities”).
From 2001 to 2005 she conducted a study on risk factors of recurrent pneumonias
and malnutrition in children with severe motor and intellectual disabilities at this
Chair. Among other things, this study resulted in this thesis. From 2002 to 2004 she
was chairman of the Rotterdam PhD council and representative in the Dutch PhD
council. As part of her PhD-training she obtained her Master of Science degree
in Clinical Epidemiology at the Netherlands Institute of Health Sciences (NIHES)
in 2005. Currently she has resumed her medicine study with her practical years
(co-schappen). In 2007 she hopes to graduate as a Medical Doctor.
OVER DE AUTEUR
Rebekka Veugelers werd op 25 augustus 1977 geboren in Vlissingen. Zij behaalde
haar HAVO (1994) en VWO (1996) diploma’s aan het St Willibrord college te
Goes. In 1996 startte zij met haar studie Geneeskunde aan de Erasmus Univer-
siteit Rotterdam. Het studiejaar 1999-2000 bekleedde zij een bestuursfunctie bij
een van de Rotterdamsche Studenten Verenigingen (“Vice Praeses Senaat” bij
het “Rotterdamsch Studenten Gezelschap”). In 2001 rondde ze haar doctoraal
geneeskunde af met een afstudeeronderzoek bij de Leerstoel Geneeskunde voor
Verstandelijk Gehandicapten, afdeling Huisartsgeneeskunde van het Erasmus
MC (“de toepasbaarheid van de Rotterdamse Activiteiten Monitor bij kinderen
met ernstige meervoudige beperkingen”). Van 2001 tot 2005 hield zij zich bezig
met het opzetten en uitvoeren van een onderzoek op naar risicofactoren van
recidiverende lage luchtweginfecties en ondervoeding bij kinderen met ernstige
motorische en verstandelijke beperkingen bij deze leerstoel. Dit resulteerde o.a. in

164
Cha
pte
r 9
dit proefschrift. Van 2002 tot 2004 was zij voorzitter van de Promovendi vereniging
Rotterdam, en afgevaardigde voor de Landelijke Promovendi vereniging. In 2005
behaalde ze haar Master of Science diploma in de Klinische Epidemiologie aan
het Netherlands Institute for Health Sciences (NIHES). Momenteel heeft zij haar
studie Geneeskunde hervat, en loopt haar co-schappen. Zij hoopt in 2007 haar
arts-diploma te behalen.
Related Documents