i

Welcome message from author
This document is posted to help you gain knowledge. Please leave a comment to let me know what you think about it! Share it to your friends and learn new things together.
Transcript

i

JABATAN PERANGKAAN MALAYSIA
Pemakluman/ Announcement:
Kerajaan Malaysia telah mengisytiharkan Hari Statistik Negara (MyStats Day) pada
20 Oktober setiap tahun. Tema sambutan MyStats Day adalah
“Data Berkualiti, Kehidupan Sejahtera.”
The Government of Malaysia has declared National Statistics Day (MyStats Day) on
20th October each year. MyStats Day theme is
“Better Data, Better Lives.”
PERANGKAAN PERKHIDMATAN SERVICES STATISTICS
PRESTASI PERDAGANGAN BORONG & RUNCIT
PERFORMANCE OF WHOLESALE & RETAIL TRADE
SEPTEMBER
SEPTEMBER 2019
MALAYSIA
Dikeluarkan pada: 12 November 2019 Released on: 12 November 2019

Muka surat ini sengaja dibiarkan kosong.
This page is deliberately left blank.

Diterbitkan dan dicetak oleh:
Jabatan Perangkaan Malaysia
Blok C6, Kompleks C,
Pusat Pentadbiran Kerajaan Persekutuan,
62514 Putrajaya,
MALAYSIA
Tel. : 03-8885 7000
Faks : 03-8888 9248
Portal : https://www.dosm.gov.my
Facebook : https://www.facebook.com/StatsMalaysia
Twitter : https://twitter.com/StatsMalaysia
Harga/ Price : RM10.00
Diterbitkan pada November 2019/ Published in November 2019.
Hakcipta terpelihara/ All rights reserved.
Tiada bahagian daripada terbitan ini boleh diterbitkan semula, disimpan untuk
pengeluaran atau ditukar dalam apa-apa bentuk atau alat apa jua pun kecuali
setelah mendapat kebenaran daripada Jabatan Perangkaan Malaysia.
Pengguna yang mengeluarkan sebarang maklumat dari terbitan ini sama ada yang
asal atau diolah semula hendaklah meletakkan kenyataan berikut:
“Sumber: Jabatan Perangkaan Malaysia.”
No part of this publication may be reproduced or distributed in any form or by any
means or stored in database without the prior written permission from Department
of Statistics, Malaysia.
Users reproducing content of this publication with or without adaptation should
quote the following:
“Source: Department of Statistics, Malaysia.”
ISSN 2682 - 8472
i
KATA PENGANTAR
Penerbitan ini memaparkan Prestasi Perdagangan Borong & Runcit bagi bulan rujukan
September 2019 meliputi subsektor Kenderaan Bermotor, Perdagangan Borong
dan Perdagangan Runcit. Ianya diterbitkan secara bulanan dan menggunakan
klasifikasi industri yang terperinci berdasarkan Piawaian Klasifikasi Industri Malaysia
(MSIC) 2008, Ver.1.0 yang selari dengan International Standard Industrial Classification
of All Economic Activities Revision 4, yang diterbitkan oleh United Nations Statistics
Division. Bagi indeks volum, ia telah disusun buat kali pertama dengan menggunakan
tahun 2008 sebagai tahun asas (2008=100). Bermula suku tahun pertama 2014, ianya
telah diasaskan semula kepada tahun 2010 dan seterusnya, pada suku tahun kedua
2019, ia telah menggunakan tahun asas 2015.
Penerbitan ini mengandungi ringkasan penemuan, jadual terperinci, nota teknikal dan
glosari yang menerangkan istilah dan takrifnya bagi meningkatkan kefahaman
berkenaan data.
Jabatan ingin merakamkan setinggi-tinggi penghargaan atas kerjasama semua pihak
dalam membekalkan data yang diperlukan. Cadangan dan pandangan ke arah
memperbaiki lagi penerbitan ini pada masa hadapan amatlah dihargai.
DATO’ SRI DR. MOHD UZIR MAHIDIN
Ketua Perangkawan Malaysia
November 2019
ii
PREFACE
This publication highlights the Performance of Wholesale & Retail Trade for
references September 2019 encompassing the Motor Vehicles, Wholesale Trade
and Retail Trade sub-sectors. It is published on a monthly basis and uses the detailed
classification of industries in the Malaysia Standard Industrial Classification (MSIC) 2008,
Ver. 1.0 which is in line with the International Standard Industrial Classification of All
Economic Activities Revision 4, published by the United Nations Statistics Division. This
volume index was compiled for the first time using 2008 as the base year (2008=100).
Beginning in first quarter 2014, it has been rebased to 2010 and subsequently, in second
quarter 2019, 2015 as the base year has been implemented.
This publication consists summary of the main findings, detailed tables, technical notes
and glossary which describes the terms used and their definition to enhance the
understanding of data.
The Department gratefully acknowledges the co-operation of all parties concerned in
providing the required data. Comments and suggestions towards improving future reports
are greatly appreciated.
DATO’ SRI DR. MOHD UZIR MAHIDIN
Chief Statistician Malaysia
November 2019

iii
KALENDAR AWALAN KELUARAN 2019
PERDAGANGAN BORONG & RUNCIT
ADVANCE RELEASE CALENDAR YEAR 2019
WHOLESALE & RETAIL TRADE
Nota.
Notes.
Merujuk kepada tarikh data disebarkan kepada media atau dalam penerbitan khusus.
Refers to the date of release of the data to the media or in the specific publication.
Tarikh siaran tertakluk kepada pindaan.
Release dates are subject to change.
Bulan rujukan
Reference month
Tarikh
Date
Januari 2019
January 2019
14 Mac 2019
14 March 2019
Februari 2019
February 2019
11 April 2019
11 April 2019
Mac 2019
March 2019
13 Mei 2019
13 May 2019
April 2019
April 2019
11 Jun 2019
11 June 2019
Mei 2019
May 2019
12 Ogos 2019
12 July 2019
Jun 2019
June 2019
13 Ogos 2019
13 August 2019
Julai 2019
July 2019
11 September 2019
11 September 2019
Ogos 2019
August 2019
11 Oktober 2019
11 October 2019
September 2019
September 2019
12 November 2019
12 November 2019
Oktober 2019
October 2019
12 Disember 2019
12 Disember 2019

iv
SINGKATAN ABBREVIATIONS
Nota.
Notes.
Penjumlahan komponen mungkin berbeza dengan angka jumlah kecil atau jumlah besar disebabkan pembundaran.
The sum of the component figures may not totally with the sub-total or total figures due to rounding.
&
/
%
dan/ and
atau/ or
Peratus/ percentage
Simbol Symbols
b
j
p
MoM
r
RM
t.t.t.l
YoY
n.a
SA
b
m
p
MoM
r
n.e.c
YoY
n.a
SA
Bilion
Juta
Permulaan
Bulan ke bulan
Pindaan
Ringgit Malaysia
Tidak terkelas di tempat lain
Tahun ke Tahun
Tiada
Pelarasan Bermusim
Billion
Million
Preliminary
Month on month
Revision
Not elsewhere classified
Year on year
Not available
Seasonal Adjusted

v
KANDUNGAN CONTENTS
Muka surat Page Kata pengantar i Preface
Kalendar Awalan Keluaran iii Advance Release Calendar
Singkatan iv Abbreviations Sepintas Lalu 1 Snapshots Ringkasan Penemuan 5 Summary of Findings Jadual Tables
1. Nilai Jualan Perdagangan Borong & Runcit Mengikut Subsektor 19 Sales Value of Wholesales & Retail Trade by Sub-sector
2. Indeks Volum Perdagangan Borong & Runcit Tidak Diselaraskan Musim mengikut
Subsektor (2015=100) 20
Non-Seasonally Adjusted Volume Index of Wholesale & Retail Trade by Sub-sector
(2015=100)
3. Indeks Volum Perdagangan Borong & Runcit Pelarasan Musim Mengikut Subsektor
(2015=100) 21
Seasonally Adjusted Volume Index of Wholesale & Retail Trade by Sub-sector (2015=100) 4. Nilai Jualan Perdagangan Borong mengikut Kumpulan 22 Sales Value of Wholesale Trade by Group
5. Indeks Volum Perdagangan Borong Tidak Diselaraskan Musim Mengikut Kumpulan
(2015=100) 24
Non-Seasonally Adjusted Volume Index of Wholesale Trade by Group (2015=100) 6. Nilai Jualan Perdagangan Runcit mengikut Kumpulan 26 Sales Value of Retail Trade by Group
7. Indeks Volum Perdagangan Runcit Tidak Diselaraskan Musim Mengikut Kumpulan
(2015=100) 28
Non-Seasonally Adjusted Volume Index of Retail Trade by Group (2015=100) 8. Nilai Jualan Kenderaan Bermotor mengikut Kumpulan 30
Sales Value of Motor Vehicles by Group
9. Indeks Volum Kenderaan Bermotor Tidak Diselaraskan Musim mengikut Kumpulan
(2015=100) 31
Non-Seasonally Adjusted Volume Index of Motor Vehicles by Group (2015=100) 10. Indikator Ekonomi, Malaysia 32
Economic Indicators, Malaysia
vi
KANDUNGAN CONTENTS
Muka surat Page 11. Indeks Perdagangan Runcit bagi Negara Terpilih 33 Retail Trade Index for Selected Countries
Indikator Tambahan 37 Additional Indicators
Nota Teknikal 41 Technical Notes
Lampiran 55 Appendix
Glosari 71 Glossary

Muka surat ini sengaja dibiarkan kosong.
This page is deliberately left blank.

SEPINTAS LALU
SNAPSHOTS

Muka surat ini sengaja dibiarkan kosong.
This page is deliberately left blank.
RINGKASAN PENEMUAN
SUMMARY OF FINDINGS

Muka surat ini sengaja dibiarkan kosong.
This page is deliberately left blank.

5
Jabatan Perangkaan Malaysia
https://www.dosm.gov.my
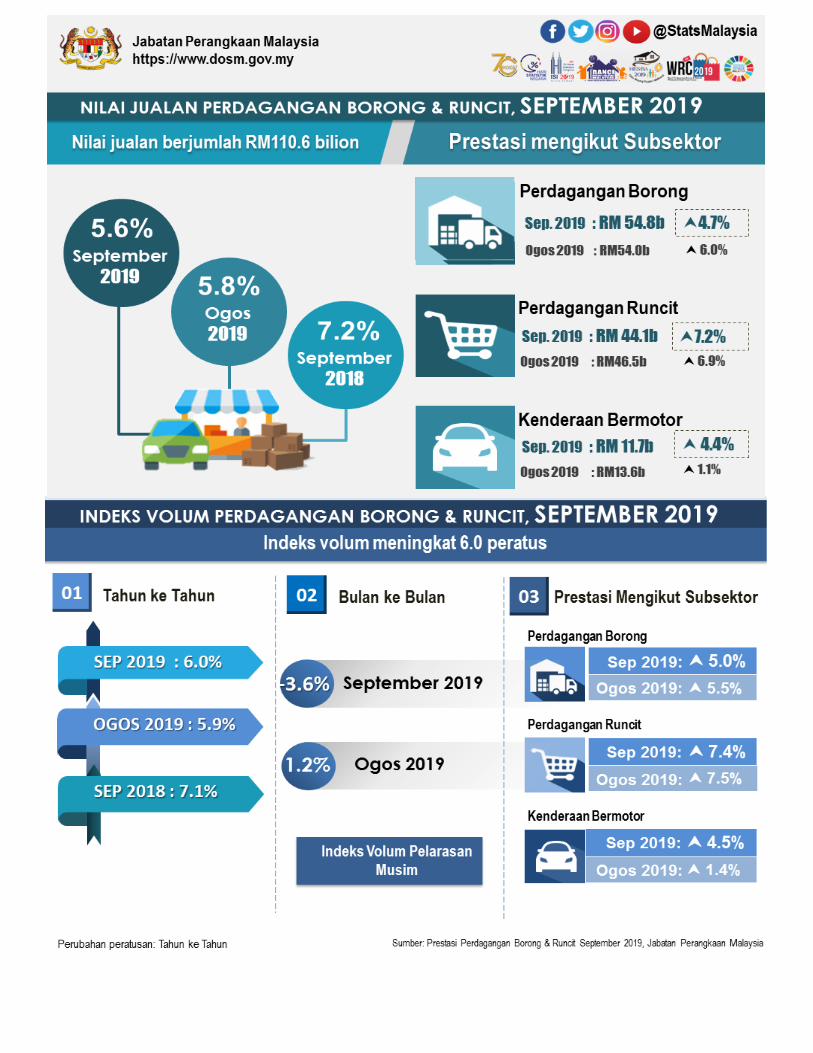
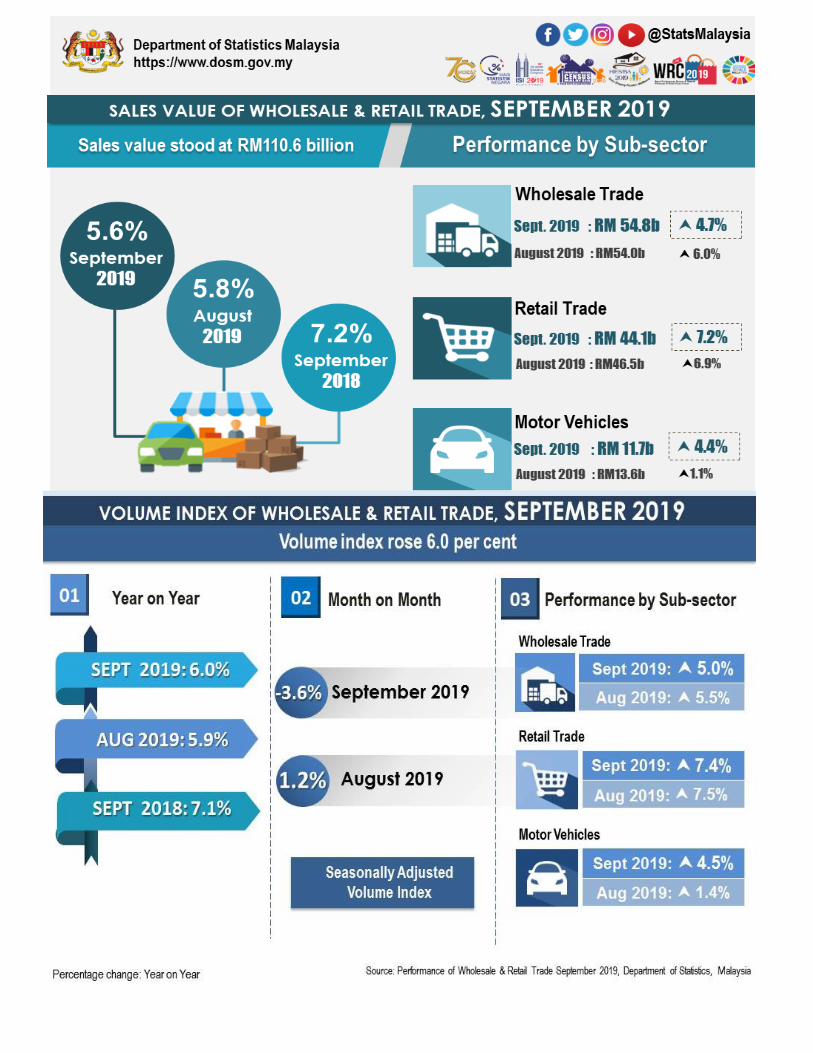
NILAI JUALAN PERDAGANGAN BORONG & RUNCIT MEREKODKAN RM110.6 BILION BAGI SEPTEMBER 2019
PRESTASI KESELURUHAN
Sejumlah RM110.6 bilion nilai jualan direkodkan oleh Perdagangan Borong & Runcit bagi
bulan September 2019, tumbuh 5.6 peratus berbanding bulan yang sama tahun
sebelumnya (Carta 2). Pertumbuhan ini disumbangkan oleh Perdagangan Runcit yang
merekodkan kenaikan RM3.0 bilion (+7.2%) dan diikuti oleh Perdagangan Borong
dengan RM2.5 bilion (+4.7%). Kenderaan Bermotor juga meningkat sebanyak
RM0.5 bilion (+4.4%).
Carta 1: Prestasi Nilai Jualan dan Indeks Volum Perdagangan Borong & Runcit, September 2019
Jualan Perdagangan Borong & Runcit 1
Carta 2: Nilai Jualan Perdagangan Borong & Runcit, Januari 2018 – September 2019

6
Bagi prestasi mengikut subsektor, Carta 4 menunjukkan subsektor Perdagangan Runcit
merupakan penyumbang utama mengatasi subsektor lain dengan 7.2 peratus
pertumbuhan tahun ke tahun. Pada tempoh sama, Perdagangan Borong meningkat
4.7 peratus. Kenderaan Bermotor turut meningkat 4.4 peratus.
Indeks volum Perdagangan Borong & Runcit mencatatkan pertumbuhan 6.0 peratus
untuk mencapai 130.0 mata berbanding bulan yang sama setahun lalu. Penyumbang
utama pertumbuhan ini ialah Perdagangan Runcit dengan 7.4 peratus (Jadual 2).
Sementara itu, indeks volum pelarasan musim turun 3.6 peratus berbanding bulan
sebelumnya.
Indeks Volum Perdagangan Borong & Runcit 2
Ja
n.
Fe
b.
Ma
c
Apr.
Mei
Ju
n
Ju
l.
Og
os
Sep
.
Okt.
No
v.
Dis
.
Ja
n.
Feb.
Ma
c
Apr.
Me
i
Ju
n
Ju
l.
Og
os
Sep
.
2018 2019
100.0
105.0
110.0
115.0
120.0
125.0
130.0
135.0
140.0
Ind
eks
Asal Pelarasan Musim
pr
Jualan Perdagangan Borong & Runcit mengikut Subsektor 3
Jan
.
Feb.
Mac
Apr.
Mei
Jun
Jul.
Ogo
s
Sep
.
Okt.
Nov.
Dis
.
Jan.
Feb.
Mac
Apr.
Mei
Jun
Jul.
Ogo
s
Sep
.
2018 2019-10.0
-5.0
0.0
5.0
10.0
15.0
20.0
Pera
tus
Perdagangan Borong Perdagangan Runcit Kenderaan Bermotor
pr
Carta 3: Indeks Volum Perdagangan Borong & Runcit, Januari 2018 – September 2019
Carta 4: Kadar Pertumbuhan Tahunan Nilai Jualan Perdagangan Borong & Runcit mengikut Subsektor, Januari 2018 – September 2019

7
Perdagangan Borong menjana jualan sebanyak RM54.8 bilion pada September 2019,
meningkat RM2.4 bilion (4.7%) berbanding bulan yang sama tahun lalu. Peningkatan ini
disokong oleh Jualan Borong Barangan Isi Rumah (6.3%), Jualan Borong Makanan,
Minuman & Tembakau (5.8%) dan Lain-lain Pengkhususan Jualan Borong (5.1%). Bagi
perbandingan antara bulan, jualan subsektor ini meningkat 1.6 peratus berbanding
Ogos 2019.
Pertumbuhan 6.0 peratus bagi indeks volum Perdagangan Borong & Runcit ini didorong
oleh Perdagangan Runcit (7.4%) dan diikuti oleh Perdagangan Borong (5.0%).
Kenderaan Bermotor pula menokok 4.5 peratus pada tempoh yang sama (Carta 5).
Indeks Volum Perdagangan Borong & Runcit mengikut Subsektor 4
Jualan Perdagangan Borong 5
Perdagangan Borong Tanpa Pengkhususan
Lain-lain Pengkhususan Jualan Borong
Jual Borong Jentera, Peralatan dan Bekalan
Jual Borong Barangan Isi Rumah
Jual Borong Makanan, Minuman dan Tembakau
Jual Borong Bahan Mentah Pertanian dan Haiwan Hidup
Jual Borong Berdasarkan Kontrak atau Yuran
Jan.
Feb.
Mac
Apr.
Mei
Jun
Jul.
Ogo
s
Sep
.
Okt.
Nov.
Dis
.
Jan.
Feb.
Mac
Apr.
Mei
Jun
Jul.
Ogo
s
Sep
.
2018 2019-6.0
-4.0
-2.0
0.0
2.0
4.0
6.0
8.0
10.0
12.0
14.0
16.0
Pera
tus
Perdagangan Borong Perdagangan Runcit Kenderaan Bermotor
pr
Carta 5: Kadar Pertumbuhan Tahunan Indeks Volum Perdagangan Borong & Runcit mengikut Subsektor, Januari 2018 – September 2019
PERDAGANGAN BORONG
Carta 6: Kadar Pertumbuhan Tahunan Nilai Jualan Perdagangan Borong mengikut Kumpulan, September 2019

8
Jualan Perdagangan Runcit mencatatkan pertumbuhan tahunan 7.2 peratus berbanding
September 2018. Pengukuhan ini dipacu oleh Jualan Runcit Makanan, Minuman &
Tembakau di Kedai Pengkhususan (8.6%), Jualan Runcit di Kedai Khusus Yang Menjual
Barangan Lain (8.5%) dan Jualan Runcit di Kedai Bukan Pengkhususan (8.4%) seperti
ditunjukkan pada Carta 8.
Indeks volum Perdagangan Borong berkembang 5.0 peratus kepada 136.0 mata pada
September 2019 berbanding bulan yang sama tahun sebelumnya. Carta 7 menunjukkan
Jualan Borong Barangan Isi Rumah mencatatkan pertumbuhan tertinggi iaitu 6.9 peratus.
Ini diikuti oleh Jualan Borong Makanan, Minuman & Tembakau (6.0%) dan Lain-lain
Pengkhususan Jualan Borong (5.6%). Indeks volum pelarasan musim bagi subsektor ini
meningkat 0.7 peratus berbanding sebulan lalu.
Indeks Volum Perdagangan Borong 6
Jualan Perdagangan Runcit 7
Jual Borong Bahan Mentah Pertanian dan Haiwan Hidup
Perdagangan Borong Tanpa Pengkhususan
Jual Borong Jentera, Peralatan dan Bekalan
Lain-lain Pengkhususan Jualan Borong
Jual Borong Barangan Isi Rumah
Jual Borong Makanan, Minuman dan Tembakau
Jual Borong Berdasarkan Kontrak atau Yuran
Jualan Runcit Bukan di Kedai, Gerai atau Pasar
Jualan Runcit di Gerai dan Pasar
Jualan Runcit di Kedai Khusus yang Menjual Barangan Kesenian dan Rekreasi
Jualan Runcit di Kedai Khusus yang Menjual Peralatan Lain Isi Rumah
Jualan Runcit di Kedai Khusus yang Menjual Peralatan Komunikasi & Maklumat
Jualan Runcit di Kedai Khusus yang Menjual Bahan Api Kenderaan
Jualan Runcit di Kedai Khusus yang Menjual Barangan Lain
Jualan Runcit Makanan, Minuman & Tembakau di Kedai Pengkhususan
Jualan Runcit di Kedai Bukan Pengkhususan
Carta 7: Kadar Pertumbuhan Tahunan Indeks Volum Perdagangan Borong mengikut Kumpulan, September 2019
PERDAGANGAN RUNCIT
Carta 8: Kadar Pertumbuhan Tahunan Nilai Jualan Perdagangan Runcit mengikut Kumpulan, September 2019

9
Nilai jualan Kenderaan Bermotor meningkat 4.4 peratus berbanding tempoh sama
setahun lalu. Peningkatan ini disumbangkan oleh Penyelenggaraan & Pembaikan
Kenderaan Bermotor sebanyak 5.8 peratus dan Jualan Kenderaan Bermotor sebanyak
4.7 peratus (Carta 10). Berbanding sebulan lalu, nilai jualan merudum kepada
14.4 peratus.
Perdagangan Runcit meningkat 7.4 peratus kepada 134.8 mata pada September 2019.
Jualan Runcit di Kedai Khusus yang Menjual Barangan Lain merekodkan pertumbuhan
9.0 peratus. Ini diikuti oleh Jualan Runcit di Kedai Khusus yang Menjual Peralatan
Komunikasi & Maklumat dan Jualan Runcit di Kedai Khusus yang Menjual Bahan Api
Kenderaan yang masing-masing mencatatkan 8.5 peratus dan 8.2 peratus seperti
ditunjukkan dalam Carta 9. Bagi indeks volum pelarasan musim, ia menyusut
4.9 peratus berbanding Ogos 2019.
Indeks Volum Perdagangan Runcit 8
Jualan Kenderaan Bermotor 9
Jualan Kenderaan Bermotor
Jualan, Penyelenggaraan dan Pembaikan Motosikal
Jualan Komponen dan Aksesori Kenderaan Bermotor
Penyelenggaraan dan Pembaikan Kenderaan Bermotor
Jualan Runcit Bukan di Kedai, Gerai atau Pasar
Jualan Runcit di Gerai dan Pasar
Jualan Runcit di Kedai Khusus yang Menjual Barangan Kesenian dan Rekreasi
Jualan Runcit di Kedai Khusus yang Menjual Peralatan Lain Isi Rumah
Jualan Runcit di Kedai Khusus yang Menjual Peralatan Komunikasi & Maklumat
Jualan Runcit di Kedai Khusus yang Menjual Bahan Api Kenderaan
Jualan Runcit di Kedai Khusus yang Menjual Barangan Lain
Jualan Runcit Makanan, Minuman & Tembakau di Kedai Pengkhususan
Jualan Runcit di Kedai Bukan Pengkhususan
Carta 9: Kadar Pertumbuhan Tahunan Indeks Volum Perdagangan Runcit mengikut Kumpulan, September 2019
KENDERAAN BERMOTOR
Carta 10: Kadar Pertumbuhan Tahunan Nilai Jualan Kenderaan Bermotor mengikut Kumpulan, September 2019

10
Bagi indeks volum, ia meningkat 4.5 peratus kepada 97.5 mata berbanding setahun yang
lalu. Peningkatan ini dipacu oleh Jualan Kenderaan Bermotor sebanyak 5.4 peratus pada
September 2019 (Carta 11). Bagi perbandingan antara bulan, indeks volum pelarasan
musim subsektor ini turun 8.8 peratus.
Indeks Volum Kenderaan Bermotor 10
Jualan Kenderaan Bermotor
Penyelenggaraan dan Pembaikan Kenderaan Bermotor
Jualan Komponen dan Aksesori Kenderaan Bermotor
Jualan, Penyelenggaraan dan Pembaikan Motosikal
Carta 11: Kadar Pertumbuhan Tahunan Indeks Volum Kenderaan Bermotor mengikut Kumpulan, September 2019
11
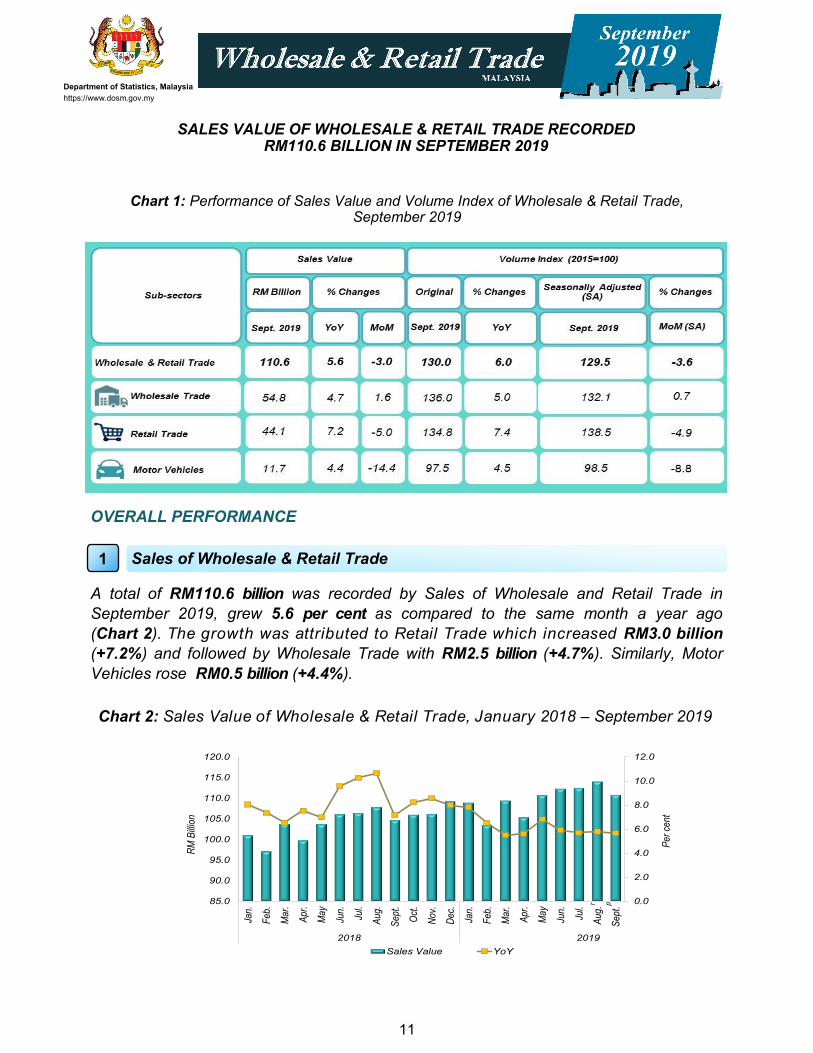
SALES VALUE OF WHOLESALE & RETAIL TRADE RECORDED RM110.6 BILLION IN SEPTEMBER 2019
Department of Statistics, Malaysia
https://www.dosm.gov.my
OVERALL PERFORMANCE
A total of RM110.6 billion was recorded by Sales of Wholesale and Retail Trade in
September 2019, grew 5.6 per cent as compared to the same month a year ago
(Chart 2). The growth was attributed to Retail Trade which increased RM3.0 billion
(+7.2%) and followed by Wholesale Trade with RM2.5 billion (+4.7%). Similarly, Motor
Vehicles rose RM0.5 billion (+4.4%).
Chart 1: Performance of Sales Value and Volume Index of Wholesale & Retail Trade, September 2019
Sales of Wholesale & Retail Trade 1
0.0
2.0
4.0
6.0
8.0
10.0
12.0
Jan.
Feb
.
Mar
.
Apr
.
May
Jun.
Jul.
Aug
.
Sep
t.
Oct
.
Nov
.
Dec
.
Jan.
Feb
.
Mar
.
Apr
.
May
Jun.
Jul.
Aug
.
Sep
t.
2018 2019
85.0
90.0
95.0
100.0
105.0
110.0
115.0
120.0
Per
cen
t
RM
Bill
ion
Sales Value YoY
pr
Chart 2: Sales Value of Wholesale & Retail Trade, January 2018 – September 2019
12
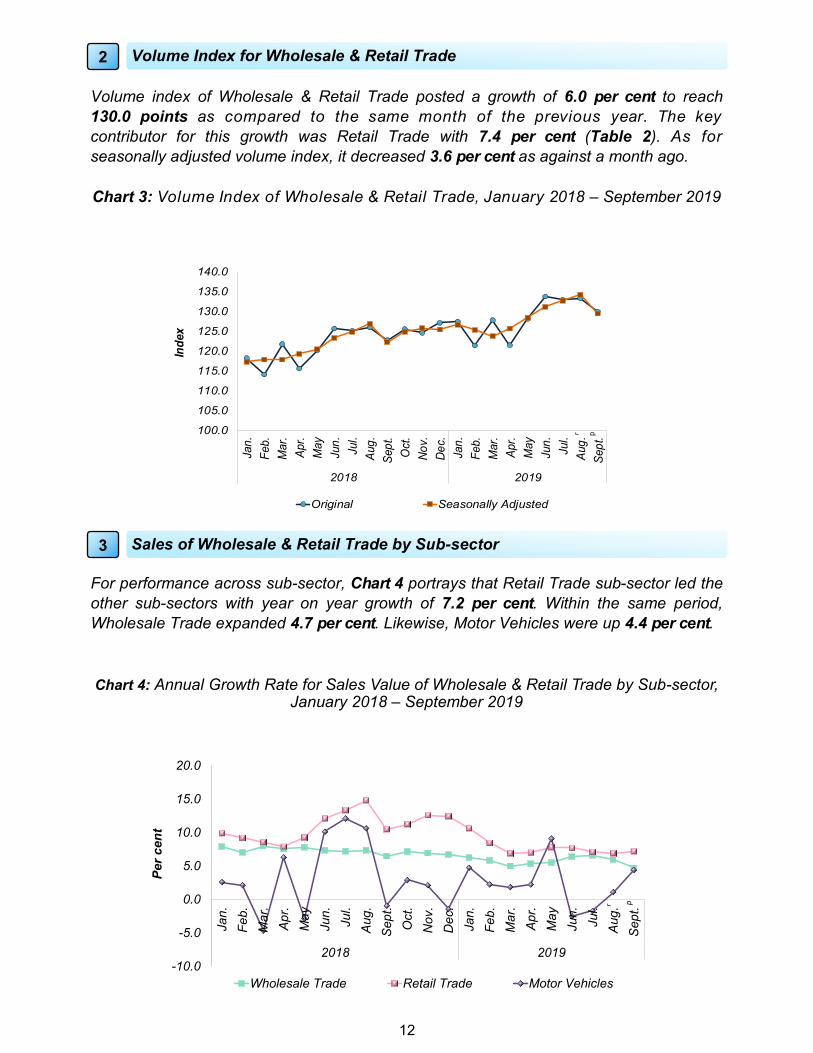
For performance across sub-sector, Chart 4 portrays that Retail Trade sub-sector led the
other sub-sectors with year on year growth of 7.2 per cent. Within the same period,
Wholesale Trade expanded 4.7 per cent. Likewise, Motor Vehicles were up 4.4 per cent.
Volume index of Wholesale & Retail Trade posted a growth of 6.0 per cent to reach
130.0 points as compared to the same month of the previous year. The key
contributor for this growth was Retail Trade with 7.4 per cent (Table 2). As for
seasonally adjusted volume index, it decreased 3.6 per cent as against a month ago.
Volume Index for Wholesale & Retail Trade 2
Sales of Wholesale & Retail Trade by Sub-sector 3
Jan
.
Feb.
Mar.
Apr.
May
Jun
.
Jul.
Aug
.
Sep
t.
Oct.
Nov.
Dec.
Jan
.
Feb.
Mar.
Apr.
May
Jun
.
Jul.
Aug
.
Sep
t.
2018 2019-10.0
-5.0
0.0
5.0
10.0
15.0
20.0
Per
cen
t
Wholesale Trade Retail Trade Motor Vehicles
pr
Jan
.
Feb.
Mar.
Apr.
May
Jun
.
Jul.
Aug
.
Sep
t.
Oct
.
No
v.
De
c.
Jan
.
Feb.
Mar.
Apr.
May
Jun
.
Jul.
Aug
.
Sep
t.
2018 2019
100.0
105.0
110.0
115.0
120.0
125.0
130.0
135.0
140.0
Ind
ex
Original Seasonally Adjusted
pr
Chart 3: Volume Index of Wholesale & Retail Trade, January 2018 – September 2019
Chart 4: Annual Growth Rate for Sales Value of Wholesale & Retail Trade by Sub-sector, January 2018 – September 2019
13
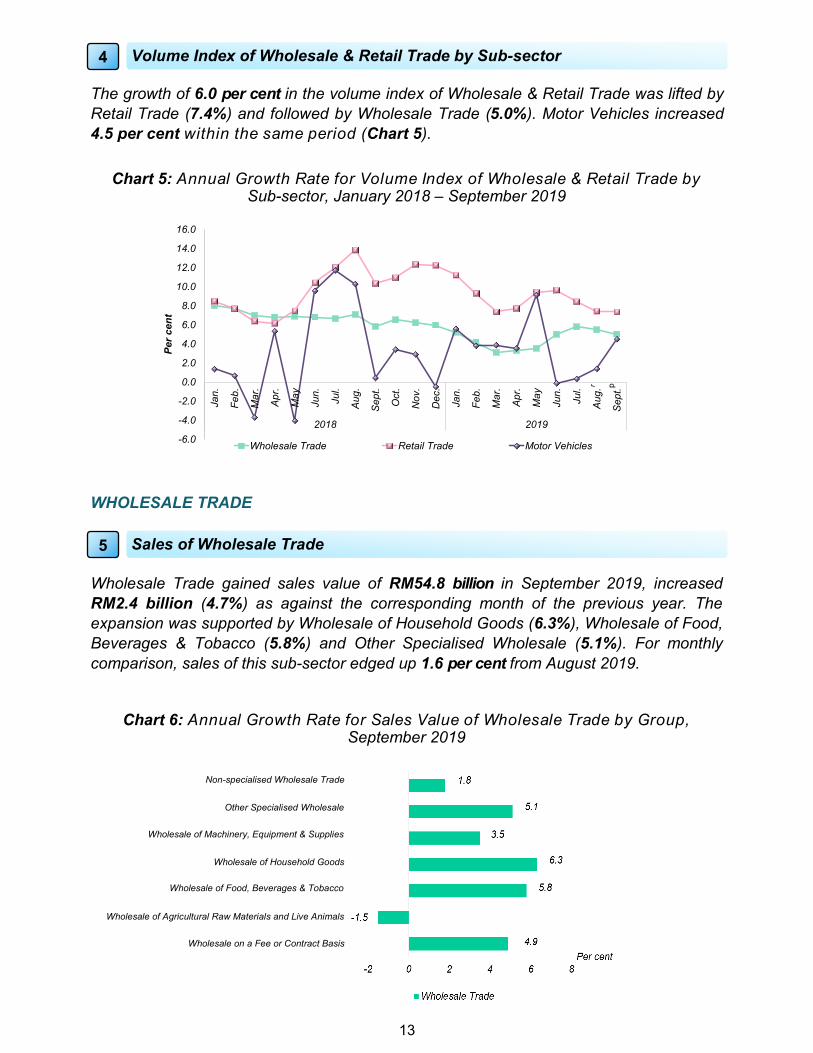
Wholesale Trade gained sales value of RM54.8 billion in September 2019, increased
RM2.4 billion (4.7%) as against the corresponding month of the previous year. The
expansion was supported by Wholesale of Household Goods (6.3%), Wholesale of Food,
Beverages & Tobacco (5.8%) and Other Specialised Wholesale (5.1%). For monthly
comparison, sales of this sub-sector edged up 1.6 per cent from August 2019.
The growth of 6.0 per cent in the volume index of Wholesale & Retail Trade was lifted by
Retail Trade (7.4%) and followed by Wholesale Trade (5.0%). Motor Vehicles increased
4.5 per cent within the same period (Chart 5).
Volume Index of Wholesale & Retail Trade by Sub-sector 4
Sales of Wholesale Trade 5
Non-specialised Wholesale Trade
Other Specialised Wholesale
Wholesale of Machinery, Equipment & Supplies
Wholesale of Household Goods
Wholesale of Food, Beverages & Tobacco
Wholesale of Agricultural Raw Materials and Live Animals
Wholesale on a Fee or Contract Basis
Jan.
Feb.
Mar.
Ap
r.
May
Jun.
Jul.
Aug.
Sept.
Oct.
Nov.
Dec.
Ja
n.
Feb.
Mar.
Apr.
May
Jun.
Jul.
Aug.
Sept.
2018 2019
-6.0
-4.0
-2.0
0.0
2.0
4.0
6.0
8.0
10.0
12.0
14.0
16.0
Per
cen
t
Wholesale Trade Retail Trade Motor Vehicles
pr
Chart 5: Annual Growth Rate for Volume Index of Wholesale & Retail Trade by Sub-sector, January 2018 – September 2019
Chart 6: Annual Growth Rate for Sales Value of Wholesale Trade by Group, September 2019
WHOLESALE TRADE

14
Sales of Retail Trade registered an annual growth of 7.2 per cent as compared to
September 2018. The expansion was fueled by Retail Sale of Food, Beverages &
Tobacco In Specialised Stores (8.6%), Retail Sale of Other Goods In Specialised Stores
(8.5%) and Retail Sale In Non-Spesialised Stores (8.4%) as shown in Chart 8.
Volume index of Wholesale Trade expanded 5.0 per cent to 136.0 points in
September 2019 as compared to the same month of the preceding year. Chart 7 shows
that Wholesale of Household Goods recorded the highest growth of 6.9 per cent. This
was followed by Wholesale of Food, Beverages & Tobacco (6.0%) and Other Specialised
Wholesale (5.6%). Seasonally adjusted volume index of this sub-sector rose 0.7 per cent
as against a month ago.
Volume Index of Wholesale Trade 6
Sales of Retail Trade 7
Non-specialised Wholesale Trade
Other Specialised Wholesale
Wholesale of Machinery, Equipment and Supplies
Wholesale of Household Goods
Wholesale of Food, Beverages and Tobacco
Wholesale of Agricultural Raw Materials and Live Animals
Wholesale on a Fee or Contract Basis
Retail Trade Not in Stores, Stalls or Markets
Retail Sale Via Stalls and Markets
Retail Sale of Cultural and Recreation Goods in Specialised Stores
Retail Sale of Other Household Equipment in Specialised Stores
Retail Sale of Information and Communication Equipment in Specialised Stores
Retail Sale of Automotive Fuel in Specialised Stores
Retail Sale of Other Goods in Specialised Stores
Retail Sale of Food, Beverages and Tobacco in Specialised Stores
Retail Sale in Non-specialised Stores
Chart 7: Annual Growth Rate for Volume Index of Wholesale Trade by Group, September 2019
Chart 8: Annual Growth Rate for Sales Value of Retail Trade by Group, September 2019
RETAIL TRADE
15
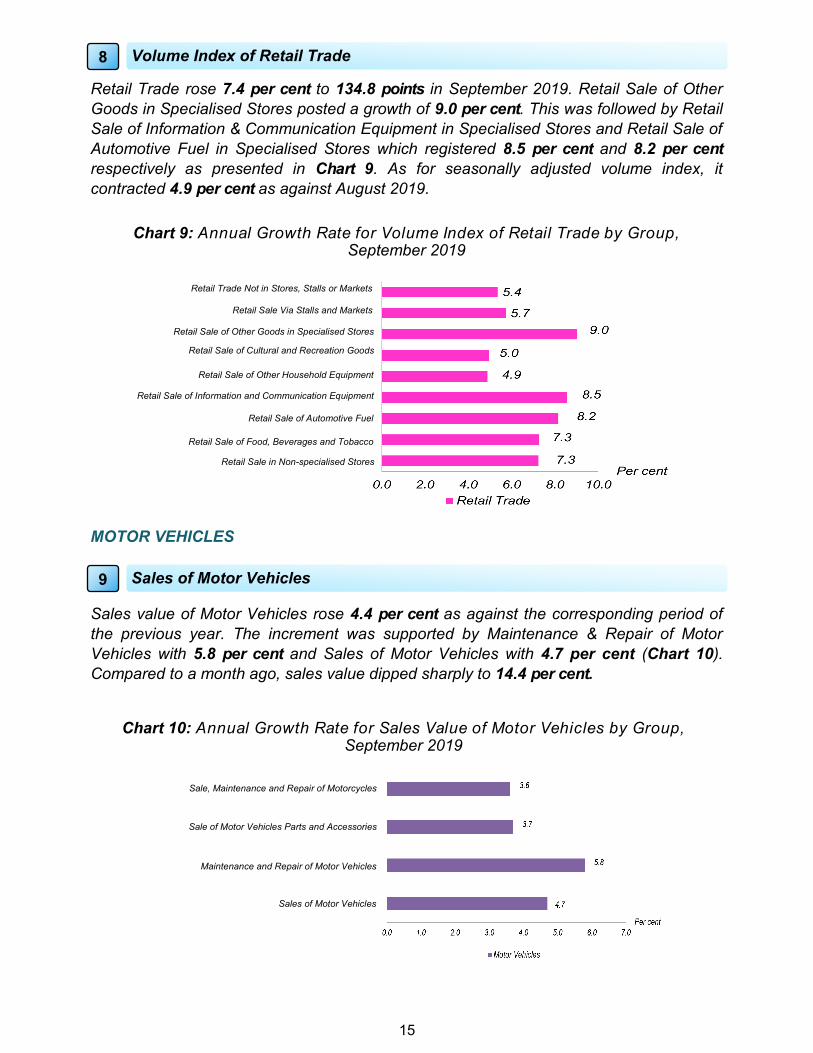
Sales value of Motor Vehicles rose 4.4 per cent as against the corresponding period of
the previous year. The increment was supported by Maintenance & Repair of Motor
Vehicles with 5.8 per cent and Sales of Motor Vehicles with 4.7 per cent (Chart 10).
Compared to a month ago, sales value dipped sharply to 14.4 per cent.
Retail Trade rose 7.4 per cent to 134.8 points in September 2019. Retail Sale of Other
Goods in Specialised Stores posted a growth of 9.0 per cent. This was followed by Retail
Sale of Information & Communication Equipment in Specialised Stores and Retail Sale of
Automotive Fuel in Specialised Stores which registered 8.5 per cent and 8.2 per cent
respectively as presented in Chart 9. As for seasonally adjusted volume index, it
contracted 4.9 per cent as against August 2019.
Volume Index of Retail Trade 8
Sales of Motor Vehicles 9
Sale, Maintenance and Repair of Motorcycles
Sale of Motor Vehicles Parts and Accessories
Sales of Motor Vehicles
Maintenance and Repair of Motor Vehicles
Retail Trade Not in Stores, Stalls or Markets
Retail Sale Via Stalls and Markets
Retail Sale of Cultural and Recreation Goods
Retail Sale of Other Household Equipment
Retail Sale of Information and Communication Equipment
Retail Sale of Automotive Fuel
Retail Sale of Other Goods in Specialised Stores
Retail Sale of Food, Beverages and Tobacco
Retail Sale in Non-specialised Stores
Chart 9: Annual Growth Rate for Volume Index of Retail Trade by Group, September 2019
Chart 10: Annual Growth Rate for Sales Value of Motor Vehicles by Group, September 2019
MOTOR VEHICLES
16
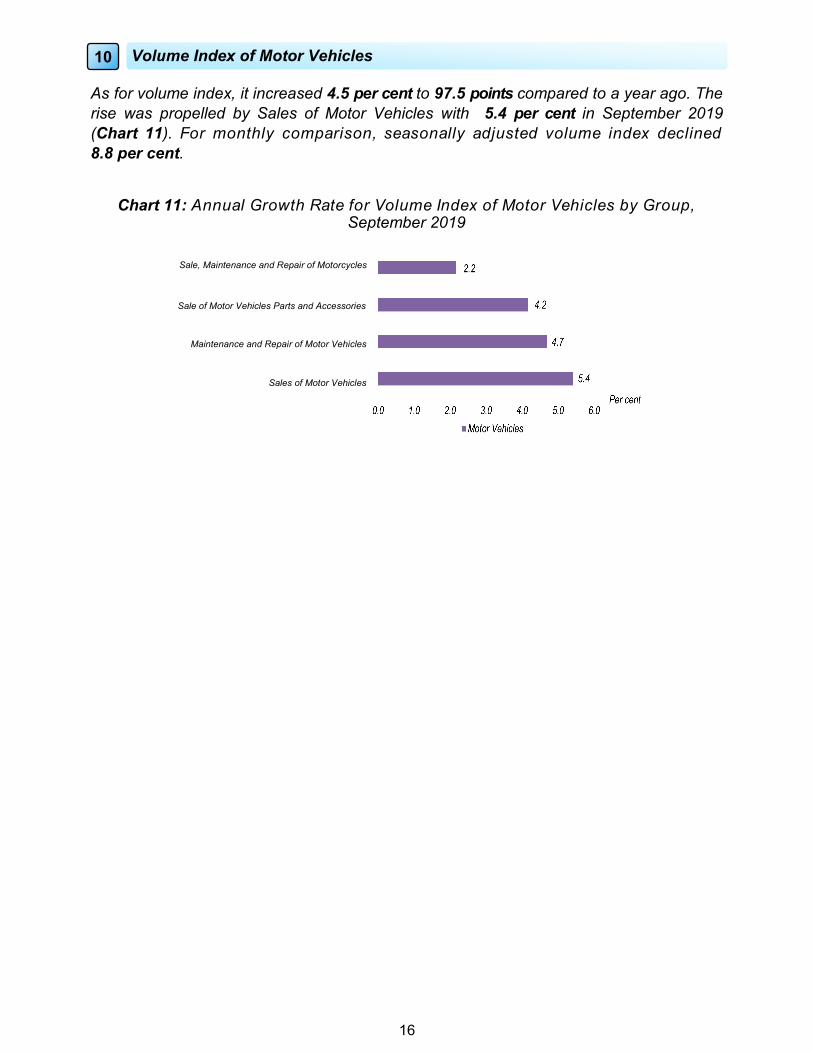
As for volume index, it increased 4.5 per cent to 97.5 points compared to a year ago. The
rise was propelled by Sales of Motor Vehicles with 5.4 per cent in September 2019
(Chart 11). For monthly comparison, seasonally adjusted volume index declined
8.8 per cent.
Volume Index of Motor Vehicles 10
Sales of Motor Vehicles
Maintenance and Repair of Motor Vehicles
Sale of Motor Vehicles Parts and Accessories
Sale, Maintenance and Repair of Motorcycles
Chart 11: Annual Growth Rate for Volume Index of Motor Vehicles by Group, September 2019
SENARAI JADUAL
LIST OF TABLES

Muka surat ini sengaja dibiarkan kosong.
This page is deliberately left blank.
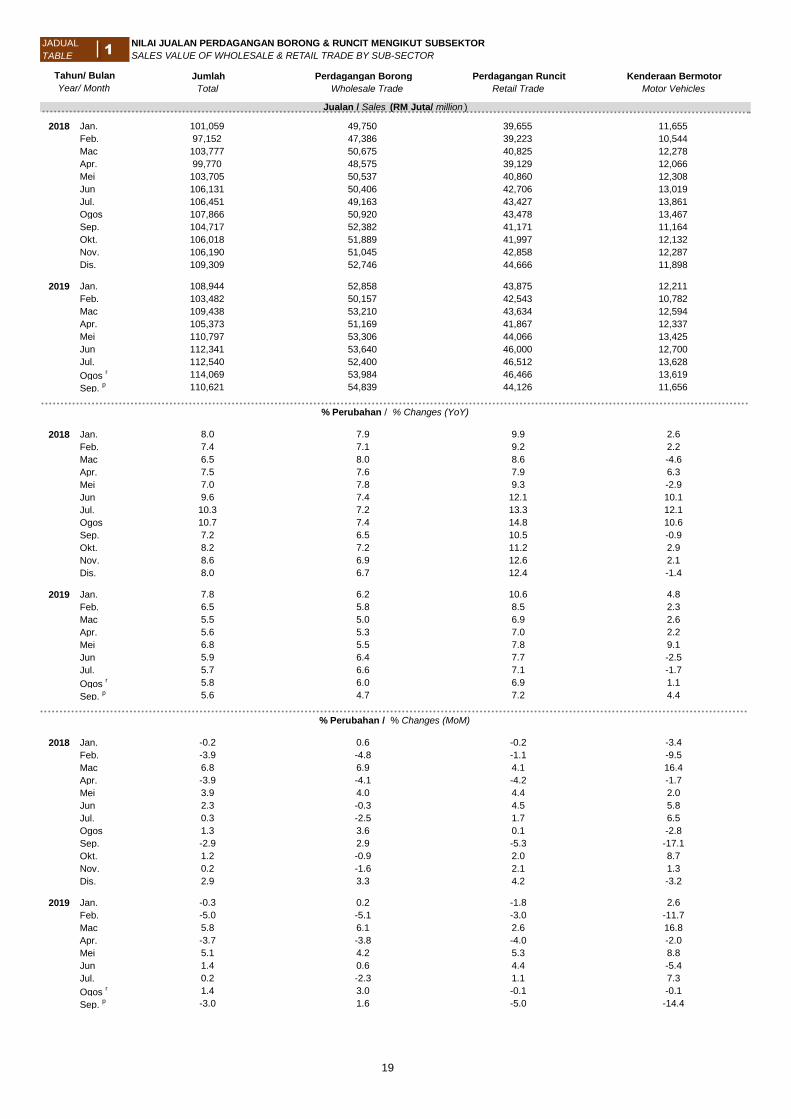
JADUAL NILAI JUALAN PERDAGANGAN BORONG & RUNCIT MENGIKUT SUBSEKTOR
TABLE SALES VALUE OF WHOLESALE & RETAIL TRADE BY SUB-SECTOR
Jumlah Perdagangan Borong Perdagangan Runcit Kenderaan Bermotor
Total Wholesale Trade Retail Trade Motor Vehicles
2018 Jan. 101,059 49,750 39,655 11,655
Feb. 97,152 47,386 39,223 10,544
Mac 103,777 50,675 40,825 12,278
Apr. 99,770 48,575 39,129 12,066
Mei 103,705 50,537 40,860 12,308
Jun 106,131 50,406 42,706 13,019
Jul. 106,451 49,163 43,427 13,861
Ogos 107,866 50,920 43,478 13,467
Sep. 104,717 52,382 41,171 11,164
Okt. 106,018 51,889 41,997 12,132
Nov. 106,190 51,045 42,858 12,287
Dis. 109,309 52,746 44,666 11,898
2019 Jan. 108,944 52,858 43,875 12,211
Feb. 103,482 50,157 42,543 10,782
Mac 109,438 53,210 43,634 12,594
Apr. 105,373 51,169 41,867 12,337
Mei 110,797 53,306 44,066 13,425
Jun 112,341 53,640 46,000 12,700
Jul. 112,540 52,400 46,512 13,628
Ogos r 114,069 53,984 46,466 13,619
Sep. p 110,621 54,839 44,126 11,656
2018 Jan. 8.0 7.9 9.9 2.6
Feb. 7.4 7.1 9.2 2.2
Mac 6.5 8.0 8.6 -4.6
Apr. 7.5 7.6 7.9 6.3
Mei 7.0 7.8 9.3 -2.9
Jun 9.6 7.4 12.1 10.1
Jul. 10.3 7.2 13.3 12.1
Ogos 10.7 7.4 14.8 10.6
Sep. 7.2 6.5 10.5 -0.9
Okt. 8.2 7.2 11.2 2.9
Nov. 8.6 6.9 12.6 2.1
Dis. 8.0 6.7 12.4 -1.4
2019 Jan. 7.8 6.2 10.6 4.8
Feb. 6.5 5.8 8.5 2.3
Mac 5.5 5.0 6.9 2.6
Apr. 5.6 5.3 7.0 2.2
Mei 6.8 5.5 7.8 9.1
Jun 5.9 6.4 7.7 -2.5
Jul. 5.7 6.6 7.1 -1.7
Ogos r 5.8 6.0 6.9 1.1
Sep. p 5.6 4.7 7.2 4.4
2018 Jan. -0.2 0.6 -0.2 -3.4
Feb. -3.9 -4.8 -1.1 -9.5
Mac 6.8 6.9 4.1 16.4
Apr. -3.9 -4.1 -4.2 -1.7
Mei 3.9 4.0 4.4 2.0
Jun 2.3 -0.3 4.5 5.8
Jul. 0.3 -2.5 1.7 6.5
Ogos 1.3 3.6 0.1 -2.8
Sep. -2.9 2.9 -5.3 -17.1
Okt. 1.2 -0.9 2.0 8.7
Nov. 0.2 -1.6 2.1 1.3
Dis. 2.9 3.3 4.2 -3.2
2019 Jan. -0.3 0.2 -1.8 2.6
Feb. -5.0 -5.1 -3.0 -11.7
Mac 5.8 6.1 2.6 16.8
Apr. -3.7 -3.8 -4.0 -2.0
Mei 5.1 4.2 5.3 8.8
Jun 1.4 0.6 4.4 -5.4
Jul. 0.2 -2.3 1.1 7.3
Ogos r 1.4 3.0 -0.1 -0.1
Sep. p -3.0 1.6 -5.0 -14.4
Tahun/ Bulan
Year/ Month
Jualan / Sales (RM Juta/ million )
% Perubahan / % Changes (YoY)
% Perubahan / % Changes (MoM)
1
19

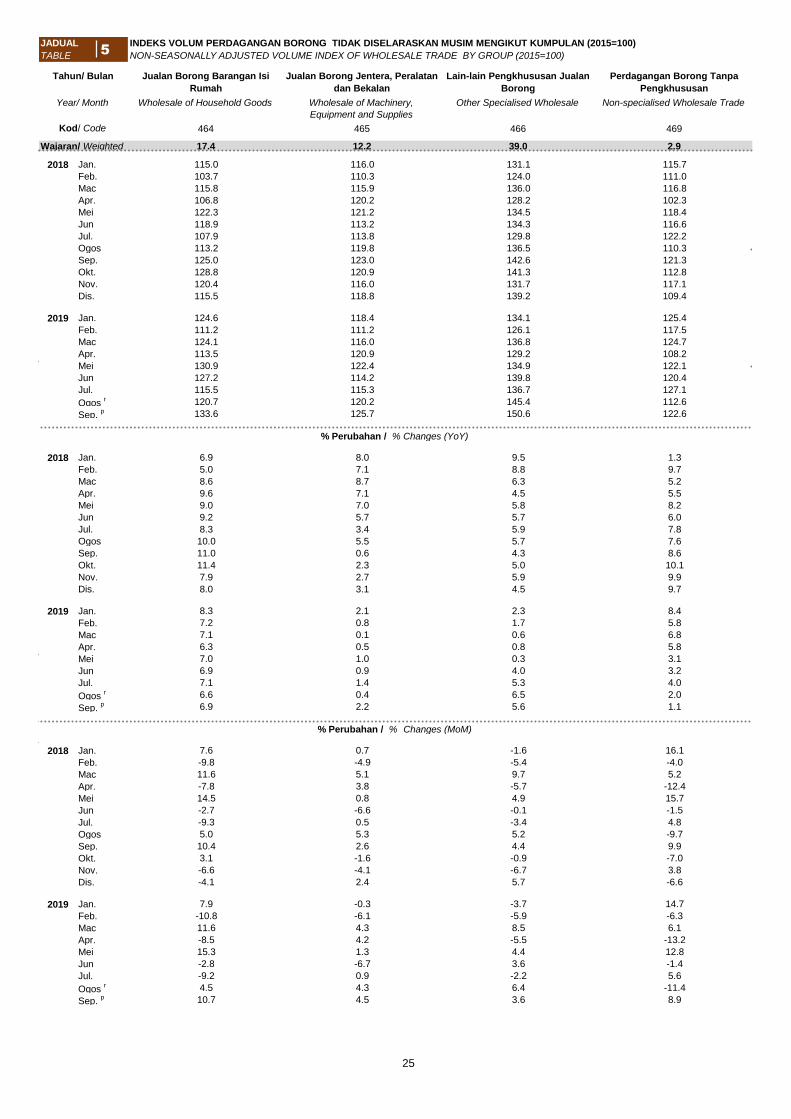
JADUAL INDEKS VOLUM PERDAGANGAN BORONG & RUNCIT TIDAK DISELARASKAN MUSIM MENGIKUT SUBSEKTOR (2015=100)
TABLE NON-SEASONALLY ADJUSTED VOLUME INDEX OF WHOLESALE & RETAIL TRADE BY SUB-SECTOR (2015=100)
Jumlah Perdagangan Borong Perdagangan Runcit Kenderaan Bermotor
Total Wholesale Trade Retail Trade Motor Vehicles
100.0 44.9 40.9 14.2
2018 Jan. 118.1 119.0 124.4 98.0Feb. 114.0 114.2 121.6 92.3Mac 121.7 123.1 127.7 100.5Apr. 115.5 118.1 119.8 95.7Mei 120.1 124.9 122.3 99.8Jun 125.6 123.6 133.8 109.0Jul. 125.0 119.6 135.1 114.1Ogos 125.9 125.1 132.6 109.8Sep. 122.6 129.5 125.5 93.3Okt. 125.5 128.9 130.8 100.4Nov. 124.5 123.3 133.9 101.9Dis. 127.1 124.6 139.9 98.4
2019 Jan. 127.4 125.3 138.3 103.4Feb. 121.3 119.0 132.9 95.8Mac 127.8 127.0 137.1 104.4Apr. 121.5 122.0 129.0 99.1Mei 128.1 129.3 133.8 108.9Jun 133.7 129.8 146.7 108.8Jul. 132.9 126.5 146.5 114.5Ogos
r 133.2 131.9 142.5 111.3Sep.
p 130.0 136.0 134.8 97.5
2018 Jan. 7.4 8.0 8.5 1.4Feb. 6.9 7.8 7.7 0.7Mac 5.4 7.0 6.4 -3.7Apr. 6.4 6.8 6.1 5.3Mei 5.8 6.9 7.5 -4.0Jun 8.7 6.8 10.4 9.6Jul. 9.6 6.6 12.0 11.7Ogos 10.3 7.1 13.9 10.3Sep. 7.1 5.8 10.3 0.4Okt. 8.0 6.5 10.9 3.4Nov. 8.4 6.2 12.3 2.9Dis. 8.0 6.0 12.2 -0.5
2019 Jan. 7.9 5.2 11.2 5.6Feb. 6.4 4.2 9.3 3.8Mac 5.0 3.1 7.4 3.9Apr. 5.2 3.3 7.7 3.5Mei 6.7 3.5 9.4 9.1Jun 6.4 5.0 9.6 -0.1Jul. 6.3 5.8 8.4 0.3Ogos
r 5.9 5.5 7.5 1.4Sep.
p 6.0 5.0 7.4 4.5
2018 Jan. 0.4 1.3 -0.2 -1.0Feb. -3.5 -4.1 -2.2 -5.8Mac 6.7 7.8 5.0 8.9Apr. -5.1 -4.1 -6.2 -4.8Mei 4.0 5.7 2.1 4.3Jun 4.5 -1.0 9.4 9.2Jul. -0.5 -3.2 0.9 4.7Ogos 0.7 4.6 -1.8 -3.8Sep. -2.6 3.5 -5.4 -15.0Okt. 2.4 -0.4 4.2 7.7Nov. -0.8 -4.4 2.4 1.5Dis. 2.1 1.0 4.5 -3.4
2019 Jan. 0.3 0.5 -1.1 5.1Feb. -4.8 -5.0 -3.9 -7.4Mac 5.4 6.7 3.2 8.9Apr. -4.9 -3.9 -5.9 -5.1Mei 5.4 6.0 3.7 9.9Jun 4.3 0.4 9.6 0.0Jul. -0.6 -2.5 -0.2 5.2Ogos
r 0.3 4.3 -2.7 -2.8Sep.
p -2.5 3.1 -5.4 -12.4
% Perubahan / % Changes (YoY)
% Perubahan / % Changes (MoM)
Tahun/ Bulan
Year/ Month
Wajaran / Weight
2
20

JADUAL INDEKS VOLUM PERDAGANGAN BORONG & RUNCIT PELARASAN MUSIM MENGIKUT SUBSEKTOR (2015=100)
TABLE SEASONALLY ADJUSTED VOLUME INDEX OF WHOLESALE & RETAIL TRADE BY SUB-SECTOR (2015=100)
Jumlah Perdagangan Borong Perdagangan Runcit Kenderaan Bermotor
Total Wholesale Trade Retail Trade Motor Vehicles
100.0 44.9 40.9 14.2
2018 Jan. 117.2 119.1 121.4 99.4Feb. 117.8 119.6 121.9 100.0Mac 117.8 120.2 122.6 95.5Apr. 119.3 120.9 123.6 102.0Mei 120.4 121.9 126.3 100.4Jun 123.3 122.4 131.3 104.8Jul. 124.8 122.7 133.7 109.5Ogos 126.8 124.5 135.6 106.6Sep. 122.2 125.9 128.9 94.1Okt. 124.8 125.6 132.7 101.0Nov. 125.8 125.6 134.4 101.5Dis. 125.4 125.2 135.1 97.4
2019 Jan. 126.6 125.5 135.2 105.1Feb. 125.3 124.7 133.3 103.9Mac 123.7 123.9 131.6 99.1Apr. 125.6 125.0 133.3 105.9Mei 128.4 126.1 138.1 109.5Jun 131.1 128.6 143.8 104.8Jul. 132.6 129.9 144.9 109.8
Ogos r 134.2 131.3 145.6 108.0
Sep. p 129.5 132.1 138.5 98.5
2018 Jan. 0.9 0.9 0.9 1.4Feb. 0.4 0.4 0.3 0.6Mac 0.0 0.5 0.6 -4.5Apr. 1.3 0.6 0.8 6.8Mei 0.9 0.8 2.1 -1.6Jun 2.4 0.4 4.0 4.4Jul. 1.2 0.3 1.8 4.4Ogos 1.6 1.5 1.4 -2.6Sep. -3.7 1.1 -4.9 -11.7Okt. 2.2 -0.2 2.9 7.4Nov. 0.8 0.0 1.3 0.5Dis. -0.3 -0.3 0.5 -4.1
2019 Jan. 0.9 0.2 0.0 7.9Feb. -1.0 -0.6 -1.4 -1.1Mac -1.3 -0.6 -1.3 -4.6Apr. 1.6 0.9 1.3 6.9Mei 2.2 0.9 3.6 3.4Jun 2.2 1.9 4.1 -4.3Jul. 1.1 1.1 0.8 4.8
Ogos r 1.2 1.0 0.5 -1.6
Sep. p -3.6 0.7 -4.9 -8.8
Wajaran / Weight
% Perubahan / % Changes (MoM)
Tahun/ Bulan
Year/ Month
3
21

JADUAL NILAI JUALAN PERDAGANGAN BORONG MENGIKUT KUMPULAN
TABLE SALES VALUE OF WHOLESALE TRADE BY GROUP
Jumlah Jual Borong Berdasarkan
Kontrak atau Yuran
Jual Borong Bahan Mentah
Pertanian dan Haiwan Hidup
Jualan Borong Makanan,
Minuman dan Tembakau
Total Wholesale on a Fee or Contract
Basis
Wholesale of Agricultural Raw
Materials and Live Animals
Wholesale of Food, Beverages and
Tobacco
46 461 462 463
2018 Jan. 49,750 904 4,454 9,099
Feb. 47,386 926 4,153 8,568
Mac 50,675 916 4,290 8,806
Apr. 48,575 909 4,083 8,699
Mei 50,537 966 3,999 9,007
Jun 50,406 985 3,861 9,477
Jul. 49,163 999 3,909 9,283
Ogos 50,920 1,020 4,038 9,376
Sep. 52,382 953 4,282 9,392
Okt. 51,889 955 4,227 9,285
Nov. 51,045 983 4,111 9,274
Dis. 52,746 990 4,192 9,507
2019 Jan. 52,858 952 4,593 9,668
Feb. 50,157 967 4,373 9,090
Mac 53,210 951 4,410 9,162
Apr. 51,169 959 4,189 9,188
Mei 53,306 1,000 4,222 9,730
Jun 53,640 1,010 4,181 10,116
Jul. 52,400 1,039 4,261 9,952
Ogos r 53,984 1,055 4,389 9,985
Sep. p 54,839 1,000 4,218 9,932
2018 Jan. 7.9 9.0 9.0 7.0
Feb. 7.1 10.2 6.3 6.5
Mac 8.0 0.3 9.9 7.8
Apr. 7.6 9.4 5.3 9.5
Mei 7.8 7.4 0.4 9.2
Jun 7.4 7.6 -0.9 9.4
Jul. 7.2 7.8 -2.4 11.3
Ogos 7.4 6.8 -0.5 10.3
Sep. 6.5 5.0 -3.7 7.9
Okt. 7.2 8.4 -4.2 7.2
Nov. 6.9 5.6 -4.9 7.6
Dis. 6.7 7.6 -4.6 8.0
2019 Jan. 6.2 5.3 3.1 6.3
Feb. 5.8 4.4 5.3 6.1
Mac 5.0 3.8 2.8 4.0
Apr. 5.3 5.6 2.6 5.6
Mei 5.5 3.5 5.6 8.0
Jun 6.4 2.5 8.3 6.7
Jul. 6.6 4.0 9.0 7.2
Ogos r 6.0 3.4 8.7 6.5
Sep. p 4.7 4.9 -1.5 5.8
2018 Jan. 0.6 -1.8 1.4 3.4
Feb. -4.8 2.4 -6.8 -5.8
Mac 6.9 -1.0 3.3 2.8
Apr. -4.1 -0.8 -4.8 -1.2
Mei 4.0 6.3 -2.1 3.5
Jun -0.3 2.0 -3.5 5.2
Jul. -2.5 1.4 1.2 -2.0
Ogos 3.6 2.1 3.3 1.0
Sep. 2.9 -6.6 6.1 0.2
Okt. -0.9 0.1 -1.3 -1.1
Nov. -1.6 3.0 -2.7 -0.1
Dis. 3.3 0.7 2.0 2.5
2019 Jan. 0.2 -3.9 9.6 1.7
Feb. -5.1 1.6 -4.8 -6.0
Mac 6.1 -1.6 0.8 0.8
Apr. -3.8 0.8 -5.0 0.3
Mei 4.2 4.3 0.8 5.9
Jun 0.6 1.0 -1.0 4.0
Jul. -2.3 2.9 1.9 -1.6
Ogos r 3.0 1.5 3.0 0.3
Sep. p 1.6 -5.2 -3.9 -0.5
Jualan / Sales (RM Juta/ million )
% Perubahan / % Changes (YoY)
% Perubahan / % Changes (MoM)
Tahun/ Bulan
Year/ Month
Kod/ Code
4
22

JADUAL NILAI JUALAN PERDAGANGAN BORONG MENGIKUT KUMPULAN (SAMB.)
TABLE SALES VALUE OF WHOLESALE TRADE BY GROUP (CONT.)
Jualan Borong Barangan Isi
Rumah
Jualan Borong Jentera,
Peralatan dan Bekalan
Lain-lain Pengkhususan Jualan
Borong
Perdagangan Borong Tanpa
Pengkhususan
Wholesale of Household Goods Wholesale of Machinery,
Equipment and Supplies
Other Specialised Wholesale Non-specialised Wholesale Trade
464 465 466 469
2018 Jan. 9,672 4,448 19,809 1,364
Feb. 9,019 4,167 19,251 1,302
Mac 9,595 4,362 21,399 1,307
Apr. 9,239 4,441 19,918 1,287
Mei 9,782 4,514 20,873 1,397
Jun 9,858 4,335 20,534 1,356
Jul. 9,375 4,357 19,872 1,367
Ogos 9,824 4,449 20,853 1,360
Sep. 10,167 4,413 21,725 1,450
Okt. 10,187 4,447 21,390 1,399
Nov. 9,909 4,316 21,042 1,410
Dis. 10,150 4,515 22,027 1,365
2019 Jan. 10,412 4,548 21,246 1,439
Feb. 9,558 4,242 20,579 1,349
Mac 10,132 4,432 22,749 1,375
Apr. 9,729 4,534 21,239 1,332
Mei 10,427 4,626 21,887 1,414
Jun 10,490 4,413 22,054 1,378
Jul. 10,000 4,474 21,263 1,411
Ogos r 10,413 4,554 22,187 1,400
Sep. p 10,807 4,566 22,840 1,476
2018 Jan. 7.8 6.1 9.0 1.5
Feb. 5.5 5.4 8.6 5.1
Mac 7.2 7.3 8.9 2.1
Apr. 8.1 6.2 7.5 3.3
Mei 7.9 5.9 9.3 5.7
Jun 8.7 4.3 8.3 4.6
Jul. 7.2 3.0 8.5 5.7
Ogos 8.7 4.2 7.9 5.5
Sep. 9.8 -0.9 8.3 6.6
Okt. 10.5 1.6 9.2 8.9
Nov. 7.3 2.3 10.2 7.9
Dis. 7.5 2.9 9.0 7.5
2019 Jan. 7.6 2.2 7.3 5.6
Feb. 6.0 1.8 6.9 3.6
Mac 5.6 1.6 6.3 5.2
Apr. 5.3 2.1 6.6 3.5
Mei 6.6 2.5 4.9 1.3
Jun 6.4 1.8 7.4 1.6
Jul. 6.7 2.7 7.0 3.2
Ogos r 6.0 2.3 6.4 2.9
Sep. p 6.3 3.5 5.1 1.8
2018 Jan. 2.4 1.3 -2.0 7.4
Feb. -6.8 -6.3 -2.8 -4.5
Mac 6.4 4.7 11.2 0.4
Apr. -3.7 1.8 -6.9 -1.5
Mei 5.9 1.6 4.8 8.5
Jun 0.8 -4.0 -1.6 -2.9
Jul. -4.9 0.5 -3.2 0.8
Ogos 4.8 2.1 4.9 -0.5
Sep. 3.5 -0.8 4.2 6.6
Okt. 0.2 0.8 -1.5 -3.5
Nov. -2.7 -2.9 -1.6 0.8
Dis. 2.4 4.6 4.7 -3.2
2019 Jan. 2.6 0.7 -3.5 5.5
Feb. -8.2 -6.7 -3.1 -6.3
Mac 6.0 4.5 10.5 1.9
Apr. -4.0 2.3 -6.6 -3.1
Mei 7.2 2.0 3.1 6.1
Jun 0.6 -4.6 0.8 -2.5
Jul. -4.7 1.4 -3.6 2.4
Ogos r 4.1 1.8 4.3 -0.8
Sep. p 3.8 0.3 2.9 5.4
Jualan / Sales (RM Juta/ million )
% Perubahan / % Changes (MoM)
% Perubahan / % Changes (YoY)
Tahun/ Bulan
Year/ Month
Kod/ Code
4
23

JADUAL INDEKS VOLUM PERDAGANGAN BORONG TIDAK DISELARASKAN MUSIM MENGIKUT KUMPULAN (2015=100)
TABLE NON-SEASONALLY ADJUSTED VOLUME INDEX OF WHOLESALE TRADE BY GROUP (2015=100)
Jumlah Jual Borong Berdasar Kontrak
atau Yuran
Jual Borong Bahan Mentah
Pertanian dan Haiwan Hidup
Jualan Borong Makanan,
Minuman dan Tembakau
Total Wholesale on a Fee or Contract
Basis
Wholesale of Agricultural Raw
Materials and Live Animals
Wholesale of Food, Beverages and
Tobacco
46 461 462 463
Wajaran/ Weighted 100.0 2.2 9.3 17.0
2018 Jan. 119.0 98.6 102.7 115.4
Feb. 114.2 108.1 110.5 113.4
Mac 123.1 107.9 124.3 116.6
Apr. 118.1 114.1 111.8 115.0
Mei 124.9 120.7 107.0 118.9
Jun 123.6 115.5 106.8 126.0
Jul. 119.6 114.9 111.0 121.8
Ogos 125.1 132.1 111.6 124.7
Sep. 129.5 110.1 118.5 125.3
Okt. 128.9 107.7 120.7 123.2
Nov. 123.3 115.7 111.4 122.8
Dis. 124.6 114.4 109.1 122.5
2019 Jan. 125.3 101.9 117.3 124.3
Feb. 119.0 110.4 122.5 121.5
Mac 127.0 109.3 130.7 123.6
Apr. 122.0 116.7 117.6 123.9
Mei 129.3 123.1 113.8 129.4
Jun 129.8 117.6 117.7 136.3
Jul. 126.5 119.7 123.0 131.8
Ogos r 131.9 137.5 122.1 132.2
Sep. p 136.0 115.9 120.1 132.9
2018 Jan. 8.0 5.2 12.1 7.1
Feb. 7.8 8.7 9.7 7.8
Mac 7.0 -0.7 13.8 6.2
Apr. 6.8 7.5 8.2 8.4
Mei 6.9 5.7 3.8 8.4
Jun 6.8 5.8 3.6 9.2
Jul. 6.6 6.0 2.8 11.1
Ogos 7.1 5.2 4.4 10.5
Sep. 5.8 2.8 4.9 9.2
Okt. 6.5 5.8 4.7 8.3
Nov. 6.2 3.8 4.6 8.7
Dis. 6.0 6.1 5.3 9.4
2019 Jan. 5.2 3.3 14.2 7.7
Feb. 4.2 2.1 10.9 7.2
Mac 3.1 1.3 5.2 6.0
Apr. 3.3 2.3 5.1 7.8
Mei 3.5 2.0 6.4 8.9
Jun 5.0 1.8 10.1 8.2
Jul. 5.8 4.2 10.8 8.3
Ogos r 5.5 4.1 9.4 6.1
Sep. p 5.0 5.3 1.4 6.0
2018 Jan. 1.3 -8.5 -0.9 3.1
Feb. -4.1 9.6 7.6 -1.8
Mac 7.8 -0.2 12.5 2.8
Apr. -4.1 5.7 -10.0 -1.4
Mei 5.7 5.8 -4.4 3.4
Jun -1.0 -4.3 -0.1 6.0
Jul. -3.2 -0.6 3.9 -3.3
Ogos 4.6 15.0 0.5 2.4
Sep. 3.5 -16.6 6.1 0.5
Okt. -0.4 -2.2 1.8 -1.7
Nov. -4.4 7.5 -7.7 -0.3
Dis. 1.0 -1.2 -2.1 -0.2
2019 Jan. 0.5 -10.9 7.5 1.5
Feb. -5.0 8.3 4.5 -2.2
Mac 6.7 -1.0 6.7 1.7
Apr. -3.9 6.8 -10.1 0.3
Mei 6.0 5.4 -3.2 4.5
Jun 0.4 -4.5 3.4 5.3
Jul. -2.5 1.9 4.5 -3.3
Ogos r 4.3 14.8 -0.7 0.3
Sep. p 3.1 -15.7 -1.7 0.5
% Perubahan / % Changes (MoM)
% Perubahan / % Changes (YoY)
Tahun/ Bulan
Year/ Month
Kod/ Code
5
24
JADUAL INDEKS VOLUM PERDAGANGAN BORONG TIDAK DISELARASKAN MUSIM MENGIKUT KUMPULAN (2015=100)
TABLE NON-SEASONALLY ADJUSTED VOLUME INDEX OF WHOLESALE TRADE BY GROUP (2015=100)
Jualan Borong Barangan Isi
Rumah
Jualan Borong Jentera, Peralatan
dan Bekalan
Lain-lain Pengkhususan Jualan
Borong
Perdagangan Borong Tanpa
Pengkhususan
Wholesale of Household Goods Wholesale of Machinery,
Equipment and Supplies
Other Specialised Wholesale Non-specialised Wholesale Trade
464 465 466 469
Wajaran/ Weighted 17.4 12.2 39.0 2.9
2018 Jan. 115.0 116.0 131.1 115.7
Feb. 103.7 110.3 124.0 111.0
Mac 115.8 115.9 136.0 116.8
Apr. 106.8 120.2 128.2 102.3
Mei 122.3 121.2 134.5 118.4
Jun 118.9 113.2 134.3 116.6
Jul. 107.9 113.8 129.8 122.2
Ogos 113.2 119.8 136.5 110.3
Sep. 125.0 123.0 142.6 121.3
Okt. 128.8 120.9 141.3 112.8
Nov. 120.4 116.0 131.7 117.1
Dis. 115.5 118.8 139.2 109.4
2019 Jan. 124.6 118.4 134.1 125.4
Feb. 111.2 111.2 126.1 117.5
Mac 124.1 116.0 136.8 124.7
Apr. 113.5 120.9 129.2 108.2
Mei 130.9 122.4 134.9 122.1
Jun 127.2 114.2 139.8 120.4
Jul. 115.5 115.3 136.7 127.1
Ogos r 120.7 120.2 145.4 112.6
Sep. p 133.6 125.7 150.6 122.6
2018 Jan. 6.9 8.0 9.5 1.3
Feb. 5.0 7.1 8.8 9.7
Mac 8.6 8.7 6.3 5.2
Apr. 9.6 7.1 4.5 5.5
Mei 9.0 7.0 5.8 8.2
Jun 9.2 5.7 5.7 6.0
Jul. 8.3 3.4 5.9 7.8
Ogos 10.0 5.5 5.7 7.6
Sep. 11.0 0.6 4.3 8.6
Okt. 11.4 2.3 5.0 10.1
Nov. 7.9 2.7 5.9 9.9
Dis. 8.0 3.1 4.5 9.7
2019 Jan. 8.3 2.1 2.3 8.4
Feb. 7.2 0.8 1.7 5.8
Mac 7.1 0.1 0.6 6.8
Apr. 6.3 0.5 0.8 5.8
Mei 7.0 1.0 0.3 3.1
Jun 6.9 0.9 4.0 3.2
Jul. 7.1 1.4 5.3 4.0
Ogos r 6.6 0.4 6.5 2.0
Sep. p 6.9 2.2 5.6 1.1
2018 Jan. 7.6 0.7 -1.6 16.1
Feb. -9.8 -4.9 -5.4 -4.0
Mac 11.6 5.1 9.7 5.2
Apr. -7.8 3.8 -5.7 -12.4
Mei 14.5 0.8 4.9 15.7
Jun -2.7 -6.6 -0.1 -1.5
Jul. -9.3 0.5 -3.4 4.8
Ogos 5.0 5.3 5.2 -9.7
Sep. 10.4 2.6 4.4 9.9
Okt. 3.1 -1.6 -0.9 -7.0
Nov. -6.6 -4.1 -6.7 3.8
Dis. -4.1 2.4 5.7 -6.6
2019 Jan. 7.9 -0.3 -3.7 14.7
Feb. -10.8 -6.1 -5.9 -6.3
Mac 11.6 4.3 8.5 6.1
Apr. -8.5 4.2 -5.5 -13.2
Mei 15.3 1.3 4.4 12.8
Jun -2.8 -6.7 3.6 -1.4
Jul. -9.2 0.9 -2.2 5.6
Ogos r 4.5 4.3 6.4 -11.4
Sep. p 10.7 4.5 3.6 8.9
% Perubahan / % Changes (MoM)
% Perubahan / % Changes (YoY)
Tahun/ Bulan
Year/ Month
Kod/ Code
5
25

JADUAL NILAI JUALAN PERDAGANGAN RUNCIT MENGIKUT KUMPULAN
TABLE SALES VALUE OF RETAIL TRADE BY GROUP
Jumlah Jualan Runcit di Kedai
Bukan Pengkhususan
Jualan Runcit Makanan,
Minuman dan Tembakau
di Kedai Pengkhususan
Jualan Runcit di Kedai
Khusus yang Menjual
Bahan Api Kenderaan
Jualan Runcit di Kedai
Khusus yang Menjual
Peralatan Komunikasi dan
Maklumat
Total Retail Sale in
Non-specialised Stores
Retail Sale of Food,
Beverages and Tobacco in
Specialised Stores
Retail Sale of Automotive
Fuel in Specialised Stores
Retail Sale of Information
and Communication
Equipment in Specialised
Stores
47 471 472 473 474
2018 Jan. 39,655 13,260 2,313 3,366 4,277
Feb. 39,223 13,156 2,256 3,440 4,264
Mac 40,825 13,910 2,333 3,567 4,305
Apr. 39,129 13,142 2,312 3,423 4,170
Mei 40,860 13,875 2,370 3,511 4,261
Jun 42,706 14,853 2,437 3,615 4,292
Jul. 43,427 15,166 2,433 3,691 4,365
Ogos 43,478 14,787 2,482 3,705 4,425
Sep. 41,171 13,820 2,333 3,591 4,356
Okt. 41,997 14,101 2,379 3,604 4,395
Nov. 42,858 14,562 2,414 3,660 4,432
Dis. 44,666 15,309 2,487 3,671 4,488
2019 Jan. 43,875 15,098 2,494 3,601 4,479
Feb. 42,543 14,397 2,457 3,633 4,522
Mac 43,634 15,009 2,553 3,716 4,493
Apr. 41,867 14,206 2,515 3,536 4,399
Mei 44,066 15,121 2,598 3,634 4,430
Jun 46,000 16,160 2,661 3,778 4,451
Jul. 46,512 16,394 2,688 3,808 4,508
Ogos r 46,466 15,962 2,721 3,813 4,560
Sep. p 44,126 14,981 2,533 3,735 4,539
2018 Jan. 9.9 11.1 11.5 11.6 5.5
Feb. 9.2 10.3 8.8 10.8 4.7Mac 8.6 8.6 8.9 10.6 4.0Apr. 7.9 8.8 10.1 9.8 3.5
Mei 9.3 10.3 11.7 11.0 4.0
Jun 12.1 14.0 12.1 14.9 5.1
Jul. 13.3 15.8 9.1 13.6 7.2
Ogos 14.8 17.6 12.3 14.4 8.9
Sep. 10.5 11.9 10.6 10.8 4.1
Okt. 11.2 13.3 11.5 8.3 5.5
Nov. 12.6 15.5 10.8 9.9 7.3
Dis. 12.4 15.9 8.1 7.6 7.6
2019 Jan. 10.6 13.9 7.8 7.0 4.7
Feb. 8.5 9.4 8.9 5.6 6.0Mac 6.9 7.9 9.4 4.2 4.4Apr. 7.0 8.1 8.8 3.3 5.5
Mei 7.8 9.0 9.6 3.5 4.0
Jun 7.7 8.8 9.2 4.5 3.7
Jul. 7.1 8.1 10.5 3.2 3.3
Ogos r 6.9 7.9 9.6 2.9 3.0
Sep. p 7.2 8.4 8.6 4.0 4.2
2018 Jan. -0.2 0.4 0.5 -1.3 2.5
Feb. -1.1 -0.8 -2.5 2.2 -0.3
Mac 4.1 5.7 3.4 3.7 1.0
Apr. -4.2 -5.5 -0.9 -4.0 -3.1
Mei 4.4 5.6 2.5 2.6 2.2Jun 4.5 7.0 2.8 3.0 0.7Jul. 1.7 2.1 -0.1 2.1 1.7
Ogos 0.1 -2.5 2.0 0.4 1.4
Sep. -5.3 -6.5 -6.0 -3.1 -1.6
Okt. 2.0 2.0 2.0 0.4 0.9
Nov. 2.1 3.3 1.5 1.6 0.8
Dis. 4.2 5.1 3.0 0.3 1.3
2019 Jan. -1.8 -1.4 0.3 -1.9 -0.2
Feb. -3.0 -4.6 -1.5 0.9 1.0
Mac 2.6 4.2 3.9 2.3 -0.6
Apr. -4.0 -5.3 -1.5 -4.9 -2.1
Mei 5.3 6.4 3.3 2.8 0.7Jun 4.4 6.9 2.4 4.0 0.5Jul. 1.1 1.4 1.0 0.8 1.3
Ogos r -0.1 -2.6 1.2 0.1 1.2
Sep. p -5.0 -6.1 -6.9 -2.0 -0.5
Tahun/ Bulan
Year/ Month
Kod/ Code
Jualan / Sales (RM Juta/ million )
% Perubahan / % Changes (YoY)
% Perubahan / % Changes (MoM)
6
26

JADUAL NILAI JUALAN PERDAGANGAN RUNCIT MENGIKUT KUMPULAN (SAMB.)
TABLE SALES VALUE OF RETAIL TRADE BY GROUP (CONT.)
Jualan Runcit di Kedai
Khusus yang Menjual
Peralatan Lain Isi Rumah
Jualan Runcit di Kedai
Khusus yang Menjual
Barangan Kesenian dan
Rekreasi
Jualan Runcit di Kedai
Khusus yang Menjual
Barang Lain
Jualan Runcit di Gerai
dan Pasar
Jualan Runcit Bukan di
Kedai, Gerai atau Pasar
Retail Sale of Other
Household Equipment in
Specialised Stores
Retail Sale of Cultural and
Recreation Goods in
Specialised Stores
Retail Sale of Other Goods
in Specialised Stores
Retail Sale Via Stalls and
Markets
Retail Trade Not in Stores,
Stalls or Markets
475 476 477 478 479
2018 Jan. 5,452 2,213 8,323 119 332
Feb. 5,271 2,189 8,202 115 329
Mac 5,499 2,250 8,510 116 335
Apr. 5,308 2,146 8,173 115 341
Mei 5,487 2,174 8,728 117 338
Jun 5,757 2,273 9,020 120 340
Jul. 5,781 2,280 9,249 118 344
Ogos 5,794 2,311 9,504 119 352
Sep. 5,510 2,408 8,691 120 342
Okt. 5,621 2,342 9,080 122 352
Nov. 5,710 2,376 9,220 122 363
Dis. 6,037 2,478 9,702 127 366
2019 Jan. 5,910 2,470 9,330 128 366
Feb. 5,638 2,382 9,039 124 352
Mac 5,807 2,432 9,144 127 352
Apr. 5,616 2,300 8,810 125 360
Mei 5,910 2,356 9,540 129 349
Jun 6,154 2,469 9,841 130 356
Jul. 6,162 2,457 10,007 127 358
Ogos r 6,153 2,500 10,262 129 367
Sep. p 5,862 2,555 9,429 130 362
2018 Jan. 7.8 9.1 11.2 8.2 5.9
Feb. 8.1 9.5 10.3 6.8 5.3Mac 8.3 10.2 9.8 7.3 7.2Apr. 7.5 9.8 7.3 5.5 6.6
Mei 9.4 8.4 9.4 4.2 4.7
Jun 10.0 12.3 13.2 5.2 5.0
Jul. 11.8 13.7 14.7 5.6 9.2
Ogos 13.7 11.0 16.3 5.5 10.8
Sep. 9.5 10.8 12.4 6.6 8.4
Okt. 9.8 11.5 13.2 7.7 9.8
Nov. 11.1 9.0 14.5 7.4 11.8
Dis. 9.3 12.2 14.8 7.8 9.9
2019 Jan. 8.4 11.6 12.1 7.5 10.3
Feb. 7.0 8.8 10.2 7.8 6.9Mac 5.6 8.1 7.5 9.8 5.1Apr. 5.8 7.2 7.8 8.2 5.6
Mei 7.7 8.4 9.3 9.9 3.2
Jun 6.9 8.6 9.1 8.6 4.9
Jul. 6.6 7.8 8.2 7.7 4.1
Ogos r 6.2 8.2 8.0 8.4 4.5
Sep. p 6.4 6.1 8.5 7.6 5.8
2018 Jan. -1.3 0.2 -1.5 1.2 -0.6
Feb. -3.3 -1.1 -1.5 -3.1 -0.7
Mac 4.3 2.8 3.8 0.3 1.9
Apr. -3.5 -4.6 -4.0 -0.3 1.6
Mei 3.4 1.3 6.8 1.4 -0.8Jun 4.9 4.6 3.3 2.2 0.5Jul. 0.4 0.3 2.5 -1.0 1.3
Ogos 0.2 1.4 2.8 0.7 2.2
Sep. -4.9 4.2 -8.6 1.1 -2.6
Okt. 2.0 -2.8 4.5 1.6 2.8
Nov. 1.6 1.5 1.5 -0.1 3.0
Dis. 5.7 4.3 5.2 3.8 1.1
2019 Jan. -2.1 -0.4 -3.8 0.8 -0.2
Feb. -4.6 -3.6 -3.1 -2.8 -3.8
Mac 3.0 2.1 1.2 2.1 0.2
Apr. -3.3 -5.4 -3.7 -1.7 2.1
Mei 5.2 2.4 8.3 3.0 -3.0Jun 4.1 4.8 3.2 1.0 2.2Jul. 0.1 -0.5 1.7 -1.9 0.5
Ogos r -0.2 1.7 2.5 1.4 2.6
Sep. p -4.7 2.2 -8.1 0.3 -1.4
Tahun/ Bulan
Year/ Month
Kod/ Code
% Perubahan / % Changes (YoY)
Jualan / Sales (RM Juta/ million )
% Perubahan / % Changes (MoM)
6
27

JADUAL INDEKS VOLUM PERDAGANGAN RUNCIT TIDAK DISELARASKAN MUSIM MENGIKUT KUMPULAN (2015=100)
TABLE NON-SEASONALLY ADJUSTED VOLUME INDEX OF RETAIL TRADE BY GROUP (2015=100)
Jumlah Jualan Runcit di Kedai
Bukan Pengkhususan
Jualan Runcit Makanan,
Minuman dan Tembakau
di Kedai Pengkhususan
Jualan Runcit di Kedai
Khusus yang Menjual
Bahan Api Kenderaan
Jualan Runcit di Kedai
Khusus yang Menjual
Peralatan Komunikasi dan
Maklumat
Total Retail Sale in Non-
specialised Stores
Retail Sale of Food,
Beverages and Tobacco in
Specialised Stores
Retail Sale of Automotive
Fuel in Specialised Stores
Retail Sale of Information
and Communication
Equipment in Specialised
Stores
47 471 472 473 474
100.0 33.6 5.5 10.3 9.3
2018 Jan. 124.4 123.0 127.1 114.0 127.5
Feb. 121.6 122.5 123.3 110.8 124.9
Mac 127.7 123.7 125.7 170.3 126.1
Apr. 119.8 115.1 125.1 135.5 123.9
Mei 122.3 122.9 125.0 125.1 124.6
Jun 133.8 132.2 135.8 136.8 135.0
Jul. 135.1 134.0 131.5 133.5 135.9
Ogos 132.6 128.6 130.1 135.4 138.5
Sep. 125.5 119.4 128.8 136.6 132.2
Okt. 130.8 124.0 133.0 138.4 140.6
Nov. 133.9 130.0 131.5 141.8 143.9
Dis. 139.9 136.8 135.6 135.9 146.4
2019 Jan. 138.3 136.2 137.9 122.4 145.4
Feb. 132.9 131.3 134.1 118.5 141.5
Mac 137.1 129.3 137.1 180.6 140.5
Apr. 129.0 120.5 135.5 143.2 138.4
Mei 133.8 136.0 137.1 132.5 136.9
Jun 146.7 149.0 148.2 150.0 147.6
Jul. 146.5 148.4 144.6 145.7 147.7
Ogos r 142.5 139.2 141.6 146.2 149.2
Sep. p 134.8 128.0 138.2 147.8 143.5
2018 Jan. 8.5 8.4 9.1 7.9 9.6
Feb. 7.7 7.4 6.4 10.9 7.7
Mac 6.4 3.8 6.6 12.3 6.5
Apr. 6.1 5.1 9.6 9.4 6.4
Mei 7.5 6.6 11.0 5.9 8.2
Jun 10.4 10.5 13.7 6.1 8.9
Jul. 12.0 12.4 10.8 4.9 11.7
Ogos 13.9 14.5 14.1 6.2 13.9
Sep. 10.3 8.9 11.4 4.7 12.4
Okt. 10.9 10.2 11.7 4.3 13.6
Nov. 12.3 12.2 11.2 7.8 15.6
Dis. 12.2 12.5 8.6 5.4 16.1
2019 Jan. 11.2 10.7 8.5 7.4 14.0
Feb. 9.3 7.2 8.8 6.9 13.2
Mac 7.4 4.5 9.1 6.1 11.4
Apr. 7.7 4.7 8.3 5.7 11.7
Mei 9.4 10.7 9.7 5.9 9.9
Jun 9.6 12.8 9.1 9.6 9.4
Jul. 8.4 10.7 9.9 9.1 8.7
Ogos r 7.5 8.2 8.8 7.9 7.7
Sep. p 7.4 7.3 7.3 8.2 8.5
2018 Jan. -0.2 1.2 1.7 -11.5 1.2
Feb. -2.2 -0.4 -2.9 -2.8 -2.0
Mac 5.0 1.0 1.9 53.6 1.0
Apr. -6.2 -7.0 -0.5 -20.4 -1.8
Mei 2.1 6.8 -0.1 -7.7 0.5
Jun 9.4 7.5 8.6 9.4 8.4
Jul. 0.9 1.4 -3.2 -2.4 0.7
Ogos -1.8 -4.1 -1.1 1.4 1.9
Sep. -5.4 -7.2 -1.0 0.9 -4.6
Okt. 4.2 3.9 3.2 1.3 6.3
Nov. 2.4 4.9 -1.1 2.4 2.4
Dis. 4.5 5.2 3.2 -4.1 1.7
2019 Jan. -1.1 -0.4 1.7 -9.9 -0.6
Feb. -3.9 -3.6 -2.7 -3.2 -2.7
Mac 3.2 -1.6 2.2 52.4 -0.7
Apr. -5.9 -6.8 -1.2 -20.7 -1.5
Mei 3.7 12.9 1.2 -7.5 -1.1
Jun 9.6 9.6 8.1 13.2 7.8
Jul. -0.2 -0.4 -2.4 -2.9 0.1
Ogos r -2.7 -6.2 -2.1 0.3 1.0
Sep. p -5.4 -8.0 -2.5 1.1 -3.9
% Perubahan / % Changes (MoM)
Tahun/ Bulan
Year/ Month
Kod/ Code
Wajaran/ Weighted
% Perubahan / % Changes (YoY)
7
28

JADUAL INDEKS VOLUM PERDAGANGAN RUNCIT TIDAK DISELARASKAN MUSIM MENGIKUT KUMPULAN (2015=100)
TABLE NON-SEASONALLY ADJUSTED VOLUME INDEX OF RETAIL TRADE BY GROUP (2015=100)
Jualan Runcit di Kedai
Khusus yang Menjual
Peralatan Lain Isi Rumah
Jualan Runcit di Kedai
Khusus yang Menjual
Barangan Kesenian dan
Rekreasi
Jualan Runcit di Kedai
Khusus yang Menjual
Barang Lain
Jualan Runcit di Gerai
dan Pasar
Jualan Runcit Bukan di
Kedai, Gerai atau Pasar
Retail Sale of Other
Household Equipment in
Specialised Stores
Retail Sale of Cultural and
Recreation Goods in
Specialised Stores
Retail Sale of Other Goods
in Specialised Stores
Retail Sale Via Stalls and
Markets
Retail Trade Not in Stores,
Stalls or Markets
475 476 477 478 479
15.2 4.8 20.0 0.3 1.0
2018 Jan. 120.6 131.6 125.1 123.3 114.1
Feb. 111.8 129.7 124.5 119.5 107.7
Mac 119.6 131.5 129.1 119.6 118.9
Apr. 113.0 117.9 122.0 115.3 116.6
Mei 116.6 117.1 124.3 124.1 114.2
Jun 124.4 131.8 140.7 124.0 117.5
Jul. 125.8 132.5 144.0 112.7 119.2
Ogos 125.9 128.6 138.4 126.0 126.8
Sep. 120.3 123.2 127.9 130.0 123.4
Okt. 122.3 125.9 135.9 139.8 127.7
Nov. 124.4 135.3 136.3 124.8 130.5
Dis. 131.8 146.9 143.8 131.5 132.1
2019 Jan. 129.4 149.7 141.5 136.3 128.5
Feb. 118.7 142.4 138.4 131.8 117.8
Mac 125.4 143.4 139.9 133.8 128.9
Apr. 119.0 128.2 133.4 127.1 127.0
Mei 125.1 127.7 137.1 137.1 119.1
Jun 131.1 144.1 154.8 134.5 122.8
Jul. 131.6 142.7 156.2 121.1 123.2
Ogos r 131.6 138.7 149.5 135.6 133.1
Sep. p 126.2 129.4 139.5 137.5 130.0
2018 Jan. 5.3 11.2 9.3 5.8 3.6
Feb. 5.9 11.1 8.0 5.5 4.0
Mac 5.7 9.3 6.8 6.3 6.4
Apr. 5.5 9.2 5.0 4.0 5.0
Mei 8.3 8.5 6.8 3.9 2.8
Jun 8.1 14.3 11.8 6.2 4.3
Jul. 9.9 16.2 13.9 7.1 8.6
Ogos 11.9 13.7 16.2 6.6 11.1
Sep. 8.8 13.3 11.4 9.5 9.4
Okt. 8.9 13.9 11.7 10.4 10.6
Nov. 9.7 11.0 13.7 10.1 13.1
Dis. 7.9 14.3 14.2 10.7 11.6
2019 Jan. 7.3 13.8 13.1 10.5 12.7
Feb. 6.2 9.8 11.2 10.3 9.4
Mac 4.8 9.1 8.4 11.9 8.4
Apr. 5.3 8.7 9.3 10.3 8.9
Mei 7.3 9.0 10.3 10.4 4.3
Jun 5.5 9.3 10.0 8.4 4.5
Jul. 4.6 7.7 8.5 7.5 3.3
Ogos r 4.5 7.9 8.0 7.7 5.0
Sep. p 4.9 5.0 9.0 5.7 5.4
2018 Jan. -1.2 2.4 -0.7 3.8 -3.6
Feb. -7.3 -1.4 -0.5 -3.1 -5.6
Mac 7.0 1.4 3.7 0.1 10.4
Apr. -5.5 -10.3 -5.5 -3.6 -2.0
Mei 3.2 -0.7 1.9 7.7 -2.1
Jun 6.7 12.6 13.2 -0.1 2.9
Jul. 1.2 0.5 2.3 -9.1 1.4
Ogos 0.1 -3.0 -3.8 11.7 6.4
Sep. -4.4 -4.1 -7.6 3.2 -2.7
Okt. 1.6 2.1 6.2 7.5 3.5
Nov. 1.7 7.5 0.3 -10.8 2.2
Dis. 5.9 8.6 5.5 5.3 1.2
2019 Jan. -1.8 1.9 -1.6 3.7 -2.7
Feb. -8.2 -4.9 -2.2 -3.3 -8.3
Mac 5.6 0.7 1.1 1.6 9.4
Apr. -5.1 -10.6 -4.7 -5.0 -1.5
Mei 5.1 -0.4 2.8 7.8 -6.3
Jun 4.9 12.8 12.9 -1.9 3.1
Jul. 0.3 -0.9 0.9 -9.9 0.3
Ogos r -0.04 -2.8 -4.3 12.0 8.1
Sep. p -4.1 -6.7 -6.7 1.4 -2.4
% Perubahan / % Changes (YoY)
% Perubahan / % Changes (MoM)
Tahun/ Bulan
Year/ Month
Kod/ Code
Wajaran/ Weighted
7
29

JADUAL NILAI JUALAN KENDERAAN BERMOTOR MENGIKUT KUMPULAN
TABLE SALES VALUE OF MOTOR VEHICLES BY GROUP
Jumlah Jualan Kenderaan
Bermotor
Penyelenggaraan dan
Pembaikan Kenderaan
Bermotor
Jualan Komponen dan
Aksesori Kenderaan
Bermotor
Jualan, Penyelenggaraan
dan Pembaikan Motosikal
Total Sales of Motor Vehicles Maintenance and Repair of
Motor Vehicles
Sale of Motor Vehicles
Parts and Accessories
Sale, Maintenance and
Repair of Motorcycles
45 451 452 453 454
2018 Jan. 11,655 6,179 1,543 3,060 873
Feb. 10,544 5,623 1,431 2,653 837
Mac 12,278 6,888 1,473 2,914 1,003
Apr. 12,066 6,812 1,427 2,868 959
Mei 12,308 6,732 1,549 3,041 986
Jun 13,019 7,347 1,642 3,079 951
Jul. 13,861 8,129 1,585 3,099 1,048
Ogos 13,467 7,734 1,640 3,111 982
Sep. 11,164 5,605 1,494 3,095 970
Okt. 12,132 6,548 1,469 3,101 1,014
Nov. 12,287 6,660 1,538 3,103 985
Dis. 11,898 6,199 1,612 3,115 971
2019 Jan. 12,211 6,488 1,614 3,177 932
Feb. 10,782 5,600 1,501 2,777 903
Mac 12,594 6,964 1,550 3,045 1,035
Apr. 12,337 6,875 1,484 2,977 1,000
Mei 13,425 7,614 1,618 3,163 1,030
Jun 12,700 6,716 1,751 3,255 978
Jul. 13,628 7,658 1,670 3,220 1,081
Ogos r 13,619 7,665 1,732 3,211 1,011
Sep. p 11,656 5,868 1,582 3,201 1,005
2018 Jan. 2.6 -1.0 7.3 7.5 4.6
Feb. 2.2 -0.9 4.9 7.4 2.9
Mac -4.6 -8.6 7.9 -1.6 -0.7
Apr. 6.3 6.8 9.1 4.2 5.4
Mei -2.9 -8.3 7.0 3.9 3.5
Jun 10.1 13.6 7.6 5.1 5.9
Jul. 12.1 15.8 6.9 7.8 6.1
Ogos 10.6 13.0 7.8 8.2 5.7
Sep. -0.9 -7.6 9.3 6.6 3.9
Okt. 2.9 1.7 3.0 5.2 4.2
Nov. 2.1 -0.1 3.7 6.0 3.1
Dis. -1.4 -5.1 1.2 2.6 7.4
2019 Jan. 4.8 5.0 4.6 3.8 6.8
Feb. 2.3 -0.4 4.9 4.7 7.9
Mac 2.6 1.1 5.2 4.5 3.2
Apr. 2.2 0.9 4.1 3.8 4.3
Mei 9.1 13.1 4.4 4.0 4.5
Jun -2.5 -8.6 6.6 5.7 2.8
Jul. -1.7 -5.8 5.4 3.9 3.1
Ogos r 1.1 -0.9 5.6 3.2 2.9
Sep. p 4.4 4.7 5.8 3.4 3.6
2018 Jan. -3.4 -5.4 -3.2 0.8 -3.5
Feb. -9.5 -9.0 -7.3 -13.3 -4.1
Mac 16.4 22.5 2.9 9.9 19.8
Apr. -1.7 -1.1 -3.1 -1.6 -4.4
Mei 2.0 -1.2 8.6 6.0 2.8
Jun 5.8 9.1 6.0 1.3 -3.5
Jul. 6.5 10.6 -3.5 0.7 10.2
Ogos -2.8 -4.9 3.5 0.4 -6.3
Sep. -17.1 -27.5 -8.9 -0.5 -1.2
Okt. 8.7 16.8 -1.7 0.2 4.5
Nov. 1.3 1.7 4.7 0.1 -2.8
Dis. -3.2 -6.9 4.9 0.4 -1.5
2019 Jan. 2.6 4.6 0.1 2.0 -4.0
Feb. -11.7 -13.7 -7.0 -12.6 -3.1
Mac 16.8 24.3 3.3 9.6 14.6
Apr. -2.0 -1.3 -4.2 -2.2 -3.4
Mei 8.8 10.7 9.0 6.3 3.0
Jun -5.4 -11.8 8.3 2.9 -5.1
Jul. 7.3 14.0 -4.7 -1.1 10.5
Ogos r -0.1 0.1 3.7 -0.3 -6.5
Sep. p -14.4 -23.4 -8.7 -0.3 -0.6
Tahun/ Bulan
Year/ Month
Kod/ Code
% Perubahan / % Changes (YoY)
% Perubahan / % Changes (MoM)
Jualan / Sales (RM Juta/ million )
8
30
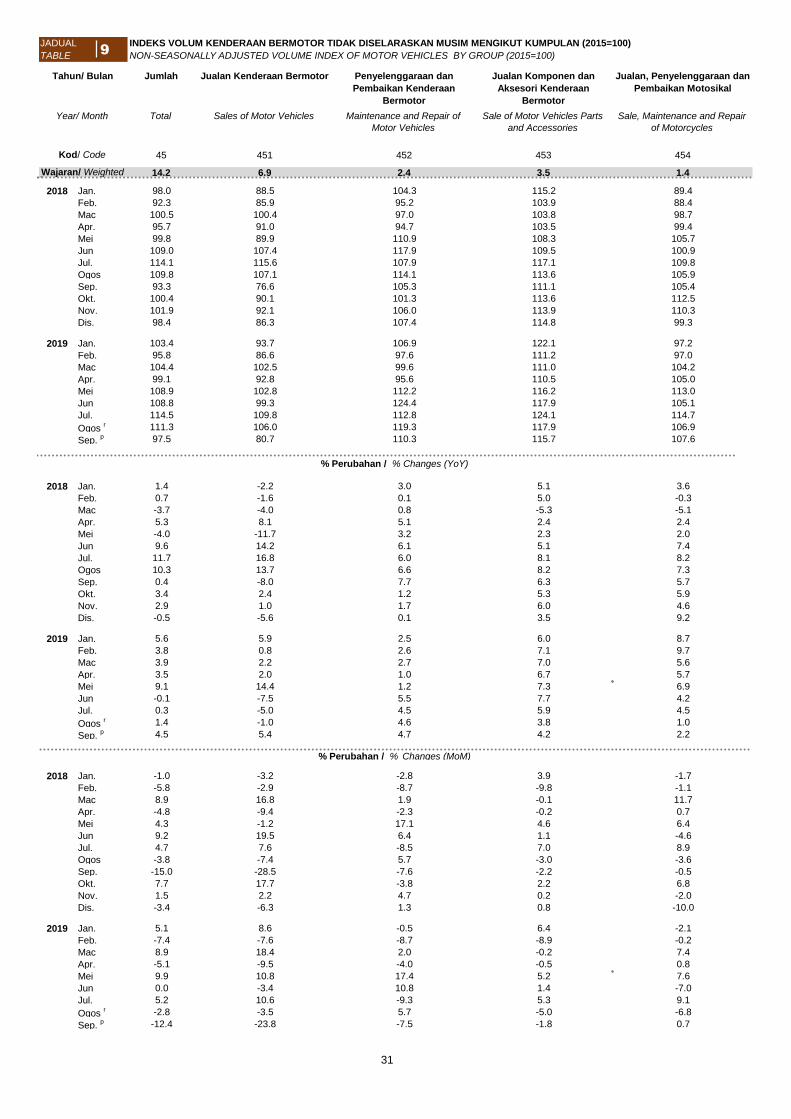
JADUAL INDEKS VOLUM KENDERAAN BERMOTOR TIDAK DISELARASKAN MUSIM MENGIKUT KUMPULAN (2015=100)
TABLE NON-SEASONALLY ADJUSTED VOLUME INDEX OF MOTOR VEHICLES BY GROUP (2015=100)
Jumlah Jualan Kenderaan Bermotor Penyelenggaraan dan
Pembaikan Kenderaan
Bermotor
Jualan Komponen dan
Aksesori Kenderaan
Bermotor
Jualan, Penyelenggaraan dan
Pembaikan Motosikal
Total Sales of Motor Vehicles Maintenance and Repair of
Motor Vehicles
Sale of Motor Vehicles Parts
and Accessories
Sale, Maintenance and Repair
of Motorcycles
45 451 452 453 454
14.2 6.9 2.4 3.5 1.4
2018 Jan. 98.0 88.5 104.3 115.2 89.4
Feb. 92.3 85.9 95.2 103.9 88.4
Mac 100.5 100.4 97.0 103.8 98.7
Apr. 95.7 91.0 94.7 103.5 99.4
Mei 99.8 89.9 110.9 108.3 105.7
Jun 109.0 107.4 117.9 109.5 100.9
Jul. 114.1 115.6 107.9 117.1 109.8
Ogos 109.8 107.1 114.1 113.6 105.9
Sep. 93.3 76.6 105.3 111.1 105.4
Okt. 100.4 90.1 101.3 113.6 112.5
Nov. 101.9 92.1 106.0 113.9 110.3
Dis. 98.4 86.3 107.4 114.8 99.3
2019 Jan. 103.4 93.7 106.9 122.1 97.2
Feb. 95.8 86.6 97.6 111.2 97.0
Mac 104.4 102.5 99.6 111.0 104.2
Apr. 99.1 92.8 95.6 110.5 105.0
Mei 108.9 102.8 112.2 116.2 113.0
Jun 108.8 99.3 124.4 117.9 105.1
Jul. 114.5 109.8 112.8 124.1 114.7
Ogos r 111.3 106.0 119.3 117.9 106.9
Sep. p 97.5 80.7 110.3 115.7 107.6
2018 Jan. 1.4 -2.2 3.0 5.1 3.6
Feb. 0.7 -1.6 0.1 5.0 -0.3
Mac -3.7 -4.0 0.8 -5.3 -5.1
Apr. 5.3 8.1 5.1 2.4 2.4
Mei -4.0 -11.7 3.2 2.3 2.0
Jun 9.6 14.2 6.1 5.1 7.4
Jul. 11.7 16.8 6.0 8.1 8.2
Ogos 10.3 13.7 6.6 8.2 7.3
Sep. 0.4 -8.0 7.7 6.3 5.7
Okt. 3.4 2.4 1.2 5.3 5.9
Nov. 2.9 1.0 1.7 6.0 4.6
Dis. -0.5 -5.6 0.1 3.5 9.2
2019 Jan. 5.6 5.9 2.5 6.0 8.7
Feb. 3.8 0.8 2.6 7.1 9.7
Mac 3.9 2.2 2.7 7.0 5.6
Apr. 3.5 2.0 1.0 6.7 5.7
Mei 9.1 14.4 1.2 7.3 6.9
Jun -0.1 -7.5 5.5 7.7 4.2
Jul. 0.3 -5.0 4.5 5.9 4.5
Ogos r 1.4 -1.0 4.6 3.8 1.0
Sep. p 4.5 5.4 4.7 4.2 2.2
2018 Jan. -1.0 -3.2 -2.8 3.9 -1.7
Feb. -5.8 -2.9 -8.7 -9.8 -1.1
Mac 8.9 16.8 1.9 -0.1 11.7
Apr. -4.8 -9.4 -2.3 -0.2 0.7
Mei 4.3 -1.2 17.1 4.6 6.4
Jun 9.2 19.5 6.4 1.1 -4.6
Jul. 4.7 7.6 -8.5 7.0 8.9
Ogos -3.8 -7.4 5.7 -3.0 -3.6
Sep. -15.0 -28.5 -7.6 -2.2 -0.5
Okt. 7.7 17.7 -3.8 2.2 6.8
Nov. 1.5 2.2 4.7 0.2 -2.0
Dis. -3.4 -6.3 1.3 0.8 -10.0
2019 Jan. 5.1 8.6 -0.5 6.4 -2.1
Feb. -7.4 -7.6 -8.7 -8.9 -0.2
Mac 8.9 18.4 2.0 -0.2 7.4
Apr. -5.1 -9.5 -4.0 -0.5 0.8
Mei 9.9 10.8 17.4 5.2 7.6
Jun 0.0 -3.4 10.8 1.4 -7.0
Jul. 5.2 10.6 -9.3 5.3 9.1
Ogos r -2.8 -3.5 5.7 -5.0 -6.8
Sep. p -12.4 -23.8 -7.5 -1.8 0.7
Wajaran/ Weighted
Kod/ Code
Tahun/ Bulan
Year/ Month
% Perubahan / % Changes (MoM)
% Perubahan / % Changes (YoY)
9
31

JADUAL
TABLE
Indeks Harga Pengguna Kadar Penyertaan Tenaga
Buruh (%)
Kadar Pengangguran (%) Eksport
(RM Bilion)
Import
(RM Bilion)
Consumer Price Index Labour Force Participation
Rate (%)
Unemployment Rate (%) Export
(RM Billion)
Import
(RM Billion)
2018 Jan. 121.3 68.2 3.4 83,252 73,201
Feb. 121.3 68.2 3.3 70,552 61,417
Mac 120.9 68.2 3.3 84,856 69,897
Apr. 120.9 68.2 3.3 84,636 71,374
Mei 121.1 68.4 3.3 82,862 74,040
Jun 119.6 68.5 3.4 78,845 72,746
Jul. 119.8 68.6 3.4 86,475 78,349
Ogos 120.0 68.4 3.4 81,982 80,536
Sep. 120.5 68.5 3.3 83,342 67,771
Okt. 120.7 68.5 3.3 97,122 80,270
Nov. 121.0 68.4 3.3 85,543 77,046
Dis. 121.1 68.5 3.3 84,120 73,157
2019 Jan. 120.5 68.6 3.3 85,400 73,886
Feb. 120.8 68.5 3.3 66,599 55,543
Mac 121.1 68.5 3.4 84,063 69,679
Apr. 121.1 68.5 3.4 85,155 74,346
Mei 121.4 68.5 3.3 84,138 75,063
Jun 121.4 68.6 3.3 76,143 65,631
Jul. 121.5 68.5 3.3 87,958 73,682
Ogos r 121.8 68.6 3.3 81,355 70,434
Sep. p 121.8 68.7 3.3 77,704 69,367
2018 Jan. 2.7 0.7 -0.1 18.4 11.9
Feb. 1.4 0.6 -0.2 -2.0 -2.6
Mac 1.3 0.7 -0.1 2.4 -9.5
Apr. 1.4 0.7 -0.1 14.0 9.5
Mei 1.8 0.9 -0.1 4.6 1.5
Jun 0.8 1.0 0.0 8.3 16.2
Jul. 0.9 1.3 -0.1 9.8 11.0
Ogos 0.2 0.9 0.0 -0.1 11.7
Sep. 0.3 0.9 -0.1 7.0 -2.7
Okt. 0.6 0.7 -0.1 18.6 11.7
Nov. 0.2 0.7 0.0 2.5 4.8
Dis. 0.2 0.6 0.0 5.8 1.4
2019 Jan. -0.7 0.6 -2.9 2.6 0.9
Feb. -0.4 0.4 0.0 -5.6 -9.6
Mac 0.2 0.4 3.0 -0.9 -0.3
Apr. 0.2 0.4 3.0 0.6 4.2
Mei 0.2 0.1 0.0 1.5 1.4
Jun 1.5 0.1 -2.9 -3.4 -9.8
Jul. 1.4 -0.1 -2.9 1.7 -6.0
Ogos r 1.5 0.3 -2.9 -0.8 -12.5
Sep. p 1.1 0.3 0.0 -6.8 2.4
2018 Jan. 0.3 0.1 0.1 4.7 1.5
Feb. 0.0 0.0 -0.1 -15.3 -16.1
Mac -0.3 0.0 0.0 20.3 13.8
Apr. 0.0 0.0 0.0 -0.3 2.1
Mei 0.2 0.3 0.0 -2.1 3.7
Jun -1.2 0.1 0.1 -4.8 -1.7
Jul. 0.2 0.1 0.0 9.7 7.7
Ogos 0.2 -0.3 0.0 -5.2 2.8
Sep. 0.4 0.1 -0.1 1.7 -15.9
Okt. 0.2 0.0 0.0 16.5 18.4
Nov. 0.2 -0.1 0.0 -11.9 -4.0
Dis. 0.1 0.1 0.0 -1.7 -5.0
2019 Jan. -0.5 0.1 0.0 1.5 1.0
Feb. 0.2 -0.1 0.0 -22.0 -24.8
Mac 0.2 0.0 3.0 26.2 25.5
Apr. 0.0 0.0 0.0 1.3 6.7
Mei 0.2 0.0 -2.9 -1.2 1.0
Jun 0.0 0.1 0.0 -9.5 -12.6
Jul. 0.1 -0.1 0.0 15.5 12.3
Ogos r 0.2 0.1 0.0 -7.5 -4.4
Sep. p 0.0 0.1 0.0 -4.5 -1.6
INDIKATOR EKONOMI, MALAYSIA
ECONOMIC INDICATORS, MALAYSIA
Tahun/ Bulan
Year/ Month
% Perubahan / % Changes (YoY)
% Perubahan / % Changes (MoM)
10
32

JADUAL
TABLE
MALAYSIA HONG KONG SINGAPURA INDONESIA UNITED KINGDOM THAILANDREPUBLIC OF
KOREA
MALAYSIA HONG KONG SINGAPORE INDONESIAUNITED
KINGDOMTHAILAND
REPUBLIC OF
KOREA
2018 Jan. 124.4 112.3 98.7 203.5 102.6 236.1 105.3
Feb. 121.6 113.6 96.8 200.0 103.2 230.3 101.7
Mac 127.7 99.1 98.9 209.1 101.7 260.1 113.2
Apr. 119.8 97.6 99.8 215.0 103.2 223.6 109.9
Mei 122.3 100.4 99.2 231.9 105.5 246.4 112.8
Jun 133.8 93.5 100.4 237.8 104.9 247.5 108.7
Jul. 135.1 97.1 97.8 216.0 106.2 256.7 110.8
Ogos 132.6 95.6 99.0 214.3 105.7 273.1 107.0
Sep. 125.5 91.3 99.5 210.8 105.5 255.8 109.9
Okt. 130.8 99.0 99.3 208.1 105.3 262.7 113.5
Nov. 133.9 97.2 99.9 213.8 106.8 265.2 116.2
Dis. 139.9 112.1 97.7 236.3 105.9 283.2 116.4
2019 Jan. 138.3 120.0 98.3 218.1 107.0 259.0 109.8
Feb. 132.9 101.7 97.0 218.2 107.4 248.1 99.8
Mac 137.1 98.3 98.0 230.2 108.7 284.0 116.0
Apr. 129.0 92.7 98.5 229.4 108.3 253.8 111.4
Mei 133.8 98.6 96.2 249.8 108.0 271.1 116.0
Jun 146.7 86.4 94.1 233.6 108.7 264.1 110.0
Jul. 146.5 84.4 96.8 221.2 109.2 257.6 110.5
Ogos r 142.5 71.4 95.5 216.6 108.9 264.97 111.4
Sep. p 134.8 72.7 n.a 215.2 109.0 n.a 113.5
2018 Jan. 8.5 2.4 0.3 -1.8 2.0 9.9 1.9
Feb. 7.7 28.3 -3.1 1.5 1.8 8.0 6.8
Mac 6.4 10.0 -1.1 2.5 1.2 3.8 7.4
Apr. 6.1 10.9 0.8 4.1 0.8 7.8 5.8
Mei 7.5 11.4 -0.2 8.3 4.1 6.3 4.8
Jun 10.4 9.9 0.4 2.3 3.2 7.5 4.3
Jul. 12.0 5.9 -3.1 2.9 3.9 16.0 5.6
Ogos 13.9 8.0 1.4 6.1 3.4 16.9 5.6
Sep. 10.3 5.3 -0.3 4.8 3.0 10.3 0.4
Okt. 10.9 6.0 -0.1 2.9 2.3 20.3 5.1
Nov. 12.3 1.2 0.6 3.4 3.4 13.3 1.0
Dis. 12.2 0.1 -2.2 7.7 3.3 10.5 3.1
2019 Jan. 11.2 6.9 0.6 7.2 4.2 9.7 4.3
Feb. 9.3 -10.5 -1.3 9.1 4.1 7.7 -1.9
Mac 7.4 -0.8 1.0 10.1 6.8 9.2 2.5
Apr. 7.7 -5.0 0.5 6.7 4.9 13.5 1.4
Mei 9.4 -1.8 -2.3 7.7 2.3 10.0 2.8
Jun 9.6 -7.6 -2.2 -1.8 3.7 6.7 1.2
Jul. 8.4 -13.1 2.9 2.4 3.4 0.3 -0.3
Ogos r 7.5 -25.3 -1.3 1.1 2.6 -3.0 4.1
Sep. p 7.4 -20.4 n.a 2.1 3.1 n.a 3.3
2018 Jan. 10.1 0.3 -4.8 -7.3 -4.2 -7.8 -6.7
Feb. -2.2 1.2 -1.9 -1.7 0.6 -2.5 -3.4
Mac 5.0 -12.8 2.2 4.5 -1.5 12.9 11.3
Apr. -6.2 -1.6 0.9 2.8 1.5 -14.0 -2.9
Mei 2.1 3.0 -0.6 7.9 2.2 10.2 2.6
Jun 9.4 -6.9 1.2 2.5 -0.6 0.4 -3.6
Jul. 0.9 3.9 -2.6 -9.2 1.2 3.7 1.9
Ogos -1.8 -1.5 1.2 -0.8 -0.5 6.4 -3.4
Sep. -5.4 -4.5 0.5 -1.6 -0.2 -6.3 2.7
Okt. 4.2 8.4 -0.2 -1.3 -0.2 2.7 3.3
Nov. 2.4 -1.8 0.6 2.7 1.4 0.9 2.4
Dis. 4.5 15.3 -2.2 10.5 -0.8 6.8 0.2
2019 Jan. -1.1 7.0 0.6 -7.7 1.0 -8.5 -5.7
Feb. -3.9 -15.3 -1.3 0.0 0.4 -4.2 -9.1
Mac 3.2 -3.3 1.0 5.5 1.2 14.5 16.2
Apr. -5.9 -5.7 0.5 -0.3 -0.4 -10.6 -4.0
Mei 3.7 6.4 -2.3 8.9 -0.3 6.8 4.1
Jun 9.6 -12.4 -2.2 -6.5 0.6 -2.5 -5.2
Jul. -0.2 -2.3 2.9 -5.3 0.5 -2.5 0.5
Ogos r -2.7 -15.4 -1.3 -2.1 -0.3 2.9 0.8
Sep. p -5.4 1.8 n.a -0.6 0.1 n.a 1.9
INDEKS PERDAGANGAN RUNCIT BAGI NEGARA TERPILIH
RETAIL TRADE INDEX FOR SELECTED COUNTRIES
Tahun/ Bulan
Year/ Month
% Perubahan / % Changes (MoM)
% Perubahan / % Changes (YoY)
11
33

Muka surat ini sengaja dibiarkan kosong.
This page is deliberately left blank.
INDIKATOR TAMBAHAN
ADDITIONAL INDICATORS

Muka surat ini sengaja dibiarkan kosong.
This page is deliberately left blank.

37
INDIKATOR TAMBAHAN ADDITIONAL INDICATORS
Carta 13: Kadar Penyertaan Tenaga Buruh, Jan. 2018 – September 2019 Chart 13: Labour Force Participation Rate, Jan. 2018 – September 2019
Carta 14: Kadar Pengangguran, Jan. 2018 – September 2019 Chart 14: Unemployment Rate, Jan. 2018 - September 2019
Carta 12: Indeks Harga Pengguna, Jan. 2018 – September 2019 Chart 12: Consumer Price Index, Jan. 2018 – September 2019

38
INDIKATOR TAMBAHAN ADDITIONAL INDICATORS
Carta 15: Eksport Malaysia, Jan. 2018 - September 2019 Chart 15: Export Malaysia, Jan. 2018 - September 2019
Carta 16: Import Malaysia, Jan. 2018 - September 2019 Chart 16: Import Malaysia, Jan. 2018 - September 2019

NOTA TEKNIKAL
TECHNICAL NOTES

Muka surat ini sengaja dibiarkan kosong.
This page is deliberately left blank.
41
1. PENDAHULUAN
Data dalam penerbitan ini dikumpul melalui Survei Perdagangan Borong & Runcit Bulanan
yang merangkumi sektor Perdagangan Borong dan Runcit bermula pada Januari 2014;
Walau bagaimanapun, untuk tujuan penerbitan ini, data yang dilaporkan adalah bermula
tahun 2018.
2. OBJEKTIF
Penerbitan ini membentangkan maklumat nilai jualan dalam sektor Perdagangan Borong
dan Runcit. Survei yang dijalankan ini adalah untuk:
Menyediakan indikator jangka pendek sektor Perdagangan Borong dan Runcit;
Menyediakan input dalam penyusunan Indeks Perdagangan Borong dan Runcit
bulanan;
Menyediakan maklumat bagi penyusunan Keluaran Dalam Negeri Kasar Suku
Tahunan; dan
Membantu pihak kerajaan dan organisasi lain termasuk komuniti perniagaan dalam
merancang dan membuat keputusan.
3. SKOP DAN LIPUTAN
Survei ini meliputi semua pertubuhan yang berdaftar dengan badan-badan kawal selia
yang terlibat dalam Perkhidmatan Perdagangan Borong & Runcit.
4. KONSEP DAN DEFINISI
Klasifikasi industri adalah berasaskan kepada Piawaian Klasifikasi Industri Malaysia 2008
Ver.1.0. Klasifikasi yang diguna pakai adalah selaras dengan International Standard
Industrial Classification All Economic Activities, Revision 4, United Nations Statistics
Division. Manakala, perdagangan borong dan runcit yang digunapakai dalam penerbitan ini
berasaskan kepada saranan di dalam Manual International Recommendations for
Distributive Trade Statistics 2008 (IRDTS 2008) yang diterbitkan oleh United Nations
Statistics Division. Definisi tersebut adalah termasuk aktiviti berikut:
NOTA TEKNIKAL

42
4.1 Perdagangan Borong & Runcit
4.1.1 Perdagangan Borong
Merujuk kepada penjualan semula (tanpa pengubahsuaian) barangan baru dan
barang yang telah digunakan kepada peruncit, pengguna perindustrian,
perdagangan, institusi atau profesional; atau kepada pemborong lain; atau
menjual dagangan kepada orang atau syarikat berkenaan.
Pemborong selalunya memasang, memilih dan menklasifikasikan barang dalam
lot-lot besar; memecahkan muatan yang besar, membungkus semula dan
membotol (kecuali bekas yang kedap udara) dan membahagi semula kepada lot-
lot kecil; menyimpan, menyejuk, menghantar dan memasang barang dan juga
turut serta dalam promosi jualan untuk pelanggan dan rekabentuk label.
4.1.2 Perdagangan Runcit
Merujuk kepada penjualan semula (jualan tanpa pengubahsuaian) barang baru
dan terpakai kepada orang awam untuk kegunaan peribadi atau isi rumah.
4.1.3 Kenderaan Bermotor
Merujuk kepada jualan secara borong dan runcit kenderaan bermotor dan
motosikal, sama ada baru atau terpakai, jualan alat-alat ganti dan aksesori
kenderaan, penyelenggaraan dan pembaikan kenderaan bermotor dan motosikal
termasuk mencuci, mengilap serta agen komisen.
4.2 Indeks Volum Perdagangan Borong & Runcit
4.2.1 Jenis Indeks Volum
Indeks Volum Perdagangan Borong & Runcit diukur pada tempoh rujukan
berbanding tahun asas, (2015=100).
5. UNIT MELAPOR
Survei ini dilaksanakan dengan menggunakan pendekatan pertubuhan. Pertubuhan
ditakrifkan sebagai “satu unit ekonomi yang bergiat di bawah satu aktiviti, di bawah
penguasaan tunggal yang sah dan beroperasi di satu lokasi fizikal”. Setiap pertubuhan
diberikan klasifikasi industri yang berdasarkan aktiviti utama dan bukannya mengikut
syarikat induk.

43
6. NILAI JUALAN
Definisi ini terpakai kepada Perdagangan Borong & Runcit.
Nilai jualan merujuk kepada:
(a) nilai semua barang di mana hak milik atau hak mutlak untuk penggunaan telah
dipindahkan kepada orang lain dengan tujuan barang itu akan dibeli akhirnya; dan
(b) nilai perkhidmatan yang diberikan dalam tempoh laporan tanpa mengambil kira masa
dan cara pembayaran dibuat.
Nilai jualan dalam survei ini merujuk kepada jumlah bayaran yang dibayar oleh
pelanggan-pelanggan. Ia termasuk:
(a) harga jualan;
(b) caj-caj pinjaman kewangan, pengiriman dan pemasangan, jika perkhidmatan ini
diberikan oleh pertubuhan yang diliputi.
7. KUASA PERUNDANGAN
Maklumat yang dikumpul adalah mengikut peruntukan Akta Perangkaan 1965
(Disemak 1989). Seksyen 5 di bawah Akta ini menghendaki mana-mana pertubuhan
yang beroperasi di Malaysia untuk memberikan maklumat sebenar atau anggaran terbaik
kepada Jabatan. Mengikut Akta ini, kandungan soal selidik adalah sulit dan hanya angka
agregat diterbitkan. Sementara itu, Seksyen 7 di bawah Akta yang sama
memperuntukkan denda kepada responden yang gagal memberi kerjasama kepada
survei yang dijalankan.
8. POLISI PINDAAN
Pindaan hanya akan dibuat ke atas angka yang telah diterbitkan bagi bulan sebelumnya
sekiranya terdapat sebarang perubahan berdasarkan kepada data terkini yang diperoleh.
9. METODOLOGI
9.1. Populasi
Semua pertubuhan meliputi 179 industri (5 digit) berasaskan kod Piawaian Klasifikasi
Industri Malaysia 2008 Ver 1.0.
9.2. Rangka pensampelan
Berdasarkan populasi yang telah dikenal pasti, pertubuhan yang beroperasi seperti pada
Disember 2018 disenaraikan sebagai rangka pensampelan.

44
9.3. Reka bentuk pensampelan
Reka bentuk pensampelan bagi survei ini adalah pensampelan rawak strata satu peringkat.
Kategori industri di peringkat nasional telah diklasifikasikan sebagai strata manakala
pertubuhan sebagai unit pensampelan.
Setiap strata (industri) telah dibentuk kepada empat substrata untuk memastikan sampel
yang diagihkan mengambil kira ciri-ciri ekonomi industri tersebut. Substrata utama bersifat
heterogen diliputi secara liputan penuh. Manakala, sub strata selainnya bersifat homogen,
disampelkan.
Substrata utama meliputi pertubuhan kategori besar yang mempunyai hasil yang signifikan
dalam industri liputan manakala bagi substrata kedua hingga keempat dibentuk berdasarkan
Kaedah Cumulative Square Root Frequency. Kaedah ini membentuk sempadan bagi setiap
substrata.
9.4. Saiz sampel
Statistik utama yang digunakan untuk penganggaran saiz sampel adalah jumlah hasil.
Formula yang digunakan dalam penganggaran saiz sampel bagi strata adalah seperti berikut:
di mana;
= Saiz sampel
= Saiz populasi bagi strata i
= Varian bagi strata i
= Varian sasaran
di mana;
= Jumlah nilai hasil bagi strata i
= Ralat piawai relatif
= Nilai aras keyakinan
n
iN
2
iS
V
2
2ˆ
Z
YRSEV i
iY
RSE
Z
45
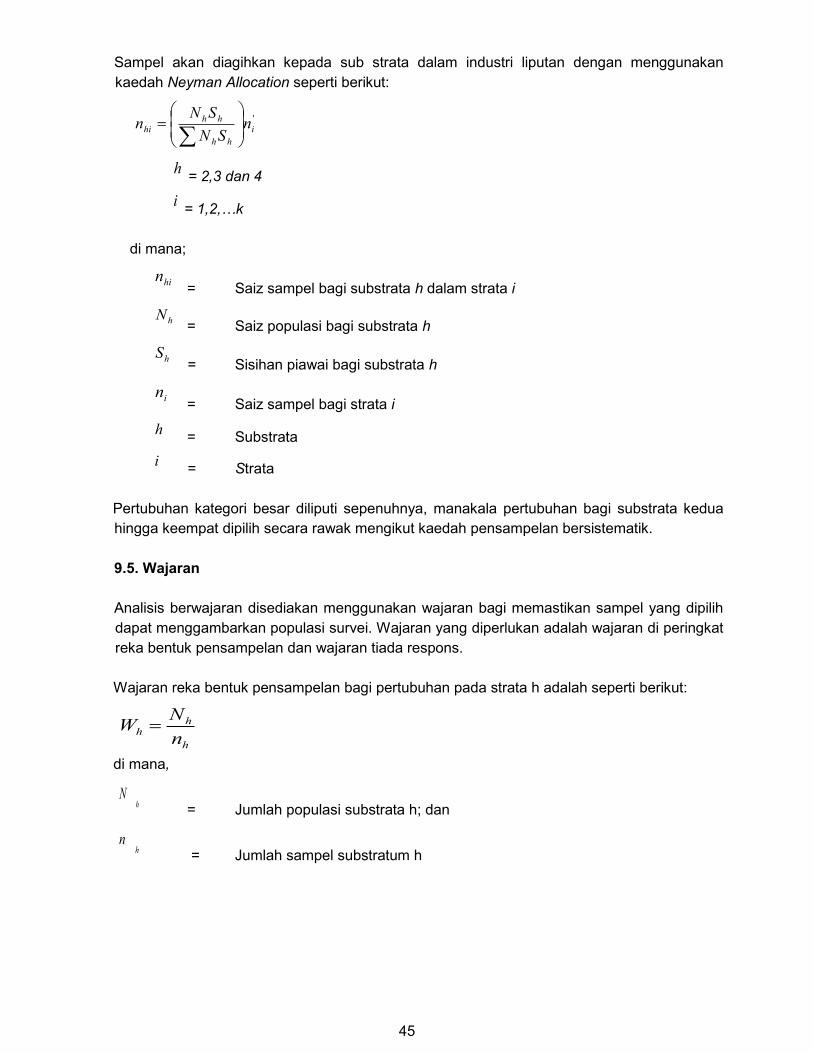
Sampel akan diagihkan kepada sub strata dalam industri liputan dengan menggunakan
kaedah Neyman Allocation seperti berikut:
= 2,3 dan 4
= 1,2,…k
di mana;
= Saiz sampel bagi substrata h dalam strata i
= Saiz populasi bagi substrata h
= Sisihan piawai bagi substrata h
= Saiz sampel bagi strata i
= Substrata
= Strata
Pertubuhan kategori besar diliputi sepenuhnya, manakala pertubuhan bagi substrata kedua
hingga keempat dipilih secara rawak mengikut kaedah pensampelan bersistematik.
9.5. Wajaran
Analisis berwajaran disediakan menggunakan wajaran bagi memastikan sampel yang dipilih
dapat menggambarkan populasi survei. Wajaran yang diperlukan adalah wajaran di peringkat
reka bentuk pensampelan dan wajaran tiada respons.
Wajaran reka bentuk pensampelan bagi pertubuhan pada strata h adalah seperti berikut:
di mana,
= Jumlah populasi substrata h; dan
= Jumlah sampel substratum h
'
i
hh
hhhi n
SN
SNn
h
i
hin
hN
hS
in
h
i
h
hh
n
NW
hN
hn
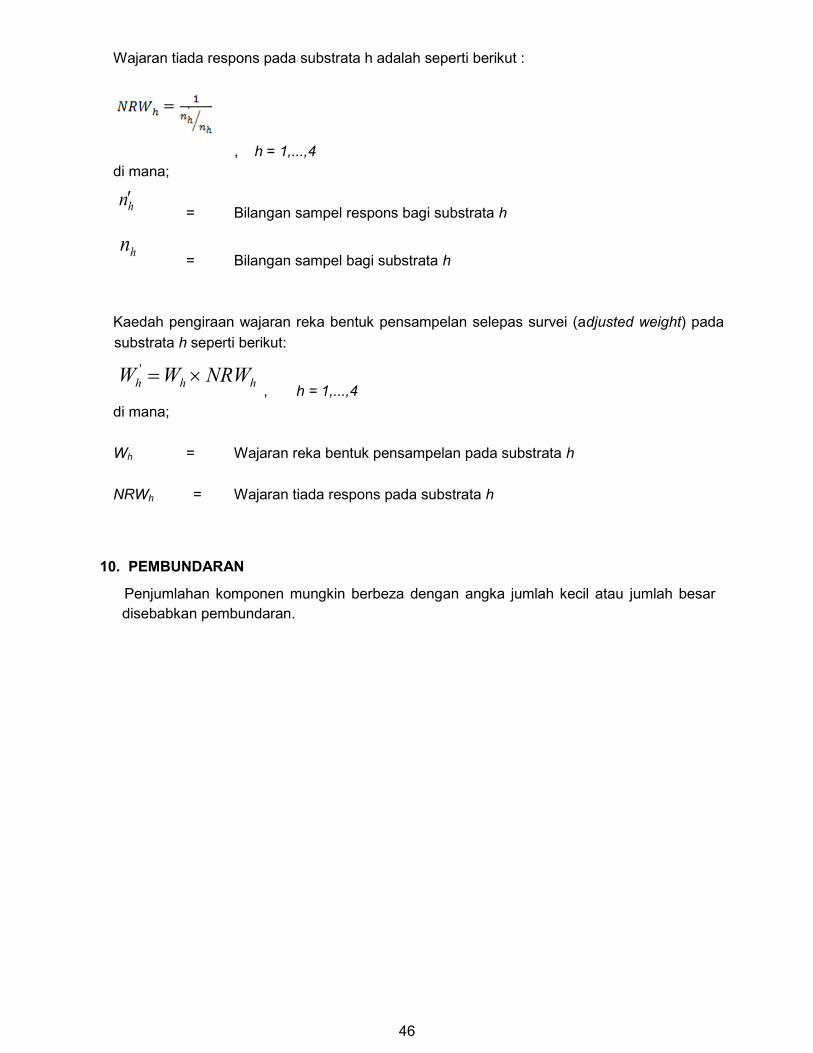
46
Wajaran tiada respons pada substrata h adalah seperti berikut :
, h = 1,...,4
di mana;
= Bilangan sampel respons bagi substrata h
= Bilangan sampel bagi substrata h
Kaedah pengiraan wajaran reka bentuk pensampelan selepas survei (adjusted weight) pada
substrata h seperti berikut:
, h = 1,...,4
di mana;
Wh = Wajaran reka bentuk pensampelan pada substrata h
NRWh = Wajaran tiada respons pada substrata h
hn
hn
hhh NRWWW '
10. PEMBUNDARAN
Penjumlahan komponen mungkin berbeza dengan angka jumlah kecil atau jumlah besar
disebabkan pembundaran.
47
1. INTRODUCTION
The data for this publication was collected through the Monthly Survey of Distributive Trade
which comprise of the Wholesale & Retail Trade sector started in the January 2014;
However, for this publication, the data presented commenced from 2018
2. OBJECTIVES
This publication presents information on sales value in Wholesale & Retail Trade sector.
The main objectives of this survey are to:
Provide short term indicators of Wholesale & Retail Trade sector;
Provide input towards the compilation of Monthly Index of Wholesale & Retail Trade
sector;
Provide information for the compilation of Quarterly Gross Domestic Product; and
Assist the government and other organisation as well as business community in planning
and decision making.
4. CONCEPTS AND DEFINITIONS
The classification of the industry is based on the Malaysia Standard Industrial Classification
2008 Ver. 1.0. The classification conforms to the International Standard Industrial
Classification of All Economic Activities, Revision 4, United Nations Statistics Division.
Meanwhile, the concepts of wholesale and retail trade adopted in this publication is based
on recommendation in the Manual of International Recommendations for Distributive Trade
Statistics 2008 (IRDTS 2008) published by the United Nations Statistics Division. The
definition of industries are as follows:
3. SCOPE AND COVERAGE
The surveys cover all registered establishments of the relevant regulatory bodies engaged
in the Wholesale & Retail Trade.
TECHNICAL NOTES
48
4.1 Wholesale and Retail Trade
4.1.1 Wholesale Trade
Refers to the resale (sale without transformation) of new and used goods to
retailers; industrial, commercial, institutional or professional users; or to
other wholesalers; or selling merchandise to, such persons or companies.
Wholesalers frequently physically assemble, sort and grade goods in large lots;
break bulk, repack and bottle (except in air-tight containers) and redistribute in
smaller lots; store, refrigerate, deliver and install goods as well as engage in
sales promotion for customers and label design.
4.1.2 Retail Trade
Refers to the resale (sale without transformation) of new and used goods to the
general public for personal or household consumption or utilisation.
4.1.3 Motor Vehicles
Refers to wholesale and retail sale of motor vehicles and motorcycles, either
new or used, sale of motor vehicle parts and accessories, maintenance and
repair of motor vehicles and motorcycles including washing, polishing as well as
commission agents.
4.2 Index Volume of Wholesale and Retail Trade
4.2.1 Type of Volume Index
The Volume Index of Wholesale & Retail Trade measured in the reference peri-
od as compared to the base period, (2015=100).
5. REPORTING UNIT
The reporting unit is an establishment. An establishment is defined as “an economic unit
that engaged in one activity, under a single legal entity and operating in a single physical
location”. Each establishment was assigned an industry classification based on its principal
activity and not by its parent company.
49
6. SALES VALUE
This definition is an applicable to Wholesale and Retail Trade.
Sales value refer to:
(a) the value of all goods, for which ownership or effective right to use with a view to
ultimate purchase, has been transferred to others; and
(b) the value of services rendered during the inquiry period, irrespective of time or method
of payment.
The sales value in this survey refers to the total sum paid by the customers. It includes:
(a) sales price;
(b) financing, delivery and installation charges, if these services are rendered by the
establishment enumerated.
7. CONFIDENTIALITY REQUIREMENTS
The information is gathered under the provisions of the Statistics Act 1965 (Revised 1989).
Section 5 of this Act requires all establishments services operating in Malaysia to provide
actual information or best estimates to the Department. The Act stipulates that the content
of individual returns are confidential and only aggregated figures are published.
Meanwhile, Section 7 under the same Act provides the penalty to the respondents that
could not comply with the surveys undertaken.
8. REVISIONS POLICY
Revisions will only be made to the published figures for the previous month if there are any
changes based on the latest available data.
9. METHODOLOGY
9.1. Population
All establishments encompass of 179 industries (5 digits) based on Malaysia Standard
Industrial Classification 2008 Ver 1.0.
9.2. Sampling frame
From the identified population, establishments that are still operating as at December 2018
were listed as sampling frame.
50
9.3. Sampling design
Sampling design of the survey is a one-stage stratified random sampling. Industries at
national level have been classified as stratum and the establishment as the sampling unit.
Each stratum (industry) has been set up into four sub stratum to ensure the sample is
distributed taking into account the economy characteristics of the industry. The main
substratum is heterogeneous, was fully covered while other sub stratum that is homogeneous
were sampled.
Main substratum comprise large establishments that have significant total revenue in the
industry while for the second to fourth substratum were formed based on Cumulative
Frequency Square Root Method. This method forms the boundaries, for each substratum.
9.4. Sample size
The main statistics used to estimate the sample size is the total revenue. The formula used in
the estimation of the sample size for a stratum is as follows:
where;
= Sample size
= Population size for stratum i
= Variance for stratum i
= Desired variance
where;
= Estimated total revenue for stratum i
= Relative standard error
= Value of confidence level
2
2
ii
ii
SNV
SNn
n
iN
2
iS
V
2
2ˆ
Z
YRSEV i
iY
RSE
Z

51
Sample is distributed to substratum of the industry using Neyman Allocation Method as
follows:
= 2,3 and 4
= 1,2,…k
where;
= Sample size for substratum h of stratum i
= Population size for substratum h
= Standard deviation for substratum h
= Sample size for stratum i
= Substratum
= Stratum
Establishments of the large categories were fully covered while establishments of the
second to fourth substratum were randomly selected using systematic random sampling.
9.5. Weight
Weighted analysis is done using sampling weight to ensure that the selected sample can
reflect population survey. The weights required are the sampling design weight and
non-response weight.
The sampling design weight for the establishment at stratum h is as follows:
where,
= Total population of substratum h; and
= Total sample of substratum h
'
i
hh
hhhi n
SN
SNn
h
i
hin
hN
hS
jn
h
j
h
hh
n
NW
hN
hn

52
Weight for non response at sub stratum h as below:
, h = 1,...,4
where;
= Number of response sampel for substratum h; and
= Number of sampel for substratum h
The method of calculating the sampling design weight after the survey (adjusted weight) on
substratum has below:
, h =1, ..., 4
where,
= Sampling design weight at substratum h
= Non response weight at substratum h
hn
hn
hhh NRWWW '
hW
hNRW
10. ROUNDING
The sum of the component figures may not tally with the sub-total or total figures due to
rounding.
LAMPIRAN
APPENDIX

Muka surat ini sengaja dibiarkan kosong.
This page is deliberately left blank.

55
Perdagangan Borong Wholesale Trade
BAHAGIAN DIVISION
KUMPULAN GROUP
PERKARA ITEM
KETERANGAN DESCRIPTION
46 461 Jual borong berdasarkan kontrak atau yuran Wholesale on a fee or contract basis
46100 Jual borong berdasarkan kontrak atau yuran Wholesale on a fee or contract basis
462 Jual borong bahan mentah pertanian dan haiwan hidup Wholesale of agricultural raw materials and live animals
46201 Jualan borong getah Wholesale of rubber
46202 Jualan borong minyak kelapa sawit Wholesale of palm oil
46203 Jualan borong kayu balak dan kayu kayan Wholesale of lumber and timber
46204 Jualan borong bunga-bungaan dan tumbuh-tumbuhan Wholesale of flowers and plants
46205 Jualan borong ternakan Wholesale of livestock
46209 Jualan borong bahan mentah pertanian dan haiwan hidup t.t.t.l Wholesale of agricultural raw material and live animals n.e.c
463 Jualan borong makanan, minuman dan tembakau Wholesale of food, beverages and tobacco
46311 Jualan borong daging, unggas dan telur Wholesale of meat, poultry and eggs
46312 Jualan borong ikan dan lain-lain makanan laut Wholesale of fish and other seafood
46313 Jualan borong buah-buahan Wholesale of fruits
46314 Jualan borong sayur-sayuran Wholesale of vegetables
46319 Jualan borong daging, ikan, buah-buahan dan sayur-sayuran t.t.t.l Wholesale of meat, fish, fruits and vegetables n.e.c
46321 Jualan borong beras, bijirin lain, tepung dan gula Wholesale of rice, other grains, flour and sugars
46322 Jualan borong hasil tenusu Wholesale of dairy products
46323 Jualan borong konfeksi Wholesale of confectionary
46324 Jualan borong biskut, kek, roti dan produk bakeri lain Wholesale of biscuits, cakes, breads and other bakery products
46325 Jualan borong kopi, teh dan minuman lain Wholesale of coffee, tea, cocoa and other beverages
LAMPIRAN / APPENDIX
Piawaian Klasifikasi Industri Malaysia 2008 Ver. 1.0 / Malaysia Standard Industrial Classification 2008 Ver.1.0

56
Perdagangan Borong
Wholesale Trade
BAHAGIAN KUMPULAN PERKARA KETERANGAN
DIVISION GROUP ITEM DESCRIPTION
46326 Jualan borong bir, wain dan spirit
Wholesale of beer, wine and spirits
46327 Jualan borong tembakau, cerut, rokok
Wholesale of tobacco, cigar, cigarettes
46329 Jualan borong bahan makanan lain
Wholesale of other foodstuffs
464 Jualan borong barangan isi rumah
Wholesale of household goods
46411 Jualan borong benang dan fabrik
Wholesale of yarn and fabrics
46412 Jualan borong linen, tuala dan selimut isi rumah
Wholesale of household linen, towels, blankets
46413 Jualan borong pakaian
Wholesale of clothing
46414 Jualan borong aksesori pakaian
Wholesale of clothing accessories
46415 Jualan borong pakaian daripada bulu binatang
Wholesale of fur articles
46416 Jualan borong kasut
Wholesale of footwear
46417 Jualan borong bahan jahitan
Wholesale of haberdashery
46419 Jualan borong tekstil, pakaian, t.t.t.l
Wholesale of textiles, clothing n.e.c
46421 Jualan borong barangan farmaseutikal dan perubatan
Wholesale of pharmaceutical and medical goods
46422 Jualan borong pewangi, kosmetik, sabun dan kelengkapan dandanan diri
Wholesale of perfumeries, cosmetics, soap and toiletries
46431 Jualan borong basikal dan komponen (termasuk alat ganti) dan aksesori
Wholesale of bicycles and their parts and accessories
46432 Jualan borong barangan fotografi dan optic
Wholesale of photographic and optical goods
46433 Jualan borong barangan kulit dan aksesori kembara
Wholesale of leather goods and travel accessories
46434
Jualan borong peralatan muzik, permainan dan barang mainan, barangan sukan
Wholesale of musical instruments, games and toys, sports goods
46441 Jualan borong kraftangan dan bunga tiruan
Wholesale of handicrafts and artificial flowers
46442 Jualan borong bunga keratan dan tumbuhan
Wholesale of cut flowers and plants
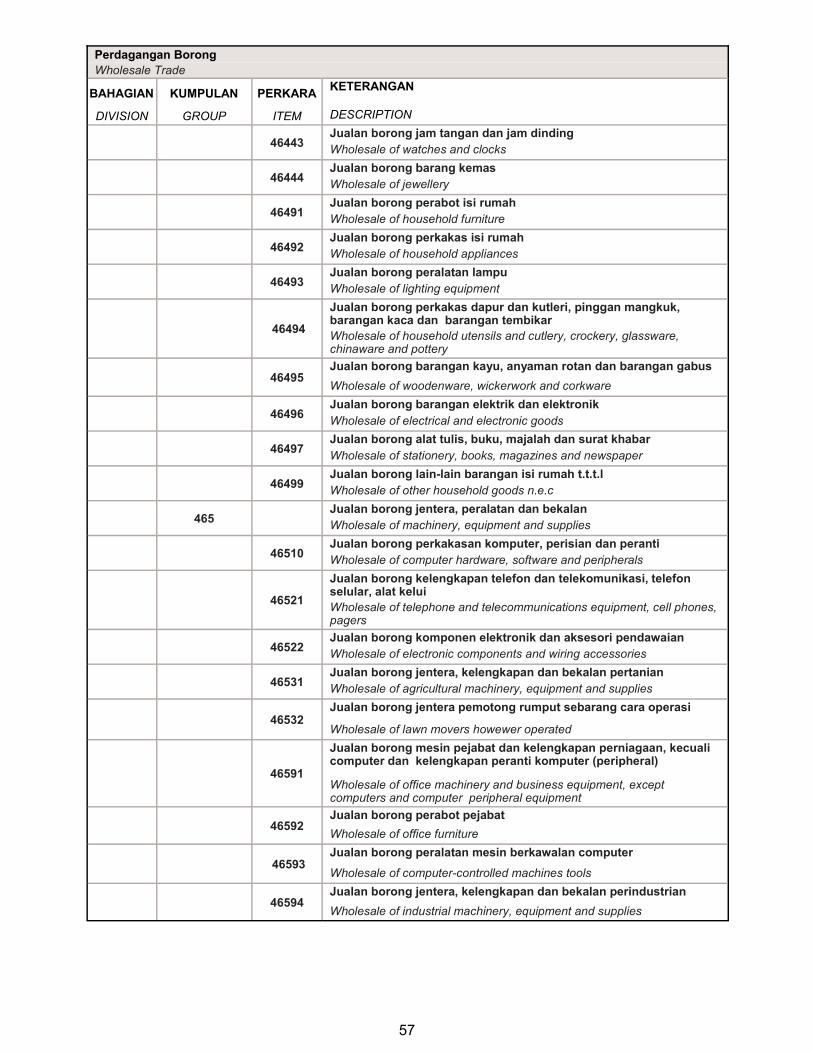
57
Perdagangan Borong
Wholesale Trade
BAHAGIAN KUMPULAN PERKARA KETERANGAN
DIVISION GROUP ITEM DESCRIPTION
46443 Jualan borong jam tangan dan jam dinding
Wholesale of watches and clocks
46444 Jualan borong barang kemas
Wholesale of jewellery
46491 Jualan borong perabot isi rumah
Wholesale of household furniture
46492 Jualan borong perkakas isi rumah
Wholesale of household appliances
46493 Jualan borong peralatan lampu
Wholesale of lighting equipment
46494
Jualan borong perkakas dapur dan kutleri, pinggan mangkuk, barangan kaca dan barangan tembikar
Wholesale of household utensils and cutlery, crockery, glassware, chinaware and pottery
46495 Jualan borong barangan kayu, anyaman rotan dan barangan gabus
Wholesale of woodenware, wickerwork and corkware
46496 Jualan borong barangan elektrik dan elektronik
Wholesale of electrical and electronic goods
46497 Jualan borong alat tulis, buku, majalah dan surat khabar
Wholesale of stationery, books, magazines and newspaper
46499 Jualan borong lain-lain barangan isi rumah t.t.t.l
Wholesale of other household goods n.e.c
465 Jualan borong jentera, peralatan dan bekalan
Wholesale of machinery, equipment and supplies
46510 Jualan borong perkakasan komputer, perisian dan peranti
Wholesale of computer hardware, software and peripherals
46521
Jualan borong kelengkapan telefon dan telekomunikasi, telefon selular, alat kelui
Wholesale of telephone and telecommunications equipment, cell phones, pagers
46522 Jualan borong komponen elektronik dan aksesori pendawaian
Wholesale of electronic components and wiring accessories
46531 Jualan borong jentera, kelengkapan dan bekalan pertanian
Wholesale of agricultural machinery, equipment and supplies
46532 Jualan borong jentera pemotong rumput sebarang cara operasi
Wholesale of lawn movers howewer operated
46591
Jualan borong mesin pejabat dan kelengkapan perniagaan, kecuali computer dan kelengkapan peranti komputer (peripheral)
Wholesale of office machinery and business equipment, except computers and computer peripheral equipment
46592 Jualan borong perabot pejabat
Wholesale of office furniture
46593 Jualan borong peralatan mesin berkawalan computer
Wholesale of computer-controlled machines tools
46594 Jualan borong jentera, kelengkapan dan bekalan perindustrian
Wholesale of industrial machinery, equipment and supplies

58
Perdagangan Borong
Wholesale Trade
BAHAGIAN KUMPULAN PERKARA KETERANGAN
DIVISION GROUP ITEM DESCRIPTION
46595
Jualan borong jentera dan kelengkapan pembinaan dan kejuruteraan awam
Wholesale of construction and civil engineering machinery and equipment
46596
Jualan borong lif, eskalator, penghawa dingin, kelengkapan keselamatan dan pemadam api
Wholesale of lift escalators, air-conditioning, security and fire fighting
46599
Jualan borong lain-lain jentera untuk kegunaan industri, perdagangan dan pengemudian dan lain-lain perkhidmatan t.t.t.l
Wholesale of other machinery for use in industry, trade and navigation and other services n.e.c
466 Lain-lain pengkhususan jualan borong
Other specialised wholesale
46611 Jualan borong petrol, diesel, pelincir
Wholesale of petrol, diesel, lubricants
46612 Jualan borong gas petroleum cecair
Wholesale of liquefied petroleum gas
46619
Jualan borong bahan api pepejal, cecair dan gas dan produk berkaitan t.t.t.l
Wholesale of other solid, liquid and gaseous fuels and related products n.e.c
46621 Jualan borong bijih besi dan bukan besi dan logam
Wholesale of ferrous and non-ferrous metal ores and metals
46622
Jualan borong bijih besi dan bukan besi dan logam separuh siap dan produk t.t.t.l
Wholesale of ferrous and non-ferrous semi-finished metal ores and products n.e.c
46631
Jualan borong kayu balak, kayu bergergaji, papan lapis, venier dan produk berkaitan
Wholesale of logs, sawn timber, plywood, veneer and related products
46632 Jualan borong cat dan varnish
Wholesale of paints and varnish
46633 Jualan borong bahan pembinaan
Wholesale of construction materials
46634 Jualan borong kelengkapan dan lekapan
Wholesale of fittings and fixtures
46635 Jualan borong pemanas air
Wholesale of hot water heaters
46636 Jualan borong pemasangan dan peralatan kebersihan
Wholesale of sanitary installation and equipment
46637 Jualan borong alatan
Wholesale of tools
46639
Jualan borong dan bekalan lain-lain bahan binaan, hardwer, peralatan paip dan alat pemanas t.t.t.l
Wholesale of other construction materials, hardware, plumbing and heating equipment and supplies n.e.c
46691 Jualan borong bahan kimia industry
Wholesale of industrial chemicals
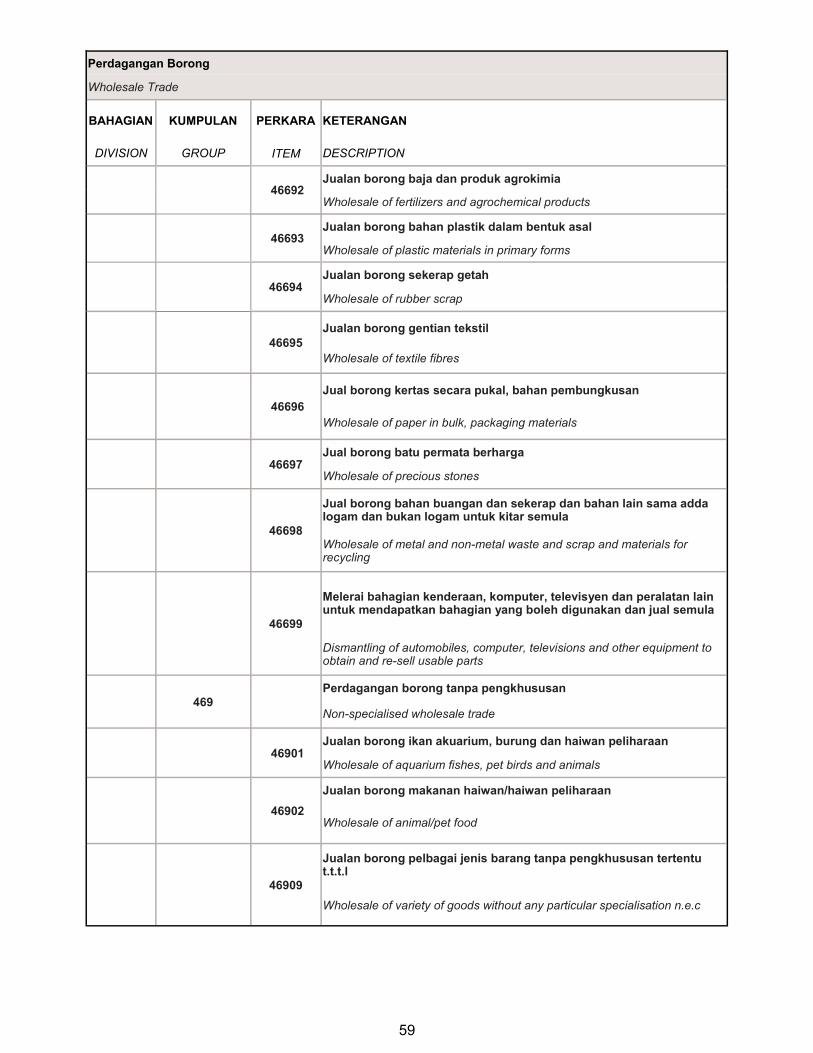
59
Perdagangan Borong
Wholesale Trade
BAHAGIAN KUMPULAN PERKARA KETERANGAN
DIVISION GROUP ITEM DESCRIPTION
46692 Jualan borong baja dan produk agrokimia
Wholesale of fertilizers and agrochemical products
46693 Jualan borong bahan plastik dalam bentuk asal
Wholesale of plastic materials in primary forms
46694 Jualan borong sekerap getah
Wholesale of rubber scrap
46695
Jualan borong gentian tekstil
Wholesale of textile fibres
46696
Jual borong kertas secara pukal, bahan pembungkusan
Wholesale of paper in bulk, packaging materials
46697 Jual borong batu permata berharga
Wholesale of precious stones
46698
Jual borong bahan buangan dan sekerap dan bahan lain sama adda logam dan bukan logam untuk kitar semula
Wholesale of metal and non-metal waste and scrap and materials for recycling
46699
Melerai bahagian kenderaan, komputer, televisyen dan peralatan lain untuk mendapatkan bahagian yang boleh digunakan dan jual semula
Dismantling of automobiles, computer, televisions and other equipment to obtain and re-sell usable parts
469
Perdagangan borong tanpa pengkhususan
Non-specialised wholesale trade
46901 Jualan borong ikan akuarium, burung dan haiwan peliharaan
Wholesale of aquarium fishes, pet birds and animals
46902
Jualan borong makanan haiwan/haiwan peliharaan
Wholesale of animal/pet food
46909
Jualan borong pelbagai jenis barang tanpa pengkhususan tertentu t.t.t.l
Wholesale of variety of goods without any particular specialisation n.e.c
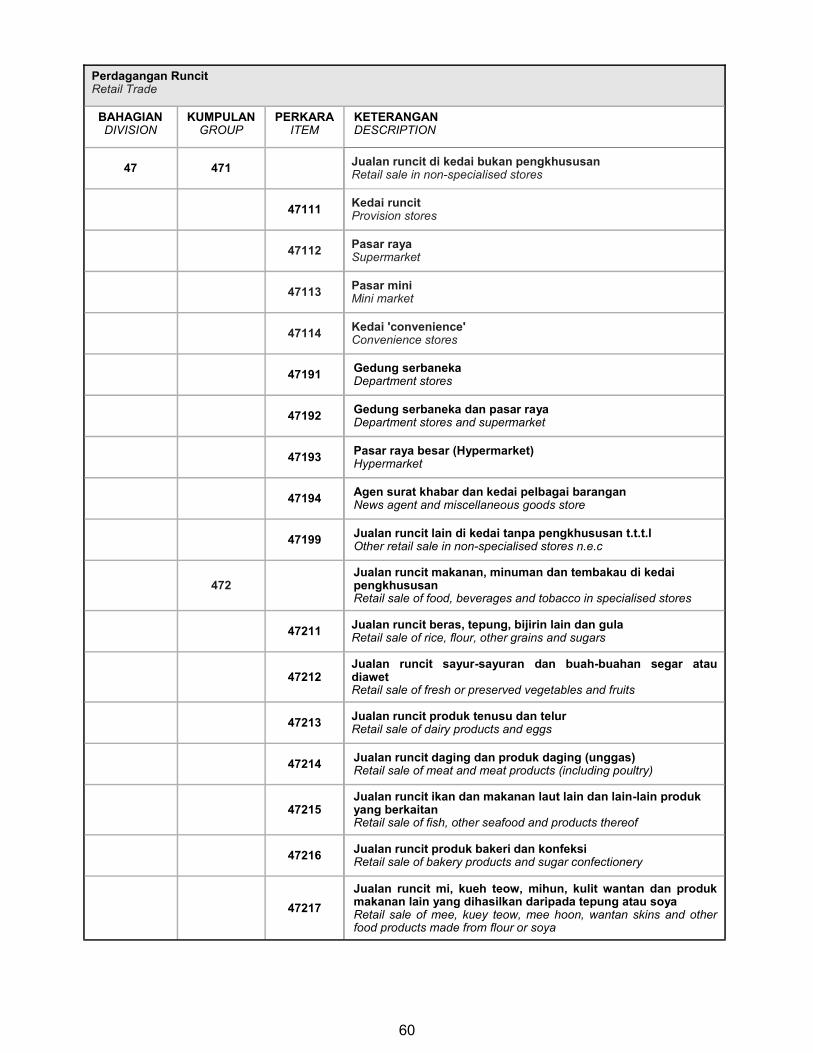
60
Perdagangan Runcit Retail Trade
BAHAGIAN DIVISION
KUMPULAN GROUP
PERKARA ITEM
KETERANGAN DESCRIPTION
47 471 Jualan runcit di kedai bukan pengkhususan Retail sale in non-specialised stores
47111 Kedai runcit Provision stores
47112 Pasar raya Supermarket
47113 Pasar mini Mini market
47114 Kedai 'convenience' Convenience stores
47191 Gedung serbaneka Department stores
47192 Gedung serbaneka dan pasar raya Department stores and supermarket
47193 Pasar raya besar (Hypermarket) Hypermarket
47194 Agen surat khabar dan kedai pelbagai barangan News agent and miscellaneous goods store
47199 Jualan runcit lain di kedai tanpa pengkhususan t.t.t.l Other retail sale in non-specialised stores n.e.c
472 Jualan runcit makanan, minuman dan tembakau di kedai pengkhususan Retail sale of food, beverages and tobacco in specialised stores
47211 Jualan runcit beras, tepung, bijirin lain dan gula Retail sale of rice, flour, other grains and sugars
47212 Jualan runcit sayur-sayuran dan buah-buahan segar atau diawet Retail sale of fresh or preserved vegetables and fruits
47213 Jualan runcit produk tenusu dan telur Retail sale of dairy products and eggs
47214 Jualan runcit daging dan produk daging (unggas) Retail sale of meat and meat products (including poultry)
47215 Jualan runcit ikan dan makanan laut lain dan lain-lain produk yang berkaitan Retail sale of fish, other seafood and products thereof
47216 Jualan runcit produk bakeri dan konfeksi Retail sale of bakery products and sugar confectionery
47217
Jualan runcit mi, kueh teow, mihun, kulit wantan dan produk makanan lain yang dihasilkan daripada tepung atau soya Retail sale of mee, kuey teow, mee hoon, wantan skins and other food products made from flour or soya

61
Perdagangan Runcit Retail Trade
BAHAGIAN DIVISION
KUMPULAN GROUP
PERKARA ITEM
KETERANGAN DESCRIPTION
47219 Jualan runcit produk makanan lain t.t.t.l Retail sale of other food products n.e.c
47221 Jualan runcit bir, wain dan spirit Retail sale of beer, wine and spirits
47222
Jualan runcit teh, kopi, minuman ringan, air mineral dan minuman lain Retail sale of tea, coffee, soft drinks, mineral water and other beverages
47230 Jualan runcit produk tembakau di kedai khusus Retail sale of tobacco products in specialised store
473
Jualan runcit di kedai khusus yang menjual bahan api kenderaan Retail sale of automotive fuel in specialised stores
47300 Jualan runcit bahan api kenderaan di kedai khusus Retail sale of automotive fuel in specialised store
474
Jualan runcit di kedai khusus yang menjual peralatan komunikasi dan maklumat Retail sale of information and communication equipment in specialised stores
47411 Jualan runcit komputer, peralatan dan kelengkapan komputer Retail sale of computers, computer equipment and supplies
47412
Jualan runcit konsol permainan video dan perisian bukan ditempah khas Retail sale of video game consoles and non-customised software
47413 Jualan runcit di peralatan telekomunikasi Retail sale of telecommunication equipment
47420
Jualan runcit peralatan audio dan video di kedai pengkhususan Retail sale of audio and video equipment in specialised store
475
Jualan runcit di kedai khusus yang menjual peralatan lain isi rumah Retail sale of other household equipment in specialised stores
47510 Jualan runcit di kedai khusus yang menjual tekstil Retail sale of textiles in specialised stores
47520 Jualan runcit bahan binaan, perkakasan, cat dan kaca Retail sale of construction materials, hardware, paints and glass
47531 Jualan runcit karpet dan hamparan Retail sale of carpets and rugs
47533 Jualan runcit kertas dinding dan alas lantai Retail sale of wallpaper and floor coverings
47591 Jualan runcit perabot isi rumah Retail sale of household furniture

62
Perdagangan Runcit Retail Trade
BAHAGIAN DIVISION
KUMPULAN GROUP
PERKARA ITEM
KETERANGAN DESCRIPTION
47592 Jualan runcit peralatan lampu Retail sale of articles for lighting
47593
Jualan runcit perkakasan isi rumah, perkakas dapur dan kutleri, pinggan mangkuk, barangan kaca dan barangan tembikar Retail sale of household utensils and cutlery, crockery, glassware, chinaware and pottery
47594 Jualan runcit kayu, barangan gabus dan barangan anyaman rotan Retail sale of wood, cork goods and wickerwork goods
47595 Jualan runcit perkakas isi rumah Retail sale of household appliances
47596 Jualan runcit peralatan muzik dan skor Retail sale of musical instruments and scores
47597 Jualan runcit sistem keselamatan Retail sale of security systems
47598 Jualan runcit barangan dan peralatan isi rumah t.t.t.l Retail sale of household articles and equipment n.e.c
476 Jualan runcit di kedai khusus yang menjual barangan kesenian dan rekreasi Retail sale of cultural and recreation goods in specialised stores
47611 Jualan runcit bekalan dan peralatan pejabat Retail sale of office supplies and equipment
47612 Jualan runcit buku, surat khabar dan alat tulis Retail sale of books, newspapers and stationary
47620
Jualan runcit rekod muzik, pita audio, cakera padat, kaset, pita video, VCD dan DVD, pita dan cakera kosong Retail sale of musical records, audio tapes, compact discs, cassettes, video tapes, VCDs and DVDs, blank tapes and discs
47631 Jualan runcit barangan dan peralatan sukan Retail sale of sports goods and equipments
47632 Jualan runcit peralatan memancing Retail sale of fishing equipment
47633 Jualan runcit barangan perkhemahan Retail sale of camping goods
47634 Jualan runcit bot dan peralatannya Retail sale of boats and equipments

63
Perdagangan Runcit Retail Trade
BAHAGIAN DIVISION
KUMPULAN GROUP
PERKARA ITEM
KETERANGAN DESCRIPTION
47635 Jualan runcit basikal dan komponen (termasuk alat ganti) dan aksesori yang berkaitan Retail sale of bicycles and related parts and accessories
47640 Jualan runcit permainan dan barang mainan, diperbuat dari pelbagai bahan Retail sale of games and toys, made of all materials
477 Jualan runcit di kedai khusus yang menjual barangan lain Retail sale of other goods in specialised stores
47711
Jualan runcit pakaian, artikel bagi bulu binatang dan aksesori pakaian Retail sale of articles of clothing, articles of fur and clothing accessories
47712 Jualan runcit kasut Retail sale of footwear
47713 Jualan runcit barangan kulit, aksesori kulit serta gantian kulit Retail sale of leather goods, accessories of leather and leather substitutes
47721
Jualan runcit di kedai khusus yang menjual barang farmaseutikal, perubatan dan ortopedik Stores specialised in retail sale of pharmaceuticals, medical and orthopaedic goods
47722
Jualan runcit di kedai khusus yang menjual pewangi, kosmetik dan kelengkapan dandanan diri Stores specialised in retail sale of perfumery, cosmetic and toilet articles
47731 Jualan runcit peralatan fotografi dan kepersisan Retail sale of photographic and precision equipment
47732 Jualan runcit jam tangan dan jam dinding Retail sale of watches and clocks
47733 Jualan runcit barang kemas Retail sale of jewellery
47734 Jualan runcit bunga, tumbuhan, biji benih dan baja Retail sale of flowers, plants, seeds, fertilizers
47735 Jualan runcit cenderahati, kraftangan dan barang keagamaan Retail sale of souvenier, craftwork and religious articles
47736 Jualan runcit minyak tanah, gas memasak, batu arang dan kayu api Retail sale of household fuel oil, cooking gas, coal and fuel wood
47737 Jualan runcit cermin mata dan barang optik lain Retail sale of spectacles and other optical goods
47738 Jualan runcit ikan akuarium, haiwan peliharaan dan makanannya Retail sale of aquarium fishes, pet animals and pet food

64
Perdagangan Runcit Retail Trade
BAHAGIAN DIVISION
KUMPULAN GROUP
PERKARA ITEM
KETERANGAN DESCRIPTION
47739 Jualan runcit di kedai khusus yang menjual barang baru lain t.t.t.l Other retail sale of new goods in specialised stores n.e.c
47741 Jualan runcit buku terpakai Retail sale of second-hand books
47742 Jualan runcit barang elektrik dan elektronik terpakai Retail sale of second-hand electrical and electronic goods
47743 Jualan runcit barang antik Retail sale of antiques
47744 Aktiviti pusat lelongan (runcit) Activities of auctioning houses (retail)
47749 Jualan runcit barangan terpakai t.t.t.l Retail sale of second-hand goods n.e.c
478 Jualan runcit di gerai dan pasar Retail sale via stalls and markets
47810
Jualan runcit makanan, minuman dan produk tembakau di gerai atau pasar Retail sale of food, beverages and tobacco products via stalls or markets
47820 Jualan runcit tekstil, baju dan kasut di gerai atau pasar Retail sale of textiles, clothing and footwear via stalls or markets
47891 Jualan runcit permaidani dan di gerai dan pasar Retail sale of carpets and rugs via stalls or markets
47892 Jualan runcit buku di gerai atau pasar Retail sale of books via stalls or markets
47893 Jualan runcit alat permainan dan barang mainan di gerai atau pasar Retail sale of games and toys via stalls or markets
47894
Jualan runcit peralatan isi rumah dan barang elektronik di gerai atau pasar Retail sale of household appliances and consumer electronics via stall or markets
47895 Jualan runcit rekod muzik dan video di gerai atau pasar Retail sale of music and video recordings via stall or markets

65
Perdagangan Runcit Retail Trade
BAHAGIAN DIVISION
KUMPULAN GROUP
PERKARA ITEM
KETERANGAN DESCRIPTION
479 Jualan runcit bukan di kedai, gerai atau pasar Retail trade not in stores, stalls or markets
47911 Jualan runcit sebarang jenis produk melalui pesanan mel Retail sale of any kind of products by mail order
47912 Jualan runcit sebarang jenis produk melalui internet Retail sale of any kind of product over the Internet
47913 Jualan langsung melalui televisyen, radio dan telefon Direct sale via television, radio and telephone
47914 Jualan runcit lelongan melalui internet Internet retail auctions
47991
Jualan runcit sebarang jenis produk melalui jualan langsung atau penjualan dari pintu ke pintu Retail sale of any kind of product by direct sales or door-to-door sales persons
47992 Jualan runcit sebarang jenis produk melalui mesin layan diri (vending machine) Retail sale of any kind of product through vending machines
47999 Jualan runcit lain bukan di kedai, gerai atau pasar t.t.t.l Other retail sale not in stores, stalls or markets n.e.c

66
Kenderaan Bermotor Motor Vehicles
BAHAGIAN DIVISION
KUMPULAN GROUP
PERKARA ITEM
KETERANGAN DESCRIPTION
45 451 Jualan kenderaan bermotor
Sale of motor vehicles
45101 Jualan borong dan runcit kenderaan bermotor baru
Wholesale and retail of new motor vehicles
45102 Jualan borong dan runcit kenderaan bermotor terpakai
Wholesale and retail of used motor vehicles
45103 Jualan kenderaan industri, komersial dan pertanian - baru
Sale of industrial, commercial and agriculture vehicles - new
45104
Jualan kenderaan industri, komersial dan pertanian - terpakai
Sale of industrial, commercial and agriculture vehicles - used
45105
Jualan oleh agen komisen
Sale of commission agents
45106 Lelongan kereta
Car auctions
45109 Jualan lain-lain kenderaan bermotor t.t.t.l
Sale of other motor vehicles n.e.c
452 Penyelenggaraan dan pembaikan kenderaan bermotor
Maintenance and repair of motor vehicles
45201 Penyelenggaraan dan pembaikan kenderaan bermotor
Maintenance and repair of motor vehicles
45202 Menyembur dan mengecat
Spraying and painting
45203 Mencuci dan mengilap (cuci kereta)
Washing and polishing (car wash)
45204 Pembaikan tempat duduk kenderaan bermotor
Repair or motor vehicle seats
45205
Pemasangan komponen (termasuk alat ganti) dan aksesori bukan sebahagian daripada proses pembuatan
Installation of parts and accessories not as part of the manufacturing process
453
Jualan komponen (termasuk alat ganti) dan aksesori kenderaan bermotor
Sale of motor vehicle parts and accessories
45300
Jualan borong dan runcit semua jenis komponen, alat ganti,
bekalan, peralatan dan aksesori kenderaan bermotor
Wholesale and retail sale of all kinds of parts, components, supplies, tools and accessories for motor vehicles

67
Kenderaan Bermotor Motor Vehicles
BAHAGIAN DIVISION
KUMPULAN GROUP
PERKARA ITEM
KETERANGAN DESCRIPTION
454
Jualan, penyelenggaraan dan pembaikan motosikal dan komponen (termasuk alat ganti) dan aksesori berkaitan
Sale maintenance and repair of motorcycles and related parts and accessories
45401
Jualan borong dan runcit motosikal
Wholesale and retail sale of motorcycles
45402
Jualan borong dan runcit komponen (termasuk alat ganti) dan aksesori motosikal
Wholesale and retail sale of parts and accessories for motorcycles
45403 Pembaikan dan penyelenggaraan motosikal
Repair and maintenance of motorcycles
Muka surat ini sengaja dibiarkan kosong.
This page is deliberately left blank.

GLOSARI
GLOSARRY

Muka surat ini sengaja dibiarkan kosong.
This page is deliberately left blank.

71
Jualan Borong Berdasarkan Yuran atau
Kontrak
Termasuk agen komisyen, broker komoditi dan
semua pemborong lain yang berdagang bagi
pihak dan dengan akaun orang lain, mereka
yang menemukan penjual dan pembeli atau
menjalankan transaksi komersil bagi pihak
majikan. Termasuk juga aktiviti jual borong
pusat lelongan.
Lain-lain Pengkhususan Jual Borong
Kumpulan ini termasuk aktiviti jual borong
pengkhususan lain yang tidak terkelas dalam
kumpulan lain. Ini juga termasuk jual borong
produk perantara, kecuali pertanian, biasanya
bukan untuk kegunaan isi rumah.
Jual Borong Tanpa Pengkhususan
Kumpulan ini termasuk jual borong pelbagai
barangan tanpa sebarang pengkhususan
tertentu.
Jualan Runcit di Stor Tanpa Pengkhususan
Kumpulan ini termasuk jualan runcit pelbagai
keluaran produk dalam unit yang sama, seperti
kedai runcit, pasar raya, pasar mini, kedai
convenience, gedung serbaneka dan pasar
raya besar.
Indeks Volum Nilai Jualan
Indeks volum bagi nilai jualan mengukur jualan
dalam satu tempoh masa dalam bentuk volum
(kuantiti yang dijual). Bagi mendapatkan volum
nilai jualan, indeks nilai bagi jualan
dibahagikan dengan Indeks Harga Pengguna
dan Indeks Harga Pengeluar (yang mana
berkenaan) untuk menyingkirkan pengaruh
harga kepada nilai jualan.
Kadar Pertumbuhan Tahun-ke-Tahun (YoY)
Kadar pertumbuhan tahun-ke-tahun
membandingkan satu tempoh (kebiasaannya
satu bulan atau suku tahun) dengan tempoh
sama tahun sebelumnya dengan mengukur
peratus perubahan.
Wholesale on a fee or contract basis
Includes activities of commission agents,
commodity brokers and all other wholesalers
who trade on behalf and on the account of
others, activities or those involved in bringing
sellers and buyers together or undertaking
commercfial transactions on behalf of a
principal. Also included are activities of
wholesale auctioneering houses.
Other Specialised Wholesale
This group includes other specialized
wholesale activities not classified in the other
groups.This also includes wholesale of
intermediate products, except agriculture,
typically not for household use.
Non-Specialized Wholesale
This group includes the wholesale of a variety
of goods without any particular specialization.
Retail Sales in Non-Specialised stores
This group includes the retail sale of a variety
of product lines in the same unit, such as
provision stores, supermarkets, mini markets,
convenience stores, department stores and
hypermarkets.
Volume Index of Sales
The volume of sales index measures the sales
over time in volume terms (quantity sold). In
order to determine the volume of sales index,
the value of sales index is divided by the
Consumer Price Index and Producer Price
Index (where applicable) to allow removing
price effects on turnover.
Year-on-Year Growth Rate (YoY)
Year-on-year growth rate compares a period
(typically a month or quarter) with the same
period from the previous year, measuring the
percentage change.
GLOSARI / GLOSSARY

72
Kadar Pertumbuhan Bulan-ke-Bulan (MoM)
Kadar pertumbuhan bulan-ke-bulan
membandingkan satu bulan dengan bulan
sebelumnya dengan mengukur peratus
perubahan.
Pelarasan Musim
Pelarasan musim adalah satu proses untuk
mengenalpasti dan menyingkirkan pola musim
yang biasa berlaku dalam tempoh tertentu,
yang mungkin juga merangkumi pengaruh dari
kesan cuti yang bergerak dan hari bekerja/
berdagang.
Month-on-Month Growth Rate (MoM)
Month-on-month growth rate compares one
month with the previous month, measuring the
percentage change.
Seasonal Adjustment
Seasonal adjustment is a process to identify
and to remove seasonal pattern within a
period, which may also include the influences
of moving holidays and working/ trading days
effect in each period.
Pengarah, Jabatan Perangkaan Malaysia Negeri Johor, Tingkat 14, Menara Tabung Haji, Jalan Air Molek, 80000 Johor Bahru, Johor. Tel : 07 - 225 3700 Faks : 07 - 224 9972 E-mel : [email protected] Pengarah, Jabatan Perangkaan Malaysia Negeri Kedah, Aras 1, Zon C, Wisma Persekutuan, Pusat Pentadbiran Kerajaan Persekutuan, Bandar Muadzam Shah, 06550 Anak Bukit, Alor Setar, Kedah Tel : 04 - 700 1240 Faks : 04 - 733 8412 E-mel : [email protected] Pengarah, Jabatan Perangkaan Malaysia Negeri Kelantan, Tingkat 8, Bangunan Persekutuan, Jalan Bayam, 15514 Kota Bharu, Kelantan. Tel : 09 - 7419449 Faks : 09 - 7482142 E-mel : [email protected] Pengarah, Jabatan Perangkaan Malaysia Negeri Melaka, Aras 7 & 8, Wisma Persekutuan, Jalan MITC, Hang Tuah Jaya, 75450 Ayer Keroh, Melaka. Tel : 06 - 252 2725 Faks : 06 - 252 2711 E-mel : [email protected] Pengarah, Jabatan Perangkaan Malaysia Negeri Sembilan, Tingkat 12, Wisma Persekutuan, Jalan Dato’ Abdul Kadir, 70000 Seremban, Negeri Sembilan. Tel : 06 - 765 5000 Faks : 06 - 765 5002 E-mel : [email protected] Pengarah, Jabatan Perangkaan Malaysia Negeri Pahang, Tingkat 7, Bangunan Persekutuan, Jalan Gambut, 25000 Kuantan, Pahang. Tel : 09 - 516 3931/7 Faks : 09 - 514 4636 E-mel : [email protected] Pengarah,
Jabatan Perangkaan Malaysia Negeri Pulau Pinang,
Tingkat 6, Bangunan Persekutuan, 10400, Jalan Anson, Pulau Pinang. Tel : 04 - 226 6244 Faks : 04 - 229 9499 E-mel : [email protected]
Pengarah, Jabatan Perangkaan Malaysia Negeri Perak, Tingkat 3, Blok A, Bangunan Persekutuan Ipoh, Jalan Dato’ Seri Ahmad Said (Greentown) 30450 Ipoh, Perak Tel : 05 - 255 4963 Faks : 05 - 255 1073 E-mel : [email protected] Pengarah, Jabatan Perangkaan Malaysia Negeri Perlis, Tingkat 1, Bangunan Perodua Kangar, No. 2, Persiaran Jubli Perak, 01000 Kangar, Perlis Tel : 04 - 976 7381 Faks : 04 - 976 8950 E-mel : [email protected] Pengarah, Jabatan Perangkaan Malaysia Negeri Selangor, Tingkat 9, Bangunan Darul Ehsan, Jalan Indah, Seksyen 14, 40000 Shah Alam, Selangor Tel : 03 - 5515 0200 Faks : 03 - 5518 0408 E-mel : [email protected] Pengarah, Jabatan Perangkaan Malaysia Negeri Terengganu, Tingkat 9, Wisma Persekutuan, Jalan Sultan Ismail, 20200 Kuala Terengganu, Terengganu. Tel : 09 - 622 3062 Faks : 09 - 622 9659 E-mel : [email protected] Pengarah, Jabatan Perangkaan Malaysia Negeri Sabah, Tingkat 1-3, Blok C, Kompleks Pentadbiran Kerajaan Persekutuan Sabah, Jalan UMS, Beg Berkunci No. 2046, 88999 Kota Kinabalu, Sabah. Tel : 088 - 484 602 Faks : 088 - 484 659 E-mel : [email protected] Pengarah, Jabatan Perangkaan Malaysia Negeri Sarawak, Tingkat 7 & 8, Bangunan Tun Datuk Patinggi Tuanku Haji Bujang, Jalan Simpang Tiga, 93514 Kuching, Sarawak. Tel : 082 - 240 287 Faks : 082 - 242 609 E-mel : [email protected] Pengarah, Jabatan Perangkaan Malaysia Wilayah Persekutuan, Tingkat 14 & 15, Wisma FGV, Jalan Raja Laut, 50350 Kuala Lumpur. Tel : 03 - 2267 2400 Faks : 03 - 2274 5075 E-mel : [email protected]
PENERBITAN INI BOLEH JUGA DIPEROLEH DI JABATAN PERANGKAAN NEGERI SEPERTI BERIKUT: THIS PUBLICATION IS ALSO AVAILABLE AT THE FOLLOWING STATES DEPARTMENT OF STATISTICS:

74
Related Documents