INDONESIA ECONOMIC QUARTERLY MARCH 2013 Jim Brumby, PREM Sector Manager & Lead Economist Paramadina Public Policy Institute, March 2013 PRESSURES MOUNTING www.worldbank.org/id

Welcome message from author
This document is posted to help you gain knowledge. Please leave a comment to let me know what you think about it! Share it to your friends and learn new things together.
Transcript
INDONESIA ECONOMIC QUARTERLY MARCH 2013
Jim Brumby, PREM Sector Manager & Lead EconomistParamadina Public Policy Institute, March 2013
PRESSURES MOUNTING
www.worldbank.org/id

MARCH 2013 IEQ LAUNCH PRESENTATION
Steady recent economic growth, but pressures mounting
Strong performance can continue but will require policy progress in key areas
More evidence on the need and scope for progress in these areas

INDONESIA’S ECONOMY CONTINUES TO PERFORM WELL
0
3
6
9
12
15
0
3
6
9
12
15
Dec-2009 Dec-2010 Dec-2011 Dec-2012
Percent Percent
China
IndiaIndonesia
MalaysiaMajor Trading Partners
USA
Source: CEIC; World Bank Global Economic Prospects, January 2013, and East Asia Update, December 2012
Real GDP growth, year-on-year
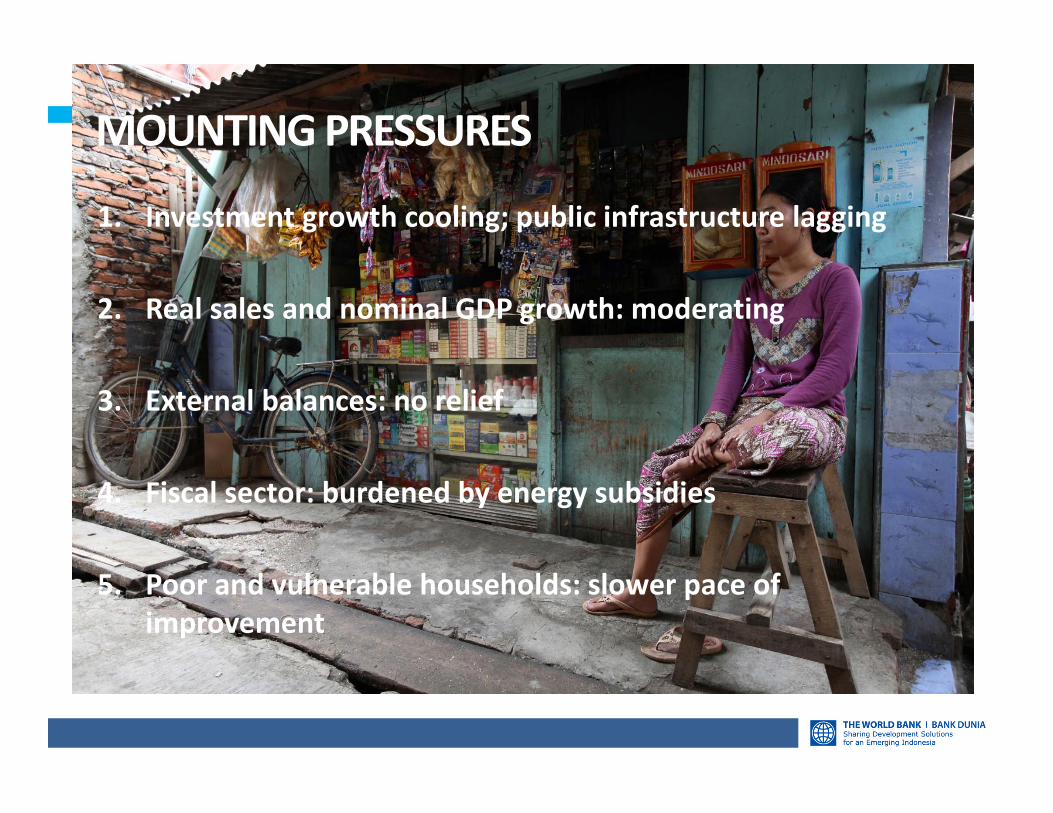
MOUNTING PRESSURES
1. Investment growth cooling; public infrastructure lagging
2. Real sales and nominal GDP growth: moderating
3. External balances: no relief
4. Fiscal sector: burdened by energy subsidies
5. Poor and vulnerable households: slower pace of improvement

INVESTMENT GROWTH: MODERATING
Source: CEIC; World Bank staff calculations
Year-on-year growth
0
2
4
6
8
10
12
14
-40
-20
0
20
40
60
80
Mar-09 Dec-09 Oct-10 Jul-11 Apr-12 Jan-13
Percent Percent
Capital goods imports (3-month moving average)
Real fixed investment

EXTERNAL BALANCES: STILL UNDER PRESSURE, RECENTLY DUE ESPECIALLY TO OIL & GAS TRADE DEFICIT
Source: CEIC; World Bank staff calculations
-2
-1
0
1
2
3
4
Jan-09 Jan-10 Jan-11 Jan-12 Jan-13
Non-oil and gas balance Oil and gas balance
USD billion USD billion
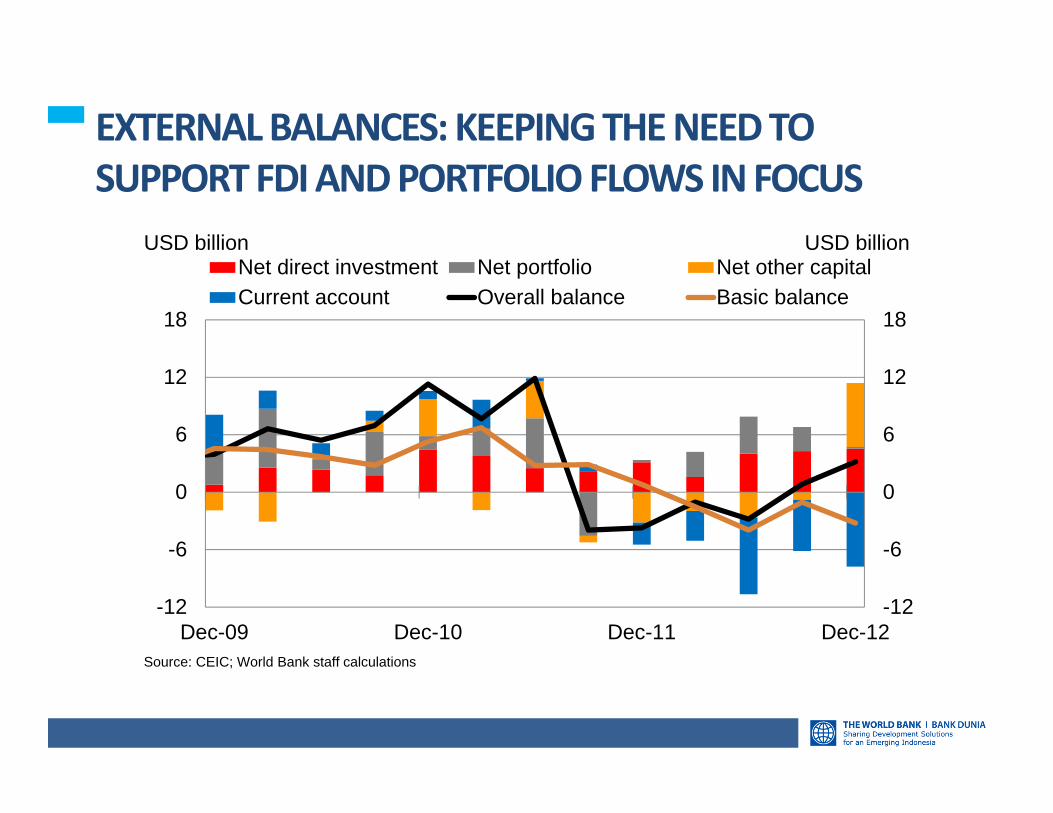
EXTERNAL BALANCES: KEEPING THE NEED TO SUPPORT FDI AND PORTFOLIO FLOWS IN FOCUS
-12
-6
0
6
12
18
-12
-6
0
6
12
18
Dec-09 Dec-10 Dec-11 Dec-12
Net direct investment Net portfolio Net other capitalCurrent account Overall balance Basic balance
USD billion USD billion
Source: CEIC; World Bank staff calculations

GROWTH OUTLOOK: MEASURED REAL FINAL SALES GROWTH DECLINING
0
2
4
6
8
10
0
2
4
6
8
10
Dec-04 Dec-06 Dec-08 Dec-10 Dec-12
Real final sales Real final domestic sales Real GDP
Percent Percent
Note: Real final (domestic) sales = Measured private consumption + government consumption + fixed investment+ net exports (-net exports)Source: CEIC; World Bank staff calculations
Year-on-year growth

GROWTH OUTLOOK: NOMINAL GDP GROWTH MODERATING
0
5
10
15
20
25
30
0
5
10
15
20
25
30
Dec-04 Dec-06 Dec-08 Dec-10 Dec-12
Real GDP Nominal GDP
Percent Percent
Source: CEIC; World Bank staff calculations
Year-on-year growth
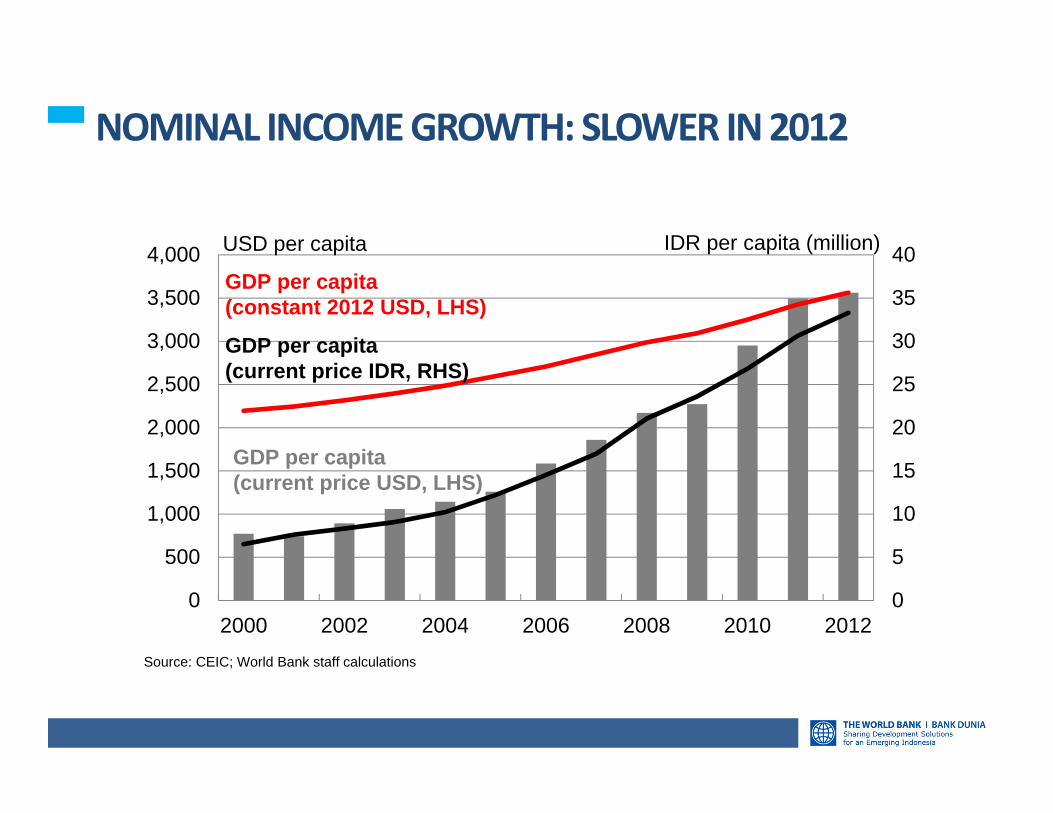
NOMINAL INCOME GROWTH: SLOWER IN 2012
0
5
10
15
20
25
30
35
40
0
500
1,000
1,500
2,000
2,500
3,000
3,500
4,000
2000 2002 2004 2006 2008 2010 2012
GDP per capita (constant 2012 USD, LHS)
GDP per capita (current price USD, LHS)
GDP per capita (current price IDR, RHS)
USD per capita IDR per capita (million)
Source: CEIC; World Bank staff calculations

INFLATION: FOOD PRICE PRESSURES
Source: CEIC; World Bank staff calculations
0
2
4
6
8
0
20
40
60
80
GreenChili
Red Chili Garlic Onion Foodinflation
exclitems*
Foodinflation
Change in CPI from Dec 2012 toFeb 2013 (LHS)
Change in CPI from Dec 2012 toFeb 2013 (RHS)
Percent Percent

ACHIEVING OFFICIAL POVERTY REDUCTION TARGETS WILL BE A STRETCH
-1.5
-1.0
-0.5
0.0
0.5
1.0
1.5
2.0
2.5
0
2
4
6
8
10
12
14
16
18
20
2005 2006 2007 2008 2009 2010 2011 2012 2013 2014
Official Poverty (LHS)
RPJM High TargetRPJM Moderate Target
Annual Change in Poverty
Change in Poverty rate, percentPoverty rate, percent

FISCAL SECTOR: BURDENED BY INEFFICIENT SPENDING
0
50
100
150
200
250
300
350
0
50
100
150
200
250
300
350
Personnel Material Capital Int.Payments
Energysubsidy
Social
2011 Actual Audited 2012 Preliminary Actual 2013 Budget
IDR trillion IDR trillion
Source: MoF; World Bank staff calculations

MARCH 2013 IEQ LAUNCH PRESENTATION
Steady recent economic growth, but pressures mounting
Strong performance can continue but will require policy progress in key areas
More evidence on the need and scope for progress in these areas

NOTWITHSTANDING THE PRESSURES, STRONG PERFORMANCE AND PROGRESS CAN CONTINUE…
Note: CPI is annual average. Government figures for Budget deficit: 2012 is preliminary outturn, 2013 is approved Budget and 2014 is from the 2013 Draft Budget Financial Note Source: Ministry of Finance, BPS, Consensus Forecasts Inc., World Bank staff calculations
2011 2012 2013 2014
Gross domestic product
6.5 6.2 6.2 6.5
Consumer price index 5.2 4.3 5.5 5.2
Budget balance ‐1.2 ‐1.8 ‐1.7 ‐1.4
Major trading partner growth
3.6 3.4 3.7 4.0
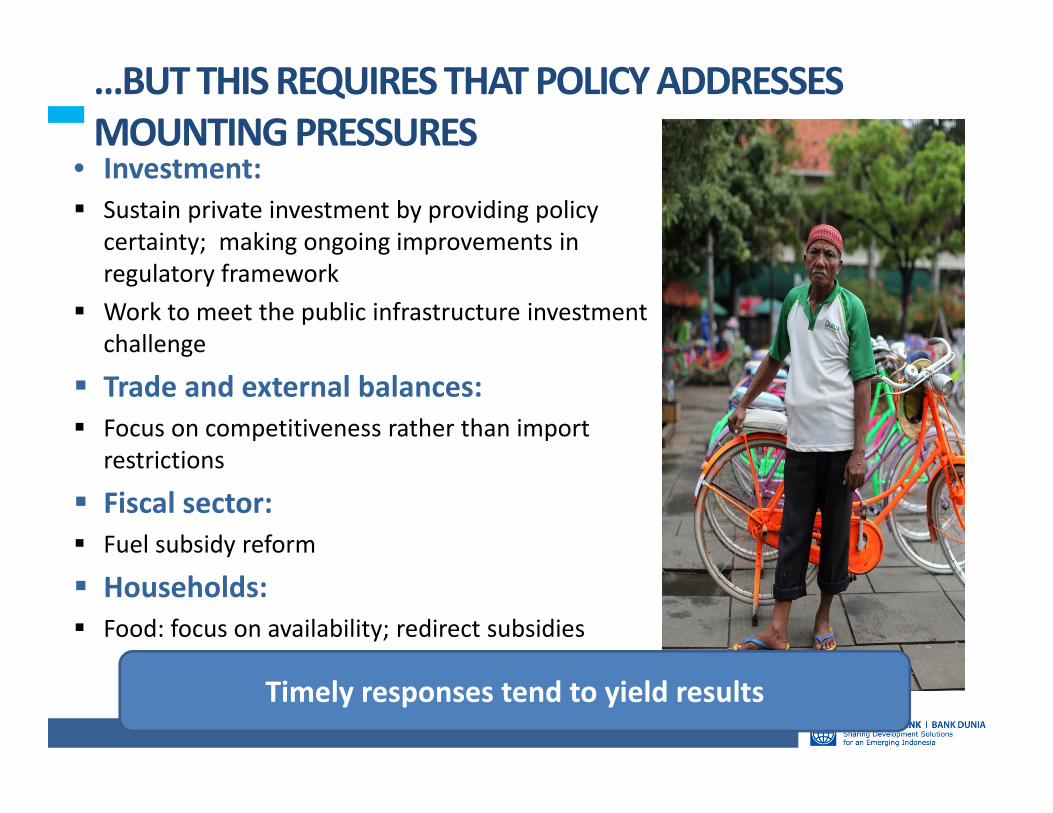
…BUT THIS REQUIRES THAT POLICY ADDRESSES MOUNTING PRESSURES
• Investment: Sustain private investment by providing policy
certainty; making ongoing improvements in regulatory framework
Work to meet the public infrastructure investment challenge
Trade and external balances: Focus on competitiveness rather than import
restrictions
Fiscal sector: Fuel subsidy reform
Households: Food: focus on availability; redirect subsidies
Timely responses tend to yield results
MARCH 2013 IEQ LAUNCH PRESENTATION
Steady recent economic growth, but pressures mounting
Strong performance can continue but will require policy progress in key areas
More evidence on the need and scope for progress in these areas

0 25 50 75 100
SUCCESSFUL MANUFACTURES RELY ON IMPORTS
0 25 50 75 100
AgricultureMining
Food prodTCF
Wood&paperChemicals&mi…
Basic metalMachinery
Electric eq.Transport eq.
Other
Domestic goods Domestic servicesForeign goods Foreign services
Percent
Indonesia China
Value-added in manufactured goods exports
Source: OECD and WTO Trade in Value-Added (TiVA) statistics
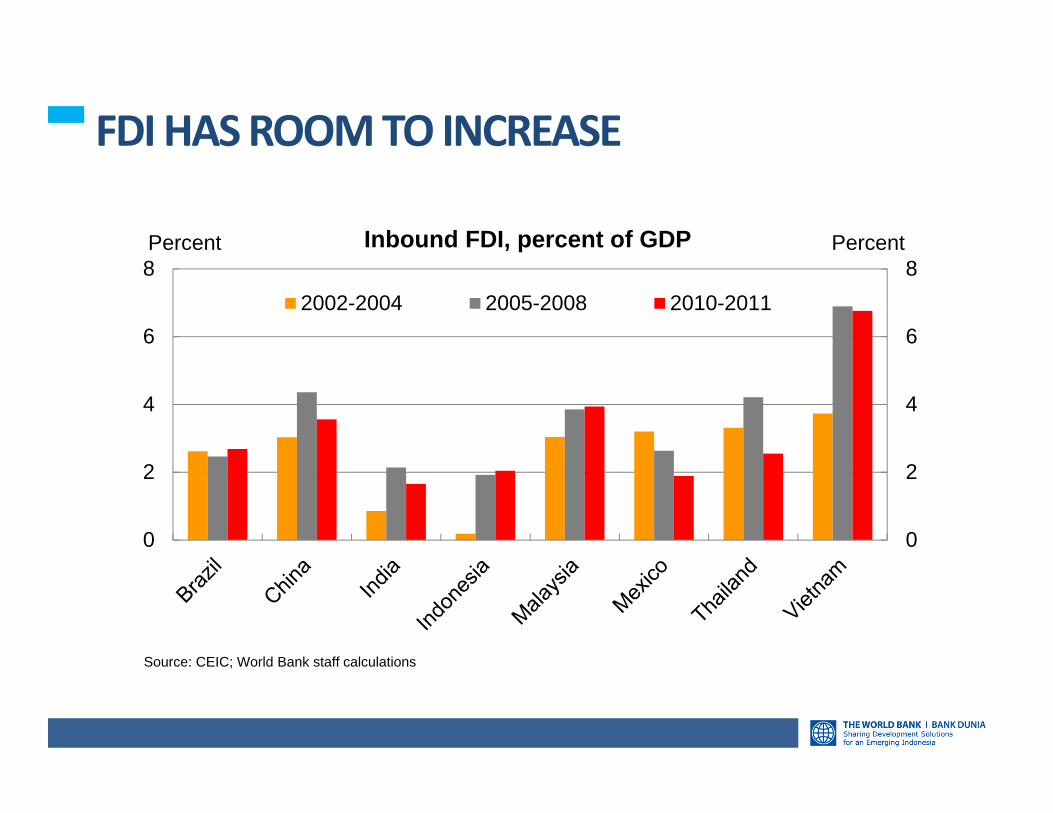
FDIHAS ROOM TO INCREASE
0
2
4
6
8
0
2
4
6
82002-2004 2005-2008 2010-2011
Percent Percent
Source: CEIC; World Bank staff calculations
Inbound FDI, percent of GDP

PUBLIC INFRASTRUCTURE NEEDS A FURTHER BOOST
0
100
200
300
400
500
0
2
4
6
8
10
1995 1997 1999 2001 2003 2005 2007 2009 2011
Percent of GDP IDR trillion
Real spending (2000 prices, RHS)
Infrastructure investment to GDP (LHS)
Note: Real value calculated using investment GDP deflatorSource: Infrastructure investment data as detailed in Box 5 of March 2013 IEQ and World Bank staff calculations

TAP INTO THE POTENTIAL OF FAST URBANIZATION
Source: Indonesia: The Rise of Metropolitan Regions. The World Bank (2012)
Agglomeration areas in Indonesia
15
25
35
45
55
15
25
35
45
555.5 6 6.5 7 7.5 8 8.5 9 9.5
Percent Ln GDP per capita (PPP, 2005 prices)
Indonesia China
India
Philippines
Thailand
Vietnam
Per capita GDP against urbanization rates
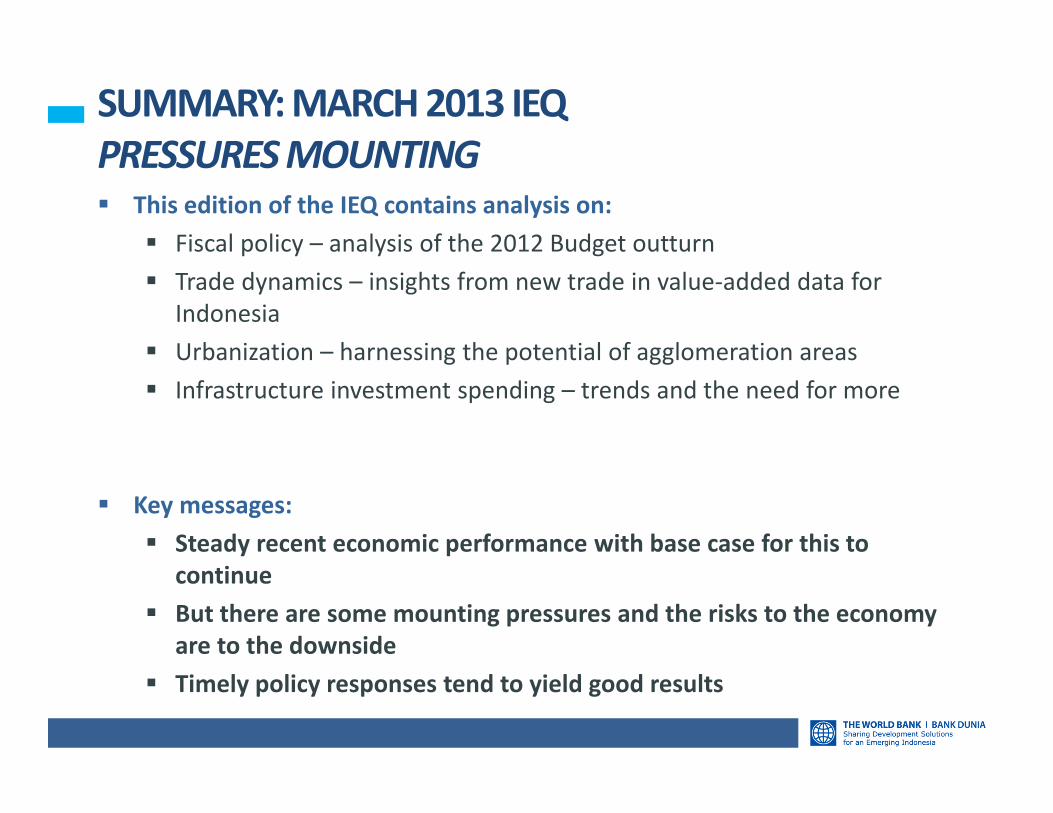
SUMMARY: MARCH 2013 IEQ PRESSURES MOUNTING This edition of the IEQ contains analysis on:
Fiscal policy – analysis of the 2012 Budget outturn Trade dynamics – insights from new trade in value‐added data for
Indonesia Urbanization – harnessing the potential of agglomeration areas Infrastructure investment spending – trends and the need for more
Key messages: Steady recent economic performance with base case for this to
continue But there are some mounting pressures and the risks to the economy
are to the downside Timely policy responses tend to yield good results
Related Documents