PHYSICAL REVIEW B 83, 085101 (2011) Pressure-induced quantum phase transition in Fe 1−x Co x Si ( x = 0.1,0.2) M. K. Forthaus, 1 G. R. Hearne, 2 N. Manyala, 3 O. Heyer, 1 R. A. Brand, 4 D. I. Khomskii, 1 T. Lorenz, 1 and M. M. Abd-Elmeguid 1 1 II. Physikalisches Institut, Universit¨ at zu K ¨ oln, Z ¨ ulpicher Str. 77, D-50937 K¨ oln, Germany 2 Department of Physics, University of Johannesburg, P.O. Box 524, Auckland Park, Johannesburg, RSA 3 Department of Physics, Institute of Applied Materials, University of Pretoria, Pretoria, RSA 4 Karlsruher Institut f ¨ ur Technologie (KIT), Institut f¨ ur Nanotechnologie (INT), Hermann-von-Helmholtz-Platz 1, D-76344 Eggenstein-Leopoldshafen, Germany (Received 21 June 2010; revised manuscript received 7 December 2010; published 2 February 2011) We have investigated the effect of pressure on electrical transport and magnetic properties of ferromagnetic Fe 1−x Co x Si alloys for x = 0.1(T C ∼ 11 K) and x = 0.2(T C ∼ 32 K) using electrical resistivity measurements up to about 30 GPa. We have also studied the magnetic properties of these samples (x = 0.1 and x = 0.2) and a sample with x = 0.3(T C ∼ 43 K) at ambient pressure using 57 Fe M¨ ossbauer-effect (ME) spectroscopy. The ME results indicate that the effective magnetic hyperfine field B eff at the 57 Fe nucleus exhibits the same concentration dependence as the macroscopic magnetic moment and confirm that the onset of magnetic order is above x ∼ 0.02. The analysis of the high-pressure results reveals in both samples a gradual suppression of the ferromagnetic state to a quantum phase transition (QPT) at pressures of p ∼ 11 GPa and p ∼ 12 GPa for x = 0.1 and x = 0.2, respectively. High-pressure x-ray diffraction measurements on the three samples indicate very similar change of the volume of the cubic unit cell with pressure and exclude that the observed QPTs are connected with a structural phase transition. We discuss the observed instability of the ferromagnetic state with increasing Co concentration in the context of increasing local crystallographic disorder, which causes a change of the distribution of the helix wave vector as well as a modification of the ferromagnetic half-metallic state. We further show that, in the pressure-induced nonmagnetic metallic state, all samples, regardless of their different local crystallographic disorder, exhibit similar non-Fermi-liquid behavior [ρ(T ) ∝ T ]. Finally, we find a small but positive magnetoresistance in the high-pressure metallic state well beyond the QPT of Fe 0.9 Co 0.1 Si. This can be attributed to a slight field-induced modification of the spin majority and minority band which leads to a very small magnetic moment. DOI: 10.1103/PhysRevB.83.085101 PACS number(s): 71.30.+h, 75.30.Kz, 75.50.Bb I. INTRODUCTION In recent years, the disordered Fe 1−x Co x Si alloys, crystal- lizing in the cubic B20-type structure, have attracted significant interest due to their remarkable electronic and magnetic properties. 1–10 The undoped system FeSi is a paramagnetic metal at high temperatures (T 400 K). However, its electri- cal resistivity increases dramatically with decreasing temper- ature, yielding an insulating ground state. 11,12 The opening of a small energy gap (around 60 meV) at low temperatures has been observed. 13,14 On the other hand, investigations of the magnetic properties of FeSi have revealed that the ground state is nonmagnetic: although the magnetic susceptibility above 500 K indicates a local moment behavior, no long-range magnetic order has been detected by neutron diffraction, 29 Si nuclear magnetic resonance, and 57 Fe M ¨ ossbauer experiments at low temperatures. 15,16 Because of these findings, FeSi has been characterized as a narrow-gap semiconductor and, therefore, was considered as a candidate for a 3d -based Kondo insulator. 17 However, this scenario has been put into question by very recent photoemission spectroscopy measurements that suggest that FeSi is most appropriately described as an itinerant semiconductor. 18–20 Most interesting is the finding that a slight substitution of Fe by Co (i.e., electron doping) induces a metal-insulator tran- sition at about x 0.02. 1 Higher Co doping (0.05 x 0.7) leads to the formation of an unusual ferromagnetic metallic state which exhibits a helical magnetic structure 2,3 similar to that reported for the isostructural compounds MnSi 21,22 and FeGe. 23,24 According to the magnetic phase diagram of Fe 1−x Co x Si, 4,5 the onset of ferromagnetic order is for x 0.05 with a maximum ordering temperature (T C ∼ 50 K) for x = 0.4. Upon further increasing Co concentration, the magnetic state is suppressed, since the end member of the series (CoSi) is a diamagnetic compound. The saturation magnetization M has been shown to follow T C in the whole concentration range. Here, M linearly increases with increasing x below x 0.2 and saturates at low external magnetic fields (B 0.2 T). 5 This behavior suggests that the excess 3d electrons only occupy the majority spin band. 5,6 Moreover, a positive magne- toresistance has been reported. These observations have been attributed to the nearly-half-metallic nature of Fe 1−x Co x Si, in which the electrons responsible for ferromagnetism are triggering the electrical and magnetotransport. 5,6 A promising approach for a better understanding of such a strong coupling between the spin and charge degrees of freedom in this system is to investigate the effect of external pressure p on the magnetic and electrical transport properties of Fe 1−x Co x Si at fixed concentrations. Indeed, recent high- pressure studies on a ferromagnetic metallic Fe 0.7 Co 0.3 Si sample (T C ∼ 43 K) revealed a complete suppression of the ferromagnetic order and a transition to a nonmagnetic state above a critical pressure p c of about 7 GPa 5 [i.e., magnetic quantum phase transition (QPT)]. Most interesting is the observation of an unusual temperature dependence of the electrical resistivity [ρ (T ) ∝ T ] at low temperatures from p c = 7 GPa to 10 GPa. This is entirely different from that reported for MnSi and FeGe [ρ (T ) ∝ T 3/2 ] at and beyond 085101-1 1098-0121/2011/83(8)/085101(10) ©2011 American Physical Society

Welcome message from author
This document is posted to help you gain knowledge. Please leave a comment to let me know what you think about it! Share it to your friends and learn new things together.
Transcript
PHYSICAL REVIEW B 83, 085101 (2011)
Pressure-induced quantum phase transition in Fe1−xCoxSi (x = 0.1,0.2)
M. K. Forthaus,1 G. R. Hearne,2 N. Manyala,3 O. Heyer,1 R. A. Brand,4 D. I. Khomskii,1 T. Lorenz,1 and M. M. Abd-Elmeguid1
1II. Physikalisches Institut, Universitat zu Koln, Zulpicher Str. 77, D-50937 Koln, Germany2Department of Physics, University of Johannesburg, P.O. Box 524, Auckland Park, Johannesburg, RSA
3Department of Physics, Institute of Applied Materials, University of Pretoria, Pretoria, RSA4Karlsruher Institut fur Technologie (KIT), Institut fur Nanotechnologie (INT), Hermann-von-Helmholtz-Platz 1,
D-76344 Eggenstein-Leopoldshafen, Germany(Received 21 June 2010; revised manuscript received 7 December 2010; published 2 February 2011)
We have investigated the effect of pressure on electrical transport and magnetic properties of ferromagneticFe1−xCoxSi alloys for x = 0.1 (TC ∼ 11 K) and x = 0.2 (TC ∼ 32 K) using electrical resistivity measurementsup to about 30 GPa. We have also studied the magnetic properties of these samples (x = 0.1 and x = 0.2)and a sample with x = 0.3 (TC ∼ 43 K) at ambient pressure using 57Fe Mossbauer-effect (ME) spectroscopy.The ME results indicate that the effective magnetic hyperfine field Beff at the 57Fe nucleus exhibits the sameconcentration dependence as the macroscopic magnetic moment and confirm that the onset of magnetic orderis above x ∼ 0.02. The analysis of the high-pressure results reveals in both samples a gradual suppression ofthe ferromagnetic state to a quantum phase transition (QPT) at pressures of p ∼ 11 GPa and p ∼ 12 GPa forx = 0.1 and x = 0.2, respectively. High-pressure x-ray diffraction measurements on the three samples indicatevery similar change of the volume of the cubic unit cell with pressure and exclude that the observed QPTs areconnected with a structural phase transition. We discuss the observed instability of the ferromagnetic state withincreasing Co concentration in the context of increasing local crystallographic disorder, which causes a changeof the distribution of the helix wave vector as well as a modification of the ferromagnetic half-metallic state. Wefurther show that, in the pressure-induced nonmagnetic metallic state, all samples, regardless of their differentlocal crystallographic disorder, exhibit similar non-Fermi-liquid behavior [ρ(T ) ∝ T ]. Finally, we find a smallbut positive magnetoresistance in the high-pressure metallic state well beyond the QPT of Fe0.9Co0.1Si. This canbe attributed to a slight field-induced modification of the spin majority and minority band which leads to a verysmall magnetic moment.
DOI: 10.1103/PhysRevB.83.085101 PACS number(s): 71.30.+h, 75.30.Kz, 75.50.Bb
I. INTRODUCTION
In recent years, the disordered Fe1−xCoxSi alloys, crystal-lizing in the cubic B20-type structure, have attracted significantinterest due to their remarkable electronic and magneticproperties.1–10 The undoped system FeSi is a paramagneticmetal at high temperatures (T � 400 K). However, its electri-cal resistivity increases dramatically with decreasing temper-ature, yielding an insulating ground state.11,12 The opening ofa small energy gap (around 60 meV) at low temperatures hasbeen observed.13,14 On the other hand, investigations of themagnetic properties of FeSi have revealed that the groundstate is nonmagnetic: although the magnetic susceptibilityabove 500 K indicates a local moment behavior, no long-rangemagnetic order has been detected by neutron diffraction, 29Sinuclear magnetic resonance, and 57Fe Mossbauer experimentsat low temperatures.15,16 Because of these findings, FeSihas been characterized as a narrow-gap semiconductor and,therefore, was considered as a candidate for a 3d-based Kondoinsulator.17 However, this scenario has been put into questionby very recent photoemission spectroscopy measurements thatsuggest that FeSi is most appropriately described as an itinerantsemiconductor.18–20
Most interesting is the finding that a slight substitution ofFe by Co (i.e., electron doping) induces a metal-insulator tran-sition at about x � 0.02.1 Higher Co doping (0.05 � x � 0.7)leads to the formation of an unusual ferromagnetic metallicstate which exhibits a helical magnetic structure2,3 similarto that reported for the isostructural compounds MnSi21,22
and FeGe.23,24 According to the magnetic phase diagram ofFe1−xCoxSi,4,5 the onset of ferromagnetic order is for x � 0.05with a maximum ordering temperature (TC ∼ 50 K) for x =0.4. Upon further increasing Co concentration, the magneticstate is suppressed, since the end member of the series (CoSi)is a diamagnetic compound. The saturation magnetization M
has been shown to follow TC in the whole concentration range.Here, M linearly increases with increasing x below x � 0.2and saturates at low external magnetic fields (B � 0.2 T).5
This behavior suggests that the excess 3d electrons onlyoccupy the majority spin band.5,6 Moreover, a positive magne-toresistance has been reported. These observations have beenattributed to the nearly-half-metallic nature of Fe1−xCoxSi,in which the electrons responsible for ferromagnetism aretriggering the electrical and magnetotransport.5,6
A promising approach for a better understanding of sucha strong coupling between the spin and charge degrees offreedom in this system is to investigate the effect of externalpressure p on the magnetic and electrical transport propertiesof Fe1−xCoxSi at fixed concentrations. Indeed, recent high-pressure studies on a ferromagnetic metallic Fe0.7Co0.3Sisample (TC ∼ 43 K) revealed a complete suppression of theferromagnetic order and a transition to a nonmagnetic stateabove a critical pressure pc of about 7 GPa5 [i.e., magneticquantum phase transition (QPT)]. Most interesting is theobservation of an unusual temperature dependence of theelectrical resistivity [ρ(T ) ∝ T ] at low temperatures frompc = 7 GPa to 10 GPa. This is entirely different from thatreported for MnSi and FeGe [ρ(T ) ∝ T 3/2] at and beyond
085101-11098-0121/2011/83(8)/085101(10) ©2011 American Physical Society
M. K. FORTHAUS et al. PHYSICAL REVIEW B 83, 085101 (2011)
pc.25–28 A possible origin for the linear behavior of ρ(T ) inFe0.7Co0.3Si has been attributed to the existence of chemical(atomic) disorder in the sample.5
In fact, recently experimental evidence for local crys-tallographic Co-Fe site disorder in Fe1−xCoxSi has beenreported. Raman spectroscopy data shows a clear increaseof the Raman line width as the Co concentration increaseswith a maximum at x = 0.5.9 Furthermore, small-anglepolarized neutron diffraction measurements reveal that thehelix wave vector exhibits a distribution which increases withincreasing Co concentration.10 Finally, ab initio calculationson Fe1−xCoxSi indicate that these alloys behave as a disorderedferromagnetic half-metal and that increasing disorder withincreasing Co concentration results in a gradual suppressionof the half-metallic character.6
Motivated by such unusual behavior of these disorderedalloys, and in particular the observed anomalous metallicnonmagnetic state under high pressure, we have investigatedthe effect of pressure on the electronic, magnetic, and struc-tural properties in much less crystallographically disorderedFe0.9Co0.1Si (TC ∼ 11 K) and Fe0.8Co0.2Si (TC ∼ 32 K) ferro-magnetic samples. For comparison, we have investigated thestructural properties of Fe0.7Co0.3Si under pressure. Furtherinformation on the magnetic ground state of all three samplesat ambient pressure was obtained using 57Fe Mossbauer-effectspectroscopy. We show that our investigations shed moreinsight into the nature of the ground state of Fe1−xCoxSi andprovide a proper judge whether atomic disorder is responsiblefor the observed anomalous low-temperature behavior of theelectrical resistivity at and beyond the critical pressure of thepressure-induced QPT.
II. EXPERIMENT
All experiments presented here were carried out on high-quality single-phase polycrystalline Fe1−xCoxSi (x = 0.1, 0.2,0.3) samples. Details of the preparation of the samples aregiven elsewhere.4
To probe the temperature dependence of the electricalresistivity of Fe0.9Co0.1Si and Fe0.8Co0.2Si as a function ofpressure, we performed high-pressure electrical resistivitymeasurements using a four-probe resistivity setup in a diamondanvil cell (DAC) made of a Ti-based alloy with a low ex-pansion coefficient in order to minimize temperature-inducedvariations of the pressure. Gaskets were made of a mixture ofStycast 1266 and Al2O3 (or BN). A typical sample chamberdiameter was about 200 μm. Measurements were done fortemperatures 1.6 K � T � 300 K using a 4He bath cryostatfor pressures up to ∼30 GPa. In addition, we performed high-pressure magnetoresistance measurements at low temperatures(2 K � T � 50 K) in external magnetic fields up to 8 T onFe0.9Co0.1Si at 30 GPa using a 4He gas-flow cryostat with asuperconducting magnet. Pressure was determined by the rubyfluorescence method29 before and after each run.
To obtain information about the structural stability acrossthe expected pressure-induced quantum phase transition, thepressure dependence of the structural parameters of thecubic lattice of Fe0.9Co0.1Si, Fe0.8Co0.2Si, and Fe0.7Co0.3Si atroom temperature up to 30.4 GPa, 23.1 GPa, and 9.0 GPa,
respectively, was determined by energy dispersive x-raydiffraction using synchrotron radiation at the beamlineF3 at HASYLAB, Hamburg. Spectra were taken withEdhkl = 72.750 keV A, Edhkl = 73.247 keV A, and Edhkl =69.862 keV A for Fe0.9Co0.1Si, Fe0.8Co0.2Si, and Fe0.7Co0.3Si,respectively, and a typical data acquisition time of 15–20 min.Pressure was generated in all cases by using a DAC setup withBoehler-Almax design type anvils30 and Inconel 750 as gasketmaterial. The diamonds had culets of 0.6 mm (Fe0.9Co0.1Si andFe0.8Co0.2Si) and 1.3 mm (Fe0.7Co0.3Si). The applied pressurewas determined either by the ruby fluorescence method or byusing a tiny piece of gold inserted into the sample chamber.This allows one to determine the pressure in situ duringacquisition of the spectrum via the calibrated lattice parameterof the cubic lattice of gold.31 The obtained spectra wereanalyzed using the program EDXPOWD.32
To investigate the magnetic ground state of Fe1−xCoxSi andits evolution with Co concentration x at a microscopic level, wehave performed 57Fe Mossbauer spectroscopy measurementsat ambient pressure and for temperatures 4.2 K � T � 300 Kfor concentrations x = 0, 0.1, 0.2, 0.3. Using 57Fe Mossbauerspectroscopy, one is able to inspect the electronic and magneticproperties of systems containing Fe. Information about thevalence state of Fe, local site symmetry, and the magneticorder and moment can be obtained from the isomer shiftS, the quadrupole splitting QS, and the effective magnetichyperfine field Beff at the 57Fe nucleus, respectively. Since theFe1−xCoxSi (0.1 � x � 0.3) alloys are disordered samples, itis possible to observe a distribution of QS and Beff which isexpected to vary from site to site for the different samples. 57FeMossbauer spectra for Fe1−xCoxSi (x = 0.1, 0.2, 0.3) weretaken in a liquid 4He bath cryostat with a 57Co(Rh) sourceand the absorber (sample) kept at the same temperature of4.2 K. Sample thickness was about 10–15 mg/cm2. Additionalspectra (not shown) were taken for all samples at roomtemperature and 90 K.
III. RESULTS
A. 57Fe Mossbauer spectroscopy on Fe1−xCoxSiat ambient pressure
Spectra have been taken at room temperature (RT), 90,and 4.2 K. The RT and 90-K spectra (not shown) all show aquadrupole line splitting QS due to a nonzero electric fieldgradient (EFG) at the 57Fe nucleus. They have been evaluatedusing a single enlarged quadrupole doublet and transmissionintegral. The results given in Table I (reference for isomer shiftS is α-Fe at room temperature) give the linewidth as the sum ofthe source and absorber values to better compare with literaturevalues. These data are similar to those from Wertheim et al.33
(Slight differences in average values are attributable to thedifferent fit methods. Note differences in composition.)
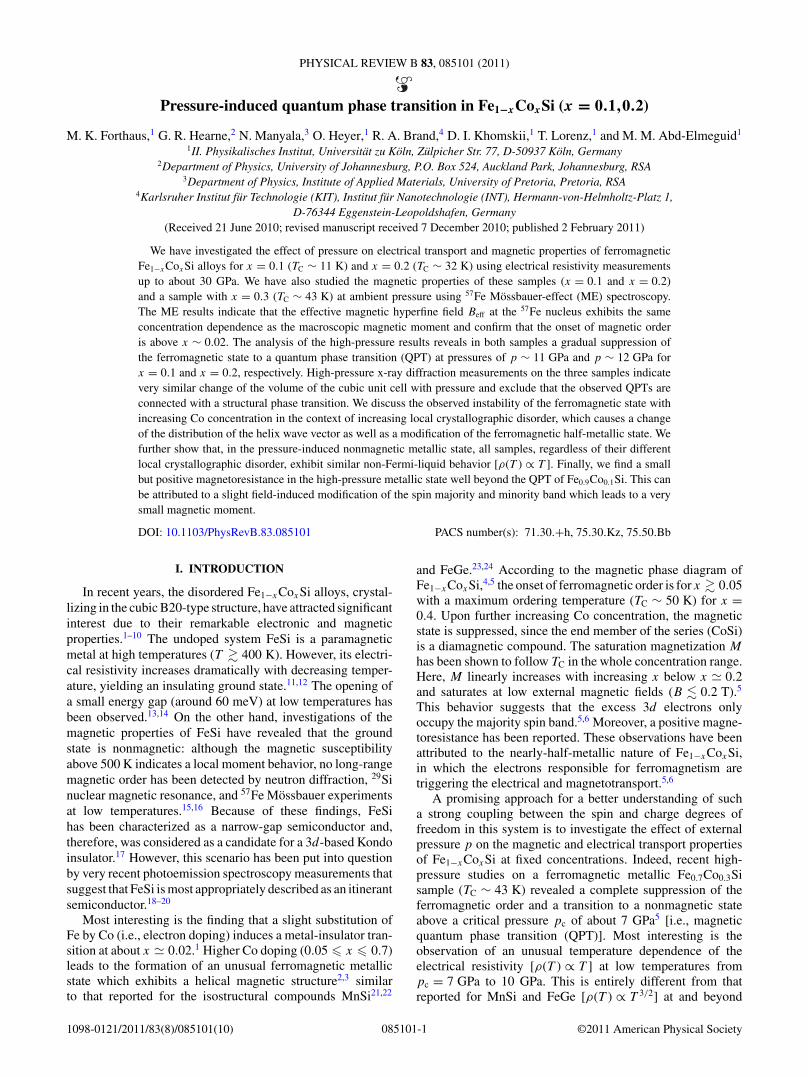
The spectra from 4.2 K are shown in Fig. 1. It is known that,in nonmagnetic FeSi, QS strongly depends on temperature forT above about 100 K but with little variation below.33 Theincreased spectral broadening with Co content shown in Fig. 1is a result of the magnetic order creating a magnetic hyperfinefield Beff at the 57Fe nucleus. This effect evidently increasesover the composition range presented, similar to Wertheim
085101-2
PRESSURE-INDUCED QUANTUM PHASE TRANSITION IN . . . PHYSICAL REVIEW B 83, 085101 (2011)
TABLE I. Results of 57Fe Mossbauer measurements ofFe1−xCoxSi (x = 0.1, 0.2, 0.3) at room temperature (300 K), 90K, and 4.2 K. �: linewidth; S: average isomer shift; QS: averagequadrupole splitting; Beff : average hyperfine field; σx, (x = S, QS,and B: standard deviations of S, QS, and Beff .) Typical errors are±0.01 mm/s and ±0.1 T. Note that fits to the data at room temperature(300 K), 90 K, and for FeSi (x = 0) at 4.2 K are single-site fits usingthe transmission integral.
x
0 0.1 0.2 0.3
300 K� (mm/s) 0.25 0.24 0.27 0.26S (mm/s) 0.25 0.26 0.26 0.26QS (mm/s) 0.50 0.51 0.50 0.50
90 K� (mm/s) 0.32 0.31 0.32S (mm/s) 0.35 0.35 0.36QS (mm/s) 0.72 0.62 0.60
4.2 K� (mm/s) 0.25 0.25 0.25 0.25S (mm/s) 0.39 0.40 0.41 0.41σS (mm/s) 0.00 0.01 0.00QS (mm/s) 0.74 0.70 0.63 0.59σQS (mm/s) 0.00 0.07 0.08Beff (T) 0.0 0.82 1.7 2.5σB (T) 0.94 1.4 1.4
et al.33 However, the magnetic splitting of the nuclear sublevelsis not large compared to the effect of the EFG, necessitatingthe use of the full Hamiltonian for 57Fe with mixed EFG andBeff interactions. The line positions and intensities then dependon the relative orientation between the EFG principal axis andBeff . From the crystal structure of FeSi, the EFG principal axisat the iron site is along 〈111〉 directions and the asymmetryparameter is zero.35 At low Co concentration, the iron momentsare along 〈100〉 directions but become random with increasingCo concentration.10 Since the four possible 〈111〉 directionsare all at an angle of arccos(1/
√3) to 〈100〉, diagonal EFG
terms drop out of the Hamiltonian, but nondiagonal terms donot (see, for example, Ref. 34).
In order to exploit the spectra from 4.2 K, first they werefit using the transmission integral and the full Hamiltonianwith the fixed angle arccos(1/
√3) to 〈100〉 between the EFG
principal axis and Beff . Then they were also fit assuming anisotropic distribution between the EFG principal axis and Beff .An expression for the angular-averaged (isotropic) case forfixed QS and Beff has been given by Blaes et al.34 Thesetwo methods yield about the same values of S, QS, and Beff .However, these fits were far from adequate. This shows thatthe dispersion in Beff is too large to be simply included in anenlarged linewidth. In order to compensate for this magneticdistribution, we were obliged to use a histogram routine.However the single-site transmission-integral fits were usedas a guide for the following fits. It was also necessary to usea routine which starts from the full Hamiltonian for mixedhyperfine interactions. Since the single-site results indicatedlittle difference for the three fits between a fixed (single-site
FIG. 1. (Color online) Left panel: Mossbauer spectra ofFe1−xCoxSi (x = 0.1, 0.2, 0.3) at 4.2 K. Solid line corresponds tothe histogram fit of the data involving a distribution of Beff includingmixed hyperfine interactions using the Blaes et al. routine.34 Smalllinear variations of center shift S and quadrupole splitting QS wereallowed. Right panel: Beff distribution P (Beff ) obtained from fittingthe spectra at 4.2 K.
Hamiltonian) and an isotropic (Blaes et al.) distribution, theBlaes et al. routine was used in the following.
The spectra for x = 0.1, 0.2, 0.3 were fit using a histogramof subspectra at fixed Beff values. The histogram routinecalculates the distribution P (QS) or P (Beff) but obliges the useof the thin-absorber approximation. The results given for 90 Kin Table I show that QS decreases slightly with increasing Cocontent. Thus, a criterion to judge the distribution fits was thatthis tendency should be obtained as well. They were fit usinga series of subspectra at intervals of 1 T, allowing the centershift and QS to vary. In addition, linear variations of both S
and QS were allowed whereby only small resulting variationsare taken as physically relevant. A small smoothing-parameterconstraint as well as small constraints on initial and final valuesof P (Beff) were assumed. But variation of these constraintslead to only small changes in the average values and standarddeviations reported on below.
The theoretical fits are given in Fig. 1 (obtained byWinNormos36). The left panel gives the spectra and fittedcurve, while the right panel shows the three distributionsP (Beff). Calculating P (Beff) from the spectra we obtain theaverage values of S, QS, and Beff . To characterize the width ofthe distribution, the standard deviations σ x (x = S, QS, Beff)have been calculated as well and are given in the table for thesespectra. Essentially no dispersion was found in S or QS. Theresults yield the histogram of Beff . The average values as wellas the standard deviations are presented in Table I (referencefor S is α-Fe at room temperature).
085101-3
M. K. FORTHAUS et al. PHYSICAL REVIEW B 83, 085101 (2011)
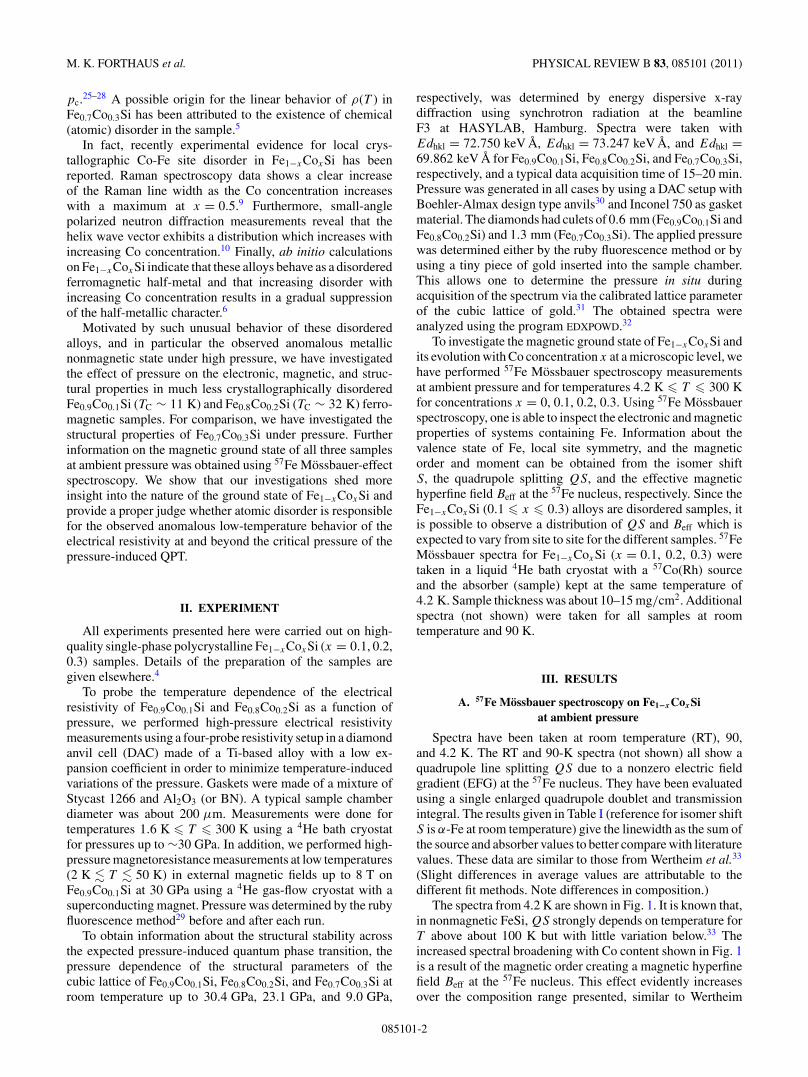
FIG. 2. (Color online) Average magnetic hyperfine field Beff ofFe1−xCoxSi as a function of concentration x. Dotted line is onlya guide to the eye. The inset shows that Beff is proportional to themagnetization M obtained by macroscopic measurements. The valuesof M are taken from Ref. 5. The solid red line is a linear fit to thedata, the dotted part is an extrapolation of this linear fit toward zerofield.
The concentration dependence of the average magnetichyperfine field Beff is shown in Fig. 2. Beff nearly revealsa linear increase with increasing concentration and roughlyindicates that the onset of magnetic order is between 0.02and 0.05, close to what has been reported from magnetizationmeasurements.4,5 Also, the inset of Fig. 2 displays a good cor-relation between Beff and the value of the magnetic moment;that is, Beff exhibits the same concentration dependence as themagnetic moment.
B. Pressure dependence of the electrical resistivity
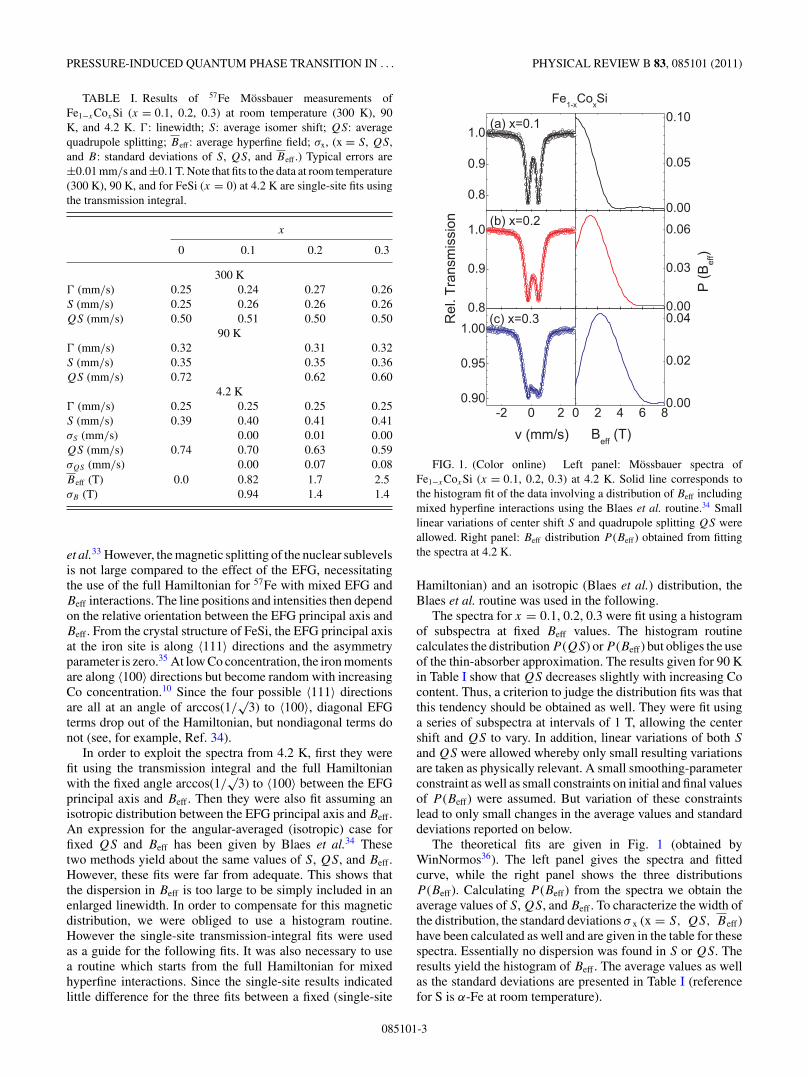
The temperature dependence (1.6 K � T � 300 K) of theelectrical resistivity ρ(T ,p) of Fe0.9Co0.1Si for differentpressures from ambient pressure up to 29.9 GPa is shownin Fig. 3(a). The resistivity at ambient pressure first in-creases rapidly with decreasing temperature, reaches a broadmaximum around Tmax ∼ 65 K, and then decreases. At lowtemperatures, the resistivity shows a weak upturn at TM ∼11 K, which is due to the onset of ferromagnetic order belowTC. Thus, Tmax can be identified as the temperature belowwhich the system becomes metallic. The observed features arein full agreement with those reported for Fe0.7Co0.3Si.5 Uponincreasing the pressure, the maximum is gradually shifted tohigher temperatures, and the upturn of the resistivity at TM
disappears, suggesting that magnetic order is suppressed (atleast down to 1.6 K); that is, a pressure-induced quantum phasetransition (QPT) is observed.
Figure 3(b) shows the temperature dependence (1.6 K �T � 300 K) of the electrical resistivity of Fe0.8Co0.2Si fordifferent pressures from ambient pressure up to p = 15.3 GPa.As is evident from the figure, one observes a similar typeof behavior for ρ(T ,p) with increasing pressure as forFe0.9Co0.1Si. However, the maximum in ρ(T ) appears in thissample at a higher temperature (Tmax ∼ 110 K). In addition,due to the higher value of TC ∼ 32 K, one clearly observes apressure-induced shift of the resistivity upturn at TM to lowertemperatures which nearly disappears above ∼11 GPa. This
FIG. 3. (Color online) Temperature dependence of the resistivityof (a) Fe0.9Co0.1Si and (b) Fe0.8Co0.2Si for different pressures fromambient pressure up to 29.9 and 15.3 GPa, respectively, as obtainedby four-point electrical resistivity measurements using a diamondanvil cell setup. The arrows at ambient pressure indicate the maximain ρ(T ) at Tmax, below which the systems show a metallic-liketemperature dependence of ρ(T ), and the anomalies at TM whichare connected with the onset of ferromagnetic order in Fe0.9Co0.1Si(TC ∼ 11 K) and Fe0.8Co0.2Si (TC ∼ 32 K).5
again suggests a pressure-induced magnetic quantum phasetransition in Fe0.8Co0.2Si.
The evolution of ρ(T ,p) with pressure in both samplescan be qualitatively explained on the basis of the electronicstructure of the undoped FeSi sample assuming two narrowbands with a high density of states and the Fermi energy EF
lying in the gap between the two bands.11,37 Obviously, uponelectron doping, impurity or defect states and the associatedmobility edge result in a finite density of states at EF. Asa consequence, ρ(T ) exhibits a metallic-like behavior at lowtemperatures. This, however, changes to a semiconducting-likebehavior above Tmax due to a considerable thermal activationof the charge carriers across the energy gap between the twonarrow bands. Since external pressure is expected to causea broadening of the bands, the density of states at EF willgradually decrease with pressure. Simultaneously, the energygap will decrease due to the broadening of the bands. Thus,a metallic state is stabilized at higher temperature. As aresult, Tmax is gradually shifted toward higher temperatureswith increasing pressure and a metallic behavior is achievedin the whole temperature range for p � 25 GPa and p �11 GPa for Fe0.9Co0.1Si and Fe0.8Co0.2Si, respectively. Thus,Tmax represents the energy scale for the transition from the
085101-4
PRESSURE-INDUCED QUANTUM PHASE TRANSITION IN . . . PHYSICAL REVIEW B 83, 085101 (2011)
metallic to the insulating state upon increasing temperature.Bearing in mind that ferromagnetism in such a band (itinerant)picture originates from the difference (shift) between themajority (spin-up) and minority (spin-down) 3d bands at theFermi level, the observed pressure-induced suppression of theferromagnetic state can simply be explained by a gradualdecrease of the splitting between spin-up and spin-downbands. It should be mentioned that the band picture discussedabove is consistent with band structure calculations forFe1−xCoxSi.6
C. Pressure dependence of the crystal structure
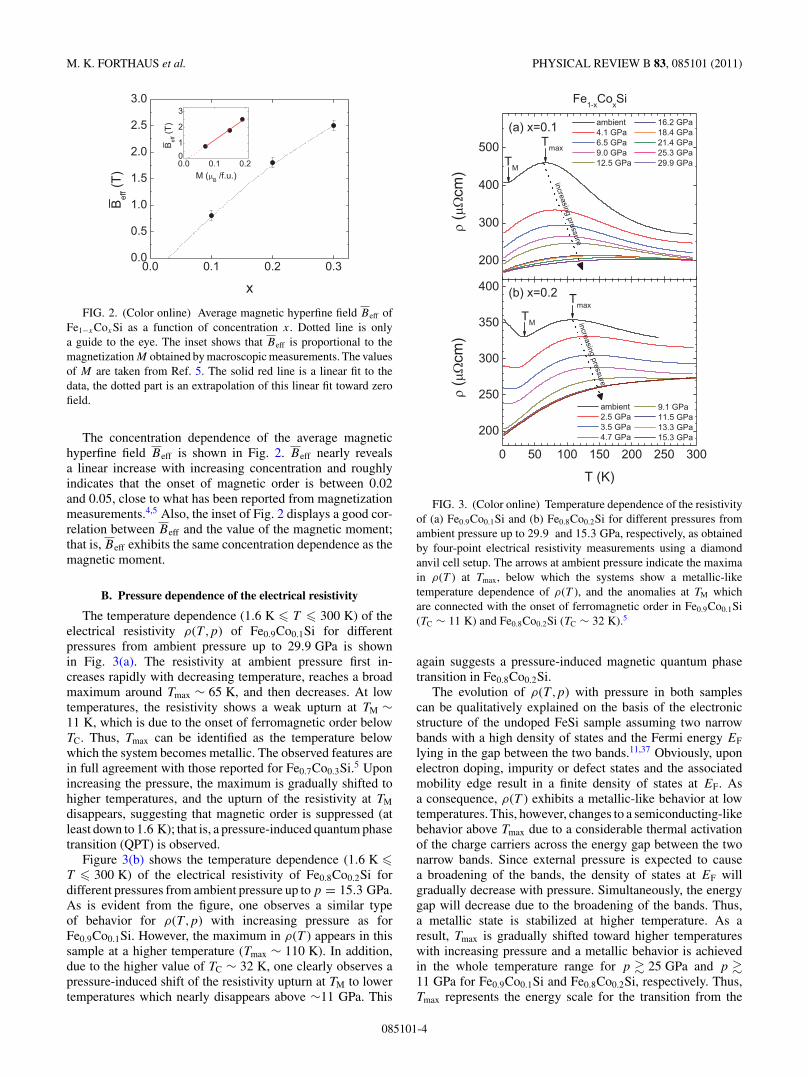
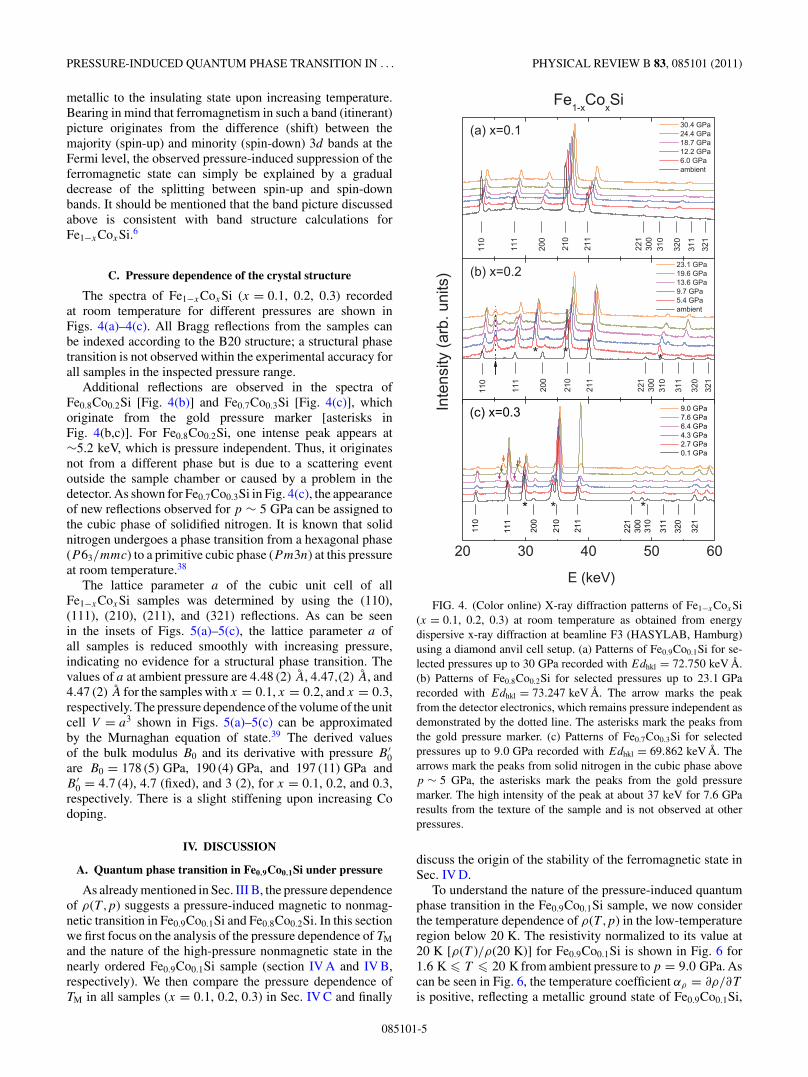
The spectra of Fe1−xCoxSi (x = 0.1, 0.2, 0.3) recordedat room temperature for different pressures are shown inFigs. 4(a)–4(c). All Bragg reflections from the samples canbe indexed according to the B20 structure; a structural phasetransition is not observed within the experimental accuracy forall samples in the inspected pressure range.
Additional reflections are observed in the spectra ofFe0.8Co0.2Si [Fig. 4(b)] and Fe0.7Co0.3Si [Fig. 4(c)], whichoriginate from the gold pressure marker [asterisks inFig. 4(b,c)]. For Fe0.8Co0.2Si, one intense peak appears at∼5.2 keV, which is pressure independent. Thus, it originatesnot from a different phase but is due to a scattering eventoutside the sample chamber or caused by a problem in thedetector. As shown for Fe0.7Co0.3Si in Fig. 4(c), the appearanceof new reflections observed for p ∼ 5 GPa can be assigned tothe cubic phase of solidified nitrogen. It is known that solidnitrogen undergoes a phase transition from a hexagonal phase(P 63/mmc) to a primitive cubic phase (Pm3n) at this pressureat room temperature.38
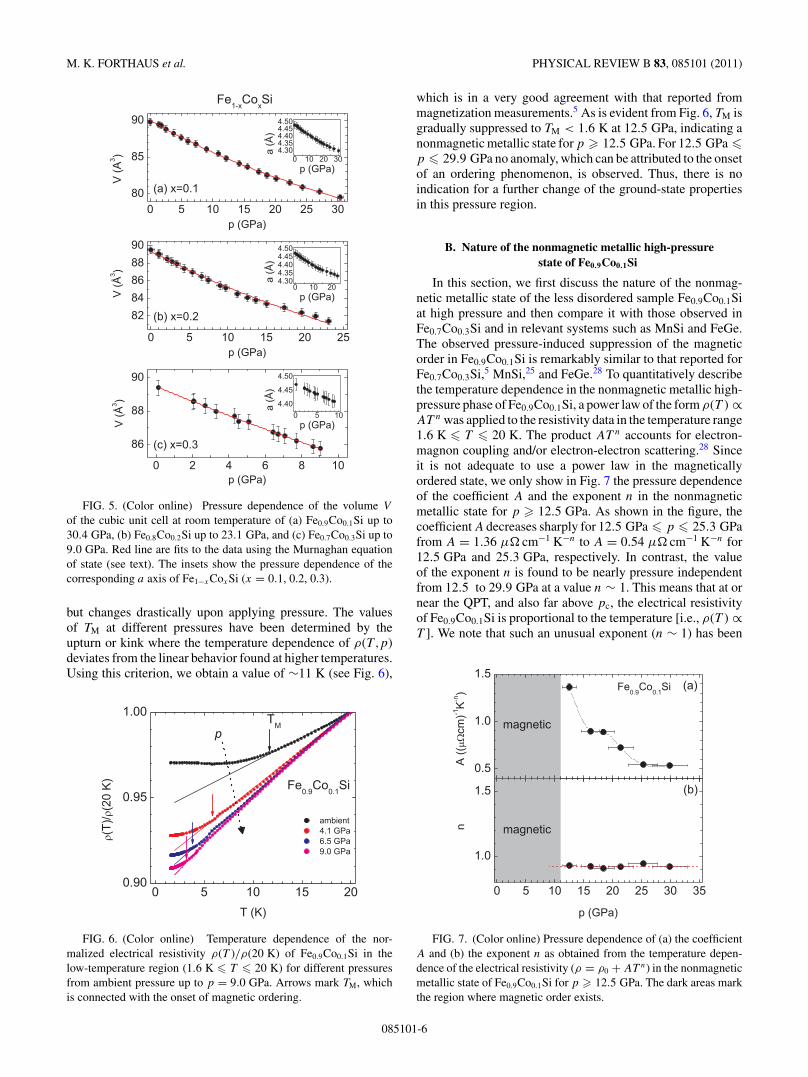
The lattice parameter a of the cubic unit cell of allFe1−xCoxSi samples was determined by using the (110),(111), (210), (211), and (321) reflections. As can be seenin the insets of Figs. 5(a)–5(c), the lattice parameter a ofall samples is reduced smoothly with increasing pressure,indicating no evidence for a structural phase transition. Thevalues of a at ambient pressure are 4.48 (2) A, 4.47,(2) A, and4.47 (2) A for the samples with x = 0.1, x = 0.2, and x = 0.3,respectively. The pressure dependence of the volume of the unitcell V = a3 shown in Figs. 5(a)–5(c) can be approximatedby the Murnaghan equation of state.39 The derived valuesof the bulk modulus B0 and its derivative with pressure B ′
0are B0 = 178 (5) GPa, 190 (4) GPa, and 197 (11) GPa andB ′
0 = 4.7 (4), 4.7 (fixed), and 3 (2), for x = 0.1, 0.2, and 0.3,respectively. There is a slight stiffening upon increasing Codoping.
IV. DISCUSSION
A. Quantum phase transition in Fe0.9Co0.1Si under pressure
As already mentioned in Sec. III B, the pressure dependenceof ρ(T ,p) suggests a pressure-induced magnetic to nonmag-netic transition in Fe0.9Co0.1Si and Fe0.8Co0.2Si. In this sectionwe first focus on the analysis of the pressure dependence of TM
and the nature of the high-pressure nonmagnetic state in thenearly ordered Fe0.9Co0.1Si sample (section IV A and IV B,respectively). We then compare the pressure dependence ofTM in all samples (x = 0.1, 0.2, 0.3) in Sec. IV C and finally
FIG. 4. (Color online) X-ray diffraction patterns of Fe1−xCoxSi(x = 0.1, 0.2, 0.3) at room temperature as obtained from energydispersive x-ray diffraction at beamline F3 (HASYLAB, Hamburg)using a diamond anvil cell setup. (a) Patterns of Fe0.9Co0.1Si for se-lected pressures up to 30 GPa recorded with Edhkl = 72.750 keV A.(b) Patterns of Fe0.8Co0.2Si for selected pressures up to 23.1 GParecorded with Edhkl = 73.247 keV A. The arrow marks the peakfrom the detector electronics, which remains pressure independent asdemonstrated by the dotted line. The asterisks mark the peaks fromthe gold pressure marker. (c) Patterns of Fe0.7Co0.3Si for selectedpressures up to 9.0 GPa recorded with Edhkl = 69.862 keV A. Thearrows mark the peaks from solid nitrogen in the cubic phase abovep ∼ 5 GPa, the asterisks mark the peaks from the gold pressuremarker. The high intensity of the peak at about 37 keV for 7.6 GParesults from the texture of the sample and is not observed at otherpressures.
discuss the origin of the stability of the ferromagnetic state inSec. IV D.
To understand the nature of the pressure-induced quantumphase transition in the Fe0.9Co0.1Si sample, we now considerthe temperature dependence of ρ(T ,p) in the low-temperatureregion below 20 K. The resistivity normalized to its value at20 K [ρ(T )/ρ(20 K)] for Fe0.9Co0.1Si is shown in Fig. 6 for1.6 K � T � 20 K from ambient pressure to p = 9.0 GPa. Ascan be seen in Fig. 6, the temperature coefficient αρ = ∂ρ/∂T
is positive, reflecting a metallic ground state of Fe0.9Co0.1Si,
085101-5
M. K. FORTHAUS et al. PHYSICAL REVIEW B 83, 085101 (2011)
FIG. 5. (Color online) Pressure dependence of the volume V
of the cubic unit cell at room temperature of (a) Fe0.9Co0.1Si up to30.4 GPa, (b) Fe0.8Co0.2Si up to 23.1 GPa, and (c) Fe0.7Co0.3Si up to9.0 GPa. Red line are fits to the data using the Murnaghan equationof state (see text). The insets show the pressure dependence of thecorresponding a axis of Fe1−xCoxSi (x = 0.1, 0.2, 0.3).
but changes drastically upon applying pressure. The valuesof TM at different pressures have been determined by theupturn or kink where the temperature dependence of ρ(T ,p)deviates from the linear behavior found at higher temperatures.Using this criterion, we obtain a value of ∼11 K (see Fig. 6),
FIG. 6. (Color online) Temperature dependence of the nor-malized electrical resistivity ρ(T )/ρ(20 K) of Fe0.9Co0.1Si in thelow-temperature region (1.6 K � T � 20 K) for different pressuresfrom ambient pressure up to p = 9.0 GPa. Arrows mark TM, whichis connected with the onset of magnetic ordering.
which is in a very good agreement with that reported frommagnetization measurements.5 As is evident from Fig. 6, TM isgradually suppressed to TM < 1.6 K at 12.5 GPa, indicating anonmagnetic metallic state for p � 12.5 GPa. For 12.5 GPa �p � 29.9 GPa no anomaly, which can be attributed to the onsetof an ordering phenomenon, is observed. Thus, there is noindication for a further change of the ground-state propertiesin this pressure region.
B. Nature of the nonmagnetic metallic high-pressurestate of Fe0.9Co0.1Si
In this section, we first discuss the nature of the nonmag-netic metallic state of the less disordered sample Fe0.9Co0.1Siat high pressure and then compare it with those observed inFe0.7Co0.3Si and in relevant systems such as MnSi and FeGe.The observed pressure-induced suppression of the magneticorder in Fe0.9Co0.1Si is remarkably similar to that reported forFe0.7Co0.3Si,5 MnSi,25 and FeGe.28 To quantitatively describethe temperature dependence in the nonmagnetic metallic high-pressure phase of Fe0.9Co0.1Si, a power law of the form ρ(T ) ∝AT n was applied to the resistivity data in the temperature range1.6 K � T � 20 K. The product AT n accounts for electron-magnon coupling and/or electron-electron scattering.28 Sinceit is not adequate to use a power law in the magneticallyordered state, we only show in Fig. 7 the pressure dependenceof the coefficient A and the exponent n in the nonmagneticmetallic state for p � 12.5 GPa. As shown in the figure, thecoefficient A decreases sharply for 12.5 GPa � p � 25.3 GPafrom A = 1.36 μ� cm−1 K−n to A = 0.54 μ� cm−1 K−n for12.5 GPa and 25.3 GPa, respectively. In contrast, the valueof the exponent n is found to be nearly pressure independentfrom 12.5 to 29.9 GPa at a value n ∼ 1. This means that at ornear the QPT, and also far above pc, the electrical resistivityof Fe0.9Co0.1Si is proportional to the temperature [i.e., ρ(T ) ∝T ]. We note that such an unusual exponent (n ∼ 1) has been
FIG. 7. (Color online) Pressure dependence of (a) the coefficientA and (b) the exponent n as obtained from the temperature depen-dence of the electrical resistivity (ρ = ρ0 + AT n) in the nonmagneticmetallic state of Fe0.9Co0.1Si for p � 12.5 GPa. The dark areas markthe region where magnetic order exists.
085101-6
PRESSURE-INDUCED QUANTUM PHASE TRANSITION IN . . . PHYSICAL REVIEW B 83, 085101 (2011)
also observed for Fe0.7Co0.3Si in the nonmagnetic metallicstate and is indicative of non-Fermi liquid behavior.5
The enhancement of A close to the QPT in Fe0.9Co0.1Si isalso found for both MnSi and FeGe.28 The high-pressure non-Fermi liquid regime in Fe0.9Co0.1Si persists up to pressuresof at least p ∼ 2.5pc, which is much higher than the criticalpressure where the QPT is located. A similar observation hasbeen reported in MnSi, where the non-Fermi liquid behavioralso survives up to much higher pressures than the criticalpressure (p ∼ 3pc).26,27 However, the unusual temperaturedependence of the electrical resistivity [ρ(T ) ∝ T ] found inFe1−xCoxSi for p � pc for x = 0.1 and x = 0.3 is clearlydistinct from the temperature dependence found both in MnSiand FeGe [ρ(T ) ∝ T 1.5] at low temperatures at or near theQPT28,40 and also different from what one would expectfrom the Hertz-Moriya-Millis spin fluctuation scenario.41–43
This points to a considerable difference in the nature of thehigh-pressure ground states of the Fe1−xCoxSi system andMnSi or FeGe. It has been proposed that disorder might be thereason for the unusual temperature dependence of ρ(T ) foundfor Fe0.7Co0.3Si.5 However, since this temperature dependenceis also found in nearly ordered Fe0.9Co0.1Si, the observednon-Fermi liquid behavior and its unusual exponent n is foundto be independent on the degree of disorder and seems to bean intrinsic property of Fe1−xCoxSi.
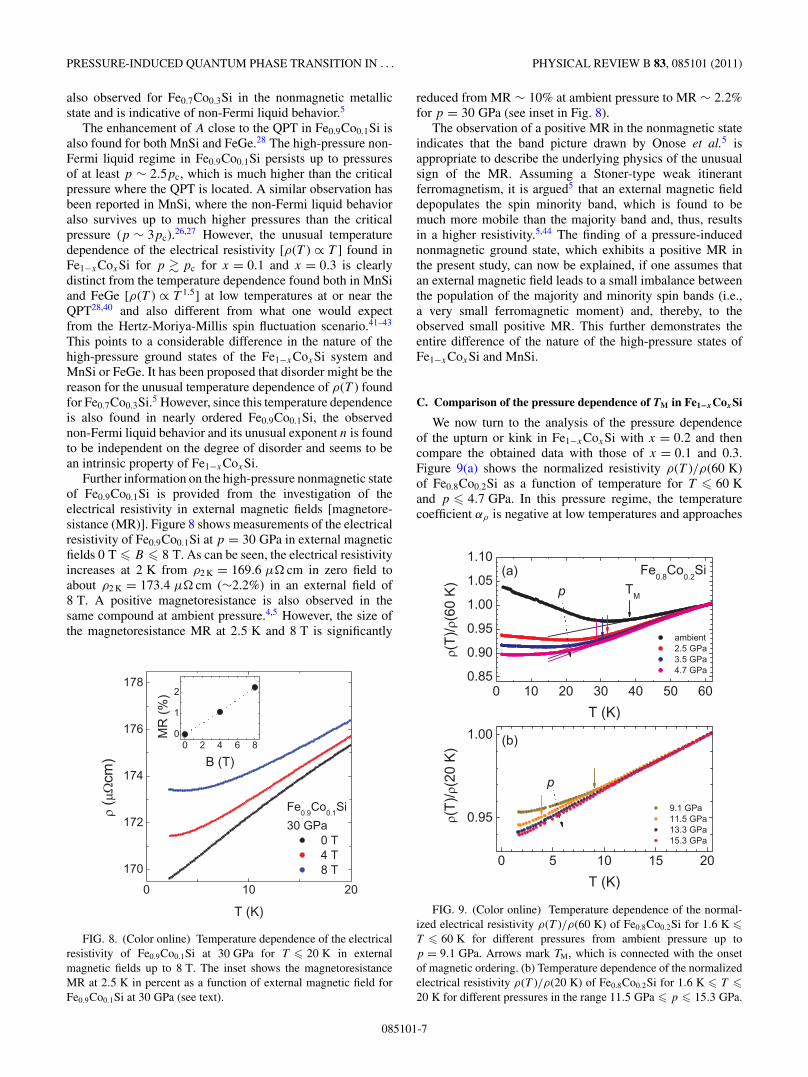
Further information on the high-pressure nonmagnetic stateof Fe0.9Co0.1Si is provided from the investigation of theelectrical resistivity in external magnetic fields [magnetore-sistance (MR)]. Figure 8 shows measurements of the electricalresistivity of Fe0.9Co0.1Si at p = 30 GPa in external magneticfields 0 T � B � 8 T. As can be seen, the electrical resistivityincreases at 2 K from ρ2 K = 169.6 μ� cm in zero field toabout ρ2 K = 173.4 μ� cm (∼2.2%) in an external field of8 T. A positive magnetoresistance is also observed in thesame compound at ambient pressure.4,5 However, the size ofthe magnetoresistance MR at 2.5 K and 8 T is significantly
FIG. 8. (Color online) Temperature dependence of the electricalresistivity of Fe0.9Co0.1Si at 30 GPa for T � 20 K in externalmagnetic fields up to 8 T. The inset shows the magnetoresistanceMR at 2.5 K in percent as a function of external magnetic field forFe0.9Co0.1Si at 30 GPa (see text).
reduced from MR ∼ 10% at ambient pressure to MR ∼ 2.2%for p = 30 GPa (see inset in Fig. 8).
The observation of a positive MR in the nonmagnetic stateindicates that the band picture drawn by Onose et al.5 isappropriate to describe the underlying physics of the unusualsign of the MR. Assuming a Stoner-type weak itinerantferromagnetism, it is argued5 that an external magnetic fielddepopulates the spin minority band, which is found to bemuch more mobile than the majority band and, thus, resultsin a higher resistivity.5,44 The finding of a pressure-inducednonmagnetic ground state, which exhibits a positive MR inthe present study, can now be explained, if one assumes thatan external magnetic field leads to a small imbalance betweenthe population of the majority and minority spin bands (i.e.,a very small ferromagnetic moment) and, thereby, to theobserved small positive MR. This further demonstrates theentire difference of the nature of the high-pressure states ofFe1−xCoxSi and MnSi.
C. Comparison of the pressure dependence of TM in Fe1−xCoxSi
We now turn to the analysis of the pressure dependenceof the upturn or kink in Fe1−xCoxSi with x = 0.2 and thencompare the obtained data with those of x = 0.1 and 0.3.Figure 9(a) shows the normalized resistivity ρ(T )/ρ(60 K)of Fe0.8Co0.2Si as a function of temperature for T � 60 Kand p � 4.7 GPa. In this pressure regime, the temperaturecoefficient αρ is negative at low temperatures and approaches
FIG. 9. (Color online) Temperature dependence of the normal-ized electrical resistivity ρ(T )/ρ(60 K) of Fe0.8Co0.2Si for 1.6 K �T � 60 K for different pressures from ambient pressure up top = 9.1 GPa. Arrows mark TM, which is connected with the onsetof magnetic ordering. (b) Temperature dependence of the normalizedelectrical resistivity ρ(T )/ρ(20 K) of Fe0.8Co0.2Si for 1.6 K � T �20 K for different pressures in the range 11.5 GPa � p � 15.3 GPa.
085101-7
M. K. FORTHAUS et al. PHYSICAL REVIEW B 83, 085101 (2011)
zero as p → 4.7 GPa. As indicated by the arrows, an upturnor kink at TM is visible where ferromagnetic ordering setsin (TC ∼ 32 K at ambient pressure). For pressures above9.1 GPa, αρ becomes positive, indicating a further suppressionof the magnetism as can be seen in Fig. 9(b), which displaysthe temperature dependence of the normalized resistivityρ(T )/ρ(20 K) for T � 20 K and 9.1 GPa � p � 15.3 GPa. Aclear sign of TM cannot be tracked anymore for p > 11.5 GPa.However, the ratio ρ(1.6 K)/ρ(20 K) further decreases withincreasing pressure up to p = 15.3 GPa. It should be notedhere that the signature of TM in Fe0.8Co0.2Si is much lesspronounced than in Fe0.9Co0.1Si. This can be an intrinsicproperty of the sample possibly due to the fact that Fe0.8Co0.2Siis expected to exhibit more disorder than Fe0.9Co0.1Si. It canalso be due to large pressure gradients and/or nonhydrostaticconditions in this particular high-pressure run.
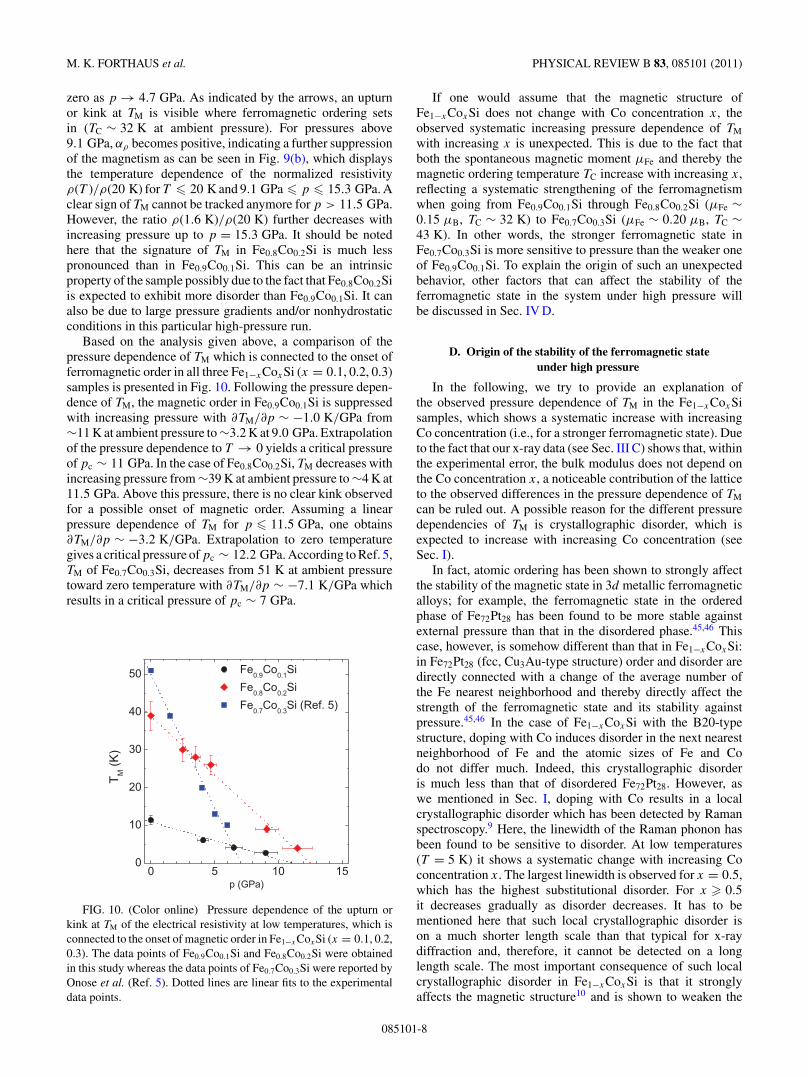
Based on the analysis given above, a comparison of thepressure dependence of TM which is connected to the onset offerromagnetic order in all three Fe1−xCoxSi (x = 0.1, 0.2, 0.3)samples is presented in Fig. 10. Following the pressure depen-dence of TM, the magnetic order in Fe0.9Co0.1Si is suppressedwith increasing pressure with ∂TM/∂p ∼ −1.0 K/GPa from∼11 K at ambient pressure to ∼3.2 K at 9.0 GPa. Extrapolationof the pressure dependence to T → 0 yields a critical pressureof pc ∼ 11 GPa. In the case of Fe0.8Co0.2Si, TM decreases withincreasing pressure from ∼39 K at ambient pressure to ∼4 K at11.5 GPa. Above this pressure, there is no clear kink observedfor a possible onset of magnetic order. Assuming a linearpressure dependence of TM for p � 11.5 GPa, one obtains∂TM/∂p ∼ −3.2 K/GPa. Extrapolation to zero temperaturegives a critical pressure of pc ∼ 12.2 GPa. According to Ref. 5,TM of Fe0.7Co0.3Si, decreases from 51 K at ambient pressuretoward zero temperature with ∂TM/∂p ∼ −7.1 K/GPa whichresults in a critical pressure of pc ∼ 7 GPa.
FIG. 10. (Color online) Pressure dependence of the upturn orkink at TM of the electrical resistivity at low temperatures, which isconnected to the onset of magnetic order in Fe1−xCoxSi (x = 0.1, 0.2,0.3). The data points of Fe0.9Co0.1Si and Fe0.8Co0.2Si were obtainedin this study whereas the data points of Fe0.7Co0.3Si were reported byOnose et al. (Ref. 5). Dotted lines are linear fits to the experimentaldata points.
If one would assume that the magnetic structure ofFe1−xCoxSi does not change with Co concentration x, theobserved systematic increasing pressure dependence of TM
with increasing x is unexpected. This is due to the fact thatboth the spontaneous magnetic moment μFe and thereby themagnetic ordering temperature TC increase with increasing x,reflecting a systematic strengthening of the ferromagnetismwhen going from Fe0.9Co0.1Si through Fe0.8Co0.2Si (μFe ∼0.15 μB, TC ∼ 32 K) to Fe0.7Co0.3Si (μFe ∼ 0.20 μB, TC ∼43 K). In other words, the stronger ferromagnetic state inFe0.7Co0.3Si is more sensitive to pressure than the weaker oneof Fe0.9Co0.1Si. To explain the origin of such an unexpectedbehavior, other factors that can affect the stability of theferromagnetic state in the system under high pressure willbe discussed in Sec. IV D.
D. Origin of the stability of the ferromagnetic stateunder high pressure
In the following, we try to provide an explanation ofthe observed pressure dependence of TM in the Fe1−xCoxSisamples, which shows a systematic increase with increasingCo concentration (i.e., for a stronger ferromagnetic state). Dueto the fact that our x-ray data (see Sec. III C) shows that, withinthe experimental error, the bulk modulus does not depend onthe Co concentration x, a noticeable contribution of the latticeto the observed differences in the pressure dependence of TM
can be ruled out. A possible reason for the different pressuredependencies of TM is crystallographic disorder, which isexpected to increase with increasing Co concentration (seeSec. I).
In fact, atomic ordering has been shown to strongly affectthe stability of the magnetic state in 3d metallic ferromagneticalloys; for example, the ferromagnetic state in the orderedphase of Fe72Pt28 has been found to be more stable againstexternal pressure than that in the disordered phase.45,46 Thiscase, however, is somehow different than that in Fe1−xCoxSi:in Fe72Pt28 (fcc, Cu3Au-type structure) order and disorder aredirectly connected with a change of the average number ofthe Fe nearest neighborhood and thereby directly affect thestrength of the ferromagnetic state and its stability againstpressure.45,46 In the case of Fe1−xCoxSi with the B20-typestructure, doping with Co induces disorder in the next nearestneighborhood of Fe and the atomic sizes of Fe and Codo not differ much. Indeed, this crystallographic disorderis much less than that of disordered Fe72Pt28. However, aswe mentioned in Sec. I, doping with Co results in a localcrystallographic disorder which has been detected by Ramanspectroscopy.9 Here, the linewidth of the Raman phonon hasbeen found to be sensitive to disorder. At low temperatures(T = 5 K) it shows a systematic change with increasing Coconcentration x. The largest linewidth is observed for x = 0.5,which has the highest substitutional disorder. For x � 0.5it decreases gradually as disorder decreases. It has to bementioned here that such local crystallographic disorder ison a much shorter length scale than that typical for x-raydiffraction and, therefore, it cannot be detected on a longlength scale. The most important consequence of such localcrystallographic disorder in Fe1−xCoxSi is that it stronglyaffects the magnetic structure10 and is shown to weaken the
085101-8
PRESSURE-INDUCED QUANTUM PHASE TRANSITION IN . . . PHYSICAL REVIEW B 83, 085101 (2011)
polarization of the ferromagnetic half-metallic state for x >
0.25.6 In the following, we would like to relate the observedpressure dependence of TM for the different concentrations to acorresponding change of the magnetic structure and characterof the ferromagnetic half-metallic state.
Regarding the magnetic structure of Fe1−xCoxSi, it has beenshown that, for small concentrations x � 0.15, the helix axis isnearly oriented along the 〈100〉 direction due to the anisotropicexchange. However, the anisotropy of the system decreaseswith increasing Co concentration for x � 0.2 and results in adistribution of the helix wave vector. This distribution has beenshown to be random for high Co concentration (x = 0.5).10
On the other hand, ab initio calculations on Fe1−xCoxSirevealed that such local disorder at concentrations abovex > 0.25 is responsible for the decrease of the polarizationof the ferromagnetic half-metallic state. This has been shownto be reflected in the deviation of the linear dependence ofthe magnetic moment on the concentration for x > 0.25.6
Thus, at high concentrations, local disorder causes a decreaseof the anisotropic exchange and weakens the character ofthe ferromagnetic half-metallic state. We thus would expectthat the ferromagnetic state at low concentrations (x = 0.1)is more robust against pressure than the state with higherconcentrations (x = 0.2 and 0.3). This scenario can explainthe observed decrease of the stability of the ferromagneticstate under pressure as Co concentration increases. Indeed, thesample with the lowest local disorder (x = 0.1) reveals thesmallest pressure dependence of TM; that is, a higher stabilityof the ferromagnetic state when compared to that observed forthe sample with higher concentrations (x = 0.3). This findingis consistent with the above mentioned neutron diffractionstudies10 and ab initio calculations6 on Fe1−xCoxSi, whichshow that the strength of the anisotropic exchange and thecharacter of the half-metallic state remain unchanged for Coconcentrations below x � 0.15 and x � 0.25, respectively. Incontrast, as the Co concentration exceeds these values, boththe anisotropic exchange and the half-metallic character willbe modified and result in an instability of the ferromagneticstate. This can explain our observation of a larger pressure-induced decrease of TM for x = 0.3 than that for x = 0.1and 0.2. In the sample with x = 0.3, the instability of theferromagnetic state originates from a decrease of both theanisotropic exchange and the half-metallic character. Botheffects lead to the observed largest pressure dependence ofTM. The situation is different for the sample with x = 0.2.This is because, for concentrations x � 0.25, local disorderdoes not affect the half-metallic nature of the system.6 In sucha case (x = 0.2) the stability of the ferromagnetic state can beonly affected by a corresponding decrease of the anisotropicexchange and thus exhibits a smaller pressure dependence ofTM compared to that observed for the sample with x = 0.3. Inthis respect we would like to mention that the relative decreaseof TM with pressure ( 1
TM
∂TM∂p
) for the sample with x = 0.2
( 1TM
∂TM∂p
∼ 0.08 GPa−1) is comparable with that of the samplewith x = 0.1 (∼0.09/GPa) while the relative decrease of thesample with x = 0.3 is noticeably larger (∼0.14/GPa). Thissuggests that the character of the half-metallic state is thedominating factor for the observed differences of the pressuredependence of TM in the doped samples.
V. SUMMARY
The aim of the present high-pressure study was to inves-tigate the pressure-induced quantum phase transitions (QPT)in ferromagnetic Fe0.9Co0.1Si (TC ∼ 11 K) and Fe0.8Co0.2Si(TC ∼ 32 K). This was motivated by the recently observedpressure-induced QPT in Fe0.7Co0.3Si (TC ∼ 43 K) and theassociated unusual temperature dependence of the electricalresistivity [ρ(T ) ∝ T ] near the QPT,5 suggested to be at-tributed to the atomic disorder of the sample. Since the sampleswith x = 0.1 and x = 0.2 are much less disordered, thepresent investigation should help establish whether disorderis responsible for the observed unusual ρ(T ) ∝ T behaviornear the QPT.
To explore the magnetic ground state at ambient pressureof the investigated samples (x = 0.1, 0.2, and 0.3) at amicroscopic level, we have applied 57Fe Mossbauer-effectspectroscopy. The results of the Mossbauer data revealedthat the concentration dependence of the average magnetichyperfine field at the 57Fe nucleus is proportional to thecorresponding change of the macroscopic magnetic moment.Further analysis of the Mossbauer-effect data indicate thatthe onset of magnetic order in Fe1−xCoxSi is for x � 0.05,which is consistent with previous reports from magnetizationmeasurements.4,5
High-pressure resistivity measurements up to 30 GPa and15 GPa for Fe0.9Co0.1Si and Fe0.8Co0.2Si, respectively, re-vealed in both samples a gradual suppression of the ferro-magnetic state to a QPT at pressures of p ∼ 11 GPa andp ∼ 12 GPa, respectively. Energy dispersive x-ray diffractionmeasurements on Fe1−xCoxSi (x = 0.1, 0.2, 0.3) indicatedthat the observed QPT are not connected with a structuralphase transition. A comparison of the critical pressure forthe QPT in the three samples indicates that the stabilityof the ferromagnetic state decreases with increasing Coconcentration.
The analysis of all experimental results led to the followingconclusions: The suppression of the ferromagnetic state isnot related to a structural instability of the samples butrather strongly coupled to their different degree of localcrystallographic disorder. However, in the pressure-inducednonmagnetic metallic state, local crystallographic disorderdoes not seem to affect the observed non-Fermi liquid be-havior with ρ(T ) ∝ T . This clearly indicates that the unusualbehavior (exponent n ∼ 1) is not due to the existence of localcrystallographic disorder but is characteristic of the metallichigh-pressure state of Fe1−xCoxSi with x = 0.1, 0.2, 0.3 nearand beyond the QPT. The observed positive magnetoresistancein the high-pressure state of Fe0.9Co0.1Si could be attributedto a slight field-induced modification of the spin majority andminority bands which leads to a very small magnetic moment.
ACKNOWLEDGMENTS
This work was financially supported by the DeutscheForschungsgemeinschaft (DFG) through SFB 608 and a jointproject of DFG and the South African National ResearchFoundation (NRF). M.K.F. and M.M.A. thank A. Rosch andE. Bauer for fruitful discussions.
085101-9
M. K. FORTHAUS et al. PHYSICAL REVIEW B 83, 085101 (2011)
1M. A. Chernikov, L. Degiorgi, E. Felder, S. Paschen, A. D. Bianchi,H. R. Ott, J. L. Sarrao, Z. Fisk, and D. Mandrus, Phys. Rev. B 56,1366 (1997).
2J. Beille, J. Voiron, F. Towfiq, M. Roth, and Z. Y. Zhang, J. Phys.F: Metal Phys. 11, 2153 (1981).
3J. Beille, J. Voiron, and M. Roth, Solid State Commun. 47, 399(1983).
4N. Manyala, Y. Sidis, J. F. DiTusa, G. Aeppli, D. P. Young, andZ. Fisk, Nature (London) 404, 581 (2000).
5Y. Onose, N. Takeshita, C. Terakura, H. Takagi, and Y. Tokura,Phys. Rev. B 72, 224431 (2005).
6J. Guevara, V. Vildosola, J. Milano, and A. M. Llois, Phys. Rev. B69, 184422 (2004).
7F. P. Mena, J. F. DiTusa, D. van der Marel, G. Aeppli, D. P.Young, A. Damascelli, and J. A. Mydosh, Phys. Rev. B 73, 085205(2006).
8D. Menzel, P. Popovich, N. N. Kovaleva, J. Schoenes, K. Doll, andA. V. Boris, Phys. Rev. B 79, 165111 (2009).
9A.-M. Racu, D. Menzel, J. Schoenes, and K. Doll, Phys. Rev. B 76,115103 (2007).
10S. V. Grigoriev, V. A. Dyadkin, D. Menzel, J. Schoenes, Y. O.Chetverikov, A. I. Okorokov, H. Eckerlebe, and S. V. Maleyev,Phys. Rev. B 76, 224424 (2007).
11V. Jaccarino, G. K. Wertheim, J. H. Wernick, L. R. Walker, andS. Arajs, Phys. Rev. 160, 476 (1967).
12B. Buschinger, C. Geibel, F. Steglich, D. Mandrus, D. Young, J. L.Sarrao, and Z. Fisk, Physica B 230-232, 784 (1997).
13Z. Schlesinger, Z. Fisk, H.-T. Zhang, M. B. Maple, J. F. DiTusa,and G. Aeppli, Phys. Rev. Lett. 71, 1748 (1993).
14A. Damascelli, K. Schulte, D. van der Marel, and A. A. Menovsky,Phys. Rev. B 55, R4863 (1997).
15H. Watanabe, H. Yamamoto, and K. Ito, J. Phys. Soc. Jpn. 18, 995(1963).
16G. K. Wertheim, V. Jaccarino, J. H. Wernick, J. A. Seitchik, H. J.Williams, and R. C. Sherwood, Phys. Lett. 18, 89 (1965).
17G. Aeppli and Z. Fisk, Comments Condens. Matter Phys. 16, 155(1992).
18D. Zur, D. Menzel, I. Jursic, J. Schoenes, L. Patthey, M. Neef,K. Doll, and G. Zwicknagl, Phys. Rev. B 75, 165103 (2007).
19M. Klein, D. Zur, D. Menzel, J. Schoenes, K. Doll, J. Roder, andF. Reinert, Phys. Rev. Lett. 101, 046406 (2008).
20M. Klein, D. Menzel, K. Doll, M. Neef, D. Zur, I. Jursic,J. Schoenes, and F. Reinert, New J. Phys. 11, 23026 (2009).
21Y. Ishikawa, K. Tajima, D. Bloch, and M. Roth, Solid StateCommun. 19, 525 (1976).
22M. Ishida, Y. Endoh, S. Mitsuda, Y. Ishikawa, and M. Tanaka,J. Phys. Soc. Jpn. 54, 2975 (1985).
23L. Lundgren, O. Beckman, V. Attia, S. P. Bhattacherjee, andM. Richardson, Phys. Scr. 1, 69 (1970).
24B. Lebech, J. Bernhard, and T. Freltoft, J. Phys. Condens. Matter 1,6510 (1989).
25C. Pfleiderer, G. J. McMullan, S. R. Julian, and G. G. Lonzarich,Phys. Rev. B 55, 8330 (1997).
26N. Doiron-Leyraud, I. R. Walker, L. Taillefer, M. J. Steiner, S. R.Julian, and G. G. Lonzarich, Nature (London) 425, 595 (2003).
27P. Pedrazzini, D. Jaccard, G. Lapertot, J. Flouquet, Y. Inada,H. Kohara, and Y. Onuki, Physica B 378-380, 165 (2006).
28P. Pedrazzini, H. Wilhelm, D. Jaccard, T. Jarlborg, M. Schmidt,M. Hanfland, L. Akselrud, H. Q. Yuan, U. Schwarz, Y. Grin, and F.Steglich, Phys. Rev. Lett. 98, 047204 (2007).
29K. Syassen, High Press. Res. 28, 75 (2008).30R. Boehler and K. De Hantsetters, High Pressure Res. 24, 391
(2004).31D. L. Heinz and R. Jeanloz, J. Appl. Phys. 55, 885 (1984).32F. Porsch, EDXPowd 3.155, Windows Version, RTI GmbH Pader-
born, Germany (1996).33G. K. Wertheim, J. H. Wernick, and D. N. E. Buchanan, J. Appl.
Phys. 37, 3333 (1966).34N. Blaes, H. Fisher, and U. Gonser, Nucl. Instrum. Methods B 9,
201 (1985).35M. Fanciulli, A. Zenkevich, I. Wenneker, A. Svane, N. E.
Christensen, and G. Weyer, Phys. Rev. B 54, 15985 (1996).36R. A. Brand, WinNormos-for-Igor Users Manual, WissEl GmbH,
Starnberg (Universitat Duisburg, Duisburg, 2006).37A. Mani, A. Bharathi, and Y. Hariharan, Phys. Rev. B 63, 115103
(2001).38R. L. Mills, B. Olinger, and D. T. Cromer, J. Chem. Phys. 84, 2837
(1986).39F. D. Murnaghan, Am. J. Math. 59, 235 (1937).40C. Pfleiderer, D. Reznik, L. Pintschovius, H. v. Lohneysen,
M. Garst, and A. Rosch, Nature (London) 427, 227 (2004).41J. A. Hertz, Phys. Rev. B 14, 1165 (1976).42T. Moriya, Spin Fluctuations in Itinerant Electron Magnetism
(Springer, Berlin, 1985).43A. J. Millis, Phys. Rev. B 48, 7183 (1993).44K. Ishimoto, M. Ohashi, H. Yamauchi, and Y. Yamaguchi, J. Phys.
Soc. Jpn. 61, 2503 (1992).45M. M. Abd-Elmeguid and H. Micklitz, Physica B: Condensed
Matter 163, 412 (1990).46M. M. Abd-Elmeguid, Nucl. Instrum. Methods B 76, 159 (1993).
085101-10
Related Documents