Pressure distribution on the frontal disk for turbulent flows in a radial diffuser José Luiz Gasche ⇑ , Danilo Martins Arantes, Thiago Andreotti Department of Mechanical Engineering, College at Ilha Solteira, State University of São Paulo, Ilha Solteira, Av. Brasil Centro, 56, Postal Code 15385-000, SP, Brazil article info Article history: Received 22 May 2014 Received in revised form 31 August 2014 Accepted 6 October 2014 Available online 17 October 2014 Keywords: Radial diffuser Frontal disk Pressure distribution Compressor valve abstract The radial diffuser has been used as a basic geometry to study several mechanical devices like thrust bearings, aerosol impactors, artificial heart valves, and refrigeration compressor valves. Experimental results for the pressure distribution on the frontal disk are essential for valve designers because they can provide the force acting on the valve. However, the measurement of this pressure requires a precise procedure, because the flow is highly sensitive to the distance between the frontal disk and the back disk. The main purpose of this work is to provide experimental results for the pressure distribution on the frontal disk of a radial diffuser with a new diameter ratio of 1.5, by using a new technique (an optical sensor) to measure the distance between the disks. A wide range of operation conditions were considered. Pressure distributions were measured for Reynolds number varying from 3,000 to 20,000, considering dimensionless distance between the disks in the range of 0.01–0.09. The results showed very good repeatability with small uncertainties and can be used for validating numerical codes developed to solve the flow through real refrigeration compressor valves. Ó 2014 Elsevier Inc. All rights reserved. 1. Introduction The radial diffuser has been used as a basic geometry to study several mechanical devices like thrust bearings, aerosol impactors, and artificial heart valves. Of particular interest to the authors of this paper is the modelling of refrigeration compressor valves. A radial diffuser is shown in Fig. 1. It is composed of two concentric and parallel disks, one of which is a frontal disk, the other being a back disk with a concentric orifice. When it is used to model com- pressor valves, the frontal disk represents the valve reed and the back disk represents the valve seat. The fluid flows axially through the feeding orifice, which has a diameter, d. It is then deflected by the frontal disk, which has diameter, D, and then flows radially through the gap, which is formed between the frontal disk and the back disk. This is known as the radial diffusor and has a height, s. Several studies have been carried out to characterize the main features of the flow through the valve, specially using the radial diffuser as a valve model. Numerical solutions for incompressible laminar flows [1–6] and for incompressible turbulent flows [7,8] have been performed. Experimental work on this subject has been accomplished by Wark and Foss [9], Ferreira and Driessen [10], Tabatabai and Pollard [11], Ervin et al. [12], Gasche et al. [13], and Souto [14]. Especially related to this work is the investigation carried out by Ferreira et al. [4], in which the pressure profile along the frontal disk has been measured for a radial diffuser having diameter ratio D/d = 3, for Reynolds number varying from about 700 to 2800, and dimensionless distance between the disks, s/d, approximately equal to 0.01 and 0.02. The authors state that the measurement of the pressure distribution along the frontal disk for small distances between the disks requires very careful procedures, especially because of the high sensitivity of the flow with respect to the geometric parameters of the problem, specifically the dis- tance between the disks. Pressure distribution on the frontal disk for D/d = 3 and D/ d = 1.66, for Reynolds number equal to 14,000 has been measured by Souto and Deschamps [15], using the same experimental appa- ratus used by Ferreira et al. [4]. In this experimental apparatus, the distance between the disks is adjusted by using a stainless sphere as reference. The sphere is carefully passed by the experimenter through the gap between the disks and, by feeling the friction force acting on the sphere surface, the experimenter can define a reference distance between both disks. Taking this distance as ref- erence, the desired position of the frontal disk is adjusted by using a micrometric table. As the sphere sliding process depends on the http://dx.doi.org/10.1016/j.expthermflusci.2014.10.005 0894-1777/Ó 2014 Elsevier Inc. All rights reserved. ⇑ Corresponding author. Tel.: +55 18 3743 1035; fax: +55 18 3742 2992. E-mail addresses: [email protected] (J.L. Gasche), arantes.danilo@yahoo. com.br (D.M. Arantes), [email protected] (T. Andreotti). Experimental Thermal and Fluid Science 60 (2015) 317–327 Contents lists available at ScienceDirect Experimental Thermal and Fluid Science journal homepage: www.elsevier.com/locate/etfs

Welcome message from author
This document is posted to help you gain knowledge. Please leave a comment to let me know what you think about it! Share it to your friends and learn new things together.
Transcript
Experimental Thermal and Fluid Science 60 (2015) 317–327
Contents lists available at ScienceDirect
Experimental Thermal and Fluid Science
journal homepage: www.elsevier .com/locate /et fs
Pressure distribution on the frontal disk for turbulent flows in a radialdiffuser
http://dx.doi.org/10.1016/j.expthermflusci.2014.10.0050894-1777/� 2014 Elsevier Inc. All rights reserved.
⇑ Corresponding author. Tel.: +55 18 3743 1035; fax: +55 18 3742 2992.E-mail addresses: [email protected] (J.L. Gasche), arantes.danilo@yahoo.
com.br (D.M. Arantes), [email protected] (T. Andreotti).
José Luiz Gasche ⇑, Danilo Martins Arantes, Thiago AndreottiDepartment of Mechanical Engineering, College at Ilha Solteira, State University of São Paulo, Ilha Solteira, Av. Brasil Centro, 56, Postal Code 15385-000, SP, Brazil
a r t i c l e i n f o
Article history:Received 22 May 2014Received in revised form 31 August 2014Accepted 6 October 2014Available online 17 October 2014
Keywords:Radial diffuserFrontal diskPressure distributionCompressor valve
a b s t r a c t
The radial diffuser has been used as a basic geometry to study several mechanical devices like thrustbearings, aerosol impactors, artificial heart valves, and refrigeration compressor valves. Experimentalresults for the pressure distribution on the frontal disk are essential for valve designers because theycan provide the force acting on the valve. However, the measurement of this pressure requires a preciseprocedure, because the flow is highly sensitive to the distance between the frontal disk and the back disk.The main purpose of this work is to provide experimental results for the pressure distribution on thefrontal disk of a radial diffuser with a new diameter ratio of 1.5, by using a new technique (an opticalsensor) to measure the distance between the disks. A wide range of operation conditions wereconsidered. Pressure distributions were measured for Reynolds number varying from 3,000 to 20,000,considering dimensionless distance between the disks in the range of 0.01–0.09. The results showed verygood repeatability with small uncertainties and can be used for validating numerical codes developed tosolve the flow through real refrigeration compressor valves.
� 2014 Elsevier Inc. All rights reserved.
1. Introduction
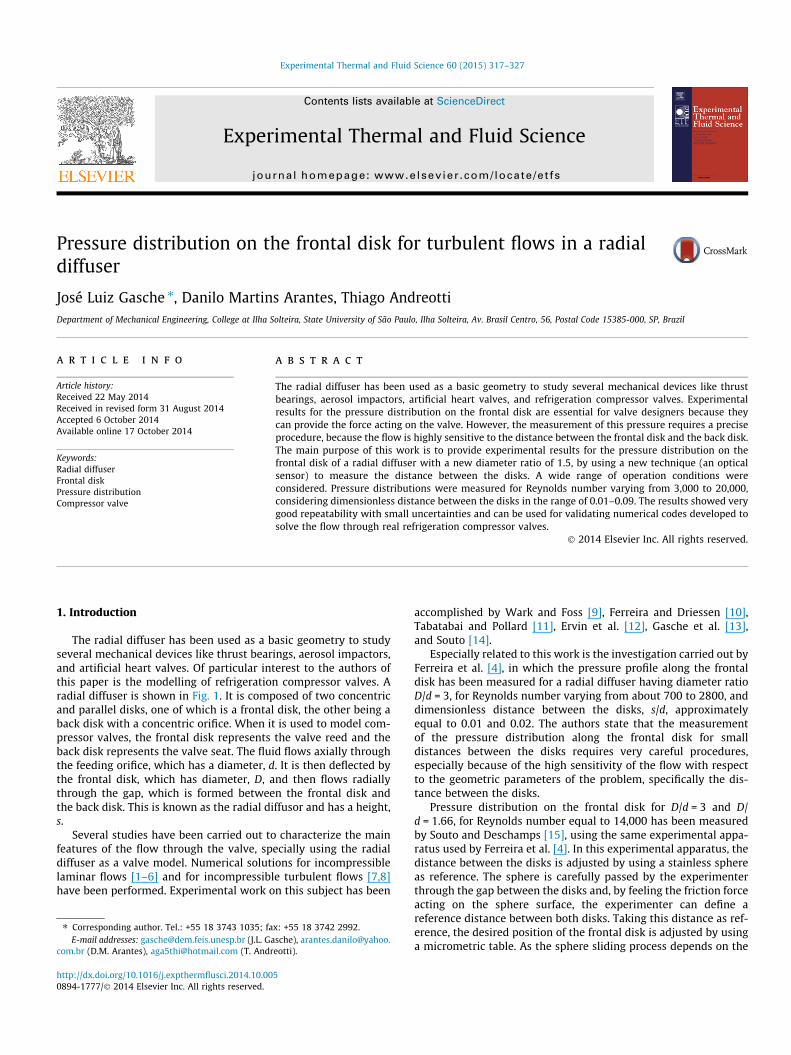
The radial diffuser has been used as a basic geometry to studyseveral mechanical devices like thrust bearings, aerosol impactors,and artificial heart valves. Of particular interest to the authors ofthis paper is the modelling of refrigeration compressor valves. Aradial diffuser is shown in Fig. 1. It is composed of two concentricand parallel disks, one of which is a frontal disk, the other being aback disk with a concentric orifice. When it is used to model com-pressor valves, the frontal disk represents the valve reed and theback disk represents the valve seat. The fluid flows axially throughthe feeding orifice, which has a diameter, d. It is then deflected bythe frontal disk, which has diameter, D, and then flows radiallythrough the gap, which is formed between the frontal disk andthe back disk. This is known as the radial diffusor and has a height,s.
Several studies have been carried out to characterize the mainfeatures of the flow through the valve, specially using the radialdiffuser as a valve model. Numerical solutions for incompressiblelaminar flows [1–6] and for incompressible turbulent flows [7,8]have been performed. Experimental work on this subject has been
accomplished by Wark and Foss [9], Ferreira and Driessen [10],Tabatabai and Pollard [11], Ervin et al. [12], Gasche et al. [13],and Souto [14].
Especially related to this work is the investigation carried out byFerreira et al. [4], in which the pressure profile along the frontaldisk has been measured for a radial diffuser having diameter ratioD/d = 3, for Reynolds number varying from about 700 to 2800, anddimensionless distance between the disks, s/d, approximatelyequal to 0.01 and 0.02. The authors state that the measurementof the pressure distribution along the frontal disk for smalldistances between the disks requires very careful procedures,especially because of the high sensitivity of the flow with respectto the geometric parameters of the problem, specifically the dis-tance between the disks.
Pressure distribution on the frontal disk for D/d = 3 and D/d = 1.66, for Reynolds number equal to 14,000 has been measuredby Souto and Deschamps [15], using the same experimental appa-ratus used by Ferreira et al. [4]. In this experimental apparatus, thedistance between the disks is adjusted by using a stainless sphereas reference. The sphere is carefully passed by the experimenterthrough the gap between the disks and, by feeling the friction forceacting on the sphere surface, the experimenter can define areference distance between both disks. Taking this distance as ref-erence, the desired position of the frontal disk is adjusted by usinga micrometric table. As the sphere sliding process depends on the
Nomenclature
a maximum deviation of a measurand in relation to itsaverage value
d orifice internal diameter (m)D frontal disk diameter (m)_m mass flow rate (kg s�1)
r radial position of the tap hole (m)Re Reynolds number (dimensionless)s distance between the frontal disk and the back disk (m)T Temperature (�C)u uncertaintyV average velocity (m s�1)x frontal disk adjustment distance (m)
Greek Lettersl dynamic viscosity (Pa s)q density (kg m�3)
SubscriptsA uncertainty Type AB uncertainty Type B
318 J.L. Gasche et al. / Experimental Thermal and Fluid Science 60 (2015) 317–327
sensitivity of the experimenter, this procedure can increase theuncertainty of the measurement of the distance between the disks.
The characteristics of flow through the radial diffuser essen-tially depend on the diameter ratio, mass flow rate, and especiallythe distance between the disks [4]. The flow is very complex due tothe presence of flow separation and reattachment, recirculatingregions, large and small edges, and adverse pressure gradient.These flow features are challenges to be overcome by researcherstrying to simulate the flow using computational fluid dynamicstools. In order to develop robust computational codes to solve thistype of flow, researchers need accurate experimental results tovalidate their results. As the distance between the disks is the mostimportant parameter affecting the flow, it is essential to measure itas accurately as possible.
The main purpose of this work is to provide accurate experi-mental results for pressure distributions on the frontal disk of aradial diffuser with a new diameter ratio of 1.5 by using a newtechnique (an optical sensor) to measure the distance betweenthe disks. A wider range of operation conditions are covered: thepressure distribution was measured for Reynolds number varyingfrom 3,000 to 20,000 and the dimensionless distance betweenthe disks was varied in the range of 0.01–0.09. The main reasonfor providing these results is that they can be used for validatingnumerical codes developed to solve the flow through real refriger-ation compressor valves.
2. Experimental apparatus
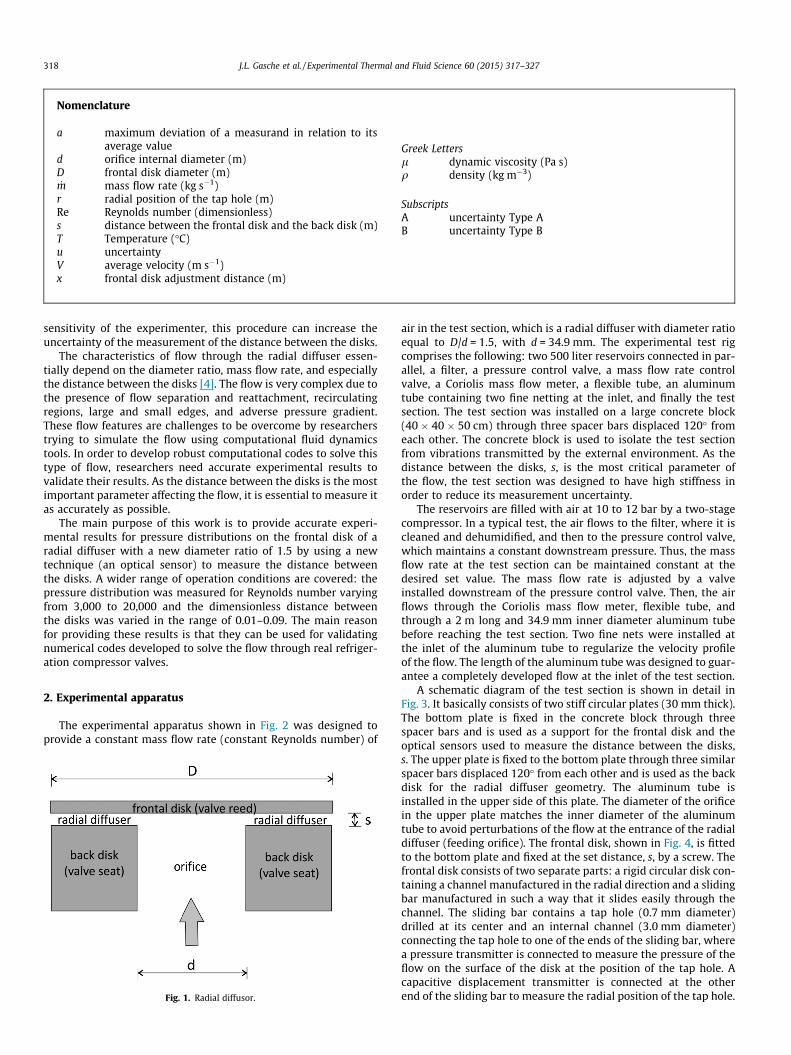
The experimental apparatus shown in Fig. 2 was designed toprovide a constant mass flow rate (constant Reynolds number) of
Fig. 1. Radial diffusor.
air in the test section, which is a radial diffuser with diameter ratioequal to D/d = 1.5, with d = 34.9 mm. The experimental test rigcomprises the following: two 500 liter reservoirs connected in par-allel, a filter, a pressure control valve, a mass flow rate controlvalve, a Coriolis mass flow meter, a flexible tube, an aluminumtube containing two fine netting at the inlet, and finally the testsection. The test section was installed on a large concrete block(40 � 40 � 50 cm) through three spacer bars displaced 120� fromeach other. The concrete block is used to isolate the test sectionfrom vibrations transmitted by the external environment. As thedistance between the disks, s, is the most critical parameter ofthe flow, the test section was designed to have high stiffness inorder to reduce its measurement uncertainty.
The reservoirs are filled with air at 10 to 12 bar by a two-stagecompressor. In a typical test, the air flows to the filter, where it iscleaned and dehumidified, and then to the pressure control valve,which maintains a constant downstream pressure. Thus, the massflow rate at the test section can be maintained constant at thedesired set value. The mass flow rate is adjusted by a valveinstalled downstream of the pressure control valve. Then, the airflows through the Coriolis mass flow meter, flexible tube, andthrough a 2 m long and 34.9 mm inner diameter aluminum tubebefore reaching the test section. Two fine nets were installed atthe inlet of the aluminum tube to regularize the velocity profileof the flow. The length of the aluminum tube was designed to guar-antee a completely developed flow at the inlet of the test section.
A schematic diagram of the test section is shown in detail inFig. 3. It basically consists of two stiff circular plates (30 mm thick).The bottom plate is fixed in the concrete block through threespacer bars and is used as a support for the frontal disk and theoptical sensors used to measure the distance between the disks,s. The upper plate is fixed to the bottom plate through three similarspacer bars displaced 120� from each other and is used as the backdisk for the radial diffuser geometry. The aluminum tube isinstalled in the upper side of this plate. The diameter of the orificein the upper plate matches the inner diameter of the aluminumtube to avoid perturbations of the flow at the entrance of the radialdiffuser (feeding orifice). The frontal disk, shown in Fig. 4, is fittedto the bottom plate and fixed at the set distance, s, by a screw. Thefrontal disk consists of two separate parts: a rigid circular disk con-taining a channel manufactured in the radial direction and a slidingbar manufactured in such a way that it slides easily through thechannel. The sliding bar contains a tap hole (0.7 mm diameter)drilled at its center and an internal channel (3.0 mm diameter)connecting the tap hole to one of the ends of the sliding bar, wherea pressure transmitter is connected to measure the pressure of theflow on the surface of the disk at the position of the tap hole. Acapacitive displacement transmitter is connected at the otherend of the sliding bar to measure the radial position of the tap hole.
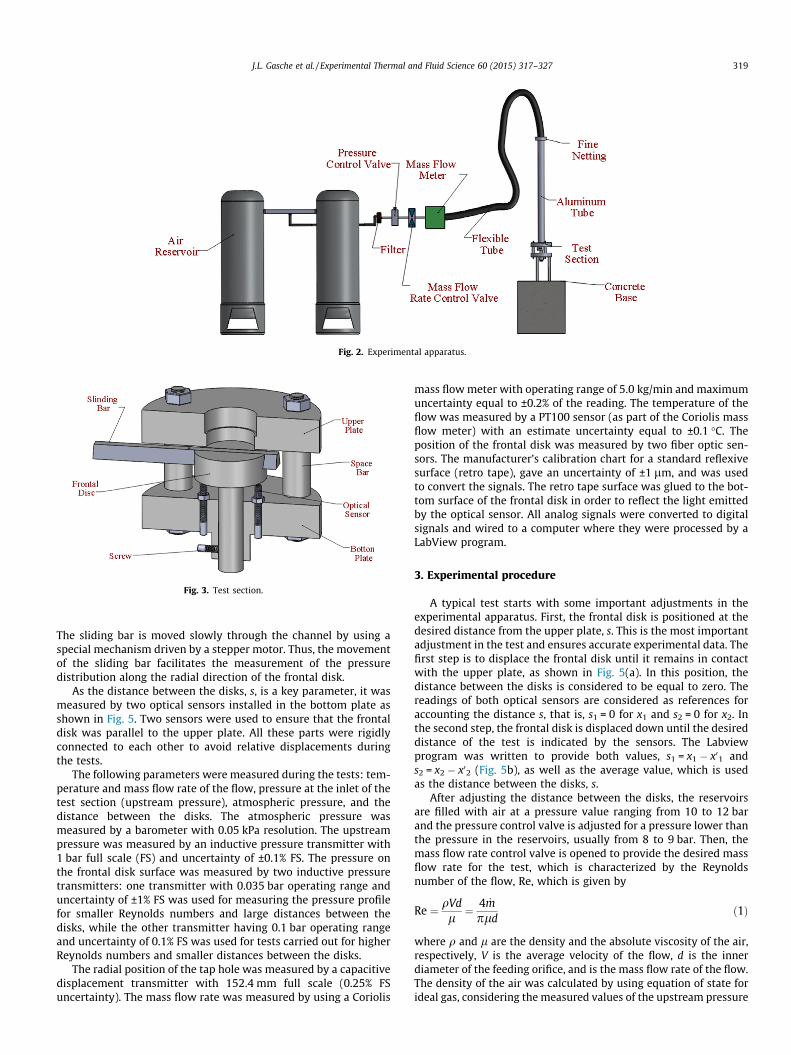
Fig. 2. Experimental apparatus.
Fig. 3. Test section.
J.L. Gasche et al. / Experimental Thermal and Fluid Science 60 (2015) 317–327 319
The sliding bar is moved slowly through the channel by using aspecial mechanism driven by a stepper motor. Thus, the movementof the sliding bar facilitates the measurement of the pressuredistribution along the radial direction of the frontal disk.
As the distance between the disks, s, is a key parameter, it wasmeasured by two optical sensors installed in the bottom plate asshown in Fig. 5. Two sensors were used to ensure that the frontaldisk was parallel to the upper plate. All these parts were rigidlyconnected to each other to avoid relative displacements duringthe tests.
The following parameters were measured during the tests: tem-perature and mass flow rate of the flow, pressure at the inlet of thetest section (upstream pressure), atmospheric pressure, and thedistance between the disks. The atmospheric pressure wasmeasured by a barometer with 0.05 kPa resolution. The upstreampressure was measured by an inductive pressure transmitter with1 bar full scale (FS) and uncertainty of ±0.1% FS. The pressure onthe frontal disk surface was measured by two inductive pressuretransmitters: one transmitter with 0.035 bar operating range anduncertainty of ±1% FS was used for measuring the pressure profilefor smaller Reynolds numbers and large distances between thedisks, while the other transmitter having 0.1 bar operating rangeand uncertainty of 0.1% FS was used for tests carried out for higherReynolds numbers and smaller distances between the disks.
The radial position of the tap hole was measured by a capacitivedisplacement transmitter with 152.4 mm full scale (0.25% FSuncertainty). The mass flow rate was measured by using a Coriolis
mass flow meter with operating range of 5.0 kg/min and maximumuncertainty equal to ±0.2% of the reading. The temperature of theflow was measured by a PT100 sensor (as part of the Coriolis massflow meter) with an estimate uncertainty equal to ±0.1 �C. Theposition of the frontal disk was measured by two fiber optic sen-sors. The manufacturer’s calibration chart for a standard reflexivesurface (retro tape), gave an uncertainty of ±1 lm, and was usedto convert the signals. The retro tape surface was glued to the bot-tom surface of the frontal disk in order to reflect the light emittedby the optical sensor. All analog signals were converted to digitalsignals and wired to a computer where they were processed by aLabView program.
3. Experimental procedure
A typical test starts with some important adjustments in theexperimental apparatus. First, the frontal disk is positioned at thedesired distance from the upper plate, s. This is the most importantadjustment in the test and ensures accurate experimental data. Thefirst step is to displace the frontal disk until it remains in contactwith the upper plate, as shown in Fig. 5(a). In this position, thedistance between the disks is considered to be equal to zero. Thereadings of both optical sensors are considered as references foraccounting the distance s, that is, s1 = 0 for x1 and s2 = 0 for x2. Inthe second step, the frontal disk is displaced down until the desireddistance of the test is indicated by the sensors. The Labviewprogram was written to provide both values, s1 = x1 � x01 ands2 = x2 � x02 (Fig. 5b), as well as the average value, which is usedas the distance between the disks, s.
After adjusting the distance between the disks, the reservoirsare filled with air at a pressure value ranging from 10 to 12 barand the pressure control valve is adjusted for a pressure lower thanthe pressure in the reservoirs, usually from 8 to 9 bar. Then, themass flow rate control valve is opened to provide the desired massflow rate for the test, which is characterized by the Reynoldsnumber of the flow, Re, which is given by
Re ¼ qVdl¼ 4 _m
pldð1Þ
where q and l are the density and the absolute viscosity of the air,respectively, V is the average velocity of the flow, d is the innerdiameter of the feeding orifice, and is the mass flow rate of the flow.The density of the air was calculated by using equation of state forideal gas, considering the measured values of the upstream pressure
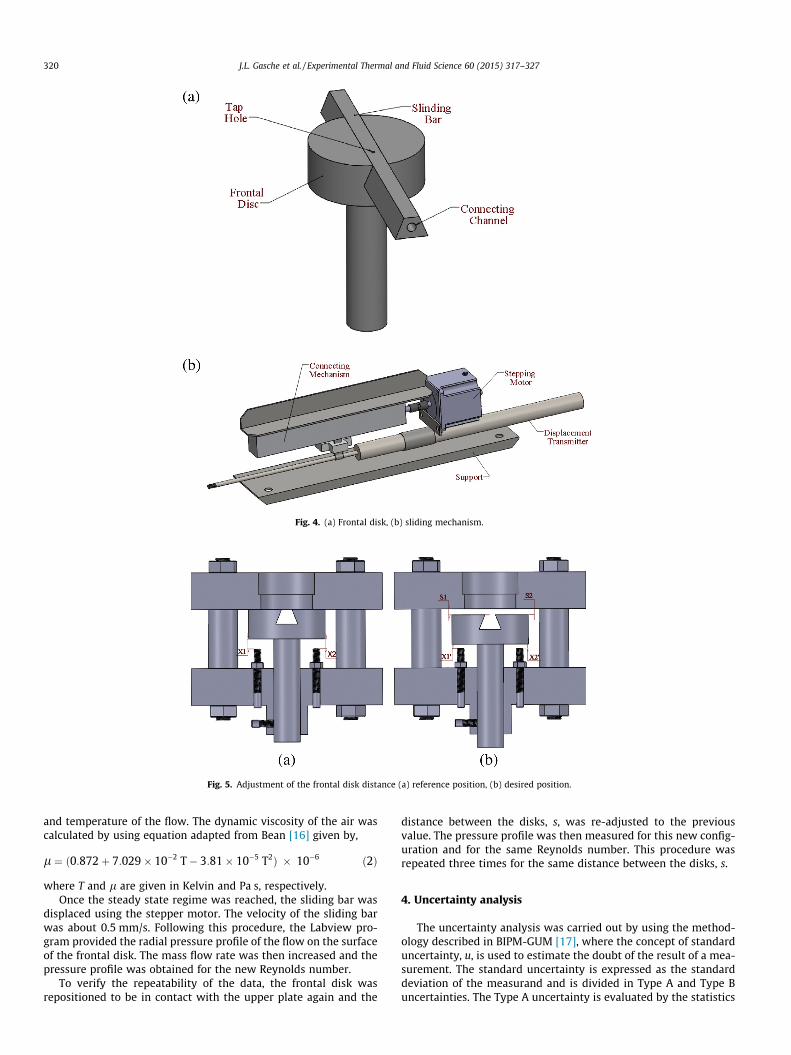
Fig. 4. (a) Frontal disk, (b) sliding mechanism.
Fig. 5. Adjustment of the frontal disk distance (a) reference position, (b) desired position.
320 J.L. Gasche et al. / Experimental Thermal and Fluid Science 60 (2015) 317–327
and temperature of the flow. The dynamic viscosity of the air wascalculated by using equation adapted from Bean [16] given by,
l ¼ ð0:872þ 7:029� 10�2 T� 3:81� 10�5 T2Þ � 10�6 ð2Þ
where T and l are given in Kelvin and Pa s, respectively.Once the steady state regime was reached, the sliding bar was
displaced using the stepper motor. The velocity of the sliding barwas about 0.5 mm/s. Following this procedure, the Labview pro-gram provided the radial pressure profile of the flow on the surfaceof the frontal disk. The mass flow rate was then increased and thepressure profile was obtained for the new Reynolds number.
To verify the repeatability of the data, the frontal disk wasrepositioned to be in contact with the upper plate again and the
distance between the disks, s, was re-adjusted to the previousvalue. The pressure profile was then measured for this new config-uration and for the same Reynolds number. This procedure wasrepeated three times for the same distance between the disks, s.
4. Uncertainty analysis
The uncertainty analysis was carried out by using the method-ology described in BIPM-GUM [17], where the concept of standarduncertainty, u, is used to estimate the doubt of the result of a mea-surement. The standard uncertainty is expressed as the standarddeviation of the measurand and is divided in Type A and Type Buncertainties. The Type A uncertainty is evaluated by the statistics
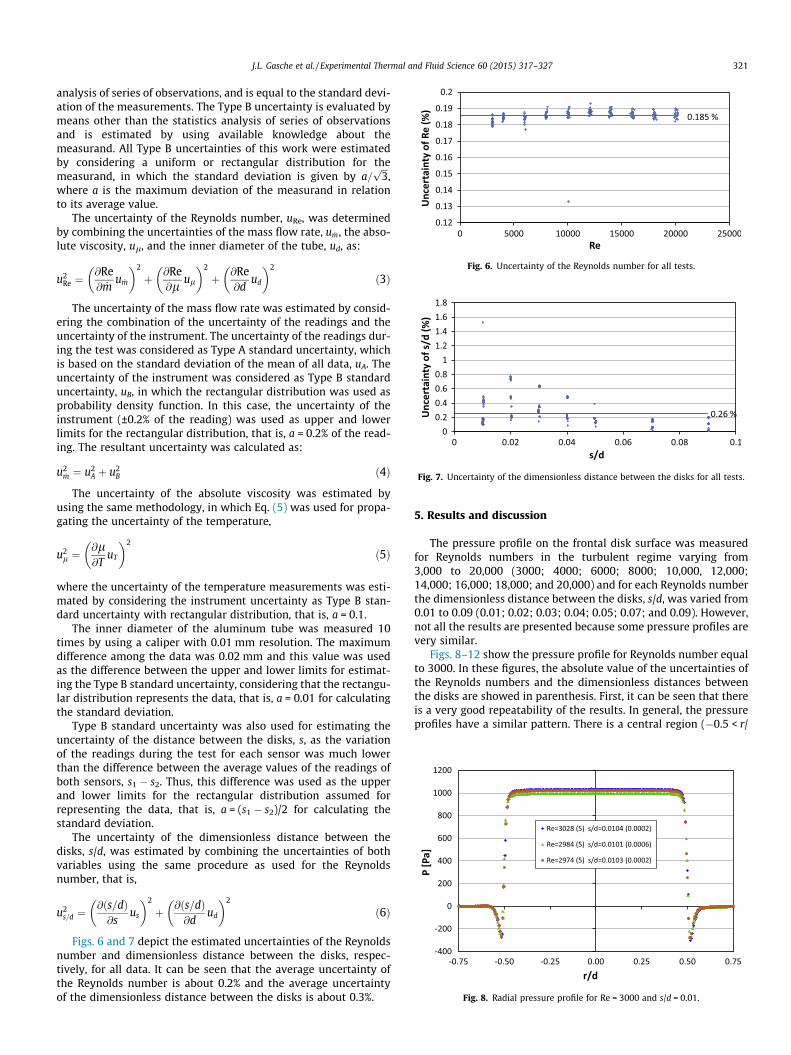
Fig. 6. Uncertainty of the Reynolds number for all tests.
Fig. 7. Uncertainty of the dimensionless distance between the disks for all tests.
Fig. 8. Radial pressure profile for Re = 3000 and s/d = 0.01.
J.L. Gasche et al. / Experimental Thermal and Fluid Science 60 (2015) 317–327 321
analysis of series of observations, and is equal to the standard devi-ation of the measurements. The Type B uncertainty is evaluated bymeans other than the statistics analysis of series of observationsand is estimated by using available knowledge about themeasurand. All Type B uncertainties of this work were estimatedby considering a uniform or rectangular distribution for themeasurand, in which the standard deviation is given by a=
ffiffiffi3p
,where a is the maximum deviation of the measurand in relationto its average value.
The uncertainty of the Reynolds number, uRe, was determinedby combining the uncertainties of the mass flow rate, u _m, the abso-lute viscosity, ul, and the inner diameter of the tube, ud, as:
u2Re ¼
@Re@ _m
u _m
� �2
þ @Re@l
ul
� �2
þ @Re@d
ud
� �2
ð3Þ
The uncertainty of the mass flow rate was estimated by consid-ering the combination of the uncertainty of the readings and theuncertainty of the instrument. The uncertainty of the readings dur-ing the test was considered as Type A standard uncertainty, whichis based on the standard deviation of the mean of all data, uA. Theuncertainty of the instrument was considered as Type B standarduncertainty, uB, in which the rectangular distribution was used asprobability density function. In this case, the uncertainty of theinstrument (±0.2% of the reading) was used as upper and lowerlimits for the rectangular distribution, that is, a = 0.2% of the read-ing. The resultant uncertainty was calculated as:
u2_m ¼ u2
A þ u2B ð4Þ
The uncertainty of the absolute viscosity was estimated byusing the same methodology, in which Eq. (5) was used for propa-gating the uncertainty of the temperature,
u2l ¼
@l@T
uT
� �2
ð5Þ
where the uncertainty of the temperature measurements was esti-mated by considering the instrument uncertainty as Type B stan-dard uncertainty with rectangular distribution, that is, a = 0.1.
The inner diameter of the aluminum tube was measured 10times by using a caliper with 0.01 mm resolution. The maximumdifference among the data was 0.02 mm and this value was usedas the difference between the upper and lower limits for estimat-ing the Type B standard uncertainty, considering that the rectangu-lar distribution represents the data, that is, a = 0.01 for calculatingthe standard deviation.
Type B standard uncertainty was also used for estimating theuncertainty of the distance between the disks, s, as the variationof the readings during the test for each sensor was much lowerthan the difference between the average values of the readings ofboth sensors, s1 � s2. Thus, this difference was used as the upperand lower limits for the rectangular distribution assumed forrepresenting the data, that is, a = (s1 � s2)/2 for calculating thestandard deviation.
The uncertainty of the dimensionless distance between thedisks, s/d, was estimated by combining the uncertainties of bothvariables using the same procedure as used for the Reynoldsnumber, that is,
u2s=d ¼
@ðs=dÞ@s
us
� �2
þ @ðs=dÞ@d
ud
� �2
ð6Þ
Figs. 6 and 7 depict the estimated uncertainties of the Reynoldsnumber and dimensionless distance between the disks, respec-tively, for all data. It can be seen that the average uncertainty ofthe Reynolds number is about 0.2% and the average uncertaintyof the dimensionless distance between the disks is about 0.3%.
5. Results and discussion
The pressure profile on the frontal disk surface was measuredfor Reynolds numbers in the turbulent regime varying from3,000 to 20,000 (3000; 4000; 6000; 8000; 10,000, 12,000;14,000; 16,000; 18,000; and 20,000) and for each Reynolds numberthe dimensionless distance between the disks, s/d, was varied from0.01 to 0.09 (0.01; 0.02; 0.03; 0.04; 0.05; 0.07; and 0.09). However,not all the results are presented because some pressure profiles arevery similar.
Figs. 8–12 show the pressure profile for Reynolds number equalto 3000. In these figures, the absolute value of the uncertainties ofthe Reynolds numbers and the dimensionless distances betweenthe disks are showed in parenthesis. First, it can be seen that thereis a very good repeatability of the results. In general, the pressureprofiles have a similar pattern. There is a central region (�0.5 < r/
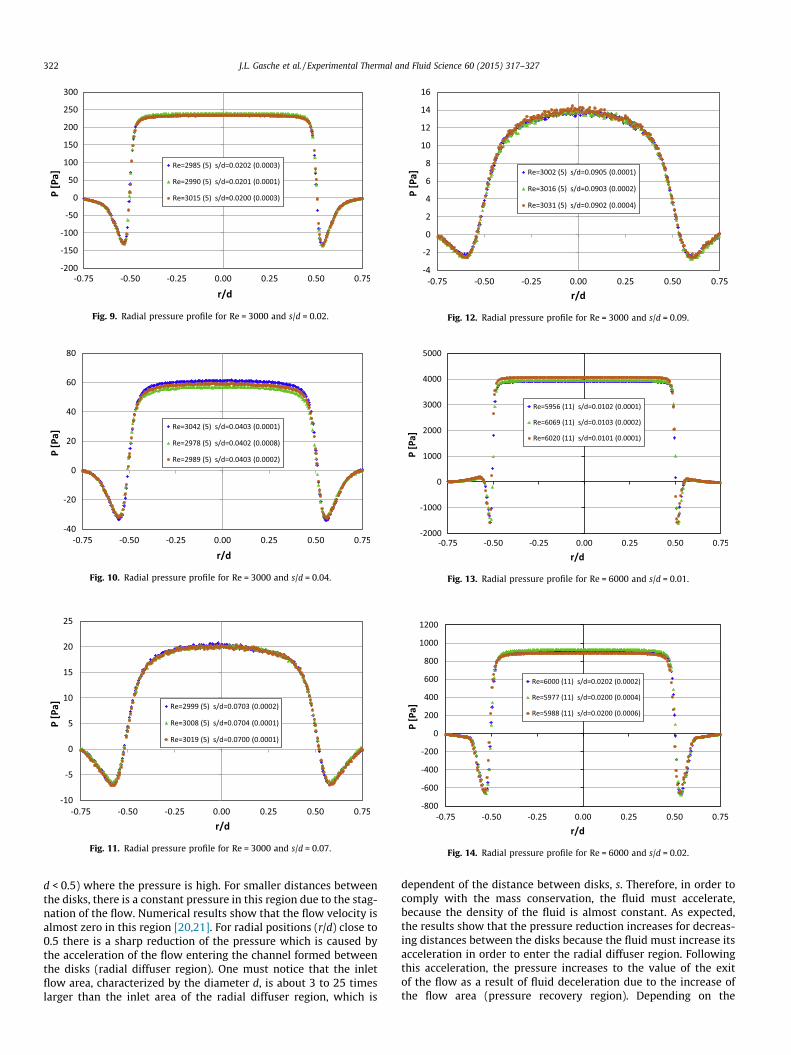
Fig. 9. Radial pressure profile for Re = 3000 and s/d = 0.02.
Fig. 10. Radial pressure profile for Re = 3000 and s/d = 0.04.
Fig. 11. Radial pressure profile for Re = 3000 and s/d = 0.07.
Fig. 12. Radial pressure profile for Re = 3000 and s/d = 0.09.
Fig. 13. Radial pressure profile for Re = 6000 and s/d = 0.01.
Fig. 14. Radial pressure profile for Re = 6000 and s/d = 0.02.
322 J.L. Gasche et al. / Experimental Thermal and Fluid Science 60 (2015) 317–327
d < 0.5) where the pressure is high. For smaller distances betweenthe disks, there is a constant pressure in this region due to the stag-nation of the flow. Numerical results show that the flow velocity isalmost zero in this region [20,21]. For radial positions (r/d) close to0.5 there is a sharp reduction of the pressure which is caused bythe acceleration of the flow entering the channel formed betweenthe disks (radial diffuser region). One must notice that the inletflow area, characterized by the diameter d, is about 3 to 25 timeslarger than the inlet area of the radial diffuser region, which is
dependent of the distance between disks, s. Therefore, in order tocomply with the mass conservation, the fluid must accelerate,because the density of the fluid is almost constant. As expected,the results show that the pressure reduction increases for decreas-ing distances between the disks because the fluid must increase itsacceleration in order to enter the radial diffuser region. Followingthis acceleration, the pressure increases to the value of the exitof the flow as a result of fluid deceleration due to the increase ofthe flow area (pressure recovery region). Depending on the
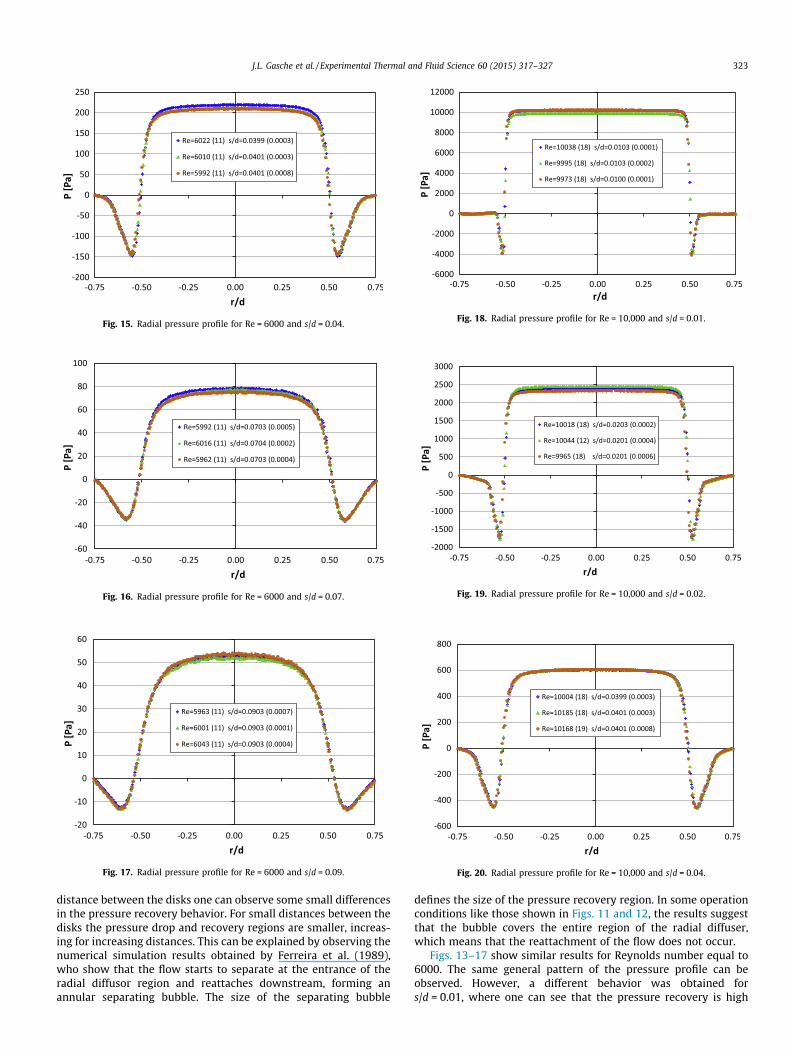
Fig. 15. Radial pressure profile for Re = 6000 and s/d = 0.04.
Fig. 16. Radial pressure profile for Re = 6000 and s/d = 0.07.
Fig. 17. Radial pressure profile for Re = 6000 and s/d = 0.09.
Fig. 18. Radial pressure profile for Re = 10,000 and s/d = 0.01.
Fig. 19. Radial pressure profile for Re = 10,000 and s/d = 0.02.
Fig. 20. Radial pressure profile for Re = 10,000 and s/d = 0.04.
J.L. Gasche et al. / Experimental Thermal and Fluid Science 60 (2015) 317–327 323
distance between the disks one can observe some small differencesin the pressure recovery behavior. For small distances between thedisks the pressure drop and recovery regions are smaller, increas-ing for increasing distances. This can be explained by observing thenumerical simulation results obtained by Ferreira et al. (1989),who show that the flow starts to separate at the entrance of theradial diffusor region and reattaches downstream, forming anannular separating bubble. The size of the separating bubble
defines the size of the pressure recovery region. In some operationconditions like those shown in Figs. 11 and 12, the results suggestthat the bubble covers the entire region of the radial diffuser,which means that the reattachment of the flow does not occur.
Figs. 13–17 show similar results for Reynolds number equal to6000. The same general pattern of the pressure profile can beobserved. However, a different behavior was obtained fors/d = 0.01, where one can see that the pressure recovery is high
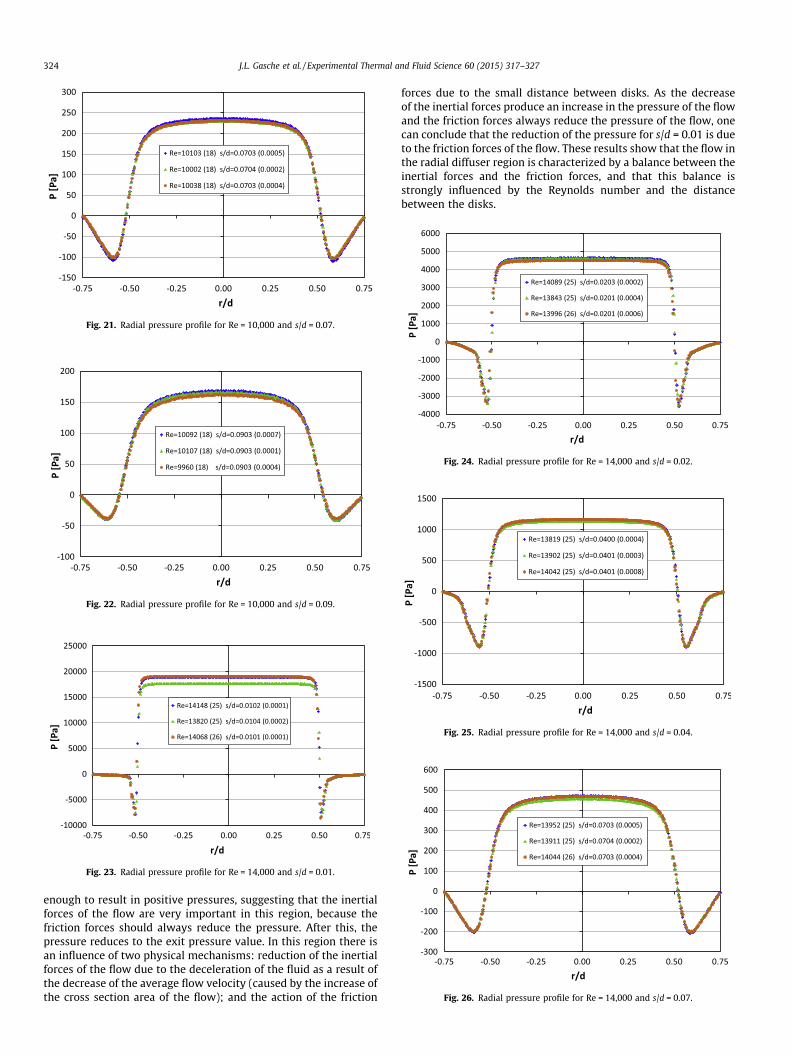
Fig. 21. Radial pressure profile for Re = 10,000 and s/d = 0.07.
Fig. 22. Radial pressure profile for Re = 10,000 and s/d = 0.09.
Fig. 23. Radial pressure profile for Re = 14,000 and s/d = 0.01.
Fig. 24. Radial pressure profile for Re = 14,000 and s/d = 0.02.
Fig. 25. Radial pressure profile for Re = 14,000 and s/d = 0.04.
Fig. 26. Radial pressure profile for Re = 14,000 and s/d = 0.07.
324 J.L. Gasche et al. / Experimental Thermal and Fluid Science 60 (2015) 317–327
enough to result in positive pressures, suggesting that the inertialforces of the flow are very important in this region, because thefriction forces should always reduce the pressure. After this, thepressure reduces to the exit pressure value. In this region there isan influence of two physical mechanisms: reduction of the inertialforces of the flow due to the deceleration of the fluid as a result ofthe decrease of the average flow velocity (caused by the increase ofthe cross section area of the flow); and the action of the friction
forces due to the small distance between disks. As the decreaseof the inertial forces produce an increase in the pressure of the flowand the friction forces always reduce the pressure of the flow, onecan conclude that the reduction of the pressure for s/d = 0.01 is dueto the friction forces of the flow. These results show that the flow inthe radial diffuser region is characterized by a balance between theinertial forces and the friction forces, and that this balance isstrongly influenced by the Reynolds number and the distancebetween the disks.
J.L. Gasche et al. / Experimental Thermal and Fluid Science 60 (2015) 317–327 325
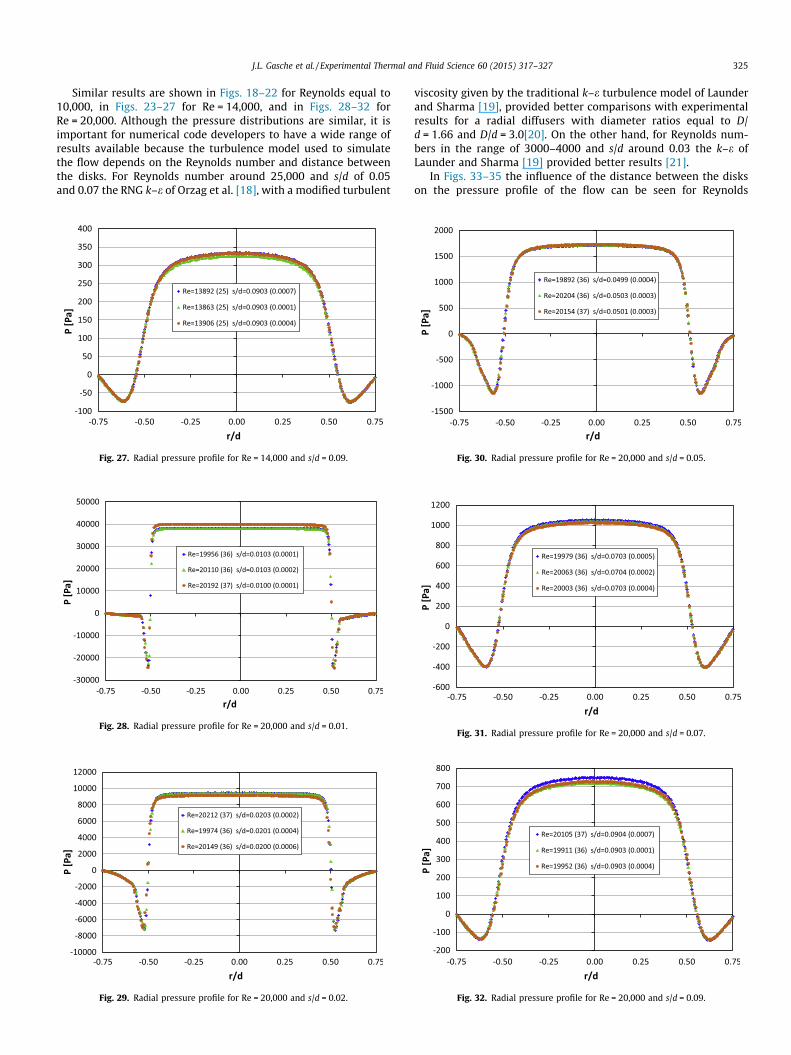
Similar results are shown in Figs. 18–22 for Reynolds equal to10,000, in Figs. 23–27 for Re = 14,000, and in Figs. 28–32 forRe = 20,000. Although the pressure distributions are similar, it isimportant for numerical code developers to have a wide range ofresults available because the turbulence model used to simulatethe flow depends on the Reynolds number and distance betweenthe disks. For Reynolds number around 25,000 and s/d of 0.05and 0.07 the RNG k–e of Orzag et al. [18], with a modified turbulent
Fig. 27. Radial pressure profile for Re = 14,000 and s/d = 0.09.
Fig. 28. Radial pressure profile for Re = 20,000 and s/d = 0.01.
Fig. 29. Radial pressure profile for Re = 20,000 and s/d = 0.02.
viscosity given by the traditional k–e turbulence model of Launderand Sharma [19], provided better comparisons with experimentalresults for a radial diffusers with diameter ratios equal to D/d = 1.66 and D/d = 3.0[20]. On the other hand, for Reynolds num-bers in the range of 3000–4000 and s/d around 0.03 the k–e ofLaunder and Sharma [19] provided better results [21].
In Figs. 33–35 the influence of the distance between the diskson the pressure profile of the flow can be seen for Reynolds
Fig. 30. Radial pressure profile for Re = 20,000 and s/d = 0.05.
Fig. 31. Radial pressure profile for Re = 20,000 and s/d = 0.07.
Fig. 32. Radial pressure profile for Re = 20,000 and s/d = 0.09.
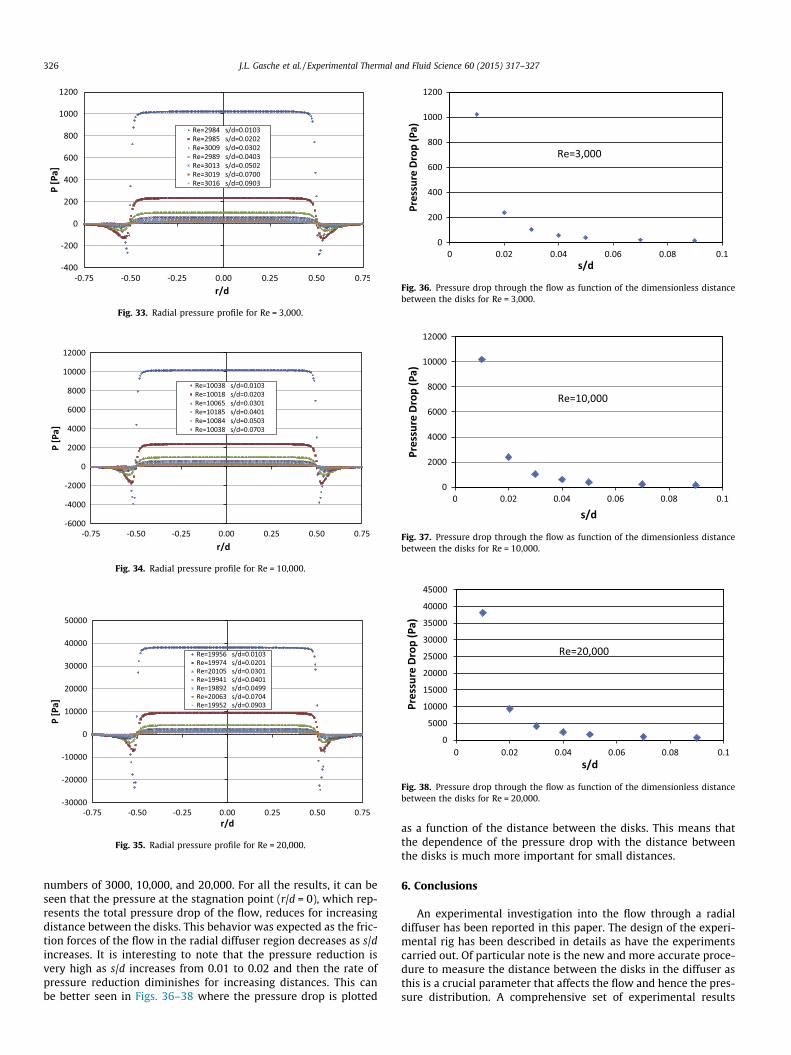
Fig. 33. Radial pressure profile for Re = 3,000.
Fig. 34. Radial pressure profile for Re = 10,000.
Fig. 35. Radial pressure profile for Re = 20,000.
Fig. 36. Pressure drop through the flow as function of the dimensionless distancebetween the disks for Re = 3,000.
Fig. 37. Pressure drop through the flow as function of the dimensionless distancebetween the disks for Re = 10,000.
Fig. 38. Pressure drop through the flow as function of the dimensionless distancebetween the disks for Re = 20,000.
326 J.L. Gasche et al. / Experimental Thermal and Fluid Science 60 (2015) 317–327
numbers of 3000, 10,000, and 20,000. For all the results, it can beseen that the pressure at the stagnation point (r/d = 0), which rep-resents the total pressure drop of the flow, reduces for increasingdistance between the disks. This behavior was expected as the fric-tion forces of the flow in the radial diffuser region decreases as s/dincreases. It is interesting to note that the pressure reduction isvery high as s/d increases from 0.01 to 0.02 and then the rate ofpressure reduction diminishes for increasing distances. This canbe better seen in Figs. 36–38 where the pressure drop is plotted
as a function of the distance between the disks. This means thatthe dependence of the pressure drop with the distance betweenthe disks is much more important for small distances.
6. Conclusions
An experimental investigation into the flow through a radialdiffuser has been reported in this paper. The design of the experi-mental rig has been described in details as have the experimentscarried out. Of particular note is the new and more accurate proce-dure to measure the distance between the disks in the diffuser asthis is a crucial parameter that affects the flow and hence the pres-sure distribution. A comprehensive set of experimental results
J.L. Gasche et al. / Experimental Thermal and Fluid Science 60 (2015) 317–327 327
have been provided for the pressure distribution on the frontal diskfor a new diameter ratio of 1.5 and a wide Reynolds number rangeof 3000–20,000, considering dimensionless distance between thedisks in a wide range of 0.01–0.09.
In general, the pressure profiles have a similar pattern.However, a different behavior was obtained for Re = 6000 ands/d = 0.01, where the pressure recovery is high enough to resultin positive pressures in the radial diffuser region, suggesting thatthe inertial forces of the flow are higher than the friction forces.In addition, it was shown that the dependence of the pressure dropwith the distance between the disks is much more important forsmall distances between the disks.
As the results showed very good repeatability with small uncer-tainties, they can be used for validating numerical codes developedto solve the flow through real refrigeration compressor valves.
Acknowledgements
Thanks are due to FAPESP (Grant Number 2010/16837-9) andTecumseh do Brasil Ltda for sponsoring this research project.
References
[1] S. Hayashi, T. Matsui, T. Ito, Study of flow and thrust in nozzle-flapper valves, J.Fluids Eng. 97 (1975) 39–50.
[2] J.D. Raal, Radial source flow between parallel disks, J. Fluid Mech. 85 (1978)401–416.
[3] J.R. Piechna, G.E.A. Meier, Numerical investigation of steady and unsteady flowin valve gap, in: International Compressor Engineering Conference at Purdue,1986.
[4] R.T.S. Ferreira, A.T. Prata, C.J. Deschamps, Pressure distribution along valvereeds of hermetic compressors, Exp. Thermal Fluid Sci. 2 (2) (1989) 201–207.
[5] J.L. Gasche, Laminar Flow through Eccentric Valves of RefrigerationCompressors, MS. Dissertation, (in Portuguese), Federal University of SantaCatarina, Florianópolis-SC, Brazil, 1992, p. 149.
[6] F.C. Possamai, R.T.S. Ferreira, A.T. Prata, Pressure distribution in laminar radialflow through inclined disks, Int. J. Heat Fluid Flow 22 (4) (2001) 440–449.
[7] C.J. Deschamps, R.T.S. Ferreira, A.T. Prata, Turbulent Flow Through Reed TypeValves of Reciprocating Compressors, ASME, International MechanicalEngineering Congress, Atlanta, EUA, 1996.
[8] A.K. Colaciti, L.M.V. López, H.A. Navarro, L. Cabezas-Gómez, Numericalsimulation of a radial diffuser turbulent airflow, Appl. Math. Comput. 189(2007) 1491–1504.
[9] C.E. Wark, J.F. Foss, Forces caused by the radial out-flow between parallel disks,J. Fluids Eng. 106 (1984) 292–297.
[10] R.T.S. Ferreira, J.L. Driessen, Analysis of the influence of valve geometricparameters on the effective flow and force areas, in: International CompressorEngineering Conference at Purdue, 1986, pp. 632–646.
[11] M. Tabatabai, A. Pollard, Turbulence in radial flow between parallel disks atmedium and low reynolds numbers, J. Fluid Mech. 185 (1987) 483–502.
[12] J.S. Ervin, N.V. Suryanarayana, H.Chai NG, Radial, turbulent flow of a fluidbetween two coaxial disks, J. Fluid Eng. 111 (1989) 378–383.
[13] J.L. Gasche, R.T.S. Ferreira, A.T. Prata, Pressure distribution along eccentriccircular valve reed of hermetic compressors, in: 12th Purdue Int. CompressorTechnology Conference, West Lafayette, USA, 1992, pp. 1189–1198.
[14] L.E.M. Souto, Experimental Investigation of Turbulent Flow in Compressors,MS. Dissertation, (in Portuguese), Federal University of Santa Catarina,Florianópolis-SC, Brazil, 2002, p. 105.
[15] L.E.M. Souto, C.J. Deschamps, Experimental investigation of flow thoughcompressor valves, in: Proc. International IIR Conference Compressors,Papiernicka, 2004, pp. 67–75.
[16] H.S. Bean, Fluid Meters – Their Theory and Application, sixth ed., The AmericanSociety of Mechanical Engineers, 1971.
[17] BIPM-GUM, Evaluation of Measurement Data – Guide to the Expression ofUncertainty in Measurement, JCGM, 2008. p. 120.
[18] S.A. Orzag, V. Yakhot, W.S. Flannery, F. Boysan, D. Choudhury, J. Marusewski, B.Patel, Renormalization group modeling and turbuence simulations, Near-WallTurbulent Flows (1993).
[19] B.E. Launder, B.I. Sharma, Application of the energy dissipation model ofturbulence to the calculation of flow near a spinning disc, Lett. Heat MassTransfer 1 (1974) 131–138.
[20] D.A. Salinas Casanova, Numerical Analysis of the Turbulent Flow in AutomaticValves of Compressors, Ph.D. Thesis, (in Portuguese), Federal University ofSanta Catarina, Florianópolis-SC, Brazil, 2001, p. 267.
[21] F.F.S. Matos, Numerical Analysis of the Dynamic Behavior of Reed Type Valvesof Hermetic Compressors, Ph.D. Thesis, (in Portuguese), Federal University ofSanta Catarina, Florianópolis-SC, Brazil, 2002, p. 243.
Related Documents