Pressure dependence of viscosity of rhyolitic melts Hejiu Hui a, * ,1 , Youxue Zhang a , Zhengjiu Xu a , Piero Del Gaudio b,2 , Harald Behrens b a Department of Geological Sciences, The University of Michigan, Ann Arbor, MI 48109-1005, USA b Institut fu ¨ r Mineralogie, Universita ¨ t Hannover, D-30167 Hannover, Germany Received 20 October 2008; accepted in revised form 30 March 2009; available online 8 April 2009 Abstract Viscosity of silicate melts is a critical property for understanding volcanic and igneous processes in the Earth. We inves- tigate the pressure effect on the viscosity of rhyolitic melts using two methods: indirect viscosity inference from hydrous spe- cies reaction in melts using a piston cylinder at pressures up to 2.8 GPa and direct viscosity measurement by parallel-plate creep viscometer in an internally-heated pressure vessel at pressures up to 0.4 GPa. Comparison of viscosities of a rhyolitic melt with 0.8 wt% water at 0.4 GPa shows that both methods give consistent results. In the indirect method, viscosities of hydrous rhyolitic melts were inferred based on the kinetics of hydrous species reaction in the melt upon cooling (i.e., the equiv- alence of rheologically defined glass transition temperature and chemically defined apparent equilibrium temperature). The cooling experiments were carried out in a piston-cylinder apparatus using hydrous rhyolitic samples with 0.8–4 wt% water. Cooling rates of the kinetic experiments varied from 0.1 K/s to 100 K/s; hence the range of viscosity inferred from this method covers 3 orders of magnitude. The data from this method show that viscosity increases with increasing pressure from 1 GPa to 3 GPa for hydrous rhyolitic melts with water content P0.8 wt% in the high viscosity range. We also measured viscosity of rhyolitic melt with 0.13 wt% water using the parallel-plate viscometer at pressures 0.2 and 0.4 GPa in an internally-heated pressure vessel. The data show that viscosity of rhyolitic melt with 0.13 wt% water decreases with increasing pressure. Com- bining our new data with literature data, we develop a viscosity model of rhyolitic melts as a function of temperature, pressure and water content. Ó 2009 Elsevier Ltd. All rights reserved. 1. INTRODUCTION Viscosity of silicate melts is a property of fundamental importance in Earth sciences. Viscosities of silicate melts under ambient pressure have been studied extensively (e.g., Friedman et al., 1963; Bottinga and Weill, 1972; Shaw, 1972; Dingwell, 1986; Scarfe and Cronin, 1986; Neu- ville et al., 1993; Schulze et al., 1996; Whittington et al., 2000; Girodano et al., 2004; Hui and Zhang, 2007). Several experimental techniques are developed to measure viscosity directly: (1) in the low viscosity range, concentric cylinder viscometer (e.g., Dingwell, 1986) and falling sphere tech- nique (e.g., Shaw, 1963); (2) in the high viscosity range, micropenetration method (e.g., Hummel and Arndt, 1985), parallel-plate creep viscometer (e.g., Neuville and Ri- chet, 1991) and fiber elongation method (e.g., Lillie, 1931). Many geologic processes in which silicate melts are in- volved occur at elevated pressures. The pressures of these processes may vary from 0 to 200 MPa for volcanic erup- tions, to a couple of GPa for crustal anatexis and mantle melting, to hundreds of GPa for core–mantle segregation. This extreme range of magnitudes in pressure requires the exploration of a very broad spectrum of measurement prin- ciples and technologies in melt viscosity studies. Some of the viscometers above have been adapted to high-pressure conditions (e.g., Kushiro et al., 1976; Kan- zaki et al., 1987; Dingwell, 1998; Behrens and Schulze, 0016-7037/$ - see front matter Ó 2009 Elsevier Ltd. All rights reserved. doi:10.1016/j.gca.2009.03.035 * Corresponding author. E-mail address: [email protected] (H. Hui). 1 Present address: Lunar and Planetary Institute, USRA-Hous- ton, Houston, TX 77058, USA. 2 Present address: Istituto Natizionale di Geofisica e Vulcanolo- gia, Via di Vigna Murata 605, I-00143 Roma, Italy. www.elsevier.com/locate/gca Available online at www.sciencedirect.com Geochimica et Cosmochimica Acta 73 (2009) 3680–3693

Welcome message from author
This document is posted to help you gain knowledge. Please leave a comment to let me know what you think about it! Share it to your friends and learn new things together.
Transcript

Available online at www.sciencedirect.com
www.elsevier.com/locate/gca
Geochimica et Cosmochimica Acta 73 (2009) 3680–3693
Pressure dependence of viscosity of rhyolitic melts
Hejiu Hui a,*,1, Youxue Zhang a, Zhengjiu Xu a, Piero Del Gaudio b,2, Harald Behrens b
a Department of Geological Sciences, The University of Michigan, Ann Arbor, MI 48109-1005, USAb Institut fur Mineralogie, Universitat Hannover, D-30167 Hannover, Germany
Received 20 October 2008; accepted in revised form 30 March 2009; available online 8 April 2009
Abstract
Viscosity of silicate melts is a critical property for understanding volcanic and igneous processes in the Earth. We inves-tigate the pressure effect on the viscosity of rhyolitic melts using two methods: indirect viscosity inference from hydrous spe-cies reaction in melts using a piston cylinder at pressures up to 2.8 GPa and direct viscosity measurement by parallel-platecreep viscometer in an internally-heated pressure vessel at pressures up to 0.4 GPa. Comparison of viscosities of a rhyoliticmelt with 0.8 wt% water at 0.4 GPa shows that both methods give consistent results. In the indirect method, viscosities ofhydrous rhyolitic melts were inferred based on the kinetics of hydrous species reaction in the melt upon cooling (i.e., the equiv-alence of rheologically defined glass transition temperature and chemically defined apparent equilibrium temperature). Thecooling experiments were carried out in a piston-cylinder apparatus using hydrous rhyolitic samples with 0.8–4 wt% water.Cooling rates of the kinetic experiments varied from 0.1 K/s to 100 K/s; hence the range of viscosity inferred from this methodcovers 3 orders of magnitude. The data from this method show that viscosity increases with increasing pressure from 1 GPa to3 GPa for hydrous rhyolitic melts with water content P0.8 wt% in the high viscosity range. We also measured viscosity ofrhyolitic melt with 0.13 wt% water using the parallel-plate viscometer at pressures 0.2 and 0.4 GPa in an internally-heatedpressure vessel. The data show that viscosity of rhyolitic melt with 0.13 wt% water decreases with increasing pressure. Com-bining our new data with literature data, we develop a viscosity model of rhyolitic melts as a function of temperature, pressureand water content.� 2009 Elsevier Ltd. All rights reserved.
1. INTRODUCTION
Viscosity of silicate melts is a property of fundamentalimportance in Earth sciences. Viscosities of silicate meltsunder ambient pressure have been studied extensively(e.g., Friedman et al., 1963; Bottinga and Weill, 1972;Shaw, 1972; Dingwell, 1986; Scarfe and Cronin, 1986; Neu-ville et al., 1993; Schulze et al., 1996; Whittington et al.,2000; Girodano et al., 2004; Hui and Zhang, 2007). Severalexperimental techniques are developed to measure viscosity
0016-7037/$ - see front matter � 2009 Elsevier Ltd. All rights reserved.
doi:10.1016/j.gca.2009.03.035
* Corresponding author.E-mail address: [email protected] (H. Hui).
1 Present address: Lunar and Planetary Institute, USRA-Hous-ton, Houston, TX 77058, USA.
2 Present address: Istituto Natizionale di Geofisica e Vulcanolo-gia, Via di Vigna Murata 605, I-00143 Roma, Italy.
directly: (1) in the low viscosity range, concentric cylinderviscometer (e.g., Dingwell, 1986) and falling sphere tech-nique (e.g., Shaw, 1963); (2) in the high viscosity range,micropenetration method (e.g., Hummel and Arndt,1985), parallel-plate creep viscometer (e.g., Neuville and Ri-chet, 1991) and fiber elongation method (e.g., Lillie, 1931).Many geologic processes in which silicate melts are in-volved occur at elevated pressures. The pressures of theseprocesses may vary from 0 to 200 MPa for volcanic erup-tions, to a couple of GPa for crustal anatexis and mantlemelting, to hundreds of GPa for core–mantle segregation.This extreme range of magnitudes in pressure requires theexploration of a very broad spectrum of measurement prin-ciples and technologies in melt viscosity studies.
Some of the viscometers above have been adapted tohigh-pressure conditions (e.g., Kushiro et al., 1976; Kan-zaki et al., 1987; Dingwell, 1998; Behrens and Schulze,
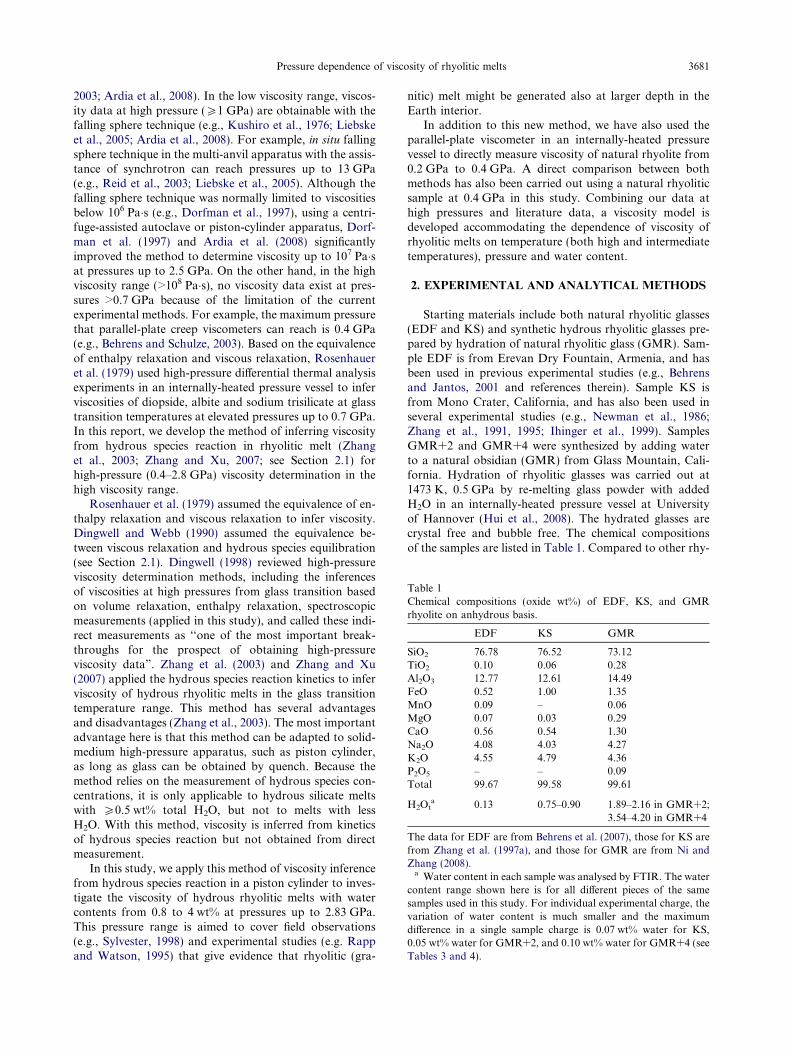
Table 1Chemical compositions (oxide wt%) of EDF, KS, and GMRrhyolite on anhydrous basis.
EDF KS GMR
SiO2 76.78 76.52 73.12TiO2 0.10 0.06 0.28Al2O3 12.77 12.61 14.49FeO 0.52 1.00 1.35MnO 0.09 – 0.06MgO 0.07 0.03 0.29CaO 0.56 0.54 1.30Na2O 4.08 4.03 4.27K2O 4.55 4.79 4.36P2O5 – – 0.09Total 99.67 99.58 99.61
H2Ota 0.13 0.75–0.90 1.89–2.16 in GMR+2;
3.54–4.20 in GMR+4
The data for EDF are from Behrens et al. (2007), those for KS arefrom Zhang et al. (1997a), and those for GMR are from Ni andZhang (2008).
a Water content in each sample was analysed by FTIR. The watercontent range shown here is for all different pieces of the samesamples used in this study. For individual experimental charge, thevariation of water content is much smaller and the maximumdifference in a single sample charge is 0.07 wt% water for KS,0.05 wt% water for GMR+2, and 0.10 wt% water for GMR+4 (seeTables 3 and 4).
Pressure dependence of viscosity of rhyolitic melts 3681
2003; Ardia et al., 2008). In the low viscosity range, viscos-ity data at high pressure (P1 GPa) are obtainable with thefalling sphere technique (e.g., Kushiro et al., 1976; Liebskeet al., 2005; Ardia et al., 2008). For example, in situ fallingsphere technique in the multi-anvil apparatus with the assis-tance of synchrotron can reach pressures up to 13 GPa(e.g., Reid et al., 2003; Liebske et al., 2005). Although thefalling sphere technique was normally limited to viscositiesbelow 106 Pa�s (e.g., Dorfman et al., 1997), using a centri-fuge-assisted autoclave or piston-cylinder apparatus, Dorf-man et al. (1997) and Ardia et al. (2008) significantlyimproved the method to determine viscosity up to 107 Pa�sat pressures up to 2.5 GPa. On the other hand, in the highviscosity range (>108 Pa�s), no viscosity data exist at pres-sures >0.7 GPa because of the limitation of the currentexperimental methods. For example, the maximum pressurethat parallel-plate creep viscometers can reach is 0.4 GPa(e.g., Behrens and Schulze, 2003). Based on the equivalenceof enthalpy relaxation and viscous relaxation, Rosenhaueret al. (1979) used high-pressure differential thermal analysisexperiments in an internally-heated pressure vessel to inferviscosities of diopside, albite and sodium trisilicate at glasstransition temperatures at elevated pressures up to 0.7 GPa.In this report, we develop the method of inferring viscosityfrom hydrous species reaction in rhyolitic melt (Zhanget al., 2003; Zhang and Xu, 2007; see Section 2.1) forhigh-pressure (0.4–2.8 GPa) viscosity determination in thehigh viscosity range.
Rosenhauer et al. (1979) assumed the equivalence of en-thalpy relaxation and viscous relaxation to infer viscosity.Dingwell and Webb (1990) assumed the equivalence be-tween viscous relaxation and hydrous species equilibration(see Section 2.1). Dingwell (1998) reviewed high-pressureviscosity determination methods, including the inferencesof viscosities at high pressures from glass transition basedon volume relaxation, enthalpy relaxation, spectroscopicmeasurements (applied in this study), and called these indi-rect measurements as ‘‘one of the most important break-throughs for the prospect of obtaining high-pressureviscosity data”. Zhang et al. (2003) and Zhang and Xu(2007) applied the hydrous species reaction kinetics to inferviscosity of hydrous rhyolitic melts in the glass transitiontemperature range. This method has several advantagesand disadvantages (Zhang et al., 2003). The most importantadvantage here is that this method can be adapted to solid-medium high-pressure apparatus, such as piston cylinder,as long as glass can be obtained by quench. Because themethod relies on the measurement of hydrous species con-centrations, it is only applicable to hydrous silicate meltswith P0.5 wt% total H2O, but not to melts with lessH2O. With this method, viscosity is inferred from kineticsof hydrous species reaction but not obtained from directmeasurement.
In this study, we apply this method of viscosity inferencefrom hydrous species reaction in a piston cylinder to inves-tigate the viscosity of hydrous rhyolitic melts with watercontents from 0.8 to 4 wt% at pressures up to 2.83 GPa.This pressure range is aimed to cover field observations(e.g., Sylvester, 1998) and experimental studies (e.g. Rappand Watson, 1995) that give evidence that rhyolitic (gra-
nitic) melt might be generated also at larger depth in theEarth interior.
In addition to this new method, we have also used theparallel-plate viscometer in an internally-heated pressurevessel to directly measure viscosity of natural rhyolite from0.2 GPa to 0.4 GPa. A direct comparison between bothmethods has also been carried out using a natural rhyoliticsample at 0.4 GPa in this study. Combining our data athigh pressures and literature data, a viscosity model isdeveloped accommodating the dependence of viscosity ofrhyolitic melts on temperature (both high and intermediatetemperatures), pressure and water content.
2. EXPERIMENTAL AND ANALYTICAL METHODS
Starting materials include both natural rhyolitic glasses(EDF and KS) and synthetic hydrous rhyolitic glasses pre-pared by hydration of natural rhyolitic glass (GMR). Sam-ple EDF is from Erevan Dry Fountain, Armenia, and hasbeen used in previous experimental studies (e.g., Behrensand Jantos, 2001 and references therein). Sample KS isfrom Mono Crater, California, and has also been used inseveral experimental studies (e.g., Newman et al., 1986;Zhang et al., 1991, 1995; Ihinger et al., 1999). SamplesGMR+2 and GMR+4 were synthesized by adding waterto a natural obsidian (GMR) from Glass Mountain, Cali-fornia. Hydration of rhyolitic glasses was carried out at1473 K, 0.5 GPa by re-melting glass powder with addedH2O in an internally-heated pressure vessel at Universityof Hannover (Hui et al., 2008). The hydrated glasses arecrystal free and bubble free. The chemical compositionsof the samples are listed in Table 1. Compared to other rhy-

3682 H. Hui et al. / Geochimica et Cosmochimica Acta 73 (2009) 3680–3693
olitic melts, GMR has higher Al2O3, FeO and CaO, butlower SiO2 content. The compositional difference is nottrivial. The effect of the difference on the viscosity will bediscussed in Section 4.3.
2.1. Indirect viscosity inference using hydrous species reaction
2.1.1. Theoretical background
Water is present in the silicate melts as at least two spe-cies: molecular H2O (H2Om) and hydroxyl group (OH)(Stolper, 1982a,b). The hydrous species reaction in themelts is
H2Om þO�2OH ð1Þ
where O is the anhydrous bridging oxygen in the melt. To-tal H2O content is denoted as H2Ot. The apparent equilib-rium constant K of Reaction (1) is defined as
K ¼ X 2OH
X H2Om X O
ð2Þ
where X means mole fraction. K is referred to as an appar-ent equilibrium constant because for a true equilibriumconstant, mole fractions would be replaced by activities.The relationship between the apparent equilibrium constantK and temperature (equilibrium line in Fig. 1) can be ex-pressed by a regular solution model as (Silver et al., 1990;Ihinger et al., 1999):
ln K ¼ Aþ 1000
TðBþ CX H2Om þ DX OHÞ; ð3Þ
where T is the temperature in K, and A, B, C and D are thefitting parameters depending on pressure. Hui et al. (2008)estimated these parameters for rhyolitic melts at 0.0001,0.94, 1.89, and 2.83 GPa. For example, (A, B, C, D) =(1.812, �3.083, �7.420, 3.044) at 0.0001 GPa, and (0.765,�2.025, �7.444, 1.835) at 2.83 GPa.At high enough tem-peratures, equilibrium between the hydrous species isreached rapidly. During cooling, at a certain low
Fig. 1. Sketch of kinetics of Reaction (1) during cooling (Behrensand Nowak, 2003). Tae is the apparent equilibrium temperature(Zhang, 1994), which depends on the cooling rate. Te is theequilibrium temperature.
temperature that depends on the cooling rate, the concen-trations of the two hydrous species in the melt with a givencomposition start to deviate from the equilibrium state. InFig. 1, this is shown as curves off the straight line (the equi-librium line). When temperature becomes too low to changespecies concentrations, water speciation is frozen in theglass as indicated by the horizontal segments in Fig. 1.The intersection of each horizontal line, which is calculatedfrom the hydrous species concentrations retained in thequenched glass, with the equilibrium line defines the appar-ent equilibrium temperature (Zhang, 1994). An equilibratedmelt at this temperature has the same water speciation asobserved in the quenched glass at room temperature. Thisapparent equilibrium temperature depends on the coolingrate shown in Fig. 1. A higher apparent equilibrium tem-perature indicates a faster cooling rate.
The viscosity at the glass transition temperature dependson the cooling rate. For a cooling rate of the order of 10 K/min, the glass transition temperature occurs at the viscosityof 1012 Pa�s. As the cooling rate changes, the glass transi-tion temperature changes too. Based on theoretical consid-erations and experimental results, Moynihan et al. (1976)showed that the dependence of the glass transition temper-ature on the cooling rate is as follows:
d log qdð1=T gÞ
¼ �DHR; ð4Þ
where q is the quench rate in K/s, Tg is the glass transitiontemperature in K, R is the gas constant, and DH is the acti-vation enthalpy for the relaxation times controlling thestructural enthalpy or volume relaxation, which is alsoequal to the activation enthalpy of the shear viscosity with-in experimental error. Scherer (1984) derived that viscosity(g) at the glass transition temperature is reciprocal to thequench rate (log gT g
¼ 11:3� log q). Dingwell and Webb(1990) advanced this idea further to infer viscosity fromkinetics of hydrous species reaction (i.e., Reaction (1)) inthe rhyolitic melt assuming the equivalence of the apparentequilibrium temperature and glass transition temperature(i.e., assuming that the time scale of Reaction (1) in rhyo-litic melt is the same as the structural relaxation time scaleof rhyolitic melt because both processes involve bridgingoxygen in the melt structure of rhyolite). By comparing ki-netic data on Reaction (1) and viscosity data obtained byother methods (including bubble growth data of Liu andZhang, 2000), Zhang et al. (2003) formulated the equationbelow to infer viscosity at the apparent equilibrium temper-ature (Tae) for hydrous rhyolitic melts:
log gT g¼ log gT ae
¼ 11:45� log q; ð5Þ
where g is the viscosity in Pa�s, q is the quench rate in K/sand 11.45 is a constant. Other experimental studies haveverified the equivalence of relaxation at the glass transitiontemperature on viscosity, volume and heat capacity (e.g.,Toplis et al., 2001; Sipp and Richet, 2002). Furthermore,there is consistency in the value of the constant (11.45) inEq. (5) by various studies: 11.3 in Scherer (1984), 11.5 inToplis et al. (2001), and Sipp and Richet (2002) found thevariation of the constant with melt composition to bewithin ±0.22 (2r). Therefore, the key in this method is to

Pressure dependence of viscosity of rhyolitic melts 3683
calculate the apparent equilibrium temperature (which re-quires equilibrium experiments) for a cooling experimentwith known quench rate (which means kinetic experiments),whereas viscosity at this temperature is calculated from Eq.(5).
2.1.2. Equilibrium experiments
This study is the first time to extend the method of infer-ring viscosity using hydrous species reaction in rhyoliticmelt to high pressures up to 3 GPa. In order to show theaccuracy of the viscosity determined with this method athigh pressure, we conducted experiments to compare vis-cosity derived from the hydrous species reaction to those di-rectly measured with the parallel-plate creep viscometer(Behrens and Schulze, 2003). The highest pressure thatcould be reached by current parallel-plate creep viscometeris 0.4 GPa (see Section 1). Hence, the viscosity data at0.4 GPa inferred from hydrous species reaction in the cool-ing experiments are compared with the ones determined bycreep experiments at this pressure. Sample KS was chosenfor these experiments because its H2O content is low en-ough to avoid dehydration in the parallel-plate creep exper-iments at 0.4 GPa (see Section 2.2) and high enough forreliable measurements of hydrous species concentrationsby IR.
The equilibrium experiments at 0.4 GPa follow the pro-cedures of Hui et al. (2008) and are briefly summarized be-low. Equilibrium experiments at 0.4 GPa were carried outin a piston cylinder at the University of Michigan. All theexperimental charges at 0.4 GPa were relaxed over nightat 423 K. Then, the temperature was brought to the desiredtemperature for a specified duration. The desired tempera-tures of 829 K, 875 K and 926 K were chosen so that theyare high enough for equilibrium to be reached in a reason-able duration and low enough so that species concentra-tions would not be changed during quench. Theexperimental duration at a given temperature shown in Ta-ble 3A was chosen so as to reach equilibrium. These param-eters are estimated based on experimental data andexperience from our previous studies (Zhang et al., 1995,1997b, 2000; Hui et al., 2008). The rapidly quenched glassis doubly polished and analyzed by FTIR for hydrous spe-cies concentrations, from which K is calculated. K is inde-
Table 2Results of parallel-plate creep viscometry.
EDF
0.2 GPa 0.4 GPa
T (K) log g (Pa�s) Exp.# T (K) log g (P
1038.15 11.42 12 1028.15 11.191048.15 11.28 1 1038.15 11.031048.15 11.21 13 1038.15 11.011067.15 10.83 2 1058.15 10.781067.15 10.74 5 1088.15 10.251088.15 10.52 14 1118.15 9.801087.15 10.47 31118.15 9.97 4
Note. # means the chronological order of the measurements.
pendent of the water content when the waterconcentration in the rhyolitic melt is less than 2.7 wt% asassessed in Zhang et al. (1997a). Hence, the speciation mod-el established from these equilibrium experiments can beused to predict the apparent equilibrium temperature ofthe rhyolitic melt containing less than 2.7 wt% water cooledat 0.4 GPa.
At other pressures, equilibrium data have already beenreported in Hui et al. (2008). The hydrous speciation mod-els developed in that study (Eq. (5) in Hui et al., 2008 withparameters listed in Table 3 in Hui et al., 2008) are used toinfer viscosities of hydrous rhyolitic melts at higher pres-sures (0.94–2.83 GPa).
2.1.3. Kinetic experiments
In addition to equilibrium experiments, controlled cool-ing rate experiments (referred to as kinetic experiments)must be conducted to infer viscosity at some temperature(the apparent equilibrium temperature). These experimentswere conducted in a piston cylinder at the University ofMichigan. A glass cylinder with a diameter of about2 mm and a height of about 2 mm was placed into a graph-ite capsule, which was enclosed in crushable MgO as the in-ner pressure medium, with a graphite heater outside and aBaCO3 cell as the outer pressure medium. The charge washeated to a high temperature (typically 1073 K, dependingon H2Ot) for melt relaxation and for hydrous species inthe melt to reach equilibrium to avoid any effect from priorthermal history. Then, the sample was isobarically cooled ata controlled cooling rate to room temperature. The coolingrate for most of the experiments is slow (610 K/s; some asslow as 0.1 K/s = 360 K/h), and hence it is possible tomaintain a roughly constant oil pressure on the main ramby manual pumping. The variation of the pressure appliedto the sample by the piston is estimated to be within±0.02 GPa during this process. For those experimentsquenched by turning off the power, the pressures weremaintained with our best effort. The results for these rap-idly quenched kinetic experiments are nonetheless consis-tent with those from slowly cooled samples with moreaccurate pressure control (see Section 3). Pressure in thepiston cylinder was previously calibrated using quartz-coes-ite phase transition and melting of a gold wire (Hui et al.,
KS
0.4 GPa
a�s) Exp.# T (K) log g (Pa�s) Exp.#
11 848.15 11.51 16 856.15 11.35 6
10 867.15 11.14 57 886.15 10.60 28 907.15 10.30 39 925.15 10.02 4

Table 3Experimental results for inference of viscosity from hydrous species reaction for sample KS at 0.4 GPa.a
Measurement# T (K) t (s) Abs. 5200 Abs. 4500 Thickness (mm) H2Ot (wt%) H2Om (wt%) OH (wt%) ln K
(A) Equilibrium experiment
E01-1 926 600 0.0231 0.0900 0.617 0.852 0.159 0.693 �1.504E01-2 925 600 0.0238 0.0910 0.618 0.864 0.164 0.700 �1.513E01-3 926 600 0.0233 0.0904 0.616 0.858 0.161 0.697 �1.502E02-1 875 16320 0.0389 0.1271 0.878 0.874 0.189 0.685 �1.696E02-2 875 16320 0.0407 0.1290 0.879 0.892 0.197 0.696 �1.708E02-3 874 16320 0.0379 0.1250 0.876 0.858 0.184 0.674 �1.704E04-1 829 86400 0.0684 0.2072 1.577 0.797 0.184 0.612 �1.900E04-2 829 86400 0.0697 0.2099 1.573 0.811 0.188 0.623 �1.886E04-3 829 86400 0.0697 0.2091 1.575 0.807 0.188 0.619 �1.897
Measurement# qb
(K/s)Abs.5200
Abs.4500
Thickness(mm)
H2Ot
(wt%)H2Om
(wt%)OH(wt%)
ln Kae Tae (K) log g(Pa�s)
(B) Cooling experiment
Q01-1 101.6 0.0241 0.0995 0.671 0.859 0.153 0.707 �1.421 950.13 9.44Q01-2 101.6 0.0242 0.0998 0.670 0.864 0.154 0.710 �1.420 950.57 9.44Q01-3 101.6 0.0236 0.0988 0.673 0.848 0.149 0.699 �1.423 949.66 9.44Q02-1 9.86 0.0180 0.0695 0.510 0.791 0.150 0.641 �1.599 900.92 10.46Q02-2 9.86 0.0181 0.0698 0.512 0.791 0.150 0.641 �1.600 900.66 10.46Q02-3 9.86 0.0186 0.0703 0.508 0.808 0.156 0.652 �1.604 899.67 10.46Q03-1 0.99 0.0445 0.1349 0.964 0.854 0.196 0.658 �1.817 847.03 11.45Q03-2 0.99 0.0433 0.1334 0.962 0.843 0.192 0.651 �1.814 847.75 11.45Q03-3 0.99 0.0448 0.1357 0.962 0.862 0.198 0.664 �1.810 848.68 11.45
Note. # Three points were measured by IR for each experimental sample; they are listed here as xxx-1, -2, and -3.a Pressure has been corrected based on pressure calibration.b q was calculated from the thermal history recorded by computer.
3684 H. Hui et al. / Geochimica et Cosmochimica Acta 73 (2009) 3680–3693
2008; Ni and Zhang, 2008). The pressures of cooling exper-iments are 0.4 GPa, 0.94 GPa (nominal pressure of 1 GPa),1.89 GPa (nominal pressure of 2 GPa), and 2.83 GPa (nom-inal pressure of 3 GPa). The temperature was measuredwith a type-S (Pt90Rh10–Pt) or type-D (W97Re3–W75Re25)thermocouple. No pressure correction was applied to thethermocouple emf. The temperature history was recordedeither by computer or manually.
The experimental charge after quench was embedded inepoxy resin. Then, it was polished on both sides into a thicksection along the cylindrical axis. The thickness of the sec-tion polished away on each side of the charge was at leasttwice the diffusion distance of water estimated using the dif-fusivity from Zhang and Behrens (2000). Infrared spectra ofthe quenched glass were obtained using a Perkin-ElmerFTIR spectrometer. The baseline of IR spectra was fit bya flexicurve (Newman et al., 1986). The concentrations ofhydrous species and total water content were obtainedusing the calibration of Zhang et al. (1997a). There are afew other calibration methods in the literature (e.g., New-man et al., 1986; Withers and Behrens, 1999). The reasonwe use the calibration of Zhang et al. (1997a) here is tobe consistent with the speciation study in Hui et al. (2008)because we calculate the apparent equilibrium temperaturefrom concentrations of hydrous species retained in thequenched glass using equations and parameters in Huiet al. (2008). The self-consistency also means that the effectdue to densification of glass at high pressure is minimized.The inferred apparent equilibrium temperature (i.e., glasstransition temperature) depends on cooling rate as well as
pressure. With the recorded cooling rate and known pres-sure, viscosity was inferred from Eq. (5) at the apparentequilibrium temperature. The 2r error for viscosity inferredfrom this method is estimated to be 0.2 in terms of log g(Zhang et al., 2003).
In addition to the experiments in the piston-cylinderapparatus at pressures below 3 GPa, we also carried outsome experiments at pressures above 3 GPa in a multi-anvildevice at the University of Michigan. However, these exper-imental charges crystallized, which also occurred in theequilibrium experiments at pressures above 3 GPa (Huiet al., 2008). Because of the extreme difficulty, we did notpursue these higher-pressure experiments further.
2.2. Direct viscosity measurement by parallel-plate
viscometer
We also used the parallel-plate creep viscometer in aninternally-heated pressure vessel at University of Hannoverto measure viscosity of rhyolitic melts near the glass transi-tion temperature. Melt viscosity was derived from the rateof deformation of a cylindrical sample with a diameter of3.8 mm and a height of 10 mm as a function of a verticallyapplied constant stress. The design, operation and calibra-tion of the viscometer are described in detail by Schulzeet al. (1999). The detailed experimental procedure is ex-plained in Behrens and Schulze (2003). This technique canmeasure viscosity of the same cylinder in the high viscosityrange covering three orders of magnitude from 108.5 to1011.5 Pa�s at pressures up to 0.4 GPa by pumping in Ar

Pressure dependence of viscosity of rhyolitic melts 3685
(pressure media) or releasing it. The effect of dehydration ofthe sample on the viscosity measurements was monitoredby repeated viscosity measurements at the same P–T condi-tions during the whole experimental course; and water con-tent in the sample was also checked after the experiment byinfrared spectroscopy.
To limit the effect of dehydration of the samples duringmeasurement, only samples with relatively low water con-tent were used in this method, including sample EDF with0.13 wt% H2Ot, and sample KS with 0.8 wt% H2Ot. Forsample EDF, viscosity was measured at different pressuresduring a cycle from 0.2 to 0.4 to 0.2 GPa. As shown in Ta-ble 2 and Fig. 2A, the viscosity values at the first and last0.2 GPa cycle are in good agreement with differences lessthan ±0.1 log units, indicating that there was no significantwater loss or gain during viscosity measurement. Tempera-ture was corrected based on the melting point of aluminumat 0.2 GPa (Lees and Williamson, 1965). For sample KS,dehydration occurred in a test run of long cycles. Hence,we minimized the heating duration and only measured vis-cosity at 0.4 GPa without cycling back and forth. In thisway the time spent by the sample at high temperatureswas kept to a minimum. Temperature in this measurementwas corrected based on the melting point of zinc at 0.4 GPa(Akella et al., 1973). After experiments, both samples werestill in good cylinder shapes, indicating negligible tempera-
Fig. 2. Viscosity of rhyolitic melts (EDF, KS, GMR+2 and GMR+4) as afrom kinetic water speciation experiments except for those for EDF anStraight lines are fit of the data by the Arrhenius equation (i.e., Eq. (6)).from Zhang et al. (2003) as references.
ture gradient and smooth deformation during creep exper-iments. Both samples were checked for water content byFTIR spectroscopy after isobaric quench of the experimen-tal charge. Water loss or gain was negligible in both viscos-ity measurement series. The reproducibility of viscosities isalways within ±0.15 log units (Behrens and Schulze, 2003).Within any single series of experiments, the precision iseven better (within ±0.1 log units in this study).
3. EXPERIMENTAL RESULTS
Experimental results from the hydrous species reactionin rhyolitic melts are summarized in Tables 3 and 4. Origi-nal IR absorbance peak heights are also reported in casethere will be further improvement in the IR calibration inthe future. The results from equilibrium experiments at0.4 GPa are plotted in Fig. 3A. These speciation data arein good agreement with the speciation model (Eq. (6))developed in Hui et al. (2008) as shown in Fig. 3B. Theequilibrium line from Fig. 3A is used to infer apparent equi-librium temperature based on the hydrous species concen-trations in the rhyolitic glass cooled down at a certainrate at 0.4 GPa as shown in Fig. 3C.With Eq. (5), viscosityis inferred at the apparent equilibrium temperature fromthe cooling rate. Viscosity is plotted as a function of1000/T at different pressures in Figs. 3D and 4. Within
function of temperature at various pressures. All data were derivedd KS at 0.2 and 0.4 GPa where creep experiments were also used.Viscosities of various rhyolitic melts at 0.0001 GPa were calculated

Table 4Viscosity of hydrous rhyolitic melts at various pressures inferred from hydrous species reactions.
Measurement# Pa
(GPa)qb
(K/s)Abs.5200
Abs.4500
Thickness(mm)
H2Ot
(wt%)H2Om
(wt%)OH(wt%)
Tae
(K)log g(Pa�s)
KS-1-2.1 0.94 9.56 0.0448 0.1608 1.124 0.846 0.170 0.677 906.03 10.47KS-1-2.2 0.94 9.56 0.0447 0.1604 1.118 0.849 0.170 0.679 907.11 10.47KS-1-2.3 0.94 9.56 0.0441 0.1610 1.126 0.843 0.167 0.677 911.23 10.47KS-1-3.1 0.94 0.99 0.0557 0.1717 1.195 0.877 0.198 0.678 862.61 11.45KS-1-3.2 0.94 0.99 0.0539 0.1689 1.190 0.862 0.193 0.669 863.08 11.45KS-1-3.3 0.94 0.99 0.0585 0.1748 1.198 0.898 0.208 0.690 859.79 11.45KS-1-4.1 0.94 0.10 0.0649 0.1883 1.373 0.843 0.201 0.642 829.61 12.45KS-1-4.2 0.94 0.10 0.0626 0.1857 1.370 0.829 0.194 0.634 831.31 12.45KS-1-4.3 0.94 0.10 0.0646 0.1883 1.371 0.844 0.200 0.643 831.40 12.45KS-1-5.1 0.94 92.33 0.0432 0.1720 1.163 0.862 0.158 0.704 954.99 9.48KS-1-5.2 0.94 92.33 0.0432 0.1700 1.150 0.864 0.160 0.704 951.13 9.48KS-1-5.3 0.94 92.33 0.0435 0.1708 1.164 0.857 0.159 0.698 946.06 9.48GMR+2-1-1.1 0.94 9.50 0.1720 0.2272 0.990 1.886 0.747 1.140 808.08 10.47GMR+2-1-1.2 0.94 9.50 0.1709 0.2268 0.987 1.886 0.744 1.142 809.82 10.47GMR+2-1-1.3 0.94 9.50 0.1729 0.2275 0.991 1.890 0.750 1.140 807.37 10.47GMR+2-1-2.1 0.94 1.00 0.1729 0.2048 0.911 1.920 0.816 1.104 774.82 11.45GMR+2-1-2.2 0.94 1.00 0.1750 0.2064 0.910 1.942 0.827 1.115 776.83 11.45GMR+2-1-2.3 0.94 1.00 0.1712 0.2030 0.909 1.905 0.810 1.096 773.10 11.45GMR+2-1-3.1 0.94 0.10 0.1105 0.1131 0.502 2.041 0.947 1.094 743.24 12.45GMR+2-1-3.2 0.94 0.10 0.1089 0.1118 0.498 2.031 0.941 1.090 742.89 12.45GMR+2-1-3.3 0.94 0.10 0.1097 0.1123 0.504 2.017 0.937 1.080 740.02 12.45GMR+4-1-2.1 0.94 9.68 0.2159 0.1114 0.356 4.116 2.667 1.449 701.15 10.46GMR+4-1-2.2 0.94 9.68 0.2137 0.1107 0.351 4.141 2.678 1.462 704.00 10.46GMR+4-1-2.3 0.94 9.68 0.2152 0.1107 0.356 4.094 2.657 1.437 698.69 10.46GMR+4-1-3.1 0.94 76.87 0.1467 0.0859 0.268 3.937 2.403 1.534 733.94 9.56GMR+4-1-3.2 0.94 76.87 0.1540 0.0901 0.282 3.925 2.397 1.529 733.01 9.56GMR+4-1-3.3 0.94 76.87 0.1548 0.0885 0.276 3.989 2.463 1.526 728.97 9.56GMR+4-1-4.1 0.94 1.00 0.1509 0.0789 0.271 3.779 2.440 1.339 684.09 11.45GMR+4-1-4.2 0.94 1.00 0.1509 0.0779 0.267 3.815 2.477 1.338 682.11 11.45GMR+4-1-4.3 0.94 1.00 0.1498 0.0792 0.275 3.711 2.386 1.325 682.96 11.45KS-2-1.1 1.89 1.00 0.0111 0.0396 0.270 0.871 0.175 0.696 883.40 11.45KS-2-1.2 1.89 1.00 0.0106 0.0397 0.280 0.832 0.161 0.671 885.52 11.45KS-2-2.1 1.89 134.16 0.0431 0.1862 1.201 0.898 0.153 0.745 984.15 9.32KS-2-2.2 1.89 134.16 0.0381 0.1769 1.192 0.844 0.136 0.708 989.96 9.32KS-2-2.3 1.89 134.16 0.0428 0.1851 1.202 0.890 0.152 0.739 979.76 9.32KS-2-3.1 1.89 9.65 0.0496 0.1892 1.246 0.895 0.169 0.726 923.76 10.47KS-2-3.2 1.89 9.65 0.0462 0.1842 1.234 0.871 0.159 0.712 931.37 10.47KS-2-3.3 1.89 9.65 0.0466 0.1848 1.245 0.867 0.159 0.707 927.31 10.47KS-2-4.1 1.89 0.10 0.0384 0.1244 0.859 0.875 0.190 0.685 847.43 12.45KS-2-4.2 1.89 0.10 0.0368 0.1219 0.856 0.855 0.183 0.672 847.46 12.45KS-2-4.3 1.89 0.10 0.0360 0.1203 0.849 0.849 0.180 0.668 847.82 12.45GMR+2-2-2.1 1.89 9.50 0.1595 0.2196 0.870 2.071 0.789 1.282 823.15 10.47GMR+2-2-2.2 1.89 9.50 0.1579 0.2181 0.870 2.052 0.781 1.271 820.82 10.47GMR+2-2-2.3 1.89 9.50 0.1611 0.2184 0.860 2.097 0.807 1.290 821.42 10.47GMR+2-2-3.1 1.89 1.00 0.2053 0.2498 0.997 2.147 0.887 1.259 786.31 11.45GMR+2-2-3.2 1.89 1.00 0.2008 0.2459 0.989 2.123 0.875 1.248 784.66 11.45GMR+2-2-3.3 1.89 1.00 0.2032 0.2484 0.997 2.129 0.878 1.251 785.17 11.45GMR+2-2-5.1 1.89 90.72 0.1539 0.2177 0.831 2.142 0.798 1.343 847.45 9.49GMR+2-2-5.2 1.89 90.72 0.1526 0.2165 0.825 2.144 0.797 1.347 849.47 9.49GMR+2-2-5.3 1.89 90.72 0.1530 0.2180 0.825 2.158 0.799 1.359 854.15 9.49GMR+4-2-3.1 1.89 1.00 0.4415 0.2595 0.797 3.997 2.433 1.564 716.58 11.45GMR+4-2-3.2 1.89 1.00 0.4356 0.2573 0.796 3.954 2.402 1.552 715.02 11.45GMR+4-2-3.3 1.89 1.00 0.4453 0.2581 0.797 4.002 2.454 1.548 711.81 11.45GMR+4-2-4.1 1.89 107.00 0.2441 0.1593 0.465 4.004 2.306 1.698 757.59 9.42GMR+4-2-4.2 1.89 107.00 0.2370 0.1551 0.457 3.957 2.277 1.680 754.55 9.42GMR+4-2-4.3 1.89 107.00 0.2484 0.1621 0.473 4.005 2.307 1.698 757.54 9.42GMR+4-2-5.1 1.89 9.67 0.3797 0.2294 0.677 4.115 2.467 1.648 736.32 10.46GMR+4-2-5.2 1.89 9.67 0.3914 0.2307 0.677 4.195 2.545 1.650 733.18 10.46GMR+4-2-5.3 1.89 9.67 0.3914 0.2320 0.680 4.188 2.534 1.655 734.81 10.46KS-3-1.1 2.86 1.00 0.0491 0.2066 1.408 0.847 0.148 0.699 916.18 11.45KS-3-1.2 2.86 1.00 0.0493 0.2064 1.408 0.847 0.149 0.698 913.16 11.45
(continued on next page)
3686 H. Hui et al. / Geochimica et Cosmochimica Acta 73 (2009) 3680–3693

Table 4 (continued)
Measurement# Pa
(GPa)qb
(K/s)Abs.5200
Abs.4500
Thickness(mm)
H2Ot
(wt%)H2Om
(wt%)OH(wt%)
Tae
(K)log g(Pa�s)
KS-3-1.3 2.86 1.00 0.0489 0.2064 1.407 0.846 0.148 0.698 916.67 11.45KS-3-2.1 2.83 0.99 0.0534 0.2252 1.535 0.846 0.148 0.698 916.66 11.45KS-3-2.2 2.83 0.99 0.0538 0.2256 1.533 0.850 0.149 0.701 915.89 11.45KS-3-2.3 2.83 0.99 0.0563 0.2289 1.530 0.871 0.157 0.714 912.06 11.45KS-3-9.1 2.83 0.10 0.0479 0.1785 1.221 0.861 0.167 0.694 865.65 12.45KS-3-9.2 2.83 0.10 0.0490 0.1803 1.225 0.870 0.170 0.700 864.01 12.45KS-3-9.3 2.83 0.10 0.0472 0.1765 1.218 0.852 0.165 0.687 862.42 12.45KS-3-8.1 2.83 9.56 0.0546 0.2581 1.760 0.831 0.132 0.699 968.21 10.47KS-3-8.2 2.83 9.56 0.0638 0.2732 1.756 0.903 0.155 0.748 957.34 10.47KS-3-8.3 2.83 9.56 0.0628 0.2723 1.757 0.897 0.152 0.744 960.32 10.47KS-3-11.1 2.83 111.66 0.0332 0.1907 1.389 0.751 0.102 0.649 1021.91 9.40KS-3-11.2 2.83 111.66 0.0335 0.1925 1.395 0.755 0.102 0.653 1026.81 9.40KS-3-11.3 2.83 111.66 0.0335 0.1929 1.395 0.757 0.102 0.655 1029.21 9.40KS-3-11.4 2.83 111.66 0.0336 0.1925 1.392 0.757 0.103 0.655 1026.15 9.40GMR+2-3-2.1 2.83 9.07 0.1210 0.2070 0.823 1.925 0.632 1.293 851.32 10.49GMR+2-3-2.2 2.83 9.07 0.1260 0.2089 0.818 1.977 0.662 1.315 848.23 10.49GMR+2-3-2.3 2.83 9.07 0.1263 0.2093 0.823 1.968 0.660 1.308 845.58 10.49GMR+2-3-3.1 2.83 1.00 0.1726 0.2538 1.004 2.030 0.740 1.290 802.91 11.45GMR+2-3-3.2 2.83 1.00 0.1740 0.2539 1.004 2.035 0.746 1.289 800.63 11.45GMR+2-3-3.3 2.83 1.00 0.1664 0.2503 1.004 1.983 0.713 1.270 803.50 11.45GMR+2-3-4.1 2.83 104.30 0.0852 0.1523 0.594 1.944 0.617 1.327 878.19 9.43GMR+2-3-4.2 2.83 104.30 0.0849 0.1485 0.572 1.984 0.638 1.346 876.98 9.43GMR+2-3-4.3 2.83 104.30 0.0823 0.1449 0.558 1.981 0.634 1.347 879.44 9.43GMR+4-3-4.1 2.83 1.00 0.2215 0.1709 0.518 3.540 1.869 1.671 739.53 11.45GMR+4-3-4.2 2.83 1.00 0.2256 0.1729 0.516 3.614 1.913 1.702 744.70 11.45GMR+4-3-4.3 2.83 1.00 0.2210 0.1673 0.503 3.605 1.922 1.683 738.43 11.45GMR+4-3-5.1 2.83 107.00 0.1838 0.1477 0.417 3.766 1.931 1.835 781.53 9.42GMR+4-3-5.2 2.83 107.00 0.1812 0.1464 0.410 3.793 1.938 1.855 786.93 9.42GMR+4-3-5.3 2.83 107.00 0.1873 0.1509 0.422 3.803 1.946 1.857 786.73 9.42
Note. #A few points (two to four) were measured by IR for each experimental sample; they are listed here as xxx.1, .2, .3 or .4.a P has been corrected based on pressure calibration.b q was calculated from the thermal history recorded by computer or manually.
Pressure dependence of viscosity of rhyolitic melts 3687
the small temperature range of viscosity measurements,temperature dependence of viscosity of rhyolitic melts ateach pressure can be described by the Arrheniusrelationship:
g ¼ g0 � expEa
RT
� �; ð6Þ
where g0 is the pre-exponential factor and Ea is the activa-tion energy for viscous flow, which depends on water con-tent and pressure. Viscosity of rhyolitic melts decreaseswith increasing water content systematically at a given pres-sure and temperature as shown in Fig. 4.
Viscosities of samples EDF and KS obtained fromthe parallel-plate creep viscometer are listed in Table2 including chronological order of measurements andshown in Fig. 2A and B. Temperature dependence ofviscosity of each sample at each pressure can also bedescribed by the Arrhenius relationship (i.e., Eq. (6))within the small temperature range of measurements.
The pressure dependence of viscosity in the high viscos-ity range is more complicated than the temperature depen-dence and the water content dependence. For the ‘‘dry”
sample (EDF), viscosity does not change significantly from0.1 MPa to 0.2 GPa. From 0.2 to 0.4 GPa, the viscosity of
sample EDF decreases by about 0.2 log units. For the hy-drous samples with 0.8 and 2 wt% H2Ot (KS andGMR+2), viscosity increases monotonically by about 1log unit as pressure increases from 0.1 MPa to 2.8 GPa.For hydrous sample with about 4 wt% H2Ot (GMR+4),viscosity first decreases as pressure increases from0.1 MPa to 0.9 GPa, and then increases from 0.9 to2.8 GPa.
4. DISCUSSION
4.1. Comparison of two viscometers at 0.4 GPa
The viscosity data of sample KS inferred from hydrousspecies reaction and measured by parallel-plate creep vis-cometer at 0.4 GPa are compared in Fig. 3D. The two datasets from two different experimental techniques in two dif-ferent laboratories agree well with each other. This excellentagreement shows that the indirect viscosity inference fromhydrous species reaction kinetics in rhyolitic melt can be ap-plied to high pressure in addition to successful applicationsat ambient pressure (Zhang et al., 2003; Zhang and Xu,2007).

Fig. 3. Equilibrium and cooling experiments of sample KS at 0.4 GPa. (A) Equilibrium experiments at 0.4 GPa. (B) Comparison ofexperimental K values from this study and calculated values from speciation model (Eq. (6) of Hui et al., 2008) at 0.4 GPa. (C) Calculation ofthe apparent equilibrium temperature in cooled glasses based on the speciation model (i.e., equation in Fig. 3A). (D) Comparison of viscositydata at 0.4 GPa from two different methods: inferred from hydrous species reaction (solid circles) and measured by parallel-plate creepviscometer (open squares).
3688 H. Hui et al. / Geochimica et Cosmochimica Acta 73 (2009) 3680–3693
4.2. Pressure dependence of viscosity
Viscosities of a variety of silicate liquids in the low vis-cosity range have been investigated using the falling spheretechnique in high-pressure apparatus, demonstrating acomplex pressure dependence of viscosities (e.g., Kushiro,1976; Scarfe et al., 1987; Lange, 1994; Tinker et al., 2004;Liebske et al., 2005). Pressure-induced viscosity changehas been related to the degree of polymerization of the meltin general (Scarfe et al., 1987). Viscosities of anhydrous rhy-olite melt (e.g., Scarfe et al., 1987), jadeite melt (e.g., Kus-hiro, 1976), dacite melt (e.g., Tinker et al., 2004), andesitemelt (e.g., Kushiro et al., 1976), and some basalt melts(e.g., Scarfe et al., 1987) decrease with increasing pressurein the first several GPa, whereas those of diopside melt(e.g., Scarfe et al., 1979) and peridotite melt (Liebskeet al., 2005), both highly depolymerized, increase withincreasing pressure.
Water dissolved in the silicate melt can depolymerize themelt by forming hydroxyl groups (Reaction (1)). Hence, thenegative pressure dependence of viscosity of anhydrouspolymerized melt may change to positive pressure depen-dence after adding a certain amount of water. For example,viscosity of anhydrous andesite melt decreases with
pressure (Kushiro et al., 1976), but viscosity of andesitewith 3 wt% water increases with pressure (Kushiro, 1978).Also, the pressure dependence of viscosity of a given meltmay change from positive to negative with further increaseof pressure, such as periodite (Liebske et al., 2005), or fromnegative to positive, such as albite (Funakoshi et al., 2002).In other words, there may be a viscosity maximum or min-imum with increasing pressure.
In the high viscosity range, only a few studies havebeen conducted on the pressure dependence of viscosityof silicate melts in a pressure range up to 0.4 GPa. Vis-cosity of the albite–diopside binary system shows achange in the sign of the pressure dependence from neg-ative for albite to positive for diopside (Schulze et al.,1999; Behrens and Schulze, 2003). The pressure depen-dence of viscosity of haploandesite in the high viscosityrange changes from neutral to slightly negative for anhy-drous melt to positive for hydrous melt with 1.06 wt%water or up (Liebske et al., 2003). This is consistentwith pressure dependence of viscosity of andesite inthe low viscosity range (Kushiro et al., 1976; Kushiro,1978). Moreover, as temperature decreases, increasingpressure tends to lead to increasing viscosity for hydrousrhyolitic melts (Ardia et al., 2008).

Fig. 4. Dependence of viscosities of rhyolitic melts (EDF, KS, GMR+2 and GMR+4) on temperature at pressures of 0.4, 0.94, 1.89 and2.83 GPa. All data are from this study: data at 0.4 GPa (A) are measured by parallel-plate creep viscometer (samples EDF and KS) andinferred from hydrous species reaction (sample KS), and data at higher pressures (B–D) are inferred from hydrous species reaction. Straightlines are fit of the data by the Arrhenius equation (i.e., Eq. (6)).
Pressure dependence of viscosity of rhyolitic melts 3689
Due to experimental limitations (see Section 2.2), wemeasured viscosity of sample EDF, which contained minoramounts of water, only at pressures 60.4 GPa. The viscos-ity decreases with increasing pressure as shown in Fig. 2Ain this pressure range. That is, it behaves as a polymerizedmelt, as expected. But for the hydrous samples KS andGMR+2 as shown in Fig. 2B and C, the viscosity increaseswith increasing pressure based on our data. As dissolvedH2O depolymerizes the melt, this trend is consistent withthe literature data (Kushiro et al., 1976; Kushiro, 1978; Lie-bske et al., 2003). The viscosities of the sample GMR+4,which contains about 4 wt% water, increase systematicallyfrom 1 GPa to 3 GPa as shown in Fig. 2D. The pressuredependence of viscosity from ambient pressure to 1 GPais small and whether the dependence is positive or negativedepends on the temperature.
4.3. Modeling the P-T-X dependence of viscosity
There are various models used to describe tempera-ture dependence of viscosity of anhydrous and hydrousnatural silicate melts (e.g., Shaw, 1972; Hui and Zhang,2007). The pressure dependence of viscosity in the lowviscosity range has been modeled for some anhydrousmelts, such as peridotite liquid (Liebske et al., 2005),
or hydrous melts, such as rhyolite liquid (Ardia et al.,2008), but this quantification for natural silicate meltsat high pressures (P1 GPa) has never been extendedto the high viscosity range because no experimental datawere available at those high pressures (see Section 1).Our data are the first viscosity data at pressuresP1 GPa in the low-temperature (high viscosity) range.With the high-pressure viscosity data in the high viscos-ity range from this study and the ones in the low viscos-ity range from the literature (Shaw, 1963; Schulze et al.,1996; Ardia et al., 2008), we make an effort to constructa general viscosity model of rhyolitic melts as a functionof temperature, pressure and water content from low tohigh viscosity range. There are a couple of models forlow-pressure viscosity of rhyolitic melts (e.g., Hess andDingwell, 1996; Zhang et al., 2003; Girodano et al.,2004). Here we extend the viscosity model of Zhanget al. (2003) to high pressures because the model applieswell to both hydrous and H2O-free melt and both lowand high viscosities (up to 1017 Pa�s) (Zhang and Xu,2007). The data used for the model include viscositydata from this study and literature data at high pres-sures and ambient pressure (Shaw, 1963; data on rhyo-lite in Neuville et al., 1993; data on EDF and BL6 inStevenson et al., 1995; Schulze et al, 1996; Zhang

Fig. 6. P–T–XH2Ot range of all experimental data used to constructour model, i.e., Eq. (7).
3690 H. Hui et al. / Geochimica et Cosmochimica Acta 73 (2009) 3680–3693
et al., 2003; Zhang and Xu, 2007; Ardia et al., 2008).After some trials, we found the equation below can fitthe data well:
logg¼ � log exp 18:5611þa �P 0:5�ð49:584þb �P 0:5Þ �1000
T
� ��
þexp ð1:47517þc �PÞ� 1795:5
T
� �1:9448þd�P" #
�X 1þ ð1:8122þe�PÞ�1000Tð Þ2o; ð7Þ
where P is the pressure in GPa, T is the temperature in K,and X is the mole fraction of total dissolved H2O on a singleoxygen basis (Stolper, 1982b; Zhang, 1999) and is calcu-lated as (C/18.015)/[C/18.015 + (100 � C)/32.49] where C
is H2Ot in wt%. The values of 18.5611, 49.584, 1.47517,etc. are from the low-pressure viscosity model of Zhanget al. (2003). Five additional parameters are added intothe model to accommodate the pressure effect on viscosity.The best-fit parameters in Eq. (7) are: a = �2.5557,b = �7.0285, c = 1.6863, d = �0.4132, e = 0.1822. Thisequation can reproduce the whole database (313 datapoints) with 2r of 0.43 in terms of log g and all high-pres-sure viscosity data with 2r of 0.48. Fig. 5 shows a compar-ison between experimental viscosities and calculated valuesusing Eq. (7). Although the fit is good, extrapolation of themodel beyond experimental conditions is not recom-mended. That is, calculated viscosity at high pressuresshould be inside the range of 102–1012 Pa�s (at low pressuresthe model applies to a larger viscosity range of 102–1017 Pa�s), and T–P–XH2Ot conditions should be withinconditions shown in Fig. 6. The calculated pressure depen-dence of viscosity of rhyolitic melts with different watercontents is shown in Fig. 7 and it is in agreement withFig. 2B–D.
Compared to the model of Ardia et al. (2008), (1) ourmodel covers a wider range of viscosity (and slightly higherpressure); and (2) our model can reproduce the data of Ar-
Fig. 5. Comparison of experimental viscosity data of rhyoliticmelts with those calculated from Eq. (7). Data are from: Shaw(1993), Neuville et al. (1993), Stevenson et al. (1995), Schulze et al.(1996), Zhang et al. (2003), Zhang and Xu (2007), and Ardia et al.(2008).
dia et al. (2008) to a 2r of 0.44 in log g, slightly better thantheir own model with 2r of 0.52. On the other hand, if themodel of Ardia et al. (2008) is applied to predict our data,the predictions are lower than our data by up to 4.9 log gunits, which is understandable because high viscosity dataat high pressures were not available for their model calibra-tion. Hence, the calculated isokom temperature in Ardiaet al. (2008) at 1012 Pa�s and 1.5 GPa is significantly off.As shown in Fig. 8A, the discrepancy between the isokomtemperatures predicted by the two models becomes largeas water content in the melt increases. The isokom temper-ature calculated from Ardia et al. (2008) is about 170 Klower than that from Eq. (7) when water content in the meltis 4 wt%.
The dependence of viscosity as a function of OH andmolecular H2O concentrations was also examined at differ-ent pressures using the speciation model of Hui et al.(2008), but no simple relation emerged for a large rangeof water content. Hence, no species information is includedin fitting how viscosity depends on water concentration.
There is some compositional difference between GMR(with 73 wt% SiO2) and other calc-alkaline rhyolitic melts(with 76–77 wt% SiO2) in this study and literature. It ishence worthwhile to examine whether the compositional

Fig. 7. Pressure effect on viscosity at some temperatures and water concentrations. The curves (with temperature indicated by large numbers)are calculated from Eq. (7) with different water concentrations: (A) 0.13 wt%, (B) 0.8 wt%, (C) 2 wt% and (D) 4 wt%. Points are experimentaldata at indicated temperatures (small numbers) and different symbols mean different samples.
Pressure dependence of viscosity of rhyolitic melts 3691
difference is significant such that the data on GMR areinconsistent with other data. When these compositions wereused to calculate the viscosity at 1.8–4.2 wt% H2Ot and vis-cosity range of 109.4–1012.5 Pa�s (that is, the experimentalconditions in this work) using the model of Hui and Zhang(2007), the viscosity of GMR melt differs from that of EDFor KS melts by less than 0.15 log units, which is within theuncertainty of the viscosity model of Hui and Zhang (2007),and also within the measurement uncertainty of this work.Hence, the viscosity data for all compositions in this workare consistent with themselves and also with the viscositydata on typical calc-alkaline rhyolites with 76–77 wt%SiO2. That is, the viscosity model constructed above canbe applied to typical calc-alkaline rhyolitic melts with 76–77 wt% SiO2. However, at lower H2Ot, the viscosity differ-ence between GMR melt and other rhyolitic melts can belarger due to stronger compositional dependence of viscos-ity at low H2Ot (high viscosity). Therefore, it is not recom-mended to apply the viscosity model constructed above(i.e., Eq. (7)) to GMR melt (rhyolite with lower SiO2) con-taining less than 1.0 wt% H2Ot.
The glass transition temperature is an important rheo-logical parameter of melts. Eqs. (5) and (7) can be used toestimate the glass transition temperature of rhyolitic meltunder high pressure for a known cooling rate q. Fig. 8B
shows the pressure dependence of glass transition tempera-tures of hydrous rhyolitic melts containing different watercontents calculated from Eqs. (5) and (7) with a cooling rateof 0.28 K/s = 16.8 K/min (at g = 1012 Pa�s). The glass tran-sition temperature (Fig. 8B) for the rhyolitic melts with 0.8,2 and 4 wt% water increases with increasing pressure.
5. CONCLUDING REMARKS
By comparing with parallel-plate creep viscometer, weverified that the method of inferring viscosity from hydrousspecies reaction in rhyolitic melt can be extended to highpressures. We inferred viscosity of hydrous rhyolitic meltscontaining 0.8–4 wt% water using the hydrous species reac-tion in melt at pressures up to 2.83 GPa in the high viscosityrange. This represents the first viscosity data at low temper-ature (high viscosity) and pressures above 1 GPa. Combin-ing the data of this study with literature data, we present aviscosity model as a function of temperature, pressure, andwater content. The model (i.e., Eq. (7)) represents the firstsuccess to model the dependence of the viscosity (includingboth high and low viscosities) of a melt as a function oftemperature, H2O content and pressure. It can be utilizedfor interpolation within the range of available data(Fig. 6), but is not recommended for extrapolation.

Fig. 8. (A) Effect of water on isokom temperatures at 1.5 GPawhen g = 1012 Pa�s corresponding to glass transition. The solid lineis calculated from Eq. (7) and the dashed line is from model inArdia et al. (2008). (B) The pressure dependence of glass transitiontemperatures of hydrous rhyolitic melts with different watercontents (0.8, 2 and 4 wt% H2O) calculated from Eq. (7) wheng = 1012 Pa�s (i.e., cooling rate is 0.28 K/s).
3692 H. Hui et al. / Geochimica et Cosmochimica Acta 73 (2009) 3680–3693
ACKNOWLEDGMENTS
We thank M. Toplis for editorial handling as well as insightfulcomments, and C.E. Lesher, A. Priven and an anonymous reviewerfor insightful reviews. This research is supported by NSF GrantsEAR-0537598 and EAR-0711050.
REFERENCES
Akella J., Ganguly J., Grover R. and Kennedy G. (1973) Meltingof lead and zinc to 60 kbar. J. Phys. Chem. Solids 34, 631–636.
Ardia P., Giordano D. and Schmidt M. W. (2008) A model for theviscosity of rhyolite as a function of H2O-content and pressure:a calibration based on centrifuge piston cylinder experiments.Geochim. Cosmochim. Acta 72, 6103–6123.
Behrens H. and Jantos N. (2001) The effect of anhydrouscomposition on water solubility of granitic melts. Am. Mineral.
86, 14–20.
Behrens H. and Nowak M. (2003) Quantification of H2O specia-tion in silicate glasses and melts by IR spectroscopy – in situversus quench techniques. Phase Trans. 76, 45–61.
Behrens H. and Schulze F. (2003) Pressure dependence of meltviscosity in the system NaAlSi3O8–CaMgSi2O6. Am. Mineral.
88, 1351–1363.
Behrens H., Zhang Y., Leschik M., Wiedenbeck M., Heide G. andFrischat G. H. (2007) Molecular H2O as carrier for oxygendiffusion in hydrous silicate melts. Earth Planet. Sci. Lett. 254,
69–76.
Bottinga Y. and Weill D. F. (1972) The viscosity of magmaticsilicate liquids: a model for calculation. Am. J. Sci. 272, 438–
475.
Dingwell D. B. (1986) Viscosity–temperature relationships in thesystem Na2Si2O5–Na4Al2O5. Geochim. Cosmochim. Acta 50,
1261–1265.
Dingwell D. B. (1998) Melt viscosity and diffusion under elevatedpressures. Rev. Mineral. 37, 397–422.
Dingwell D. B. and Webb S. L. (1990) Relaxation in silicate melts.Eur. J. Mineral. 2, 427–449.
Dorfman A., Dingwell D. B. and Bagdassarov N. S. (1997) Arotating autoclave for centrifuge studies: falling sphere viscom-etry. Eur. J. Mineral. 9, 345–350.
Friedman I., Long W. and Smith R. L. (1963) Viscosity and watercontent of rhyolitic glass. J. Geophys. Res. 68, 6523–6535.
Funakoshi K.-i., Suzuki A. and Terasaki H. (2002) In situ viscositymeasurements of albite melt under high pressure. J. Phys.:
Condens. Matter 14, 11343–11347.
Girodano D., Romano C., Dingwell D. B., Poe B. and Behrens H.(2004) The combined effects of water and fluorine on the viscosityof silicic magmas. Geochim. Cosmochim. Acta 68, 5159–5168.
Hess K.-U. and Dingwell D. B. (1996) Viscosities if hydrousleucogranitic melts: a non-Arrhenian model. Am. Mineral. 81,
1297–1300.
Hui H. and Zhang Y. (2007) Toward a general viscosity equationfor natural anhydrous and hydrous silicate melts. Geochim.
Cosmochim. Acta 71, 403–416.
Hui H., Zhang Y., Xu Z. and Behrens H. (2008) Pressuredependence of the speciation of dissolved water in rhyoliticmelts. Geochim. Cosmochim. Acta 72, 3229–3240.
Hummel W. and Arndt J. (1985) Variation of viscosity withtemperature and composition in the plagioclase system. Con-
trib. Mineral. Petrol. 90, 83–92.
Ihinger P. D., Zhang Y. and Stolper E. M. (1999) The speciation ofdissolved water in rhyolitic melt. Geochim. Cosmochim. Acta 63,
3567–3578.
Kanzaki M., Kurita K., Fujii T., Kato T., Shimomura O. andAkimoto S. (1987) A new technique to measure the viscosityand density of silicate melts at high pressure. In High-Pressure
Research in Mineral Physics, vol. 39 (eds. M. H. Manghnaniand Y. Syono). Geophysical Monograph, pp. 195–200.
Kushiro I. (1976) Changes in viscosity and structure of melt ofNaAlSi2O6 composition at high pressures. J. Geophys. Res. 81,
6347–6350.
Kushiro I. (1978) Density and viscosity of hydrous calc-alkalicandesite magma at high pressures. Carnegie Inst. Washington
Year Book 77, 675–677.
Kushiro I., Yoder, Jr., H. S. and Myson B. O. (1976) Viscosities ofbasalt and andesite melts at high pressures. J. Geophys. Res. 81,
6351–6356.
Lange R. A. (1994) The effect of H2O, CO2 and F on the densityand viscosity of silicate melts. Rev. Mineral. 30, 331–365.
Lees J. and Williamson B. H. J. (1965) Combined very highpressure/high temperature calibration of the tetrahedral anvilapparatus, fusion curves of zinc, aluminium, germanium andsilicon to 60 kilobars. Nature 208, 278–279.
Liebske C., Behrens H., Holtz F. and Lange R. A. (2003) Theinfluence of pressure and composition on the viscosity ofandesitic melts. Geochim. Cosmochim. Acta 67, 473–485.

Pressure dependence of viscosity of rhyolitic melts 3693
Liebske C., Schmickler B., Terasaki H., Poe B. T., Suzuki A.,Funakoshi K.-i., Ando R. and Rubie D. C. (2005) Viscosity ofperidotite liquid up to 13 GPa: implications for magma oceanviscosities. Earth Planet. Sci. Lett. 240, 589–604.
Lillie H. R. (1931) Viscosity of glass between the strain point andmelting temperature. J. Am. Ceram. Soc. 14, 502–512.
Liu Y. and Zhang Y. (2000) Bubble growth in rhyolitic melt. Earth
Planet. Sci. Lett. 181, 251–264.
Moynihan C. T., Easteal A. J., Wilder J. and Tucker J. (1976)Dependence of the glass transition temperature on heating andcooling rate. J. Phys. Chem. 78, 2673–2677.
Neuville D. R. and Richet P. (1991) Viscosity and mixing in molten(Ca, Mg) pyroxenes and garnets. Geochim. Cosmochim. Acta
55, 1011–1019.
Neuville D. R., Courtial P., Dingwell D. B. and Richet P. (1993)Thermodynamic and rheological properties of rhyolite andandesite melts. Contrib. Mineral. Petrol. 113, 572–581.
Newman S., Stolper E. M. and Epstein S. (1986) Measurement ofwater in rhyolitic glasses: calibration of an infrared spectro-scopic technique. Am. Mineral. 71, 1527–1541.
Ni H. and Zhang Y. (2008) H2O diffusion models in rhyolitic meltwith new high pressure data. Chem. Geol. 250, 68–78.
Rapp R. P. and Watson E. B. (1995) Dehydration melting ofmetabasalt at 8–32 kbar: implications for continental growthand crust–mantle recycling. J. Petrol. 36, 891–931.
Reid J. E., Suzuki A., Funakoshi K., Terasaki H., Poe B. T., RubieD. C. and Ohtani E. (2003) The viscosity of CaMgSi2O6 liquidat pressures up to 13 GPa. Phys. Earth Planet. Inter. 139, 45–54.
Rosenhauer M., Scarfe C. M. and Virgo D. (1979) Pressuredependence of the glass transition temperature in glasses ofdiopside, albite, and sodium trisilicate composition. Carnegie
Inst. Washington Year Book 78, 556–559.
Scarfe C. M. and Cronin D. J. (1986) Viscosity–temperaturerelationships at 1 atm in the system diopside–albite. Am.
Mineral. 71, 767–771.
Scarfe C. M., Mysen B. O. and Virgo D. (1979) Changes inviscosity and density of melts of sodium disilicate, sodiummetasilicate, and diopside composition with pressure. Carnegie
Inst. Washington Year Book 78, 547–551.
Scarfe C. M., Mysen B. O. and Virgo D. (1987) Pressuredependence of the viscosity of silicate melts. In MagmaticProcesses: Physicochemical Principles. Geochem. Soc. Spec.
Pub. (ed. B.O. Mysen), vol. 1. pp. 59–67.Scherer G. W. (1984) Use of the Adam–Gibbs equation in the
analysis of structural relaxation. J. Am. Ceram. Soc. 67, 504–
511.
Schulze F., Behrens H. and Hurkuck W. (1999) Determination ofthe influence of pressure and dissolved water on the viscosity ofhighly viscous melts: application of a new parallel-plateviscometer. Am. Mineral. 84, 1512–1520.
Schulze F., Behrens H., Holtz F., Roux J. and Johannes W. (1996)The influence of H2O on the viscosity of a haplogranitic melt.Am. Mineral. 81, 1155–1165.
Shaw H. R. (1963) Obsidian-H2O viscosities at 1000 and 2000 barsin the temperature range 700 to 900 �C. J. Geophys. Res. 68,
6337–6343.
Shaw H. R. (1972) Viscosities of magmatic silicate liquids: anempirical method of prediction. Am. J. Sci. 272, 870–893.
Silver L. A., Ihinger P. D. and Stolper E. (1990) The influence ofbulk composition on the speciation of water in silicate glasses.Contrib. Mineral. Petrol. 104, 142–162.
Sipp A. and Richet P. (2002) Equivalence of volume, enthalpy andviscosity relaxation kinetics in glass-forming silicate liquids. J.
Non-Cryst. Solids 298, 202–212.
Stevenson R. J., Dingwell D. B., Webb S. L. and Bagdassarov N. S.(1995) The equivalence of enthalpy and shear stress relaxationin rhyolitic obsidians and quantification of the liquid–glasstransition in volcanic processes. J. Volcanol. Geotherm. Res. 68,
297–306.
Stolper E. M. (1982a) The speciation of water in silicate melts.Geochim. Cosmochim. Acta 46, 2609–2620.
Stolper E. M. (1982b) Water in silicate glasses: an infraredspectroscopic study. Contrib. Mineral. Petrol. 81, 1–17.
Sylvester P. J. (1998) Post-collisional strongly peraluminousgranites. Lithos 45, 29–44.
Tinker D., Lesher C. E., Baxter G. M., Uchida T. and Wang Y.(2004) High-pressure viscometry of polymerized silicate meltsand limitations of the Eyring equation. Am. Mineral. 89, 1701–
1708.
Toplis M. J., Gottsmann J., Knoche R. and Dingwell D. B. (2001)Heat capacities of haplogranitic glasses and liquids. Geochim.
Cosmochim. Acta 65, 1985–1994.
Whittington A., Richet P. and Holtz F. (2000) Water and theviscosity of depolymerized aluminosilicate melts. Geochim.
Cosmochim. Acta 64, 3725–3736.
Withers A. C. and Behrens H. (1999) Temperature-inducedchanges in the NIR spectra of hydrous albitic and rhyoliticglasses between 300 and 100 K. Phys. Chem. Miner. 27, 119–
132.
Zhang Y. (1994) Reaction kinetics, geospeedometry, and relaxationtheory. Earth Planet. Sci. Lett. 122, 373–391.
Zhang Y. (1999) H2O in rhyolitic glasses and melts: measurement,speciation, solubility, and diffusion. Rev. Geophys. 37, 493–516.
Zhang Y. and Behrens H. (2000) H2O diffusion in rhyolitic meltsand glasses. Chem. Geol. 169, 243–262.
Zhang Y., Belcher R., Ihinger P. D., Wang L., Xu Z. and NewmanS. (1997a) New calibration of infrared measurement ofdissolved water in rhyolitic glasses. Geochim. Cosmochim. Acta
61, 3089–3100.
Zhang Y., Jenkins J. and Xu Z. (1997b) Kinetics of the reactionH2O + O = 2OH in rhyolitic glasses upon cooling: geospeed-ometry and comparison with glass transition. Geochim. Cos-
mochim. Acta 61, 2167–2173.
Zhang Y., Stolper E. M. and Ihinger P. D. (1995) Kinetics of thereaction H2O + O = 2OH in rhyolitic and albitic glasses:Preliminary results. Am. Mineral. 80, 593–612.
Zhang Y., Stolper E. M. and Wasserburg G. J. (1991) Diffusion ofwater in the rhyolitic glasses. Geochim. Cosmochim. Acta 55,
441–456.
Zhang Y. and Xu Z. (2007) A long-duration experiment onhydrous species geospeedometer and hydrous melt viscosity.Geochim. Cosmochim. Acta 71, 5226–5232.
Zhang Y., Xu Z. and Behrens H. (2000) Hydrous speciesgeospeedometer in rhyolite: improved calibration andapplications. Geochim. Cosmochim. Acta 64, 3347–
3355.
Zhang Y., Xu Z. and Liu Y. (2003) Viscosity of hydrous rhyoliticmelts inferred from kinetic experiments, and a new viscositymodel. Am. Mineral. 88, 1741–1752.
Associate editor: Michael Toplis
Related Documents