President’s Report to Colleagues Dear IFTA Colleagues, Welcome to the new nor- mal! Although the world is still stuck in the pan- demic, some countries are opening up again—at least partly. So, it looks like we all can make the next step into “the new normal”—what- ever this might be. In the markets, we also face some kind of “new normal.” While most of us still focus on stocks, indexes, or commodities, cryptos are heading “to the moon” or falling down to the ground—both with the help of Elon Musk. Whereas stock investors aim for profits of 10, 50, or maybe 100 percent per year, crypto investors expect this within a couple of days—at the most. So, is this the “new normal” in investing now? Also, is it the “new normal” that a single tweet or late night show statement by Elon Musk causes crashlike moves of 50 percent in a whole asset class? Let’s hope not… IFTA also has stepped into a “new nor- mal.” With the IFTA podcast—available on iTunes or Spotify—we made a first step into new media accompanied by our growing YouTube channel and ongoing social media activities. And there is a new kid on the block as well. You already know the IFTA Journal and the IFTA Update. In May, we happily introduced our latest publication, the IFTA Magazine, and we look forward for your feedback. Finally, the American Association of Professional Technical Analysts (AAPTA) is hosting the 34 th IFTA Conference in a virtual format this year. On October 8 and 9, IFTA opens its doors again to technical analysts, investors, and traders from across the world. So, what was new for IFTA last year—the virtual conference—has already become normal. As IFTA, we are aware that things change in a rapid way—from new normal to normal—and we will provide the best support possible while going through this process. All the best, Wieland Arlt, CFTe IFTA President IFTA2021 CONFERENCE IS VIRTUAL! October 8–9, 2021 Financial analysis taken to new heights! For further information, see page 22. IN THIS ISSUE 1 President’s Report to Colleagues 2 Call for Board Nominations 3 Member News Education Lounge 4 Trend Following: A Proven Edge (Part 1) 9 Bitcoin vs. Risk: Understanding Volatility 12 Forecasting Long-Term Market Cycles Down to a Specific Day 15 Bitcoin: Dead or Alive 16 Interview With John Bollinger 21 Congratulations New CFTes 21 MFTA and CFTe Exam Dates 22 IFTA 2021 Conference 23 IFTA 2021 Conference Sponsor Information 28 Calendar-at-a-Glance 32 In Memoriam: J. Welles Wilder Jr. 33 In Memoriam: Adrian Kömel 34 IFTA Member Societies 34 Board of Directors 34 IFTA Staff Next Issue: September 2021 Submission Deadline: August 15 Education Lounge articles: Send submissions to [email protected]. All other content: Send submissions to [email protected]. Advertise in the UPDATE and reach more than 7,000+ IFTA colleagues worldwide. For more information, go to www.ifta.org. a newsletter for the colleagues of the International Federation of Technical Analysts 2021 Volume 28 Issue 2 The IFTA UPDATE is a publication of the International Federation of Technical Analysts, Inc. www.ifta.org, a not- for-profit professional organization incorporated in 1986. International Federation of Technical Analysts 1300 Piccard Drive, Suite LL 14 Rockville, MD 20850 USA Email: [email protected] • Phone: +1 240-404-6508

Welcome message from author
This document is posted to help you gain knowledge. Please leave a comment to let me know what you think about it! Share it to your friends and learn new things together.
Transcript
President’s Report to Colleagues
Dear IFTA Colleagues,
Welcome to the new nor-mal! Although the world is still stuck in the pan-demic, some countries are opening up again—at
least partly. So, it looks like we all can make the next step into “the new normal”—what-ever this might be.
In the markets, we also face some kind of “new normal.” While most of us still focus on stocks, indexes, or commodities, cryptos are heading “to the moon” or falling down to the ground—both with the help of Elon Musk. Whereas stock investors aim for profits of 10, 50, or maybe 100 percent per year, crypto investors expect this within a couple of days—at the most. So, is this the “new normal” in investing now?
Also, is it the “new normal” that a single tweet or late night show statement by Elon
Musk causes crashlike moves of 50 percent in a whole asset class? Let’s hope not…
IFTA also has stepped into a “new nor-mal.” With the IFTA podcast—available on iTunes or Spotify—we made a first step into new media accompanied by our growing YouTube channel and ongoing social media activities. And there is a new kid on the block as well. You already know the IFTA Journal and the IFTA Update. In May, we happily introduced our latest publication, the IFTA Magazine, and we look forward for your feedback.
Finally, the American Association of Professional Technical Analysts (AAPTA) is hosting the 34th IFTA Conference in a virtual format this year. On October 8 and 9, IFTA opens its doors again to technical analysts, investors, and traders from across the world.
So, what was new for IFTA last year—the virtual conference—has already become normal. As IFTA, we are aware that things change in a rapid way—from new normal to normal—and we will provide the best support possible while going through this process.
All the best,
Wieland Arlt, CFTeIFTA President
IFTA2021 CONFERENCE IS VIRTUAL!October 8–9, 2021Financial analysis taken to new heights! For further information, see page 22.
IN THIS ISSUE1 President’s Report to Colleagues 2 Call for Board Nominations3 Member NewsEducation Lounge
4 Trend Following: A Proven Edge (Part 1)
9 Bitcoin vs. Risk: Understanding Volatility
12 Forecasting Long-Term Market Cycles Down to a Specific Day
15 Bitcoin: Dead or Alive
16 Interview With John Bollinger21 Congratulations New CFTes21 MFTA and CFTe Exam Dates22 IFTA 2021 Conference23 IFTA 2021 Conference Sponsor Information28 Calendar-at-a-Glance32 In Memoriam: J. Welles Wilder Jr.33 In Memoriam: Adrian Kömel34 IFTA Member Societies34 Board of Directors34 IFTA Staff
Next Issue: September 2021Submission Deadline: August 15
Education Lounge articles: Send submissions to [email protected] other content: Send submissions to [email protected].
Advertise in the UPDATE and reach more than 7,000+ IFTA colleagues worldwide. For more information, go to www.ifta.org.
a newsletter for the colleagues of the International Federation of Technical Analysts2021 Volume 28 Issue 2 The IFTA UPDATE is a publication of the International Federation of Technical Analysts, Inc. www.ifta.org, a not-for-profit professional organization incorporated in 1986.
International Federation of Technical Analysts 1300 Piccard Drive, Suite LL 14
Rockville, MD 20850 USA Email: [email protected] • Phone: +1 240-404-6508
IFTAUPDATE 2021 Volume 28 Issue 2 page 2
IFTA is an international organization established to advance the interests of the global community of technical analysis societies. IFTA is managed by a board of directors, which is elected by the member societies at the Annual General Meeting, normally conducted at the time of IFTA’s Annual Conference. In selecting a slate of candidates for the IFTA board of directors, IFTA seeks to have the management resources, global representation, diversity, expertise and experience needed to advance its mission.
IFTA is now requesting nominations from individuals to serve on the board of directors for the October 2021–October 2024 term. IFTA estimates that seven board vacancies will be filled at the 2021 Virtual Annual General Meeting. Nominees must be willing to serve as a member or chair of a key IFTA committee and/or assist the committees and the board in ongoing work as needed.
Board members serve without payment for their work on the IFTA board of directors. Service on the IFTA board demands a high level of responsibility and a serious commitment to support IFTA’s mission; it also provides personal and professional rewards to its members. Nominations from all interested persons are welcome. The deadline to submit nominations is August 7, 2021.
The nomination procedure is simple:
1 Any member in good standing of an IFTA member society may be nominated or may nominate him/herself.
2 Nominations must be seconded by two members in good standing of an IFTA member society.
3 The nominee must have the support of the board of directors of a local member society, preferably his or or her own Society.
4 Each nominee must submit the following to IFTA Headquarters no later than August 7, 2021.a Completed Nomination Formb Completed IFTA Member Society Endorsementc Summary or Curriculum Vitae (CV)
5 All nomination materials should be sent by email or postal mail to:International Federation of Technical Analysts Phone: (240) 404-65081300 Piccard Drive, Suite LL 14 Fax: (301) 990-9771Rockville, Maryland 20850 USA Email: [email protected]
Nominations will be announced to the membership in early September. Voting will take place at the IFTA Annual General Meeting on or around October 23, 2020. If you have questions concerning this matter or would like a nominating form, please contact IFTA Admin at [email protected].
IFTA Board of Directors Nomination FormNomination Form: IFTA Board of Directors
Name of Nominee
Firm
Address
City State Postal Code Country
Phone Fax Email
Member in Good Standing of (Name of IFTA Member Society):
Nominated by
Persons seconding this nomination (must be members in good standing of an IFTA member society). Two seconders required.
1)Name Society
2)Name Society
Nominee must have the support of the board of his/her IFTA member society. A completed IFTA Member Society Endorsement (below) must accompany this Nomination Form. A summary of the nominee’s pro-fessional credentials and background must accompany this application.Nominations deadline: August 7, 2021.
IFTA Member Society Endorsement
Name of Nominee Name of IFTA Member Society
and has the support of the society’s board of directors to run for a position on the IFTA board of directors.
Signature of Society Officer Date

IFTAUPDATE 2021 Volume 28 Issue 2 page 3
Member NewsThe Society of Technical Analysts(STA, United Kingdom)
The STA has been taking advantage of holding its monthly meetings via live webinar to build an interna-tional speaker programme. In March, we hosted a fire-side chat with Niels Kaastrup-Larsen. Niels is managing director of DUNN Capital but is perhaps most widely known for his Top Traders Unplugged podcast. In April, Tom Bundgard of Kairos Commodities, Denmark gave a superb talk on using Interdisciplinary Price Analysis (IPA) for long-term forecasting. In May, Robin Mesch, president of Mesch Capital Management Inc. of Portland, Oregon, gave an excellent presentation on market pro-file. In June, we look forward to welcoming Alexander Aburumieh, a senior asset manager at a European bank-ing institution (though he will be speaking in his private capacity). Alexander will discuss training an adapted Gann Theory in the 21st century.
Like the IFTA webinars, all our events are recorded, so members can catch up on their own time if unable to watch live.
The next STA Diploma Part 1 exam will be held on Monday 5 July, followed by the STA Diploma Part 2 exam on Thursday 21 October. Provision has been made for both exams to be sat at home with Zoom invigilation.
We have two routes for preparing for the STA Diploma qualification: Our webinar, lecture-based STA Diploma Part 1 and 2 Courses (held once a year) or our Home Study Course, for which you can start studying now.
Held via live Zoom webinar, 18.00-19.30 UK time, the next Diploma Part 1 Course will commence on Wednesday 13 October 2021, and the Diploma Part 2 Course will start on Wednesday 12 January 2022. The courses are fully interactive, with students being able to ask questions as they would in a classroom. They may also post questions on the STA Student Forum and are invited to join the official STA Diploma Course WhatsApp group.
Anyone booking a course before 1 July 2021 can register at 2020 prices. The advantage to moving all education online means it doesn’t matter where in the world you live. Visit the STA website www.technicalanalysts.com for more information.
Keep in touch with us via our online blog, follow us on Twitter @STA_ORG or LinkedIn and like our Facebook page.

Education LoungeIFTAUPDATE 2021 Volume 28 Issue 2 page 4
Trend Following: A Proven Edge (Part 1)By Zaheer Anwari, Sublime Trading
An Approach Overlooked
The goal for us as investors/traders (whichever is your preferred label) is to create as much growth as possible as safely as possible between now and retirement.
In today's online world, there are numerous approaches to the financial markets. Some work, some don't. It is your job to work out the best method to adopt to achieve your desired wealth target by retirement.
An approach that often gets very little credit, often overlooked and arguably the most complete approach for us as busy everyday people, is long-term trend following. Combine this approach with leveraged accounts (spread betting/CFDs), and you have a formidable combination. Here in the UK, we are privileged to have spread betting accounts, which are free of CGT—a reason in itself to explore how to use them correctly.
As a side note, this is not the topic of this article, but a quick word in defence of lever-aged accounts. Unfortunately, they have a terrible reputation, and this is because of how people choose to use them with greed as the primary driver. Leveraged accounts offer benefits that traditional broker accounts do not. Learn to use them correctly, and you will be handsomely rewarded. Accountability is an essential part of investing. When you stop blaming outside factors and instead look at your personal choices, results start swinging in your favour.
Looking at performance tables of the best traders and investors over the decades, trend followers such as Richard Dennis regularly feature near the top. Warren Buffett, in comparison, will be mid-table at best. However, given a choice, most will naturally opt for the Warren Buffett approach, given his status as an investing god.
No matter how much of a Warren Buffett groupie you are, the results don't lie. Of course,
value investing works, but trend following is a far more effective and efficient approach. It is also far easier to learn and far simpler to execute. In short, trend following is the connoisseur's choice if the priority is profit.
Defining the Edge
Trend following can be used across all asset classes and can be used to go long and short, greatly expanding the array of options for the portfolio. Whereas buy and hold investing is for the uber long term and requires you to sit through all market conditions with the view of seeing the market go up over the long term, trend following is where you hold for the medium to long term, giving you the flexibility to move through the natural cycles of the market.
For example, buy and hold means seeing profit vanish in a bear market, such as in 2000 and 2008, and waiting years for those positions to recover. Much time wasted in the process for no growth. This is not the case for trend following. In a bull market, you build a portfolio around the best-performing assets that are going up in price. When the market dictates a top, you take profit and then short the market, creating a portfolio around the assets weakening the quickest. When the market dictates a bottom, you position yourself to go long again.
As another side note, there is an approach known as day trading. We won't expand on this beyond this being a doomed approach. Adopt it at your peril. Remember what we said on accountability above.
There is a saying that you are probably familiar with:
“If you cannot define your edge, you don't have one. If you don't have one, you will get eaten by someone who does.”
Education LoungeIFTAUPDATE 2021 Volume 28 Issue 2 page 5
Trend Following: A Proven Edge (Part 1) continued
One of the main reasons why people have poorly performing or underperforming port-folios is simply because they have no edge. There is often an element of guesswork as well trust put in unreliable sources. It is time to take back control and replace uncertainty with stealth and accuracy.
A proven edge must be based on price action and the history of the asset. Trend fol-lowing using technical analysis is THE WAY to establish this. I will break this down step by step.
Timeframes
A multiple timeframe setup paints a clear picture of what price:
� Has done in the past.
� Is doing right now.
� Is likely to do in the future.
Trends, either to the upside or the downside, last weeks, months, even years. To catch the big moves, I use the timeframes that allow me to do that: the monthly, weekly, and daily. When all three timeframes are moving in the same direction, we have alignment and established our edge. Each timeframe requires its own set of indicators, but the primary indicator is price. All technical indicators are lagging; trying to predict what price is likely to do next based on lagging indicators is a false economy and why so many go wrong. Price will tell you what it is likely to do next; lagging indicators confirm that.
Remember, going lower than the daily timeframe gets into day trading territory. Use them at your peril.
The Monthly Timeframe
This largest of the three timeframes has the following primary purposes:
� It gives you a complete picture of the past performance of the asset. If it has a history of trending well, it is very likely to trend well going forward.
� It tells you where price is in relation to the high and low of the previous year. If price is above the high of the previous year, it has a bullish bias. If price is below the low of the previous year, it has a bearish bias. If current price action is between the high and low of last year, we generally stand aside and move to other assets or asset classes.
� It is straightforward to mark significant levels of support and resistance. These levels will help identify turning points in the market or continuations in the market if and when broken.
� It is clear to see how far price is likely to move when in a trend based on round numbers. For example, when in a bull trend:
� If you buy a UK stock at £10, then £20 is the next level price it is likely to move toward.
� If you buy a US stock at $70, then $80 is the next level price it is likely to move toward.
� If you buy the EURUSD at 1.3000, then 1.4000 is the next level price it is likely to move toward.
In addition to the above, the longer the consolidation, the bigger the breakout holds particularly true on the monthly timeframe. I like to look for stocks that have an excel-lent history of performance combined with breaking out from consolidations of at least three to five months.
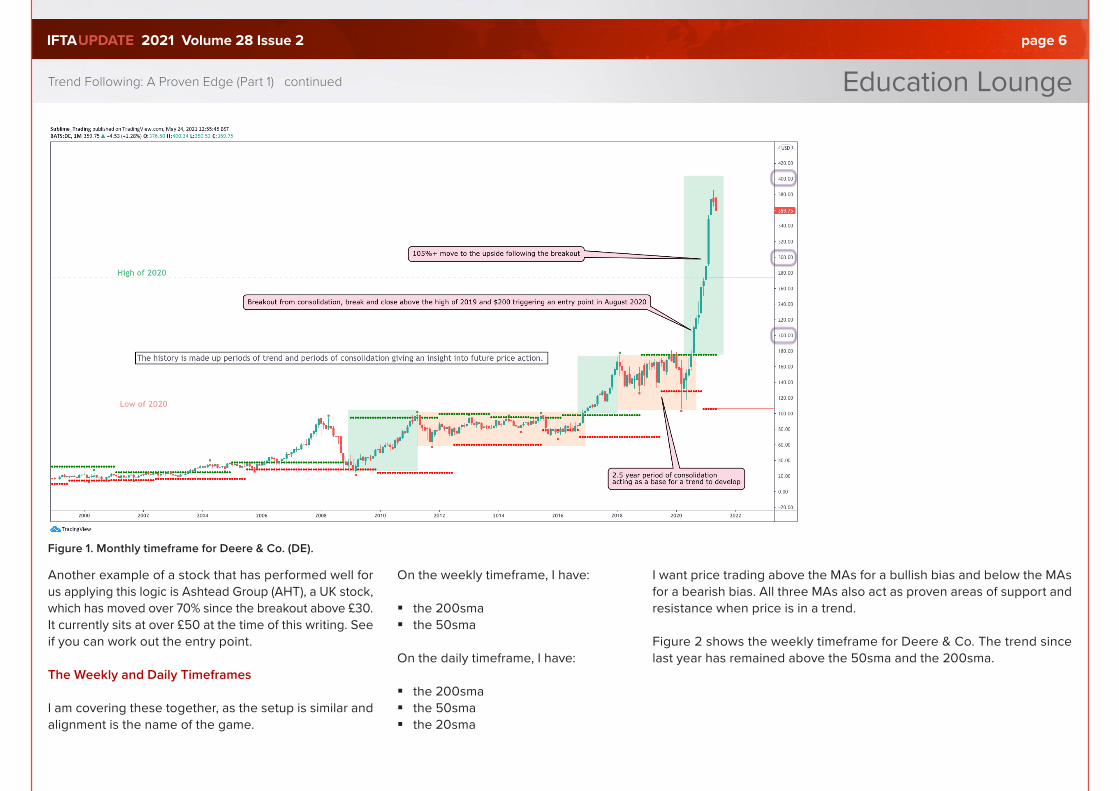
Deere & Co (DE) is a stock that met these criteria in August of last year and has been in my portfolio since. I have been holding this for circa 10 months. It has moved over 100% during this time from $200 to $400, where it is currently finding resistance. A break and close above $400, a round number, will see price move toward $500.
Below is the monthly timeframe for DE. I have developed bespoke tools that automati-cally detect and highlight the high and low of the previous year and the key levels of support and resistance. These levels will often appear at round numbers.
Education LoungeIFTAUPDATE 2021 Volume 28 Issue 2 page 6
Figure 1. Monthly timeframe for Deere & Co. (DE).
Another example of a stock that has performed well for us applying this logic is Ashtead Group (AHT), a UK stock, which has moved over 70% since the breakout above £30. It currently sits at over £50 at the time of this writing. See if you can work out the entry point.
The Weekly and Daily Timeframes
I am covering these together, as the setup is similar and alignment is the name of the game.
On the weekly timeframe, I have:
� the 200sma � the 50sma
On the daily timeframe, I have:
� the 200sma � the 50sma � the 20sma
Trend Following: A Proven Edge (Part 1) continued
I want price trading above the MAs for a bullish bias and below the MAs for a bearish bias. All three MAs also act as proven areas of support and resistance when price is in a trend.
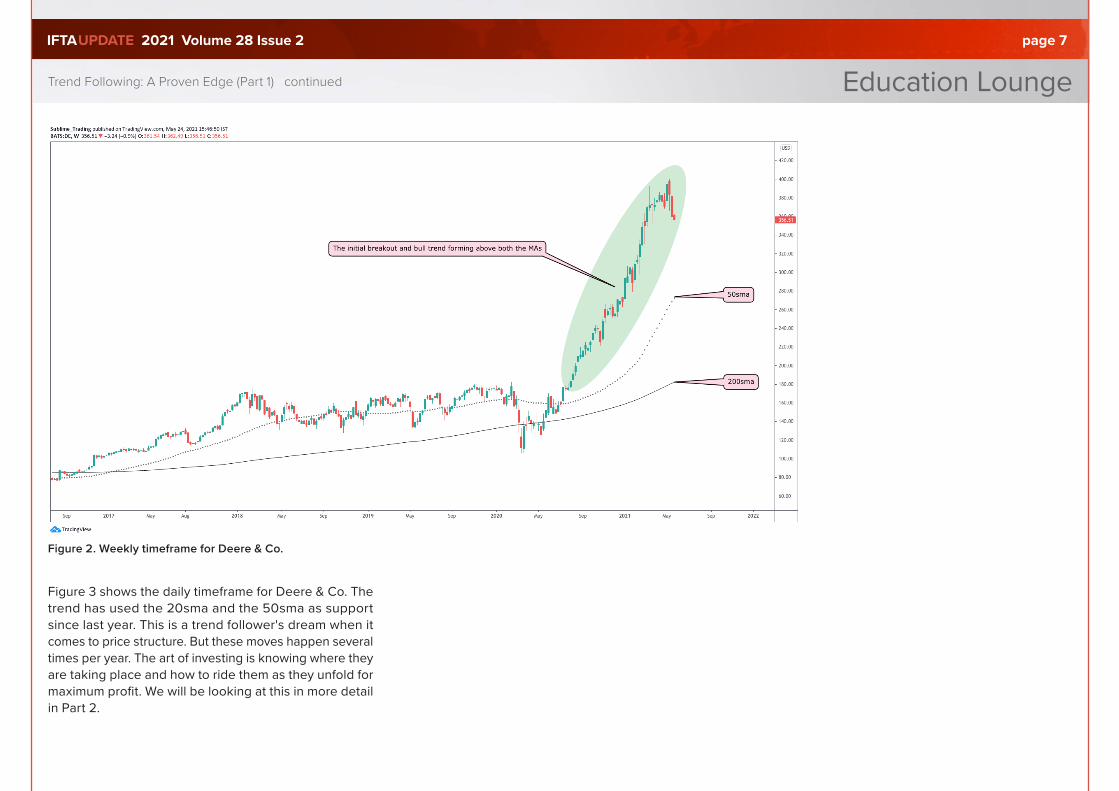
Figure 2 shows the weekly timeframe for Deere & Co. The trend since last year has remained above the 50sma and the 200sma.
Education LoungeIFTAUPDATE 2021 Volume 28 Issue 2 page 7
Figure 2. Weekly timeframe for Deere & Co.
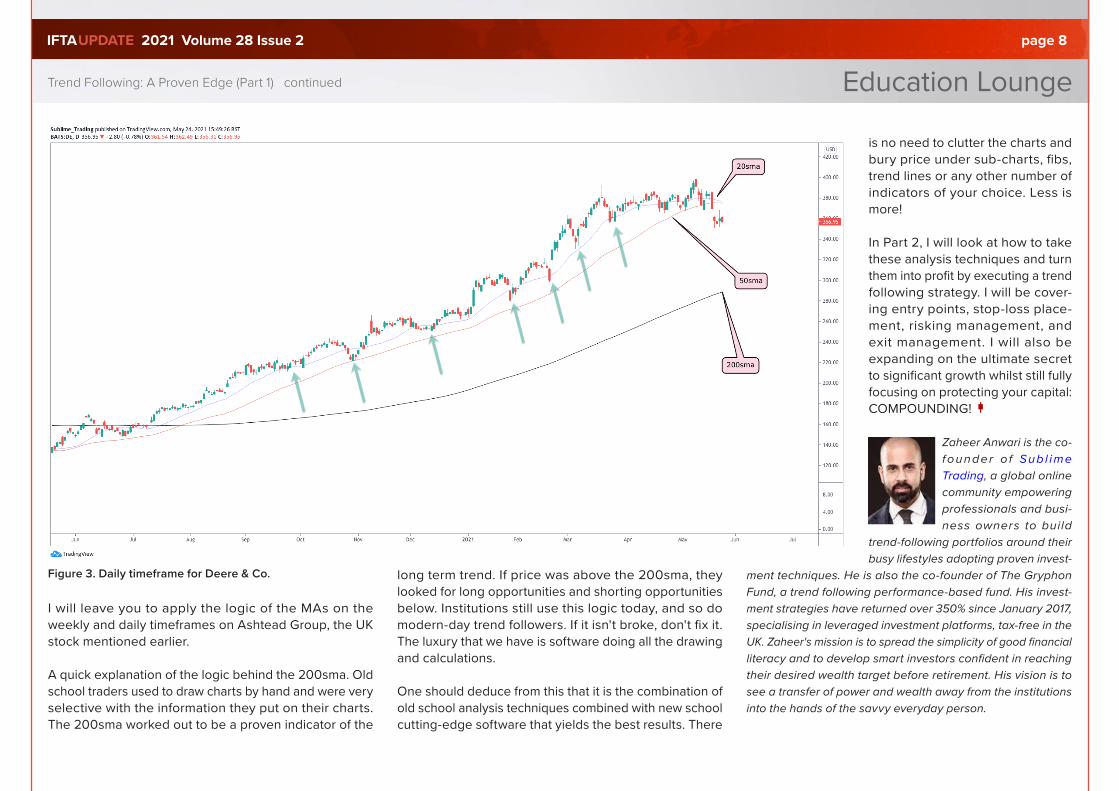
Figure 3 shows the daily timeframe for Deere & Co. The trend has used the 20sma and the 50sma as support since last year. This is a trend follower's dream when it comes to price structure. But these moves happen several times per year. The art of investing is knowing where they are taking place and how to ride them as they unfold for maximum profit. We will be looking at this in more detail in Part 2.
Trend Following: A Proven Edge (Part 1) continued
Education LoungeIFTAUPDATE 2021 Volume 28 Issue 2 page 8
Trend Following: A Proven Edge (Part 1) continued
Figure 3. Daily timeframe for Deere & Co.
I will leave you to apply the logic of the MAs on the weekly and daily timeframes on Ashtead Group, the UK stock mentioned earlier.
A quick explanation of the logic behind the 200sma. Old school traders used to draw charts by hand and were very selective with the information they put on their charts. The 200sma worked out to be a proven indicator of the
long term trend. If price was above the 200sma, they looked for long opportunities and shorting opportunities below. Institutions still use this logic today, and so do modern-day trend followers. If it isn't broke, don't fix it. The luxury that we have is software doing all the drawing and calculations.
One should deduce from this that it is the combination of old school analysis techniques combined with new school cutting-edge software that yields the best results. There
is no need to clutter the charts and bury price under sub-charts, fibs, trend lines or any other number of indicators of your choice. Less is more!
In Part 2, I will look at how to take these analysis techniques and turn them into profit by executing a trend following strategy. I will be cover-ing entry points, stop-loss place-ment, risking management, and exit management. I will also be expanding on the ultimate secret to significant growth whilst still fully focusing on protecting your capital: COMPOUNDING!
Zaheer Anwari is the co-founder o f Sub l ime Trading, a global online community empowering professionals and busi-ness owners to build
trend-following portfolios around their busy lifestyles adopting proven invest-
ment techniques. He is also the co-founder of The Gryphon Fund, a trend following performance-based fund. His invest-ment strategies have returned over 350% since January 2017, specialising in leveraged investment platforms, tax-free in the UK. Zaheer's mission is to spread the simplicity of good financial literacy and to develop smart investors confident in reaching their desired wealth target before retirement. His vision is to see a transfer of power and wealth away from the institutions into the hands of the savvy everyday person.
Education LoungeIFTAUPDATE 2021 Volume 28 Issue 2 page 9
Have you ever wondered how to assess the risk associated with the fluctuations of Bitcoin or any other digital currency?
Is volatility suitable for traders, both in the short and long run?
Volatility represents both risk and opportunity for financial investments, so let’s under-stand it adequately and in the easiest way.
First of all, let’s define it.
Simply put, volatility is the change in a security’s price over a given period. If the price stays relatively stable, the asset has low volatility. Highly volatile security hits new highs and lows quickly and has rapid increases and breathtaking falls.
And for those who have invested in Bitcoins over the past few years, we know that Bitcoin is explosive.
Risks and Opportunities
Did we ask ourselves what the risk is that we have taken, or the opportunities we have sometimes missed?
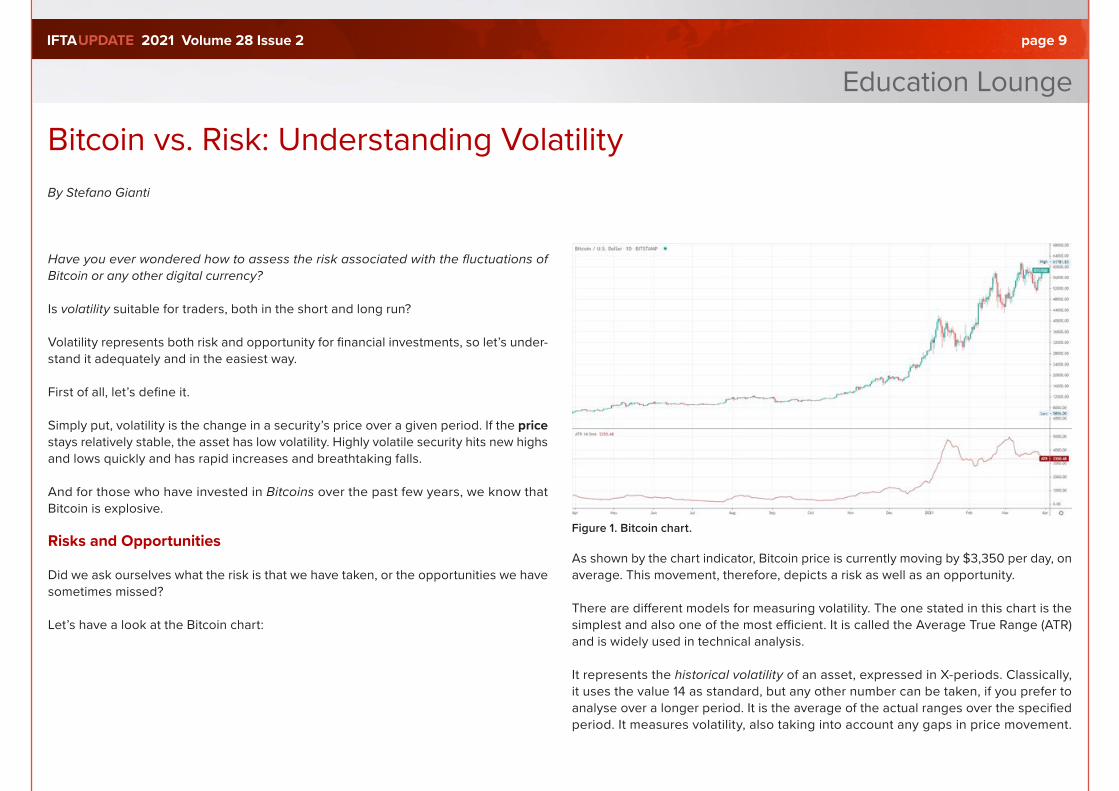
Let’s have a look at the Bitcoin chart:
Figure 1. Bitcoin chart.
As shown by the chart indicator, Bitcoin price is currently moving by $3,350 per day, on average. This movement, therefore, depicts a risk as well as an opportunity.
There are different models for measuring volatility. The one stated in this chart is the simplest and also one of the most efficient. It is called the Average True Range (ATR) and is widely used in technical analysis.
It represents the historical volatility of an asset, expressed in X-periods. Classically, it uses the value 14 as standard, but any other number can be taken, if you prefer to analyse over a longer period. It is the average of the actual ranges over the specified period. It measures volatility, also taking into account any gaps in price movement.
Bitcoin vs. Risk: Understanding VolatilityBy Stefano Gianti
Education LoungeIFTAUPDATE 2021 Volume 28 Issue 2 page 10
Therefore, we can say that the ATR measures the average high-low price excursion of the chosen timeframe.
How ATR Helps
So what help can ATR provide?
It helps us understand the more reasonable closing price for our trade.
We can therefore adapt our values of Stop Loss or Take Profit according to the ATR.
At higher ATR levels, we will have wider Stop Losses and Take Profits, thus adapting our investment to the current market volatility.
Let us do something somewhat curious: let’s mark the ATR values of various financial instruments:
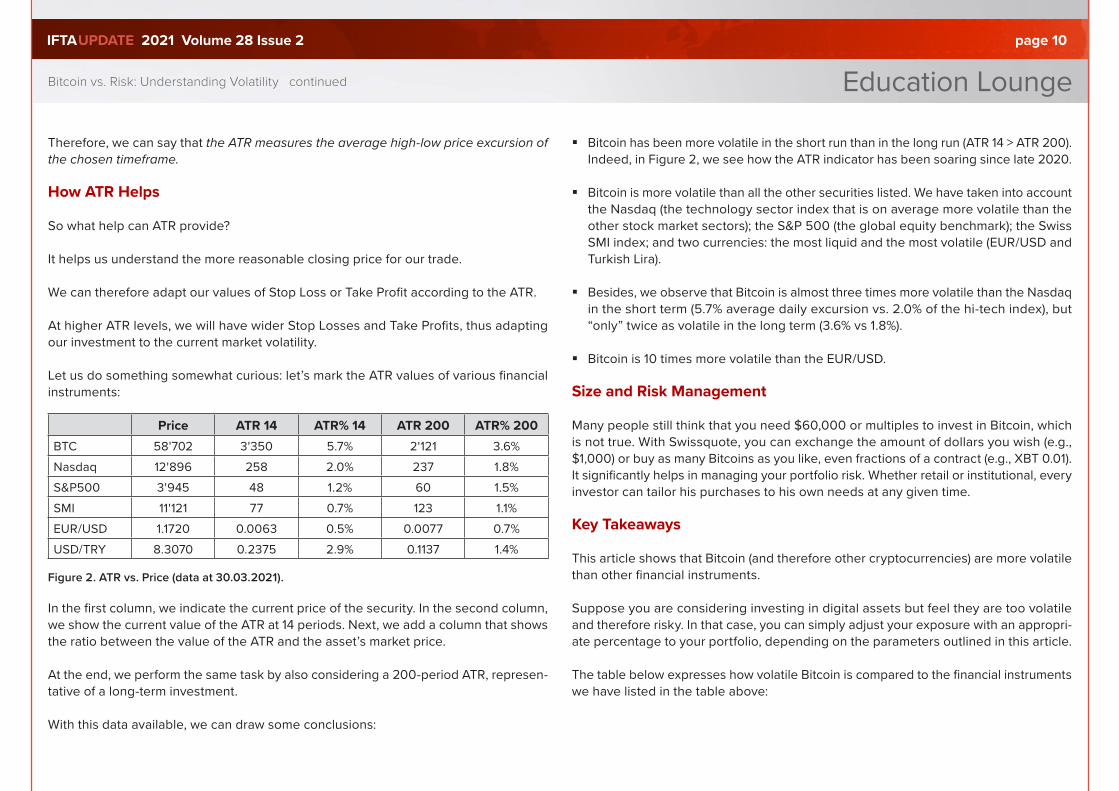
Price ATR 14 ATR% 14 ATR 200 ATR% 200BTC 58'702 3'350 5.7% 2'121 3.6%Nasdaq 12'896 258 2.0% 237 1.8%S&P500 3'945 48 1.2% 60 1.5%SMI 11'121 77 0.7% 123 1.1%EUR/USD 1.1720 0.0063 0.5% 0.0077 0.7%USD/TRY 8.3070 0.2375 2.9% 0.1137 1.4%
Figure 2. ATR vs. Price (data at 30.03.2021).
In the first column, we indicate the current price of the security. In the second column, we show the current value of the ATR at 14 periods. Next, we add a column that shows the ratio between the value of the ATR and the asset’s market price.
At the end, we perform the same task by also considering a 200-period ATR, represen-tative of a long-term investment.
With this data available, we can draw some conclusions:
� Bitcoin has been more volatile in the short run than in the long run (ATR 14 > ATR 200). Indeed, in Figure 2, we see how the ATR indicator has been soaring since late 2020.
� Bitcoin is more volatile than all the other securities listed. We have taken into account the Nasdaq (the technology sector index that is on average more volatile than the other stock market sectors); the S&P 500 (the global equity benchmark); the Swiss SMI index; and two currencies: the most liquid and the most volatile (EUR/USD and Turkish Lira).
� Besides, we observe that Bitcoin is almost three times more volatile than the Nasdaq in the short term (5.7% average daily excursion vs. 2.0% of the hi-tech index), but “only” twice as volatile in the long term (3.6% vs 1.8%).
� Bitcoin is 10 times more volatile than the EUR/USD.
Size and Risk Management
Many people still think that you need $60,000 or multiples to invest in Bitcoin, which is not true. With Swissquote, you can exchange the amount of dollars you wish (e.g., $1,000) or buy as many Bitcoins as you like, even fractions of a contract (e.g., XBT 0.01). It significantly helps in managing your portfolio risk. Whether retail or institutional, every investor can tailor his purchases to his own needs at any given time.
Key Takeaways
This article shows that Bitcoin (and therefore other cryptocurrencies) are more volatile than other financial instruments.
Suppose you are considering investing in digital assets but feel they are too volatile and therefore risky. In that case, you can simply adjust your exposure with an appropri-ate percentage to your portfolio, depending on the parameters outlined in this article.
The table below expresses how volatile Bitcoin is compared to the financial instruments we have listed in the table above:
Bitcoin vs. Risk: Understanding Volatility continued
Education LoungeIFTAUPDATE 2021 Volume 28 Issue 2 page 11
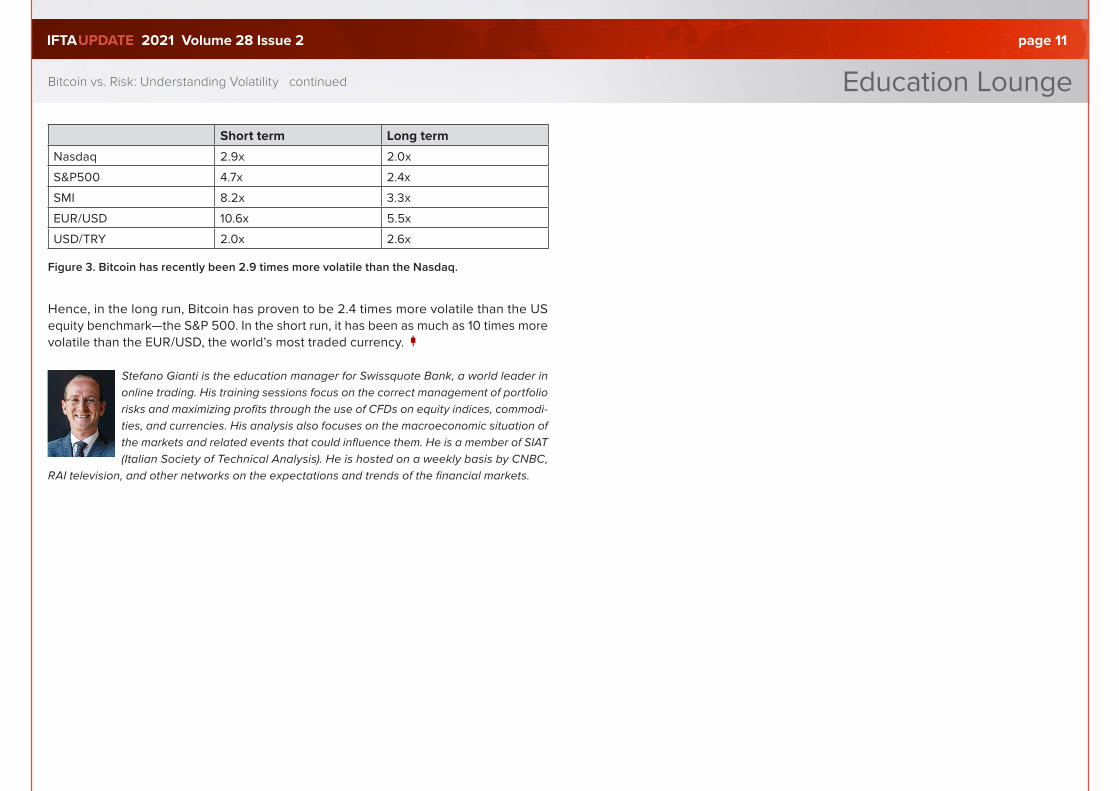
Short term Long termNasdaq 2.9x 2.0xS&P500 4.7x 2.4xSMI 8.2x 3.3xEUR/USD 10.6x 5.5xUSD/TRY 2.0x 2.6x
Figure 3. Bitcoin has recently been 2.9 times more volatile than the Nasdaq.
Hence, in the long run, Bitcoin has proven to be 2.4 times more volatile than the US equity benchmark—the S&P 500. In the short run, it has been as much as 10 times more volatile than the EUR/USD, the world’s most traded currency.
Stefano Gianti is the education manager for Swissquote Bank, a world leader in online trading. His training sessions focus on the correct management of portfolio risks and maximizing profits through the use of CFDs on equity indices, commodi-ties, and currencies. His analysis also focuses on the macroeconomic situation of the markets and related events that could influence them. He is a member of SIAT (Italian Society of Technical Analysis). He is hosted on a weekly basis by CNBC,
RAI television, and other networks on the expectations and trends of the financial markets.
Bitcoin vs. Risk: Understanding Volatility continued
Education LoungeIFTAUPDATE 2021 Volume 28 Issue 2 page 12
2020 saw a financial event of proportions not witnessed in generations. Many have dubbed the spring 2020 selloff as a black swan event. Through our study of long-term cycles, and especially super-long-term cycles, we had been on alert for this event. Black swan events are often larger cycles that are unrecognized and, therefore, unexpected. The 90-year cycle is a significant, recurring pattern, prevalent in stock markets and commodity markets. Until recently, few have been aware of this time cycle—the 2010 commodity highs happened 90 years after significant highs in 1920. During this time period, grains had a substantial blow-off move into major tops.
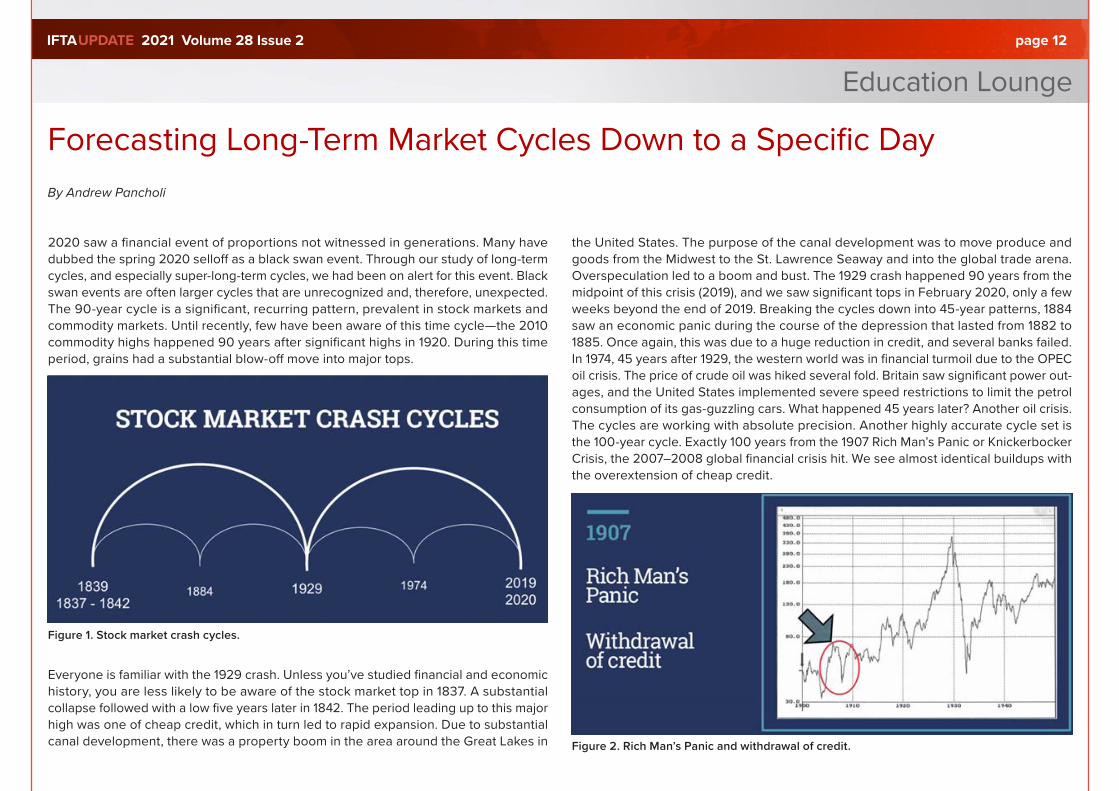
Figure 1. Stock market crash cycles.
Everyone is familiar with the 1929 crash. Unless you’ve studied financial and economic history, you are less likely to be aware of the stock market top in 1837. A substantial collapse followed with a low five years later in 1842. The period leading up to this major high was one of cheap credit, which in turn led to rapid expansion. Due to substantial canal development, there was a property boom in the area around the Great Lakes in
the United States. The purpose of the canal development was to move produce and goods from the Midwest to the St. Lawrence Seaway and into the global trade arena. Overspeculation led to a boom and bust. The 1929 crash happened 90 years from the midpoint of this crisis (2019), and we saw significant tops in February 2020, only a few weeks beyond the end of 2019. Breaking the cycles down into 45-year patterns, 1884 saw an economic panic during the course of the depression that lasted from 1882 to 1885. Once again, this was due to a huge reduction in credit, and several banks failed. In 1974, 45 years after 1929, the western world was in financial turmoil due to the OPEC oil crisis. The price of crude oil was hiked several fold. Britain saw significant power out-ages, and the United States implemented severe speed restrictions to limit the petrol consumption of its gas-guzzling cars. What happened 45 years later? Another oil crisis. The cycles are working with absolute precision. Another highly accurate cycle set is the 100-year cycle. Exactly 100 years from the 1907 Rich Man’s Panic or Knickerbocker Crisis, the 2007–2008 global financial crisis hit. We see almost identical buildups with the overextension of cheap credit.
Figure 2. Rich Man’s Panic and withdrawal of credit.
Forecasting Long-Term Market Cycles Down to a Specific DayBy Andrew Pancholi
Education LoungeIFTAUPDATE 2021 Volume 28 Issue 2 page 13
Forecasting Long-Term Market Cycles Down to a Specific Day continued
In 1907, JP Morgan himself was called upon to help out. One hundred years later, the house of JP Morgan was clearly in the spotlight. Going back 100 years to 1807, the United States implemented “The Embargo Act” to stifle trade and intervene in the Napoleonic Wars. This backfired catastrophically, leading to an 80% decline in the U.S. markets. These three financial panics were in perfect alignment: 1807, 1907, and 2007.
Mark 2107 in your calendars and forewarn your grandchildren. The 50-year midpoints of this cycle also see huge financial panics globally. In 1857, over half of U.S. banks failed. In 2008, there was a run on the Northern Rock bank in the United Kingdom. People thought this could not happen in 2008. History repeats itself. 1957 saw a 20% selloff in the markets, especially in the United States, due to a drop in manufacturing demand, and a small recession followed.
Numerous long-term cycle sequences are prevalent in markets, and when differing cycle sequences overlap, significant events take place. One such cycle set is the 72-year cycle. Approximately 72 years after 1929 marks the end of the tech boom, and by 2001, a clear bear market was in place both in Europe and the United States 72 years before 1929 saw one of the largest modern day panics in the United States and the UK. The year 1857, which appears in different cycle sets relating to panics and crises, is a conflu-ence point and, as such, is a critical timing point for future cycles. It is clear that financial panics happen cyclically with absolute precision.
Understanding these super macro moves allows us to anticipate significant trading cam-paigns. In doing so, we can fully exploit strategies employing a variety of instruments and derivatives. If we get it right, adding a basket of options can provide tremendous leverage with minimal risk.
However, the challenge is to be able to fine-tune these events from yearly cycles into much smaller windows. Without this ability, it is not possible to harness the opportunities effectively.
To do this, we need to examine the far more complex smaller cycles and how they interact. This allows us to identify weekly and even daily windows when markets are likely to change trend. This is particularly useful for those managing portfolios based on trend following.
Exit strategies can be fine-tuned to maximise the profit potential when such turning points are approached. The majority of trend followers exit positions based on previous swings being broken and thus give back a significant proportion of profits.
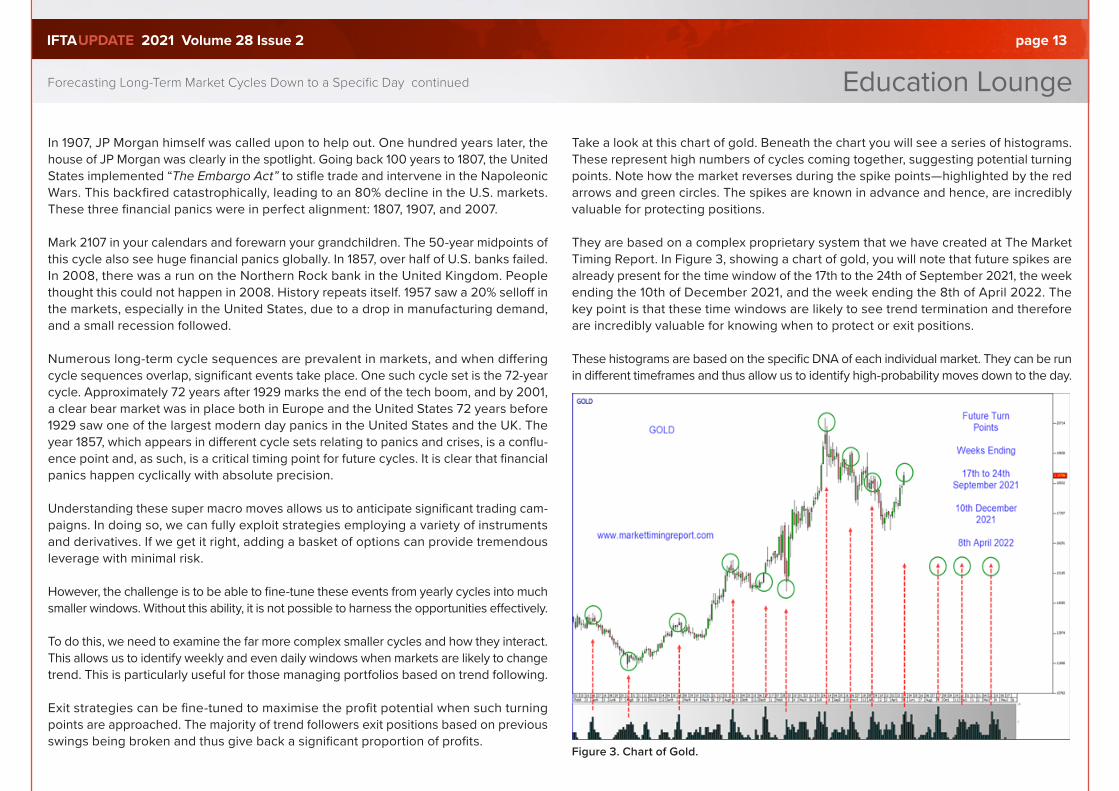
Take a look at this chart of gold. Beneath the chart you will see a series of histograms. These represent high numbers of cycles coming together, suggesting potential turning points. Note how the market reverses during the spike points—highlighted by the red arrows and green circles. The spikes are known in advance and hence, are incredibly valuable for protecting positions.
They are based on a complex proprietary system that we have created at The Market Timing Report. In Figure 3, showing a chart of gold, you will note that future spikes are already present for the time window of the 17th to the 24th of September 2021, the week ending the 10th of December 2021, and the week ending the 8th of April 2022. The key point is that these time windows are likely to see trend termination and therefore are incredibly valuable for knowing when to protect or exit positions.
These histograms are based on the specific DNA of each individual market. They can be run in different timeframes and thus allow us to identify high-probability moves down to the day.
Figure 3. Chart of Gold.
Education LoungeIFTAUPDATE 2021 Volume 28 Issue 2 page 14
Forecasting Long-Term Market Cycles Down to a Specific Day continued
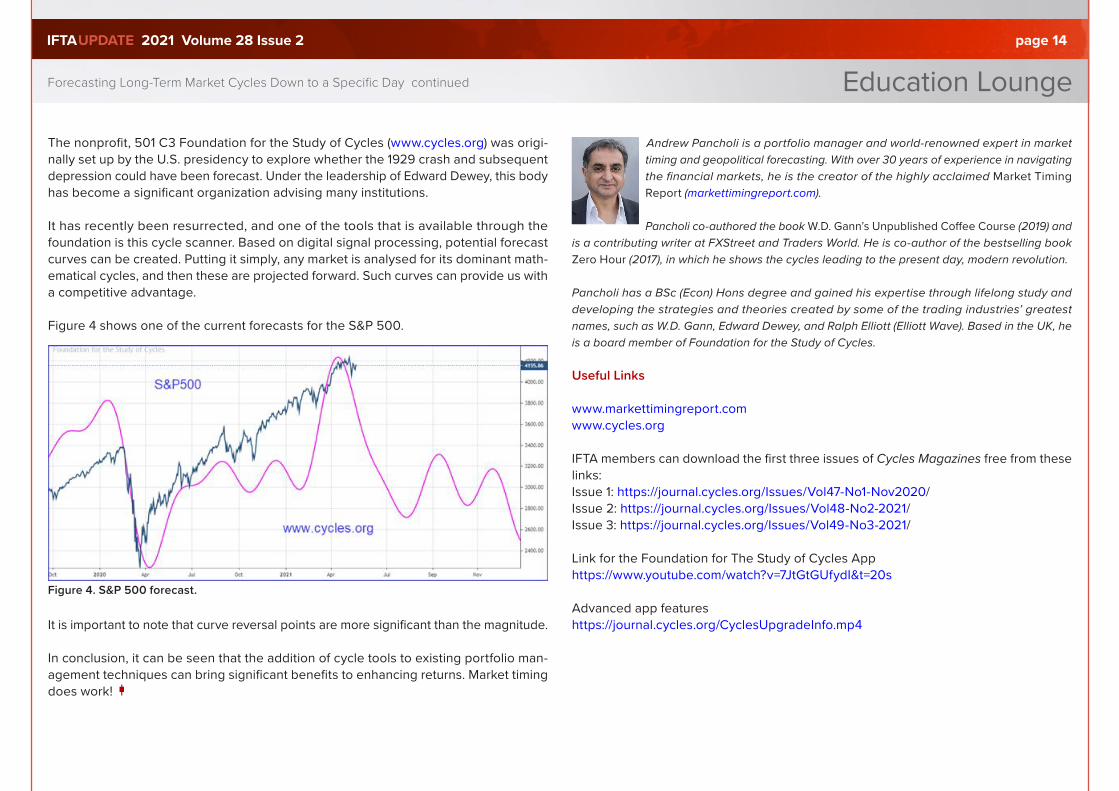
The nonprofit, 501 C3 Foundation for the Study of Cycles (www.cycles.org) was origi-nally set up by the U.S. presidency to explore whether the 1929 crash and subsequent depression could have been forecast. Under the leadership of Edward Dewey, this body has become a significant organization advising many institutions.
It has recently been resurrected, and one of the tools that is available through the foundation is this cycle scanner. Based on digital signal processing, potential forecast curves can be created. Putting it simply, any market is analysed for its dominant math-ematical cycles, and then these are projected forward. Such curves can provide us with a competitive advantage.
Figure 4 shows one of the current forecasts for the S&P 500.
Figure 4. S&P 500 forecast.
It is important to note that curve reversal points are more significant than the magnitude.
In conclusion, it can be seen that the addition of cycle tools to existing portfolio man-agement techniques can bring significant benefits to enhancing returns. Market timing does work!
Andrew Pancholi is a portfolio manager and world-renowned expert in market timing and geopolitical forecasting. With over 30 years of experience in navigating the financial markets, he is the creator of the highly acclaimed Market Timing Report (markettimingreport.com).
Pancholi co-authored the book W.D. Gann’s Unpublished Coffee Course (2019) and is a contributing writer at FXStreet and Traders World. He is co-author of the bestselling book Zero Hour (2017), in which he shows the cycles leading to the present day, modern revolution.
Pancholi has a BSc (Econ) Hons degree and gained his expertise through lifelong study and developing the strategies and theories created by some of the trading industries’ greatest names, such as W.D. Gann, Edward Dewey, and Ralph Elliott (Elliott Wave). Based in the UK, he is a board member of Foundation for the Study of Cycles.
Useful Links
www.markettimingreport.comwww.cycles.org
IFTA members can download the first three issues of Cycles Magazines free from these links:Issue 1: https://journal.cycles.org/Issues/Vol47-No1-Nov2020/Issue 2: https://journal.cycles.org/Issues/Vol48-No2-2021/Issue 3: https://journal.cycles.org/Issues/Vol49-No3-2021/
Link for the Foundation for The Study of Cycles Apphttps://www.youtube.com/watch?v=7JtGtGUfydI&t=20s
Advanced app featureshttps://journal.cycles.org/CyclesUpgradeInfo.mp4
Education LoungeIFTAUPDATE 2021 Volume 28 Issue 2 page 15
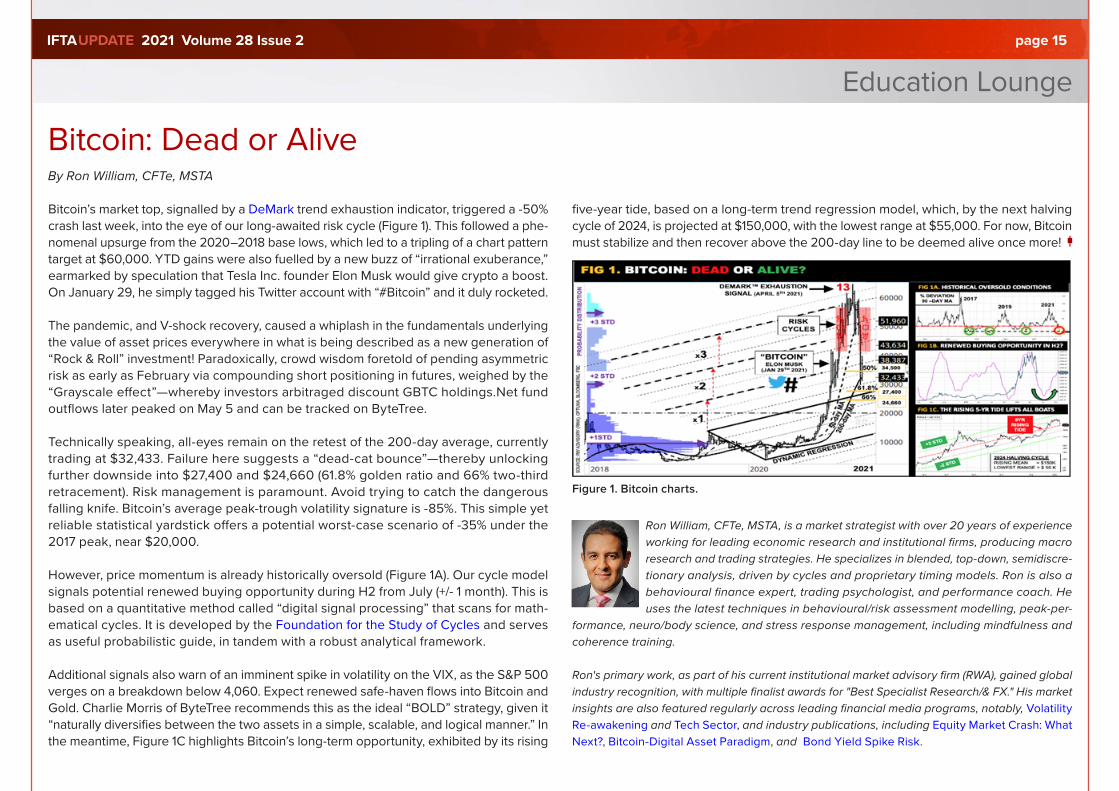
Bitcoin’s market top, signalled by a DeMark trend exhaustion indicator, triggered a -50% crash last week, into the eye of our long-awaited risk cycle (Figure 1). This followed a phe-nomenal upsurge from the 2020–2018 base lows, which led to a tripling of a chart pattern target at $60,000. YTD gains were also fuelled by a new buzz of “irrational exuberance,” earmarked by speculation that Tesla Inc. founder Elon Musk would give crypto a boost. On January 29, he simply tagged his Twitter account with “#Bitcoin” and it duly rocketed.
The pandemic, and V-shock recovery, caused a whiplash in the fundamentals underlying the value of asset prices everywhere in what is being described as a new generation of “Rock & Roll” investment! Paradoxically, crowd wisdom foretold of pending asymmetric risk as early as February via compounding short positioning in futures, weighed by the “Grayscale effect”—whereby investors arbitraged discount GBTC holdings.Net fund outflows later peaked on May 5 and can be tracked on ByteTree.
Technically speaking, all-eyes remain on the retest of the 200-day average, currently trading at $32,433. Failure here suggests a “dead-cat bounce”—thereby unlocking further downside into $27,400 and $24,660 (61.8% golden ratio and 66% two-third retracement). Risk management is paramount. Avoid trying to catch the dangerous falling knife. Bitcoin’s average peak-trough volatility signature is -85%. This simple yet reliable statistical yardstick offers a potential worst-case scenario of -35% under the 2017 peak, near $20,000.
However, price momentum is already historically oversold (Figure 1A). Our cycle model signals potential renewed buying opportunity during H2 from July (+/- 1 month). This is based on a quantitative method called “digital signal processing” that scans for math-ematical cycles. It is developed by the Foundation for the Study of Cycles and serves as useful probabilistic guide, in tandem with a robust analytical framework.
Additional signals also warn of an imminent spike in volatility on the VIX, as the S&P 500 verges on a breakdown below 4,060. Expect renewed safe-haven flows into Bitcoin and Gold. Charlie Morris of ByteTree recommends this as the ideal “BOLD” strategy, given it “naturally diversifies between the two assets in a simple, scalable, and logical manner.” In the meantime, Figure 1C highlights Bitcoin’s long-term opportunity, exhibited by its rising
five-year tide, based on a long-term trend regression model, which, by the next halving cycle of 2024, is projected at $150,000, with the lowest range at $55,000. For now, Bitcoin must stabilize and then recover above the 200-day line to be deemed alive once more!
Figure 1. Bitcoin charts.
Ron William, CFTe, MSTA, is a market strategist with over 20 years of experience working for leading economic research and institutional firms, producing macro research and trading strategies. He specializes in blended, top-down, semidiscre-tionary analysis, driven by cycles and proprietary timing models. Ron is also a behavioural finance expert, trading psychologist, and performance coach. He uses the latest techniques in behavioural/risk assessment modelling, peak-per-
formance, neuro/body science, and stress response management, including mindfulness and coherence training.
Ron's primary work, as part of his current institutional market advisory firm (RWA), gained global industry recognition, with multiple finalist awards for "Best Specialist Research/& FX." His market insights are also featured regularly across leading financial media programs, notably, Volatility Re-awakening and Tech Sector, and industry publications, including Equity Market Crash: What Next?, Bitcoin-Digital Asset Paradigm, and Bond Yield Spike Risk.
Bitcoin: Dead or AliveBy Ron William, CFTe, MSTA
IFTAUPDATE 2021 Volume 28 Issue 2 page 16
Interview With John Bollinger, Bollinger Capital ManagementBy Ron William, CFTe, MSTA
John Bollinger, CFA, CMT, is the founder and president of Bollinger Capital Management, a firm that provides money management and proprietary technical analysis research and tools for institu-tions and individuals. He is internation-ally known as the developer of Bollinger
Bands, which are utilized worldwide for analyzing the financial markets.
John’s book Bollinger on Bollinger Bands has been translated into 12 languages, and his website www.BollingerBands.com is the hub for everything related to Bollinger Bands. The site offers free and for pay educa-tional materials as well as information about Bollinger Band Tool Kits available for various financial platforms. In addition, www.BollingerBands.us provides charts, signals, screening, and tools for analyzing the market and make trading decisions based on Bollinger Bands and www.BollingerBands.it offers the same for Italian traders.
John is the recipient of the Technical Securities Analysts Association of San Francisco Lifetime Award for Outstanding Achievement in Technical Analysis, the 2005 Market Technicians Association (now the CMT Association) Annual Award for Outstanding Contribution to the Field of Technical Analysis, and the IFTA Lifetime Achievement Award.
Ron William: Welcome, everyone. This is our exclusive interview on behalf of IFTA with our IFTA 2020 keynote speaker, Mr. John Bollinger. John, welcome.
John Bollinger: Well, thanks very much, Ron. Pleasure to be here. Happy to do this interview.
RW: John, you're very well known for the Bollinger Band indicators, which I'd like to kick start a question on. But also, I wanted to add that some years ago you are received the IFTA Lifetime Achievement Award.
JB: I think back several years ago in Singapore, I was given that award, and it was one of the greatest honours of my career. I'm still humbled by that experience.
RW: One of greatest contributions is the Bollinger Band volatility based indicators. Many people know and use them. Could you give us a little bit of the back story as to how Bollinger Bands came into creation?
JB: Well, I created Bollinger Bands in the very early 1980s. In those days, we did a lot of our technical analysis by hand, and we kept indicators and such on long yellow pads and column accounting pads and such like that.
I was an option trader at the time. I was very lucky amongst technicians. I was also a little bit of an electron-ics hobbyist, so I had an early microcomputer. This was in the days before it became upgraded and created into the PC. I had a working microcomputer, ran the operating system, and it allowed me to run a spreadsheet in early version of spreadsheet that was called “Super Count.” I would keep track of my option positions and all my invest-ments on that spreadsheet.
If you've ever traded options and you know anything about options, then you understand the key to being a successful option trader is understanding both historical volatility and implied volatility. That is the option. That is the volatility that is buried in options price. So one day, I was copying down a formula for volatility in a column of the spreadsheet, and I saw that the calculation for volatility was running, changing over time. Now, that was important to me because I was in the middle off a big research project.
So when I came into the business, the first technical tools that were really explored were trading bands. Trading bands in those days were simply a moving average reflected up and down by some percentage. For exam-ple, a moving average of the DOW with a line of 4.5% above it, or 4.5% below it? We would weigh a price action within those bands with the action of indicators based on advances and declines up and down volume.
We tagged the upper band and one of those indicators with negative. We take that as a cell alert, and we tagged the lower band. One of those indicators was positive, then take that as a signal. The problem with this is markets change over time. The volatility characteristics of mar-kets change. So you are constantly having to readjust the bands. In one regime, you need 4% bands and another regime a 7% band. Nothing's changed, except for the market activity.
The problem with that is you're constantly having to hand-fit the bands. When you do so, you let emotions into the
IFTAUPDATE 2021 Volume 28 Issue 2 page 17
training process. If you're bullish, you set the bands to present a bullish picture. If you’re bearish, you present a bearish picture. This conditioning was very hard to over-come, so I was looking for some mechanism to make trading bands adapt. When I saw that volatility was as volatile as it was, I thought, well, maybe we could use that volatility calculation to set the with bands, and that was the genesis of the Bollinger Band.
Now, it's interesting, because at the time we believed that volatility was a static quantity. We believed that it didn't change over time. For example, if you use a calculation of beta, which is the market stock sensitivity, we thought that a stock's beta was simply a stock's beta. This is akin to stating the wall is white, or the sky is blue.
It only changed over the life cycle of a company from when the company was small, young, and growing. Maybe it would be 1.8 or 2, and as it matured gradually, that's the only way we thought that volatility changed.
But, you know, those ideas were in the air at the time. For example, Richard Angle some years ago got the Nobel Prize for the observation that the that economic series, the volatility of economic series, was in fact volatile.
A lot of people were thinking about this at the time. I just happened to be the one working on the trading band problem. The moment I coupled a measure of volatility, I chose standard deviation. After looking at several alter-natives, I coupled a measure of volatility with the moving average and such, and I realized that I had the answer to the question.
RW: Well, an interesting point in terms of market regime. Looking back at the long-term chart of equity markets and the bear market prior to that 1966 to 1982, it was one of the well-known volatile roller-coaster rides for traders of that era. Is it fair to say that maybe it set the scene for volatility type indicators thereafter?
JB: Well, I think yes. It's more than fair. That environment from, 1966 to 1982 as you pointed out, which contains the great 1973-1974 bear market—it was a very challenging environment. We had the great post-World War II bull market. That lasted for some 20 years, up until 1960 to make the top 1966.
It just depends on what index you look at. But you had a very, very long bull-run, where investing was basically a slam dunk. And in that in that world, you know, people like Markowitz and other people, started putting forth “modern portfolio theory” and the “efficient market”.
People pointed out the big bull-run—it's really hard to beat the market because, you know, everything's going up, everything's going north. They think that because it’s correct. Random Walk Down Wall Street was published in 1974. The efficient market people were right to a certain extent here. We talked about this earlier.
If you're a really large institution, you effectively are the market, and beating the market's really, really, really hard for you because you own such a big piece of the market. I always use the retirement fund as an example. They are the market, and all their efforts to try to beat the market really ended up upcoming for not, and it's been a huge
amount of money, a lot of time, and a lot of effort trying to do that without any real success.
I think it's entirely possible to meet the market. Of course, it's very hard during the “great bull-run” when all the boats are rising with the tide. But during these times, full of price swings and sideways markets, you know that's the ideal fuel from market timers. They could make money in those markets.
RW: This brings us to the subject of your presentation at the IFTA 2020 conference. So without stealing the thunder off your of your key message, on the subject of “indexing and indexing for technicians,” can you please share with us some key insights about indexing and what you've discovered in this recent work?
JB: I think the most important thing to understand about indexing is that indexing itself is a method. Each of the indexing methods has its strengths and its weaknesses. For example, the DOW30 is a price weighted index, and the largest stocks in that have the highest price stocks that have the largest impact on the index.
But the benchmark for most investors is the S&P 500, and that's a very special index because it is a capitalization weighted index. Therefore, the weight of each stock in the index is the price of the stock. This is multiplied by its outstanding float of the number of shares that they have available for trading. So each day, each stock that rises on that day gets a little more weight in the index, and each stock that falls on that day gets a little less weight in the index.
In fact, to be 500 is an incredibly efficient relative strength allocator. It's a great market timing mechanism. So the question is whether your market timing mechanism is bet-ter than their market timing mechanism, not whether you
“I was looking for some mechanism to make trading bands adapt. When I saw that volatility was as volatile as it was, I thought, well, maybe we could use
that volatility calculation to set the with bands, and that was the genesis of the Bollinger Band.
Interview With John Bollinger continued
IFTAUPDATE 2021 Volume 28 Issue 2 page 18
want to use a market timing mechanism. This is because if you invest in the S&P 500, by definition, you are using a market timing method. In that case, the method is called relative strength. Once again, S&P 500 is an incredibly efficient relative strength mechanism.
RW: How much concern do you have on the concentra-tion off-market cap stocks in the S&P 500, such as the infamous tech FAANG stocks. I mean, it's just been the irrational exuberance story of 2020 since the bounce back from the pandemic crash lows.
JB: You know, I think it's a pretty big problem. NASDAQ recognized some years back, and they capped Apple’s exposure in the NASDAQ composite. They just wouldn't let it grow beyond a certain percentage. I don't think that S&P 500 has ever done anything like that. Last time I checked, six stocks composed 20% of the S&P 500. The bottom 100 smallest stocks in the S&P 500 were less than 5% of the index. So it's a very, very skewed index. There's no question about that, but it does its job very efficiently. You know it's hard to beat, because it is, in fact, a very efficient relative strength index, and I guess to some extent it will offer lead and lag divergence signals.
RW: If we compared NASDAQ, otherwise known as “Tech Street” versus “Wall Street,” DOW and S&P 500, then “Main Street,” Russell 2000. It's a form of breath. Relative measures will give an idea of what's been outperforming.
JB: Yeah, I think that's right. You know, one way to look at that is that there's an equal weighted version of the S&P 500 published. You can look at the equal-weighted version versus the performance of the cap-weighted version. That contains a lot of information. For example, the cap-weighted version has been pounded. It’s was diverging for quite a long time. That's a big message. So
you needed to be involved in, you know, the largest cap stocks. In order to stay in the game, you know, there are lots of ways to take this apart.
What interests me most, actually, is sub-setting index. I think you can develop clever algorithms. We'll talk about some of that in my talk, but I think that through clever algorithms and good choices, one can very successfully subset and index and do very well against that index.
You know, I'll tell you a funny story. So I'm a CFA in addi-tion to being a CMT, and I studied for my CFA in the mid 1980s, taking the tests. Early on in the CFA process, a guy that I was studying with looked at me and said, “The whole argument here is that you can't beat the market, as defined by the S&P 500.” I said, “Oh yes, you can.” All you have to do is eliminate the poorly performing stocks. So, you know, I've been interested in this idea of trying to subset, indices for the benefit of portfolios for a very long time.
I think it's a very powerful idea. I think it's a underappre-ciated, underutilized, and underdiscussed idea. I think people start thinking about it and will realize tremendous value there. If you think about it, people do it without thinking. When you invest in a sector, that's essentially what you're doing. You're investing in the substance of these indices and they are run the same way. So it's not like it's a unique or totally, you know, a new shiny idea. The idea has been with us for a long time. I just think that if practitioners focus on sub-setting, they can really add value to their client's portfolios.
RW: Another key point in your presentation is ESG invest-ing. What was the inspiration for that focus?
JB: Well, you know, a couple of years ago, my daughter joined our firm, and she brought with her a rich interest in ESG investing. She had a new, extensive background in the area and really wanted to do something. This idea of ethical investing has a very long history. However, it mostly underperforms the market.
Instead, I looked at her and said, “I'm totally fine with doing something, but we have to do it right.” So what we did is build from scratch a couple of ESG indexes and then looked at ways of sub-setting. That's essentially the heart of my talk. So I'm not going to give that much more away. I think you'll find it very interesting. It's a kind of classic in a number of ways. But it's also very, very practical. This stuff is relatively easy to do. You have to be very disciplined. But you can really add value to client portfolios with this. You know, this idea of sub-setting using technical tools, maybe just a question on the position of technical analysis and market timing.
RW: Right here and now on a bigger picture level. What's your sense in terms of this age-old debate about passive vs. active investing and where technical analysis adds value.
JB: So I think passive investing is a reality only for the very largest investors. Other people can’t and should take a more active approach, even if it's a simple little allocation mechanism. You know, it's pretty easy. This
“So the question is whether your market timing mechanism is better than their market timing mechanism, not whether you want to use a market timing
mechanism.”
Interview With John Bollinger continued

IFTAUPDATE 2021 Volume 28 Issue 2 page 19
adds value. Harry Brown is a very well-known market technician who is now long retired. He put forth the idea of a permanent portfolio. You take a portfolio and cut it up into four pieces. A quarter in stocks, a quarter in bonds, a quarter in cash and a quarter gold. So that's a great idea and it works well over time.
It tends to be much less volatile than the market as a whole. Investors could be pretty happy with that. Except the months they're looking over at the S&P 500. That will, on its own, beat the portfolio for many years. But think about it. Just take a very simple little allocation and decide to work with a permanent portfolio. But instead of just one quarter, one quarter, one quarter, let's make it adjustable. Let's say you know any element of the port-folio can range from 10% to 50%. Adjust it based on the performance of the components. You know what's work-ing versus what's not, and you give higher allocations to what's working in lesser allocations.
For example, gold is very, very trendy. So when gold is rising, you add a little extra weight to gold. When gold is not rising, you pull some way away when stocks are doing well. I think the idea of active investing could be something that simple. Once a month, sitting down with the yellow pad and making a few tiny little calculations to adjust your portfolio. Or it could be something as active as running a portfolio. For example, a very active rela-tive strength program that's making daily changes in in a portfolio. There's a range of possibilities.
That's why it always disturbs me so much when I hear people saying market timing is not for me. So what you mean is making money is not for you? It just doesn't make
any sense, because there are so many approaches, and they could be really suited to the individual to their risk and reward criteria. They could be happy versus how many people you know that put all their money in the S&P 500 and lived through the extreme drawdown.
I think there are so many people who pulled out of all their positions near the bottom and are now sitting there after this massive rally that has ensued saying, “Oh, my God. You know, I've missed the entire recovery process.” I think the case against passive investing is very clear and the case for active investing is also very clear.
RW: It may be part of the kind of market timing benefit of making money, as you quite aptly said. It also flips into a double benefit off risk management, particularly when the market is just so risk centric in terms of the destruction of diversification with too much indexation.
JB: How much of that is really driven by people? I don't think I understand indexing all this money that's going into these ETFs. When money comes in, they must buy the whole list of stocks. When money comes out, they must sell the whole list of stocks.
I think that's becoming a very, very tough game to play. It's a really delicate effect on the areas of the stock market that are covered by those indexes. You know, I must say, I'm a little bit of a heretic in this regard. Everybody wants to index. But I love investing in individual stocks. I think that's where the real opportunity to start with the crowd is headed 100% toward. You know, all of these exchange traded funds and mutual funds of various sorts and type. I think they create more opportunity for people like myself
and my firm, who want to invest in individual stocks. We've had some terrific opportunities.
This year, I think we'll continue to have opportunities because, you know, the vast majority of people aren't looking over into our world of individual stocks. They're all about exchange traded funds and passive investing. So it's just it's really a land of plenty for stock pickers.
RW: A final risk question regarding the options market. There's been a lot of talk about overheated leverage posi-tioning in the options market from big and small money, within the institutional and retail space. What's your sense of the extent of the option market situation?
JB: I'm not sure that I have a really good handle on that. I know that there’s a lot of options activity out there. I keep a number of option indicators, so I keep a fairly, you know, good sense of the pulse of that market. But I'm not sure how important that is. For example, coming into the U.S. presidential elections, virtually all of the exchanges and many of the brokerage houses have started gradually raising their margin requirements, reducing the lever-age that's available to customers—both professional and amateur. That ranges from the brokerage firms catering to professionals like interactive brokers to brokerage firms catering to individuals like TD Ameritrade. All of these entities have raised their margins. Now, I must say that they seem to have done so pretty responsibly. They're doing it gradually, and they made the announcement way in advance. So they're not disrupting the markets by doing so. So I think there is some understanding there's too much use of leverage out there.
These firms are starting to lean against the wind. The same thing is true about brokerage firms. I keep hearing people talk about a couple of big players, that they're using a call option trying to drive the process of individual
“That's why it always disturbs me so much when I hear people saying market timing is not for me. So what you mean is making money is not for you?”
Interview With John Bollinger continued
IFTAUPDATE 2021 Volume 28 Issue 2 page 20
stocks. I think the big Wall Street firms, they understand what's going on there. You know, they're fully capable of taking the other side of that trade. So, I'm not as worried about it as some people are. I do see a potential problem, but I always see leverage as a problem. Leverage is the great destroyer. Whenever there's been a blowup in the stock market, you look back and what was behind it, some form of leverage. It's happened time and time and time again. So I've never been a fan of leverage. Whenever I’ve used it, it’s always been very judiciously.
RW: Macro and technical question, all in one phrase: “Don't fight the tape. Don't fight the Fed.” What’s your perspective on both of those statements in the current environment?
JB: It's pretty strong, and the Fed’s pretty strong. So prices are going up. I mean, it seems very straightforward. Marty Zweig famously coined those phrases. It was much older market wisdom, but he put those phrases into the vernacular. It featured during his appearances on Wall Street Week, Louis Rukeyser's TV show many years ago. He would, you know, constantly remind people, “Don't fight the Fed, don't fight the tape.” That's great wisdom. I think it is as important today as it was then. If the Fed’s providing liquidity and ensuring that the financial envi-ronment is conducive to higher stock prices, you ought to pay attention. And if stock prices are rising, you ought to pay attention.
RW: A final question on my side from the new genera-tion of traders, particularly new traders that have literally started this year from the crash lows into what has been a phenomenal bull market. What key lessons can some of those new traders learn?
JB: Well, if you take any old professional and ask them what the worst thing is that could happen to a beginning
trader, they will look at you and say that the first trade is a huge win. I'm afraid that we've created an enormous crop of traders who feel that they could do no wrong, no matter what they buy. No matter how they buy it. No matter how little discipline they use, they're going to make money, and they're going to find out that all of those things were wrong. They're going to find out that what they buy is incredibly important.
We will find out how much leverage they use is incredibly important. Sitting on top of all of that, they're going to find out that that self-discipline is the number one determining factor of investment performance.
RW: Very wise words, John. One that I think that will create a lot of ongoing insights with many of our IFTA members around the world. We hope to have thousands of attendees in this first ever online 24-hour conference. We're really excited to have you on board as our keynote speaker.
JB: Well I'm really looking forward to beyond this confer-ence, which obviously I'm very excited about. I'm looking forward to next year's conference, where I can meet and greet my fellow analysts and portfolio manager techni-cians and talk about ideas and get to see people in the flesh once again. So, we look forward to some new normal in next year and thereafter. I wish you a great conference this year. I'm happy to contribute to it. But I'm also hoping for a regular conference next year.
RW: We do, too. Thank you very much, John.
JB: My pleasure.
View live interviews with John Bollinger via YouTube and IFTA’s podcast.
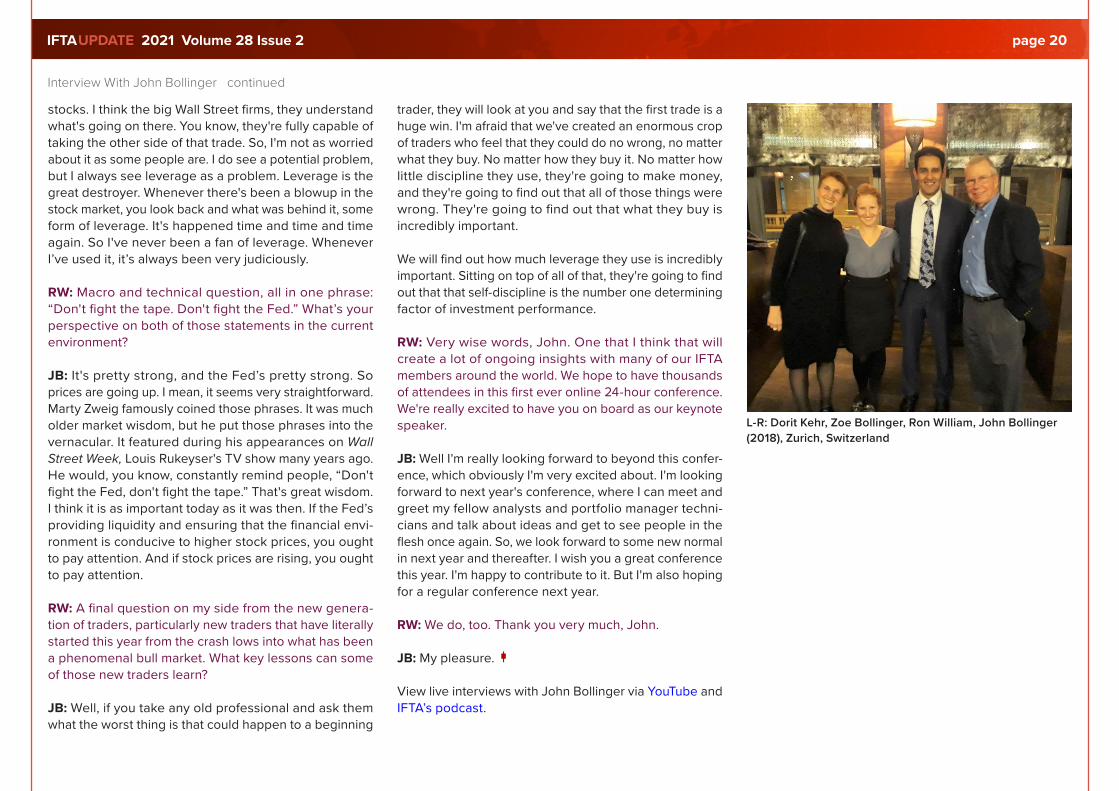
L-R: Dorit Kehr, Zoe Bollinger, Ron William, John Bollinger(2018), Zurich, Switzerland
Interview With John Bollinger continued
IFTAUPDATE 2021 Volume 28 Issue 2 page 21
MFTA and CFTe Exam DatesCertified Financial Technician (CFTe)—Level IDate Offered Year-roundSee our website for further instructions www.ifta.org/certifications/registration/Syllabus and Study Guide www.ifta.org/public/files/publication-downloads/IFTA_CFTe_Syllabus.pdf
Certified Financial Technician (CFTe)—Level II 2021 2022Exam dates 21 Oct 2021 TBA Apr 2022Registration deadline 9 Sept 2021 TBA Mar 2022 Register at https://ifta.org/application-forms/cfte-ii-application/Syllabus and Study Guide www.ifta.org/public/files/publication-downloads/IFTA_CFTe_Syllabus.pdfFor more information on the CFTe program, visit www.ifta.org/certifications.
Master of Financial Technical Analysis (MFTA) 2021 2022Alternative Path Pre-Application Deadline 31 July 2021 28 Feb 2022Application/Outline Deadline 2 Oct 2021 2 May 2022Paper Deadline 15 Mar 2022 15 Oct 2022(Session 1) Register at https://ifta.org/application-forms/mfta-application-session1/(Session 2) Register at https://ifta.org/application-forms/mfta-application-session-2/
Congratulations New CFTes!Desmond Adeosun (STA)Raffaele Daniele Aliperti (STA)Abbas Ariff (STA)Hamid Asseffar (STA)Ashraf Rifa'ie Azhar (STA)IR. HJ. Nazri Bin HJ. AB Razak (STA)Mohd Ashraf Bin Shamsuddin (STA)Muhamad Suhail Bin Zolkifly (STA)Haziah Malim Binti Sidik Malim (STA)Vinnie Liew Boon Yee (STA)Thomas Brenning (VTAD)Charles Nicolas Burdett (STA)Tarachand Dewangan (ATA)Shivam Gaba Sumit Gupta (ATA)Iacovos Hadjioannou (STA)Hafiz Izzuddin Hashim (STA)Nordine IBN MEJD (STA)
Muhammad Sofwan Jafri (STA)Elias Ktoris (STA)Sze Yee Lim (MATA)Arturs Lokomets (STA)Vangelis Mavronikolas (STA)Paolo Mazzarini (SAMT)Jamie Pakenham-Walsh (STA)Elyas Amir Ramli Arveen Nair S/O Krishnan (STA)Emir Myqal Samsudin Ho (STA)Hans-Peter Schurr (VTAD)Aitor Tejado Solana (IEATEC)Julia Thilenius (VTAD)V Nyanasegaran Venkitasan (STA)Robbie Walker (STA)George Williams (STA)LOOI YEW KIN (STA)XiaoJiao Zhang (TASS)
IFTAUPDATE 2021 Volume 28 Issue 2 page 22
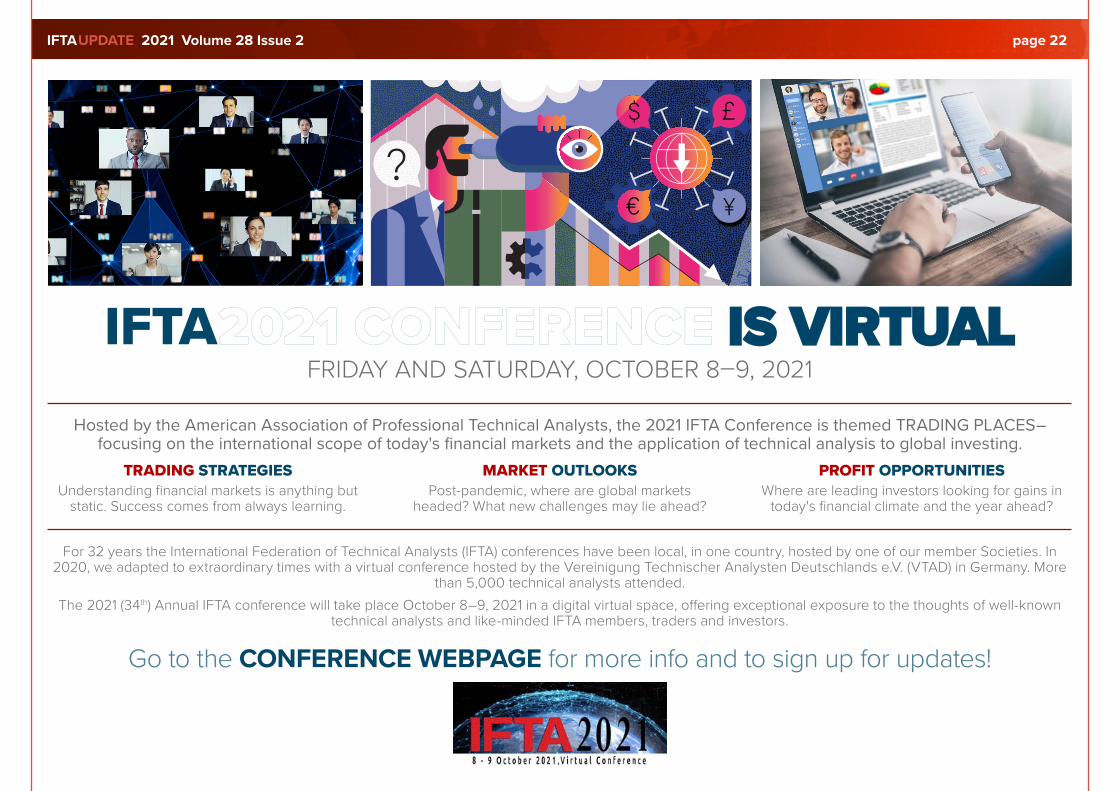
Hosted by the American Association of Professional Technical Analysts, the 2021 IFTA Conference is themed TRADING PLACES–focusing on the international scope of today's financial markets and the application of technical analysis to global investing.
For 32 years the International Federation of Technical Analysts (IFTA) conferences have been local, in one country, hosted by one of our member Societies. In 2020, we adapted to extraordinary times with a virtual conference hosted by the Vereinigung Technischer Analysten Deutschlands e.V. (VTAD) in Germany. More
than 5,000 technical analysts attended. The 2021 (34th) Annual IFTA conference will take place October 8–9, 2021 in a digital virtual space, offering exceptional exposure to the thoughts of well-known
technical analysts and like-minded IFTA members, traders and investors.
Go to the CONFERENCE WEBPAGE for more info and to sign up for updates!
IFTA2021 CONFERENCE IS VIRTUALIS VIRTUALFRIDAY AND SATURDAY, OCTOBER 8–9, 2021
TRADING STRATEGIESUnderstanding financial markets is anything but
static. Success comes from always learning.
MARKET OUTLOOKSPost-pandemic, where are global markets
headed? What new challenges may lie ahead?
PROFIT OPPORTUNITIESWhere are leading investors looking for gains in
today's financial climate and the year ahead?

IFTAUPDATE 2021 Volume 28 Issue 2 page 23
2021 VIRTUAL
ConferenceOCTOBER 8-9, 2021
SPONSORSHIP OPPORTUNITIES
IFTAUPDATE 2021 Volume 28 Issue 2 page 24
2
GLOBAL OUTREACH FOR SPONSORSFor 32 years the International Federation of Technical Analysts (IFTA) conferences have been local, in one country, hosted by one of our member Societies. In 2020, we adapted to extraordinary times with a virtual conference hosted by the Association of Technical Analysts in Germany (VTAD). More than 5,000 techical analysts attended.
In 2021, with international travel restricted for many of our members, our host society - the American Association of Professional Tech-nical Analysts (AAPTA) - continues the virtual format with an exciting agenda shaped by the dynamic changes taking place throughout the financial markets worldwide.
The 34th annual IFTA conference will take place October 8-9, 2021 in a digital virtual space. In addition to offering exceptional exposure to the thoughts of well-known technical analysts
and like-minded IFTA members, traders and investors, the 34th IFTA Conference is a unique opportunity for sponsor companies to reach a global audience of heavy-hitter technical analysts.
Four sponsorship levels are available. The benefits of each sponsorship are shown on the following grid. Platinum and Gold Sponsorships will be limited to one Platinum and four Gold Sponsor companies. If these opportunities are ideal for your firm, complete and submit the sponsorship application quickly.
For more questions about IFTA Conferences and how this event will benefit your firm, con-tact Peter Mauthe at 972-213-5816, Scott Full-man at 917-627-7409 or email [email protected]. For additional conference information - www. ifta2021intheUS.org.
IFTAUPDATE 2021 Volume 28 Issue 2 page 25
3
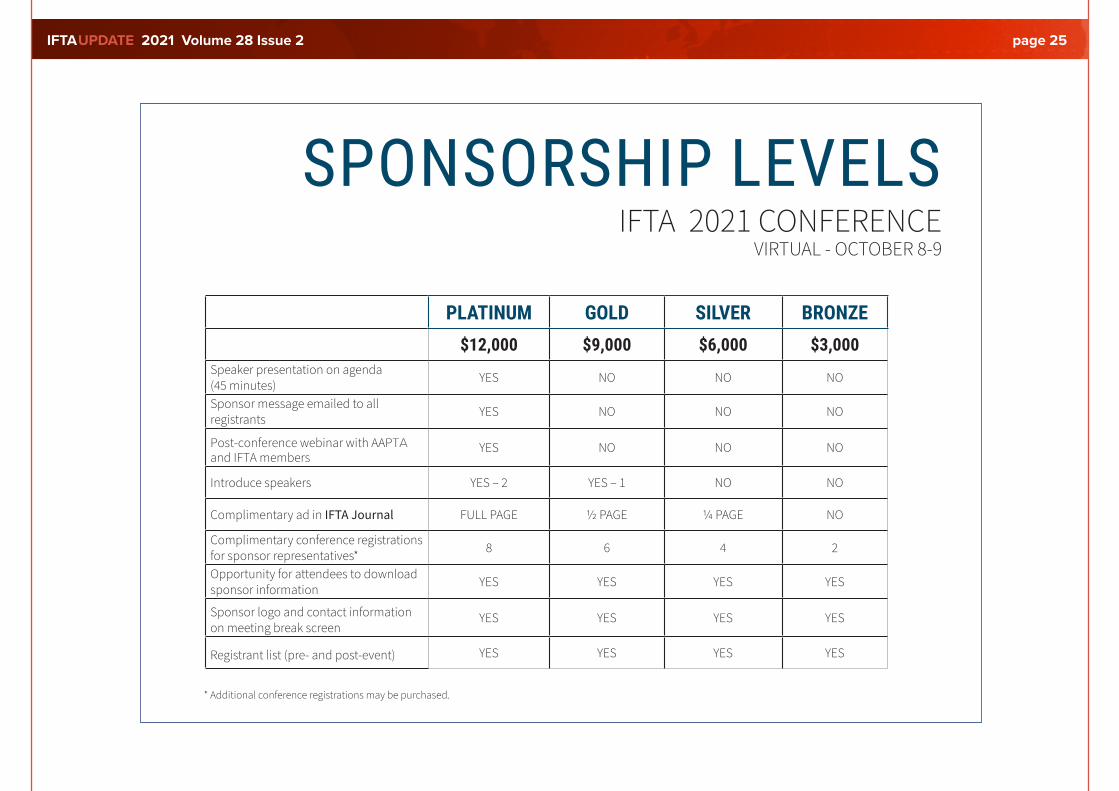
SPONSORSHIP LEVELSIFTA 2021 CONFERENCE
VIRTUAL - OCTOBER 8-9
PLATINUM GOLD SILVER BRONZE$12,000 $9,000 $6,000 $3,000
Speaker presentation on agenda (45 minutes) YES NO NO NO
Sponsor message emailed to all registrants YES NO NO NO
Post-conference webinar with AAPTA and IFTA members
YES NO NO NO
Introduce speakers YES – 2 YES – 1 NO NO
Complimentary ad in IFTA Journal FULL PAGE ½ PAGE ¼ PAGE NO
Complimentary conference registrations for sponsor representatives* 8 6 4 2
Opportunity for attendees to download sponsor information YES YES YES YES
Sponsor logo and contact information on meeting break screen
YES YES YES YES
Registrant list (pre- and post-event) YES YES YES YES
* Additional conference registrations may be purchased.
IFTAUPDATE 2021 Volume 28 Issue 2 page 26
4
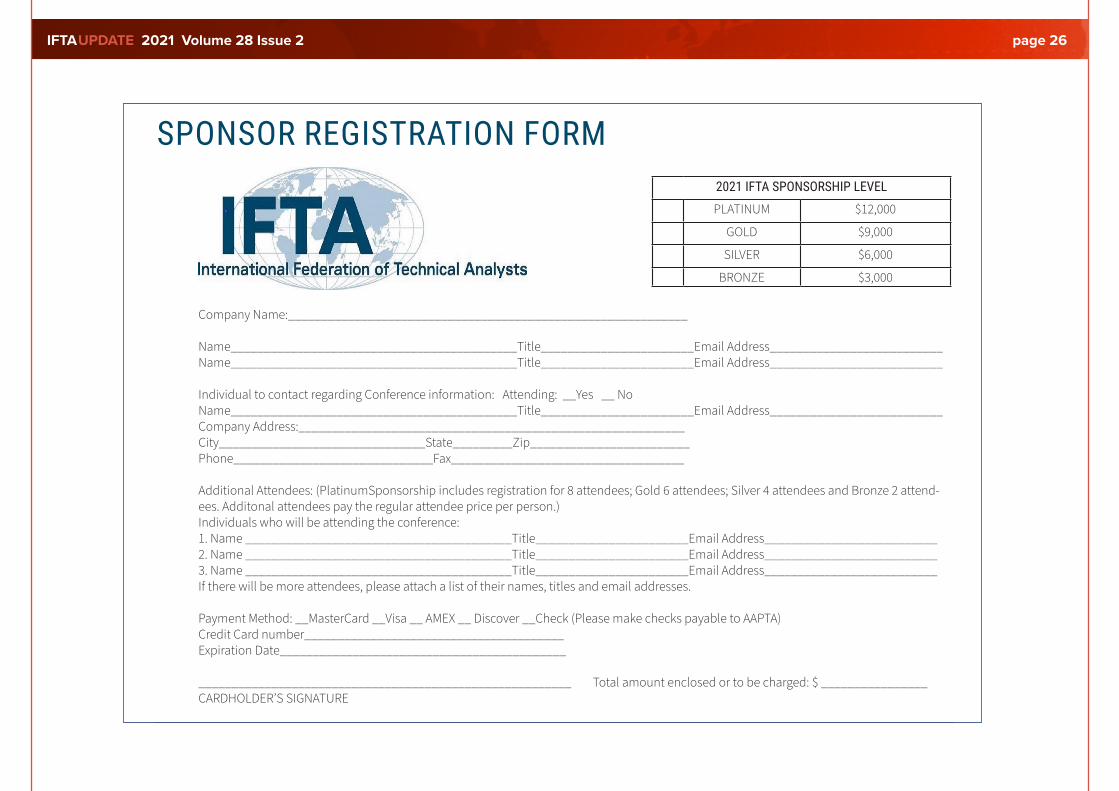
SPONSOR REGISTRATION FORM2021 IFTA SPONSORSHIP LEVEL
PLATINUM $12,000
GOLD $9,000
SILVER $6,000
BRONZE $3,000
Company Name:____________________________________________________________
Name___________________________________________Title_______________________Email Address__________________________Name___________________________________________Title_______________________Email Address__________________________
Individual to contact regarding Conference information: Attending: __Yes __ NoName___________________________________________Title_______________________Email Address__________________________Company Address:__________________________________________________________City_______________________________State_________Zip________________________Phone______________________________Fax___________________________________
Additional Attendees: (PlatinumSponsorship includes registration for 8 attendees; Gold 6 attendees; Silver 4 attendees and Bronze 2 attend-ees. Additonal attendees pay the regular attendee price per person.)Individuals who will be attending the conference:1. Name ________________________________________Title_______________________Email Address__________________________2. Name ________________________________________Title_______________________Email Address__________________________3. Name ________________________________________Title_______________________Email Address__________________________If there will be more attendees, please attach a list of their names, titles and email addresses.
Payment Method: __MasterCard __Visa __ AMEX __ Discover __Check (Please make checks payable to AAPTA)Credit Card number_______________________________________Expiration Date___________________________________________
________________________________________________________ Total amount enclosed or to be charged: $ ________________ CARDHOLDER’S SIGNATURE
IFTAUPDATE 2021 Volume 28 Issue 2 page 27
5
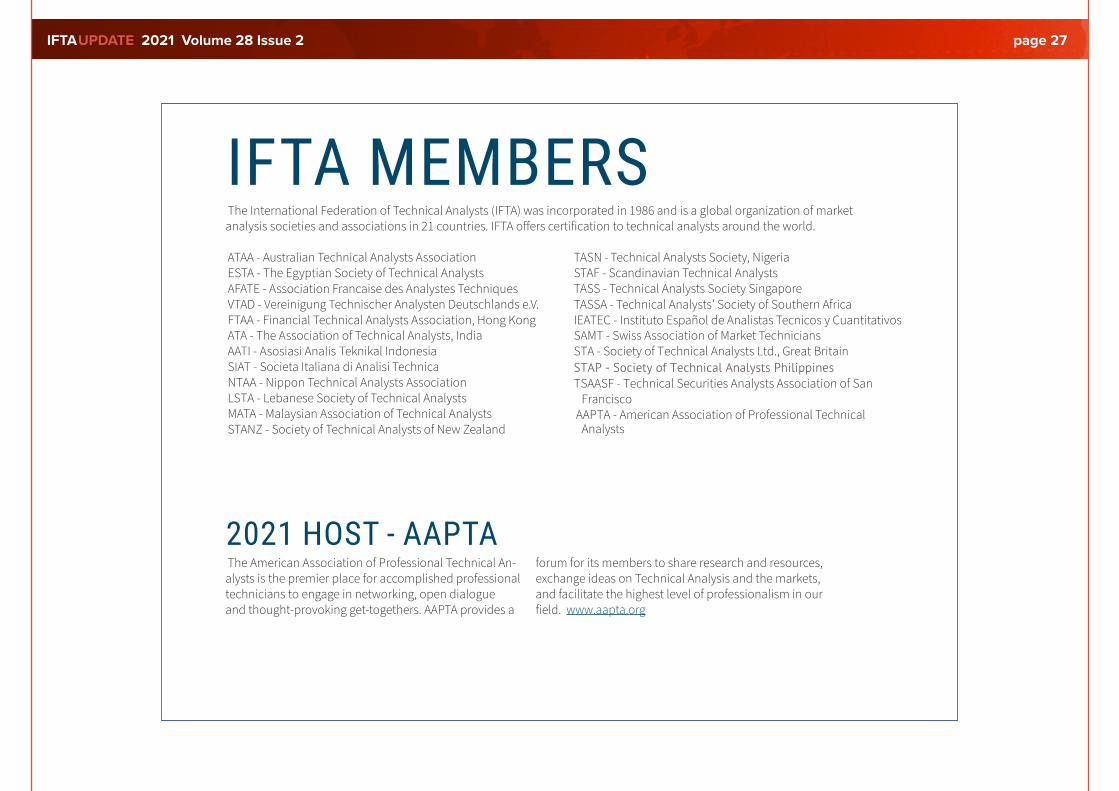
IFTA MEMBERSTASN - Technical Analysts Society, NigeriaSTAF - Scandinavian Technical AnalystsTASS - Technical Analysts Society SingaporeTASSA - Technical Analysts’ Society of Southern Africa IEATEC - Instituto Español de Analistas Tecnicos y Cuantitativos SAMT - Swiss Association of Market TechniciansSTA - Society of Technical Analysts Ltd., Great BritainSTAP - Society of Technical Analysts Philippines TSAASF - Technical Securities Analysts Association of San FranciscoAAPTA - American Association of Professional Technical Analysts
ATAA - Australian Technical Analysts AssociationESTA - The Egyptian Society of Technical AnalystsAFATE - Association Francaise des Analystes Techniques VTAD - Vereinigung Technischer Analysten Deutschlands e.V. FTAA - Financial Technical Analysts Association, Hong Kong ATA - The Association of Technical Analysts, IndiaAATI - Asosiasi Analis Teknikal IndonesiaSIAT - Societa Italiana di Analisi TechnicaNTAA - Nippon Technical Analysts AssociationLSTA - Lebanese Society of Technical AnalystsMATA - Malaysian Association of Technical Analysts STANZ - Society of Technical Analysts of New Zealand
2021 HOST - AAPTAThe American Association of Professional Technical An-alysts is the premier place for accomplished professional technicians to engage in networking, open dialogue and thought-provoking get-togethers. AAPTA provides a
forum for its members to share research and resources, exchange ideas on Technical Analysis and the markets, and facilitate the highest level of professionalism in our field. www.aapta.org
The International Federation of Technical Analysts (IFTA) was incorporated in 1986 and is a global organization of market analysis societies and associations in 21 countries. IFTA offers certification to technical analysts around the world.
IFTAUPDATE 2021 Volume 28 Issue 2 page 28
Continued on page 29
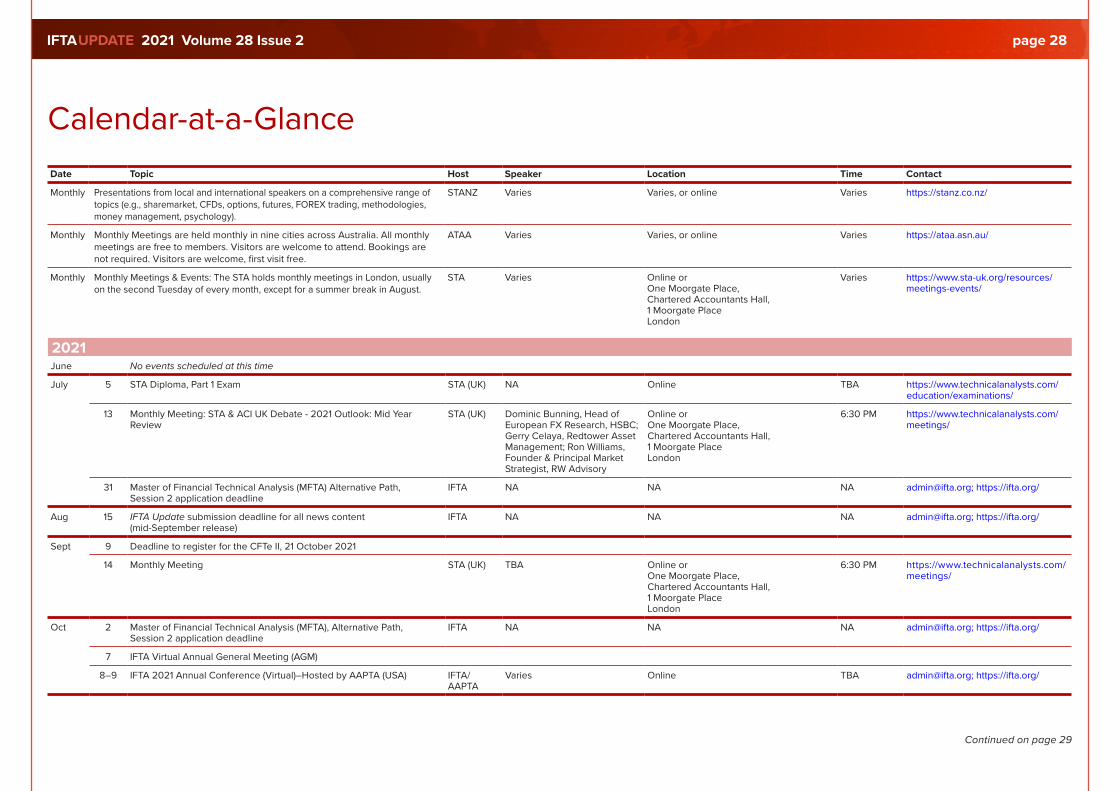
Calendar-at-a-Glance Date Topic Host Speaker Location Time Contact
Monthly Presentations from local and international speakers on a comprehensive range of topics (e.g., sharemarket, CFDs, options, futures, FOREX trading, methodologies, money management, psychology).
STANZ Varies Varies, or online Varies https://stanz.co.nz/
Monthly Monthly Meetings are held monthly in nine cities across Australia. All monthly meetings are free to members. Visitors are welcome to attend. Bookings are not required. Visitors are welcome, first visit free.
ATAA Varies Varies, or online Varies https://ataa.asn.au/
Monthly Monthly Meetings & Events: The STA holds monthly meetings in London, usually on the second Tuesday of every month, except for a summer break in August.
STA Varies Online or One Moorgate Place, Chartered Accountants Hall, 1 Moorgate Place London
Varies https://www.sta-uk.org/resources/meetings-events/
2021June No events scheduled at this time
July 5 STA Diploma, Part 1 Exam STA (UK) NA Online TBA https://www.technicalanalysts.com/education/examinations/
13 Monthly Meeting: STA & ACI UK Debate - 2021 Outlook: Mid Year Review
STA (UK) Dominic Bunning, Head of European FX Research, HSBC; Gerry Celaya, Redtower Asset Management; Ron Williams, Founder & Principal Market Strategist, RW Advisory
Online or One Moorgate Place, Chartered Accountants Hall, 1 Moorgate Place London
6:30 PM https://www.technicalanalysts.com/meetings/
31 Master of Financial Technical Analysis (MFTA) Alternative Path, Session 2 application deadline
IFTA NA NA NA [email protected]; https://ifta.org/
Aug 15 IFTA Update submission deadline for all news content (mid-September release)
IFTA NA NA NA [email protected]; https://ifta.org/
Sept 9 Deadline to register for the CFTe II, 21 October 2021
14 Monthly Meeting STA (UK) TBA Online or One Moorgate Place, Chartered Accountants Hall, 1 Moorgate Place London
6:30 PM https://www.technicalanalysts.com/meetings/
Oct 2 Master of Financial Technical Analysis (MFTA), Alternative Path, Session 2 application deadline
IFTA NA NA NA [email protected]; https://ifta.org/
7 IFTA Virtual Annual General Meeting (AGM)
8–9 IFTA 2021 Annual Conference (Virtual)–Hosted by AAPTA (USA) IFTA/AAPTA
Varies Online TBA [email protected]; https://ifta.org/
IFTAUPDATE 2021 Volume 28 Issue 2 page 29
Date Topic Host Speaker Location Time Contact
12 Monthly Meeting STA (UK) TBA Online or One Moorgate Place, Chartered Accountants Hall, 1 Moorgate Place London
6:30 PM https://www.technicalanalysts.com/meetings/
Oct 15 Master of Financial Technical Analysis (MFTA), Session 1 paper deadline
IFTA NA NA NA [email protected]; https://ifta.org/
21 Certified Financial Technician (CFTe) Level II Examination IFTA NA Varies or online TBA
21 STA Diploma, Part 2 Exam STA (UK) NA Online TBA https://www.technicalanalysts.com/education/examinations/
Nov 1 IFTA 2022 Journal Web publication IFTA NA NA NA [email protected]; https://ifta.org/publicatons/journal/
15 IFTA Update submission deadline for all news content (mid-December release)
IFTA NA NA NA [email protected]; https://ifta.org/
Dec 6 STA Diploma, Part 1 Exam STA (UK) NA Online TBA https://www.technicalanalysts.com/education/examinations/
14 Monthly Meeting STA (UK) TBA Online or One Moorgate Place, Chartered Accountants Hall, 1 Moorgate Place London
6:30 PM https://www.technicalanalysts.com/meetings/
2022Jan No events scheduled at this time
Feb 15 IFTA Update submission deadline for all news content (mid-March release)
IFTA NA NA NA [email protected]; https://ifta.org/
28 Master of Financial Technical Analysis (MFTA), Alternative Path, Session 1 application deadline
IFTA NA NA NA [email protected]; https://ifta.org/
Mar 15 Master of Financial Technical Analysis (MFTA), Session 2 paper deadline
IFTA NA NA NA [email protected]; https://ifta.org/
April TBA Certified Financial Technician (CFTe) Level II Examination IFTA NA NA NA [email protected]; https://ifta.org/
TBA STA (UK) Diploma, Part 2 STA (UK) NA Online All day https://www.technicalanalysts.com/meetings/
May 1 Certified Financial Technician (CFTe) Level II - registration opens for October examination through IFTA website.
IFTA NA NA NA [email protected]; https://ifta.org/
2 Master of Financial Technical Analysis (MFTA) Session 1 application, outline and fees deadline
IFTA NA NA NA [email protected]; https://ifta.org/
15 IFTA Update submission deadline for all news content (mid-June release)
IFTA NA NA NA [email protected]; https://ifta.org/
31 IFTA Journal Call for Paper submission deadline IFTA NA NA NA [email protected]; https://ifta.org/
Calendar continued

Balance professional development and your personal life with the STA Home Study Course©
WHY PURCHASE THE HOME STUDY COURSE?
The world-class e-learning Home Study Course (HSC)© is written by leading industry practitioners, making it one of the best online products available on the technical analysis market. Whether this is your first introduction to technical analysis, you want to refresh your existing knowledge, or you wish to become a qualified technical analyst, the STA offers a tailored Home Study Course as part of our portfolio of world respected courses preparing students for our internationally accredited STA Diploma qualification.
You can learn from the comfort of your home at times that best suit you. Although website based, it is fully downloadable and may be used online or offline via PC, Mac, iPad or Android machines.
WHAT WILL IT COVER?
• The syllabi for both STA Diploma Part 1 & Part 2 examinations
• 15 in-depth subject teaching units • Exercises to self-test progress• Exam preparation module & video• Advice on report writing.
...find out more here
Since the HSC is International Federation of Technical Analysts (IFTA) syllabus compliant it can also be used to prepare candidates for both the IFTA CFTe I and II examinations.
WHO IS THE COURSE FOR?
The course is intended for individuals who want to use technical analysis in a professional manner or who want to become a qualified technical analyst and advance their career. Enroll and start studying now!
For more details click here or contact the STA office on+44 (0) 207 125 0038 or [email protected]
WHEN WOULD YOU LIKE TO START?
Learn at your own pace rather than in a classroom - the HSC course is designed for those who need a truly part-time study option with maximum flexibility!Buy now: £1,195.00
WHY PURCHASE THE HOME STUDY COURSE?The world-class e-learning Home Study Course (HSC)© is written by leading industry practitioners, making it one of the best online products available on the technical analysis market. Whether this is your first introduction to technical analysis, you want to refresh your existing knowledge, or you wish to become a qualified technical analyst, the STA offers a tailored Home Study Course as part of our portfolio of world respected courses preparing students for our internationally accredited STA Diploma qualification.
You can learn from the comfort of your home at times that best suit you. Although website based, it is fully downloadable and may be used online or offline via PC, Mac, iPad or Android machines.
WHAT WILL IT COVER?• The syllabi for both STA Diploma Part
1 & Part 2 examinations
• 15 in-depth subject teaching units
• Exercises to self-test progress
• Exam preparation module & video
• Advice on report writing. ...find out more here
Since the HSC is International Federation of Technical Analysts (IFTA) syllabus compliant it can also be used to prepare candidates for both the IFTA CFTe I and II examinations.
WHO IS THE COURSE FOR? The course is intended for individuals who want to use technical analysis in a professional manner or who want to become a qualified technical analyst and advance their career. Enroll and start studying now!
For more details click here or contact the STA office on +44 (0) 207 125 0038 or [email protected]
WHEN WOULD YOU LIKE TO START?Learn at your own pace rather than in a classroom - the HSC course is designed for those who need a truly part-time study option with maximum flexibility!Buy now: £1,195.00
Balance professional development and your personal life with the STA Home Study Course©
WHY PURCHASE THE HOME STUDY COURSE?
The world-class e-learning Home Study Course (HSC)© is written by leading industry practitioners, making it one of the best online products available on the technical analysis market. Whether this is your first introduction to technical analysis, you want to refresh your existing knowledge, or you wish to become a qualified technical analyst, the STA offers a tailored Home Study Course as part of our portfolio of world respected courses preparing students for our internationally accredited STA Diploma qualification.
You can learn from the comfort of your home at times that best suit you. Although website based, it is fully downloadable and may be used online or offline via PC, Mac, iPad or Android machines.
WHAT WILL IT COVER?
• The syllabi for both STA Diploma Part 1 & Part 2 examinations
• 15 in-depth subject teaching units • Exercises to self-test progress• Exam preparation module & video• Advice on report writing.
...find out more here
Since the HSC is International Federation of Technical Analysts (IFTA) syllabus compliant it can also be used to prepare candidates for both the IFTA CFTe I and II examinations.
WHO IS THE COURSE FOR?
The course is intended for individuals who want to use technical analysis in a professional manner or who want to become a qualified technical analyst and advance their career. Enroll and start studying now!
For more details click here or contact the STA office on+44 (0) 207 125 0038 or [email protected]
WHEN WOULD YOU LIKE TO START?
Learn at your own pace rather than in a classroom - the HSC course is designed for those who need a truly part-time study option with maximum flexibility!Buy now: £1,195.00

Don’t Get Caught Inside When You Can Be Hanging Five
Get Started. Visit www.elliottwave.com/wave/GetCertified
OK, so truth be told, we had a fairly heated discussion at Elliott Wave International over the direction of this ad. Do we go straight serious, like just about every other ad? Or do we show our playful side, in the hope that you won’t just skip past it like all those other ads?
Because on the one hand, the Certified Elliott Wave Analyst (CEWA) designation is dead serious. The CEWA program is the standard for Elliott wave analysts. But at the same time, the Wave Principle is gnarly, dude – why surf the chop with the kooks when you could be rippin' the best waves with the locals.
And so, in an exclusive arrangement with our buds at IFTA, EWI now offers the Certified Elliott Wave Analyst (CEWA) designation for the coolest dudes: Elliott wave pros, analysts and traders.
Your CEWA designation lets everyone know that you're a legend in the practical application of the Elliott Wave Principle, one of the most recognized forms of technical analysis. With CEWA you can finally paddle out away from the crowds and find some open water where you can shoot the curl.
Show your CEWA designation to potential employers and prospective clients, so they know YOU know where the bombs -- and the grey fins -- lurk.
“Is it just me, or has Wilson gained some confidence since he became a CEWA?”

IFTAUPDATE 2021 Volume 28 Issue 2 page 32
In MemoriamJ. Welles Wilder Jr. (1935–2021)
IFTA’s 2020 Lifetime Achievement Award was pre-sented to a man who revolutionized technical analysis. In the mid-1970s J. Welles Wilder Jr. created a set of indicators that was considered revolutionary because the indicators proved optimal during the sideways period that the market was witnessing during these years.
His indicators, however, stood the test of time and proved to be of great value, even when the markets witnessed strong trends. The approach worked well in the 70s, 80s, 90s, and 2000s.
Welles was a real genius and understood very well the mechanics of market movements, which was obvious in his simple but concrete definitions of upward and downward movements in addition to the relative com-
parisons between buyers and sellers that he always used in a very professional manner.
Welles’ DMI system is one of the most well-built systems in technical analysis. It is a concrete system that gives you clear information about market direction, how strong the move is, in addition to clear overbought and oversold signals. It is important to note the DMI system (in my opinion) is the only system that can give you a real overbought situation during an uptrend, and a real oversold situation during a downtrend. This is one of the techniques that is very much underrated in this system.
Other great indicators include RSI, Parabolic (SAR), and Average True Range. Professionals that used Welles’ indicators know well that they contain real value, much more than was actually written in his books.
Welles was 90 years old, and his achievements in technical analysis are endless. He will remain one of the greatest technical analysts in history. There is no doubt about that. Thank you, Welles, for all you have done for our industry and for technical analysis. We all love and respect you.
IFTA Education Committee
J. Welles Wilder Jr.—A Farewell to One of the Greatest Technical Analysts in HistoryIt seems like yesterday that I was given the honor and pleasure of presenting the IFTA Lifetime Achievement Award to Welles Wilder during IFTA’s online 2020 Annual Conference.
It was long overdue, not only because the work and contribution of Welles was revolutionary on many levels, but also because his work helped countless technical analysts worldwide to improve their analysis and therefore make better investment decisions.
As technical analysts, we are all using at least one of the indicators and systems developed by Welles, such as the DMI System, the Relative Strength Index, the Average True Range, or the Parabolic SAR, to get better market insight.
But Welles was even more than that. In his personal life, he was also a great hus-band, father, and friend. While Welles could not receive the award himself, Tom DeMark—his close friend for over 40 years—accepted the reward on his behalf, sharing memorable stories about their decades together as colleagues and close friends.
I am grateful thinking of that touching moment when Welles’ daughter, Catherine, was with us during the conference. I still hear her loving words about Welles being a dad and a husband. Truly a very special moment that all who attended will never forget.
Welles leaves a big gap—as a husband, a father, friend, and colleague.
We have to say farewell now, but we never will forget Welles and the contribution he made to all of us. His legacy continues in our charts, and this is handed down from one generation of technical analysts to another. This is IFTA’s duty, and we are grateful to fulfill it.
Wieland Arlt, IFTA President

IFTAUPDATE 2021 Volume 28 Issue 2 page 33
In MemoriamAdrian Kömel(1988–2021)
With deep dismay, I have to inform you about the passing of one of our young colleagues and friends, Adrian Kömel.
Just a couple months ago, we were discussing the “Evolution of Trading and Technical Analysis” w i t h Adr ian , L inda Raschke, Raul Glavan, and Tobias Bärlin at IFTA’s on l ine 2020 Annual Conference.
As a technical analyst and trader, Adrian was well known for his application of CoT data and statistics. He was a dear friend and col-league and a very promising speaker, and he was just about to get the international recognition he deserved.
He left us at the age of 32.
Our deep condolences are with his family and friends.
Wieland Arlt, IFTA President
More about Adrian…Adrian Kömel studied business mathematics and success-fully completed it as one of the top students . He became interested in trading through an internship and got to know his trading partner, Tobias Bärlin, with whom he has been working and trading since then and built the website https://www.suricate-trading.com/. Tobias has been trad-ing for about 15 years now, and Adrian had been trad-ing full time for about seven years. First, they dealt with statistical approaches and evaluated the markets using simulation programs and looked at what works and what doesn’t. Through the World Trading Championship, they became aware of other approaches and analyzed what is the best in the world trade. So they got to know the CoT data and developed their own trading system that com-bines different approaches. This system combines CoT data, timing instruments, volume profiles, and the footprint chart. They had been participating in the Trading World Championship for three years and had been among the five best traders in the world every year.
IFTAUPDATE 2021 Volume 28 Issue 2 page 34
Board of DirectorsPresident Wieland Arlt, CFTe (VTAD)[email protected]
Treasurer and Website Director Karin Roller, CFTe (VTAD)[email protected]
Secretary and Membership Director Alek Jankowski, BE, M.Eng.Sc., Grad.Dip.Mgt. (ATAA) [email protected]
Vice President Middle East and Africa and Immediate Past President Mohamed El Saiid, MFTA, CFTe (ESTA)[email protected]
Vice President Europe Clive Lambert, MSTA, CFTe (STA)[email protected]
Vice President Asia-Pacific Hiwon Yoon, Ph.D., CMTA (NTAA)[email protected]
Vice President The Americas and 2021 Conference Chair Jeanette Young, CFP®, CMT, M.S. (AAPTA)[email protected]
Education Director Saleh Nasser, CFTe, CMT (ESTA)[email protected]
Examination Director Gregor Bauer, Ph.D., CFTe, (VTAD)[email protected]
Development Director Ron William, MSTA, CFTe, CMT (SAMT) [email protected]
Director Francesco Caruso, MFTA (SIAT)[email protected]
Director Nik Ihsan Raja Abdullah, MSTA, CFTe (MATA)[email protected]
Director Giovanni Trombetta, CFTA, Electronic Engineer (SIAT)[email protected]
Director Yukitoshi Higashino, MFTA (NTAA)[email protected]
StaffExecutive Director Kristen LeBlanc, MPA, CAESenior Vice President, Meetings Grace L. Jan, CAE, CMP Senior Member Services Manager Linda Bernetich, CAESenior Marketing Director Julie HillProduction Manager Maryia AlenchykManaging Editor Lynne AgostonDirector of Accounting Services Dawn Rosenfeld
IFTA HEADQUARTERSInternational Federation of Technical Analysts 1300 Piccard Drive, Suite LL 14 Rockville, MD 20850 USA
Phone: +1 240-404-6508 Fax: +1 301-990-9771 Email: [email protected]
AUSTRALIA—ATAA Australian Technical Analysts Association www.ataa.asn.auEGYPT—ESTA Egyptian Society of Technical Analysts www.estaegypt.orgFRANCE—AFATE Association Française des Analystes Techniques www.afate.comGERMANY—VTAD Vereinigung der Technischer Analysten Deutschlands e.V. www.vtad.deHONG KONG—FTAA Financial Technical Analysts Association www.ftaa.org.hkINDIA—ATA Association of Technical Analysts www.tataindia.orgINDONESIA—AATI Asosiasi Analis Teknikal Indonesia www.aati.my.idITALY—SIAT Società Italiana di Analisi Tecnica www.siat.orgJAPAN—NTAA Nippon Technical Analysts Association www.ntaa.org.jpLEBANON—LSTA Lebanese Society of Technical Analysts www.lstalebanon.comMALAYSIA—MATA Malaysia Malaysian Association of Technical Analysts www.malaysianchartist.comNEW ZEALAND—STANZ Society of Technical Analysts of New Zealand www.stanz.co.nzPHILIPPINES–STAP* Society of Technical Analysts Philippines www.technicalanalysts.orgSCANDINAVIA—STAF Skandinaviens Tekniska Analytikers Förening www.staf.nuSINGAPORE—TASS Technical Analysts Society (Singapore) www.tass.org.sgSOUTH AFRICA—TASSA Technical Analysts Society of Southern Africa www.tassa.org.zaSPAIN—IEATEC Instituto Español de Analistsas Técnicos y Cuantitativos www.ieatec.esSWITZERLAND—SAMT Swiss Association of Market Technicians www.samt-org.chUNITED KINGDOM—STA Society of Technical Analysts Ltd. www.sta-uk.orgUSA—TSAASF Technical Securities Analysts Association www.tsaasf.orgUSA—AAPTA American Association of Professional Technical Analysts www.aapta.com*Developing Society
IFTA Update ScheduleThe IFTA Update is the quarterly electronic newsletter of the International Federation of Technical Analysts, reaching more than 7,000+ IFTA colleagues worldwide. The Update is an efficient and cost-effective way to communicate with IFTA’s member societies and colleagues.
PUBLICATION SCHEDULESeptember Issue All content due August 15December Issue All content due November 15March Issue All content due February 15June Issue All content due May 15
Send Education Lounge article submissions to [email protected]. Send all other content to [email protected] more information and to advertise, visit our website: www.ifta.org/publications/newsletter/.
IFTA Member Societies
Related Documents