PRESIDENT'S LIST OF ARTICLES WHICH MAY BE DESIGNATED OR MODIFIED AS ELIGIBLE ARTICLES FOR PURPOSES OF THE U.S. GENERALIZED SYSTEM OF PREFERENCES Report to the President on Investigation Nos. TA-503(a)- 11 and 332-166 USITC PUBLICATION 1526 MAY 1984 United States International Trade Commission / Washington, D.C. 20436

Welcome message from author
This document is posted to help you gain knowledge. Please leave a comment to let me know what you think about it! Share it to your friends and learn new things together.
Transcript

PRESIDENT'S LIST OF ARTICLES WHICH MAY BE DESIGNATED OR MODIFIED AS ELIGIBLE ARTICLES FOR PURPOSES OF THE U.S. GENERALIZED SYSTEM OF PREFERENCES
Report to the President on Investigation Nos. TA-503(a)-11 and 332-166
USITC PUBLICATION 1526
MAY 1984
United States International Trade Commission / Washington, D.C. 20436

UNITED STATES INTERNATIONAL TRADE COMMISSION
COMMISSIONERS
Alfred E. Eckes, Chairman
Paula Stern
Veronica A. Haggart
Seeley G. Lodwick
Susan W. Liebeler
David B. Rohr
Kenneth R. Mason, Secretary to the Commission
Prepared by the Office of Industries
Norris A. Lynch, Director
Address all communications to
Office of the Secretary
United States International Trade Commission
Washington, D.C. 20436

CONTENTS
Page
Introduction------------------------------------------------------------- 1 Presentation of probable effects advice:
Commodity digests 3 TSUS items covered in prior investigations 4
Digest locator 5 Appendix A. U.S. Trade Representative request of July 21, 1983, for
probable economic effect advice A-1 Appendix B. U.S. International Trade Commission notice of investi-
gation and hearing--- B-1 Appendix C. List of witnesses appearing at the Commission hearing C-1
Note.--The whole of the Commission's report to the President in November 1983 may not be made public since it contains certain information that has been classified by the United States Trade Representative or would result in the disclosure of the operations of individual concerns. This published report is the same as the report to the President, except that the above-mentioned infor-mation has been omitted. Such omissions are indicated by asterisks.


INTRODUCTION
On July 21, 1983, in accordance with sections 503(a) and 131(a) of the
Trade Act of 1974 and pursuant to the authority of the President delegated to
the U.S. Trade Representative (USTR) by Executive Order 11846, as amended by
Executive Order 11947, the USTR requested advice in four areas related to the
GSP: (1) the addition of certain articles to the list of GSP eligible
articles, (2) the removal of certain articles from the GSP list, (3) the
removal of duty-free status under the GSP for certain beneficiary developing
countries for certain articles ("graduation"), and (4) a determination of
whether or not certain articles are like or directly competitive with any
article produced in the United States on January 3, 1975, for purposes of
section 504(d) of the Act. 1/
For each article being considered for addition to the list of eligible
articles, the Commission is advising the USTR as to the probable economic
effect of the addition on U.S. industries producing like or directly
competitive articles and on consumers. For each article being considered for
removal or graduation, the Commission is advising the USTR as to the impact on
U.S. industries producing like or directly competitive articles and on
consumers of continued GSP status for the articles and countries in question.
The USTR requested the Commission, in providing its advice, to assume
that benefits of the GSP would not apply to imports that would be excluded
from receiving such benefits by virtue of the "competitive need" limitations
specified in section 504(c) of the Act.
Section 504(d) of the Act exempts from one of the competitive-need limits
in section 504(c) articles for which no like or directly competitive article
1/ The USTR request, including four listings of concerned articles, is contained in appendix A.

-2-
was being produced in the United States on the date of enactment of the La.
Accordingly, pursuant to the authority of section 332(g) of the Tariff Act of
1930, the USTR requested that the Commission also provide advice with respect
to whether products like or directly competitive with any articles contained
in Part A of the USTR request were being produced in the United States on
January 3, 1975.
In response to the USTR request, the Commission on August 5, 1983,
instituted investigation. Nos. TA-503(a)-11 and 332-166 for the purpose of
obtaining, to the extent practicable, information for use in connection with
the preparation of advice requested by the USTR. The Commission notice of
investigation and hearing is contained in appendix B. 1/
A public hearing in connection with the investigation was held in the
Commission hearing room, 701 E Street NW., Washington, D.C. 20436, on
September 27 and 29, 1983. All interested parties were afforded an
opportunity to appear by counsel or in person, to produce evidence, and to be
heard. Transcripts of the hearing and copies of briefs submitted by
interested parties in connection with the investigation are attached. 2/
1/ The following Federal Register notices have been issued related to Investigation Nos. TA-503(a)-11 and 332-166:
Date ' Agency Notice Subject
July 21, 1983 USTR 48 F.R. 33400 Initial notice. Aug. 12, 1983 ITC 48 F.R. 36675 Initial notice of ITC
investigation and hearing.
2/ A list of witnesses appearing at the Commission hearing is contained in app. C.

-3--
PRESENTATION OF PROBABLE EFFECTS ADVICE
Commodity digests
In response to the USTR request for probable effects advice, the
Commission determined that an appropriate format for such an analysis would be
commodity digests, each digest dealing with the effects of tariff .
modifications on a specific commodity area.
For each of the commodity areas being analyzed, the digests provide an
analysis of the impact of the possible tariff modifications on U.S. import
levels, industry and the consumer. Within each digest the probable effects
advice is provided in both a textual and code format. The probable effects
code provides the reader with a quick summary of the probable effects on
import levels, industry, and the consumer as follows:
1. Level of U.S. imports Code A: nil or negligible increase (0-5 percent) Code B: modest increase (6-15 percent) Code C: significant increase (16-25 percent) Code D: substantial increase (over 25 percent)
2. U.S. industry Code A: nil or negligible adverse impact Code B: significant adverse impact (significant proportion of
workers unemployed; declines in output; firms depart, but adverse impact not industry-wide)
Code C: substantial adverse impact (substantial unemployment; widespread idling of productive facilities; adverse impact on the industry as a whole)
3. U.S. consumer Code A: Duty savings are expected to be absorbed by the foreign
supplier and/or importer and will not likely benefit the industrial/intermediate consumer or the consuming public.
Code B: Duty savings will likely benefit the industrial/inter-mediate consumer, but the consuming public is not expected to benefit from the duty savings (which are expected to be absorbed in the trade).
Code C: Duty savings will likely benefit both the industrial/ intermediate consumer and the consuming public (which are expected to benefit by lower prices, slower rises in prices , and/or greater availability of the ultimate products).

-4-
TSUS items covered in prior investigations
GSP probable economic effect advice was provided in Investigation no.
TA-503(a)-7 for the items listed below. This volume contains updated data and
probable effect statements for these articles.
161.60 685.1915 (Advice previously given at 5-digit level)

DIGEST LOCATOR
Digest numbers, titles, and the contents of each digest by TSUS item are
provided below.
A. Articles being considered for designation as eligible articles for the GSP
Digest number
Commodity/TSUS item
A101 Alfalfa seeds 126.01
A102 Certain prepared or preserved strawberries 146.85
A103 Mustard, other than ground (prepared) 161.60
A401 p-Toluenesulfonyl choride 403.05
A402 Benzoic acid 404.04
A403 Rubber processing chemicals 406.16 406.40(pt.)
• A404 Other cyclic intermediate chemicals 403.16(pt.) 405.09 (pt.) 406.48(pt.)
A405 Meclizine hydrochloride 411.56(pt.)
A406 Acetyl sulfisoxazole; and sulfamerazine, sodium 411.83(pt.)
A407 Chlorpropamide and chlorothiazide 412.69(pt.)
A501 Certain colored sheet glass 542.57 542.67 542.71 542.73 542.75 542.77 542.92 542.94 542.96 542.98
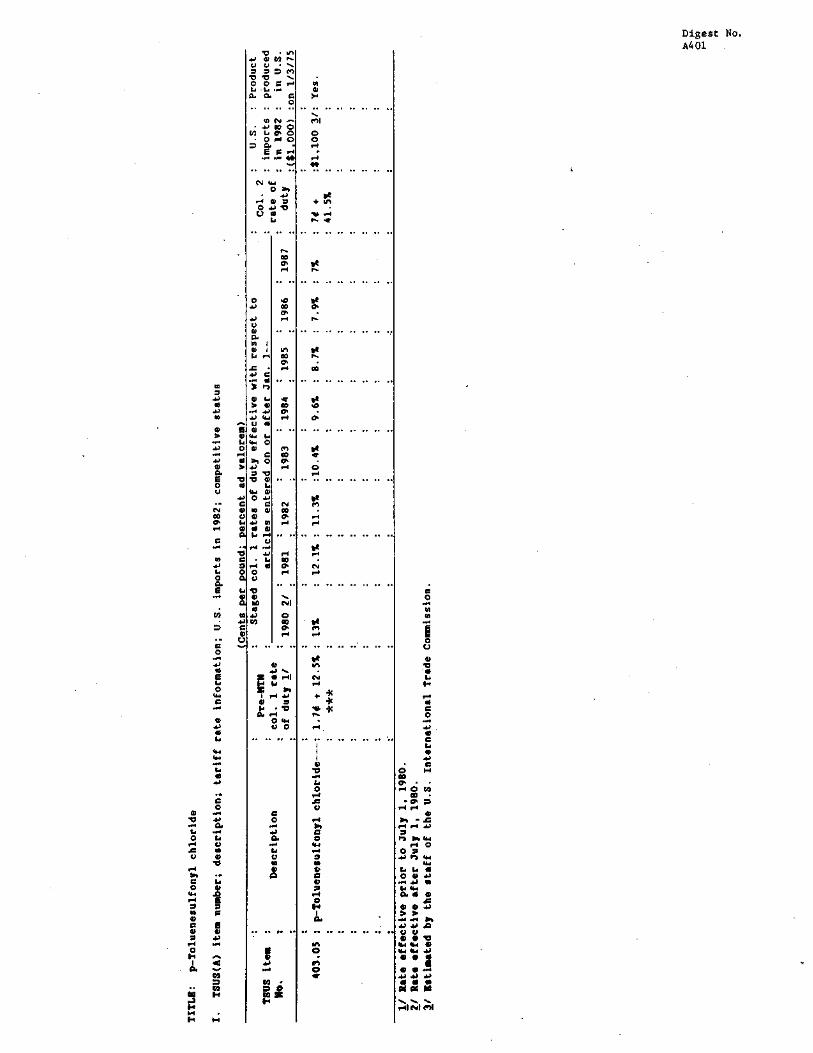
A502 Certain float and plate glass 543.21 543.23 543.27 543.31 543.61 543.63 543.67 543.69
A.601. Antennas 685.1915

6
Digest number
Commodity/TSUS item
A701 Handmade wood or clay dolls 737.24(pt.)
A702 Resin buttons and certain button blanks, molds, and parts
745.32 745.42
B. Articles being considered for removal as eligible articles for the GSP
Digest number
Commodity/TSUS item
B401 2,4-Dinitro-6-sec-butylphenol 408.22(pt.)
B402 Melamine 425.1020
B403 Citric acid 425.74
8601 Pipe & tube fittings of iron or steel
610.62 610.63 610.65 610.66 610.70 610.71
610.74 610.80
B701 Furniture of rubber and plastics, n.s.p.f.
727.50 727.8630
B703 Fishing reels valued not over $2.70 each 731.20
C. Articles being considered to remove duty-free status from a beneficiary country for a product on the list of eligible articles for the GSP
Digest number
C501
C601
C602
Commodity/TSUS item
Certain glass containers 545.21 545.25 545.27 (Mexico)
Porcelain-on-steel cooking and kitchen ware 654.02(pt.) (Taiwan)
Portable air purifiers 661.95(pt.) (Hong Kong, Taiwan)

Digest number
Commodity/TSUS item
C603 Drilling machines valued under $2,500 each 674.3227 (Taiwan)
C604 12-volt lead acid storage batteries 683.05 (Republic of Korea)
C605 Ignition wiring sets for motor vehicles 688.12 (Taiwan)
C701 Certain fixed-focus cameras
722.1205 722.1212 722.1225 (Hong Kong, Republic of Korea, Taiwan)
C702 Pianos
725.01 725.03 (Republic of Korea)


Description
• • • • • • • •
44 VI • • • • 1100 2:1 2 • 0 2:/ 10 0 • a. 1r 0 •
• • • • • • • •
211 04
• 43 03 0 Oi 03 laQ
• o o a a owl
owl
• • • • • • • • - • • • • • •••
044 C4 43 ti g e).
• a •
41 %) CY 01 0 ..4 0 1
A41 ... ..1
O Ls Simi .5
U • 0 (0
0 33
.1.) u .0 •...
11 • 03
.mil • CD • I .-1 • 1 ta 4-1
.0 • .
.■," 0 6ts .4, ■•• G. ii ID o-11 2 ft o. - • ... •
mve mim; 0 4.1 04 C O
•
41. .... 0 a) 00 r-11 .46 00 14 CD
0 41
Uo .•1 el • 44
C 44 Id 0 o 41 Id 7 23 01 •••• 0
1O/ 0 CO v-11 Z L. 17
04 • .4 • O 41
•C V •
0 • la • imi ♦0 111 (V .mm. O 0 03 •-11 r-1 1.1 4.4 CO 5
ti .4 S. 6.4 44 •
44 • 44 • Le 4
1-1 • 6-4 A 16-1 •••• 46 11 OD .41 mbi
0, ,I X ,-I 0 • X 00 •• •• • • V3
•
110 •••• .41
34 . O. ,-4 164
0 .• .. •• ..
.... 0 •
• .4 g Ai 0 1 • At fa
fa 44 10 CO 2 0 0
4 1 1F-1 1:1 166 •
1126 0 JO
to • 4.6 X ,t 0
.4 o IL ail moo 0 O 1.4 •
.0 .. .. .. .• .. .• .. .. .. 41
a
• •• • 4
▪
■■
a
• ws •0 ..• • • W • 4)
• a Is • : • 4:
a. 00
4-1 C • • • Simi • .0 S *•4 id s• a a ED 0
...1 lo • • U
III a • 0 41 V
v-1 o 0 0
03 X X = 44
g cm r4
... ,41
TITLE: Alfalfa seed
item
num
be
r;
descr
ipt
ion;
tar
iff ra
te
in
form
at
ion;
U.S.
imports
in
19
82;
competitiVe
sta
tus
ao H 1.4
ri
0.0 • • • •

2
Digest No. A101--Con.
II. Comments
Description and uses
The seed here considered is used in the production of one of the most
widely grown cultivated forage 1/ legumes, alfalfa. The plant is a long-lived
perennial legume 2/ which is high in digestible protein. The long tap roots
of alfalfa, which may penetrate the soil to a depth of 25 feet, improve soil
texture. Alfalfa is grown separately or with other legumes and grasses as a
pasture, hay, silage, 3/ and soil-improving crop; some is dehydrated to
produce alfalfa meal pellets. Of relatively recent origin is the use of
sprouted alfalfa seed as an ingredient in salads; the amount of seed so used
is not known, but it is small relative to that used for planting purposes.
The Federal Seed Act 7 U.S.C. 1551 51551 (1976) requires that imported
alfalfa seed for planting be stained to identify its origin. Ten percent of
the alfalfa seed in each container imported from sources other than Canada or
South America must be stained red, 10 percent of such seed from South America
must be stained orange red, and 1 percent of such seed from Canada must be
stained violet. Imported alfalfa seed must also be treated to eliminate
fungus infection.
U.S. producers
Alfalfa is grown for forage in nearly every State, but principally in the
North Central States. Alfalfa seed, however, is produced primarily in the
1/ Forage is an animal feed, generally hay or pasture. 2/ Legumes are a family of plants that, with the aid of bacteria, have the
ability to use atmospheric nitrogen for plant nutrition; examples include alfalfa, clover, peas, and beans. 3/ Silage is grasses, legumes, or grains which are preserved by their own
fermentation in a silo.

3
Digest No. A101--Con.
Western States, where the climate is favorable for seed production and
harvesting. In recent years, California has been the leading producer,
accounting for more than 40 percent of the U.S. production. About 5,000 farms
produce alfalfa seed. U.S. producers are well-established and world-renowned
for the quality of their alfalfa seed.
Alfalfa seed production is a capital-intensive operation. The producer
often produces seeds under the regulations of the State seed-certifying agency
in order to be eligible for seed certification. 1/ The grower may produce
seed under contract for a wholesaler, he may be a member of a cooperative, or
completely independent. Most producers limit their marketing activities to
large wholesalers in their area of production. The wholesaler, in turn, may
be tied by contract, pricing, policy, custom, or ownership directly to
midwestern or eastern distributors.
U.S. consumption and production
Apparent consumption of alfalfa seed increased from 74 million pounds in
1978 to 95 million pounds in 1981 and then declined slightly to 90 million
pounds in 1982 (table A). Domestic producers supply virtually all of
consumption.
The United States is the world's leading producer of alfalfa seed.
During 1978-82, annual U.S. production of such seed increased irregularly from
92 million to 106 million pounds. In recent years, alfalfa seed has been
1/ Seed certification is the system used to keep pedigree records for crop varieties and to make available sources of genetically pure seed for general distribution.

4
Digest No. A101--Con.
harvested from fewer acres, but with increased yields. Forage crop seed can
be stored for several years and still retain most of its viability (the
ability to take root and grow). In recent years, carryover stocks of alfalfa
seed have been equivalent to one-third to two-fifths of domestic output. Most
of the stocks are held by seed dealers.
U.S. exports
During 1978-82, annual U.S. exports of alfalfa seed ranged from
11.6 million pounds in 1978 to 20.7 million pounds in 1980 and averaged
15.7 million pounds, valued at $20.1 million (table B). Mexico, Canada, and
the Republic of South Africa were the principal markets for U.S. exports, and
together accounted for two-thirds of the 1982 total. Exports were equivalent
to about 15 percent of production during the period under review. A decline
in exports in 1982 reflects, in part, the strength of the U.S. dollar in
relation to foreign currencies, Mexico's economic situation which dampened
sales to that market, and reduced purchases by Australia due to drought
conditions in that country; also, exports to Poland ceased because of that
country's foreign exchange problems. Exports to Poland resumed during
January-June 1983 and accounted for most of the increased shipments in that
6-month period compared with those in the corresponding period in 1982.
U.S. imports
U.S. imports of alfalfa seed are small in relation to domestic production
and consumption. Canada is virtually the only foreign producer of alfalfa

5
Digest No. A101--Con.
seed that is adapted for general agricultural use in the United States (7 CFR
201.103). During 1978-82, imports increased irregularly from 107,000 pounds,
valued at 8109,000, to 1.2 million pounds, valued at $902,000 (table C).
During January-Juno 1983, imports amounted to 1.7 million pounds, up
49 percent from those in the corresponding period of 1982. The sharp jump in
imports reflects, in part, increased demand for seed owing to a new U.S.
Department of Agriculture (USDA) program in 1983 to reduce certain crop
surpluses (payment-in-kind program). To participate in the program, the USDA
requires that growers of wheat, corn, grain sorghum, rice, and upland cotton
must keep idle a portion of their crop land, which must then be put into soil
conservation uses such as pasturage (which includes alfalfa).
Canada has been the leading supplier of alfalfa seed imports in recent
years. Imports from'GSP-eligible countries accounted for less than 1 percent
of the total during 1979-82; no, imports of alfalfa seed entered from Chile,
the petitioner for duty-free treatment (table D). Chilean alfalfa seed is
grown at various altitudes which results in seed of differing degrees of
hardiness; consequently, some of the output may be suitable for use in parts
of the United States. The sharp difference in the unit valdes of imports from
different sources and from one year to the nest reflects, in part, the
relative quantities of high-priced certified seed and low-priced uncertified
seed. Most of the imports consist of entries by U.S. seed companies to

6
Digest No. A101--Con.
supplement their domestic output or to use for experimental purposes; some
imports from Canada are border trade entries'.
Position of interested parties
The Government of Chile is the petitioner for GSP treatment of alfalfa
seed. There were no representations presented by interested parties during
the investigation.

7
Digest No. A101--Con.

8
Digest No. A101--Con.
Table A.--Alfalfa seed: U.S. beginning stocks, production, exports of domestic merchandise, imports for consumption, and apparent consumption, 1978-82, January-June 1982, and January-June 1983
(Quantity in thousands, of pounds; value in thousands of dollars; unit value per Pound)
•
Period
: :
Begin- . on: fling Production'
stocks •
. : .
• : :Imports: : 1/ : : :
:Ratio (per-Apparent : cent) of consump-
: tion
imports to :consumption
Quantity
: : : • 1978 : 28,268 : . 91,725 : 11,572 : 107 : 74,481 : 2/ 1979 : 34,547 : 100,235 : 17,063 : 3 : 77,556 : 2/ 1980 : 40,166 : 102,140 : 20,723 : 66 : 76,068 : 2/ 1981 : 43,581 : 114,955 : 17,097 : 426 : 94,869 : 2/ 1982 : 46,996 :3/ 106,000 : 12,254 : 1,198 : 3/ 90,000 : 1 January-June : : : : :
1982 : 46,996 : 4/ : 5,961 : 1,113 :. 4/ : 4/ 1983 : 4/ : 4/ : 7.735 : 1.663 : 4/ : 4/
Value
1978 : 4/ : 106,084 : 14,220 : 109 : - : 1979 : 4/ : 113,115 : 21,174 : 7 : - : 1980 : 4/ : 114,652 : 26,098 : 64 : - : 1981 : 4/ : 122,133 : 23,969 : 301 : - : 1982 : 4/ : 4/ : 14,914 : 902 : - : January-June : : : : : :
1982 : 4/ : 4/ : 8,259 : 879 : - : 1983 : 4/ : 4/ : 7.925 : 1.368 : - :
Unit value
1978 : - : $1.16 : $1.23 : $1.01 : • - : 1979 : - : 1.13 : 1.24 : 2.28 : - : 1980 : - : 1.12 : 1.26 : .98 : - : 1981 : - : 1.06 : 1.40 : .71 : - : 1982 : - : - : 1.22 : .75 : - : January-June : : : : . :
1982 : - : - : 1.39 : .79 : - : 1983 : - - : 1.02 : .82 : - :
1/ Canada accounted for 94 percent of the imports during 1978-82, in terms of quantity. 2/ Less than 0.5 percent. 3/ Estimated by the staff of the U.S. International Trade Commission. 4/ Not available.
Source: Production and beginning stocks, compiled from official statistics of the U.S. Department of Agriculture, except as noted; imports and exports, compiled from official statistics of the U.S. Department of Commerce.
Note.--Unit values are calculated from the unrounded figures.

41 a ea Co co UN C)
4• IV
4414 00 00
•
0 4' .7 0 Pt ......
.0NO....111trItNiors
N
4,0 04. 4. 00 041. 00
U. UN ..... uM 03 03 10 r. 0.1 Pn ..... UM PA 01
PI V4 v. v*
•
0•40 gr r. SP N 0 Pm 03 gt N UM P. 40
Kr PN
•
40N gr r0 40 Kr IP 4` ol 43 P. NJ 40 .0 a. 4 NP UM
uM gr oN
44 44 um Co PN U. MI rg MI 40 .0 .■ CP gf 01 40 ru rg Ad NT V.
PA
▪
UN ral ..
•
P4 C2 C2 OK CD Pa 40 411 40 UM .■ Kr UM U. 40A SD gr oN CD V4
PO
▪
WI
I 1 1 11 I I I I
1 1 1 1 I 1 I 1 C. 1 1 I • •
• -• .c co • •
▪
.0 L. • 44 MD 01 • 34 • I. U 0 1.• • L. .0 CO 4.1
• C O. oC • 14 L •••■
W OO 44 S.20.. = i.140 4/1 w U. 0 IC
• O. I .1. 04 1 .r 1 44 ••• P. .■
VO UN p.
• oft
011 ,O0 . 00 00
PN 02 40 Mf 4040- .. H..P .. 44 P. Kr N MN P. MI IA
N
gr UM VP N NM OD .- gr .- A. C3 0. N UN CO O3 P. WI WM
P. 4K C2 P. 4040 00 C2 KO gr gr 40 1140 N0 PI r4• N P%
VD gr pN
C3 MI N ..... P. N 4.4 CD N VD /N N .0 PI 01 Pm CP 441 eg
P. UN MN Pp
• up .0 gr CD 03 40 Kr 44 40 CD OK tri 03 .0 M1.0 pot ro gr
gr V N N
0.0 00
P% C3 1.4 ON MN rg C3 4K 41 UM 40 UM N PP OM MI N D
PI .7 IP. O.
I 1 1 1 I I I I I I I I I I • •
••• .0 44 0 • • .0 L • 44 0 u 1341• 3441S.tJ 0H -- • 1. 4.0 0 ■ C O. 4 • wa Y • • 44 1. 3 0 ••■ ▪ es LII .11C
0 C 2 -f 1
• 3 C •
N 0 t . • o■
•
•
4.
0 •
• o.
C
I. a.
.o
U
C •
•
•
- •
4.
• O Is
414 0
III 03 0*.
0 O. 111 ▪ C • 3
• I • !. • L.
• • 2
•• C 13 • • -1 41 WI VI
C
• N tO 11,
ot 1 1
CO
• *4 O a 0.
N 03 P
•• •• ea
N 03 O.
OD 400 4Mb 0414.
• 40 40
(1.
00
0 p
ounds
)
Y. 4.1
C a 3 a
O CO
• 0.0
tr• N.
00 00 GO 00
P
00 • 40 • •
re • a
Value (1,000 dollars
)
Unit value (per pound
)
. . 00 . 00 se .
Digest No. A101 --Con.
9
P. qr I 0 1 Ch d CP .■ ru CP PM • • • • •
0. 410 00• 00.
•• • • • •
M CD VD CD N pm PI rg JN um 4r WI AM • • • • • • • •
v. v. 0. N v* v. v. V. •
UM UM 413 CD UM PN UM PI N .....
• • . • • .• • • M. V. V. V. 42 •
••
04. SO uM UM 01 CD 43 UM N P4 40 UM PI 11M P. PI • • • • • . • •
104 ••
ru UM P. CD rg 40 PI • • • • • • • •
CO P. N 441 40 Pm N 4, N eSI N It's CI NI P. MI • • • • • • • •
N CD CP N p% qr CD MIN PI 42 .■ UM CD
. . . . . .
•4•
00 .
O 0.
POO
v.
N •
VI Oa
•
N
• •
• • a O t.1
0
4.1 C • • 4.
a
O •
a
.40
0
111 U
4, UI
a
a
■■- •4- 0
• O I. 4-
12 0
a. •
I I I 1 1 0 I I I I I I I I I a I I I L 171 44 I I I • 0 •
41- III ..■ .0 1. 0 II • J3 L. • 40 5 U 13 WI • A• I. U 0 3
•••• • t. ..." cp 4' 0 4C 0 • c co. .• • a 6.4 UI • moo 404.30 ,-,
Z U et US 04 u. 4C IC 4C

January-June 1982.
and
N co
• U 1. 2 0 IA
..• • 0.
U C
0.
a. .0
C O 41 0. •
2
C 0 U
0 1•
•I
▪
. 0 0. •
• in WI .10
Oa
111 • • C Si 3 Inn
• 3.- a.
• 3 • C .4 •
•
•
.•
• •0 1 1 I 10 I N .4
03 1 I 1 I 1 1
O •• 11111 O.
03
.•
OINIP.4.111 0. N
00 04 00 . WI 00 . 00 .
P. 1 1 1 I 1 to N VI
00
41 1 I I I I I I
✓ 1..1114'1
•
0 O O 0
• •-• •
••• 1 C 2 0 O.
a. • O.
3
c o
an i I 1 0 1 O. 0. V P. . • • 0 0 0 •
e■ I toe 1 1 1 los O'
Depar
tment of Commerc
e.
In
• .c
is. 0
U
IP. •
0
0 1 •• 1 0 NI 1 1 1 P•• CI WI 0
• • • • 0 NI CV •S' •
N 1 1 1 1 1 N
O •
N .. •
00
In 1 I I 1 1 I 1 0
N • or
oe
UN I 01 1 1 1 1P• P•• •••
• ••• •
O •• N •
er.
O
4.
• U
O *4-
Digest: No.
A101 — —Con.
10
00 00 /A 00
N
00 00 OD 00
ao
00 00 00 ••
O O O. 11.•
• U I. 3 O
IA
. 00
00
•• CI I 1 1 1 1 UN •• N 0
• • • • •
1 1 1 I I 1 1 1 1 1 1 1 1 1 1 1 I I 1 1 1 1 1 1 1 1 1 1 1 I I 1 1 1 1 1 I 1 1 1 1 1 L-4 I 1 1. 4* 1 I I a. 1 1 1 • • I 1 • • I I •
••• M C .0 4.• • C L 40 C ea • • 'CI 40 •-• • 0 4• 0 • • • 0 4. .4 • 0 • • '0 4A • 0 41 131.3.•••1111111.11.101.• 51.34411111111.11.102 0.10 .•44••••C-• ••-••••■ • C ••• • do C ••∎ 4 C InflY.at/•4 • x.4 C • • •• N • an ••• CM1114.0 0N•x••• • 3 J. • • I. • ••• • •• • • a. • ••• • 3 .0 • • V • U•C•••ZO.Z11.3C4 ••••11.••00..Z11.Z 4C 4*4 Z S.Z It.£4
N 8:1 I.
Quantity (
1,000 pounds
)
I
• 01 • ia •

Including
.desig
nate
d GSP countr
iesi 1979-82 and
January-
• • •
go4
• 3
wee •
eie fio •
"ee , a
4./
0 O. •
1.5
.10 • • • 10
0 • 0%
•
▪
• W C
•
1
0 • a • 1—
•
Digest No. A101--Con.
11
OD 00
e0
00 OD
00
• • C • 6 • a.
Oa
s. O •
0 0 OD
N 0
0
GO 00
0 0
00 00
ee.
C 3 0 0.
0 0
t.r
1.1
40 C • 3 O
O
00 00
0 0
0
• 40 0 40
• • •A•
40 0 40
•
000
es M
0 0
0 0
••• 0
000
00
0
N
0
0 a eo
• eol wee
O 0 0
en.
• •
owl •
•
00 .
00 .
• 4' 0
N
t.
Mt 00
N
00 00
• 44 0
00 M
1
1 1
1 1
N 1
1 1
1
I
l■
1
1
M
too 0
1
I
1
I
• •
• • • 0
1•• 0 40 C • ■
44
•
• O •
1/1 •
• a .14
•1. 0
4A N
4.• ■
sm4 •
ee.
ow.
•
• s.
• • U a. • V1 • • 44 4.4 9 111 • 0
1. • t. • •••• 0 O. • 0. 6 • 0 40 4.• • •• C 04' 4• • -• C 0 44 4A • • •A•
• OUCIOI A • Z U C 111 30 0 •• • ••• • 0 A. • ••• • LI • 0 • 6 • • 11 vs Oo I. 3
• 11 • 1. 0
• • • t. • • O 0 C • 0. • 0. z t a. a 6 V IA t. • Ill ♦• 0 N CO 0 J •A CO


• •
.01
• • • •
• • • O. •
8
• •
!SUS it
em "
umbe
r; descr
iptio
n; ta
ritt ra
ts informat
ion:
U.S.
imp
orts
is
191
2; c
ompo
titive sta
tus
si • M
• •
A102
•• •• •• 4ND *0 •• •• ••
•• 00 •• *0 •• •• 00 00 ••
."4
00 00 •• 0* 00 *0 00 4•0 00
00 •• 00 00 OND *0 00 •• 00
tol
•• 00 0* 0* 00 00 0* 0*
0* •• •• •• •• •• •• ••
:=81
•• •• •• *0 •• •• 044.
00 00 • 41 00 •• •• ••
.`• •• •• 00 •• •• ••
ro 00 •• 00 00 IND a*
1 3
• V
" •
kd• 0 0 • • •• I.
Ss S. * •• A • Dog
1 .hi • 2 •
• • 4+ • • • S. 011 • • Is • Sr
• • • es A • 14 Is 0
0 0 Id U. S
•• •-• •41 004 00 •• ••
M • • to
• • 0
• O
A
•
• et • ttt
to
a • A 41
O O O a 0 t
▪
e•
• A
•
■
•
4.1
• a •
•
(Perce
nt
a d val
orem
) :
2,
46.42m
S
tage
d co
l. 1
rate of du
ty o
ffse
t's
' with resp
ect to
• . Col.
:
U.S. : Pr
o duc
t 28U8 it
em : ar
tic l
es e
ste
rsd
o n o
r at
ter
Jas.
1-- : im
ports :
pro
duced
Descr
iption : c
ol. 1 ra
ts : .
rat. of
. a. a
ss,
s i. n
a
Se. •
. :
: o
f du
ty : 19$0 •
1911
1 1982 g 191
3 : 1984 g 198$
• 1984 :
1 957
' Ogts • -- --
- - ' - - -'-
' : : : ; :
- :
(81.
0001
:on
1/W1S

2
Digest No. A102--Con.
II. Comments
Description and uses
The article under review is strawberries prepared or preserved in any
manner other than by being frozen, dried, or in brine, as provided for in TSUS
item 146.85, subpart B, part 9 of schedule 1. Headnote 1(e) to subpart B
excludes certain kinds of products from the definition of "prepared or
preserved;" the principal strawberry products so excluded are strawberry paste
and pulp, and strawberry jelly and jam. Products which are covered by TSUS
item 146.85 include strawberry preserves, strawberries heat-sterilized in
airtight containers of glass or metal (canned strawberries), and strawberries
aseptically packed. Strawberries which might appear fresh or chilled but are
advanced beyond their crude or natural state also would be classified under
TSUS item 146.85 1/, as would any other forms of strawberry preparation or
preservation not elsewhere provided for in the TSUS.
Strawberries are processed for many end-uses, chief among them are jams,
jellies, and preserves; desserts and dessert toppings; and flavoring for ice
cream and yogurts. For such uses most strawberries are first processed into
frozen strawberries 2/ before being reprocessed by the end-use manufacturers.
1/ A U.S. Customs Service internal advice memorandum (139/80) in September 1980 discusses certain classification issues between "fresh," which is defined in headnote 1(a) to subpart B of part 9 of Schedule 1, and "otherwise prepared or preserved."
2/ Frozen strawberries, upon a petition from Chile, were under review for GSP eligibility in 1981 and became a GSP eligible article effective March 31, 1982.

3
Digest No. A102--Con.
Strawberry preserves (which comprised most of the imports under TSUS item
146.85 in recent years) are used largely as a spread in a manner similar to
jam, except that the preserves contain pieces of fruit.
Canned strawberries are used mostly in desserts by retail consumers; such
strawberries are not popular with end-use manufacturers, partly because the
cooked berries lack firmness. Aseptically-packed strawberries, a relatively
new product, are used largely in industries where sterile conditions are very
important, such as yogurt manufacturing.
U.S. customs treatment
Two customs classification decisions where articles have been found
classifiable under TSUS item 146.85 are of note for this review.
A Customs Court decision has held that strawberries processed and packed
in a manner which substantially retains the shape of the strawberry in its
natural condition is not a jam. 1/ Thus, strawberry preserves in which the
fruit remains largely whole or in visible pieces are classified for duty
purposes as otherwise prepared or preserved strawberries (currently TSUS item
146.85).
In a 1981 decision on a difference of opinion concerning strawberry
flavorbase, the U.S. Customs Service held that the inclusion of a modified
starch stabilizer and other ingredients with strawberries, so that the
viscosity was sufficient to suspend the fruit, did not remove the
classification of the flavorbase from the provision for otherwise prepared
1/ Goldfarb V. U.S., 55 Cust. Ct. 120 (1965).

4
Digest No. A102--Con.
or preserved strawberries 1/. This decision, in effect, reversed an earlier
classification ruling made in 1973 (T.D. 73-262(7) 7 Cust. B & Dec. 766(1973)).
U.S. producers
Processors of strawberries are located throughout the United States.
There are an estimated 29 firms with production of $100,000 or more that
produce strawberry preserves and jams. Frozen strawberries, which are
produced by about 80 U.S. firms, are produced predominately in California.
Canned strawberries are produced probably by not more than a dozen U.S. firms,
chiefly located in the Pacific Northwest. Information on the number of
producers of aseptically-packed strawberries is not available.
U.S. consumption and production
During 1978-82, U.S. consumption and production of the type of processed
strawberries that are dutiable under TSUS item 146.85 is estimated at 40
million pounds annually (table A-1).
During 1978-82, U.S. consumption of all processed strawberries increased
irregularly from 333 million pounds in 1978 to 412 million pounds in 1982, or
by 24 percent (table A-2). Nearly all of the consumption was comprised of
frozen strawberries processed by industrial users to manufacture end-use
products. During 1978-82, U.S. production of all processed strawberries
(converted from fresh weight to an estimated product-weight basis) increased
irregularly from 236 million pounds in 1978 to 381 million pounds in 1982, or
by 61 percent.
Of the consumption of all processed strawberries, it is estimated that
perhaps one-half are consumed as preserves or jams, one-quarter in desserts or

5
Digest No. A102--Con.
ice cream, from5 percent to 10 percent in yogurt, and the balance in
miscellaneous uses including a small percentage as canned strawberries.
U.S. exports
During 1978-82, U.S. exports of all processed strawberries (nearly all
frozen strawberries) are estimated to have ranged from 4 million to 10 million
pounds annually (table A-2). Exports of canned strawberries (the article
petitioned for) are believed to be negligible or nil.
U.S. imports
During 1978-82, U.S. imports of otherwise prepared or preserved
strawberries, under TSUS item 146.85, declined 38 percent from 954,000 pounds
in 1978 to 596,000 pounds in 1982, and based on January-June data for 1982 and
1983, imports are likely to decline further in 1983 (table W. Non-GSP
eligible countries were the principal suppliers in 1982. However, in recent
years when GSP eligible suppliers were in the market, such as Mexico in 1981
and Israel in 1980, they were the predominant suppliers, ' providing products of
comparable quality at unit values below the average unit value for all sources
(table C-1). For January-June 1983, GSP-eligible countries supplied 19
percent of the value of the imports.
During 1978-82, U.S. imports of otherwise prepared or preserved
strawberries under TSUS item 146.85 accounted for 1 percent of the average
annual imports of all processed strawberries. During that period, U.S.
imports of all processed strawberries declined from 106 million pounds in 1978
to 38 million pounds in 1982 (table A-2). The relative importance of the
different forms in which processed strawberries are imported is illustrated in

6
Digest No. A102--Con.
the following tabulation for the years 1978, 1980, and 1982, as compiled from
official statistics of the U.S. Department of Commerce:
(Quantity in millions of pounds)
U.S. imports Processed form of strawberries
1978 1980 1982
Frozen : 97.6 : 83.5 : 34.9 Pulp and paste : 6.5 : 4.3 : 1.4 Jams and jellies : 1.0 : 1.6 : 1.1 Otherwise prepared or preserved (item 146.85)--: 1.0 : .7 : .6
Total : 106.1 : 90.1 : 38.0
Nearly all of the U.S. imports of processed strawberries (mostly frozen
strawberries) are not covered under TSUS item 146.85 and are from suppliers
that are designated GSP beneficiary countries, mostly Mexico (tables C-2).
Imports of frozen strawberries, which are subject to a 14 percent ad valorem
rate of duty (the same rate applicable under TSUS item 146.85), became
eligible for duty-free entry under the GSP effective March 31, 1982, except
that Mexico was excluded from the benefits due to competitive need
limitations. However, Mexico was not a significant supplier of otherwise
prepared or preserved strawberries in 1982 and would not be excluded from GSP
benefits under competitive need limitations, should GSP treatment be granted
to TSUS item 146.85. U.S. imports of strawberry pulp and paste are subject to
a U.S. rate of duty of 15 percent ad valorem and are not GSP eligible;
virtually all imports are from Mexico. The rate of duty applicable to
strawberry jams and jellies is 3 percent ad valorem, and imports are eligible
for GSP treatment; in recent years nearly all imports have been from non-GSP
suppliers.

7
Digest No. A102--Con.
Position of interested parties
The petitioner for granting GSP treatment to canned strawberries was
Chile.
The Processing Strawberry Advisory Board of California (PSAB) opposes
Chile's petition to add canned strawberries, TSUS item 146.85, to the list of
articles eligible for GSP treatment. They assert that the high cost of
research and development of new strawberry varieties (which are then used by
foreign producers free of such costs) and-lower foreign prices put domestic
producers and processors of strawberries at a competitive disadvantage with
foreign producers. The PSAB also asserts that lower quality of the foreign
product disadvantages domestic consumers of both domestic and foreign-
produced processed strawberries.

8
Digest No. A102--Con.

9
Digest No. A102--Con.

10
Digest No. A102--Con.
* *

11
Digest No. A102 - -Con.
IV. Statistical Data
Table A-1.--Strawberries, otherwise prepared or preserved: 1/ U.S. production, exports of domestic merchandise, imports for consumption, and apparent consumption, 1978-82
(Quantity in thousand of pounds; value in thousands of dollars; unit value cents per pound)
Period •
: Produc- tion 2/
: : :
Exports . •
Apparent Ratio (percent)
: Imports : of imports to
consumption : consum
ption : .
Quantity
1978 : 40,000 : 3/ : 954 : 40,954 : 2 1979 : 40,000 : 3/ : 761 : 40,761 : 2 1980 : 40,000 : 3/ : 734 : 40,734 : 2 1981 : 40,000 : 3/ : 662 : 40,662 : 2 1982 40.000 : 3/ : 596 : 40.596 : 1
Value
1978 : 4/ : 3/ : 235 : - : 1979 : 4/ : 3/ : 230 : - : 1980 : 4/ : 3/ : 380 : - : 1981 : 4/ : 3/ : 347 : - : 1982 : 4/ : 3/ : 445 : - :
Unit value
: : : • . : 1978 : 4/ : 3/ : 25 : - : 1979 : 4/ : 3/ : 30 : - : 1980 : 4/ : 3/ : 52 : - : 1981 : 4/ : 3/ : 52 : - :: 1982 : 4/ : 3/ : 75 : - :
1/ TSUS item 146.85. 2/ Estimated. Chiefly strawberry preserves. 3/ Not available but believed to be negligible. 4/ Not available.
Source: Production and exports. estimated by staff of the U.S. International Trade Commission; imports, compiled from official statistics of the U.S. Department of Commerce.

12
Digest No. A102--Con.
Table A-2.--Strawberries, processed: 1/ U.S. production, exports of domestic merchandise, imports for consumption, and apparent consumption, 1978-82
(Quantity in thousand of pounds; value in thousands of dollars; unit value cents per pound)
Period • •
Produc- tion 2/
• Apparent :
:Exports 3/:Imports 4/ : cons
umption:
Ratio (percent) of imports to consumption
Quantity
: . . . . : 1978 : 236,000 : 9,535 : 106,063 : 332,500 : 32 ,
1979 : 263,000 : 5,159 : 120,974 : 378,800 : 32 1980 : 285,000 : 4,364 : 90,092 : 370,700 : 24 1981 : 265,000 : 6,561 : 65,744 : 324,200 : 20 1982 381.000 : 7.127 : 37.994 : 411.900 : 9
Value
1978 : 34,102 : 3,586 : 94,016 : 1979 57,745 : 2,443 : 111,450 : - : 1980 : 57,661 : 2,037 : 83,461 : - : 1981 : 57,858 : 3,957 : 58,437 : - : 1982 : 99.038 : 4.778 : 31.525 : - :
Unit value
1978 : 19 : 38 : 89 : - : 1979 : 29 : 47 : 92 : - : 1980 : 26 : 47 : 93 : - : 1981 : 28 : 60 : 89 : - : 1982 : 34 : 67 : 83 : - :
1/ Processed for all uses including frozen, canned, preserves, pulp, jelly, jam, and other uses.
2/ Fresh farm weight adjusted for estimated average weight gain (30 percent) in producing the processed products; values and unit values relate to the fresh farm weight. 3/ Frozen strawberries only. 4/ Chiefly frozen strawberries.
Source: Production, compiled from official statistics of the U.S. Department of Agriculture as noted; exports and imports, compiled from official statistics of the U.S. Department of Commerce.

• 2
14 •
N
•
7 0 aD
C.
C.1
0.
.0
Dd .41 101 42 1 1 CP IS 4. no
CI 411 VP 2%1111 411 CD N N
42 P. 12 ak 2. 40 2.12V0212/.. qm
MI DO 41 PC MC 1 f MO 11% 111
40 CD 2. UN 1 1 VD Of v. •
v.
Of 4' P. 2. 1 1 CD 01
•• •• ••
41 vit 2. 1 VP 1 1 40
•
Unit valu
e (per
poun
d)
the
U.S. Department of
Comm
erce.
0
U
41 4 w U. • W S W
I■1 o4.1 4
• TI
•
w
0 =
S Cl).
F. ... ►4
0 .12 .44 •
.n1 14 a.
o t111 U
S 0
1
•
" O 0
• Z
13
Digest No. A102--Con.
sd
•• •• •• OS
Oa OD OD MP
N 0
O 0
N 0
PS 0.
•
2 •
10 MD W CI CD 111 0 0*
121. WI 40 42 CD CO W 411 VW V% N
• mm 0% 111 40 W 41 01 01 N 4% N
P. CD CD CI OM PM 111 N .• N
*0 0000 01
•• •• •• DO ...... .
01010124.1111221 N I..
ea 40 04 40 12 40 CD 40
1 1 I 1 1 I
I I 1 I 1 I 1. ° 1 1 00 •
VI I dC 44 12 • • 44 44 a 4$ 4.
CC01144.44.0014, .4. 0C•44o401•
.410C.,4, 84.6.44 01.•2‘••.41
DO. u.causmols Pe 4.
I I s I II III I I
I • • 1:1 ■ A 40
CA • • -4 • ..I44 0 C c trap 00o. - • C ••■•• N o• MI *Po 0 C L. PI
O 1.•214•• O. If. CI g MI ■•
I I 1 1 I I 1 1 I I 0
1 al I I• •
• a oro • • 40 •
• C • WV DI 01 • 4 141 .4 • C.■ •••11."
0 1. • 2 1. •5.-1) :m a. u. cm um mm 0 Pe
0 A
Quantity (1,000 poun
ds)
•
O
O O

Perc
entage
a
O 0.
OP 00 DO
N
Quantit
y (1,
000 poun
ds)
04 0. 00 40
P► N
00
I 0 ma 1 I *r ■•■ N
P•• A l l l l I
1 M10 1 1 1 1 N 4
1 0 01 03 1 1 1 4.•
• 4.0 O
• • 0 • G. 14 44 • ••• 13 w • • 0
0 a. 0 10 4•3 114 4.1 011 N 0
a.
0
eD
14.1 4 wi W 4
• 100 4.% 0 to
4,1
•
g
▪
P Qa
▪
u.•
M 0 0 GI
• 0 41 0 01 04 lo
0. O 0
2 2 a .. m I
3 3
• o
E • o 0 .4041 td Z
••1 • Y 1R 0 0
.0
4 4
0
4.1
4.4
0
A
tad 0
•
14 Digest No. A102--Con.
O
• 4.1
4ID N
010010040 N
0 UPI 0 0 0 0 N
0 N0/ 000 10 N
0.a 0 0 00
N
O N O .0 0 0 14 •• O
GO O. OD Oa
• 4' O 40
• .4 111 • 40
44 *0
IL 4' 40 II
4' '0 • ••••
•0 40
• me •
111
•
•
e • 044•41012114
0 40 ••••
3 0 14 0 44.1 • C • •• O. 0 •••• • 44 k
.5 111 • .2 0 .2 •
a. •••• 0. • 04 IC 1.1 11.1
0 vs
0.
a)
Iw
= C. O
a rn
CU
at
0
S
Y. 0
SA ao .0 04
4.40 0
o cos g
.44 744
• 0 CA 2
• 2 0
0 -12 C
a, Id
Ol O.
rr O
F. o. 4)
o.
U)
3 10) 4)
0
•
41
Ir
.0
01 0.•
to
c.)
A 0
14
Value (1,000 doll
ars
)

Quantity (1,000
poun
ds)
Percentage
•
I. 0 a. a
6.1
00 OS 00 00
N
00 01. 00 , 00
00 00 00 00
O Co
00 OD 00 00
• 40 O
•
0 o.
26 deve
loped sti
les,
•
0 V to
•
Cn
•—■
7 O U 0. 0
• .61
00
•
00 4
TI
U
• •
al
▪
es
V at
0 • 7 0
0 " 1 M .4 he
al 1I1 u C
• Tti
.13
m- 40
0 0.
u
Table C-2.
--Straw
berrie
s, frozen
:
lç Digest No. A102--Con.
on
Valu
e (1.000 doll
ars
)
• •
1.1
26 deve
loped sti
les, to
ta
l
• a
00000100 41 14 Mf
0 0 .41 41 0 t• Oa i14
0
O 01.
V 0 ••• O 112••••• 0 ••• 4.• ••• • U Is I. I. •••• •••••sa
a, o. Ise tri 4.1 %A as
•
0 4'
• • 011•1
C 0 01•4 V .0 ••• sun••••• • —w000•-•• U U a. on
• 00.10.00 11.Ma.m1/11.0t.)7. 10 01
4'1•011•11 I 411 0 N P.
0
Gross imports
00
CD 0' sl 0 0 0 CD Ws P.
0. N
OW 0 0 0 0 0 •••
Al
▪ 00 0 00 0
N
•
0
• •
I. •••
C 0 C11.*
eV *0 I 1 I I I sa N
• I P. IS W P. I
P.
• I I I I I • I .0
N
•■ 111111 I N
•
0
1/ Le
ss than 0.
5 per
cent.
• • yU
O
• • 4.1 •
Comp
iled fr
om o
ffic
ia
l statistics o
f the U.S.
• U
0


Must
ard
, other than gro
und (p
repar
ed)
• •
•
•
4) •
a
a 4)
fQ
a 0
•
0
0
•
•
a 0
a.
• • •0
1
O •
4 • 2
.0 11 M
• • 04
•• •• •• •• ••
01 C0 •0 04 •S•
• 04
•
•
Ord
• • a
0 O. • it .10 44 O .4
a •• •• •• •• ••
a • a. a
• •
A• .44 a in i .4 • 00 •••• _,7 14 a• 40
• 1.6 > •
... 44 • 44 •
a
t4 • 44 0 a 03 •••• ...•
04 LI 0. 411 4.) W 0 ,-4 • • .4
O *I
tw 0 0 4.) SO
V 01 ■• • X ',0a • ce 441
N CA W0 r4 • 0 4.) 13 a• • • 0
• • to • 04 4.) • 04 • • 03 •••• .4 1., .4 a• 411 •
* r• L. .4 .44 •
4.1 ...■ Lo •
14 • ..♦ 0 •••• O m ••••• ..4
.41 .4
13 a
• 10 • •
44 .0 CA ....
441 44
%a
.. . . 0.
•• •• 40 • •• - •• • so • • a
ga o
4.1 le .... . 12
o v o co a a = 41
.• • er.
• • • • • • • D
escr
ipt
ion

2
Digest No. A103--Con.
II. Comments
Description and uses
Prepared mustard is a paste composed of a mixture of ground mustard seed
or mustard flour and sweetening agents, salt, vinegar, and other spices (often
including turmeric). Most of the mustard consumed in the United States is in
the form of prepared mustard.
Prepared mustard is a popular seasoning for meats (particularly sandwich
meats and hotdogs), meat dishes, and other prepared foods.
Producers
New York, California, and Wisconsin are the principal producing States
and contain over a third of the approximately 100 domestic producing
establishments. These firms vary widely in size and are distributed
throughout the country. However, a few large firms distributing nationally
advertised brands control a large share of the market.
U.S. consumption, production
During 1980-82, domestic consumption of prepared mustard is estimated to
have steadily trended upward from 450 million to 461 million pounds (table
A). Domestic producers supplied virtually all of domestic consumption. Trade
and industry sources indicate the steadily increasing consumption of prepared
mustard is related to population growth and the acquired taste for this
product as a complement to meat. Production of prepared mustard during
1978-82 is estimated to have increased steadily from 438 million pounds,
valued at $107 million, to 461 million pounds, valued at $171 million.

Digest No. A103--Con.
U.S. exports
During 1978-82, U.S. exports of ground or prepared mustard (separate data
for prepared mustard are not available) decreased irregularly from 3.3 million
pounds, valued at $1.3 million, to 3.1 million pounds, valued at $1.5 million
(table B). Japan was the chief market, accounting for 16 percent, by value,
of 1982 exports. Saudi Arabia, Greece, and Canada were also major markets,
accounting for 8, 7, and 7 percent, respectively.
U.S. imports
During 1980-82 (separate data for prepared mustard were not available
until 1980), U.S. imports of prepared mustard increased from 2.5 million
pounds, valued at $2.1 million, to 2.9 million pounds, valued at $2.4 million
(table C). France was the principal source of imports in 1982, accounting for
87 percent, by value, of total imports. Other suppliers of note were the
United Kingdom, West Germany, and Canada. In 1982, GSP-eligible countries
supplied 18,000 pounds of prepared mustard, valued at $15,000 (table D). Most
of the prepared mustard imported from France is considered to be a high
quality mustard because of the high standards used in the selection and
processing of seed. In general, prepared mustard from European suppliers is
considered by some to be a specialty or gourmet product and often commands a
premium price over the domestic article.
Position of interested parties
The petition for granting GSP treatment to prepared mustard was presented
by the Government of Peru (FOPEX). There were no representations presented by
interested parties during the investigation.

4
Digest A103--(

Digest No. A103--Con.
Table A.--Prepared mustard: U.S. production, foreign trade, and consumption, 1978-82, January-June 1982 and January-June 1983
(Quantity in millions of pounds; value in. millions of dollars; unit value per pound)
: :
Period
• .
Production : Exports 2/ 1/
: : : : • Imports . • . : .
Consumption •
-:
Ratio (per- cent) of imports to consumption
• Quantity
1978 : 437.8 : 3.3 : 3/ : - 1979 : 443.7 : 3.3 : 3/ : - r - 1980 : 449.7 : 2.7 : 2.5 : 449.5 : .6 1981 : 455.6 : 3.4 : 2.5 : 454.7 : .5 1982 : 460.7 : 3.1 : 2.9 : 460.5 : .6 January-June : : : :
1982 : 3/ : 1.7 : 1.3 : - : 1983 : 3/ : 1.6 : 1.6 : - :
Value
1978 : 106.6 : 1.3 : 3/ : - : 1979 : 119.4 : 1.2 : 3/ : - : 1980 : 133.7 : 1.3 : 2.1 : - : 1981 : 149.7 : 1.5 : 2.2 : - : 1982 : 170.6 : 1.5 : 2.4 : - :
'January-June : : : : 1982 : 3/ : .8 : 1.2 : - : 1983 ; 3/ : .7 : 1.3 :
Unit value
1978 : $0.24 : $0.38 : 3/ : - : 1979 : .27 : .36 : 3/ : •- : 1980 : .30 : .50 : $0.84 : - : 1981 : .33.: .45 : .88 : - : 1982 : .37 : .48 : .84 : - : January-June : : : :
1982 : 3/ : .49 : .92 : - : 1983 : 3/ : .42 : .83 : - :
1/ Estimated from the reported quantity and value of prepared mustard as reported by the U.S. Department of Commerce in 1977 Census of Manufactures-Industry Series. Quantity has been converted from gallons to pounds through a conversion factor of 8.5 pounds per 1 gallon of prepared mustard. .
2/ Includes ground and prepared mustard. 3/ Not available.
Source: Compiled from official statistics of the U.S. Department of Commerce, except as noted.

Digest A103--0 6
00
00
00
00
00 06
N•MN0W000 MANA4 P.N .• PA
4.44
00 00 06 60 00 00 60 *0
C%1 CP% W %a 0% (4) %)) NMA•MIAMM
4•.4 44.4 •
00 00 SO 00 00 00
0000•0NWINOMN 01.1.01M%
00 06 00 00 SO 00
0701..04000%truot P.NOWI. WM go. ."" M
.. 00 00 00 00 00 00 00 00
00...0010M0100 1.C%10000NI■N
v"M
• 010010NMNO ."01ANIM M .
ON •
00 00 No 00 00 00 00 00 00
00)11e1MMWO M0N0I0 .OM 0.■
00 00 00 00 V* 00 00 60 00
0
•441 0 V
O 0 O
0 2
00 0•
WM0001■ 1Ww• WMWMI%
00 00 00 00 00 00 00 *6 00 • •
ONN04•C04 .040 M.01^.O IA IA-"N ICI
0* 06 00 00 00 60 00 00
N00 MNW %).”0■ 00.0111
00 00 00 00 06 00 Of 00
N101,..010010 NN
M r-
SO 00 00 0* 00 00 00 00
POI 040
*0 06 00 00 00 00 00 00 00
OIMNM04 400.1 NNMNO• M polv■
•• •• •• •• •• • • 00 •• 60 ••
tri gy 414 WN
00 Oe • so 00 06 OD
• •
• •
00
• •
6104
• 6
00 00
1 I
III III
188411111 ttttt 1111
I
I III 11..11111 I. I t I. •-■ I I 10 tttttt ISM 1 • ALW . 11 I 44,41 I .0 4' .4
.004A111VW0 .004.01V...WO C4W01111.1001■ ciumgs.-mo> 46.410000WCC MLOMOWCC < asoc...m-0-4 essoc-im-v... A l •••• a t a a6 as • as -...
.004.0111V.0.W0 cmumEs•mol-mt.also•cc oolccoc-im-m.4 •
Compiled fr
om off
icia
l sta
tistic
s of the U.
S. De
partment of Commerce.
00
0 t;
3 O
N 0 1 00
0 4,
E 0 0%
OV 00 00 0.
0
-1; .0
0 a- X 0
•
00 00 00 00
24
00 06 00 00
110
02%
13
(1,00
0 pou
nds
)
>4 40
4, C A 3
1%.w•MNWIP..1%. 0,10NNO% WM . . . . . . 000oN 00
%■ 01440 ,0 4, 1%0N M W1∎ W IMWO N *0'
• 00***** • 00000000
.. oo 00 aro 60 op 00 oo 66 se the 60
10,00044114M0 0 101W1..Nr.WON
• • • • • • • • •
00000000
e1.0111WIMM M WWP.N.0 W ¶'-: •
0 0 0 0 0 40 0 0
00 00 00 00 00 00 60 00 00 00 00 00
q%.0/..0%0NON WWNOMN011101. ........ 0000000o 0 to
Of 00 60 OS 00 00 00 00 00 00 Of 06
NNOWSOMN001 Pei VP •0 •••• vi .......
0000000 04
00 00 00 00 00 00 00 00 0* 66 00 ••
Ng) N CNI OOP% 1..0.4 0 MAIIIM1•040111 M
• • • k • • • • •
***00.. **
O
00 00 00 00 00 OD 00 00 00 00 NI 00
Unit
valu
e (p
er pou
nd)
0
41* IA
O
O

CO
N .0 I (1000Na0 N
00 .2'
N
•• 0• 00 00 00 .0
• •
N
Value (1
,000 do
llars
)
••
• •
1
ogiosoc, N
N ••••
•• •• •• •• •• •• •• •• •• ••
•• •• •• •• •• •• •• •• •• ••
NNON4)W01)101 .0
• •
1O•
•• •• •• •• •• •• •• •• •• ••
..1910.0NNOMN 00“-tO • NNM
•• •• •• •• •• •• •• •• •• ••
11 11 11111
00 OS 0. 00 00
I 11111111
.7
4. ..0•006011M NO•"NN.-
00 00 00
40000•004•NNI.1
•• •• ••• •• •• •• •• •• •• ••
N00.'0000NNW
• NN"-
•■•
•• •• •• •• •• •• •• •• •• ••
N
• •
••
•S00MVCONION0
• N." •••
• •
•• •• 00 00 •• •• •• •• •• ••
.0 0. CN1 1 dN tel N N sr N •
•• •• •• •• •• •• •• •• •• ••
I I I I I I I I I
•• •• •• 0 • •• •• •• •• •• ••
11 1 I 1 1 1 1 1
VNNIA0041'1.., M NNO•Nd • • • • • • •
000NMO 4/),
00 00 00 SO 00 OS 00
.000 0 4)00N O■ N V1110.0•01".0 ■' O.
• • • • • • • •
4,0
•• • • •• •• •• •• •• •• 1170 •40 • •
0.1.00dN.00 N. 00 CO 1t1 CS1 1.. 0
• • • • • • • • • 0 0 0" PF, .r• ...•• 40
•• •• •• •• •• •• •• •• •• •• •• ••
40."0•VNV W
. . . . . •
•• •• •• •• •• •• •• •• •• •• •• ••
^tOWNLI1N100 0•NOMO•O• M V • • • • • • •
00..0N0
1111111.111
•• •• •• •• •• •• •• •• •• •• •• ••
1111111111
• O
O
O
. .
• •
1
per pound)
Unit
valu
e
Departm
ent of Commerc
e.
N
10 N.
00
al U
7 0 O
A a U
O.
.0
N 00 tr•
1
C
C
N
C O U
O 0
Sam.
4.1 a E 7
4,
0 a
'0 • C L
a.
L L am
-o c c m I.
o L."0 • c
re
re
-14 110
0I LO V 4.PC r. O D
'0 L L MM ..1J2
• rn .0 A
Digest
A103--Con.
(1,000 pounds
)
•• •• •• •• •• 00 •• 00 00 •• •• •• •• •• •• •• • • • • • • •• • • • • • •• •• •• •• •• •• •• •• •• •• •• •• OS 00 ••
I II II I I I I II II I 1 L. I I 0 (II
C MC .C.6,
OL
•
A MMC400
C.-OMM.C715 MU 00.4+00.-1 L LMM0
I 11 1 1 - I II II I 11 1 1 I I I I I I 11 11 1 II 10 11 I 1....4 I II Lel . II OM 1 11 O M E mc = 4J E MC .CL
MOIL me -o no c•60 o OOLM 124C400
OCOMC.4.-..00).' OCOMC.1..00>
C..-OMM.C7M C..0 M AL DM
MY C a.pc, 0.4 AY • C 0.4+0 111.4 t • AO AO al 7 ...■•

8
•• 00
4+ O
developed ctries,
-oss imports
Oa. •• •• •• •• •• •• •• •• • • 60 00 ••
4. 0
ca4+ a. 0 40
-CI C .4 C 0 IV Cle S IV U C
214 C '0 X 0 41.0
0.00 111 C I A- •C 0.roul-H4E•st-o
0 4'
0
40 C 3 0
S .G
••■•• cgINI
00 60 •• •• •• •• •• • • 6. OS •• .0 00
▪ 1.0 ICDO .• • 0 00
•• •• •• 00 WO • • •• •• •• • • • 00 00 • • •• • •
(1,000 do
llars
)
111111 I II
N I
•• •• 00 •• 00 00 •• •• 06 •• •• •• • • • • ••
M •t• I I I I WS 1. tr)
14.
•• • • •• ••• • • •• •• •• • • •• •• •• •• •• •• 00 00 60
.42 N ••• ••• 1 1 1 PM -
•
•• •• 60 •• •• •• •• •• •• 00 •• 00 06 ••
•••
•• •• • • • • •• •• •• •• •• •• 60 00 00 •• •• 00
i11111111111.' •-• •••
•• •• •• •• •• oo •• •• •• •• •• •• •• ••
••
01. CI
4+ C.
S. 0.
00 •
1 0 40
O 0. E
N ‘4)
1,000 pounds
)
•• •• •• ••
4,
C to 2
•• •• OOP • •
O 00
•• •• OP • •
r-
▪
I I
•• •• es •• •• ••
N 0 to) 0.- 0 0 M I
•• •• . •• •• • • *0 66 •• • • ••
0 •,co•-• ca N
• • •• • • • • • • •• •• •• • • •• •• •• •• •• • •
•0rsOk000000.- 0.0
•• •• •• • • •• •• 00 00 •• •• •• •• •• •• •• •• ••
•• 00
195s
imports
1 1 1 1 1 1 1 1 1 1
•• •• •• 00 •• •• •• 60 HD ••
O 4+
O O
C C• 040
.4 0 -P C0 30410001111UC.41. 0 lie C
L. WU X 0.54 0.0 0 0 c
o.Soac1-op4E.s ►-o
••
4' O 4'
O
4,
S 0. O
O
O S
A103--
4
. c
C
statistiec of the
Comniled from offinia
l
imports by cer
tain world areas in
cluding desig
nate
d GSP
N • pp,
= 00
13 0 • C L
", 0. a
0.c
13 -) C 3 0 L-0 01C
C N
=40 40 1
01 01 -C -. 40 0
a
oem A. L 41 4+ -P C 41 2 • 0
E U 1 1 •
0
0
A
p-Toluenesu
lfonyl chlorid
e
TSUS(A) item numbe
r; descrip
tio
n; tariff ra
te in
form
atio
n; U.S.
impor
ts in
19
82; com
petit
ive sta
tus
O
ml
0 0
4*
K +
d—I o
Os
Vt
00
we
qt
0
ve
Ire
0
1
r.
It
c•I
+'k
4* *
d-I
'0
Le 0
100
0 414 .-1
O e C
0
a.
0
O 4r
co o.
1/1 CO O•
•cr
et,
m 00
CO CP,
• 198
0 2/ :
1981
• V% J w OR N
C.) •
• '0 •••■ O 0 0 r. 14 y.0 O.
0
00
o. 0
•
I Lo
.0 +.)
0 LI * 01 .0 .0 .0 40
•••••• C./ 0 a 0 Yr
•
Le Law0 0
rwl 0 0% 0 >
7 '0 '0 9 0 O Li
%A 4/
00 0 .1.)
O 10 0
4)
•
IA O 0 0
La 04
• L
▪
. 0 H O 0
1.1 O 0)
00 4)
C0
U
Descrip
tio
n
H

Digest No. A401--Con.
Also, the major foreign producers are more competitive in world markets
because of their generally lower prices compared with the U.S. product.
U.S. imports
During 1978-82, U.S. imports of p-toluenesulfonyl chloride increased from
279,000 pounds to 1.1 million pounds (table 8). The principal sources of this
chemical during this period were Japan and the Netherlands. During
January-June 1983, imports of this chemical amounted to 894,000 pounds, an
increase of 50 percent compared with imports in the corresponding period in
1982. Small amounts of this chemical were imported from India, a GSP-
beneficiary country, beginning in 1981 through the first 6 months of 1983.
The Republic of Korea, another GSP-beneficiary country, also began exporting
small amounts of this chemical to the United States in 1982 (table C).
There is no difference in quality between the domestic and the imported
chemicals; pure grades of this chemical can be obtained from both sources. A
-determining factor to suppliers, consequently, is the cost of the chemical.
In 1982, the unit value of the imported chemical was $1.00 per pound as
Compared with approximately $1.50 per pound for the domestic chemical.
Postion of interested parties
The Government of the Republic of Korea is the petitioner requesting GSP
status for p-toluenesulfonyl chloride (item 403.05). The granting of GSP
status will enable Korea to be more competitive with other major exporters of
this chemical (e.g., Japan) to the U.S. market; according to the petitioner,
it will also benefit the domestic consumers by providing more competitive
prices. No submissions were received from other interested parties.

4
Digest No. A401--Con.
* *

5
Digest No. A401--Con.

6
Digest No. A.401- Con.
Table A.--p-Toluenesulfonyl chloride: U.S. production, foreign trade, apparent consumption, and ratio of imports to consumption
(Quantity in thousands of pounds; value in thousands of dollars; unit value per pound)
Period : Production : :
Exports : :
Imports : Apparent : consumption . : •
Ratio (percent) of imports to consumption
Quantity
1978 : *** : 1/ : 279 : *** : *** 1979-------: *** : 1/ : 642 : *** : ***
1980 : *** : 1/ : 871 : *** : ***
1981 : *** : 1/ : 950 : *** : *** 1982------- -: *** : 1/ : 1,056 : *** : *** Jan.-June: : :
1982- ---- -: 2/ : 1/ : 597 : - : 1983-----: 2/ : 1/ : 894 : - :
Value
1978 : *** : 1/ : 250 : *** : *** 1979 : *** : 1/ : 814 : *** : *** 1980--- : *** : 1/ : 1,263 : *** : *** 1981 : *** : 1/ : 908 : *** : ***
1982-.- : *** : 1/ : 1,051 : *** : ***
Jan.-June: : : : : 1982 : 2/ : 1/ : 597 : - : - 1983 : 2/ : 1/ : 712 : - : -
Unit value
1978 : *** : - : $0.90 : - : 1979 : *** : - : 1.27 : - : 1980- : *** : - : 1.45 : - : 1981 : *** : - : .96 : - : 1982 : *** : - : 1.00 : - : Jan.-June: : : : :
1982 : 2/ : - : 1.00 : - : 1983 : 2/ : - : .80 : :
1/ Negligible. 2/ Not available.
Source: U.S. production, U.S. International Trade Commission, Synthetic Organic Chemicals, United States Production and Sales, annual reports, 1978-82.

0. NT cc CV CD CD 0 CD 0 Ch M r4 s■
•• •• •• •• •• •• •• •• •• ••
0 0 n .3• 0 0 o 0 o In cr•
• 1.1.1
•• •• •• •• •• •• •• •• •• ••
..7• Os 0 J o 0 0 0 0 Ln M V2
•• 0* •• •• • • •• •• 00 •
CN CN 0 0 CD CD CD Vr V2 NV
•• •• •• •• •• •• •• •• ••
N. sr 00 00 \ 0 P-. •••I
0. co
••
0.
O
0.
••
••• oh
••0 CP NI •-• 1•1 I I I I tO •••
• • •• • • •• •• •• •• • •
CI in •." CO 11111 03 ,13 N.) ni
co 0.h 0 1 I I I 1 O n M cs, an sr
Os 10 kr1 I I I M.- J
•• "
r-• .r
• •
.•
vs 0 C
••
0 Ph 40 h MIMI o N. No 43 co
• • • • • 0 CD CD CD 0 0.
0.44,05O. IIII 0 CO •0 • • • • . •
0 0 Is.
NJ cr. 01111 I 10 .- 0 •o
• • • • gr. 0 0 I". ot,
•• •• •• •• •• •• ••
co ..r Lri I I 1 as CN 42 0 CD
• • • • • 0 0 0 0
In
or-.1 I I iccI prs If1 M
• .
C2
•• ••
CD CD
•••
•• ••
•
••
• , 0.
.r
a) U L.
0
0
C
O.
0 • ce• 10 .c
0.
0 1.1.• A ti
0
O O U
•• O • • •• •• •• •• •• •• •• •• ••
00000.0 \ 0 CO Is I I Ire-\ I .- C2 I I I N C• I I IN NI CP. ru N1
••••I ru
fo N M N4 .2* • • • •
NJ
NT •
C
N 4,
U
, ••• •• .
WI 0 Ps ID .■ C2 CD ND N. Pel 111 •0 I Os I I .4) ••• in In /41 I rn I I 0 4' 0 Ne N 0`• •••• 00.0. Os Os Os
• • •
000 0 0.t 0 0
• 0 'CI 0 in -I
C C. . 10 E
I I I I 1 I 1 I I I I I I I I I I I .0 0 I 1 1 I I I I I I I I I 1 I I 1 I I I I I I i I I I I I I I I I I I I II i I I I L.+ i I I I L. .1 I I I I 1. 01 In •• I I I I II 0 i I I I V 1 I I I I W al N W 0 0. E a .0 •I•• IA 0a ■ t 4+ IA 0. 1 1 .0 I. U 0 Si 2 01 1. 4., 0 .0 W 2 01 L. 0.• 0 0 w 2 01 L. 44 lb L .-1 C00e-Ce>.01- ..4 C • i• ..... c • ).• • 1.• .-4 C al ec - C al 3. O> •C 10 - 01-- Cb 4-4 •C • •..• a% .. CD .4 • C 1 - al- CO •-■ .4e N. 0 0J 0.0 L. .-4 be w .-4 4, 0.0 L. 4-1 he 1 •# 44 O. 0 L -4 be 1 .-• 0.1 WWCOW L.+0 .-I 01000• 11.44 -1 'UNCOIL L4, -4 Z -, •-1 be co = cc. •-■ •10 Z -A 4-4 be CO = IL. OI .t Z -3 ► 1 be 03 = U. P.4 at
C . 0
C 0
N.1 0
0
0 9-
0. L. I .- 0
-C u
C
0 00
L. 0. 0 0.
U • • • • •• ••
•• •• •• ••
• • •• •• ••
(1
,0
00 p
ou
nd
s)
b. 44
C
Or
.
Digest No. 7
A401--Con.

Dep
ar
tmen
t o
f C
om
merce.
O
U
UI
U
0
VI 01
E 0
•• al U L.
0
Digest No. 8
A4 01 --Con .
CO
01
44
0 U
0 CO
0
44 CO C 01
01 V
Col CO 0,
01 c 3
I
> L. 2 D C
0 ••-•
01 .1./ CD 3
.1-■ .0 C..- 01 L.
L. IA W • ■•• 0- 'ID
IA 44
0 D. E
O O
co
10 rn cr.
CS1
• • • •
ern .0
N \
•/-1
•• • • ••
O CSI
0 sy.
•• • • • • • • • •
n va
• • •
go-
in
•
\
Pet •••
co cv
01 O C
'0 CO oft.
U C
C 3
IA 4.
0. CO
o■i
ID 01
0 13
• • • • 0 • • • •
O ••■ P 0.• 0 0 0 CP. Os I CO O
••• O O O
-I 0
0 (11. 44 3
44 01 C 3
C
CO 3
•-• co
L. • • • • • • • • • • • • • • • • • •
U 0 0 0 0 I I
.0 O 1:1:1 Cis
4. 0 0. E
• tfl
• • • • • • • • • • • • • • • • • • • • • • • • • • • • • •• • • • •
0 0 0 I I •3'
01 P •
L. 0
.0 CO U
0-1 • • • • • • • • • • • • • • • • • • •• • • • • • • •• • • • • • • .• •• ••
.1 • • •• • • •• • • • • • Ds III C C co
•Li
0 01 61. -) 0 0
44 1
VI .11
01 C IA ID IA ID • C GI 01 +I In 0 0/ ", 3
0 E
0 0 4.1
• 0 0I11
Cc E. 10 I C a. 01
01 44
VI .1.1
1. '0 01 4+ '0 07
G. 00
00 W .0 .0 4+
0 0. II. 0 O. 4. O. 0 .1.1 O. 0. 0 41 O. W
• E •■• C C 10 2 U Si • OC .- al 2 W CS W Si
> 0 > 0 J 101 W U V 1. L N W LI '0 L. L.
.0 In o
9 C C O. ►-I id
01 .0
III '0 CO 01 0 0. LIC
\ \
CO L • 1 In L. •0 11) I- CO N CO 0 CO N CO

'0 • 0 • N N C) C) • •••■
0 0 C1 •0 •0 ••.. O 0 e.. • t.. 0. O. C
0
O CM • 4• 00 0
40.0 • 0 1.• 0
• 0.
•••••
es 10
OS
P
▪
:
O r.
g • + r •
0.1 e N 0 ”.1
10
1.4
OD O■
co
10
10
•
1980
2/ :
19
81
•
• •41 •••••
N trt • 1.•
CSI • N
40 0 1•••
1.4
• • •
Benzo
ic acid
Benzoic acid
TSUS item numbe
r; de
scr
ipti
on; ta
riff ra
te informa
tion
; U.S.
im
por
ts in
198
2; com
petit
ive sta
tus
00
1.4
0
0 0. 01 I O I • r•I
.0 • C
at PI
0 E N. • 4.) 40 O 1.3 4 ▪ • 4 16.1 11.
144 0
C 4>i0
.0 0
▪
▪
.0 • '0 • • 0
4... 41 SA 0 .0
C 0
.1.) • V 4 • C 1.4 O U
1.1 44
1.. • 0
• .0 0
60 Ol
.0 CV
Descr
iptio
n
4. IA Id •
411. • 0. of CV 40 1.4
4. 0
4. 0 •••
0 03 0• • • 1.4 0
ao -P
••4 0
A 1C
1.3
•
01 04 ,1 0
O 0 1.2
ted Sr 4 0 0 • .0
.0 0 la 10 0. 4 0
• el >
...■
.0 f.) 0 0 '0 44 Os • 4.1 44 A)
• 0 •••• .0 .0 .0 4 Od OS he
• •••• .4 NI MI
Inte
rnatio
nal Trad
e Commission.

2
Digest No.
A402--Con.
II. Comments
Description and uses
Benzoic acid is a synthetic organic chemical derived principally from
toluene. This chemical is used primarily as a broad-based intermediate in the
manufacture of plasticizers, resins, dyes, drugs, flavors, and perfumes. It
is also used as a food additive and in the production of phenol. This
chemical is available in two grades, technical and pharmaceutical (U.S.P).
Only the technical-grade benzoic acid is included in this digest, as the
pharmaceutical-grade benzoic acid is classified in TSUS item 410.56. The
major use of benzoic acid, excluding its use to produce phenol, is in the
production of glycol dibenzoate plasticizers which are used as stabilizers in
vinyl resins. Benzoic acid is also used in the production of sodium benzoate,
a food preservative, and of benzoyl chloride, an initiator and curing agent in
the production of polymers (i.e., plastics).
U.S. producers and employment
During 1978-82, there were four domestic producers of technical-grade
benzoic acid. These four producers operate five plants with a total annual
capacity of approximately 160 million pounds, excluding the amount used to
produce phenol. Employment data for the chemical are not available, as
workers in these plants are usually engaged in the production of more than one
chemical.

Digest No. A402- Con.
U.S. consumption and production
During 1978-82, U.S. consumption of benzoic acid decreased from 85
million pounds to 62 million pounds, or by 28 percent (table A). Except for a
slight rise in 1981 because of increased consumer demand following an economic
downturn, the general trend has been downward since 1978.
Domestic production of benzoic acid during this period also decreased
from 85 million pounds in 1978 to 62 million pounds in 1982, or by 28 percent
(table A). During this period, yearly changes in production were similar to
the domestic consumption changes for the reason stated earlier; domestic
production and consumption were approximately the same for each year during
this period.
U.S. exports
During 1978-82, U.S. exports of benzoic acid were negligible. Industry
sources estimate that exports ranged from 1 to 3 percent of domestic
production during this period, mainly to Canada.
U.S. imports
U.S. imports of benzoic acid during 1978-82 increased from 7,000 pounds
to 441,000 pounds (table B). The large increase in 1982 was due to imports
from Canada and Japan. This trend continued in the first 6 months of 1983, as
imports continued to increase compared with a corresponding period in 1982,
from 141,000 pounds to 617,000 pounds, principally from Japan and Canada.
Imports from Japan are believed to be the higher grade, while those from
Canada are the technical grade as evidenced by their values in 1982

4
Digest No. A402- Con.
($7.89 per pound from Japan vs. $0.22 per pound from Canada). In 1982 and
January-June 1983, there were small quantities' of imports of this chemical
from Romania, an eligible GSP-beneficiary country (table C). Despite an
increase in imports during 1978-82, the imports-to-consumption ratio, by
quantity, remained at less than 1 percent.
Postion of interested parties
The Government of Colombia is the petitioner requesting GSP status for
benzoic acid (item 404.04). That Government believes its exports of this
chemical under GSP would have little adverse impact on the U.S. producers
while providing an incentive to the development of the Colombian economy.
No submissions were received from U.S. producers.

5
Digest No. A402--Con.

6
Digest No. A402--Con.

7
Digest No. A402--Con.
Table A.--Benzoic acid: U.S. production, exports of domestic merchandise, imports for consumption, and apparent consumption, 1978-82, January-June 1982, and January-June 1983
(Quantity in thousands of pounds, value in thousands of dollars: unit value in cents per pound)
Year Produc- tion
: : Exports : Imports consumpti on
Apparen t :
Ratio (percent) Ratio of imports to
consumption
Quantity
: • . : 1978-- : 85,175 : 1/ 7 : 85,168 : 0.01 1979 : 77,043 : 1/ 21 : 77,022 : .03 1980 : 73,414 : 1/ 17 : 73,397 : .02 1981 --: 78,547 : 1/ 225 : 78,322 : .3 1982 : 62,115 : 1/ 441 : 61,674 : .7 Jan.-June--: :
1982----- - : 2/ : 1/ 141 : 2/ : 1983-----: 2/ : 1/ 617 : 2/ :
Value
1978 20,440 : 1/ 2 : 20,438 : .01 1979-------: 24,650 : 1/ 58 : 24,592 : .2 1980- : 29,370 : 1/ 30 : 29,340 : .1 1981 : 35,350 : 1/ 1,098 : 34,252 : 3.2 1982--- : 27,330 : 1/ 880 : 26,450 : 3.3 Jan.-June : : :
1982 : 2/ : 1/ 800 : 2/ : 1983 : 2/ : 1/ 265 : 2/ :
Unit value
1978 : $0.24 : - : $0.25 : - : 1979 : .32 : : 2.79 : - : 1980-- : .40 : - : 1.77 : - : 1981 : .45 : - : 4.87 : - : 1982 : .44 : : 1.99 : - : Jan.-June : : :
1982 : - : - : 5.69 : - : 1983 : - : - : .43 : - :
1/ Negligible. 2/ Not available.
Source: U.S. production, compiled from U.S. International Trade Commission, Synthetic Organic Chemicals, United States Production and Sales, annual reports 1978, 1979, 1980, 1981, and 1982.

O. .0
N
O.
N O
5.?
N O I I I Ps o I I I Low' • •
- po PP
N
N
0000N0000
•• •• •• •• •• •• •• ••
•• • • • • •• •• •• •• •• •• •• ••
nu= 46.7004 U m<LL7004 UM44.7M04
••
O
• •
N000‘\000
C 0 0
C.
C C O
8
CD011-1111111
•• •• 00 . •• •• so
COP. N
O. Pr ul r. i I I
I I I
O
c0111ev".III N
0 O
▪ .111Imm *SI C. AM P.
• • • LM P.00 O M N 0
•• •• •• 100 •• •• •• •• • • •• .
MI0311100 P.
O
•• 00 0/
In •••.' •• C
7•.1
N C
•• •• •• •• •• •• Oe •• •• •• •• • •
a. SM000..0\0 •4 .4
I/ Less than 500.
L.
O
•
0
C
=
0
CL
January-June 1982, and
••
In N
•• •• •• •• •• •• • • •• •• • •
•• •• •• •• •• •• •• •• ••
Digest No. A402--Con.
oN ao 04 • N0
• .1* 10111111
• • • 0110
.11)
WO
. .
mcv00 N 10 1 11 CON M000
• • • • • • P.000..0
p. 1 1 1 w cv 1 I 1 CI
• •
O
•• •• •• Oe •• •• •• •• •• ••
4P.M.T00000 N0, 1
•• •• 00 •• •• SO ••
CD 0 0 0 CD 0 0 CD 4'
•• Oa •• ON •• •• ••
04- 1.-N\00 00J.- 4-1
.0000».\00
N
I I I IP.I I I.-
I I I I I I I I I I I 1 I I I 1 I 1 I I I 1 I I
I I I I 1 I I I I I W I I I I 6.4 ILm I I I I L M I I I I WM Itige I I I 1 W OWE MME M.C40 M W E M .0 L
0•• L. 0 01....60C*4.40 CMCL0C01401,- CUWCWNOW C MCLWCWN00 al 0 04, 0—V.e.. M M 01400..124, m0.1, 0 ,"V40 4 MCE0 MC EN WW•■■•• o. CEm WW—•-• 0 0 o 2 L 3 M oou 33-4 MO=1. 33.4
C O
.10
E
C O
1.
m-
L. 0 C. E
O
O
O 0.6
••
O
00 NI 00 04 00 00
N aO
N O
••
C' ,•°"
• O
O
0
0
E .I.•
a
• 111 • 7
0
IN 0
40
U
0
0
V 0 -I
a 0 U
0
D 0 0

9
a
a
U L.
03 61 0.
In 1
1/1
1. L 0 a o. • E C o•a a
In I st
C a
0 C a
03
C
0 U
ca
-12
a C O1
a a
C
• 0
U C
a a a
O
0 3
C — 0
a U
a
0 0.
V)
•• '0
U a ••••,
00 U Cis
O 14 11/ C C 6/
123
a
.0 a
1..
• • • • •• • • • •
1.4
a
C
O a.
a 4. a
0 •0 O O O
a a
a
0 0
O 0 0
Department of Commerce.
I I I
• • • • • • • - • ••
0 00 In
a .c
O
a U
. ■
a
• • • • •• • • • • • •
I 00
a
a
•• • • ••
a U
4, 44. C 0 a
• 0
0.
a
O
a
0
in 0 Si • 0
0 In •-•
C C E
.0 .0 0 -la r U
▪ a th IA 0
U L D
s's \ 0 in
a
O
a IC
C O 0 U
0. M
a •■• 0
a a
4., a C — D C 10
• 0 10 .■
• E 0 C
O. cg •••■
a
C (0 •-
E 0 C De i-t
26 developed ctries.
26 developed ctries.
Gross imports
Gross
imports
Digest No. A402--Con.


WI co s..
al al -al tri
•• •••••• •• •••• •• •••• -• ••••
WI al al al
•••.
al al al
0
en
'U 4) 4) 01 0)
0 4.) • 0 $4
04 44 1:1 0 44 44 0 f O 0 4.1
o to 0 E u • • .4
4.) +I 4.1 • O 0 ■ xi DS 01 id I-I
•••• ••••. .-ol al ml al
•-
0
4)
O 4t.
4)
0.1
14
O 0
U
• LA 4) .0 C.)
CO•0
C .4 L.,
• ,e al U e O e
a. E
.4) 4).4 .o de a os
CO
....
I-4 . 3 (-1 1.4 I-1 1-1
"0 • an 4) 4) Ca 1.1 U • .5. 7 7 VI M O 0 C Le Le
. e O
01 N •••■ • +3 00 0
0) 4 0, 0 • 0.1 0
• 0. a1-4
01 01 0) 4) 4) 0 0
)4 04
ml o * * .ko 44 4: .14 G 44 44 •4 44
+g +0■1 g 1e1 in an 44
V 40 10
•
00
o 4.) CO
U
a. • I O I ul • 1-4 CO
.0 • 4.1
▪ 1.2
at
•
4) 14 .0 at E> 0CO .0 0 •••• Os in Le 41 44 r-e
O C.) 0 • r-I D• 0 44 4
•••• > w 0 81)
• 4 o C CO 4.1 of a. 0 0.
• 4./ 0
•
le C 'a 0
O 4) 14 U C.) 44 0
La 0 4.)
N • •• C N
41 d CO CO cr• 44 0 v-1
60 0 C 4 ■-.1
C 0 U 0 .4 +.
4, V3 • 0 • 14 e-4 I. 0
E
▪ •
0 oo
to • 0 •
to c.) 4.)
. .
1980 2/ : 1981
•
IP0 • • 1(1 a l .01 'WI rd
e-e
O
▪
• )-I al al al
• + o re
• ▪ ■•••• in 41) •-■ • al al 0
CO O +
•• •• .• •• •• •••• •• •••• •• ••••
K CO 44 5.. .5 5.
• 7) CP. 01 al al •
o+
ft
rsit Vs
▪ 1-1 7. • 40 VD 410 ,10 111. M 0• n 1.4
• + v g+1 1.4 r-I + + e-I +
as .0 4i i O 0 4' 6 .4
0 N •
Le • 41 C CD
4-) Le 0 0
I 0) M .0 .44
41.•• d 5 N 0 0
N 0 0
CL C 01.1 I 0 Os 1+1
• C 0 .0 03
U.... 4) 0 >..1 a MN A 0 0 M
O C) ft 0 0 - 4
N I 0 0
01 0
C`o •••••• N
1 1 CV N
•• •• ••••
• • 4) 4.) 0. a O.
0 0 0 0 0 0
.0 O 0 0 0
4' 4' 4
i
Description

2
Digest.No. A403- Con.
II. Comments
Description and uses
The products included in this digest are synthetic organic chemicals
derived principally from petroleum. All of these chemicals are used primarily
in the processing of synthetic and natural rubber as either accelerators or
antioxidants. Accelerators are usually organic chemicals which greatly reduce
the time required for vulcanization of synthetic and natural rubber, and at
the same time improve ageing and other physical properties. Chemicals used as
antioxidants are added to rubber before curing to retard oxidation and
deterioration. One of the chemicals in this digest, 1,2-dihydro-2,2,4-
trimethylquinoline polymer, is used as an antioxidant, while the other three
chemicals are used primarily as accelerators.
U.S. producers and employment
At various times during 1978-82, five domestic producers manufactured at
least three of these chemicals. Three of these domestic producers are major
manufacturers of rubber products, while the remaining two producers are major
chemical firms. Two of the major rubber producers manufactured all four of
these chemicals at various times during 1978-82.
In 1982, there were three producers of 1,2-dihydro-2,2,4-trimethyl-
quinoline polymer; five producers of 2,2'-dithiobisbenzothiazole; four
producers of 2-mercaptobenzothiazole; and two producers of N-(oxydiethylene)-
benzothiazole-2-sulfenamide. The , number of employees engaged in the
production of these chemicals is not readily available because the employees
are generally used to produce a number of similar chemicals at a facility.

*
Digest No. A403--Con.
U.S. consumption and production
Overall U.S. consumption of these four chemicals during 1978 -82
Domestic production of these chemicals during 1978-82
During 1978-82, the imports-to-consumption ratio for these chemicals
ranged from
* * * *
U.S. exports
Exact export data for the chemicals included in this digest are not
available as these chemicals are included in "basket" Schedule B numbers,
namely, antioxidants and accelerators. Based on the data available for these
categories and from industry sources, it is estimated that exports of these
chemicals during 1978-82 amounted to * * * percent of domestic production.
Exports of these chemicals were mainly to Canada, Western Europe, Brazil, and

4
Digest No. A403- Con.
certain Far Eastern countries. Industry sources expect exports of these
chemicals to increase slightly in 1983 compared with'1982 as the economies of
the major export markets begin to recover. Competition from other foreign
producers will probably be greater than in previous years, as the increasing
value of the U.S. dollar has increased the price of these chemicals compared
with the cost of the foreign products.
U.S. imports
During 1978-82, U.S. imports of the chemicals included in this digest
increased significantly from 803,000 pounds in 1978 to 4.2 million pounds in
1982 (table A). One of the primary reasons for this increase was the
increasing value of the U.S. dollar relative to other currencies, resulting in
less costly imports compared with the domestic products. In 1982, imports of
these chemicals were mainly from the United Kingdom, West Germany, and
Belgium. Smaller amounts also came from France, Canada, Italy, and Poland.
The Commission did not find any imports of these chemicals from GSP-
designated countries during 1978-82. Data are not available for the first 6
months of 1983, but industry sources believe imports of these chemicals were
slightly higher than in the corresponding period of 1982 because of the
improving economy and the higher value of the U.S. dollar.
Industry sources believe there are no differences in quality between the
domestic and imported chemicals discussed here, especially for imports from
West European countries. These sources are not sure of the quality of the

Digest No. A403--Con.
products from Mexico and other GSP—beneficiary countries which may export to
the United States if these chemicals are given GSP status.
Position of interested parties
Three chemical firms from Mexico, Quimica Organica de Mexico, S.A.,
Quimica Ameyal, S.A., and Novaquim„ S.A., which are subsidiaries of CYDSA,
Monterey, Mexico, are the petitioners requesting GSP status for the four
chemicals included in this digest. The granting of GSP status will give the
U.S. domestic industry a supplemental source of these chemicals at competitive
prices and also aid in the economic development of Mexico. The petitioners
contend GSP treatment of these chemicals will not adversely affect the U.S.
producers because the amounts intended for export will be quite small (not
more than 1,000 tons per year).
Mr. G. Pazianos and Mr. E. Martinez, on behalf of the three firms within
the CYDSA group, testified before the Commission in favor of granting GSP
treatment to the chemicals listed in this digest. They stated that granting
GSP status to these chemicals would aid the economic development of Mexico at
a critical time and provide U.S. customers with an additional source of these
chemicals at competitive prices. In addition, GSP treatment for these
chemicals would not adversely affect the domestic producers because the
amounts intended for export would be small.

6
Digest No. A403--Con.

7
Digest No. A403--Con.

1978 1979 1980 1981 1982 Jan.-June :
1982 1983
8
Digest No. A403- Con.
.
Table A.--Rubber processing chemicals: U.S. production, exports of domestic merchandise, imports for consumption, and apparent consumption, 1978-82, January-June 1982, and January-June 1983
(Quantity in thousands of pounds, value in thousands of dollars: unit value in cents per pound)
: Year .
:
Produc- tion
• :Exports 1/:
. : Apparent
Imports • : Consumption :
Ratio (percent) of imports to
consumption
Quantity
1978-------: *** : 11,000 : 803 : *** *** 1979- : *** : 12,000 : 3,397 : *** *** 1980 : *** : 9,000 : 2,489 : *** *** 1981-- : *** : 3,800 : 3,800 : *** *** 1982 : *** : 7,000 : 4,154 : *** *** Jan.-June :
1982- : 2/ 2/ 2/ - :
1983- : 2/ 2/ 2/ : - :
Value
1978 : *** : 2/ 2/ - : 1979 : *** : 2/ 2/ - : 1980-: : *** : 2/ 2/ - : 1981--- : *** : 2/ 2/ - : 1982 : *** : 2/ 2/ - : Jan.-June : :
1982 : 2/ 2/ 2/ - : 1983 : 2/ 2/ 2/ - :
Unit value
1/ Estimated by the staff of the U.S. International Trade Commission. 2/ Not available.
Source: U.S. production, U.S. International Trade Commission, Synthetic Organic Chemicals. United States Production and Sales, annual reports, 1978-82; U.S. imports, U.S. International Trade Commission, Imports of Benzenoid Chemicals and Products, annual reports, 1978-82.

12 ▪ ,c)
rt co p.
11/ 40 4,4
cr•
1 r'. .... Irt
0 al 0 r.I ,-I
•• •• •• •• •• •• •• •• •• ••
Irt we .0 co
5.. - 01 0 ,4 ,I
,c) co
CO CO
en 00 O 1.4
00
r-I
0 CO O. N. 11
405.09(pt.
)
403.16(pt.
)
information; U.S.
imports in 1982; competitive status
TITLE: Other cyclic intermediate chemicals
I. TSUS(A) item number; description; tar
iff
the final rate of duty.
The converted rate of
0
▪
0
.0 0 .1% O 0 • 1... O CI Vl •••• 9 0 • es 0 •0 0 .... • 0 a 0 ea CI. 0 0 0 x 0
O .. .. .. .. ...
CA N 0 ,.
vi ..) co 0 en1 ml
cni -... .. LI o. o C ••■ • _
• E a a, * i
▪
c IC
4,4 44 .4* * IC *
.. .. .. .•
0. Pe C%) 41 Cr.
0 0 + 0 • + g
Irt ...) .0 + )1
....1 0 0 )r) 0'
40 ».) P. No• .0) ) 0 r. ..... +.
co 4,1
I. 0 O .... .-1 0
)...) s.) a) O -c 0 c O .0 .0 a) 0 a) 0,-) N I. E •-1 0. C O ∎ 0 C 0
.-i . 0 .0 O. - -F
-, 0 a )•• 2 >, a)) 0) i . ta (O
...1 - NI 0 I. O o . to 0 • .0 •••., C •0 I-4 0.)
..) o 01 0,
CI 0..0 .0 9 u ..
La 0 , E 47 E I. O. o .0 0 ,..■ 0 o., A., a
... ..• o o o0
0 01 C ••-, 0 ....0•1 1 00X g
.o .d.+ .0 0 0 0
Csi ct. or • •
0.
co
O )sr
Description

2
Digest No. A404 -- Cc.".
II. Comments
Description and uses
The products included in this digest are Synthetic organic chemicals
derived principally from petroleum-derived products such as cresols and
benzene. These chemicals can be used as intermediates in the production of
more advanced synthetic organic chemicals and finished products (e.g., drugs)
or in their present form as end-use products (e.g., antioxidants).
The major use for 2,6-di-tert-butyl-p-cresol is as an antioxidant for
petroleum products, jet fuels, synthetic and natural rubber, plastics, and
food products. In addition, it can also be used in food packaging and animal
feeds (i.e., preservative) and as an intermediate chemical.
Potassium D-(-)-N-(1-methylcarbonylpropen-2-y1)-alpha-amino-p-
hydroxyphenyl acetate is used as an intermediate in the production of
amoxicillin, a semisynthetic penicillin.
The last chemical in this digest, 4-amino-6-chloro-m-benzenesulfonamide,
is also used primarily as an intermediate in the production of drugs. This
chemical is specifically used to produce chlorothiazide and hydrochlorothi-
azide, which are used as diuretics and antihypertensive agents.
U.S. producers, consumption, and production
During 1978-82, there were no domestic producers of potassium D-(-)-N-
(1-methylcarbonylpropen-2-y1)-alpha-amino-p-hydroxyphenyl acetate or 4-amino-
6-chloro-m-benzenedisulfonamide. According to industry sources, there may
have been domestic production of one or both chemicals during this period but
it was only as part of their production of the finished products (i.e., drugs)

3
Digest No. A404--Con.
and not for the domestic market. The remaining chemical in this digest,
2,6-di-tert-butyl-p-cresol, had between five and six domestic producers per
year during this period, depending upon consumer demand.
U.S. consumption of the two chemicals used as intermediates in the
production of drugs during 1978-82 was essentially the same as the volume of
imports owing to the lack of any significant domestic production.
During 1978-82, U.S. consumption of a 2,6-di-tert-butyl-p-cresol
(technical and food grades)
During 1978-82, the two chemicals in the digest used as intermediates in
the production of drugs did not have any significant domestic production. The
other chemical, 2,6-di-tert-butyl-p-cresol, had domestic production of both
the technical and food grades which were reported to the Commission. During
this period, total domestic production of this chemical decreased from 23.7
million pounds in 1978 to 11 million pounds in 1982, or by 54 percent (table
A), for the reason stated earlier for the changes in the domestic consumption.

4
Digest No. A404--Con.
U.S. production quantities of this chemical for both grades during 1978-82 are
shown in the following tabulation: 1/
Year Quantity (1,000 pounds)
Technical grade Food grade
1978 13,034 10,665 1979 13,051 9,269 1980 9,679 11,488 1981 9,217 7,714 1982 6,752 4,246
U.S. exports
Exact export data for the chemicals included in this digest are not
available as they are classified in residual "basket" Schedule B numbers.
Industry sources estimate, however, that exports of the two chemicals used as
intermediates in the production of drugs were nil during this period as they
are usually consumed domestically in the production of drugs which are more
likely to be exported. Exports of 2,6-di-tert-butyl-p-cresol during this
period averaged between * * * percent of domestic production based on data
for total exports of antioxidants obtained from Government sources and
industry estimates.
U.S. imports
*
1/ Source: U.S. International Trade Commission, Synthetic Organic Chemicals, United States Production and Sales, annual reports, 1978-82.

S
Digest No. A404--Con.
Position of interested parties
Kaneka America Corp., an importer for their affiliate, Kaneka Singapore
Co., Ltd., is the petitioner requesting GSP status for potassium
4 D-(-)-N-(1-methylcarbonyl-propen-2-y1)-alpha-amino-p-hydroxy-
phenyl acetate. The company contends the addition of this chemical to the GSP
list will have a beneficial effect on domestic consumers--namely, from lower
prices. Also, the addition of this chemical to the GSP list will not harm any
domestic firm as it is not currently produced in the United States. Price
comparisons between the imported and domestic products could not be provided.

6
Digest No. A404 Con.
Pliva of Zagreb, Yugoslavia is the petitioner requesting GSP status for
4-amino-6-chloro-m-benzenedisulfonamide. Pliva states that GSP status for
this chemical would not injure the domestic industry because it is not
produced for open market sales in the United States. This status, Pliva
further contends, would also reduce the manufacturing cost of the finished
drugs for the domestic producers, while allowing Pliva to compete with non-GSP
countries in selling this intermediate to U.S. firms.
Three Mexican companies which are subsidiaries of CYSDA, Monterey, Mexico
are the petitioners requesting GSP status for 2,6-di-tert-butyl-p-cresol.
They feel duty-free entry of this chemical would provide U.S. customers with
supplemental sources of this chemical at competitive prices and would not
adversely affect the domestic producers because the amounts intended for
export will be quite small in volume (i.e., not to exceed 1,000 tons per year).
Mr. G. Pazianos and Mr. E. Martinez, on behalf of the three firms in the
CYSDA group from Mexico, testified before the Commission in favor of granting
GSP status to 2,6-di-tert-butyl-p-cresol. They restated the reasons given in
the petition by the three Mexican companies requesting GSP status for this
chemical.

Digest No. A404--Con.

8
Digest No.
A404--Con.

Digest No. A404 Con.
Table A.---Other cyclic intermediate chemicals: U.S. production, exports of domestic merchandise, imports for consumption, and apparent consumption, 1978-82, January-June 1982, and January-June 1983
(Quantity in thousands of pounds, value in thousands of dollars: unit value in cents persound)
Year Produc- tion 1/
:Exports 2/: Imports • Apparent Consumption • •
Ratio (percent) : of imports to
consumption
Quantity
1978-- 23,699 : *** : *** : *** : *** 1979-- 22,320 : *** : *** : *** : *** 1980-- 21,167 : *** : *** : *** : *** 1981-- 16,931 : *** : *** • *** • *** 1982- 10,998 : *** : *** : *** : *** Jan.-June :
1982 3/ *** *** 1983 : 3/ *** ***
Value
1978 : 21,092 : *** *** 1979 : 37,720 : *** *** 1980- : 29,634 : *** *** 1981 24,042 : *** *** 1982 17,597 : *** ***
- Jan.-June : •
1982 : 3/ *** *** 1983 : 3/ .*** ***
Unit value
1978 $0.89 : - : : - : 1979- : 1.69 : - : - : - 1980- : 1.40 : : - : 1981 : 1.42 : - : - : - : 1982 : 1.60 : - : - : - : Jan.-June : :
1982 : -: -: -: - : 1983 : - : - : - : - :
1/ Production data are only for 2,6-di-tert-buty-p'-cresol. 2/ Estimated by the staff of the United States International Trade
Commission. 3/ Not available.
Source: U.S. production, compiled from U.S. International Trade Commission, Synthetic Organic Chemicals, United States Production and Sales, annual reports, 1978-82; U.S. imports, compiled from U.S. International Trade Commission, Imports of Benzenoid Chemicals and Products, annual reports, 1978-82.


'1980 2/ • 1981
•
0
X
It cv
IC IC
Cis
411.
56(p
t.)
Descrip
tio
n
0
.0
0
C we
Meclizine
hydrochloride
TSUS item number; descrip
tio
n; ta
riff rate
in
formatio
n; U.S.
imports
in
198
2; competitiv
e sta
tus
0
• . +4 0
02 A a -4 +1 C 1, •
ee 0
+s • -■
0 0 c)
C 0.5 0
0 0 t•
•••■ C.) V
Va 44 04 V 0
0 aa
ma
NI

2
Digest No. A405--Coli.
II. Comments
Description and uses
Meclizine hydrochloride occurs as a white or slightly yellowish
crystalline powder. It has a slight odor and is practically insoluble in
water and slightly soluble in alcohol. Meclizine hydrochloride is a
piperazine-derivative antihistamine which is used as an antinauseant. The
drug is mostly used in the prevention and treatment of motion sickness.
U.S. producers and employment
During 1978-81 meclizine hydrochloride was domestically produced by one
firm
* * *
Employment data are not available.
U.S. consumption and production
Estimated apparent consumption of meclizine hydrochloride varied during
1978-82, ranging from

Digest No.° A405--Con.
* * *
U.S. exports
Export data are not available; * * *
U.S. imports
Imports of meclizine hydrochloride during 1978-82 ranged from a low of
a'7)out 5,000 pounds in 1978 to a high of almost 10,000 pounds in 1981 (table
B).
Position of interested parties
Pliva, a Yugoslavian firm, filed the petition with the U.S Trade
Representative for GSP treatment of meclizine hydrochloride. Pliva requested
GSP treatment for this drug allegedly to help foster economic development in
Yugoslavia. No submissions were received from other interested parties.

4
Digest No.
A405--Con.

5
Digest No. A405--Con.

6
Digest No. A405--Con.
IV. Statistical Data
Table A.--Meclizine hydrochloride: U.S. production, exports of domestic mer-chandise, imports for consumption, and apparent consumption, 1978-82, January-June 1982, and January-June 1983
(Quantity in pounds, value in dollars unit value per pound)
Period :Product ion : Exports : • •
Imports Apparent
:
consum
ption
Ratio (percent) of imports to consumption
Quantity
1978 • 1/ *** 2/ 4,926 : 1/ *** 1 / *** 1979 : 1/ *** 2/ 7,996 : 1/ *** 1 / *** 1980 : 1/ *** 2/ 6,778 : 1/ *** 1 / *** 1981 : 1/ *** 2/ 9,736 : 1/ *** 1/ *** 1982 : 1/ *** 2/ 5,935 : *** 1/ *** Jan.-June: :
1982 : 1/ *** 2/ 2/ *** *** 1983 *** 2/ 2/ *** ***
Value
•
1978 *** 2/ *** *** *** 1979 *** 2/ *** *** *** 1980 *** 2/ • *** *** *** 1981 *** 2/ : 1/ *** *** *** 1982 *** 2/ 1/ *** *** *** Jan.-June: :
1982 *** 2/ *** *** *** 1983 *** 2/ *** *** ***
Unit value
• •
1978 *** *** *** *** 1979 *** *** *** *** 1980 *** *** *** *** 1981 ***
- : 1/ *** *** *** 1982 *** - : 1/ *** *** *** Jan.-June: :
1982 *** *** *** *** 1983 *** *** *** ***
1/ * * * 2/ Not available.
Source: U.S. International Trade Commission, except as noted.

prin
cip
al sourc
es,
••••• ..
0
CV .0 02
.H
0 a
0
S
03 LI C ed
0 0 G 00 C al
S.4 o
•7 •• " ••
0 cd ri s•1
•• 0
0 CY 1:1 0
04 CO CO E
1-1 «r 1.4
• 0 C/2
• 0 •• •• •• •• al
—
al cn V V a, •14 C 0 rl
tr al 0
0 P2 0
.0 • •• •• •• 0 CY 0 03
03 CIO >I
0
H 4J r1 0
Of
N .• •• •• ••
4)
C9 CO
7 r-I 0 .0
7
IC IC Ic
IC Ic IC
IC IC IC
IC IC IC
IC IK IC
4c IC IC
IC IC IC
Ic * IC N *
* * *
IC * * IC
IC * * * 4C IC
• • • • • 0,, • •
* IC 4c 4C 4C 4C ic
• • • • • • • • •
IC ix IC it * * IC
* IC
If IC IC IC * it IC 4C * * iC
* IC * IC It * * IC IC * IC IC
* * * * * * If * * * * *
IC IK Of if if if * IC * IC if if
• • • • • • • • • •
If * If N 4C lc * 4C IC * 4c 4C
• • • • • • • • • •
ic Ic IC IC * IC *
IC Ir
• • • • • • • • • •
IC Ic IC IK IC IC * * Ic * *
• • • • • • • • • •
IC IC IC it IC it IC 4C IC IC IC IC
• • • • • • • • • •
IC IC IC * IC * IC * IC * IC IC
• • • • • • • • • •
If IK IC * IC 4C * IC * * If *
iC * 4C IC * Ic IC IC 4C 4C 4C 4t
• • • • • • . • • •
Ic IC If * IC IC IC * Ic IC * If
• • • • • • • •
* >IC ic IC 4C IC * Ir IK IC *
* IC IC 4C * IK Ir * * * * IC
4C IC * IC *
* IC * IC
• • • • • • • • • •
IC * * IC * * * iC * * 4C *
• • • • • • • • • •
* IK * * * * * * IC *-* IC
• • • • • • • • • • • • • • • • • • • • • • • • • • • • • • • • • • • • • • • • • • • • • • • •
1/ Not
available.
Unit
Value
a)
ed r-i
* * it IC
IC IC If IC
IC IC IC IC
iC IC * * * * IC *
If * IC *
* IC * IC
IC * IC IC
4C * IC *
IC IC IC
• •
IC IK IC
IC IK IC
• •
IC 4c IC
• •
IC IC IC
IC IC IC
1-1
O E-1
rt
• •
•••• rt
Ln
Cr,
• •
'0 M r•-•
01
re.
tO
Its
ta at 01
r•••
tO CV
+se
Digest No. A405--Con.
U.S. Inte
rnationa
l Trade Commission, except
as note
d.
L 0 O C/!

Internationa
l Trade Commis
sion, excep
t as note
d.
a
0 0
January—June 1983
inclu
ding de
signa
ted
0
V
▪
C 0
.1.
•
) 0
.0
Li 04
U)
L 0
H
• • • • • • • •
0
•
• 0 VI Cr 00 cd
V r10 tr C 0 3 •
0 C >2 •
1`1 cd C 00
4.)0
-
Cr% L C r-I O cd 0 4-3 0
ra >11.1 .00
.63 0 Ra CSC • Cp o oz) 0 CU I 0 1-4 E co
.41
0. • Ti
• .4
• CA
411
•
441
4-1 •0 C cd 4.1
La 0 • O 0 •• •. .• rf
• N 0 C.9
CT r-i
94 34 4C
44
34 34
44
4C 34
44 94 4C
34 4C 44
• •
'C 44 iC 44
• • • •
4C
44 4C
• • • •
44
44
• •
4C 94
• •
44
is 4C
• • • •
• • • •
let
CT
cn
th
cy,
CO
N.
• • • •
tO 0 0'
rs.
'.O CV CT
.1C iC iC 4C 44
X it 4C * OC 4C
•X 9c 94 *
* * 4C *
44 44
IK
34
• • •
4C
• •
44
• •
4C
4C
IC
34
44
4C
• •
4C
* IC SC 444C
N '(C 4c 4c
* 4C 4C 4C 4C
C
O 0'
lC
1/ Not avail
abl
e.
• • • • • • • • • • • • • • OA. • • • • • • • • • • • •
0 0
4) C O * 0
* 4C • *
r4 4C 4C * * 1—♦ 4 3(
3C 9C
* X 3C *
4C *
is X All cou
ntr
ies
8
Digest No. A405--Con.

TITLE
: Acetyl ■u
lfisoxaso
le; sulf
amer
atin
e, sodiu
m
TSUS it
em n
umber; descrip
tio
n; tarif
f ra
te info
rmati
on; U.
S. impor
ts in
198
2; competit
ive sta
tus
• a O • • V • •
0
41.• 0
0
J.) •
• 0
so
O
••
▪
•1
• 1.8
•
A • .0 4.1 a O • • •
•
•
a.
0
. . .4 0 O
A a. a r4 a
O
■
8
▪
. O
o.
•
0
• • • • • • • • • • • • • • • • • • ••
gain
s, sodium-
ulfisozazo
le
• • • • • - • • • • • • • • • • • •
• • • • • • • • • • • • • • • •
• 1.4 le1 ., 5. • ..4 CI 7 .0 CO
•■••• I. •
op .1./ a. a. ....
en rs co to
.4 .4
.4 .4 4r 4r
SI • V. .0 • 0 C.I V • 2 2 0 el SI V O 0 C L. L.
0. O C O • •
■ e4 0 0 0. 0
O r-C
O. • 6 C a-4
M.
• • • 1.•
9c
CO 0. r4
(0
•• •• 0. e • i • I a-I CO
r • p•I 4LI C
6 r)
• La 41' g • • 02 • ...I J.2 Q.
.
•
1.1 41.6 • 0 •
• • Yr la O Q. 0
• pf 0 •
▪
O. 0 Os .0 r•I
.0 7 0 C • •
Y. • La
I. 0 .0 •
• • co •
• .✓ • r-I • • Y.+
•
• 0 ••
• .0 .0 • C 4.0 14• 1 • • C.) .0 O CO
• • .1.0
• 1.
Iry
• 2.
• L. • 0. .4
0 1.4 O 0
Desc
rip
tio
n
• •
0 0 z
co
• p1 eo
N ev •-I
• • •• .• •• • •
11 ye P
•
K
oe o4
en CV 04
Ire ye • vs
css ess
• • • •
0
0 • Y. 40 Or • 0
0 • .0 .0 • •
CO Od
• +. .41 NI

2
Digest No. A406--Con.
II. Comments
Description and uses
Acetyl sulfisoxazole (sulfisoxazole, acetyl) and sulfamerazine, sodium
are members of a group of chemicals referred to as anti-infective sulfonamides
because of their related chemical structures and antibacterial activity.
Although at one time anti-infective sulfonamides were widely used in the
treatment of bacterial infections, the development of resistant strains of
micro-organisms has limited the usefulness of these drugs. Anti-infective
sulfonamides are now used mostly to treat urinary tract infections in humans,
in veterinary medicine, and as growth promoters added to animal feeds.
Acetyl sulfisoxazole lacks the usual disagreeable taste of most of the
anti-infective sulfonamides and is used, therefore, mostly in pediatric syrups
or suspensions. Sulfamerazine, sodium is reportedly used primarily in
veterinary medicine or as an additive to animal feeds.
U.S. producers and employment
There is one domestic producer of acetyl sulfisoxazole. Employment data
are not available, but the number of employees associated with this product is
believed to be * * *
There was one domestic producer of sulfamerazine, sodium during 1978 and
1979; however, no production has been reported by this firm during 1980-82.
U.S. consumption and production
Precise statistics on U.S. consumption and production of acetyl
sulfisoxazole and sulfamerazine, sodium are not available. Domestic production

3
Digest No. A406--Con.
of acetyl sulfisoxazole is estimated
*
There is believed to have been no U.S. production of sulfamerazine,
sodium during 1980-82 and data for prior years are not available. Apparent
consumption during 1980-82 is believed, therefore, to equal imports which were
erratic, ranging from about 5,000 to 34,000 pounds (table A-2). Actual
consumption of sulfamerazine, sodium was probably more even because it is
possible to sell drugs from inventory for several years--especially drugs,
such as this one, for which there is little demand.
U.S. exports
Export data for acetyl sulfisoxazole and sulfamerazine, sodium are not
available.
U.S. imports
Acetyl sulfisoxazole is not believed to have been imported into the
United States prior to 1981. In 1981, imports were 2,457 pounds, valued at an
estimated * * * (table B-1). In 1982, imports were 2,701 pounds, valued at
an estimated * * *
The estimated ratio of imports to consumption was
about *** percent, based on quantity, during 1981 and 1982. Imported acetyl

4
Digest No. A406--Con.
sulfisoxazole is like and directly competitive with domestically produced
acetyl sulfisoxazole.
Imports of sulfamerazine, sodium increased from about 1,000 pounds in
1978 to 34,000 pounds in 1981 before declining to 5,000 pounds in 1982 (table
B-2). Since 1980, imports are believed to have served all of the domestic
market for this drug. There is little domestic interest in this product
because equally effective anti-infective sulfonamides are available at a lower
cost. * * *
Position of interested parties
Pliva, a Yugoslavian firm, filed the petition with the U.S. Trade
Representative (USTR) for GSP treatment of acetyl sulfisoxazole and
sulfamerazine, sodium. Pliva requested GSP treatment for these drugs
allegedly to help foster economic development in Yugoslavia.
According to Pliva, the domestic producer of acetyl sulfisoxazole
testified before USTR in opposition to Pliva's request for GSP treatment for
this drug.

5
Digest No.
A406--Con.

6
Digest No. A406--Con.
* * *

Digest No. A406--Con.
IV. Statistical Data
Table A-1.--Acetyl sulfisoxazole: U.S. production, exports of domestic mer-chandise, imports for consumption, and apparent consumption, 1978-82, January-June 1982, and January-June 1983
(Quantity
Period : Product
in pounds. value
ion : Exports :
in dollars. unit value per
Imports Apparent
: consumption
Quantity
pound) Ratio (percent)
of imports to consumption
• • • •
•
1978 1/ *** : 2/ 0 : 1/ *** 1/ *** 1979 1/ *** : 2/ 0 : 1/ *** 1/ *** 1980 1/ *** : 2/ 0 : 1/ *** 1/ *** 1981 1/ *** : 2/ 2,457 : 1/ *** 1/ *** 1982 1/ *** : 2/ 2,701 : 1/ *** 1/ *** Jan.-June: : •
1982 1/ *** : 2/ 2/ : 2/ 2/ 1983 1/ *** : 2/ 2/ 2/ 2/
Value
1978 1/ *** : 2/ *** 1/ *** 1/ *** 1979 1/ *** : 2/ *** 1/ *** 1/ *** 1980 1/ *** : 2/ *** 1/ *** 1/ *** 1981 1/ *** : 2/ *** 1/ *** 1/ *** 1982 1/ *** : 2/ *** 1/ *** 1/ *** Jan.-June: :
1982 : 1/ *** : 2/ 2/ : 2/ 2/ 1983 1/ *** : 2/ 2/ : 2/ 2/
Unit value • . •.
1978 1/ *** : : *** 1979 1/ *** : *** 1980 1/ *** : : *** 1981 1/ *** : - : 1/ *** :
1982 1/ *** : - : 1/ *** : Jan.-June: :
1982 1/ *** : 1983 1/ *** :
1/ * * * 2/ Not available.
Source: U.S. International Trade Commission, except as noted.

8
Digest No. A406--Con.
Table A-2.--Sulfamerazine, sodium: U.S. production, exports of domestic mer-chandise, imports for consumption, and apparent consumption, 1978-82, January-June 1982, and January-June 1983
uantit in •ounds value in dollars unit value •er •ound •
. : Apparent
Ratio (percent) Period : Production : Exports : Imports : : of imports to
consumption : consumption
1978 1979 1980 1981 1982 Jan.-June:
1982 1983
Quantity
: : : : : : : :
1/ 1/
: :
0 : 0 : 0 :
: 0 : 0 :
1/ 1/
: :
0 : 0 : 0 :
: 0 : 0 :
1,102 :
9,921 : 15,103 : 34,065 : 4,960 :
1/ 1/ :
1/ . 1/ •
15,103 : 34,065 : 4,960 :
: 1/ : 1/ :
1/ 1/
1/ 1/
100 100 100
Value
1978 : 1/ : 1/ : *** , *** 1 / 1979 : 1/ : 1/ : *** *** 1/ 1980 : - : - : *** *** 100 1981 : - : - : *** *** 100 1982 : - • - : *** *** 100 Jan.-June: : :
1982 : - : - : - : - : 1/ 1983 : - : - : - : - : 1/
Unit value
1978 1979 1980 1981 1982 Jan.-June: :
1982 1983
1/ Not available.
Source: U.S. International Trade Commission, except as noted.

✓-♦ al
0 C-1 *
N
N
9C
K
4(
• • • • • • • • • • • • • • • • : • • • • • • • • • • • • • • • • • • • • •
43 M 4.3 C 0 C 0
• • • • •
• • • • • •
0 0
O
f—+ ed 43 O
E-1
• • • • • •
I I
•• .• ••
I I
SC SC * 9c 9c
1/ Not available.
Inte
rna
tio
nal Trad
e Commission, except as note
d.
0
O 0 0
• •
'-I
r-1 0 r.
UI
04
O
• •
O
• •
0 C
1-♦
O
4C
4C
rI
Unit
Valu
e
r4I
* 4C 4C * * 4(
0 0
0 0
• • • • • •
I I
9 Digest No. A406--Con.
(D
I
• *
1
0 to C
cd a3 r4 3") 0%
r4 0*
T3
▪
"
Oa 0
>.% c• .0 03 L 00
.H • 1-4
O 0
o O
P•3 g I
N fa C cd r-1 O 0 C CIO C./ C C at
cd r-1 L In 0
4-1 C
co al 4) • •• O C4 b 0 O. CO E a C C.
• 0 C
• 0
1
• 7,1
L tT W cd
r-1 .
•
CT O C
cd cd h 0
.K O .• •• •• O CV
• CO (3.4 1 r4 CO 03
• 43 N. In
•
c.. ••••■
TA 4.1 r-1 >.• cd 4) C
•• •• •• •• c.) 44
1-4
Q7
6-4 0
O ti E-I
CO CT 1-1
• • • • • • • •

Digest No. A406--Con.
10
a) 1-4
Inte
rnatio
nal Tr
ade Commis
sion, except as note
d.
O
4)
0
Sourc
e: U.
S
1/ Not availabl
e.
• •
••
O
en 0
eel
ri to
O H
S., ••., 1-1 I e-41 •-4I ,•1 1 1-i
•• •• •• •• •• ••
0
N. N. 'N. N. ,-111-11
•• •• •• •• •• ••
* 4( * * 4( * 4( 4( 4( *
* 4( * * * 4e * • * 4( *
•• •• •• •• •• ••
■ N. N. N. ■ v••1I .41,41 r•1i r•1
•• •• •• •• •• ••
••
•
••• •••• 1.1I I-41 -1 f-+
•• •• •• •• •• ••
N. N. •••• ••••• 1-4
4(
4( 4(
4 is 44 4C *
44 * .1( 4( *
* 44 * * * 4C 4( 44 44 44
* 4( 4C *
* 4( * *
4( 4C is it 4c
•• • • •• •• •• •• •• •• •• •• •• • • •• •• •• • • •• Iwo • • •• •• •• •• •• •• •• ■ •• ••
COeh
01 r4
1'2
0.t Lo
1-3
.0 • • • • • • • •
0
0% eh C`.1 .0 CO 1. CO
0) s-1
prin
cip
al s
our
ces,
Jf
4.)
0 ■-•4 vi ra
eT
eT
CS1 0 1-1
ri •
ra N.. N. N. 1-41 '4 1 r-1 1 '41
•• •• •• •• •• •• ••
N. ■ •••■ v-II 1-41 r4I
•• •• •• •• • • •• ••
N. N. ••••• ••••• I 1-41 ,•11 •-41
•• •• •• •• • • •• ••
I 44
44 ■ ■ ■ \ /-1I t-11,-11 v-1
•• •• •• •• •• ••
I I I I II I
•• •• •• •• •• •• ••
1 1 1 1 1 1
••
1 I
•• •• •• •• •• ••
I I I I I
•• •• •• •• •• ••
I I I I I
•• •• •• •• ••
I 1 1 I I
•• • • •• • • •• ••
I 1 1 1 1
•• •• •• •• ••
I 1 I I
•-4 4, 0 H
Unit Valu
e
IC IC 4C

OD
60
C.)
• ■•4
al o ce1 LI co as cr.
1-4 a) e
o t-s
i c M cd cd .0 0
C cd t-3
P4 '0 .0 C
cd co .0 •
O. 0 CO 04 I 0 CO
a. 0
• • 14 .67
r4 0 N ed
0 CI.
tla
0 W
1-1
0
44
rd
value
in do
l lars
)
(NI ao ri
ao P.* at
0
= O
•• • • •• ••
00
ra
trib
utio
n
January
-Ju
ne
1983
11 Digest No. A406--Con.
1'4 r♦ ••••
•••
•• •• •• •• •• •• • • •• •• •• • • •• ••
•••.,
ri P4 ••••
1-1 v-8
•4„„
1-1 .44
rs1
•• •• OS 00 OS
P4 0
it sc sc
* St * is 4C
st sc
* I f's Ot * 4C oc C■4
•• •• 00 00 •
St IC
* * * cd
sr 4C I St
ed 4C 4C * * 41 st
O 0'
•• •• •• •• • • •• •
O O 0 00 I I
•• •• • • •• •
O O O 00 I
•• •• •• •• ••
O O O 0 0 I I
00 00 OS WO 410 00 0 • ••• 00 OS • Of 0 IF •• 00
ai a1 O
•••4 it
*4 U
1) 4) C C 0 0 9t 0 0 it ft
*
it St
0 9t 0 0 * *
9t
* IC 0 O
1-I * * * * I-I St * St St 0 r-e 4 * *
.-I . oc sc
1/ Not
avail
able.
Inte
rnational Trade Commission, exc
ept
as note
d.

12 Digest No. A406--Con.
•0
00
•10
00
.1•4 •ci
/-1
cd co cc) ra co cd
•0 r4 L+ 0 0
4'3
C •••• Lr cd .0 0 Li 0 al 0 I-3
.am
•I•1 La (N1 0 0 0. I
0
g oo f••• IT
• 1.4
O •
ca 0)
• • Li
•0 0 o c.)
Cc.
La
r4
I
• csi
0)
.0)
LI
ri 1.4 0
0,
ra
0
O
•■••
o .•
• • ••
••
• •
•• ••
•• ••
• • •
cv 00
f••I 00
00
r4
1-1
00
a) r4
.61
O
Lf 0 a.
• • ••
1.41
0 0a E F.1
• • ••
• • • .
• • ..
0
•• •
N.
••■ ••
N. 0. r•1
•• ••
0)
Lr
O ca
A.)
0'
.0 .0
• •
•
• •
• •
• •
.0
• •
•
0 v0 0)
sr
• •
Ifs
0
• •
O f♦
Ifs
0)
0'
• •
O
ra
•■•I S.■
AV 0
0 0
r4 r4 44
•
••••• r4
•••
r4
• •
• •
r4
• •
r4
• •
1-4
OO
*
*
*
"4
••
••,„ r4
4t
• •
4C
• •
••••
• •
••.• 1-♦
• •
r4
00
it
*
*
••••
•
rl
*
*
it
•
•••■ r41
•
••••
•
.0
*
*
*
1-111■4
1-1 11-)
••••
• • •
I rl
iC
* 4C *
• • •
r4
• • •
••••
• •
r4
.0
*
A
*
0)
r4
O. 00
••
• •
.•
• •
• •
•
.0
•
•••• 1•4
• •
• •
1-♦
• •
v-t
•
1-4
00
Li .4.) 0
0 0
0
I ♦ r-4 4
'4
• •
••••
1-1
• •
••••• 1-1
• •
1-4
• •
r4
• •
•••••
r4
• •
•••• '4
•
*
*
*
••••
1.11
• •
1-4
• •
••••, 11
• •
1-4
• •
1.4
• •
••••• r4
• •
f-I
0.
it
*
4(
••••
•
••••
•
••••
•
••••
•
•
•
r4I
.0
it
it
*
r411-1 1 ••••
• 0,
•••
• •
••••• r4i
• •
•••• c-11
•
• •
•
••■ r4i
it
*
*
.0,
• •
• • •
• • •
• • •
• • •
.6
cn
0)
La O 0 c0
January-June 1983
trib
utio
n
1/ Not available.
Inte
rnatio
nal Trade Commissio
n, excep
t as note
d.

4c 4c
4c
• In A• A) 1••• I0 • •••• O 0 DPI
• SI •••• O 0 • 14
14 A. 0. a
0 •• • • •• •
CO 47.
O 0
• • 1 on
OD SO
5 5 00 •• •• . O. 00 •• 00 •
04
ve
N A
*
•14 1•••
• 1•1
••
• * •
•• 00
at
N .4
4.
•14 1•••
WI
00 04 04 •• 00
• * it
•• • • •• 00 •• 00 00
•• •0 •.0 .r ....
A N 0 0. .4 o •C &a 4.• 0. o 14 IA O 0 A Al .0 .0 O 0
•• •• •• •• •• •• •• 0. 00
C. 6r.•
N .•
CA 0
CO
6-4
11•I 412.
69(p
t.)
• 0 0
0.1
1.•1 0
PRP
Po
O .4
do an
o
•
n Y 0. o • • • • • 0 • 0 • 4.) • • IX
• 4I NI
0 O
• •
• C.)
0
0 A • • X • •
so
4.1 1.1 •
• V
•
A • A
• 0 .0 • • • •
I. 4.4 • •
Chlorpropam
ide and Chloroth
iazide
Fr •4 110 CP
• Al 4) •0
5 .1 .• ..
• Le a • Il ► I. 110 7 • A A CA A Le A • A el 0 V •
■ • A4 Le ► 4■4 0
• • PI b0 W
..4 • de 0 Id A A A •
4.10 -
A 0 1:1 • •• • • • 14 0. V IAA • g LI a 4.1
• • 01 V • 0 0
O. ....• .0
• • 4.1
N a • • OD • I4 AI •• • • CP aV A .4 ..1
A A C • Li IC
••.. 14 A • 0. • 0 A
• o • .1 I. a O 4.1 • ••• a. CI 1•0 Ca • • 0 .
0 L 0 a 410
co .0
4
• 4w 4.1
a O
owl
a. rr 1.•
•
• 0 ▪ •• •• .• •
• •
•• •• 06 00
00 06 00 00
Descrip
tio
n
•• 06 •• 04 06 •• 00 •• 04 0.
.-1
O. •• •• •• . •• 04 00 00 ••
1.4

2
Digest No. A407--Con.
II. Comments
Description and uses
Chlorpropamide occurs as a white crystalline powder and is practically
insoluble in water but soluble in alcohol. Chlorpropamide is an orally active
hypoglycemic agent which is sometimes useful in the treatment of diabetes
mellitus. Chlorpropamide is a sulfonylurea compound which is structurally and
pharmacologically related to tolbutamide and other synthetic hypoglycemic
agents. Although chemically related to the anti-infective sulfonamides,
chlorpropamide has no antibacterial activity.
Chlorothiazide occurs as a white or practically white crystalline powder
and has a slightly bitter taste. The drug is slightly soluble in water or in
alcohol. Chlorothiazide is a thiazide diuretic. Chlorothiazide and related
diuretics, such as hydrochlorothiazide, are used mostly in the treatment of
congestive heart failure and hypertension. In the past, thiazide diuretics
were often used routinely during pregnancy to relieve edema. More recently,
enthusiasm for diuretic therapy in pregnant women has lessened, because edema
is now recognized as normal during most pregnancies.
U.S. producers and employment
There is one domestic producer of chlorpropamide and one domestic
producer of chlorothiazide. * * *
Employment data are not available; but the number of employees associated
with each product is believed * * *

3'
Digest No. A407--Con.
U.S consumption and production
Precise statistics on U.S. consumption and production of chlorpropamide
and chlorothiazide are not available. Domestic production of chlorpropamide
is estimated to have been
*
U.S. exports
Exports of chlorpropamide and chlorothiazide are believed to be
negligible.
U.S. imports
U.S. imports of chlorpropamide were very erratic during 1978-82, ranging
from a low of 154 pounds 1981 to a high of 59,710 pounds in 1980 (table 11-1).
In 1982, imports totaled 1,674 pounds with * * *

4
Digest No. A407--Con.
* * *
U.S. imports of chlorothiazide varied somewhat during 1978-82, declining
from 79,560 pounds in 1978 to 57,460 pounds in 1979, then increasing to 75,508
pounds in 1982 (table B-2).
*
Position of interested parties
Pliva, a Yugoslavian firm, filed the petition with the U.S. Trade
Representative for GSP treatment of chlorpropamide and chlorothiazide. Pliva
requested GSP treatment for these drugs allegedly to help foster economic
development in Yugoslavia. No submissions were received from other interested
parties.

5
Digest No. A407--Con.

6
Digest No. A407--Con.

7
Digest No. A407--Con.
IV. Statistical Data
Table A-1.--Chlorpropamide: U.S. production, exports by domestic mer- chandise, imports for consumption, and apparent consumption, 1978-82, January-June 1982, and January-June 1983
(Quantity in pounds. value in dollars, unit value per pound)
Period : Production : Exports : Imports Apparent consumption
Ratio (percent) of imports to consumption
Quantity
1978 1/ *** 2/ 3,748 : 1/ *** : 1/ *** 1979 1/ *** 2/ 17,030 : 1/ *** : 1/ *** 1980 1/ *** 2/ 59,710 : 1/ *** : 1/ *** 1981 1/ *** 2/ 154 : 1/ *** : *** 1982 1/ *** 2/ 1,674 : 1/ *** : 1/ *** Jan.-June: :
1982 1/ *** 2/ 2/ 2/ 2/ 1983 2/ 2/ 2/ : 2/ 2/
Value • •
1978 *** 2/ *** *** *** 1979 *** 2/ *** *** *** 1980 *** 2/ *** *** *** 1981 *** 2/ 1/ *** *** *** 1982 *** 2/ 1/ *** : *** ***
'Jan.-June: : 1982 *** 2/ 2/ 2/ 2/ 1983 2/ • 2/ 2/ 2/ 2/
Unit value
1978 1979 1980 1981 1982 Jan.-June: :
1982 1983
- : *** *** ***
1/ *** : - : 1/ *** :
1/ * * * 2/ Not available.
Source: U.S. International Trade Commission, except as noted.

8
Digest No. A407--Con.
IV. Statistical Data
Table A-2.--Chlorothiazide: U.S. production, exports of'domestic mer- chandise, imports for consumption, and apparent consumption, 1978-82, January-June 1982, and January-June 1983
• uantit in •ounds value in dollars unit value •er •ound : : : • : Ratio (percent)
Period : Production : Exports : Imports : Apparent of imports to consumption : consumption
Quantity
1978 : 1/ *** : 2/ : 79,560 : 1/ *** 1/ *** 1979 : 1/ *** : 2/ : 57,460 : 1/ *** 1/ *** 1980 : 1/ *** : 2/ : 57,650 : 1/ *** 1/ *** 1981 : 1/ *** : 2/ : 60,868 : 1/ *** 1/ *** 1982 : 1/ *** : 2/ : 75,508 : 1/ *** 1/ *** Jan.-June: :
1982 : 1/ *** : 2/ : 2/ *** ***
1983 2/ : 2/ : 2/ : 2/ 2/
Value
1978 : 1/ *** : 2/ : *** : *** : *** 1979 : 1/ *** : 2/ : *** : *** : *** 1980 : 1/ *** : 2/ : *** : *** : *** 1981 : 1/ *** : 2/ : 1/ *** : 1/ *** : 1/ *** 1982 : 1/ *** : 2/ : 1/ *** : 1/ *** : 1/ *** Jan.-June: : : :
1982 : 1/ *** : 2/ : 2/ : 2/ : 2/ 1983 : 2/ 2/ : 2/ : 2/ : 2/
Unit value
1978 : 1/ *** : - : *** : - : 1979 : 1/ *** : - : *** : - : 1980 : 1/ *** : - : *** : - : 1981 : 1/ *** : - : 1/ *** : - : 1982 : 1/ *** : - : 1/ *** : - : Jan.-June: : : : : :
1982 : 1/ *** : - : - : 1983 : -: -: -: - :
1/ * * * 2/ Not available.
Source: U.S. International Trade Commission, except as noted.

IC IC IC
•• •
••
ri
• •
IC SC
• •
ri
••
Inte
rna
tio
nal Trade Commis
sio
n, except as note
d.
=
U 64 0 O
1/ Not available.
0 c U 64 = O
ri 0
U
Oe 00 ON
.0 0 C
C O 1-7
.1.) a s • 0 O 0
C • cd O I-7 U
• C O Cd
CA CSI .0 00 L4% 0 O H
.14
•
C 0
1-6 M I
64 0 0
- 0 m 0 'CI I',
N Of 00 O I fa 00
r•••
o1-4 r4
• 1-1
0
0
•• •• •• ••
co cr. ri
unit value
.7
ed
0
cv Oo cr1 ri
OI 0)
0
•• •• • • • •
. 44
•• •• •• ••
64 0 O
r4 I HI v-4
•• •• •• ••
••
••
SC SC 4C 1K IC SC SC
ID
r-1
* 4C SC SC * * SC
•• •• •• ••
IP• I
• •
•••.
•• •• •• ••
••••. ••••■
r41.-11.4
•• •• •• ••
rII ••••. •••..
0
at
0
0 •
00
cd
C
CY
9. Digest No. A407--Con.
I I I
r+I rII1.4 ri
Unit
Valu
e
•• •• •• ••
r4 v-II r4
SC SC SC *
SC SC SC SC SC SC SC
•• • • •• • •
'41 ri I 1.♦
•• • • •• ••
•••. HI v-11,-1
•• •• •• ••
•••■ ••••. ••••.
I I I
SC SC IC SC IC * * IC IC
SC SC IC dC OC * SC
• • •• •• 00
I I
•• • • •• ••
I I I
•• •• •• •• •• •• •• •• •• • • • •• •• •• •• •• • • • • •• •• ••
OO ed
ri Cd
0
r—i
0

it 41
SC IK
Internationa
l Trade Commissio
n, exce
pt as note
d.
0
O
0 O
1/ Not avail
able.
\ \ \
^I ?41rII r•li r.11 1-11
•••• ••••• •••• ,-41 v-41 v-11 v-i
•• •• •• •• ••
0
••••• ••■•„, •••,.
I-41,411-11,-;
•• •• • • •• •• •• •• •• •• ••
1 1 1 I
•• • • •• •• ••
SC SC 4C *
* *
IK * * * * *
IC SC
.• •• •• •• •.
IC SC SC IC SC is * it it 4C 1C K
• • • • • • • • • •
4C 41 4C 4C • * IK *
• • •• • • • • ••
SC IC 4C 41 *
SIC
•
4K K K
SC 4K 4C * * OC * * iC SC SC
•• •• • • •• ••
•••. •••• •••• •••• v-11 "41 9-411•
•• • • •• •• ••
•••• •••• •••• 1-411-4 1 •-41 1-4
•• •• •• •• ••
• • • • •• •• ••
••••• ••••• ••••• "••• 4.414-11 r-11r-1
•• •• •• • • •
••••• •••.. v-41,-41 v-t11-4
•• •• • • • • ••
••
•• •• •• •• •• •• •• •• •• •• •• •• •• •• •• •• •• •• •• •• •• •• • • •
0•1
owl
4.1 C Cd
0'
••
Unit Valu
e
••
••
4♦
••
••
4-4
••
01) 0 let
Le%
co
co
O
O 1-1 ad
0
•0
Lel
0
•
te%
O
td 4.) O O
* * IK * * E+
SC SC SC SC IC * *
IC IC SC SC SC * SC *
4$ is *
* * 4$ 4$
* * * 4
••••• •••• •••• •••• v-41,-41 ,41
•••• ••••• 4-11r41r11 r4
co 1-4
Cn a) C) to O O
r-1 ed 04
•••I 11:1 •• •• •• ••
C.)
csi co ✓l
•• •• •• ••
co
ri
•• ••
0 CO
4-4
•• •• • • •
o• •• •• ••
O 0
unit valu
e valu
e in
do
llars
C O 1-2 .4 1
• o E cd O 0 • C • 01 O I-a c.;
14 o ed
c4.4
Ca Cs4 .1.1 00 Ls Os
E C
• 1-3 M 1
$4 ed
• C• O 0
r•1
O .C1
10 Digest No. A407--Con.

♦ r4 ril r4
• • •
♦ r4
•••••• ••••• 1-11 ♦
rt ♦
11 Digest No. A407--Con.
• • • • • • • • 41 • • • • e •
•• •• •• •.
All countr
ies
iC
iK it it IC
iC * ♦ C
C O * iK 0 C.) IC IC IC IC
ri IC * * rl 4 'C *
1/ Not avail
able.
: dis
trib
utio
n
C
a.
Co
C
1.7
Cd
C Cd
♦ r4
♦ r4
♦ r4
♦ f.1
••■,, ,-I rI
♦ 1-1
• • • • • • • • •
La O ♦
r•4 ••••• ••••• 1-41 ri
••••• ••■•• 4-41 ri I
♦ r-I
♦ r ♦
r
▪
ft. it
• •
is
IC SC
• •
it * iK 4C IC
CO
4-4
• •
• •
0 r4 1.••
•••• rl
• • •
♦ r.
• •
iC
iK
• • •
•••• •••• r414-4
• • •
.• • •
* * 4C 4C IC is C
0 0 0'
Internatio
nal Trade Commissio
n, excep
t as
note
d.
• • •
♦ ••••• •••■
1-4 I 1-41 0'
• • • • •
♦ •-4
••••• ••••• 1-41 ri I
♦ 1■♦
• • • • •
••••• •••• •-41 4-41
0
0 O
value
in do
llars
)
•••,„, T•i
sc
• •
• •
• •
ri
• •
♦ r4
• •
inclu
din
g de
sig
nate
d
VI 00 Cd • r4 %.• CO 0
•0 rl Le O 0•A
Cd C =
• = O 0 .01.2
'0
• Cd
0 00 .4.) LI 00 O f••••
ve•I
• VI C/3
4.)
•• 0) 0
5 °
▪
,42 0.0 0 0. 0 ,-♦
•
v-♦
Co r•••
• • • • • • •
C)
O
Co
1-1
• • • • • • •
0 Col 0
f•••• rl
-1y ao
O 4-4 O

Januar
y-Ju
ne 19
83
inclu
din
g de
sig
nated
• • 00 •• ••
.r4
crs M 0%
ra ‘-4
• •
ra
• •
rI1 ,4
• ik • •
••••• 5-11,-11
• •
CO 0 irs
r..
44 4' 44 4'
.4 .4 .4 * •14 M If
• • O rl
44 is 04 44
44 SC 44 .4.4.4 .4 .444 4'
14 14 44 44 44 .14
co
co
0
1-♦
•• •• •• • •
r-4 ri rd r41 •••„
•-41 1.4
• • •• •• ••
Inte
rnat
ional
Trade Commis
sion, exce
pt as note
d.
0
4
N. ri 1-♦ ri \
H1,41
•• •• ••
0.5
0
(11 r-4 1 1--1 ••••
•-3 1 1-1 1 r-♦ CT N.
•• •a •• •• •• •• •• •• •• •• •• •• •• •• •• •• ••
••
04 0
Li
'X X 0
• X X X
r.4 4' * 44
4 *
1/ Not
avail
abl
e.
All countr
ies
0 0
44 44
44 44 44 *
* * * *
44
.1.1 owl i•••■ fol
C ri cd
• • 0 M 0
'0 4.1 •• •• •• ••
C.) a)
z 4.) 1-4 4.1
a1 0 CO

Digest No. A501
N • -3) 00 0
VI Li CT 0 • 0 *I 0
0.1 6 C
.44 OA
N 0 01
0 44 .0 C./ 41
• • • • • • • •
to
0
ce
CO I un
1.1 c0 cr,
.O • 0
M 7
4 g>te ao
0. 0 1., 4,
0 0 of r-I 0) 01 44 14
41-. 0
V 0 03 • 0 01 0 0,
0. 4J E C .0 0 0 0 La
CD La 0 4)
••• 0 0 N N co 0 00 00 01 T 0. • .N m vI
• 1) 0 0 C 1.1 rI
C
01 • 1.. CO 4 r•I 0 0.• 0 0
o 3.) 0.
•I0 ••-, +I7
C 10
0 d 0 •
G..) CO
CO ce, 1•4
•
0 •
.43 0
*11 I. I+
0 X in 41.1 1 1.4 +1
e 0 to • •0 0.
0 0 414 0 0
1.
ta ea to la 01 m el
040 4) 0 0 4) 4)04 04 04 04 040.
CO N N 0. •O 0 CT .0 O. VD .- rl 3•I 3.4
Al 00 .0. co
+ + + + + +
•14 44 •• At V10 IS Ire V gt •0 ite 10 in An 0, In a to to in to IA Os in en 1.• ,-.1 *1 N N v. 14
+ + + + + +
10 .0 V 1,0 V. pc .6c1 g :i g : g :: g .0 In .0 N 40 N
.-I ri 0 0 0 0 0 0
+1+ .0 + et + ipt + et + 1t + ig
N N N CV li• NA 40. • V • V • No• • V • V • IA 4fff JO CV N. N N N Cd N .0 N N N
•••■ 0 0 0 0 0 0 0
+ t,t + + 0 + ye + c•I en en cn en m
.• • v. • ••• • + • -I. • Ne• •
N 1••• N 00 N N N N 40
40 0 0 0 r. 0 0
+ ye + irk + en + se +1,e+ ve
N Cn en en m 01 ilA V • NS. • V • •• • •41. • 'V. • oo ■co N CO N CA N 1•1 N .0 N 02 CV
10 r-1 In 0 0 0 ri 0 0
+it +tot +10 +et+ se
a a a a v. • V • va. a V • V • Na• •
41. N 03 N O. • N N 42 N 00 04 • N
r•I Y1 0 0 0 o-1 0 0
+ ot + ee we +we +K + et .0 40 •O 41. sr •W
•10. V V • V • + • Ni• • li. • 10 • oto r. .0 N 00 Cs' N en C‘i tONNIN
10 .-I tn 0 0 ■••I r4 0 0
R R
e w N 111
e e .7 .417.e.ei
el N a tt•
In T . . . .
• • . . . .
N N N M N In N N N
V VI + + :41 • + + CO + pl +
< < V • •• -at i 0‘. •44. • 0,
cp. se 4, v n-o a. so
0 0 0 0
+ 0 +0 + 0 + te + 0 + 0 ,-. .4 ,•i .4 ,-■ r•I
‘1. .0 V • V • V. • NV • ll• • V • 47 00 .0 N ‘Co N NO N N N .0 N 40 N
.• 01 0 0 0 0 0 0
.. .. .. .. .• •. .. •. .• .. .• .. •. .. •. .. .. •. .. .. .• .. .. .. .. .. .. .. .. .. .. .. .. .. .. .. .. .. .. .. •. + 0 + Ire +we +tre + 0 + 0
.4 ,-4 1-1 1-1 *1 *1 ■1 •N •N • V • .1* • V • V .- .0 • ♦ .0 N .0 N N N CO N .0 N *0 N
,♦ cir 0 0 0 0 0 0
••• 1.. 0
co 0 m 10 O.
10
4) 4) al 0 .0 V
.• V la 0) 4 .0 o E r-I o C
0 0
O
V . co 14 N V
0 '0 Lo 1.. II 0 0 • 41 0 0 I - 0 0 0 0 I • • • Lo • 7 4) 0 0 • • 4.4 •• 0 ..... 0 a. le .•. •N •N‘O NCO 0 0 0 A •.. 00 0 N CO 0 0 AO yell e la 10 N *1 41 0 1'4 0 N * .,C •• 0 •0 r-4 • r•I • 0 03 C •
X 0 0 0 4) • X 0 0 W 0 0 CA 0 IA m .3.1
•••■ 4) .7 I) N 0 4) .-I 4 N Ca *0 la •• 0 LI 0 4 la 0 la 0 00 •• el • 41 164 44 41 0 SI 0 0 ..1 7 V 0 -V 0 • 1-1 0) • ... 0 • 4.1 .... 0 .0 0 4) 0 .0 11) .0 N • ••••• CS 0 0 +I 0 •••1 4 JO .0 0 •••• > OP * +) * +) 0 * 0 .0 * * CS * 0 ea N 0 .0 • C 0 9-1 0. • •••01.0414s0 14•14+0 1440 .000 0 0 C 0 0 14 444 1 IA O.
0 . 0 40 . co • 0 0 4) 0 41 •••■ la ••• •..• 0 N 0 VI 0 la 0 O. 0 la 0 01 0 6 Os * .41 Lo > 4) • d 41 • 00 41 10 4) • 10 4) IN d • •... 0 0 0 an 0•••■ m 1.. el IA 0 0 0 o oeroorne....e-00.0e0•00•00 Cr 1.1 0 04 r`•
1. .-. 44 .... d V d fa. 1.4 ee• ON 0/0.+1 0•.-1 0 00..00..0 m04.1 • LI 44 OD 0 M 0 0 .-I IN LI ID 60 40 1.. 0 4 4) .0 La 4) 14 .W 00 0. N 4 01 COMCCI. ... 40 DO 0 0 4) • C .41 N 0 41 1.. 0 7 •• ■ 41 c)04.••-.0...es..0 • e 4) A d 0 40 •• V 0 V ...00....0e ,....0004,0eocee000e...e +1 4> 4 .11 60 4) ..= 0 • 0 g.....e.o.e A 0 •C A 0..0 .0 a. d .4 d 0 0 •... d .0 7 d 0 A 0. 41 114 0 0 0 4) C 0 V +1M 44 ..... i V V 0 10 110 be 4) 0 0 0 60 0 .0 M0) C 0.0 41.1 00 0 .•..I 4 ... M .4 X X X X •••• X 0 A et+0 IN . Ca .-1 0 0 0 4) 4) 0) `-'.... 04)... •4•000,.4, Mi M 31
41040107.0 C.)0
fa +1 ••• too A to A to 0 d
,•♦ CO
0 P. N .-1 et ul r•-• N 41 41 N .0 P. f•-• r•-• r. 0, O. 0
0 - N N N N N N N CN 41 4, Or .0 .0 41' 4t 44. 411. 0 on In on VI In to on on 0
IN
O • to
end of ta
ble.
4.)
.• • • • • •• •• •• •• •• •• •• • • •• •• •• •• •• •• •• • • •• •• • • •• • • • • • • • • •• •• .•

D/ .0 41 C O 0 C./ a.)
co
O oD O.
01
X 0
X la I ...I .0
O 0 • • O.
0 cw 0 0
Descrip
tio
n
'0 • 1 07 co) r•-• U U • ••••. =7 r7 en
o o 0 1.1 La +.1 12. a 0
0 •• •• •• •
cv • .0 CO 0
• CO 4 0. 0 O • o r0 O X 7 O.
E C •-•1 44.
• 1
▪
-1 OD 0
N 0 0 0 Dao
0 = 0
C..) Of la
A- ce
1•4
02
oo
.0 • 0 0
X I-3
co w 1.1
▪
Da O 0 0
▪ 4.1
•
La 4, W o
01
00
•
Ow O
.0 a•0 0 •co
uw 01
• F C cc 01
•0 04 41 O 4 1+1
C.1 0 v+I
a./ • La
r4 O 0
+ +
v40' Ipt 04 Ln co tri
N N
. . . . +
▪ •.• . • •0 •
V.1 1. N
0 0
+ Pe tre
• N. C1 N
O 0
+ •. + ;
▪ N
pi N
N. • CA N
o 0
O-
+ 1;C. t en en
0 • + • c0 N N
O rl
+ It + en el
•1i • `V • N 1•4 N
0 r1
+ o
•
t + •ct
▪ • gb, CA N N 04
O
oo CA 1•1
N co
co
K + •cr 47
+ • gli• N P1 N
•■••••
,r$ ZV !!!.
N O. N N.
+ Cc/ + P.
. 0 '4/•
rl
04 0
4 CO + la 0 I • 0 Of • 0 C. 0 0 ..► I 1+4 14 4. 14 •••1 O 00 g I. OD 0 0 O 0 0 •
..-. 0 0 v-I CO .-.0 ....4 a) .0 ./.1 ••4 4) 0 N • 0 41a O .0 .0 0 •.. C C • C 0 0 la 0 .4) •
O 110 + 0 0 C./ a/ Da 17. L e • • 0 0 12. Da +a 7 0 00 0 .. 0 04 0 1 .0 •
Sr • 17 0 • • I 17. In Le +a 0 7 PO La ••••• 10 • N. 0 '•1 0 O 2c c:. ,-1 .0 .. c:. • e (..■ 0 .0 0 0 .•-• 0 •. .o.) 4 in 14 4
I IL > r ' 7. 4 g 4 . : g f0 0
> ' 0 • 5
..I. • ra g 0 ..‘ .". 0 0 0 4 V ••••• •••• C.1 •-• 4-.1 31
O .0 0 0 a a+ 0 .0 C.3 04 .0 • 0
..4
.0 CO CA CA
N a 04 11.1
1/ Rate effectiv
e prior to January 1,
198
0.

3
Digest No. A501--Con.
II. Comments
Description and uses
The articles under consideration for GSP treatment are certain colored
sheet glass classified in TSUS items 542.57 through 542.98 and defined as
colored 1/ blown or drawn glass 2/ (whether or not containing wire netting),
in rectangles, not ground, not polished, not pressed or molded, and not
otherwise processed, weighing over four ounces per square foot.
Sheet glass is a type of transparent flat glass with a smooth, fire-
polished 3/ surface produced by various glass-drawing processes. The drawing
method leaves faint ripples on the surface of the glass which to varying
degrees distort objects either viewed through, or reflected in, the glass.
This characteristic of sheet glass tends to exclude it from use when large
pieces are required and an oblique angle of view is likely. Sheet glass
dimensions vary in width from 60 to 120 inches and in thickness from
approximately 0.026 inch to 7/16th inch. Less than 5 percent of all flat
glass produced in the United States is sheet glass. 4/
1/ Colored glass is unprocessed glass whose light transmittance is retarded to varying degrees by coloring agents or opacifiers within the glass, and not by treatments or irregularities of the surface of the glass. Such glass may vary from opaque glass to glass with a transmittance of about 80 percent of normally incident light of certain wavelengths. The colors most commonly manufactured in the United States are bronze, gray, and green. Any desired color may be produced by altering the coloring agents in the batch of raw materials.
2/ Sheet glass is identified in the TSUS as "drawn or blown flat glass." All sheet glass today is drawn; blown sheet glass is now obsolete.
3/ A fire polish or finish is the brilliant surface achieved by allowing the molten glass to cool to rigidity without coming in contact with anything solid.
4/ Other types of flat glass include float glass and plate glass. Float glass is produced by floating molten glass over a bed of molten tin. Plate glass is manufactured principally by using the rolled glass process and 6^ tw 1n tho ourfatto if Mit 61685 td +tory Smooth, flat finish. Certain float and plate glass are covered under a separate digest.

4
Digest No. A501--Con.
In recent years, sheet glass has been displaced by float glass in the
principal markets, including the automobile and construction (both residential
and commercial) industries. Sheet glass continues to be used in certain
specialized markets, particularly those where the use of float glass would be
impractical due to factors such as physical constraints on the manufacture of
certain glass thicknesses and increased production costs associated with low-
volume orders. Colored glass is consumed principally by the construction and
automotive markets; the narrower thicknesses are used in such products as
lenses for protective helmets and goggles.
U.S. producers and employment
At the present time sheet glass is produced in the United States by one
firm, operating one plant in Pennsylvania. The average level of employment at
the firm declined during 1980-82 (the most recent data available) and was
estimated at * * * in 1982. One other U.S. firm was engaged in the
production of sheet glass at various times during the period under
consideration: early in 1978, and from June 1980 to October 1981. No glass
is being produced by this firm at the present time. It is believed that these
two firms produced little, if any, colored sheet glass during the time period
under consideration; their output consisted of clear sheet glass.
By 1978, almost all domestic sheet glass-producing facilities had been
converted (or were in the process of being converted) to float glass lines,
with the exception of those operated by the aforementioned two firms.
Consequently, it appears that there have not been any U.S. producers of
colored sheet glass for commercial use during the subject time period.

Digest No. A501--Con.
U.S. consumption and production
Estimated apparent U.S. consumption of certain colored sheet glass, which
is believed to approximate U.S. imports of this glass, rose 20 percent in
value during 1978-79, then fell 40 percent to $3.7 million in 1982 (table A).
The decline in apparent consumption is believed to have resulted from a
combination of factors, including the greater substitution of float glass for
sheet glass in the principal markets and the reduced demand from the
construction and automotive markets, which are heavily affected by
fluctuations in the economy.
U.S. production data for certain colored sheet glass are unavailable, but
production is believed to be negligible.
U.S. exports
Estimated U.S. exports of certain colored sheet glass are believed to be
negligible.
U.S. imports
U.S. imports of certain colored sheet glass fell 40 percent from their
peak value of $6.1 million in 1979 to $3.7 million in 1982 (table B), due
principally to declines in imports from the Federal Republic of Germany and
France. U.S. imports rose to $3.0 million in January-June 1983, an increase
of 33 percent compared to the corresponding 1982 level. This growth was
largely accounted for by increased imports from Singapore and Mexico (the
petitioner for GSP treatment). Major foreign suppliers to the United States

6
Digest No. A501--Con.
in 1982 were the Federal Republic of Germany and France which together
accounted for 84 percent of U.S. imports by value, although this share was
lower than that recorded in the previous year.
U.S. imports from GSP countries fell from $412,000 in 1979 to $1,000 in
1981, then rose to $414,000 in 1982 (table C). In that year, imports from GSP
countries accounted for 11 percent of total U.S. imports by value. Imports
from GSP countries continued to rise in January-June 1983, reaching $1.2
million. During this period, imports from these countries accounted for 39
percent of the value imported. The principal GSP sources of U.S. imports are
Singapore, Mexico, and Colombia.
The nature of the sheet glass production process (and the associated
glass drawing operations) may result in significant quality differences in
pieces of glass with regard to the degree of distortion of objects viewed
through the glass. Although there is virtually no U.S. production of colored
sheet glass, U.S. glass manufacturers do produce colored float glass that
competes with high-quality, distortion-free imported colored sheet glass. 1/
In this instance, both foreign and domestic glass generally compete on an
equal basis in terms of quality, whereas a favorable price differential and
satisfactory customer service can be determining factors in the decision to
purchase the product. Because there is no domestic production of colored
1/ This competition is limited to glass thicknesses greater than 1/8-inch. Although there have been a few small-volume production runs of thin glass manufactured by the float process (primarily on an experimental basis), certain technical adjustments to this process must be accomplished in order for it to become a viable method of thin glass production.

7
Digest No. A501--Con.
sheet glass, the majority of imports under the TSUS items being considered do
not compete with any U.S. products.
Position of interested parties
The petitioner, the Government of Mexico, requests that certain colored
sheet glass be designated as articles eligible for duty-free entry under the
Generalized System of Preferences. Vitro Flotado, a Mexican flat glass
producer, claimed that the designation of the subject flat glass as
GSP-eligible will have no effect on the U.S. flat glass industry. It was
alleged that imports of flat glass into the United States from all sources, in
comparison to U.S. manufacturers' shipments of flat glass, are negligible.
PPG Industries, Inc., and AFC Industries, Inc., both of whom are U.S.
float glass producers appeared in opposition to the Mexican government's
request that the subject flat glass articles be designated as eligible for GSP
treatment; they assert that the domestic industry will experience price
suppression and depression, as well as lost sales.

8
Digest No. A501--Con.

9
Digest No. A501--Con.

10
Digest No. A501--Con.
III. Statistical Data
Table A.--Certain colored sheet glass: U.S. production, exports of domestic merchandise, imports for consumption and apparent consumption, 1978-82, January-June 1982, and January-June 1983
(Value in thousands of dollars) ;
Period: • . .
Production 1/: Exports 1/: • •
. : Imports : : •consumption 1/ :
Ratio (percent) of imports to consumption 1/
1978 : 2/ 2/ 5,104 : 5,104 : 100.0 1979 : 2/ : 2/ 6,129 : 6,129 : 100.0 1980 : 2/ : 2/ 4,109 : 4,109 : 100.0 1981 : 2/ : 2/ 4,195 : 4,195 : 100.0 1982 : 2/ : 2/ 3,706 : 3,706 : 100.0 Jan.-June: : :
1982 : 2/ : 2/ : 2,256 : 2,256 : 100.0 1983 : 2/ : 2/ : 3,011 : 3,011 : 100.0
1/ Estimated by the staff of the U.S. International Trade Commission. 2/ Negligible.
Source: Compiled from official statistics of the U.S. Department of Commerce, except as indicated.

C O
C 0
L 0
40
O es a.
0 •
0 re; 4-
• 00 0
UI
ir•••
cy C
C to LO 7 0
-'")
OII o
O AI C
.CC P••4 tO
01 .0 C
O II
0 U N
00 C Cr•
•••• ea 40 0 • C O a v•-•)
al
•
—4
to I—
••■
00
•• •• •• ••
00
••••
•• •• •• ••
00 4•••
U
tel 00 LO
7 C
•• ••
al C 7
IO
C ra N 00
•• •• •• ••
N 00
by prin
cip
al sources,
1978
-82,
11
Department of Commerce.
• 0
=
0 X
4- 0
0 U
0
.4+ IO
0
•••• LO -
U
4- 4- 0
0
0 13 0
c a m E .0 0 -1•1
0 —
in 0
01 U L
• . N. 0 In
Digest No. A501--Con.
r••• •-• ••• I Ill o•^covo•-- Ill
— in m ••••
.0 In N
N
O
O
N
.0
.• •• •• •• • • •• •• •• •• ••
oschmmlei I 40.00 .Jttl00 00 m 441
gm.
•• •• •• •• •• •• 00 •• •• ••
N to 'sr N W W s.0 CT 0 re/• •'"
.„D
N
• • • • • • .• •• • • •• • . •• • •
M 00 I r. ^ I 00 I .1 ••• M ..rD
to N. I 1•••INI
N ■ ■
NM I N I 1 P. .0 .1* cr•
•• •• •• •• . •• •• •• 00 ••
to N. INI I \ 0. 00 ^ Os ...T... 0
In
•• •• • • • • • • • • • • • • • • • I I I I I I I I I 1 I I I 1 I I I I L. •0 I I 1 0 19 E L 01-C L ola 0.0 C+'0 0010 >0£C001.-
C IV X •••4 a ••■
••••• al 0 tO 01•••4 lL U. 0 ►-■ E C-) =

12
• ■•
••
.
•• •
•• . ••
••■
IA
.s.
CP,
4' I.
t.
•• •• ••
•••
00
•• •• ••
,d•
•••
•• •• ••
•
42
•• Oa
A 4# a
0 0
1. 4,
TS
o a CL 0 E
0 z•
a 0 0 '0 O
.1) N
••
••
••
••
o.
.4
4#
a
•• ••
MaQ
^ K1
•• ••
4' 4' O.
,r
• • ••
•• ••
• • •
I
•• 00
AP
0
0
4L C 0.
O 0.- UCX..
•■
auEo
ozo=c.)
"1 ,7
•• ••
n^
rel
*4, 00 r1 .0
•• ••
•• ••
• •• •
•• ••
0 .0
OY
• 0
.- 110\11
1 11 111
I 1.- 411r-I
•• ••
1 IA
•• ••
.43 S.
•• ••
•• ••
MCI
• • • •
OW 41 C
C
01.0 fa
••
••••••13..-
•• ••
t I
•• ••
I 1
•• ••
•• • •
• • • 00
••
OC
C•-1
C L .4 a.
•• ••
re)
••
I
•• ••
•• ••
• • ••
•• ••
.c O
40
•• ••
to)
•• ••
I
•• ••
I
•• ••
I
••
••
1.
0
O U L. • E
0 . 4.)
• 4- 0
4' C •
4,
a 0
CI
O
0
• U
• O. 4'
40
4. 40 H- C
0
U E 0
fa fa -a • 0
00 In ••
• C C 0. I10 E LL 0 40
11 0 0 0 01 01 U
■I -I 1. 2
■ \ -KW
fe. Ob
1.
3 0
a.
12 111
C 01
of C
U C
L.
•0
O
-4
3
C •••
4# 1.
U
.0
VI .40 t. O 0.
• tn
••1 Pn olq
O.1# •••
O 0 C
111
0 L. 0 C
o -, U
C ••• • C
4# 1.
N (..)
O
.0
I•••
S .
C 1-1
•
0 40
•• •
L. O a
40
U t- o
•• •• •• ••
,000 do
llars
)
O 3
I1
•• •• •• ••
•• •• •• 00 . ••

•0 in .0 4) • N
• CO 7 .0 0 O 0 1-4 La Li C
0. ••• C 0
N N 0 • CO 0
0 V 0, 0 • 0 r•I •
O CU -I E c
• • • • • • • •
• • • • • • • •
V.
E O 4,
Le 4.1 0
• o
O aa 4) L- O A.• • C o
C.)
N ce co
•-• • .0
O 0 •••• 0
1.• L. O to 0.
•
to
• • • • • • • •
1.
0.
•••
CI • ••
4.4 •40
OD •rd 0.
• •• aJ lo
0. 0
• •• ta la
eO .0 .0 to
.4 o 0
6 c • .0 ▪ •
• •■•. O V • ••0
Ca
2 in
' • 14
Description
0
11)
91
•
I to i to
•C • •••• C ••-•
• Le ).
tD L.
••■•■ 0
0.• 0
•0 .0 4)
La 4.1 O 1)
9) 01
* r-I
.0 • la
r. OS 0 U
•0
Oa o
f•-• CO eT
• • • •
co
1/1
•er
en *0
•-•
CO 0'
C O
ro .0
0 CO a)
'10
I. (•••
o
o
t..
.•4
46.1 O
• •0
co O 0 9-1 0
Lo •
1•1 0
• Ai C 0
1-)
0 .0 JJ
to 0 on
- 10 0. 4)
M> •••• .1.1 0 • E tD
414 0 • C
ID 0 •••) 4.) el a
OA as •••• ••••• 141 CM)
VI 91 10 to 91 *IA VI
CD 0) 4) 41 4) /"• 14 1. 94 0. OI O. O.
.. .. .. .. .. .. .. .. .. .. .. .. .. .. .. .. .. .. .. .. .. .. .. .. .. .. .. .. .. .. .. .. .. .. .. ..
1•••• •0 •••• 1.,1 0 •Cr •-■
••••• n CO N N CO O * N n N
Y V 'V •Ibt
1/1 N N
•
O2 0.• pt ea N N ••••. 0"
• V1 • Ill • we ipt N rn 01 0• te. V.
... •-■ on ten .•4 r., .••■ trt
.. .. .. .. .. .. .. .. .. .. .. .. .. .. .. .. .. .. .. .. .. .. .. .. .. .. .. .. .. .. .. .. .. .. .. .. et ve
Y e, + ++ •■••• az ire ■ on 4) NI no • Ire to v 0 • 0 •
N o• 43 1. m + +.• + 0
. .. .. . . .. . . . . .. .. .. .. .. .. . . . . .. .. .. .. .. .. .. ..
Ve III 11* ..4 U, VI
•Ist V te ••■ • •14 • V • ••••
NI r• .0 • ea o •-• o •c• 0
• • lee ni •-■ .0 o + v+• + 1-a 9. N
. .. .. .. .. .. .. .. .. .. .. .. .. .. .. .. .. .. .. .. .. .. ..
og te st en .0 0
V V V • VA. • '0 • ■ .••' 00
Ile on or0M0O00.
Pt0
NI • N oo n 0+ N+ ••• + N
.. .. .. .. .. .. .. .. .. .. .. .. .. .. .. .. .. .. .. .. .. .. .. .. .. .. .. .. .. . .. .. .. .. .. ..
Ile IA 111 •Cf 0 V
v• N
'V • 111, • • at •••• N 0 0 in 0 en NI • no • • no 0
N N n 0+ re + N + c0
. .. .. .. .. .. .. .. .. .. .. .. .. .. .. .. .. .. .. .. .. .. .. II4 lie le
V V we vt • v • no • ter n N r4 en 03 0 n 0 .4 0 Os 041 •
N esi OD 0 + 01 +N +7O
la la la .0 CO CO
oeOD
+ • V • V - 104 m en 0.• 0 en o
NI • N N CO + N + N +
• • • • • • • • • • • • • • • • • • • • • • • • • • • • • • • • • • • • • • • • • • • • • • • • • • • • • • • • • • • • • • •• •• •• •• la la 1114 ea Cl• Ce
.10. K nr. • -a • v. • N 41. .0 .0 en 0 I-I 0 a 0 •
NI • 0 N N 1•••■ +N+N+ 1.4
.. .. .. .. .. .. .. .. .. .. .. .. .. .. .. .. .. .. .. .. .. .. .. .. .. .. .. .. .. .. .. .. .. .. .. .. ge at it ire
Y ••• lie 0' CP. Os Os ••••• •Cr 0 0.• NI •
*0n0.000
N N CP• • 1•4 r•I + N + N +
. .. .. .. .. .. .. .. .. .. .. .. .. .. .. .. .. .. .. .. .. .. ..
,••• •-• ci c't ;,
N IA ire
en •-) N N 0 Pe • We • le ,::,
.0 .I .0 F. N .4 .0 r. •4
tal >1 Da + ta + La + >I > > C. la > > > 14
v 4 af• V 41•U, 1+. ••■• cf, v OD •••• • 1... ••-•• Iflo s, CO ••••• •
• 0 • •I r•I N 0.1 I-■ ,I N N ,I
L. 0 • .....• L. . .0 to 0.1 C .4 eo. N • 4) to U a a • • en .0 > 0) C a .0 0 14 ..0 CSI • 91 .... •• 4• 0 • ta ..• ,4 a) L. a) e 1 v• 0 e 01 VI V) tr. ea a a SD .0 •• 1•4 0 1.1 DI C • •••• ••• 01 to 1-, 91 • of 4) N
g X 90 C 0 0 C 4.) un ID on • ce 0 to 0 en 0 C at •••• 0 •• L. > •• en .) %A • r4C 11)014C10 CO.. •••• oe •• 0 0 0 0 .0 •••• 0 n 0 •4 Si 0 it tr) to .... C.0 .0 et C 0 3 A - N .0 • a. to U on > U en .0 C • I•4 *• 9)..LIIIIII) to .✓ 41 el I 0' * •• to 0 ••• '.... 0 ••• •L) • 0.000.004)01 60 OCeoN •enos • > .0 .0 •C N .0 tio I.■ 91
10 •• Li ••4 01010-C Cone an CO 0 o.• 0 .0 ♦•• i 4) CO
tia 9.4 * 0 %A .10 C) 01 ••• •• C LI 01 N 1.• CO 0 0 N • M .0 • > a e SO 44 0 0. to o 0 to C OD la CV at 0 to I • 00 C 41. C C a n go co 0 0 .0 c .• 0 .i., Ca et ••• C C en 0 > 01 ent to a r.. a C •• to .... I.. 43 N to Ai .0 .9• 0 to le to 0. ••I 10 •• •••• •••• •••• 0 0 0 0 •••• 0 11) to i • 60 U O 0 t) - 0 to it0 .0 .0 lo to) X C to > L. to to to .0 1• g •C > a eo re 1•••• 0 ••••
•••■ 0 60 .0 0. to 01 .0 7 .4 .4 .I.) •••• 61 0 16 6) 61 0 u 0 • ■•• U 0 01 on oc 0 on .1.1 C V & 41 VI. 0 10 91 0 > > 10 0 Lo 0 C 4 L. La .1.1 041.10••••COC.CloUC0 .2 0 0 a •• SI 0 .0 .1•1 on 0 o. 4t 0
... 0 ••■ 0 .0 .... ••.) es a) 0 a) La 0 > > 9) C ••••• .0 44 0 4) &L. 2 2 r... 0 2 0 0 0 •••
c L. 0) to to to 0 ... 0 0 0) 20
ea a 0 C la 0 0 oo -0 2 on 2 a i..• 0 to 0 0
e•t
• I en N 01 N N N en
en in m en V Se a V in an in e•■
en N CP• 0 0
m m en en a a a
N

2
Digest No. A502--Con.
II. Comments
Description and uses
The items under consideration for GSP treatment are certain float glass
and plate glass classified in TSUS items 543.21-543.69 and defined as
unprocessed 1/ glass in rectangles, whether or not colored 2/, not containing
wire netting in the uncolored glass, ground or polished on one or both
surfaces in whole or in part.
Float glass and plate glass are types of flat glass which have plane and
parallel surfaces and do not distort objects viewed through them. Float glass
is produced by floating molten glass over a bed of molten tin. Plate glass is
manufactured principally by using the rolled glass process and grinding the
surfaces of the glass to a very smooth, flat finish. Float glass production
is technologically superior to that of plate glass, which requires expensive
grinding operations to ensure a flat, distortion-free finish. Plate glass has
not been domestically produced for commercial use at any time during the
period under consideration.
1/ Unprocessed glass is that which has not been laminated, tempered, bent, frosted, sanded, enameled, beveled, etched, embossed, engraved, flashed, stained, painted, coated, ornamented, or decorated. 2/ Colored glass is unprocessed glass whose light transmittance is retarded
to varying degrees by coloring agents or opacifiers within the glass, and not by treatments or irregularities of the surface of the glass. Such glass may vary from opaque glass to glass with a transmittance of about 80 percent of normally incident light of certain wavelengths. The colors most commonly manufactured in the United States are bronze, gray, and green. Any desired color may be produced by altering the coloring agents in the batch of raw materials; however, U.S. manufacturers produce only those colors for which there is sufficient demand to make production economically viable. Colored glass, which represents approximately 7 percent of total commercial sales of unprocessed float glass in the United States, is consumed primarily by the construction and automotive markets. All float glass lines have the capability of producing colored glass, which requires only the addition of coloring agents to the existing batch of raw materials.

Digest No. A502--Con.
The majority of float glass is consumed by the residential and commercial
construction, and the automotive original equipment and replacement markets.
Because the major users of float glass are heavily affected by fluctuations in
the economy, demand for float glass is highly cyclical.
U.S. producers and employment
Float glass is produced in the United States by 6 firms operating
approximately 22 plants. Plate glass has not been domestically manufactured
for commercial use at any time during the period under consideration. The
majority of the float glass producing establishments are located in the
Eastern and Midwestern States, with Pennsylvania, Ohio, Tennessee, and
Illinois accounting for the largest share of industry shipments. All of the
U.S. manufacturers are integrated operations and produce float glass,
processed glass, and fabricated glass products.
U.S. employment in the domestic industry producing float glass has
declined fairly steadily since 1978, reaching an annual average level of an
estimated 14,500 - 15,000 workers in 1982.
U.S. consumption and shipments
Estimated apparent U.S. consumption of certain float and plate glass
declined irregularly from 3.3 billion square feet ($935.0 million) in 1978 to
2.7 billion square feet, valued at $978.3 million, in 1982 (table A). Because
the major users are heavily affected by fluctuations in the economy, demand
for this glass is highly cyclical. The decline in apparent consumption during

4
Digest No. A502--Con.
1978-82 reflects the soft demand accompanying the economic downturn. However,
renewed growth in construction activity and automobile production resulted in
an increase of 17 percent in consumption during the first six months of 1983
as compared to the corresponding 1982 period.
Paralleling the movement of consumption, producers' shipments of certain
float and plate glass fell 14 percent in 1982 from an estimated 3.4 billion
square feet ($983.7 million) in 1978 to an estimated 2.9 billion square feet
($1.1 billion) (table A). In 1982, the average capacity utilization rate for
U.S. producers, on the basis of square feet of glass produced, was estimated
at 55-60 percent.
U.S. exports
Estimated U.S. exports of certain float and plate glass rose 51 percent
from 178.9 million square feet ($75.1 million) in 1978 to 269.7 million square
feet ($138.4 million) in 1980 (table B). Exports declined 29 percent to an
estimated 190.9 million square feet ($106.0 million) in 1982, partly as the
result of reduced exports to Canada which also experienced soft demand from
its construction and automotive markets. Of the estimated level of exports in
1982, 50 percent, or 96.2 million square feet ($39.5 million), were shipped to
Canada. Shipments to Mexico represented 12 percent, or 22.6 million square
feet ($10.6 million).

5
Digest No. A502--Con.
U.S. imports
U.S. imports of certain float and plate glass 1/ fell from a peak level
of 85.6 million square feet ($26.4 million) in 1978 to 13.7 million square
feet ($9.6 million) in 1981 (table C). Imports rose in 1982 to 25.3 million
square feet ($11.3 million) due to increases in imports from Canada, the
Federal Republic of Germany, Mexico (the petitioner for GSP treatment), and
the Korean Republic. Imports accounted for only 0.9 percent of apparent U.S.
consumption in that year. In January-June 1983, U.S. imports were almost
triple their level (in quantity) in the corresponding 1982 period, totaling
21.2 million square feet ($8.0 million). The increase was due to continued
growth in imports from the Federal Republic of Germany, Mexico, and the Korean
Republic. Major foreign suppliers to the United States in 1982 were Canada
and the Federal Republic of Germany, together accounting for almost 62 percent
of U.S. imports by quantity.
U.S. imports from GSP countries rose from 234,000 square feet ($440,000)
in 1979 to 4.7 million square feet ($1.4 million) in 1982 (table D), and
accounted for 19 percent of total U.S. imports by quantity. Imports from GSP
countries continued to increase in January-June 1983, reaching 9.6 million
square feet ($1.9 million). During the first half of 1983, imports from these
countries accounted for 46 percent of the quantity imported. The principal
GSP sources of U.S. imports are Mexico and the Republic of Korea. Combined
1/ Float glass is classified for customs purposes with plate glass in the Tariff Schedules of the United States. Plate glass is now a relatively unimportant article of commerce and in recent years accounted for only about two percent of total imports.

6
Digest No. A502--Con.
imports from these two countries in 1982 reached 4.6 million square feet and
were more than 17 times their level in 1981; this upward trend continued in
the first six months of 1983, reaching a level approximately twice as great as
the entire year of 1982. According to industry sources, Mexican flat glass
capacity was expanded when a new float glass plant became operational in
1982. The Republic of Korea's first float glass plant reportedly became
operational in June 1981, explaining the negligible level of float glass
imports from Korea prior to 1982.
Float glass is a physically homogeneous product and quality differences
are minimal. Consequently, both foreign and domestic float glass generally
compete on an equal basis in terms of quality. Favorable price differential,
adequate product availability, and timely delivery can be determining factors
in the decision to purchase glass of like quality. In 1982, the average unit
values (in cents per square foot) of imports from Mexico and Korea were lower
by an estimated 8 percent and 27 percent, respectively, than the average unit
value of U.S. producers' shipments. Transportation cost can be a significant
factor affecting price; for example, the cost of ocean freight is believed to
account for 20-25 percent of the selling price.
Position of interested parties
The petitioner, the Government of Mexico, requests that certain float and
plate glass be designated as articles eligible for the Generalized System of
Preferences. Vitro Flotado, a Mexican flat glass producer, claimed that the
designation of the subject flat glass as GSP-eligible will have no effect on

Digest No. A502--Con.
the U.S. flat glass industry. It was alleged that imports of flat glass into
the United States from all sources, in comparison to U.S. manufacturers'
shipments of flat glass, are negligible.
PPG Industries, Inc., and AFG Industries, Inc., the two manufacturers,
are opposed to the Mexican government's request that certain float and plate
glass articles be designated as eligible for GSP treatment, asserting that the
domestic industry will experience price suppression and depression, and lost
sales. On September 16, 1983, PPG Industries filed a countervailing duty
petition with the U.S. Department of Commerce against float glass from Mexico.

8
Digest No. A502--Con.
* * *

. 9
Digest No. A502--Con.

10
Digest No. A502--Con.
Table A.--Certain float and plate glass: U.S. producers' shipments, exports of domestic merchandise, imports for consumption, and apparent consumption, 1978-82, January-June 1982 and January-June 1983
(Quantity in million square feet; value in millions of dollars) :
Year • • .
Producers' shipments
1/ 2/ - -
• : • .
Exports 1/ - • . • .
Imports : •
• .
Apparent consumption
1/
. • : :
Ratio (per-cent) of imports to consumption
Quantity
1978 : 3,391.9 : 178.9 : 85.6 : 3,298.6 : 2.6 1979--- : 3,296.3 : 229.5 : 29.3 : 3,096.1 : 0.9 1980 : 2,926.1 : 269.7 : 26.2 : 2,682.6 : 1.0 1981 : 3,068.7 : 226.7 : 13.7 : 2,855.7 : 0.5 1982 : 2,901.3 : 190.9 : 25.3 : 2,735.7 : 0.9 January-June: : : : • .
1982 : 1,450.7 : 101.1 : 7.7 : 1,357.3 : 0.6 1983 : 1,668.3 : 94.8 : 21.2 : 1,594.7 : 1.3
Value
1978---- : 983.7 : 75.1 : 26.4 : 935.0 : 2.8 1979 : 1,017.7 : 107.5 : 11.0 : 921.2 : 1.2 1980- : 969.4 : 138.4 : 11.0 : 842.0 : 1.3 1981 : 1,131.5 : 134.3 : 9.6 : 1,006.8 : 1.0 1982 : 1,073.0 : 106.0 : 11.3 : 978.3 : 1.2 January-June: : : : :
1982 : 536.5 : 54.7 : 4.0 : 485.8 : 0.8 1983 : 567.2 : 54.9 : 8.0 : 520.3 : 1.5
• 1/ Estimated by staff of the U.S. International Trade Commission. 2/ U.S. producers' shipments of plate glass were negligible or nil during
the time period under consideration. Estimated data on producers' shipments reflect only shipments of float glass.
Source: Compiled from official statistics of the U.S. Department of Commerce, except as indicated.
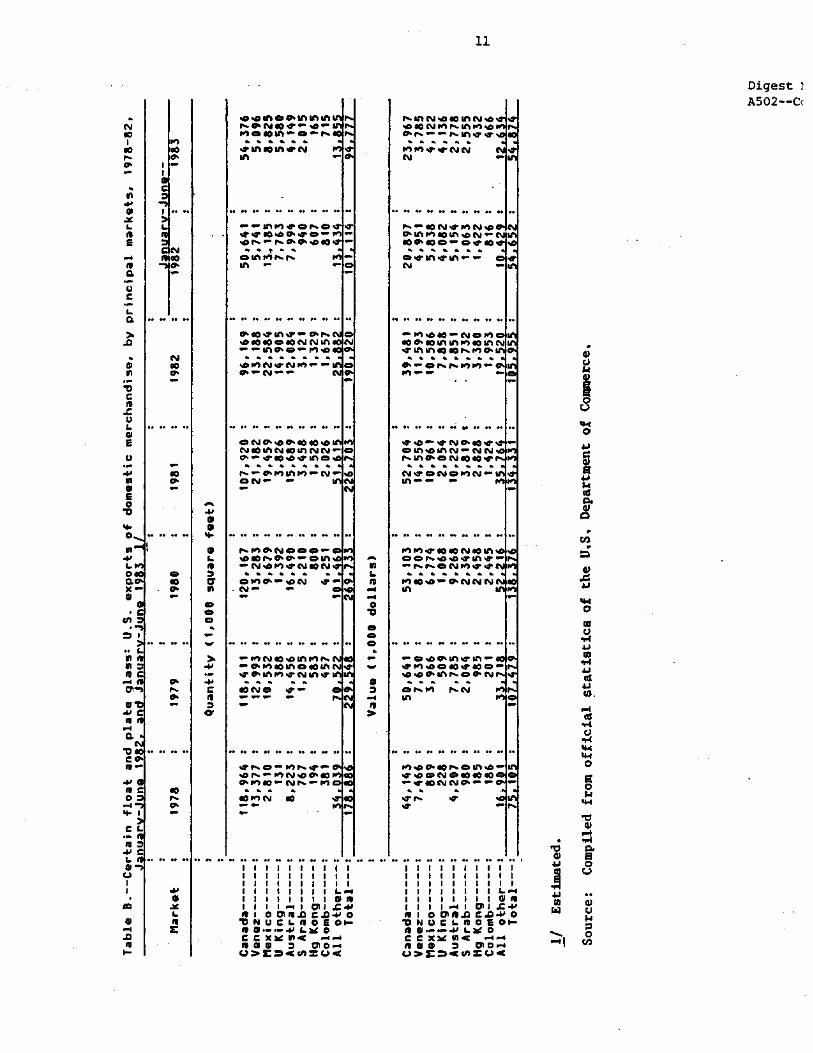
•• 00 00
t.
01 •••3
= I
111 0
C
0 • 3 WC to
low
•• •• ••
VO
O
▪
.
C 0=
4.
▪
I
10
SO
••••
4.1 ••
E
a
a
.0
• N d 00
C
I. of
E U
• •• •• ••
4,
0 E 0
* 0
4'
a X •-• of w
to
• to
00 60 ••
N 03 07*
11
P.MN.OWMN4, 4403NMI..MM.0
01MWWNN N
•• •• 00 00 •• •• •• ••
1...4 WNWWIN ■0 0.41 ,0100M.0N.- M0.000.4 0W1W
404PMWM. N w
. •• •• • • •• •• ••
."'10/43W...NOMO 030.10MMOI00MN WM010040r..M0.
Iy ww
d•
60 00 •• •• •• •• •• ••
'043 10.M.0 OU14301N.4 NN r..MCNONWOOW
N
▪
WONOWIN.4 Inww ...
••
04 00 0. •• •• . . •• ••
MMIWWONOWN
r0/00.00NNN In
04 00 •• 00 04 •• •• 00 •• •• ••
O •••
••
••
P.•
...40420•MWMOO W014300301000... .0.00.Mr.000.N
• •
=P.M 1..N In
•• •• . 0• •. ••
W.040NO0p0000O
J w
164 60 •• • • • • .60 • •• • •• •• •• . . •• • • • • •• • •• •• • •
I I I I 11 I I II I 1 1 I 1 0 M • Cl LW
M 0 0 MA C.OW 0 MNUCLMOE 014
CCXVIC104C MOO D 00.4 U>E04CO=OW
••
(1,000 dollars
)
.0.01/11o0 In P.O .N410.41
."1
▪
1140O114PN In
. . . . . .
WW03.00•W0...p. Wor... 0•4300 ..t. ■
00101,..P.
• •• •• •• •• •• • •
430450O50NNMW 4••••010.40*..M.0 ........
43, 01NWNM....•01
(1,008 square feet
) 60
*PO
41.1.
O
••
N
••
O
00
.0
co
••
03
• • •• •• •• 66 00 00 ••
ONO•450.0050.0 NtOMNO3MNN•'• Ch.-4.00.04'M=
•• 90 •• •• •• •• •• •• 00 ••
40001..0•0•.4 0M 4•4,443MWNION
O
▪
VICON Jw
• *0 so •• •• •• 06
..•01NO3.0MMr..
...00, M001t1OWO WO.MMWNOW
C ••
VONO Jw
•• 40 00 00 ••
.01...4 01N430•00
IS 49 do
ea N 00 01.••
4116.
Department of Comm
erce
.
=
4•
133
.54
iJ
co
aS
N
▪
.
1.4 03
.4 44 44 0
0 0
0
• .5.1 0. 13
" ••
■ tn

N O
0
II
•
0 U
2 0 0
fI 0. U
o.
.0
0
a E 2
0 U
L 0
0M 0.0 E a
• 0 NC • >
O • M M 2
00
.4JM
MN CO mP •
M W O C
7 W -)
1
• Li MM
L c W M 0 -)
0
fI
01 C
C
7
=
•• •• • • ••
N O C. •
U
O
40
•• •• •• 00
40
• • •• •• ••
••
• •
co
••
M
(1,000 dollars
)
O
0
••
0
••
••
••
0
••
12
(1,
000
squa
re feet
)
4.
C
a
N•01.0∎ 10N•• .4)N• AIMKINW moPMNM0
C.1•10 ,•
•• •• •• •• •• •• •• ••
M0.00.0. 0M0 M44•0.01•401•M WO%Le10.
N
• •• •• •• • • •• •• •• ••
0.004)11mm.0N r..inr....-4•./2 ■2•4•111 r...0% 110 1••••••
•
• • •• •• •• •• •• •• • • •• • •
N0.0000•00• P.04r4m•mm.s. p...04c1.0••N•
*OP,
••
0...40.40Ni.. P01141 SON
N
▪ •• •• •• •• ,•• •• •• •• ••
.10N•ec0nN• .040
• .rm
MN •
•• •• •• •• • • 00 •• 00 •• ••
W "' MINI01002a. .04nm000N0400. .acs...0.-p 00 - 42
40.0 N •.4D •••
.01,-.M010•NO.• cr440•N••Mo0
.0.
gloom
•• •• •• •• •• . . Oa ••
m.00.04nmNo NIO0.000NNO.0 n/-n•.O
•• •• • • •• •• . •• ••
NN•.00:4•N•
• • •• •• • • •• •• ••• •• .
• 040•MWn• 00c.)0404.1.-•No 0N.0•N •0.0
NM •
•• •• •• •• . Oa . •• •• ••
400N•P10000 • P..0Nr.. on." .0•••N MN
110
•• •• •• •• •• 00 66 00 •• ••
040•M• In004.1 N.r.r N.40c0
• .0N Mo.
----------
WW•04140or.•N.0 4....000.0•4=m411 • M.0•140
em .00 •
••
I 1 I 1 1
I I I I
I • 0. E .0
/0 0 GI 044 o MCMCOW..-0O3-
ca MML0.000 0 -54LNE1001=4C
••
• • O. •• • •• •• •• • •• e• •• • • •• •• •• 60 •• •• • •• •• •• • • I I I I I 1 1 I I I I I I I I I I I I I I L.-1 I I 1 L.-4
010 1 0
E CIE .0 -6+ M L 00204+0 MCMCOW-COw MMO..-- 0- CM MXI.,-4u.-4 M1L00001 -4 onu-oracm=.4
0 C)
a)
8
Departmen
t of
• CA
CD
44 0
0) W
Jd 01
os 4.) 011
.14 C)
.14
0
0 0
44
Ol
a
8 ••
O

13
(1,000 square feet)
O .0
CD
0,
N
N
O
141
O
440
N
PP) •■•••
N Pe) CO
N
N
N
N C>,
CO N
0 O 1.1
N
N
.00
0.4
110
0
• • • •
O 014.
N
N. CO N
M N
MMOO.," 111111 0 M
N N
Ill to O
O
• • • • O. 00 00
in
O 41.
CD
• • •• . •• 04 00 •• SO •• Of 00
• 0 •• O.414100 00414144 00 40 OS 00 00 00 0• •0
4141 4141 410 0• Of 0• 00 0. 0• 4141 00 00 0•
Nt 04 I 0.1 NO q•- I I '40) MnM^ N PO, CNJ
CO CO 0N ■ M11111 O1 NON O in 4- 4-
• • .1 .0 00 .0 O. 00 .0 Os. 44 0. 00. 00 0.
O 4,
O
•• • • • • • • • • • • • • 44 0 • •• 10 •• •• • •
O
• •
• • • • •• •• •• NI • • •• •• • • •• .0
N. W CO CO W S. I I W N.- N^ o wrs.o
CO
N
• • •• . 0 0 0. O. • • •• •• •• ••
."' IMI1110 0 401 10 400 MOAN NM •
v14"
00 00 40 00 O.
re,r0.00.- N ....== .0.00.N.-•
.
N
00 00 00 00 00 00 4141.. 410 00 ••
O^^000000 W to •-•
01,
•• •• •• •• .0 •• ••41 41 ...• ••
00 ^P .lOO MOP. N nN
qo
00 Of 00 OS 40
CON 000000 o 4- NUS
00 00 00
4:1
•• 00 00
O
N
C 0
0 17IW M
W M Co-0 I-OW
In L M CO 0
C
CT M
0 o o
2
I In • .1 L
L 0 M 7 E C oq
N CO ON
00 40 00 00
CO
40 .411 .1 .0
CO P
04 00 00 0.
E OJ
4./ )-1
P N
CI
4' C c O 1.1
0
CI 4'
C
0
0 C
..- 0 2
C
DI
OI L.
"0
L. O 3
C
4' L. CI U
In 4,
0 a E
In
=
01 PP,
010 41 ON
•••
a01 C.
"17 2 C
MC OM -4-,
C
411 C 4.0 L. 0N OW
ca CU
Department of Commerce.
•
•
01 .c
-o 111 U
4,
4, 111
01 L
444
a %i-
t" 10 • 0 CP
0 111
C C 40 M E .0 .0 0
In VI .• 1.11 N 0 0 al
L
N
Digest No.
A502--Con.
.. ...1 . .•iIn m I/1 PO cu 4.• 0$ -IJ
0.. 0 ..- 0 L W L W
W W 0 ... IJ .
VI In in In W '0 Cl W 12 M L. 0••• O. L Cl ... 0.. o 0. •L in o M L in 0. 0 -I' CLW PO L. CD 0. 0 W 0..1J CD L CD E -1 c o a - a m E -1 C 0 0 o- 0. M
• GI 2 0 re fl) C N tO I.> L .... 0 2 1.4 Od PD •C N VD C.) L. > o - c m c m al- m > o - c m c al 01• 0
O1 Cl ux1.•Erocc010.c L. VI 0 uxi.-E'ocCCZ.0 L 0 'D 170.00E0"- 4J 0 VI 17 0 0.0 0 E 0 ... 4.1 CI 0 Q. E be 0 ilt a > cn (..) o .0 o a E hd WIC C. tif) C.) 0 .0 L. NO V) W L. NO in 4.1 0 N 0 0 CD N 0 0


0
• 0.1 CO CT .1
fol 0
0 ••••
• •
0
441
13 R. 0
•••1
0
of
41•4 r
▪
. 14 CI
•••
0
.4f 04
.44
a 7
I. TSUS(A) item
TITLE:
Antennas
I-
O
40
In to
C•;
1.;
.0
• •
ot •0
•0
0
O 4.3
in 44 CT
% denotes percent ad valorem.
Z 1/ Rate effective prior to January 1, 1980
.4.. 0
Digest No.
A601
or. 12 O 0 • • GI 0
0 • o 7 Lo 0
Ir C O. SI.
• • • • • • : on 1/3/75
7 04 0 • 441 COO
0 I4 C0 0
M so
04 4.10
• 0 4/
.1 0 o Li 44 U 0
c0
0
.0 • • •
4.1
O
•
CO
M I -4 O 1 1.4 1•4
.0 • • C •r. CO
ra 4-1
O LI
▪ 4.) 41 w
Lf or 0
4.' to CT oto 0 v-1
04 0 4.1 O 9 01 ▪ 0 03
C• 44 0 I-4 O .of
01 0
04 O 0 CO Ir 4. CT
o .4 144 .4
4-4 • to
al 0
1:1
60 of CO CO
• 0 4•
C M r4
a 40
•
•
1980 • 1981
Description

2
Digest No. A601--Con.
II. Comment
Description and uses
The products covered in this digest are certain television receiving
antennas of a type not designed to be an integral part of a television set.
These antennas are "rabbit-ears"; roof-mounted, omnidirectional antennas and
"dish-type" antennas used to receive television transmission via satellite
(sometimes referred to as satellite earth stations). Not covered by this
digest are television antennas which are designed to be incorporated into a
television receiver, dish-type antennas used for satellite communication
reception, transmission antennas, and other types of communication antennas.
The subject antennas are constructed of various types of base metal and
used primarily in residential and commercial markets.
U.S. producers and employment
There are approximately 25 producers of television receiving antennas in
the United States employing close to 1500 persons. U.S. producers each tend
to specialize in the production of one type of antenna. About half of the
producers manufacture roof-top type and several of those produce dish-type.
Two producers manufacture rabbit-ear type antennas, exclusively; and the
others manufacture a variety of different types. In terms of sales, the
largest six producers account for about 90 percent of the domestic industry.
U.S consumption and production
The level of consumption of television receiving antennas to some degree
depends on the level of consumption of television receivers, which has
increased irregularly but fairly steadily over the past several years,

3
Digest No. A601--Con.
reaching 16 million units in 1982. This indicates that over 95 percent of the
households in the United States have at least one television set. The current
demand for television sets is primarily in the replacement and second-set
markets. As the latter market grows, demand for rabbit-ear-type antennas will
also grow. This is not the case with roof-top types, which generally can
provide transmission reception for more than one television receiver. Another
factor affecting the demand of television receiving antennas is the rapid
growth of cable television networks, which tends to moderate the demand for
television antennas. The most dynamic segment of the television receiving
antenna industry is the dish-type antenna for satellite transmission
reception. With most of the technical problems resolved, reduced production
costs, and increased broadcasting via satellite, dish-type antennas are
becoming a practical means of television reception particularly in rural areas.
Apparent consumption of the subject antennas decreased from $69.7 million
in 1978 to $59.4 million in 1980 before increasing thereafter to $67.0 million
in 1982 (table A). U.S. shipments followed the same trend as consumption,
decreasing from $72.6 million in 1978 to $61.7 million in 1980 before
increasing to $65.4 million in 1982.
U.S. exports
U.S. exports of certain television receiving antennas has followed no
discernible trend during 1978-82. Exports to the United Arab Emirates and
Canada accounted for 18 percent and 17 percent, respectively, of total exports
in 1982 (table B).

4
Digest No. A601--Con.
U.S. imports
Annual U.S. imports of the subject television receiving antennas
increased irregularly from about $713,000 in 1980 to $5.0 million in 1982 or
by 604 percent. Such imports were $1.6 million in. January-June 1982 compared
to $3.6 million in January-June 1983, an increase of 127 percent. As a share
of apparent consumption, imports increased irregularly from 1 percent in 1978
to 6.9 percent in 1982. Canada and Japan, together, accounted for 77 percent
of total imports in 1982. Imports from designated GSP countries accounted for
1 percent of apparent consumption in 1982.
While domestic and imported antennas of the rabbit-ear and roof-top types
are somewhat interchangeable, there are currently no .known significant imports
of dish-type antennas. Two reasons account for the apparent lack of imports
of dish-type antennas. These antennas are technically advanced and only a few
countries possess the technology to make them. In addition, these antennas
are bulky and not easily packaged, making the shipping very expensive. Until
the U.S. market becomes significant, it is unlikely that there will be a large
increase in imports of these antennas; and even then imports will probably
come from Japan or European countries.
Position of interested parties
The Government of Malaysia requests that certain television receiving
antennas be added to the list of articles eligible for the GSP. The Elec-
tronics Industry Association (EIA) in the United States has taken a neutral
position with this issue. This is partly because EIA represents not only

5
Digest No. A601--Con.
domestic manufacturers but also importers of the subject articles. Six
domestic manufacturers, accounting for over 90 percent of the industry, were
contacted. The general consensus was that imports of television receiving
antennas, particularly from developing countries, are not a major threat, and
so the domestic producers do not oppose the petition.
No submissions were received from other interested parties.

6
Digest No. A601--Con.

7
Digest No. A601--Con.
Table A.--Antennas: U.S. producers' shipments, exports of domestic merchandise, imports for consumption, and apparent consumption 1978-82, January-June 1982, and January-June 1983
Period Producers'
:
shipments 1/
•
: Exports 1/ : Imports : Apparent consump-
tion
: : :
Ratio of imports to consumption
1.000 dollars Percent
1978 72,603 : 3,594 : 1/ 713 : 69,722 : 1.0 1979- -- 70,298 : 3,939 : 1/ 1,390 : 67,749 : 2.1 1980 61,674 : 3,559 : 1/ 1,268 : 59,383 : 2.1 1981 64,338 : 4,185 : 1,163 : 61,316 : 1.9 1982 65,415 : 3,447 : 5,017 : 66,986 : 7.4 Jan.-June:
1982 2/ 2,074 : 1,570 : 2/ 2/ 1983 2/ 1,970 : 3569 : 2/ 2/
1/ Estimated by the staff of the U,S. International Trade Commission based on official statistics of the U.S. Department of Commerce.
2/ Not available.
Source: Official statistics of the U.S. Department of Commerce except as noted.

ao N 00,
N
000
OS
00 00 00 OD 00
a P
O
E
Digest No.
8
A601--Con.
O U
3 O 0
N co
a) 0 = ti
0
N CD
1 aD
a
el)
ea
•-1 ree 0.
0 .44 $.1 A.
.0
a
"o
U 1.4 w
U 14 4.) cn a)
0
rA
O a.
• ao .m
O •• O to ›, • 1.1 O 0 • z .w 0 O 0
1 1.
cU
4 0 E-1
N CO
1.•1
0 O
0
• N• CO
L. col
V w
O
•
CU
$.1
• co 4.0
1. ela
A o. o. • U
0 0 • 0
•
A
fw a
4.• 0 0 1-1
O 6)
•
co 4.0 we •4
4.4
co
A 4.1
0000P0oNm. WMpio. in.otnom In
a
PorNIft 0"IinIo"10 e ,-111h Wenin
N 00
•ONCOPIPPPOO p.PriPP.OnNw" P.CON
N 00 Pa
'0 0"COPI.OMP.1 PwInN""Nln
oreNOM.ONI coIf1Inero00
inor"' O
gm.
N4,040N∎ 0"4 o
"' W111 o" 0"On
■••
Po.CAMP.0%.'" 00WIN.OW"I
11111 1 1111
11111 1111.mt 111010 Lo....c4+
Cl 0 010.0101W0 MCOMCMWLOE MellomComa CaxmoUCLIOmi MAIM= •-020m1 0-2EL)=0,W4C0C
00
40 00 O
•
co In
1/ Less than
Sour
ce: Comp
iled fr
om offi
cia
l sta
tistics of
the
U.S. Depar
tmen
t of Commerce.

9
Digest No. A601--Con.
Table D. Antennas: U.S. imports by certain world areas including designated GSP countries, 1979-82 and Jan.-June 1983
Item : :
• 1979 • :
:
1980 • January-June 1983
1981 1982 • • Imports : : :
Percentage distributio
Value (1,000 dollars)
Gross imports : 1.390 : 1.268 : 1.163 : 5.017 : 3,569 : 10( 26 developed countries, : : : :
total- , : 732 : 618 : 847 : 4.010 : 3.010 : 8 , GSP countries, total----: 658 : 650 : 316 : 1,007 : 560 : it Mexico : 593 : 452 : - 58 : 650 : 348 : 1( Taiwan : 60 : 190 : 173 : 294 : 199 : ( Singapore : 1/ : 6 : 25 : 34 : 12 : 2/ Republic of Korea : 1 : 2 : 57 : 24 : 1 : 2/ Hong Kong : 3 : 1 : 2 : 4 : - : Panama--- : -: -: 1 : -: -: Costa Rica : - : - : - : - : - : Bahamas : - : 1/ : - : - : - Other GSP : 1 : 1/ - : - : - :
Other : - : 1/ - : - : - :
1/ Less than 500. 2/ Less than 0.5 percent.
Source: Compiled from official statistics of the U.S. Department of Commerce.


• - a 0
737.
24(pt.
)
5
co o X
'V • .1% 4.2 0 V3 u V • ••• O y P
•0 '0 '- O 0 0 • ••• a. a a
•• •• •
N • .0 CO 0 • Ca 0* 0 • 0 .4 0
0 41 .4 .4 40.
CO
• • • • • • • • • • • •
Ite o .0 p- r.) ce
O• e..1 4) r4 41 0 a) •• - •• • 9 001
CU a I et e I v+ d tr 41 CO
a• en .0• ,. 1.4 4) 0 .... d •• •• •• •• • a en
VI 4) ✓ 44. ,I
il) L. 00 O .4 4) 0, d 4.) 4.) 14.1 1.4 re ed u st ..,) 4) .• .• •• •• •• •• ••
ea 44. tr 44. 0
10 e a) en > a co
.... sp, o c• •or 44 .41 44 <41
44 .4.• 0 02 4) a •0 e e V 1.6 Cu 14 414
Ille g vEll
0 .0 O or
O 0 0 0 E
• N
O
'y ce, In A) to r.. e.4
N b0 0 40 0 SA 41 4 •• 0 V r4 .44.114 We
a .0
▪
41 41 a 0 1.. 40 ... 0 ..4 of a. .0
tr 0 r4 44
10 0 0 4) 04 • • • I. .4. .0
O 0 a ao o
4) .t.g a ao o•
co .. .0
0 .4
O .. .. .. .
a
14
so so
NI
0
a 0
0.
rr
O 00
41
.4 41 r4
• 0 0 .0
0 tt..
4.) O to
a sa 0.
0
0 .4 44
...•
v4.1 O 0
464 o4
.
•
4) 14
m 0 4.) d
r̀ tl NI

2
Digest No. A701--Con.
II. Comments
Description and uses
The products classified under TSUS item 737.24 include all dolls except
stuffed dolls, regardless of use. Dolls as a product group can be subdividied
into two basic categories--toy or play dolls for children's use and
collectibles for collection or decoration. The dolls for which duty-free
treatment under the GSP has been requested, handmade dolls of wood or clay,
would fall primarily in the second category as decorative handicraft dolls.
However, also included are some wood or clay Christmas ornaments, wood toy
dolls, and wood puppets and marionettes, all of which may be used by children
for play. It should be noted that the term "handmade" is somewhat imprecise;
all doll production is highly labor intensive and a handmade doll can easily
compete with dolls that are not totally handmade.
U.S. producers and employment
There were approximately 200 producers of dolls and stuffed toys in
commercial quantities in the United States in 1982. Total employment was
approximately 7,000, with an estimated 6,000 production and related workers.
Data on producers and employment with regard to wood or clay dolls are not
available; however, the bulk of domestic production of these dolls is reported
to be on a cottage industry basis (often by skilled craftsmen and artisans),
with little commercial production.
U.S. consumption and production
Apparent U.S. consumption of all nonstuffed dolls decreased from an
estimated $134.8 million in 1978 to an estimated $133.2 million in 1979, and

Digest No. A701--Con.
then increased annually to an estimated $202.9 million in 1982. Estimated
producers' shipments of all nonstuffed dolls declined annually from $69.2
million in 1978 to $32.9 million in 1981, and then recovered slightly to $39.7
million in 1982, representing an overall decline of 43 percent. The ratio of
imports to consumption increased annually from 50 percent in 1978 to 82
percent in 1982. Data on producers' shipments, exports, imports, and
consequently, apparent consumption for wood and clay dolls are not
available. 1/ However, wood and clay dolls are believed to account for less
than 5 percent of nonstuffed doll production and consumption. Imports provide
the major portion of U.S. wood and clay doll consumption.
U.S. exports
U.S. exports of all dolls ranged between $1.7 million and $2.3 million,
annually, during the period 1978-82 (table B). Exports during the first six
. months of 1983 were $500,000, down 35 percent from exports during the
comparable period of 1982. Mexico was the largest export market during the
period and accounted for 17 percent of the total in 1982. Exports of wood and
clay dolls are estimated by industry sources to be negligible.
U.S. imports
U.S. imports of all nonstuffed dolls increased annually from 128.3
million units valued at $67.4 million in 1978 to 187.4 million units valued at
1/ For this reason, no consumption table (table A) is shown.

4
Digest No. A701--Con.
$165.4 million in 1982 (table C). Hong Kong and Taiwan were the largest
sources during the period, accounting for 55 percent and 23 percent,
respectively, of the value imported in 1982. Although official data on
imports of handmade wood and clay dolls are not available, imports of these
dolls are estimated to account for less than 5 percent of the annual import
value.
As shown in table D, imports from GSP countries accounted for the bulk of
imports of all nonstuffed dolls during the period, amounting to 182.3 million
units valued at $154.1 million in 1982--97 percent of the total quantity and
93 percent of the total value imported. Most imports of handmade wood and
clay dolls are believed to come from GSP countries, although some handcarved
collectible dolls and marionettes are sourced from Europe, particularly West
Germany. With the exception of the most inexpensive wood dolls used as
Christmas decorations, imports of handmade wood and clay dolls compete with
domestic products in two ways. In general, imported native handicraft dolls
of a particular country compete as collectible dolls on the basis of design
with both other imported dolls and U.S. handicraft dolls. In addition, it is
not uncommon for an importer or foreign manufacturer to take a marketable U.S.
doll produced by a craftsman, replicate it, and, by virtue of the lower labor
rates available overseas, market it in competition with the original at
significantly lower cost.
Position of interested parties
The government of Thailand was the petitioner in this case. There were
no other representations from interested parties.

5
Digest No. A701--Con.

M co 0.
C 19
82, a
nd
N CO I • • • • • • I . •
co r-
L-CD E •• •• •• ••
7 O.
U o0
•• •• •• • •
17 C aa 7 Os
▪ • • • • • • • •
4,
o rs.
11.
4- O
C
= C
ND sO rg .-M Ch 4.
• • •• •• •• •• •• .
P. N .- 03 hi N st in PJ hi
•• •• ••
M Ps g) eV O. us us to Fq NI VD N. rg
• • • • • • • • • • oo •• • • •• • •
O in co m) u) as 03 4' sr un
co in s N n.1 CO
•• •• •• •• •• •• . •• .•
O. 111 .- .- N. 03 P. rg rg hJ
•• •• •• •• •• •• 00 •• • • ••
NOON\ Cr. CO CV CO
O
Digest No. A701--Con.
CD CD in in 0 0 C• ND O4' Ul N Os CO Ch Ps • • • • • • • •
rg N VD hi st VD Ch Ch
• • •• •• •• •• •• • • • • 00 •• ••
O CI, VD 03 CO Ch 03 CO -hl N NI' U1 Ps Pi CD .- U1 0 • • • • • • • •
ts.OMNN.D U1 03 in CO N
• • I. • • • • 0• •0 • • 1• • • • • •0
EN MI U1 IT OD U1 P. hl CO hi 111 0 N•NeOst • • • • . • • • •
• ND ND MNIfl00N un N
• • •• •• •• •• •• •• 0. •• • • •• ••
N.
M.-N.10 4' N. CV Ps Ps UN 03 rg 03 VD Ps Ps • • • • • • • •
U1 Ps U1 4' 03 P■ O' CO
•• • • • • • • • • •• • • •• •• • -
• CD Os VD VD O. 03 CD IA N Ps Ps CO N • • • • • • • •
NO NT NO NN P. CON CO .- .■
•
03 N
••0
•• ••
•• • • •• . . •• •• •• •• •• •• ••
P. NI 4' ND eh CD U1 03 N 4' P. O'- Ps VI ND Ps Ps P. • • • • • • • •
• Ps t. N N Ul hi CI IA UM CO 4-
•• •• •• • • •• 00 00 •• •• • • •• 00
VD I CD st ,r u) M VD CS st Ch es. Ch
• • • • • • UN u1 0 O. .0 0 .0 CO rg
N
CO
4+
C
Dep
ar
tmen
t o
f C
om
merce.
•
•
al .0
4- 0
1/1
4.0 7
VI
.4 CO U I}-
Y- 0
E 0
4-
O •
13 CD W in .4
C CL 7 E .0 0 4+ U
•• Ul 01 of U ..1 L.
O
I
I L .4 (1) CO
•C m .o m o
>,44cuE-ocoo- - 0)..-.000/ X Of C ac 01 C O. 014+01 L130101 3: 1.4 0. :D U. CD CD '•7 4C
6
44) ,r M. N o N. M1 Mi re1
•• • • 00 00 011 • • • • 1. Oa
• M hl Ps 0010 Os t. N. NJ .O M
•• •• •• •• •• •• •• •• ••
Ps 111 mi hi 0 NO hl rol ON Ps %ID sO N mi N N
•• •• •• •• •• •• ••
▪ N O. O. N. 0 .0 sr ol sr 4.), o. O N qr. I,
03 hi hi .4t %0 03 St a• N •D N. te) Ch U1 .-
0 O
O
N
•• •
• • •
0 0
• • •• • • •• •• •• •• •• •• •• ••
CD N. is sO O. 000 4. st .- N el N. 41 CO U1 C2 hl VD hl VD
• • • • • • •• O. • • • • • • • ••
rg I Ln OD 111 CD Ch MI in 4, 03 0 Ps sD
I I I
I .4
GI CO s 4,
O CD CI .0 CO 4• 0 U psNCUET/C131.- •.• C O 0 0 X OICU C 0.^1 al 4.1 d L 0 0 0 E I•1>MU.UC./n 4C
I I I I I IL L. CT 7 7 .0 L.
O 01 al .0 CO 4+ 01 U 7.14CUE'OCCI7
X RICY111••4 C13. 44 7 4+ 01 1. 0 CO CO E = U. C...1 C..) "1 42
•• •• • • •• • • •• •• • • •• • • • • ••• •• •• • • • • • • •• •• 00 •• •• •• •• •• •• • • • • •• 00 •• • • •• •• 00 • • •• • • 0 •

M O
•• •• •• ••
N CO
•• •• • • • • •• •• •• 00 •• •• •• •• •• 60 0. •
U1 43 CD cis ND Ln 42 03 CP 03 NI' 01 V) P. • • • • • • • • •
CD CD 01 C) C7 CD sr CD 0 4D
• •
••
••
••
••
C 0
••
••
••
• •
Value (1,
000 dollars
)
••
0 03
•• •• •• 06
40 04 00 ••
03 P.
0 U
* 0
January
-Ju
ne
198
2,
Ta
ble
C
.-
-Doll
s;
exc
ept
stu
ffe
d do
lls:
1 1 I 1 1 1 1 1 I 1 I I I I 1 1 I I I I I 1 1 I 1 1 1. .4 1 1 1 1 1 It 0 014.' C. O E .0 44 C 0 Oe 01 L 4.0 0 0 di c.) Ot C W CO 0
C IN C
m=0=001.=-1 =0mo-cc-ILI-Q.(
1 1 1 I I I I 11 1 1 1 1 1 11 1 I I I I 1 1 1 1 1 L .4 I I I 111310 1714' a IRE.C.i.o C COCW L .1.1 0 O 67 WC6001... bCC..0 WOG
...X....La ......1 COLOI.COMU.C.-1 momo.uncc.c.s.c
1 1 I 1 1 I I I I I 11 1 1 1 1 ell 1 1 I 11LM 11 1 11610 M.1.1 a EELL C COCO L ONU OCCW00}
SOC .11C
MLO.COOL.C.-1 SUEMU'IWW.11C
•• •• 00 •• •• •• 66 •• •• 00 60 •• •• •• •• •• •• •• •• •• •• •• •• 0* •• 041 06 •• •• 00 00 •• 00 •• •• 1 1 1 1
Digest No. A701--Con.
7.
CD u1 cD 01 .- Nt 01 U) N qD PS Ai cn O—OP U1 U1 NN
• ■■
Cs NT rg 01
•• •• 00 •• • • •• ••
00 ND ND N N ND .- • .41 DI CD cr. cr ck P. OD P- .-
p. 01 r4 vr
•• •• • • •• •• •• •• •• •• ••
03 U1 0 .- 0 cos 01 N 01 .1. co nf 0. P. N P..- h N 01 CD ND NO
N N M ■r
•• •• •• •• •• •• • • 6, 0 ••
NTNMP.NrP....rst ONM.-srson-J
▪ Nr NT 01 01 .-
•• •• •• •• •• . •• 00 ••
O lPJJo..D03 03 U10 sr NT CO so .- P. 4, • • • • • • • •
0 to 01 C) 01 so so Ok
•• •• •• •• •• 60 •• •• • • •• •• ••
un res c: .- 01 CD NO Cs CD 01 CO 03 01 NO • . • • • • . •
O— uM .-O N U10
•• •• •• •• •• •• •• • • •• •• •• • • 00 014. ON ION — UN 4' 0Ntfl.DU1N0 .- .O .OJO•hU1M J
UN CD Iv ND uM N rg vr
• N NOM cD UM O. /MN ND 00 00 .- 111 N Os It UN N No u1 N T. Vi
*4 06 06 G. ok •■
03 .- Cs
•
01 .-
01 rg cD u1 00 st CD M. OD rg P. .- VD P. • • • • • • • •
C2 CD NT 0 eV UN 10 4D
••
00
•• •• •• •• 00 •• •• •• •• • •
COC • M4. 1i1M0CIS
...°04TWIti.d. WINCP6
O4■ 01•4■ •■ ••••
cv u1 01 03 O. 01
•• •• •• •• •• •• •• •• •• • •
CD 01 P. lb CD 0 0 P. r■ CD so os P..- O P. O. Cs 0 13. It O Ul PANP. p. UM N 01 .- vD N
•• •• •• •• • • 66 •• •• •• 0* •• •• •• • • •• •• •• •• •• 00 00 •• •• •• •
nf 0 01 CD .- Vls UN 414 PM 0 U10 N IANN DM — N N
0.411.-4- MN 001
•• •• •• •• 1.6 •• •• •• 04
MinM0sOMM1.- 4441. 464444
N 03 sr U1 O• N
•• •• •• 60 00 • •
4).-.-.OMN003 Cs 01 N J Cs si) so NO ▪ T. .o un eg ND 03 NO WS OD CV
.r J um um ch. tin ND CD uN OD 01 rg CD C7 00 ND Cs P. ND P. No N
un m. P. in cv rg .- u1 N
• • •• •• •• •• 00 •• •• 00 ••
4. 030 .641. 44tS MN 04,03.6 00.0 17•10 4' 0M0M .441...
• ■ d■ 10 Oh 61%
O VD .- 04 vr
•• •• 0* •• •• •• SO •• •• ••
O ■ e4 w■ e■ 0 0 U1 • e4 UN m■ .r UN N ▪ V2 sO 00 uM
O. M UN IV O1 .-
N 0 J CD r4 J0O. ND SC %t m* co ru P■ 01 • • • • • • • •
•• •• •• •• •• •• • • • • • • *0 • • •
Inv)incsN...0.0000 MIANNODONN • • • • • • • •
CD CD NT C2 .- N em CD CD
•• •• •• •• •• •• •• •• •• 06 0 6 •
NO P. Cs CD NT C7 UM .0 It vr 41. CD cp 0—M • • • • • • • • 000.-00N0 0

CI CI
CC
CO
(1)
3.4
0 C./
CO
CD
"0
ro
r1
CC
C.)
CC ro
0 0
•
") "CI 00
OT
0
O 0 ■-f
rn co I
a)
•
0 u
0 • 0:1
.")
CA
}-■ 0
C)
CO •
Tab
le D
.-
-Do
lls
, ex
cep
t s
tuff
ed
doll
s:
••
••
• • • 1. • • • • •• •• • • 00 00 0. •• • • •• 00
N rel N Ifl hl .44. SD 11.1
•• • • •• . •• •• •• 00 00 00
O UN 0 01 un 00 04 .40 P. N 00 ND NI ",1 .- O CD ION 1.11 un
4. •• C• NC C4 .- M
•• •• •• 00 •• 00 41. 00 •• •
O CK ON PI P. Ps .- 0 N 0 In cc N000 .D .O JanNJ
ul el cm .0 LIN CY 0' ■••
•• •• •• •• ••
•• •• •• •• •• • • 00 •• ••
vi UN oD PO y■ PI
*-1
•• •• •• •• •• •• •• •• •• •• •• •• • • 616 SO I.
CO UN CD CD NP PI 6,1 0 ▪ .- NC 0 04 C. 04 .- NC Ul C. .- C. C4 rl PI NC
04 04 ml .- N
•
•• •• •• •• •• •• •• •• •• •• •• •• ••
N 03 re> ul ref M .0 03 03 .- CO M c0 • tsf in P.1 ■-
• •• IS 44
O. 10
•• •• ••
•• •• ••
CO
0 42
••
.•
•• •• •• •• •• 00 •• •• •• •• 00 00 I. •• •• •• •• ••
Oink. CD CD 01 ND 04 UN P. CD ND Oh C. ND un PI ON ION CD NC Oh C4 N CO
NI C. fs. IA 04 ND N
•• •• 00 00 00 00 •• 60 S.
NC NC UN Ul Oh CD VD In 0 in v■ 04 .- 00 NC 04 40 ND CN P. NO r. .- pm .-
•• ••
UN .- C. UM 04 un
• • • • •• •• •• 00 00 *0 •• •• 0. •• ••
.7 OD CD NC ND CNI CD CD 04 ND 00 NO 00 .- OD ND CO 04 O. 4' 0 UM 00 UN NC c4 CD
CD
▪
ND 01 NC uN
•• •• •• •• 06 •• 00 •• •• ••
0 ors rq 4- um .- C. CD UN 0• • 01• um .-N
.- co uN NC CD
00 C4 MM ON PI
• •• 00 •• •• •• •• 00 •• 00
O C. .- .0 0 oh 4. 00 04 C. roN Oh O. • 111 NI CO .0 .--
N 0O .7 M O. N
••
••
••
•• 00 •• •• •• •• 00 •• •
N ca MI CD .- .7 MI OK 0r. MI 4. C4 .- C4 ND 04 C. Ul C. P. PI CO
Ck 04 .- NC NI oD 01
Ch 4+
Department of Commerce.
•
•
4+
4- 0
U
N
U
▪ 4- ▪ 4-
C 0 01 U E 6 0 SI 6
• 13 OI
•••,
13.
c,
101
.J
8
Digest No. A701--Con.
•• •• •• •• •• •• •• •• •• •• •• 00 00 •• •• ••
N 00
UI CP ,o4
4+
C 7
•• •• •• ••
0 O
C
C0 •• •• • • • •
O co O.
Se • • G. 0 •
N O.
• • •• • • •• •• •• •
E
1.
▪
4
•• • • •• •• ••
•• •• •• ••
0
0 4.1
• VI fa GI 42
C. 4+
U In VI
.1.0 D 01 S.. V ••- o 0. L. V/ 0. 0 .1.# 0. 13 CD E C 0 DC W C
W 7 0 W 1.) AC 0 ••■ .1- I. >, O Id C •I•I VI
VI d U X u M .0 In •3 O1 .0 01 .0 0 01 .0 CI .1-1 O CL=Lf=0.),Crip-=0 I. .0 0 CD N CD
0 co O 4+ - 0 I. 4+
4+ U
IC N 4+ 'a Cy I. Cy 0. o O. t. O. 0 4.. Of ++ 0. 13 CD E C C 0 IX 01 C
•-• GI *OWL) 000.-4.-1. • 112SC C••-•-■ (1)
VI IV U L IA '0 01L 01.0 0 of .0 CO ++ o 0SCJEA.WEI-.S0 .c
*.0 0) 4+ CD N CD
os
.4
.4
0 V
O 0 0 ft
,fte
V 7
••

• • • • • • • •
CV 0 +) 000 0 Os 0 0 r•1 •
M O. 1+1 C
Descrip
tio
n 1/
•
N
F
TSUS(A) item numbe
r; de
scr
iptio
n; tariff rate
informatio
n; U.S. im
por
ts in
198
2; competit
ive sta
tus
TITLE: Resin buttons and certa
in bu
tton blanks, molds
, and parts
!• "
co P
co cr.
after Jan.
artic
les entere
d
N co v-1
'1980 •
1981 •
•
each TSUS it
em.
should be consulted fo
r a comple
te desc
rip
tio
n of the
articles
7 V
4, C •
.0
0 •
0 a) 43 I+
of C 0.
ol ♦ 0 t.
• • • • • • • • • • • • • •
1••
N
N
• • • • • • •• ••
• d + 0. 0. it
us .0 •40. 0 IA o we st
• •ro 4 N oto e4 N •••••
••••• V
opt eo • oft ID go sr • sr
Q C 0 • sr • • •, LI 10 •1 v-I
O +.1 b + ••••• ra
g et et N d 0 • N on
• C O.0 • • ...I LI in to
O o.•1 00 .1.
gt
In • : g
41: 1.0 sp IA 0 ,1 60 +
coope - N a • +1 00
C 0 e. • Lo e. P.
•4 00 .1.
.0 .0 es es
•••• wgfie .116 4) 01 •
C 0W • 5, +4 1. 40
o +4 00 + 0♦ .•
'rt.; OW ot° co. opt's rl
o• • r4 10 + tv O
11Pe so. 01 ,1 g
o '4 4100' g • V1 M Li N
• r•I 60 + •-N
••• •••• w..00 do oe
v. C o 0 • • •••• 4 N
O1.+ 00 + ••■•• N
S.
• C +
r•I tia
11e 00 0 .0 10
• 00 4 co N
1. 0 • •
•
.0
0) 4.1 0 • g, • 0 •
Is 0 Co. di•0
a• 0 46 • fJ
•4' ••
C • • 60
• • c) 4) .0
0 02 0 ••• M 0
. CO
O I. .0 4.) C
0 • V C
d
• a.
•o to. c o
La
§ O 0 • 0 .4 O•a •
4.1 a • 0
6.4 w 10 C 01 4, J M g
L. of .w
o .0
• 0 C .0 O 0 to .0
C I. 0 0
J)) O. •.)
of C C I oi
0.1 17 0 of • 0
0 50 V C C d
ow N I 0
rs to LI 0 C 0
0 6 .0 0 0
1, a •
N • CO
N F4
•
•
0 0 .0 10 Li .0 1.4 • 0 4 0
r• 0 d 0.
.0 • 0 03 0 ••••
CO • .16 V O. • C 4r1 0 01 4) .0 •••• 0 .0
ec 06) c
Li Yr 0 • 0 0 s.)
.C.0 4,d 0. 0 44
0.0 4. 0 4) 0 .0 .041 041
0. cc c.3 co • 41)
va
• C rd At .
)
to o v
• • 1-1 • PI
ow • 0 for .0 .0 0
Os Ow • 0 14 0 .0
• C 0 A0 .04, • •
1-1 of a
0.
.41 NI all 0 41
0
4,043 : Yes.

2
Digest No. A702--Con.
II. Comments Description and uses
This digest covers buttons of acrylic resin, of polyester resin, or of
both such resins (TSUS item 745.32) and certain button blanks, molds, and
parts of buttons, other than casein blanks (TSUS item 745.42). 1/ Acrylic
and/or polyester resin buttons, which account for the greater part of total
domestic output of all types of buttons, are used for men's shirts and ladies'
blouses, dresses, and sportswear. They are the most important type of button
in terms of commercial significance and are sold under highly competitive
conditions in the U.S. market. Button blanks are limited to raw or crude
blanks suitable for manufacture into buttons. Button molds are forms
(generally wood) which are used in making covered buttons. Button parts
consist of such items as shanks, rims and backs.
U.S. producers and employment
There are seven domestic firms that produce buttons of acrylic and/or
polyester resins, with four accounting for 50 percent or more of total U.S.
production. The seven producers derive most of their income from button
manufacturing; they are located principally in the New York City Metropolitan
area, upstate New York, Connecticut, and New Jersey. Of the seven producers,
five produce button blanks, molds, and parts.
The industry producing the products covered by this digest is capital
intensive, and total employment for all products was about 3000 in 1982.
1/ Prior to Jan. 1, 1983, button blanks, molds, and parts (including casein button blanks) were entered under TSUS item 745.40.

3
Digest No. A702--Con.
U.S. consumption and production
Based on information from industry sources, estimated consumption of
acrylic and/or polyester resin buttons amounted to $83 million annually in
recent years, with imports supplying approximately 5 percent of the domestic
market (table A-1). U.S. producers' shipments of these buttons amounted to an
estimated $80 million annually in recent years.
Data on U.S. producers' shipments and exports of certain button blanks,
molds, and parts, other than casein blanks, are not available; however,
industry sources indicate that virtually allU.S. consumption is supplied by
domestic production (table A-2).
U.S. exports
Although separate data on U.S. exports of the items considered by this
digest are not available, industry sources indicate that exports of acrylic
and/or polyester resin buttons accounted for about one to two percent of the
value of annual U.S. producers' shipments during 1978-82. Exports of button
blanks, molds, and parts accounted for less than one percent of such shipments.
U.S. imports
Imports of buttons of acrylic and/or polyester resins increased
irregularly during 1978-82, rising from 3.3 million gross to 4.1 million
gross, or by 23 percent. The value of imports decreased by 17 percent over
the period, dropping from $4.9 million to $4.0 million. The average unit
value declined from $1.46 per gross in 1978 to $0.99 in 1982 (table 8-1).

4
Digest No. A702--Con.
The major supplying countries, Japan and Italy, together accounted for 80
percent of the total value in 1982. Imports of button blanks, molds, and
parts decreased by 49 percent during 1978-82, dropping from $457,000 to
$232,000 (table B-2). West Germany, Hong Kong, the Netherlands, and France
were the leading sources, accounting for 95 percent of the total value in 1982.
Raw material costs, which are lower in the United States than in most
other nations, give domestic producers a competitive advantage over most
foreign manufacturers. The labor component of production costs is minimal.
Domestic producers also enjoy proximity to the New York City garment district,
a large purchaser of buttons.
Countries designated as beneficiaries of the Generalized System of
Preferences (GSP) supplied 20 percent of the quantity (816,000 gross) and 10
percent of the value ($408,000) of total imports of acrylic and/or polyester
resin buttons in 1982 (table C-1). Thailand and Taiwan furnished virtually
all of the imports of resin buttons from beneficiary developing countries in
1982.
Imports from beneficiary developing countries supplied 17 percent of the
total value of button blanks, molds, and parts in 1982 ($39,000) (table C-2).
Hong Kong supplied virtually all of these imports in 1982.
Position of interested parties
The Government of Colombia, through the Export Promotion Agency of the
National Bank (Fondo de Promocion de Exportaciones, Banco de la Republica),
and Modern Buttons Ltd. of. Malta both petitioned for the addition of TSUS item
745.32 to the list of articles eligible for the GSP. Colombia also petitioned

5
Digest No. A702--Con.
for the inclusion of TSUS item 745.42 on the list. Colombia contends that the
granting of its petition would not have an adverse impact on the U.S. industry
producing like articles. Allegedly, the increase in imports from developing
countries would supplant imports from developed nations such as Japan, Italy,
and West Germany. In doing so, imports under the GSP would provide U.S.
apparel producers and notions consumers with lower-priced buttons. GSP
eligibility would also benefit the economies of developing countries which
produce buttons.
The Maltese firm, Modern Buttons Ltd., asserts that it needs duty-free
treatment under the GSP for its high-quality polyester resin buttons to
compete with buttons from the United Kingdom, the Netherlands, West Germany,
Italy, Thailand, and Japan in the U.S. market. Modern Buttons Ltd. claims
that not only would GSP eligibility for item 745.32 increase employment in
Malta and improve Malta's balance of trade, but it would also lead to
increased exports of the raw material for polyester resin buttons from the
United States.

6
Digest No. A702--Con.

Digest No. A702--Con.
Table A-1.--Resin buttons: U.S. producers' shipments, exports of domestic merchandise, imports for consumption, and apparent consumption, 1978-82, January-June 1982 and January-June 1983
(Quantity in thousands of gross; value in thousands of dollars; unit value per gross)
Year
: Ratio (per- .
•Producers' . Apparent • • : cent) of shipments • Exports 2/ : Imports • consumption : 1/ 3/ imports to
• : : :consumption 4/ .
Quantity
1978- - ----- 3,334 : 1979-- --------: 4,103 : 1980- -------: 2,574 : 1981-------- 4,165 : 1982- 4,098 : January-June: :
1982 : 1,609 : 1983-- --- 2,284 :
Value
• 1978- 4,858 : 1979- 5,064 : 1980-- -------: 4,079 : 1981-- 4,511 : 1982---- 4,043 : January-June: :
1982--- 1,939 : 1983- 2,213 :
Unit value
1978 : 1.46 : : 1979 : 1.23 : : 1980 : 1.58 : : 1981--- : 1.08 : : 1982 : .99 : January-June: : :
1982 : 1.20 : 1983 : .97 :
1/ Not available; however, trade sources estimate that producers' shipments amounted to approximately $80 million annually in recent years. 2/ Not available; however, trade sources indicate that exports are
negligible. 3/ Not available; however, the consumption of resin buttons is supplied
largely from domestic production. 4/ Not available; however, in terms of value, imports of resin buttons
supplied an estimated 5 percent of consumption in 1982.
Source: Compiled from official statistics of the U.S. Deparment of Commerce, except as noted.

8
Digest No. A702--Con.
Table A-2.--Certain button blanks, molds, and parts: U.S. producers' shipments, exports of domestic merchandise, imports for consumption, and apparent consumption, 1978-82, January-June 1982 and January-June 1983
. • . : Producers' •
• • : Imports : Apparent
Ratio (per- . shipments ' Exports 2/ consumption :
cent) of
1/ 3/ : 4/
• . imports to '
: • . : . :consumption 1/
Year
Thousands of dollars Percent
1978 : : 457 : : 1979-- : : 377 : : 1980 : : 254 : : 1981 : : 281 : : 1982 : : 232 : : January-June: : : :
1982 : : 102 : : 1983 : : 108 : :
1/ Not available. 2/ Not available; however, exports are believed to be smaller than imports. 3/ Since button blanks of casein are included, import figures for 1978-82
are slightly overstated. 4/ Not available; however, virtually all of U.S. consumption of certain
button blanks, molds, and parts are supplied by domestic production.
Source: Compiled from official statistics of the U.S. Department of Commerce, except as noted.

•
•• ••
C
03 On
C 3
L.
3 C 0
ru 03
1 00
O.
in
Lc
3 0
EL
U C
ow. .
A.
0.
C 0
E 3
C 0 U
0 4-
U1
A. 0 0. E
• e
•
n =
C
•
01 '0 C 0.
On 4,
1
C
C • CD
ac 1
01
L.
0 41 N
az
(1,000 gross
)
4,1
4+ C CO 3
•• .
•• •• ••
O.
•• 10 ••
••
00
•
0
••
O
•
03
•
•
O
•
.•••■
00 0
OD
CI 0
0
40
C
Digest No. A702--Con.
9
O J MI h0• UN 01 M CD eg CD in m CV 03 03 CV
l• • • •• •• •• • • •• • •
• rh .D MI .0 CV N. Cv 01 CV .- M.. UI N. CV
•• •• 00 00 •• •• •• DO 00
ni CD CO 03 03 CD 0J N. GSM eV 4. 10 CV in v) N-
• • • • • • •• • • • • •• • • ••
N. U, IN1 cN Ul CV ht .0 VI U1 00 in OA NN .4 pl N. P.
•••
•• •• •• •• •• •• •• •• • • ••
O. • in PI CD PI CD N. 03 .- MI U10 UN AN O -. CO .- •-
N. U) 0 OA CD 03 00 •42 n eu ul UN UN Os ol 00 . 10
• .• Mo. .
•• •• 60 •• •• •• ••
in N. U.• inMS C) 00 in MI .0 0• un N J 03 00 .4
•• • • 66 • • • • lob • • •• •• • •
O 0 Ps eni 01 U100 in .0. ru ul .- h 00 ..-
00 •• •• O. •• • • .0 ••
.- CD in Nt th N. les1 CO No U1 o cr. Nci in in .0 UN PI ..-
•• •• •• •• ••
CN C2 OD Ma .- 00 • Al) U100 V) 0 04 uN • O. r4
• • • • 0. • • • • • • • • • • ••
uN .0 J Ch V) O• n V) uN ul a.0 42 V)
• • •• • • • • • • • • • • • • • •
• nt 1 n PI 0. NT .- U1.0 CO C0 M Os LT 0 04 .- 4-
ru eu
•• •• •• •• •• •• •• •• •• ••
• PI 1 rs N- .0 N. N. IV 0 MNO..O
rel
eu
0 T. en 04 0 0 ,0 n el an O.
• • • • • • • •
•• •• •• •• 60 00 •• •• 00 00 66
•1 d 0 O. Iri VI 0 • 1 •1 01 0 y u1 O. 04
• • • • • • • • 44 04 0, .4 <0.
•• •• 60 6. •• •• •• •• ••
• and 01 .1. en tv Ch 0.1 On-C r- d n r. on O. • • • • • • • •
T1 In •i ✓0-
•• •• • • •• •• •• • • •• • • • •
r, Ch.T vD CO 0, OD 01 el CD on v) un. un .4 .4 • • • • • • • •
.4 eV 04 .1 •4 el
•• •• •• •• •• 06 66 •• ••
M Ann° C) rh VD 03 An cC M 0 in
• • • • • • • • M N u1 04
CA-
• 0.1 - 1 O un 1-1 0 en Cs1 0 CD 0 01 Lei
• • • • • • • 1-1 M 0,1
</).•
•• •• •• •• 66 66 •• •• 60 ••
00
00
Ch .0 C2 UN 00 •0 N. .- O N es m 01 N0 •
co O
1-1
OD UI
1-1
r, ol 1 •n 44 O. VD ,T 01 ul 00 C) rA
• • . • • • •
ri on TI Cr
▪
t
•• •• •• •• •• 06 DV •• 00 00 •• •• • • •• 00 00 •• •• •• •• 00 •• •• .0 •• •• •• • • • •• •• . •• 60 . ••
11 1 1 I 1 1 I I I 1 1 I 1 I 1 I 1 1 I I I I I I I I I I I I I I I
I I
. 1 I I I 1 I
I 1
11 t. .-•
I 1
1 1
I I
I D L. 01
1 1 I IV • I I 1 W 111 I I I oI 10 -0 N E .3 4+ 1,0 E •C 4+ 0 N E .c C 9 L. Of CO .1.0 C '0 I. 01 10 4+ 0 C C. 01 CO •La
C .■4 C UI a 1- C 3, -1 ..., 0 C 0 0 0 I'. C >,-4-1400 0 130> W •C CO g 44 -- .c CO - 2 10 W 44 •-• .0 CD &:/ .4C 0. CO CO 4+ at C •-• W4+.CWL 030-•
0.10 10 ++ at .. c ...4 1,1 64.0.301. Als..
CA. CO 40
01 .0
4, be 4.4 C N I. g CO
•-)•-e P-ZILO&.40.t •-) •-• Z

10
Digest No. A702--Con.
Table B-2.--Certain button blanks, molds, and parts: U.S. imports for consump-tion, by principal sources, 1978-82, January-June 1982, and January-June 1983 1/
(In thousands of dollars)
January-June-- Source • 1978 • 1979 • 1980 • 1981
1982 • 1982 ! 1983
F.R. Germany : 137 : 95 : 87 : 138 : 134 : 47 : 34 Hong Kong 71 : 67 : 52 : 75 : 38 : 14 : 30 Netherlands : - : - : 77 : 27 : 28 : 21 : France : 4 : 8 : 5 : 12 : 21 : 18 : 5 Italy •: 77 : 74 : 6 : 3 : 7 : - : 31 United Kingdom : 29 : 76 : 8 : 6 : 2 : 1 : Switzerland------ : - : - : 2 : 1 : - : 2 Taiwan : 138 : 45 : 2 : - : 1 : 1 : - All other : 1 : 12 : 15 : 20 : - : - : 6
Total------- 457 : 377 : 254 : 281 : 232 : 102 : 108
1/ Since button blanks of casein are included, import figures for 1978-82 are slightly overstated.
Source: Compiled from official statistics of Department of Commerce.

O L
O O O
C
0
Gross imports
June 1983
C
00
N tr•
• 0
C 5 O
0
tD C 171
1,0
C
a
VI
.41
0 3
C a L. a
.0
o. E
C el
•• .• .• ••
M
4.0
O 0. E
■-•
co 0' •••
a 4.0 C a L.
L
0.
O 03
•• • •
26 developed ctries.
841
a 0 4,0
0 V
O O O
••••
V
0
CFI L LD C LIC 01 0 0. 0 U 10 IV L.
•• ••• 1314, 0/
0 01.0L. X C •C o IV 4,
1 20.11..E0ED
Gross imports
N \ HH
. • • • • . • • • • • • • • • • • . • • • •
01 0 03 .41 I N LrI I N P••• .-M ■?'
• • • • • • • • • • • • • • • • • • • • • • • •
1`. N •••• I I N 0 PI ••• rm
••
e0 c0 IN 0, S. 1 I I I esc rui
13'
• • • • • • • • • • • • • • • • • • • • • • • •
••••• \ IV .0 I I I CO N.4) IA
O
I L1' V, I S I I.- I 4' O.
• • • • • • • • •• • • • • • • • • • • • • •
O
•0 • • • • • • •••
0 4.0
O O
res
N
•• •• •• ••
st Os VI IN ••• N
• •
■ cpcmclom
• • • • • • • • • • • • • • • • • •
P. N WI 0 0 0 IN 0MI*0
• • • • • • • • • • • • • • • • • • • • •
00301 00, 000.0 N
••• • • • • • • • ••• • • • • ••• • • • • • • • • • • • • • •
a 4.4 O
a
ID CT S. LD C CoeCr I 0 C•
.5 La( .4 4+ ••• 11 r
L X C •C
01.0 0 •••• a4, ►..• F. 13. Z E
GSP countries,
• • • • • • • •. • • • • • • • • •• .• •
IN •••• N 0 0 NI O\ U1 NI 4' 0 cm! rs.t
0300 V1 .- ..•X 00
N 4' 10
L o
O
Digest No. A702--Con.
C
L.
Ifl •
0 • 0
0 111
C C CO 01
4.0
01 VI VI VI V 0.1

0 0
0 0
0 O
O
O O
• • • •
0
Valu
e (1,000
doll
ars
)
12
0 0 0 0 0 0 0 0
0 0 0 0 0 0 0 0
0 0 0 0 0 0 0 0
00000000
00000000
0 0 0 0 0 0 0 0
• • • • • • • • • •
0
Jol a 0 0 U
.0 m .0 .2
r4
•• •• •• •• •• •• •• ••
in...411111 M
N I 1 1 1 1 I
• • • • • • • • • • • • • • • •
MN 1111
NI
ss ss •• ss *.
vt • • I • I I
• • • • • • • • • • • • • • • • • • •
0 a.'
Ps• .4
.4
O. bl
4 en r0
o a.
re 41 0 0 N N
P. r••
Digest No. A702--Con.
a
0 0
... a ....
a. a 0
. 0 . 0 a 4.1 .4
• .0 .0 0 a .. ed • 0 0 Li • re re. 60
0*•.000 41....0 12 i d Ls 0
. • • • .4 Q • 0 0 e a .•.
..4 4.) a. • .... g 0 a 42 0 Iii a 0 1 .0 0 ... 4,4 a a ... a 0
If
0 i
a r• re Li Li 0 N 0
111 44 0 CI .44 • re $4 1 Is 44 0 '00 at d .10
0 41 0 0 0 a 00000 • o = .4 i, 0 0. 0 Mt i", in 0 IL 0 A to .0 to 01 .•
0 0 0 0
40 a 0 a
■-; a
0 0
a O
4.1 0
.0 0
0 0 a
111% on
a • t G
ff
ore• .0
O C.4
• la 1
0. •• p. 0 re
1.1 0 Os 0
e a • a - o
a
'+ 0. 3
• d a
M
0 0
4I a .0
a
4.1 •
Cn
O r4
O
January
-Jun
e 1983
a • 0 • 4.) .0 •
.0 •
Ia Ir 0 0.
arl
■ 1.1
0.
O 40 a.
a.
Quan
tit
y (numb
er)
O •
1'4

IC
4C
•1 In + • as •ir
the U.
S. Generalized
2,4-Din
itro
-6-
sec-
buty
lphe
nol (Din
oseb)
1111 n. WI Sa to to er• m -a
• o
4.) c
o ,a o IR
• 0 4.) CO g
cr• en 4.$ 44 •-■ .-.1 • u 0 O s. a. 4) O I 41 0 I In ea 0 L. ,-I co 0
ce• -a 0 .0 re .•i 40
•••• si 0, O 4 In .0 O te 0
.0 0 0 •cr 03 13 • O. • co
4) •••• 4.1 ce• 0 0 •
0 •,) 40 4-I 4.4 0 CL• O 0
t 44 VI
O a 4) • • •• r,
0. 0 44 la 0
el. $4 44 0 + 44 ...4 0
-w o co en .-4 u .0
.. 4.4 0 03
.4.1 0 at 0 (7. -04 • w .1.4 4-1 4,4 4.1
O 0 .4.I 4.4 • I-4 0 0
04 0 • 0 g "C3 4 1 •• •• •• • 4.48 O 0 14 CI) ✓ 44 0-1 0
4.) 0 4.0 +
) O 0 N V el ...a .0'..4
N 0 0 a 00 In • 60 •••
CO 0 (0 ta• • v-, ao • 4-4
4-4 0
▪
0 0 0 •-• 4-4 ...I
at r• • 4.4 0
O 0 +
0
... ,-..... vo 0 4)
• 014 00 14 4-I 0 C0 • 0 6
AJ 0 4.4 • C4 • in 0
Lc 0 0 •l 0 r4 • O 'V 4) .. 04.) ....
1..
44 o 0) ••■ • 4.) 40 fni + C C
' • a* so o
ca va ...■ o No, 4.44.4 o 4) 0 ao m - la 0
O a cr. O r4 .4' .1 •oa' ao .. 0 0
O On .. O W Cl•
.4 • W
.0
.1..4 4) Ws 0 41 • .4) "... V 11)
E 2 • 041 N Ca 4.
O ; k 04 •••1 to 0
0 21
04 I 4) + V 0 0 24
•••• i, • V 14 • 14 Q. 44 n.
g
.. • O 0 44 ..4
4) V 0 )4 0 • 4)...
La • •• •• •. •• •• .1.) 14., ... 4)
44 0
44 4) a
.4 .0 JO •
L. 4. 0 • - 00
.I.4 4.1 )4 CP. • a • wl 0 .0 CO
O 4.) 4.) • O. o ... 0 e
l • .0
4.) a a 41 14) . ta .1.1 .4 r4
..4 I • • 12 0
14 42 W V 0 M al I 0 44 • 44
• 0 0 "0 0 0 • La 4) 0 •*. 4.) 1.1
4) .0 4. O. w O. V) la 01 • . 0 f..4 : 0 0 0
Ca .4 ilft 4 ... ... 41 O to
. 414
.0 I 0 0 to 0
a .0 .0 0 0
a - 0 0 0 0 O N -. e 0
•• •• •• ••
.00 1..0 ra ug O 0 001)
4. .... 40 44 0 0
.0 ...1 0 04 44
i 4) 00 o........ a. 0 a. 0 o
• 41 .... ..... 13
v .4 MI 41.1 00
02 4 0
0
JO 0 4.0 .I.4
O 02 • •
I4
0 0 X o N N 44 ■• Od
a MI
11-0 60 ... 4.1 ... s. 0 MI le NI ell 4 at
1-1 CO

2
Digest No. B401--Con.
II. Comments
Description and uses
The chemical included in this digest, 2,4-dinitro-6-sec-butylphenol, is
produced from 2-sec-butylphenol, nitric acid, and sulfuric acid. The
principal use for this chemical is as a herbicide and plant desiccant. It is
used mainly in orchards and vineyards and on forage legumes as a general
contact herbicide and for killing potato vines and desiccating seed crops to
facilitate harvest.
U.S. producers and employment
Three domestic producers have manufactured this herbicide at various
times during 1978-82. In 1981, one manufacturer stopped production of this
herbicide and sold its trademark and customer lists to one of the remaining
domestic producers.
Employment data for this herbicide are not readily available as these
workers usually produce more than one product at a specific plant and as a
result these data are usually aggregated in larger groups (e.g., pesticides).
According to industry sources, however, there are a total of approximately* * *
workers engaged in the production of this herbicide by the remaining two
domestic producers.
U.S. consumption and production
Domestic consumption of this herbicide during 1978-82 increased from

3
Digest No. 8401—Con.
U.S. exports
During 1978-82, industry sources estimate exports of this herbicide and
its formulations were less than***percent of domestic production. Exact
export data are not available as this product is classified in a residual
(basket) Schedule B number.
U.S. imports
In 1982, U.S. imports of this herbicide amounted to 2.5 million pounds. 1/
Over ***percent of these imports were from * * *
The Commission did not identify any imports of this herbicide for
its 1978 annual report, Imports of Benzenoid Chemicals and Products; however,
during 1979-82 import quantities increased from 275,000 pounds to 2.5 million
pounds (table A).
1/ Value of imports not available.
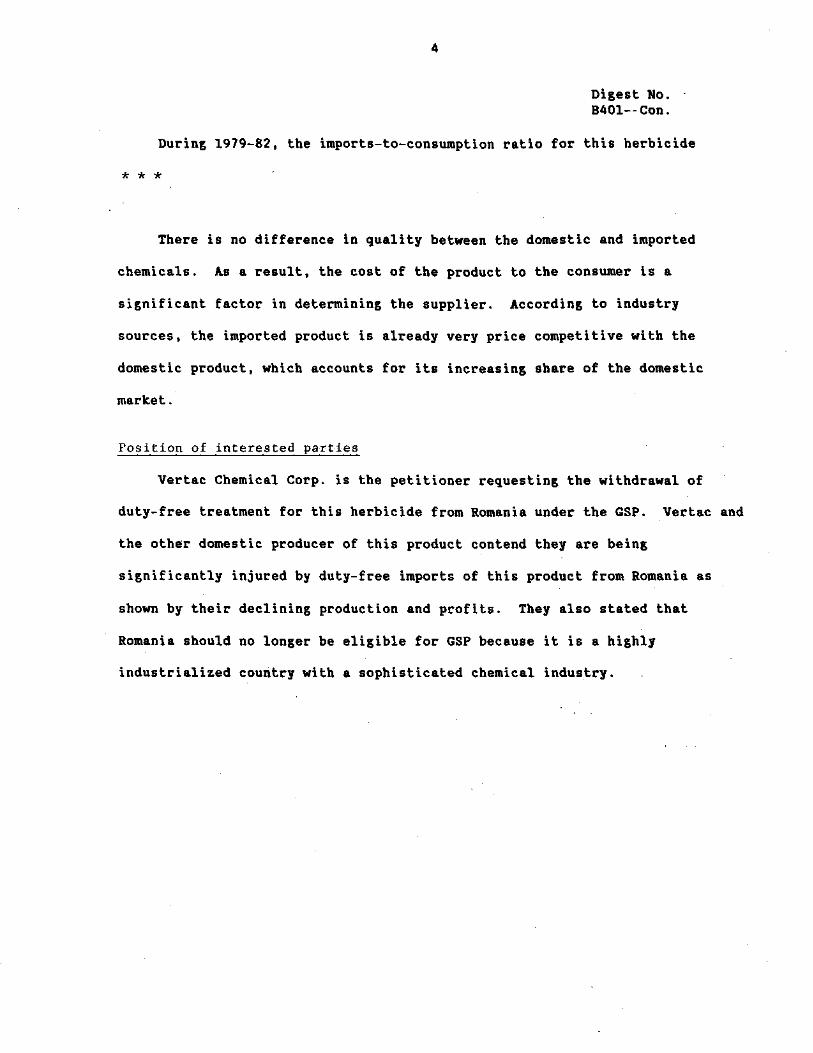
4
Digest No. • 8401—Con.
During 1979-82, the imports-to-consumption ratio for this herbicide
* * *
There is no difference in quality between the domestic and imported
chemicals. As a result, the cost of the product to the consumer is a
significant factor in determining the supplier. According to industry
sources, the imported product is already very price competitive with the
domestic product, which accounts for its increasing share of the domestic
market.
Position of interested parties
Vertac Chemical Corp. is the petitioner requesting the withdrawal of
duty-free treatment for this herbicide from Romania under the GSP. Vertac and
the other domestic producer of this product contend they are being
significantly injured by duty-free imports of this product from Romania as
shown by their declining production and profits. They also stated that
Romania should no longer be eligible for GSP because it is a highly
industrialized country with a sophisticated chemical industry.

5
Digest No. B401--Con.

Digest No. B401--Con.

1978 *** 1979 *** 1980 *** 1981 *** 1982 *** Jan.-June :
1982 1983
Digest No. B401--Con.
.
Table A.--2,6-Dinitro-6-sec-butylphenol (Dinoseb): U.S. production, exports of domestic merchandise, imports for consumption, and apparent consumption, 1978-82, January-June 1982, and January-June 1983
(Quantity in thousands of pounds, value in thousands of dollars: unit value in cents per pound)
: Year
:
Produc- tion
. :Exports 1/: • •
. : Apparent
Imports • consumption .
Ratio (percent) of imports to
consumption
Quantity
: : •
1978 : *** : *** : - : *** : ***
1979 : *** : *** : 275 : *** : ***
1980 : *** : *** : -1,142 : *** : ***
1981 : *** : *** : 222 : *** : ***
1982 : *** : *** : 2,516 : *** : ***
Jan.-June- : : 1982 2/ 2/ : 2/ : - : 1983 : 2/ 2/ : 2/ : - :
Value
1978 : *** : 2/ : 2/ : - : 1979 : *** : 2/ : 2/ : - : 1980 : *** : 2/ : 2/ : - : 1981 : *** : 2/ : 2/ : - • 1982 : *** : 2/ : 2/ : - : Jan.-June : : : :
1982 : 2/ : 2/ : 2/ : - • 1983 : 2/ : 2/ : 2/ : - :
Unit value
1/ Estimated. 2/ Not available.
Source: U.S. production, compiled from U.S. International Trade Commission, Synthetic Organic Chemicals, United States Production and Sales, 1978-82; imports, compiled from U.S. International Trade Commission, Imports of Benzenoid Chemicals and Products, 1978-82.


TITLE:
Melamin
e
Desc
rip
tio
n
a) -4)
Ca Z
I. TSUS it
em number; descrip
tio
n; tariff ra
te info
rmation; U.S. impor
ts
.0 E 0 N .0 1.1 . .8-1
04 .0
.1) 0 .0 CI3 • 4-4 C
CO
I J-I 04 ON .....
ao an
1 ..c c..1
W N
I
4.1 ,../ ...
a . L. C._
0 0
0000101 •,-, CO 0 0 111 1
0
.0 0 i
C --. .0 0 ••-• 1
u 0 1 n
0 I., C 0 1... 0
••.1 1- ,
0000
C 1:1 al
0
6 .0 •
a 0 E •r4
a)
L. 1...
0 c.) 0 - 17 ••-• al
cl 0 0 l
a
U •••• 7 al 0
.... 4 0. 0
al •••• 0 0 •••• IC w L.
0 CL
0000
g E 0
425.
1020
A :
114 In
N
N
3.
I.
Digest No. B4n2
In
N
114 1•••
e1; tir
T.
0 'V v-1
0 .-
01 00
0.)
10 y
4J
Kea
cn
or L.
CD 0
VI 0 C U
atO en 00
••-■
•,11) 0
1, a) >
41: 0 al 00 10
.0 CO

2
Digest No. B402--Con.
II. Comments
Description and uses
Melamine is a finely divided white material, usually formed by heating
urea and ammonia under pressure. Virtually all melamine produced in the
United States and abroad is consumed in the manufacture of melamine
formaldehyde resins, although the chemical may also be used in the manufacture
of fire retardants, stabilizers, and ion-exchange materials.
U.S. producers
There are two domestic producers of melamine, one of which is a large
horizontally diversified and vertically integrated chemical company. The
other firm is a joint venture which produces melamine as it sole product. The
producing plants are located in Fortier, La., and Donaldsonville, La.
U.S. consumption and production
U.S. production of melamine in 1978 was 112 million pounds, valued at an
estimated $40.3 million.

3
Digest No. B402--Con.
U.S. exports
U.S. exports are classified under a provision covering polyamines and
their salts, they are estimated to have been 10.4 million pounds, valued at
$14.7 million, in 1982 (table B).
U.S. imports
In 1978, imports of melamine were 27 million pounds, valued at $8.3
million. In 1982, imports declined to 22 million pounds, valued at $8.6
million (table C). The Netherlands, Brazil, and Austria together accounted
for over 87 percent by quantity of total imports of this chemical. The ratio
of imports to consumption fluctuated from 21 percent by quantity in 1978 to 18
percent in 1982. This ratio rose to 21 percent during the first six months of
1983, an increase of over 10 percent from the corresponding period in 1982.
GSP imports of melamine have grown dramatically in recent years. Brazil
has become the major GSP source of melamine, and imports from this country
rose from 121,000 pounds, valued at $39,000 in 1979, to 4.2 million pounds,
valued at $1.4 million in 1982. Brazil accounted for over 91 percent by
quantity of total GSP imports of melamine in 1982. In the period. January-June
1983, Brazil accounted for over 65 percent of GSP imports of melamine, and
nearly 22 percent by quantity of total imports of melamine.
Prices of imported melamine averaged
*

4
Digest No. B402--Con.
Position of interested parties
The petitioner, Melamine Chemicals, Inc., has stated that imports of
melamine from Brazil have caused substantial injury to the U.S. melamine
industry. Although only one domestic producer regularly sells melamine in the
merchant market, the petitioner contends that continued imports of low-priced
melamine would result in plant closure. Additionally, because of the large
Brazilian plant capacity, a Brazilian ban on imports of melamine, and a lack
of favorable market conditions, the petitioner feels that either GSP treatment
for melamine should be removed or that Brazil should be deleted from the list
of eligible GSP countries.
No submissions were received from other interested parties.

5
Digest No. B402--Con.

6
Digest No. B402--Con.
IV. Statistical Data
Table A.--Melamine: U.S. production, foreign trade, apparent consumption, and ratio of imports to consumption
(Quantity in thousands of pounds; value in thousands of dollars; unit value per pound)
• .Production Period . 1/
• Exports :
: Apparent Imports : consumption
Ratio (percent) of imports to consumption
Quantity
1978 : 112,158 : 11,194 : 26,932 : 127,896 : 21 1979 : *** : 5,382 : 20,742 : *** : ***
1980 : *** : 8,622 : 13,724 : *** : ***
1981 : *** : 11,947 : 29,410 : *** : **A
1982 : *** : 10,402 : 21,623 : *** : ***
Jan.-June: : : : 1982 : *** : 6,088 : 11,005 : *** : A**
1983 : *** : 3,874 : 9,662 : *** : ***
Value
1978 : 40,377 : 17,004 : 8,330 : 31,703 : 26 1979 : *** : 4,931 : 7,855 : *** : *** 1980 : *** : 9,016 : 5,640 : *** : ***
1981 : *** : 12,216 : 12,115 : *** : ***
1982 : *** : 14,663 : 8,650 : *** : ***
Jan.-June: : : 1982 : *** : 7,429 : 4,423 : *** : ***
1983 : *** : 5,631 : 3,780 : *** : ***
Unit value
: • . : 1978 : 0.36 ' : 1.52 : 0.31 : - : 1979 : *** : 0.92 : 0.38 : - : 1980 : *** : 1.05 : 0.41 : - : 1981 : *** : 1.02 : 0.41 : - : 1982 : AA* : 1.41 : 0.40 : - : Jan.-June: : : :
1982 : *** : 1.22 : 0.40 : - : 1983 : *** : 1.45 : 0.39 : - :
1/ * * *
Source: Production, Synthetic Organic Chemicals, United States Production and Sales, U.S. International Trade Commission, except as noted; imports and exports compiled from official statistics of the U.S. Department of Commerce.

00141CD.- 4' MI 0 CO *Cr CV ND 000. N N .41' Co Ps CV %IC 0000
.-
•• •• •• • • •• •• •• •• • • ••
00 CD 0- U1 ,41* =NUN ..d• UN 00 WIND .- UN CD U1 ^ N AAN
N1
•• • 0. • • • • •• • • •• • • • •
00 w- .- N ND M 111 If) N.:CND.- WIWI Ul r 00 .7. NO CU
• • •• •• • • •• •• •• •• • •
NNIC,C, NNCN ONDWI
MO.-.D ND.-CD
M ^ CV
•• •• • • •• • • •• • • •• •• ••
CD P. NOCK)... 00 CD N CD 00 ul NI ON a. Pe)
U1
• • •• •• • • •• •• •• •• • •
NowNoultn-N 00 NI CV •-(VCV O 111 •-•
. •• •• •• •• •• •• ••
CN .4f CN UN CO 00 UN CC ,t1C..
woNor.
('P1)
• •
CO
• •
cv CO
• •
%It ON
C 7 O
CD . cb O
iN dr er.
C
3
• •
00 00 0
ND
C`.1 0
O
C.
CK
• •
•• •• •• • • 06 Oa • •• •• •• •• •• • ••
I I I 1 I I I 1 I I I I I 11 I I I I 11 I L .-I I 11 1 al 10 E 10 •••4 £ 4' 3 Cr MI •. M •-■ 4-' 0
.•.- C C -0 N C Lo- 01• ..-CC -ONCLo-01- 01 M o- ,I3 -1Jo- .4.' N 01 (0 ..- (0 41 o- -V N .-1 ahL C o- M In MI --I •-1 f3.Y C o- M VI en .-■ al to M 3 0. 3 L .4 0 M III 3 O. 3 L .-I
CO -'7=000.4C0•2 03 -)=C...)11)0 4C01 4C
(1,000 dollars
)
• • •• • • . • 06 • • • •• •• •• ••
I I I I I I I I 1 I 1 I I 11 1 I I L. •-■ I 1 1 IV MI E m •-■ £ 41 3 01 ID •••0 M •-0 -V 0
ON CV
N
• •
C. qr UN .4. wl r. re) .0 '3 Li) .- 0 It) CN ulc. CD UN UN .7'C404
.4 •
• • •• •• • • •• • • •• • • •• • •
NI NO No
NO ^ re) NO ^ C. UN CO ND CD V.0 UN .7' CO CD 00 C• OT K3- ND CD OK N. N UN UN
01N-- --
0
CK
UN UN NI .- UN en • C. ...I• CV .4- N. re)
un CN r.Nr
qt
M NO NI 0 0 NOM 0 OI.M UI NM MO en in CV Ln •d• .•-•
0 0
N.
N000.0No11Nicon NINrCr.MW ,
NoiNire)Nr OmND . . •
cv C4.- NI
•■•
• • •• • • 0.* •• •• •• •• •• • • • •
7
.° •It ND CN ND CV u1 ▪ CD N CD .- N. /0/
..41. I./ NI UN NO NO N.0
1.6 •••
•• •• . •• • • • • •• • • •• ••
•• •• •• •• • • • • • • •• • • • •
CD OK ND O. ND 00 0- CD ND MOD"- P. WIWI .- CD u11.N1 CD UN .- qrul
.- re)
• • •• • • • • •• •• •• •• •• • •
• • • • • . •• •• •• •• •• ••
• •
• •
CO
M CO
0 C
C
O
E
4)%
a
C
a.
.0
-7 • C
-C U
E U
E 0
O
'0
L 63 0 ON
0 C
•
• I
•• ae C c En
m c
1 1
Co
0 -4
•• •• •• • •
••■ so
0
.0 00 Olt Of
Co
CO 0'
OS O0 ••■ 40
O
O.
06 OS 00. .1141
CO
0. • ■•
Digest No. B402--Con.
UN C. 0. WI CN 0 It) P. It) o N 00 NT
• • • • • • • . • UN P. CV UN CD 0-
4,1) N CV
• • • • • • • • •• •• • • • • • • 4,
CN CD .- CD CN ND N.
•
re) N- VD CO . . . . . • . .
cp 0 .0 N- te) U1 0 Ur CV
•• • • •• • • • • •• • • • • ••
^M UN UN N 03 03 CD 00 UN N 0- MI NO CD .- 00 • • • • • • •
CD UN o^ ND M ^ ND CD
• • • • • • •• • • •• • • •• • • ••
ND 00 CP..- 00 CV WI No N O n co .1. o0 ,4- 00 • • • • • • • •
.- epee:1042N.- NCI 40 "- C4
•• • • •• •• • • •• •• •• • • • •
CO ••-• 111 CV CV co c) •-• c) N. CO NO U) 0 N. 03
. • • • • • .. • N- CV Os 0 LCIPM C. 0 4.0
•• •• • • • • • • • • • • •• •• 00
OP. UN ON CD UN CD WI ND NO 00 ON NO MI Noir' ^ 00 • • • • • • • •
CD CD.- CD N. 0- 01.- CD
4.11P • .-
•• •• • • •• • • • • • • •• •• ••
ON Ul Of) ON CN ND ONO C, 4=i UI N No as cu CD .0 Ch • . • . . • . • •
CD CD in CD ND 0 ..,1r CD
•• • • • • •• •• •• •• •• • • •• • • • • ••
I I I 1 1 I I I 1 CI)
LOI I I Om
E m mi. 7 0110-4 (5-44.1 0 ...CC'ONcL-o> Om-m-P4JN a -4asec-mom-4 O m m3amL-4 Wn=Uttloawa
•
U
O C.)
4- 0
4.1 C
E
a a
=
0
4- O
in U
-I'
-p 10 -p
U
4- 4- O
E O
- a
O C.)
••
U
0 V)
Ny
CNJ O
0
value (per pound)
CV Cr,
O
("4 In
C 7
tO
C
00 00 0*
O0 %6 01. 1,0
0
z

1
C f0
• • •• I .
.0 ••
N 00
N 00
CO
•••
O 00
• •
c• t. C•
4) C
.- 0001.0aMmau1
.-a.or..coMMao C.1.0
01.- N
• • • • • •
a 0.1 M a ulu1 hl 00.- a nay, CD CD ODO If) CD Mb/
6 • • • •
0' Na..0a.o.0 00 r. ululaaulao-cr.N .- Na.- soMN
•• •• •• •• OS •• •• •• •• ••
oaaul7c2.-.0a
Naaao ma•a,
a•amr. mulu)
N
•• •• •• •• •• •• •• •• •• ••
Cr CD CD 01 CO CD Cr CD r, M N N00 P, 060 CD SCOW) 'Cr C./
ft CD •■•••
•• •• •• •• •• •• •• •• •• ••
0.."0•000 6''06 1:1 ste4M O strs.
NN
N CV M CV ••••
N
so
CD CD
NI N
N
CD
st
C• N
Cr N N
1.1
N
N
CD N
CI 7
(I)
NMCOLNNWts“OW ...C•00O•NNNC•S0 1•1 6.tr, NM N
•• •• •• •• •• •• 00 •• •• ••
N1 r, 141" WI. ON."' CD NI 121 N1 CD a m Mc0.0 ∎"N
N.-
100 •• •• •• 0. •• •• •• •• ••
St U1 M CD CD vr CO a a Ul
h.
o• •• e• •• •• •• •• •• •• ••
000 NI CD I CD...Y.0 01211.6.1■ 1■ a M m 00 .000 CU .4,
•• •• •• •• •• •• •• •• •• ••
O 1 p. a 00 I a N r,
c.d.&
•• •• •• •• •• •• •• •• •• ••
ooch.4- I CO 1 S CD ts./611/1 0• re)
Cr
CO N
M
M N ■I•
••
Ill •C)
CO
ul
N
In
In 00
.-N.0aNWMaaa aMMM•0MMaaM
0000coaczacpc,
0$ •• •• •• •• •• •• •• 00 ••
MI CN Poo Oh No ND s7MN1MCDN10101:1 • • • • • • • • •
000000000
•• •• •• •• •• •• •• •• ••
M 4. 030 a CO r. P. hl M M, M1 Ohl st Cr
• • • • • • • • • 0000 CD CD CD CD
N.O0043.- 1.0N aMMMu) MSS
00000 oam N
•• •• •• •• •• •• •• •• •• ••
Cr MI.1Cr N1CrCrCr • • •
CD CD O CD CD CD CD
oONNINI0amoo mmm a Mmillm
aaa o aocoo
•• ••
O
00 ••
CD st
CD
•• ••
•••
O
•• ••
CD
•• ••
• CO
M
4'
O
In 0
4)
U)
0'
0
•• •• •• •• •• •• •• •• •• •• •• • • •• •• •• •• •• •• •• •• •• •• •• •• •• •• •• •• •• •• •• •• 9- 44.•
N OI. OS0 001.5 N I v- 1 00 I CV a .- O 00 00 I. m op
a a ul M CO WM=
S a N M In a hlm Cu
• - • • • • M
1. ft ft N S N N co
o a aoaa O L
N
•• • • •• •• •• •• •• •• •• •• •• •• •• •• •• •• 0. •• •• •• •• • •• • • • •• •• •• •• •• •• • • •• •• •• • • • •• •• •• •• •• ••
I I I I I I I I I I I I I I I I I I I 0 I I I I I I I I II II I I II III C)
CI I 1
I 1
II 1 1
I I L.-4 I
MI 1 1 1
I I I L.-I I
I 1
1 1 11
1 1 0 1 L M
0 1 I 1 1 0 M 1 1 1 1 0 M 1 I 1 I 1 0 M 0,1 M M EM X.I., M M EM ..C4) M M EM IML 0
7 .0.-1...-LIL..-MM4)0 17.-40--FoL..-Mm4.0 0 M.-e..-40.L.-.17m4.1 0) O .-1...L..-OCCM01-. .-1.-L•01CCT101-- .-1•.-L•..00CMO> 01 MNI4JMOMMM ZN-IJMOMMM MN-1JMOMMM < O
-1., MM3 E.-IC.-4 -1.+MM3 E.-IC^1 4+M1a2 E-4C.-4 aLnnLoom...q aLnnLoom-4 alL7CLOOM.-4 Zon<YLLWO..04 2000NCWWW.0< =02.:CYLI-WO-U<
CI
.0
I-
Department of Commerce.
(1,000 pounds
)
(1,
000 dollars
)
Unit valu
e (p
er pound)
1982, and
C 7
C
N
CO
. a
by prin
cip
al sources,
O
a
to C 0 0
0 4-
O a EM
0'
0 • W MC
N 1 C
L
M C m
Digest No. B402--Con.
8

I
0 N
• • • • •• ••
so I I In
•— I
VIM
C
1978-82, January-June
N 4.2
Quan
tit
y (
1,000 pounds
)
en •
C
C
C
C
I 1 I
r4,
C
I I I
•• ••
• • a SI
.••• C 31■ og
N C
3 A I I. 0 0 o OC 4—
I. • •
Department of Commerce.
00
• I. o 0
9 Digest No. B402--Con.
N Ia1 1 un
N I P
NW,
•• •• •• •• • •
I II I
e•I tiO •4:o P N g:t
•••• •••
.• .• •• ••
.••
0% I I fel
Value.
(1,000 dollars
)
•• •• •• •• ••
•• •• •• ••
I I I
•• •• 04 •• •• •• ••
44 rI4 OS .I.J
iI
-•w C r* ....1 •.• C 01 0 01
1'4 0
•... C a ••• . C II Pi ii 2 N III 3 A II ..- a E •••• L 0A •. 0 A
10 OC 4.- to Og I.-
•• •• •• 00 ••
••
(per
pound
)
•• . •• •• •• •• ••


1/ Rate effective prior to Jan. 1, 1980.
N
Of
a.
N
c0.
K
co
Irk
cr.
••■
rs.
4 .7
Direst No. B403
N • 1.1 03 47
• L 0• 0 • 0 0
• 0. • • C
40.
••••• • • • • • • • •
N 44. 0 Pt
• 4-4 47 7 0 4.)
4-4
0
•• ■ V 0 o. N 1 0) I
CO
co cf•
in co cr,
N
00
4-1
0
Z F., Li X
•
>, 1••••
0 LI •0
• g•-■ 7 0.4 ✓ 0
TSUS item
O
Description
TITLE: C
itric acid
I. TSUS item number;
description; tariff rate information; U.S

2
Digest No. B403--Con.
II. Comments
Description and uses
Citric acid is a colorless, translucent, crystalline, organic chemical
that is also available in powdered form. It is odorless with a strong acid
taste. Its hydrated form releases water vapor spontaneously in dry air. It
is very soluble in water or alcohol. It is generally recognized as safe for
ingestion.
Citric acid is produced by the fermentation of carbohydrates from
molasses, corn starch, or lemon, lime, or pineapple juices. It is recovered
from the reaction medium by using milk of lime (calcium hydroxide) or a
patented liquid extraction process. Some plants have the flexibility of using
normal paraffins as feedstocks instead of or in addition to carbohydrates.
Other methods of producing citric acid have not been commercially adopted.
Because of the ease with which citric acid can be produced from a wide
variety of basic agricultural materials, the fermentation process has become
very attractive to those countries building new chemical industries with
little chemical expertise. This has proven to be especially true in some less
developed countries, where agricultural feedstocks and low cost labor are
available.
Citric acid is used as an acidulant in beverages, confections,
effervescent salts, pharmaceutical syrups, elixirs, effervescent powders and
tablets, and foods; as an antioxidant synergist in foods; as a sequestering
agent; as a water-conditioning agent; as a detergent builder; and as a
mordant; in the manufacture of alkyd resins and cheeses; in cleaning stainless
steel; and in removing sulfur dioxide from waste gases.

Digest No. B403--Con.
U.S. producers and employment
The U.S. producers of citric acid are two large, 4iversified
pharmaceutical companies. Miles Laboratories, Inc., owns citric acid plants
in Dayton, Ohio, and Elkhart, Indiana. Pfizer, Inc., owns citric acid plants
in Brooklyn, New York, Groton, Connecticut, and Southport, North Carolina.
U.S. capacity is estimated to be more than 400 million pounds per year.
Employment is estimated at slightly less than *** workers and declining.
U.S. consumption and production
*
U.S. exports
U.S. exports of citric acid were 20 million pounds, valued at $11
million, in 1978. They peaked in 1979 in terms of quantity at 44 million

Digest Mo. 1403--Con.
pounds, valued at $27 million (table B). They decreased 43 percent in terms
of quantity to 23 million pounds, valued at $20 million, in 1982.
. Australia was the principal market during 1979-83, replacing Canada,
which fell to third largest in 1979 and 1982. Other markets where large
quantities of U.S. citric acid have previously been sold are the Philippines,
Argentina, and Belgium.
U.S. imports
U.S. imports of citric acid have been rising steadily during the last 5
years. Imports were 5.6 million pounds, valued at $2.6 million, in 1978. In
1982, they increased to 23 million pounds, valued at $14 million. For
January-June 1983, they increased 74 percent to 18 million pounds, valued at
$11 million, compared with 10 million pounds valued at $6 million, during the
corresponding period of 1982. The principal sources of imports of citric acid
in 1982 were Belgium, the Federal Republic of Germany, and Austria.
GSP imports of citric acid have also risen, from 198,000 pounds, valued
at $107,000 in 1978, to 903,000 pounds, valued at $534,000 in 1982. However,
during 1978-82 these imports have represented less than 4 percent of
consumption. This increase in imports from GSP countries is primarily the
result of new foreign plants beginning production. In the first 6 months of
1983 Israel and Mexico together accounted for over 84 percent, by quantity, of
GSP imports. Most imports come from non-GSP countries, with 11 percent of the
total originating from GSP beneficiaries in the first 6 months of 1983.

5 ••
Digest No. 8403—Con.
The unit value of sales by U.S. producers
* * * * *
1 /
Although domestic consumption during the period 1978-1982
*
Pricing has been a factor in the increasing domestic market share for imported
material, and domestic producers have expressed concern over the rate at which
such imports are rising, especially duty-free GSP imports.
Position of interested parties
The petitioner, Pfizer, Inc., one of the two U.S. producers of citric
acid, argues that citric acid is an import-sensitive, homogeneous, fungible
product. The quantity of duty-free imports has increased in addition to
increases in dutiable imports, and this competition has suppressed prices and
sales. Market share is allegedly being lost due to the quantity and pricing
of GSP imports in particular; for this reason, the petitioner contends that
citric acid should be removed from the list of articles eligible for GSP
1/ Commissioner Stern notes * * * GSP imports are
priced higher than citric acid imports from the developed countries which are the principal sources.

6
Digest No. B403--Con.
treatment. The other domestic producer, Miles Laboratories, Inc., supports
the petition. The Israeli producer of citric acid argues that GSP imports
represent less than 1 percent of consumption, are higher priced than non-GSP
imports and therefore, eliminating GSP status for citric acid will only result
in increased market share for the developed economies, rather than an
improvement in the domestic industry's economic condition. Also, in the case
of Israel, GSP status has not been eliminated in the EC.

7
Digest No. B403--Con.
*

8
Digest No. B403--Con.
Table A.--Citric acid: U.S. production, exports of domestic merchandise, imports for consumption, and apparent consumption, 1978-82, January-June 1982, and January-June 1983
(Quantity in thousands of pounds; value in thousands of dollars; unit value in cents per pound)
• Year
Produc- tion 1/ 2/
: •
Exports : : Apparent :Ratio 1/ (percent)
Imports : consump- : of imports to : tion 1/ : consumption
Quantity
1978 : *** : 20,050 : 5,612 : *** ; *** 1979 : *** : 43,760 : 9,263 : *** *** 1980 : *** : 40,676 : 10,227 : *** *** 1981 : *** : 23,508 : 17,138 : *** *** 1982 : *** : 23,265 : 23,098 : *** *** Jan.-June : •
1982 : 3/ *** : 14,068 : 10,343 : *** *** 1983 : 3/ *** : 5,426 : 17,952 : *** ***
Value
1978 *** : 11,491 : 2,625 : *** *** 1979 *** : 26,962 : 4,255 : *** *** 1980 *** : 30,745 : 5,700 : *** • *** 1981 *** : 19,146 : 10,206 : *** *** 1982 *** 19,827 : 13,623 : *** *** Jan.-June : •
1982 : 3/ *** : 11,257 : 5,999 : *** *** 1983 : 3/ *** : 5,471 : 10,764 : *** ***
Unit value
•
1978 ***-: 57 : 47 : - : 1979 *** 62 : 46 : - : 1980 *** 76 : 56 : - : 1981 *** 81 : 60 : - : 1982 *** 85 : 59 : - : Jan.-June :
1982 ***.; 80 : 58 : - : 1983 *** 101 : 60 : - :
1/ Business Confidential 2/ Production values estimated by applying the unit value of sales to
production quantities. 3/ Extimated by the staff of the U.S. International Trade Commission.
Source: Production, Synthetic Organic Chemicals, United States Production and Sales, U.S. International Trade Commission, except as noted; imports and exports compiled from official statistics of the U.S. Department of Commerce.

CT NM N. C•• p. ND ND r, cl"O r. '0 • • • • • • • • •
CD CD CD CD CV CD CD CD
•• • • • • • • • • • • •• •• ••
rl rl CD N ■- P. ND r. Un P. 00 NN • • • • • • • • •
CD CD CD CD 1.1 CD CD CD
•• •• •• •• •• •• •• •• •• ••
• NI so 00 Un .- .40 N. N. ND 00 us 01.0^ • • • • • • • • •
CD CD 0 CD CD CD
•• • • •• •• •• •• .• •• •• ••
N r, WIN•) CV C• ND U1 NO ND r, N. C• N. 40 .D 00 • • • • • • • • •
CD CD CD CD CD CD CD CD CD
N Co s:r .OT UI CNN. 00
UI Ul UI U1 ND ND U1 UI ND • • • • • • • • •
CD CD CD CD CD CD CD CD CD .00
MS NI .1- .DS un NINO un un N1 .0 UI 00 WI C• • • • • • • • • •
CD CD CD CD CD CV CD CD CD
oo
O
co
O
Co
O
O
a) C
C
CO 1
Co
CT
U1
0$
L
E
rD 0.
U C
•-•
- L. 0.
al In
C ro .c U L
E
U
E O
• -
OM co CT
L 0 0
C X G1 -1
• > un L
• ro
C 10
-0 -1
U 'D ro c
ro U
L N
C•
CrCI
ai
•
tn
C
O a.
c)
C ro
CY
•• •• •• ••
CO 0•
0, N
4..
L
CD N qD No, Un 0° NO O•CTUICT op CD 01.0 co N
CO itt -- co on N re) ND P. 00 CD N. Ciscn NO M.:run.- N.-
M an UI UIM CD NCI N 401% r, Cr. ND qD NO No re) • • • • • • • •
CDC, CD CD,...) CD CD 0^ 4.0
•• •• •• •• • • •• •• • • • • •• 4. •• •• •• •• • • •• •• •• ••
L
.-4 0
CD
of 7
0000.- ND ND P. un N. .- 0. e4 UI WI C. CN CD .- Nr Co Nr ND CD U1 UI Cr NI
MCV^^ rn
••
UINIUICN Nr 00000 re) UI CD 00 U1 CD O. CO N N 00.O Co 00 .0 00 eg CD r. p.
ND re) N.- ^ un rn
•• •• •• •• •• •• • . • • ••
CT N re) ND CD UI CV UI .D • - ■- Ul c• M ^ r. N)Ul00NNN^U1M
.- Ul
.• •• •• .• •• • •
P. ND CN CD CV .4- CN CD NI ND CN ,0 MM C• CD CD 0• 4- .4r UI un so
N.- un c>
CD NI Crs 00 -- eV CD Nt •■•• 00 00 WI ill N. Nnr.cr, r. o CV CD CD Nr N
OUIJ NN^N
•• •• •• •• •• •• •• •• • • ••
NJ NN U'.41* Ul 00 r, CD
U10 MO UI UI MO' N slt .- (VP. CZ
Un ■- P.
CD
1 1 1 1 1 1 L. 4.4
ro E
VD -1-• 0 4-1 -la 0 L C -0 L OF-
M a) al 17 a) In Q C C N • MI ros - L0 .-4 < 00.Z.CCOZ‹
• Co ul.- CD N^ N o crs ■-• es,) c. r.
r, un .1" rl Nun
N.- ^ re)
•• •• •• •• •• •• •• •• • • ••
ND WI ND ND MO eg 00 •42' N 00 cD U1 NI 000^ N. CT 01 cD 000 UIUIN1
• Nr CV CV.- ■-
•• •• •• •• •• •• .• •• •• ••
CD 00 P. P. VD CD ND CN MI • P.00 U1 NI CO P. CV ON NUI 00 00 U1.- N) O•
.2* es.) CsJ un
•• •• •• •. •• •• •• •• •• ••
N 00 CD 00 re) NI NJ 40 N UI 00 CO
1
MI r, .- P. s:r CD re) .:*" rs. •43 o Ms.? CO .10 01 N r'•- . . . . .. .
...0N M. 4.- .- ..... 01 CD ...- NI
.1' CV No sr r. ND WO, CV CD ND CD N CD N. C' CD NI ND • Nsj 01 ciC CT
.0 MN ^^ ,D
.0 st .4N CD CV NO-N. ND UI CV O^ NI NO as O N Nn yl ■- ■- ^ 4D
pe)
N U1 CV
N CV 00
C.
CT
oo CD un
NI
al U
al
E 0
4- O
C al E
•++ 1.
C
(per
po
un
d)
• 4J,
CU .0
11- 0
In U
-1J tri
ro
U
11-Le-O
O
Li-
al
- a E O U
al U
O t.r)
1 I 1 1 1 1 I I I I I I 1 1 1 I I I I I 1 I I I I I I I I 0 1 I I L -1 I I I L. cr 1 I t o n) 1 I I a1 rO
.-4 10 E ..0 -1-, ..4 to E -C L M M OL ..- -1.4 7.-1 -14 o ro M CIL - -IJ 7 .-4 -1-1 Cl L C -0 L C .... 11) 0 I-- L C -0 L. C•.- 01 0 >
.4... M el) •.4 CD 01 CT CU •1•' co M •-4 0 0 01 CU .4:C In a C ••- crcr-IN•-, 111 Cl. C .- CT 17.-11.4 ...-1 O M RI _C - L 01 .• 0 01 M Z • L 01 •-4 •c:C nUCLZ44CCOZ42 4:C -) C.> 0- Z ..cC 02 Z .41C

1978-82, January-June 1982, and M
03 cr
1 — 1 al C
L 17;
C N (0 00
0•
N 00
U
0
a U
.- L a
C O
a E
O U
L 0 4..
L o a E • re)
c.n • as
00 0•
O
00 0•
0•
0,
00
al U
O
00 Cr 04 NO Ul CD Cr 00 NO Nr e%1 C4 00 00 cr N CD
• .- MINIM, Nair
rs.
•• •• .• •• •• •• •• •• •• •• •• ••
ON.- No co N NO N co CD Nr U1 ND M. P. U1 NO 00 U1111 OD
• N
00'0 .Dr O. CD ND N N CD ND • cr O^ O. UI ND ON NN Cr r, 00 cr cr eq ■- *- ■- . . .
0• 0 i*1
00
co
N
CD r, 6.1 in 00 Cr I ND 111...? OD ON CD NCJ SU1rr • ul 00 00 N
• • •• •• .• • • •• •• •• •• .• •• ••
cr cr cr 1 ul 00 No 1 v- -- NM S O re') 00 00 00 coin *0
N
U1 00 00 U1 1.11 U100 ND No CD 00 ml ftl C• U1 r. co co N. N.
CD N^ N
U1M N
• • •• •• •• • • •• •• • • •• •• •• • •
.2' U1 CD MI1111U1 111 ND CU cr 00 r- 0- 00 N cr CV
cr
cOsr111111103co M ^ ^ PI (11.1'
r, ND 1 n ^ 1 1 U1 .- U1 N NoCr cr Osi cr N ^ n1 N
N —
cf. No U1 cr I N. ■-• 1 00 I 1 — MO 0 Nr re)
▪ CD NO N Cr 1 44-r... Nr CD .0 ND U1 42 .0 U1 111 fol N,
• • • • • • CDC, CD 0 CD CD 0 CD CD CD O
•• •• •• •• •• •• •• •. • • •• •• ••
CO CD N7 OD 1 00 vD rn 1 C^ CO • ,JD U1 ul Nr 111tH CD N3 • • • • • • •
CD CDC' CD CD CD CD NI CD 4.0
•• •• • • •• • • •• •• •• J• •• • • ••
CD CD ND 00 ^ CD NO MO M N ND ND Ul ND ND U1 0 ND ND • • • • • • • • • •
0 0 CD 0 0 CD 0 0 0 0 0
• CD MI O. 1 1 1 1 U1 re) 0•
ND ND UI 01 slt ND L171 • • • • • • •
CD CD CD CD CD CD CD
•• • • •• •• •• •• •• •• •• •• •. ••
N. re) 11 I 1 I 1 I 00 UI UI NS ND
• • • • 0 0 0 0
Ul ND ND MI I r MI 1 I U1 c• rrrU1 sn cr cr cr • • • • • • •
0000 CD CD CD
MI 00 111 CD I r0 I MI I I Nr cr cr Ul ul No UI
• • c) c, co co
41),
O N
O
O N.
U1
MI N ND
MI
Ul
N
tri N
N
0• 0•
Ll1
(per pound)
O
CO
co
O
0•
O
O
UI
O
O
Department of Commerce.
(r)
g
4.0
4. 0
1.11 C)
Cu 4)
fa
U
4-
O
E O L
••-
4-
o -0 c) al
c a • C .0 0 4, (..)
• cu CJ U -J L
7
-I 0
10
U1.- CN 00 CD CD CD CD cr. in 0c 00 C,J ^ ^.DM
cr re) ul 00 ^M ^
r. ul CU r.
O r 000000000.0 M
va
r-. N
• CD r CD CO CD CD CD nn • cr 00 .0 00 -- 1 . 00 00 • r∎ N
N
• MI 00 MI CD 00 CD Ul CD CD ‘41- Ms r. CD C• .-1 .- r. ON '0
• N
.• •• •• •• •• •• •• • • •• •• • • •• • • •• •• •• • • • • •• •• •• •• • • • • •• •• • •• •• •• •- • • •• • • •• •• •• • • • • • • • • •• • • ••
1 1 1 I 1 1 1 1 1 i 1 1 1 1 1 I 1 1 1 1 1 1 1 1 1 1 1 I 1 1 1 1 1 1 1 I 1 1 1 I 1 1 1 1 1 1 11 1 1 1 1 1 al 1 1 1 I t. .•1 , 1 1 1 I I- .-4 1 1 1 I 1- Cr 1 1 1 1 al ra 1 1 1 I C.1 flil 1 1 1 1 al M E ECU Z _C 4., EECO E -C -v EECO Z .CL. 7 Li.- ...1 0 • 17-1-, 0 D L. •••• .--4 0 >. Cr -1-, 0 D L ••••• .--1 0 > Cr -1-, al
....
al L > 0/ U C GJ ro c o 1-- ..- GI S. > 131 U C of 03 C 0 1— - co L > 0I LI C: CJ r0 C 0 > 0'Q4(0.. al ..% a •- at., -4... -4 m - ra s c - o'co -1-■ -I iv •- m s c • - .<c -1 in m L x a L - >e -4 -4 in m L x a L.- le -4 -4 ill m L X D. L •, le •-, al L 0 .4• In 0 rt: 7 -,: —I al L n 4) 1/1 r.1 eJ 7 _C ..• o L D-10 Ul CU ro = J: ...1 an U. cc .-1 1-4 1: -1 p.- (..) = cz 00 U. 4I 1-1 1-4 1: -1 N. (.1 :3 cc MU. <Cm-IN-I 2: -1 1-- C) :3 ct
C
0 a CD CD O
4) C
• -
CV N
co
Nr)
N
N
111

11
Digest No. B403--Con.
Table D.--Citric acid: U.S. imports for consumption from GSP countries, 1978-82 January-June 1982, and Januay-June 1983
Source • • 1978
: 1979
• : January-June--
• 1980 1981 1982 1982 1983
Quantity (1,000 pounds)
Israel--- : 0 : 0 : 0 : 0 : 419 : 0 : 1,3 Mexico : 198 : 88 : 0 : 0 : 290 : 72 : 3 Turkey- : 0 : 0 : 0 : 0 : 162 : 162 : Thailand : 0 : 0 : 0 : 0 : 32 : 0 : 1 Taiwan- : 0 : 0 : 0 : 0 : 0 : 0 : Brazil : 0 : 0 : 44 : 0 : 0 : 0 :
Total : 198 : 88 : 44 : 0 : 903 : 234 : 2,0
Value (1,000 dollars)
Israel : - : - : - : - : 255 : - : Mexico : 107 : 47 : - : - : 175 : 35 : 2 Turkey- - : - : - : - : 86 : 86 : Thailand- : - : - : - : - : 18 : - : Taiwan : -: -: -: -: -: -: Brazil- : - : - : 29 : - : - : - :
Total---- --: 107 : 47 : 29 : - : 534 : 121 : 1,2°
Unit value (per pound)
Israel : - : - : - : - : $0.61 : - : $0.t Mexico : $0.54 : $0.53 : - : - : .60 : $0.49 : Turkey : - : - : - : - : .53 : .53 : Thailand- : - : - : - : - : .56 : - Taiwan : - : - : - : - : - : - : .t Brazil : - : - : $0.66 : - : - : - :
Average : .54 : .53 : .66 : - : .59 : .52 : •t •
Source: Compiled from official statistics of the U.S. Department of Commerce.


DI 4)
+ V A.)
We V 0 40 ce V N
U•I 0 N
+
► e CO N
to 0 ..
• 4.1 9 7 V V 0
VI 0
+• -. .0 4,
N pa V = We L.r., en of 9 0 N. el N
.-4 at at
O
0
ca
4)
C
.0
0.
F. F.
TSUS(
A) item numbe
r; Descrip
tio
n
CO 0, •■••
• • •
40 40 cr•
CO
•-■
or after Jan
effec
tive wit
h
Digest No. B601
..0 el .4. .--1 1•••• VI ....1 ,s,
Cv
we tin 47
.. .. .. .. .. + V/
•
+ CA
.. .. .. ..
+
V .4
V/
a) +4 - at at
O • un at •
▪
We e4 u'.V 44 IN.t V 44 00 V 4.3
on • .17 0 N
• .0 C
.. M.. .7 10 , • a 0 •0 VD 0 V .. N V
.. .. .. ..
to + to + 0
iN: 114 •
•
It //k a: tot . -.. un 4 v Os 'V 4, ■0 in TI 4.,
• 'V 0 • 9 0 • Ts 0 at •c N 0 9 co en o .o) on Z. 0 V N
. . .. . . .. .. .. .. . ..
+ to + 0 + to
a) a) 0 Z.: Ire • ,t! 0 ,r," we - 0
N V 4.4 00 , C•1 V 44 44 V 4.1 ••- • 9 7 • V 7 • V 7
IN CO 0 V N 47 0 V .0 N 0 '0 N
.. .. .. .. .. .. .. .. .. .. ... en to + to
O 4. 0 43 1.4. We • .4 We r....1 Ile • .4 Ire Cr. el V ., CO p4 v ... sc 0, V.. .0
• V 0 .7 V 7 • V 7 N. O. al V N • 0 V .0 N 0 • CO
37 .. .. .. .. .. .. .. .. .. .. .. .. .. .. .. .. .. .. ..
4. V) to + to
• . CV + 0 0
A we ..., we we • .. We al N I:1 44 CO We V +3 30 V +4 .0
• 9 7 PD 9 0 a. • II 7 VC 0 m9 N • m 9 r... CO m V 0,
•-• .7 .. .. .. .. .. .. .. .. .. .. .. .. .. .. .. .. .. .. ..
+ to 0 + ca
a) 4) al Ft F. et • •-•
g
+ . «. k..2 ire • -. N
M +4 V 4.4 We 17 4.3 tr. el V 4.4 • • • 4:1 0 009 7 • V 0 0
0, .-I al V N • m9 N. CP. m9 .•4 1•••■ .0
.. .. .. .. .. .. .. .. .. .. .. .. .. .. .. .. .. ..
in to 0 + CU + 0.1
... 4. d•P. we 0
we N V 7 We We V 7 w: o 10 0
we .-■
••-• ■•••• 0 9 r) vn 0 V 00 ..4 al V •4
.. .. .. .. .. ..
in en to + 0 a) + 0
c.: ...• + • ... lot 010 V .. 164 9 +. »,•,2 tpe 9..-• cv V 7 el Frt 9 C co co v 7 F
r. 4 9 v, 0 9 1-1 .
ea V .. .. .. . .. ..
. .- . .-. V ••••• • ,. .0 ••••• 9 ta al 9 in al 9 ta 01 + 0 , '0 4 ✓ : an 0 i
.. ..4 w: +.. >, .34 >. + 4.3 >
7 40 4 0 •C 0 .4
O te V V •-• ot "0 •-• itt 0 N 114 we w; o .3•+ •• ■••■ en un CO 4. +4
0, • N
.. .. .. .. .. .. 1
CC 1 a) Cl
4 I 0) I .•. 0, a)
as o 0 0 -•.0 m
a... O. .0 C i
L. .0 0. .0 14 C 0) O 0 C. m .. ..0. to 0
0 .4 L. +3 to c 0 u
+4 .4. +. 03 .0 C • • .0 I 00)4) •-■ o V O 0 8... to I
.. 4
0 V L. C v .0 ....'.4 ILL =4., to. 00 4 O. 411) 0 C
0 .0 (..) .)-). s.) .,
C a. .0 0 0 0 01 0 0 0 Ec 000 .,+.
8.) c.) »1 .0 IV
•••• 00 O. ..../ . la • I 0 0 'Q4)0'044,4) C 0 e 0 t7 ...,
44 0 0 0 0
0 0 e, ... . ..., - •.+
0 .
0 Cl) .0 0 0 0 0 .14 0
•••••• ..., 0 - • • ... ....4 .L. .0 0 0 0 .... *01 4• C4
C : t O. 0 ..- 0 0 . ..-, ?, PO C 0 en 0:1 44 L.,
...1 r•I .. 4. C C 44 +3 V 0 . 0 0 0 4.4 14
a .0 - .-4 44 .40 01
44 44 0 1.1 0 .. a
4.4 .13 I i■ • 0 14 0 0< 44014 inC44 to .4 0 00 .
70.100.10 00 *I W CV 4.1 .. ...0 LO 4.. 0t. 4 c 4C 13 ou 3 0 0 i .0 0 0
• C.) '0 .1.) CP C 0 0 a)
.0 4. al 4.4 44 c 0 0
44 0 0 +4 0 +3 .0 14 0 0 0 44 L. .0 la ,I 0 CO .11 •••• ,I 4./ C..) C> ° tala 0 ..... : :
7 03
0 V 0
C I g 14 0 41 0 09 na Z 6
in tu .0 44 ..0 L. CO .0 .1., 0 4.. •••••• v+1
: O > 0
t t : U3
V to 44 0 o
O 1... ...) 0 Cl. I
▪
v
0 ca .0 C.) .4 od tw a. o to z ... a A. C.)
.. .. .. .. .. ..
co
▪
en on
▪
.0 o
▪
1+1
▪
e
▪
r 4:1 0 .0 .0 N N N
0 0 0 0 0 0 0 F .-. F r4 F rftl ,I
.0 .0 .0 .0 W .0 .0
See
footn
otes at end of ta
ble.

E N co 0 (-4
Ci •11
4.1 14 0 O. • E 44 0
0. .
•
0
12
0 44
C0 14
4-1
4-1
t43
a 0
4.1 0.
U
•0
14 21 .0 E 0 0
CU 1./
co
steel--Continued
Pip
e and tube
O 0
K)
K N
111 03
N •
• • • • •
114
co
• • • • • •
0 (-4
44 ri ri
ek ••• ra
4 O co
O
•
1980 : 1981
. .
CO 0.• ri
co
ri
co co
(-4
N CO 13`•
N ii 0
• 4.1 V .4 0 0 14 11.4 U 0
03
11-1
co
.0 •
1•3
0 Li 0 4.)
id 44 d
0 44 La 444 0
00 0
0 V '0
Id %a0 0 4.)
0 0
.0 0 0 0 4. .4
U ri ..4
4) • 14
•
• •
MI
X 4.1 1.4 . 0
4) V 14 • 78 .4 04
0 0
Descr
iptio
n
2
• 0 a
0
N • .0 CO 0
14 CA 0 • 0 v-,1 0
O. • a -4
.4 .4 404. 00 0
0 CO
4'
14
4.) 0 a
01 0
El 4.) 0 0 0
•0 0 owl
1.4 4, .0
0 0 44 14 A.)
444 I
tw r-1 •0 .0 CO of al 0 0
0 4) 0 .0 1.4 4.) 0 4.)
04 14 a 0 4) 0 0
.4 0. 14
00 0
.• 4) .4 .4 4.) r4
1.1 .0 0 0. 0 44
•••• 40 0 fa 0 .4 0
H .4 .0 44 •••• 141
V 00 0
.4 14 04 0 .4 0 0 .0 0 a) 01 a c • c
o. 0 I..
a
0 • K 1.) m C
0 a 0 V 0
ar 1.) L. 4) 0 0 00 01
C C •0
00 •K 7 V 44 0. 4) 03 0 U 4.) SD ri C .4 V 0 .4 0 0 to Is■ 0) 0 .4 V 0 0 .0 a
C
4) 14 00 0 la .0 .0 7 •••
V a f.) •••• .4 44 0 0 0 0 .0 0 44 C .0
1:1
.0).1 0 .4 .0m 4)
0 .0 • E CO .01 m0
.0 00 a
.17) IC:1 ea .0 V 41
.0 a • 14 a 0 .41 0
10 • 4). 0 a w .0 0 u 0 0 4.) u C
44 4) 4) 44 V14 0 a 0 C .0 0
ti4 03 0 14 a
1: 1.4 0 0 .4 4 a. •• U 7 L 14 0 444 G. 0
C0 .0 .0 0
a 0 4.1
0
(12 4411 .011 ":1 11.1CoU
. 00 14
40 CI
V t .41 •0 0
01 0 4)
I":1 )14 ea. M I-. • cd
sc
.4 NI a 1.01 al 0

3
Digest No. 8601--Con.
II. Comments
Description and uses
The products covered by this digest are nonmalleable cast iron pipe and
tube fittings (TSUS items 610.62-610.66), malleable cast-iron pipe and tube
fittings (TSUS item 610.70-610.74), and other types of steel pipe and tube
fittings (TSUS item 610.80).
Pipe and tube fittings of iron or steel serve to join lengths of pipe in
linear or nonlinear directions. They also provide access for cleaning pipe
systems and a means for branching systems, as well as joining pipes of varying
diameters. Fittings are available in a wide variety of shapes and sizes
including couplings, L's, and T's. Pipe and tube fittings are used in the
water, gas, oil, chemical, and power-transmission industries as well as in
missiles, airplanes, submarines, ships, and in homes.
Malleable cast-iron fittings are made from malleable grades of pig iron
which are annealed following cooling and cleaning. The annealing process
improves the ductility and durability of the metal by reducing its brittleness.
Malleable fittings can be machined and subjected to stress with less possi-
bility of fracture than nonmalleable fittings. Almost all malleable cast-iron
fittings are advanced (machined) after the casting stage. This advancement
usually involves threading. Nonmalleable cast-iron fittings are usually not
advanced beyond the casting stage. The principal applications for all cast-
iron pipe fittings are in piping systems where pressure does not exceed 300
pounds per inch. The principal markets served by cast-iron fittings are the
residential market and certain industrial markets where high-pressure pipes is
not required. Diameters of fittings range from 1 to 6 inches.

4
Digest No. B601--Con.
Other types of steel pipe and tube fittings are generally used with steel
pipes in systems subject to high pressures and temperatures. These include
major industrial oil- and gas-related markets. Diameters range from 2 to 24
inches. Three major categories of steel fittings are produced. Threaded
fittings are designed to be fitted with lengths of pipe possessing
corresponding threads. Welding fittings are produced with specially prepared
edges designed to be welded to other, similarly prepared pipe ends. Flanged
fittings are generally shaped like a ring or collar and are provided with
holes for bolts at the end of the pipe or tube to allow another pipe or tube
to be attached. The use of flanges facilitates the removal or replacement of
lengths of pipe in a piping system with a minimum disruption of the system.
U.S. customs treatment
Pipe and tube fittings covered in this digest have been eligible for GSP
treatment since January 1, 1976. Since that time there have been two
exclusions. Between April 1, 1981 and April 9, 1982 the Republic of Korea was
not eligible for GSP treatment for exports of products under TSUS item
610.62. In addition, Israel was not eligible for GSP treatment for exports
of products under TSUS items 610.66 and 610.71 between March 13, 1978 and
March 13, 1979. There are currently no GSP exclusions for these products.
U.S. producers and employment
U.S. producers are part of the valve and pipe fittings industry (Standard
Industrial Classification 3494) which totals approximately 900 establishments.
There are 114 firms producing metal fittings, flanges, and unions for piping
systems (SIC 34945). Firms range from medium size to large multi-plant
foundries or forging operations. Establishments tend to specialize in one

5
Digest No. B601--Con.
type of product, such as cast or malleable iron fittings and unions; forged
steel fittings, unions or flanges; or stainless and alloy fittings or
flanges. In 1982 there were five known major producers of cast iron
fittings. The four largest companies producing steel fittings account for
about 25 percent of all shipments, while the 50 largest companies account for
almost 90 percent of such shipments. Producers tend to be concentrated in
major metropolitan areas where demand is largely centered. Employment in the
valve and pipe fittings industry decreased from approximately 100,000 in 1978
to 94,600 in 1982, which is believed to reflect the employment trend
experienced by firms producing pipe and tube fittings.
U.S. consumption and shipments
The value of apparent U.S. consumption of pipe and tube fittings
increased 50 percent from $0.8 billion in 1978 to $1.2 billion in 1981, before
declining 33 percent to $0.8 billion in 1982 (table A). Demand for pipe and
tube fittings is largely dependent on consumption of oilfield pipes and tubes,
which increased 60 percent during 1978-81 with the rise in oil prices and oil
drilling activity; demand by the oil- and gas-related industries weakened in
1982. Demand for cast-iron fittings is believed to have declined in recent
years due to the substitution of cast-iron pipe by copper and plastic pipe in
residential markets. The ratio of imports to consumption increased from 13
percent in 1978 to 29 percent in 1982.
The value of U.S. shipments of pipe and tube fittings paralleled
consumption trends during 1978-82, increasing 44 percent from an estimated
$0.9 billion in 1978 to an estimated $1.3 billion in 1981, due principally to
strength in the oil and gas end-user markets and declining to an estimated
$1.0 billion in 1982 as these markets weakened.

6
Digest No. B601--Con.
U.S. exports
The quantity of U.S. exports of pipe and tube fittings declined unevenly
during the 1978-82 period, from 70,300 short tons in 1978 to 58,300 short tons
in 1982, while the value increased from $217 million in 1978 to $351 million
in 1982 (table A). Saudi Arabia, with 26 percent of the total, and Canada,
with 22 percent of the total, were the principal destinations for exports of
these products in 1982 (table B).
U.S. imports
U.S. imports of pipe and tube fittings increased 57 percent from 98,600
short tons ($103.7 million) in 1978 to 154,600 short tons ($247.6 million) in
1981 as increased demand for fittings for use in the oil and gas industries
created spot shortages of these items, record order backlogs, and lengthened
delivery times (table A). Imports declined 10 percent to 139,000 short tons
($223.2 million) in 1982 following reduced oilfield activity. Japan, with 39
percent of total imports, was the principal supplying country to the United
States in 1982 (table C).
GSP imports increased from 12,000 short tons ($11 million), representing
12 percent of total imports in 1978, to 33,000 short tons ($43 million),
representing 24 percent of total imports in 1982. South Korea and Taiwan were
the principal suppliers of GSP imports to the United States in 1982 (table
C-1). Imported pipe and tube fittings are comparable in quality to domestic
products and used in similar applications, but are priced considerably lower.
Position of interested parties
U.S. producers, represented by the American Pipe Fittings Association,
support withdrawal of GSP treatment for imports of pipe and tube fittings.

7
Digest No. B601--Con.
These producers allege that GSP countries have demonstrated international
competitiveness in these products, as reflected by rising levels of GSP
imports, and that failure to withdraw GSP treatment will adversely affect
employment and sales in the pipe and tube fittings industry.
The Board of Foreign Trade, Republic of China on Taiwan, Korea Flange
Company Ltd, The Mundo Corporation, Tupy American Foundry Corporation, and the
Taiwan Association of Machinery, and Sequoia International oppose withdrawal
of GSP treatment, alleging that the U.S: economic recession and product
substitution, rather than GSP imports, are responsible for the declining
position of the domestic industry. They believe that removal of GSP treatment
will do little to help U.S. producers but will benefit non-GSP developed
countries, such as Japan, which currently undersell U.S. producers in many
product categories. The opponents conclude by stating that GSP countries
cannot compete in the U.S. market without GSP treatment.

8
Digest No. B601--Con.
* * * * *

9
Digest No. B601--Con.
.
Table A.--Pipe and tube fittings: U.S. producers' shipments, exports of domestic merchandise, imports for consumption, and apparent consumption, 1918-82, January-June 1982 and January-June 1983
(Quantity in short tons; value in thousands of dollars)
Year : Producers' : shipments
: : :
Exports . : Imports
: : :
Apparent consumption
: : :
Ratio (per-cent) of imports to consumption
Quantity
1978- : 1/ 70,329 : 98,636 : 1/ : 1/ 1979 : 1/ 60,711' : 104,452 : 1/ : 1/ 1980- : 1/ 75,971 : 109,744 : 1/ : 1/ 1981- : 1/ 68,803 : 154,591 : 1/ : 1/ 1982- : 1/ 58,346 : 139,039 : 1/ : 1/ January-June: : . : :
1982--- : 1/ 31,689 : 88,946 : 1/ : 1/ 1983- : 1/ 29,234 : 47,879 : 1/ : 1/
Value
1978 : 900,000 : 217,111 : 103,743 : 786,632 : 13.2 1979- : 1,100,000 : 257,205 : 131,346 : 974,141 : 13.5 1980 : 1,200,000 : 324,267 : 154,753 : 1,030,486 : 15.0 1981 : 1,300,000 : 365,970 : 247,590 : 1,181,620 : 21.0 1982--- :2/ 900,000 : 350,643 : 223,196 : 772,553 : 28.9 January-June: : :
1982- : 1/ 189,371 : 148,240 : 1/ : 1/ 1983 : 1/ 146,299 : 59,311 : 1/ : 1/
1/ Not available. 2/ Estimated by staff of the U.S. International Trade Commission.
Source: Producers' shipments are estimated from data found in Annual Survey of Manufactures, 1981, U.S. Department of Commerce. Import and export statistics are compiled from the official statistics of the U.S. Department of Commerce.

by princip
al
C
.c U
01 E
U
▪ to
E O
00 4. Cr 0 •-•
N
L O-) 0.1 x >
L
• n C
• m
-
•
o --t C at ro Cl
CO L. O. 0
C al O C L
•-•
4-> O i..
ro O1 01 C C rD
4'
CV 4- CO
01 00 O
N •••
C 114.
01 01-Y 0.
(0 ILE
ai
lb I-
•• •• •• ••
CO
•-
•• •• •• ••
CO 0,
COO
0•
•• •• •• ••
Co oN
CSJ CO cos
(short tons
)
4,
4, C IO 7 Cr
C 0
(per short
Cl 7
IO
4)
.4
M
00
rn cr ND
cD in rn
CD Ps 0•
U1 ND M
r. .43
■T CV M
V) CD CV
U1
r.
CV
CV .0 •••• •••.. 1.•
▪ C2,100.104 10Kw■ ..1•• .DritVMI100 Cr rn ND rn
CNI.- \ID
UneDN
•• •• •• ••
MIND ^ sl CD rs NO NO Ps CN cr rn U1 0 UN WI r..- U100 r.rnr.r1.- r■ Cr Un ND
r■ rNCV ̂N 00.-
• • . • • • . .• • . •• .• • • ••
crrn cr cD NO N Cr ND
CONON. cr.- cD CD ON ND Cr • O. ND sl r. Cr ON CD sl
INIU1s1 CV 1.1 Ss 00 - in
• • .• •• •• • • • • •• •• •• •• • •
• 00 CD Cr, U100 CD Ps 111 sl 000. c) U10• sit... ND.", CD C• 111 VD P1 CO Cr U100
ft
ss sl cD sl cD 03
• • •• •• •• •• •• •• •• 00 ••
NO CD U1 00 NY Cr Ns.) Nr • sl sl cD•sl ND ND r,
(11 00 00 ul N h. CD sl c• ft . •
4' .0 PM C\I
•• •• •• •• •• •• •• •• •• ••
N ON NO CD qr Cr NI CD Co 'P-r+ NI* U1 Ps rs CD Nr 00 u1 00 PM ND cr rn un.- r■
NO N)00 CV 000 ND
•• •• •• •• • ■ • •• •• •• •• ••
MI U100 ND CD MI NO NI* Cr ^n lNO NCoaU1 N rn un cr cf. CV r. N C4 OM
00 u") cu NO N.-
10
CO OD Or 00 ND Cr re) ,cp. 'et N Csl NO Cr hl 0. Ct I•1 Ns? Cr 111 t11 NO rs
r. 00 00 CN 00 00 C4 .0 •.0 N CV
•• •• •• •• 00 00 00
r. MM WI .TOM- No Cr .000 ul 00 I^O M CO CV earl u1cD NOD.-
0• 0.0 st rn Pon ••-
•• •• •• 80 •• Os •• •• •• ••
NO CV N rn NO cr Cr 00 WI CD NI. CD U1 U1 Ul ND Ul CD U10• n T., p.p.-0000141 ........
Ps NOM Ps NO ND csi PN ND ND C4
•• •• •• •• •• •• •• •• •• ••
CD N r. Cr rn cr CD Cr Un Nr 00 Ul cD N c• NO WIND CV.- 00 c• rn c• ev rl 00 ....•....
Cr cr CN .1* .1 0.1 ,40 .- O0 I Ul
•• •• •• •• •• •• •• . •• ••
Ps C4 NO 00 sl es1 cDr. ND.- sl S% 00 CD NO 0.. CD 00 CD ND rs rs CD esi ........ rOr■ ND cr Mr'.- r. cr rl CV
•••••
cr NOON Ncr Ps CN rn N.^ 00 cr rs U100 IN-M1 000 Ul CD
' ....... rn r, crs 00 cr cr NO MM Cro
•• •• •• •• •• •• •• •• •• ••
C4 00 CV.- CN CD cr Ul CD C•.- NON!' C4 r■ cv-- .0 MU r. .- glen cr .0
r■ cr ND ND Cr cr NO U1 CV .- 00
• CD 40 te, 0^ 0• .0^ Cr Cr rn ND r■ PI Un P. CD • • • • • • • • •
e• as Wt.,' CP• psi.," 00 ON cD un ND Co NO N Cr.? Or ON CN cr 00 CV N ▪ . . Un CV PI NUN.? cr ND ND
CO qr
•• •• •• •• •• •• •• •• • •
cr CD CD CU CK IN. 40 ND CNN Cr c--eD CD ps 40 • • • • • • • • • N.0 ,04' Cr cr un r■ U) O1 r■ Un.- U1 1 N
0000 00 Win 00 CV CD N 4 .
Un cr Un co 0 WI CV U1 r■ 1.1141
•• •• .• •• .• •• •• .• •• • .
r. 104K rs cD cr Cr cr cr • p. r.qo PM ND .- Cr • • • • • • • •
cr cr CD Cr rl Un cr n1.1 ND.- N. CD NO CD Os sl 00 M I C• VD PIN CV qh 010
Un cr Or, rn ND rl U1 ND • CV u1
cr
■T
O
111
Ni Ss
Cr CD CO
NO
•• •• •• •• •• •• •• •• •• •• •• •• •• •• •• •• •• •• •• •• •• •• •• •• •• •• •• •• •• •• •• •• •• • •• •• •• ••
I I I I I I I
I I I I L .4
I I 01 0 0.-C
0/ .0 0 •-■ 01-V "OrDUCNN-WW01- re C a X C > r0 at RI 3 of a O -1
C.) E (1) > W NC wr
I
I I I I
I I I al L
I al (11
-0 at L 10 .0 0 •4 ig -I) al "0 r0 U C N N OZ 0 > r0 ro at a
c a X 0.•••• L re CI MI 3 al 01 0
(...) (1) > LLI cC
Department of Commerce.
=
al .0 4?
4-O
U
ut
4,
IO
U •••• 4- 4- 0
E 0 L. 4-
01 ••
0. E O
01 U
O
Digest No. B601--Con.
CD NO C■I Ss CD CD CD CK CD
• • • ..... • rn Cr ND C• a 00 CO 141 r. ON 40 'Cr .4h 00 ND r, Cr Ul Cr es.1 ND U1 CV Ps U1 U10• WI
NI' SI U10• .DKr CV .0 U1 1n
cr.- M.S.- CD.- sl • 00 Nr NO Ps 00 rs 00 CD • • • • • • • •
NOOK.- r. U100 MINN, Ps NO CD CD NO ON Ch rn CV Cr r. 00 CV ND C4 N .......
cr CV cr CNN, WW1 N N U1
CD sl
Co NO CU
0- 000. NO ND C4 sl NO NI. ■T O. CD 000O 6.1 ND 'Cr CD IM un • • • • • • • •
NO un 00 cr cr CD cr ND .- ND r■ Cr CV Cv Cr Cr cD CD 00 rl Ps rs ND CD cD Cr .- CV
sleVs1.- C• C400 u1 ■T • C4 cr
U10. (1.1 cr. MC's:1'00N Ss CD 61 ON CD eV SI NO esi Nr CD • • • • • • • • •
n^ IN ul cr CD 0. N. CV Cr 00 No cr un un IN 00 CDS. ON.- ND NS' Cs! NI. cos cD
N CV N cr un rl rn cr rn NI
10
.4
.4 0
O
al 7
r0

00
I
Ot C 7
••
C 1000
N 00
•••• CO
11.
00
••-• imports for consumption, by principal sources,
• M
• 00 MO-
0 O C O 7
O 1 >
O L O M
• C C O M Ln
C O M
O . UN COO
4' -w 44-c
m
•
1 7 > it
M D C C M M
Cl
"- N 0- CO
.4
to I- •
r.
••••
0I
7
Cr,O
• • •• •• • •
• • • • • • •
cs
CN CD
N In
st cD
ND MI
00 c•
• • • • • • • • • • • • • • • • • • • •
cDOCOMNO
WIn, 00.- vDsONNo . .......
4's000= Wit10• Nrel
• • •• • • •• •• • • • • •• ••
.- CDC" 40CD 00
•
0 .4r N sr NO 4'001 N.- N O rs. n. N Nan
n0000.40nN0srs. • •••••
• • •• • • •• •• •• •• •• •• • •
rol
0• In
r In
• •
00 UI CT VI.? In in N. 00 vD .- .000 .0,0 vl 41> 41 .DS -O N. UI 01. UI CM
h. h. UI NO ■1' .1' CO M .- 00
refrol 110.W.0 0.0.TMOICIOPOM
411^4- 001.- M51.
• • • • • • •• • • .• • • .• • • • •
00.- WW W N.0 D00.0 .
O OQltl cs In ri N
•• • • • • •• • • • • • • •• ••
M70soMenCnOcCI r...0McOvCiv)0000
........ vt CD In M^ qrulvD
• • •• •• •• • • •• •• •• • • ••
NONM, WONONOCD
OsONMMOW10, N.-'
CD/el p. h, in CD UI N^ UI
fa
O
7
(short tons
)
›. 4,
4' C
CV Unit value (p
er short ton
)
.■
ul
• •
O
CV
00
v0s0h1h1.- VIVIC•M CnOs illoNo v0 .43 Ms en PO 500^O•
CNNOshs.Wh. Ws- C4
• • • • • • • . .• • • • • • • • . • • • •
ND CM
N N
CD VI 00 N 01 h. 0 00 S NIni On.111 OM OM MN) eV ND Ul CD
0000 UI UI 03004' en hl
• • • • • • • • • • • • .• .. • • • .
C4 vo P. CD 00 ND ar. Nr Cis CO .r 0 ND ND Ml Oin CD 00 .Of. UI UI hl N ■- S00
°NISI C4 CV CD .- CO CD ND N.- .- ^ ^ ^ in
O en an
N
•• • • • • •• •• • • • • • • • • ••
1.1 Ul M.
UI
N. 1014D MN CM S MI CM CD Ul CM .4) r•140.71■ Co4'.0ren,
ONP.WCPsCr....T.DM
.• • • • • .. • • • • • . • • • • • •
v0
M
M
•• •• • • •• •• • • • • • • • • ••
MM CD CD N ON 00 00 a' 00• sr siD s- 4- LCI CD N SO P. CI sr .O S
. . 0 v0 vD CONt .- .- U1
000NOU ND
0• 000M.0 ... 4'000 U/ W■ W■
MI
r.
O
11
CV UI 00 ." '0 in U1 0^ 1.1 UI MO, ON WI P. CN r•
CVPMMis.Mtc,040f.. N
• • • • .• • • • • • • .• • • • • • •
Department of Commerce.
• OI
4,
=
0
UI
IO 4, UI
.4
U 4. 4- 0
0
4-
11
a 0 0
U C.
0
N vD
vD •a vp
CV NO r. CJ.1- CD WI r. re) CV C4 sr vein. v0 Ul • • • • • • • • •
Nr.1000.- No an WI Ins" In ND.. MI OOO O co co hl wire) qD CD In
." CV
00
C. ul
• U100 cD n.4" sr Cis .- 00 111 el CD r. • • • • • • , • •
OOU1 05 U100 CC, N UI ... cp..- .- 101. a'In CM vhr. cD in UI Cis Os CD CD
• • • • • • •• • • • • •• •• • • • •
." UI UI CO 4.0 0000 cv Cu CD N CV WI • • • • • • • • •
0000 NO 00 Inns 000 r. S N UI M un in CV P. Ul CV Ulusi NI .........
N
cD.- oncomo41- WPM N In in Cr. cp. 04 cp. .........
srNr.Mrs.WV1.0.00 inti1s00000Nrs...00s-
..... 41)
CO UI
O
por-.COW.rUlartWM O00WINVICs..001M •••••••••
1.1.-ns-s--NWMW wrs.004100DOW5 MC4WMCIONW40
c‘i ^ (.4 .- 4."
• • • • •• • • •• •• •• • • • •
• • • • •• • • •• •• •• ••
0.- O. CD CD NO C' N 5 00 .0 N M MIMI 0 • • • • • • • • •
NN O. CD S to) ar, .- 00 oo 0°4- UI
1.1 v, ^ cDhl ........
CO N
UI 4=.
N.
oo M N
••.•. CA
• • • • • • •• •• •• •• •• • • ••
S.D N.O.DNo. 00 t. SO CV us No .- cis No N. • • • • • • • •
• srNc0 hl CD is. Cs1 00 CO . CT 00^S NC./ O U100 00 00 p, r. CD O
RI. 11.
41)
Digest No. B601--Con.
- . - . - - . - . . . . " - . . . - . . - . . - " . . . . - . " . . . . - . - . - . .
I I I I I I I I I I I I I I I I I I I I I I I I I I I I I I I I I I I I I I I I I I I 0 I I 1 L-4 I I I L.-1 I I I L 0 I I 1 0110 I I 1 0110 I I 10110
4., E at +' 4' E at 4., 4.. E at L. 10 WIL 0 0.1.0 0 m UL 0 0-o 0 • M OIL OW -WO
CM>MCW0=01- C11>MCOPW01-- C -0>10C WO O>
m m.-1 C...0 C re M •.-1 C .- CD C M M..4 C...-0 C .4
acm-Ne t0 L.-+ atm.-be r0s....1 ac m- 10 c...-4
MM.P.0 Ll..0-4 Mmw.0 LL0.-1 MM.4., Z LL0,-.1
)UI-luMWWy< nU ►-$0MWILY‹ nC..1 1.40=WWy<

12
Digest No. 8601-Con.
Table C-1.--Pipe and tube fittings of iron or steel: U.S. imports for consumption, under the Generalized System of Preferences by principal sources, 1978-82, January-June 1982, and January-June 1983
(Quantity in short tons; value in thousands of dollars)
Source January-June--
. • 1978
•
1979 • 1980
•
1981 1982
• 1982 : 1983
Quantity
South Korea--- : 2,240 : 5,129 : 6,402 : 8,126 : 8,043 : 4,546 : 4,306 Taiwan : 3,378 : 5,627 : 5,823 : 7,912 : 9,996 : 5,014 : 5,181 Brazil : 294 : 2,310 : 4,449 : 6,791 : 5,271 : 3,322 : 986 Israel 365 : 507 : 1,063 : 614 : 579 : 276 : 246 Malaysia : 569 : 1,030 : 817 : 1,006 : 1,076 : 528 : 253 Romania 0 : 76 : 468 : 1,384 : 492 : 415 : 19 India-- : 4,409 : 5,765 : 7,727 : 9,533 : 5,724 : 2,886 : 3,361 Singapore : 128 : 3 : 0 : 308 : 630 : 580 : 33 All other : 686 : 699 : 466 : 582 : 1,191 : 811 : 524
Total : 12,069 : 21,146 : 27,215 : 36,256 : 33,002 : 18,378 : 14,909
Value
South Korea : 1,626 : 5,407 : 6,298 : 9,136 : 8,381 : 4,965 : 5,044 Taiwan : 4,041 : 7,576 : 8,640 : 12,291 : 15,029 : 7,820 : 7,024 Brazil : 235 : 1,839 : 4,055 : 7,526 : 6,268 : 4,071 : 759 Israel : 1,227 : 2,078 : 3,189 : 4,412 : 3,532 : 2,009 : 2,062 Malaysia : 643 : 903 : 924 : 923 : 1,383 : 648 : 378 Romania 0 : 60 : 434 : 1,376 : 477 : 410 : 12 India : 2,295 : 3,833 : 6,356 : 8,297 : 4,145 : 2,341 : 1,690 Singapore 50 : 8 : 0 : 2,498 : 1,946 : 1,636 : 86 All other : 919 : 696 : 481 : 711 : 1,849 : 1,212 : 673
Total---- : 11,036 : 22,400 : 30,377 : 47,170 : 43,010 : 25,112 : 17,720
Source: Compiled from official statistics of Department of Commerce.

and mattress
es
information; U.S. impor
ts in 19
82; competit
ive sta
tus
15% a
d val.
Desc
rip
tio
n
727.
8630A
co o. ■ •1
as 0.1 4) CO 0
CA L. 0, 0 0 •1 •
B0 0. 00,
C 0.1
Oo ..4 0 141
en
• • • • • • • •
00 O.
•
03 cr.
v% 03 O.
co o.
g
we
00.
•• ••
• • • •
0/
.• ••
N •-•
02
8-4
1980 : 1981
0
TSUS item number; descrip
tio
n; tariff ra
te
TITLE:
Fu
rniture of rubber or pla
stics,
treatmen
t un
der the U
.S.
O 0. 0103 10 0
I 0% .
00 4/
0 13 La
0 t. 0 00 0
•
•
C •-4 o 10
.1a La 0
O L. r1 .0 00 to 00 0
8-1 1. 0 4)
C 0 d 0
0)
10 10 C
1:1 4) O. 4) 0 d a-4 C 0 40 0
0 0/ 13
0.% La
00 al 0.1 w. .41 0 00 0 00 La 0 La C O 0)
10
0
▪ 0 co
40 0 • ■-• r.4
.0 CLA 0.) 00
0 •/ 0 V 0 .0 01 0 01 0 d
L)
• 3 0
•
0 C to 41
- 00 La : 0 0 04 10 00 • O. La
O. 0 W O 0 0
.0 B- 0) 04) O 4) CI 00 01 0
00 O. 140 14 V) 148 O 41 9 9
O 0 O 01 41
.0 d f-I o•1 OS
•••••
0.11 NI
0
a

2
Digest No. B701--Con.
II. Comments
Description and uses
This digest covers furniture of rubber or nonreinforced or nonlaminated
plastics, n.s.p.f., and parts thereof (TSUS item 727.50) and includes all
furniture made of polyvinyl chloride (PVC) such as plastic pipe furniture, 1/
outdoor chairs, T.V. or stereo stands, and baby walkers. Also included is
injection molded plastic furniture, which may range from plastic cubes to
bedroom suites. Vinyl waterbed mattresses and liners are also covered by this
digest. 2/ These articles are two primary components of waterbeds; all
waterbeds require mattresses that can be filled with water or some liquid
substance (they generally hold about 200 gallons), as well as plastic liners
which serve as a protective layer between the waterbed frame and waterbed
mattress.
Also included in this digest are mattresses other than those wholly or in
chief value of cotton (TSUSA item 727.8630), which are generally rectangular
pads of heavy cloth filled with some substance or material as a stuffing.
This stuffing may be made of expanded, foamed, or sponge rubber or plastics,
and may also include springs or steel coils sandwiched between the layers of
insulation or cushioning. Mattresses are used primarily as, or on, a bed for
the purpose of sleep.
1/ General Foam Plastics Corporation has submitted a petition to the GSP subcommittee for the removal PVC furniture from GSP eligibility. 2/ The Waterbed Manufacturers Association (WMA) has submitted a petition to
the GSP subcommittee for the removal of waterbeds and liners from GSP eligibility.

Digest No. B701--Con.
U.S. customs treatment
Waterbed mattresses are officially classified under the provisions of
TSUS item 725.50 pursuant to the unpublished U.S. Customs Headquarters Letter
numbered CLA-2 CO:R:CV:b 069729 JLV, dated July 26, 1982. Prior to that time,
waterbed mattresses were classified in either TSUS item 727.50 or TSUSA item
727.8630, mattresses of non-cotton materials. The petition submitted by the
WMA also asked that TSUSA item 727.8630 be included for withdrawal of GSP
status.
Prior to Jan. 1, 1980, furniture of rubber or plastics, n.s.p.f., was
classified with furniture for civil aircraft of the same material under TSUS
item 727.48. TSUS item 727.48, later divided into items 727.50 and 727.51
(furniture of rubber and plastics for civil aircraft), became eligible for GSP
treatment on Jan. 1, 1976, pursuant to section 502 (a)(3) of the Tariff Act of
1974. Since that time no beneficiary countries have been excluded from GSP
benefits.
U.S. producers and employment
The number of U.S. producers of all types of furniture of rubber and or
plastics is believed to be approximately 500. There are about 25 U.S.
manufacturers of vinyl waterbed mattresses and/or liners. There are also
about 100 companies that manufacture supplies for the waterbed industry. The
majority of these manufacturers are located in California, particularly in the
Los Angeles area. Others are located in Maryland, Nebraska, Nevada and Ohio.
Most of the manufacturers are small, and total employment in the waterbed
mattress and liner industry is estimated at 1500 persons. Employment data for
the entire rubber and plastics furniture industry are not available. The
process for waterbed mattress production is very labor intensive, as the

4
Digest No. B701--Con.
mattresses are fashioned from large strips of PVC plastic; waterbed liners are
basically specially cut sheets of the same plastic material.
Mattresses are manufactured by several hundred firms located throughout
the United States with extremely localized production due to freight and
packaging expenses. The national market is dominated by several brand name
products sold through franchises; employment for the mattress and bedspring
industry was estimated at 30,000 in 1982.
U.S. consumption and production
'U.S. consumption of all furniture of rubber or plastics is not known
(table A-1), but consumption of waterbed mattresses and liners is estimated at
between $80 million and $85 million in 1982, up from $25 million in 1978. The
U.S. industry estimates that approximately 15 to 20 percent of U.S. consumption
of waterbed mattresses and 60 percent of the consumption of liners were
supplied by imports in 1982. The ratio of imports to consumption for all
furniture of rubber or plastics is believed to be small.
U.S. production of all furniture of rubber or plastics is not available
(table A); however, production of waterbed mattresses is estimated to have
been approximately $70 million in 1982, up from an estimated $21 million in
1978, while production of liners is estimated at $3.5 million, up from $650
thousand in 1978. * * *
U.S. apparent consumption of mattresses declined from 1978 to 1981,
falling from an estimated $647 million to an estimated $419 million, then
increased sharply in 1982 to an estimated $720 million (table A-2). U.S.

Digest No. 8701--Con.
producers' shipments of mattresses followed the same trend, falling from an
estimated $652 million in 1978 to and estimated $427 million in 1981, then
increasing to an estimated $730 million in 1982. The import to consumption
ratio for mattresses is negligible, less than 1 percent for the whole period.
Generally, mattress consumption is closely related to conditions in the
housing and general furniture industries; these industries suffered serious
problems in 1980 and 1981, but conditions began to improve in 1982.
U.S. exports
U.S. exports of all furniture of rubber or plastics, n.s.p.f., more than
doubled between 1978 and 1982, rising from $2.4 million to $5.8 million
(table B-1), with the principal markets being France, Japan, and Canada. For
the first six months of 1983 as compared with the same period in 1982, exports
declined from $2.4 million to $1.0 million, or by more than 58 percent. The
decline in U.S. exports can be attributed to the continued strength of the
U.S. dollar and to competition in world markets from certain Far Eastern
-countries. Exports of waterbed mattresses and liners are believed to be
negligible.
U.S. exports of mattresses increased in the period 1978-82, from $4.9
million to $9.9 million; however, exports declined in the first half of 1983
compared to the first half of 1982, falling from $4.9 million to $2.8 million,
or by 43 percent (table B-2). This steep decline reflects the continued high
value of the U.S. dollar in the world economy, which makes these relatively
high priced items even more expensive. The principal markets for U.S. exports
were Saudi Arabia and the Bahamas with these two countries receiving 50
percent of U.S. exports.

6
Digest No. 8701--Con.
U.S. imports
U.S. imports of all furniture of rubber or plastics have been irregular,
decreasing from $40.0 million in 1978 to $37.1 million in 1982 (table C-1). 1/
The primary sources of these imports were Taiwan and Canada, who together
accounted for 67 percent of total imports in 1982. Imports for the first six
months of 1983 increased by $4 million over the same period in 1982, rising
from $21.2 million to $25.2 million.
Total GSP imports for the period 1978 to 1982 declined from $23.1 million
to $17.2 million, with Taiwan and Mexico the leading GSP suppliers in 1982
(table C-2). GSP imports accounted for 46 percent of total imports in 1982.
Such imports for the first six months of 1983 increased more than $4.5 million
over the same period of 1982, rising from $10.3 million to $14.9 million.
Virtually all of this increase can be attributed to imports from Taiwan, which
increased from $8.8 million to $12.7 million in this period. Much of this
increase is believed to be waterbed mattresses and liners.
Imports of waterbed mattresses and liners are estimated at between $10
million and $15 million in 1982, up from virtually nothing in 1978, with
practically all these imports entering duty free from Taiwan and Mexico.
Waterbed mattress production is a labor intensive process, and the quality of
U.S.-produced and imported mattresses is essentially equal. However, the low
costs of labor in most countries with GSP eligibility enables them to produce
mattresses and liners and sell them in the United States at prices
approximately 25 to 30 percent lower than those of the domestic products. To
1/ Prior to Jan. 1, 1980, imports of furniture of rubber and plastics for civil aircraft were combined with imports of other furniture of the same material.

7
Digest No. B701--Con.
combat import competition, some U.S. manufacturers have transferred their
operations to less developed countries where low cost labor is more plentiful;
others are reportedly considering such a move.
U.S. imports of mattresses for the period 1978-82 have fluctuated with an
overall decrease of 25 percent, falling from $321,000 in 1978 to $240,000 in
1982. Canada, Taiwan, and Sweden were the principal sources (table C-3). The
high costs associated with transportion of these articles, as well as the
state of the U.S. economy, have affected the level of imports. Imports have
increased sharply in the first six months of 1983 over the same period in
1982, rising from $92,000 to $236,000, which reflected the improved U.S.
market for home furnishings. GSP imports of mattresses increased from $17,000
in 1978 to $64,000 in 1982 (table C-4) and accounted for 27 percent of total
imports in 1982. Taiwan and Guatemala were the principal sources of such
imports. GSP imports for the first half of 1983 increased to $67,000 from
$24,000 for the corresponding period of a year earlier, with the bulk of this
increase from Taiwan.
Position of interested parties
The Waterbed Manufacturers Association, located in Los Angeles, California,
has submitted a petition to the GSP .subcommittee asking that furniture of
rubber and plastics, n.s.p.f., TSUS item 727.50, be removed from eligibility
for GSP. The Association also included TSUS item 727.8630 in its petition
since waterbed mattresses and liners had previously been classified under
this provision. Because of the aforementioned Customs letter, waterbed
mattresses and liners are no longer classified under item 727.8630. The
Association is concerned about increasing imports and fears that in order to

8
Digest No. 13701—Con.
compete with countries with lower wage rates, such as Taiwan and Mexico, most
U.S. manufacturers will either move offshore or be forced out of business.
General Foam Plastics Corporation (GFPC), located in Richmond, VA., also
submitted a petition to the subcommittee which was received from USTR asking
that TSUS item 727.50 be removed from GSP eligibility because imports of
products they manufacture, polyvinylchloride (PVC) furniture, are classified
under this number. Because item 727.50 is a basket provision and contains all
furniture of rubber or plastics, it is not possible to determine separately
the value of imports of this type of furniture. GFPC alleges that because of
competition from imports their profit margin on this furniture is non-existent.
Manufacturers from the Republic of Taiwan argued that their imported
product is in fact more expensive and of higher quality than the domestic
product. Also, imports from Taiwan for these products are well below the
fifty percent competitive need limit.
A domestic manufacturer in the Los Angeles area, Monterey Manufacturing
Company, which had recently acquired a factory in Mexico argued in favor of
graduating GSP eligibility for Taiwan, but against removal of eligibility for
Mexico. The major share of recent increases in GSP imports has come from
Taiwan, and Mexico's economic problems are far more severe. Also, Mexican
facilities utilize U.S. materials and benefit U.S. industry by providing jobs
for U.S. suppliers, while Taiwanese firms use only foreign materials and
foreign capital.

9
Digest No. B701--Con.

10
Digest No. B701--Con.

11 •
Digest No. B701--Con.

12
Digest No. B701--Con.
Table A-1.--Furniture of rubber or plastics, n.s.p.f.: U.S. production, exports of domestic merchandise, imports for consumption, and apparent consumption, 1978-82, January-June 1982 and January-June 1983
(Thousands of dollars)
Period . : Production
: :
. Exports ' • . :
Imports : :
Apparent Consumption
: Ratio (per- : cent) of : imports to : consumption
1978 : 1/ : 2,369 :2/ 40,010 : 1/ 1/ 1979 : 1/ 2,047 :2/ 38,009 : 1/ 1/ 1980 : 1/ 2,356 : 31,355 : 1/ 1/ 1981 : 1/ : 3,883 : 38,932 : 1/ 1/ 1982 : 1/ 5,846 : 37,118 : 1/ 1/ January-June: : :
1982--- : 1/ : 2,434 : 21,215 : 1/ 1/ 1983 : 1/ 1,057 : 25,219 : 1/ 1/
1/ Not available. 2/ Prior to 1980, imports of furniture and parts of rubber and plastics,
n.s.p.f., were combined with imports of furniture for civil aircraft of the same materials.
Source: Compiled from official statistics of the U.S. Department of Commerce, except as noted.

13
Digest No. B701--Con.
Table A-2.--Mattresses of noncotton materials: U.S. production, exports of domestic merchandise, imports for consumption, and apparent consumption, 1978-82 and January-June 1982 and January-June 1983
(Thousands of dollars)
Period • - 'Production 1/:
: . •
Exports 2/ . Imports : :
Apparent Consumption
cent) of
: : :
Ratio (per-
imports to consumption
• : 1978 : 651,549 : 4,891 : 321 : 646,979 : 3/ 1979 : 688,375 : 6,330 : 577 : 682,622 : 3/ 1980 : 585,815 : 7,051 : 447 : 593,313 : 3/ 1981—r : 426,877 : 7,945 : 364 : 419,296 : 3/ 1982---- : 730,000 : 9,910 : . 240 : 720,330 : 3/ January- :
June-- : 1982 : 370,000 : 4,948 : 92 : 365,144 : 3/ 1983 : 400,000 : 2,798 : 236 : 397,438 : 3/
1/ Estimated. 2/ Includes mattresses of all materials. 3/ Less than 1 percent.
Source: Compiled from official statistics of the U.S. Department of Commerce.

M co
Ot C
M OD
•• • • •• ••
• • •• •• ••
CO
1 O r. OT
4J
..X
7 E
CL
C
CL
.0
C
.0
E
44
OU E 0
• 0
II 0
L. ref O CO CL X U 111
OS L • C CC
LO •
1 0 D. •3
• • L- LD CO U 7 0 ••- C
4, CO 111 M 7 .0 7
• C IA
CO 7 1:1 0 C •• .0 CO cm
CO L T C
M 1- N./ .0 .0 OS • C L 7
'1 `1.• 1 o >.
111 M L • C 44 7
C L
•••
LL
•
CO 1 1 .
'0 O al
•• •• •• ••
O CO OT
•• •• •• •
OT
Os •
•• •• •• •
O
cr.
•• •• •• •
O
▪
I a L. to
O O VD NO i Min.— so .0 CQ UN NO U1
N st7
•• •• •• • • •• •• •• •• •• •• •• ••
P. C7 Cs1 OD M 4* sr CD sr • CA U1 N No N O NT rn UN cl .0 sr
CS1
• • • • • • • • • • • • • • • • ••
Dep
ar
tme
nt o
f C
om
merce.
• Cf/
U .c 4,
0
111
1.
▪
11
C
▪
O 4'
80.0
4-
0
0
4-
10
004 ow.
CL
0
•• as
L.
0
/et CO CO
M
. . .
14
O S LO. CD .- CD 111 rm ..73 cl VD 00 03 rJ OD rei cl N rel cl 1.1 Cy C4 CQ Os 03
U1
• • •• •• 00 •• •• 06 •• •• ••
Os CD Os 03 CD Cc. cl an .- J .7 Os 0,
.- .O NO CQ
•• •• •• •• •• •• •• •• •• ••
C3 in 03 UN cl 03 4- on sr so • c. cl 03 cl CQ CD UN
UN Ul Cc rN
•• •• •• • • •• •• •• •• •• ••
UN cm CD 4' CQ Nr 03 Ul '41 4- CV PN CQ ND 1.1
UN un cn
• • •• • • •• •• • • •• •• • • • •
N cl CD 1.1 4- C. rJ M CQ Cc
Nr Nt cl ND cl NN.D cl
•• •• •• •• •• •• •• •• •• •• •• ••
I 1 I 1 I
I I I ••••
0.4 E .0 0.1 CO .0 171 10 C L 0 U C CO C L 0.1 CU 0 C CD CO L. ••- .1.• 'ID C7 • C Q be H 11/ L M 7 7 3 L •••1
U. -3 C.) 01 :7 .c Ln LL

• • • • • • • •
CO
• • • • • • • •
qr.
CO
Depar
tmen
t of Comme
rce
Ja
nu
ary
-Ju
ne
4a
E
ft4
O.
U C • - h. 0.
Ds .
15
ON .- CD NI ON 1.0 CO 40
NI
CO ON .- 0 CD P. NO Tun NS' PI r4 an ps
M CO
• • • . • • • • • • • • • • • • • • • •
ND CN NJ CD cv No P. On CO • O CD T T Cis On n1 sr No No M 47.
.-
• • • • • • • • • • • • • • • • • • • • • • •
ON NP. NJ 00 UNON NI CD NT CD cn en 00 CO SO w■ vs CN CD N ND ref NJ r4 N T. ft ft "
• w■ CN
7
• • • • • • • • • • • • - • • • • • • •
▪ ps uN CD 4' UN NT CD UN r4 00 ul 0 ref r- No No NI MI MI S CN ON
ft ft vs m■ Ns
• • • • • • • • • • • • • • • • • • • • • • • •
• 1.1 net uN ,41• CO ,4r (s.1 • NO un No OD n, Ps UI J O 00 ro, nl sO CD
IN Ps
• • • • • • • • • • • • • • • • • • • •
IN 40 N CO nl 411 0" NJ CD Ns CD 111 CN NT c7 47 un ni n1 CO cho r. .- w- y- Pe)
V4 VD
• • • • • • • • • • • • • • • • • • • •
qr UN r4 M CD *41' UN 10 4. .- 4r NO ml Nt .3' N. ON P. ND CN m- cr, 00
NJ'
• • • • • • • • • • • • • • • • • • • • • • • • 111111 111111 111111 I I I I s. .4 IIIIWM 01 co .4 .4 J:
▪ M M C ID f0 •- 44 0 to E N •7 0 7 L O`1- a. to w 0 Y E .1+ C 4t C C I- M 4C .4
03 W M 01 al .4 U, CO 7. C.) 7: CO 4C 2C 4C

16
Digest No. B701--Con.
Table C-1.--Furniture and parts of rubber or plastics, n.s.p.f.: U.S. imports for consumption, by principal sources, 1978-82, January-June 1982 and January-June 1983
(Thousands of dollars)
Country 1978 1/' 1979 1/' . 1980 1981 1982 January-June--
1982 ! 1983
• Taiwan- : 18,080 : 17,480 : 10,484 : 11,959 : 14,242 : 8,914 : 12,817 Canada- : 6,282 : 8,068 :• 9,703 : 15,143 : 10,476 : 6,069 : 3,106 Mexico : 1,915 : 2,351 : 2,436 : 3,171 : 2,992 : 1,358 : 1,891 Italy : 4,216 : 4,725 : 3,834 : 2,626 : 2,898 : 1,425 : 1,587 F.R. Germany : 1,394 : 966 : 1,015 : 2,497 : 2,261 : 703 : 1,858 France : 672 : 964 : 1,021 : 1,249 : 2,136 : 1,556 : 2,412 Switzerland : 250 : 242 : 278 : 317 : 439 : 172 : 200 Austria : 116 : 109 : 355 : 423 : 268 : 139 : 188 All other : 7,085 : 3,104 : 2,229 : 1,547 : 1,406 : 879 : 1,160
Total : 40,010 : 38,009 : 31,355 : 38,932 : 37,118 : 21,215 : 25,219
1/ Prior to 1980, imports of furniture and parts of rubber or plastics were combined with imports of furniture for civil aircraft of the same materials.
Source: Compiled from official statistics of the U.S. Department of Commerce, except as noted.

Country • 1978 1/' 1979 1/ . 1980 • 1981 • 1982 •
_ • • 1982 ! 1983
.
Taiwan : 17,925 : 17,363 : 10,435 : 11,812 : 14,062 : 8,802 : 12,697 Mexico : 1,753 : 1,949 : 2,117 : 2,830 : 2,899 : 1,348 : 1,794 Israel : 52 : 75 : 77 : 34 : 114 : 108 : 227 Hong Kong : 121 : 37 : 61 : 79 : 93 : 60 : 57 Korea : 3,187 : 1,248 : 605 : 42 : 13 : 9 : 30 Haiti : - : - : 1 : 20 : 10 : 10 : - Portugal : - : 2/ : - : - : 1 : - : 48 Tailand-- : 8 : 2 : - : - : 1 : 1 : - All other : 32 : 7 : 13 : 134 : 2 : 1 : 7
Total : 23,078 : 20,681 : 13,308 : 14,951 : 17,195 : 10,339 : 14,860
January-June-- . •
17
Digest No. 8701--Con.
Table C-2.--Furniture and parts of rubber or plastics, n.s.p.f.: U.S. imports for consumption under the GSP, 1978-82, January-June 1982 and January-June 1983
(Thousands of dollars)
1/ Prior to 1980, imports of furniture and parts of rubber or plastics were combined with imports of furniture for civil aircraft of the same materials.
2/ Less than 500.
Source: Compiled from official statistics of the U.S. Department of Commerce, except as noted.

18
Digest No. B701--Con.
Table C-3.--Mattresses of noncotton materials: U.S. imports for consumption, by principal sources, 1978-82, January-June 1982, and January-June 1983
(Thousands of dollars)
Country 1978 • 1979 ' 1980 • 1981 • •
January-June-- • 1982
• 1982 1983
Canada : 130 : 434 : 239 : 214 : 81 : 49 : 90 Taiwan : 10 : 1 : 30 : 44 : 38 : 21 : 56 Sweden : 2 : 5 : 27 : 8 : 33 : 4 : 16 Japan : 111 : 79 : 89 : 34 : 20 : 4 : 31 Italy : 30 : 24 : 11 : 7 : 19 : 6 : 7 Mexico : 1 : 2 : 5 : 1/ : 7 : - : 4 United : • . : • .
Kingdom : 4: 7: 5: 2: 5: 1: 1 Denmark : 14 : 9 : 11 : 4 : 5 : 1 : 3 All other : 19 : 16 : 30 : 51 : 32 : 6 : 28
Total : 321 : 577 : 447 : 364 : 240 : 92 : 236
1/ Less than $500.
Source: Compiled from official statistics of the U.S. Department of Commerce.

19
Digest No. B701--Con.
Table C-4.--Mattresses of noncotton materials: U.S. imports for consumption under the GSP, 1978-82, January-June 1982, and January-June 1983
(Thousands of dollars) . :
: Country
• 1978
. . 1979
• 1980 '
: :
1981 :
• January-June-- 1982
1982' 1983
Taiwan : 10 : 1 : 30 : 44 : 38 : 22 : 56 Guatemala : - : - : - : - : 14 : - : Mexico : 1 : 1 : 3 : 1/ : 7 : - : 3 Dominican : : :
Republic : - : - : - : . .5 : 3 : - : 3 Yugoslavia : 4 : 4 : 2 : - : 2 : 2 : - All other : 2 : S : 3 : 11.5 : - : - : 5
Total : 17 : 11 : 38 : 56 : 64 : 24 : 67
1/ Less than $500.
Source: Compiled from official statistics of the U.S. Department of Commerce.


W N • .0 03 0
CO 4P • 0 N •
0 0 ,1 IN
wet mod R./
• • • • • • • •
In WI N .01
0 0 0 • .0 0 .4 • Ile 0 0 la li.■
0 In .0
U in .0
• .0 MI 4 e
a oll
N 14
••• 0 40 %a 2 .2 a. N I • • I s■4 1.4 O. 41 .0 03 2 0 0 • • • • • 06 3 C.1 .0 •••■ .0 0
0 4.1 0 01 40 41' to .0 • 0 co 0 .s, 41.1 Le 0. 44
• 4.4 o •-■ .V4 k >
• 0 o •••• o •• •• •-4 a. .., P.O u ... .$.1
.84 0
0 la ,1 06 1••• eV • .-1 0 1.i 1•4
•
r•I ... 111 C 4.1 a • ...., s., • ... .4 •
J.) Mt es 0 •••1 .4, es 4) 0 02 • C Li 0 o mo .4 .4 40 0
t 0 so • •• ..
•
.0. u...• • • CO
4,4 0 Ot a •
C0 00 12 110..C. OS CP, ...* 01.
•••1 ,1 It C N • .-1 V W ..
W C ft • 0 0 •••. ,I 931 •••• •14 NI 4) 4., Z • C *a • V 1.1 I., 0 Le E 43
I r4 • la 0
0 0 .0 0 . 0 40 la • 0 •••■ C IL •••I 144 VI 10 .4 0 0 en 0 0
0 N - c • • .0 41 • • .. .. .. .. .. .. •
0 W e 4 • •••1 0
40 ...
.0• ..4
1.4 al •• 0 O. b. 0 p. ••. o C .0 • • Li .0 N 0 • 0 41 A CO 40 4$ 0 .1) 4) 0
LI • . C • .4 .0 V 0 0 V 4)
• * 0 • • ,I 0 .... 0 as • • 4.1 •-■ • 4.1 0. 0 4) • C 0 ...1 b. 0 0 • C fr t./ C Pa 0 le • ...8 0
NO 01 •4 A SI Ir 0 0 0 0 t) C 0 41 0 '0 0 0 ..4 Yr .4 • 14 • 0 la 0 • . * 4 Z Le 0
COO ad CL• 44 • 0 .... 1 Li 01 •C
I•4 01 .0 N 0 440 O.
• 0 m ms o • m m
ao
la a
. • . . • • .474 4)! . :": • r...
In .0 4 Oft 0 ..1..•
n N V
Pe ... 0 .0 0 •0 el .-r.0 .-1 e V 0 co t A. 0. 0 a. sa 0 •••
OF 41+ 0 r•1 0 .0
r•1 a0 O u a • • ••■ ...1
• • • N 111 N g NO 0
• 4)
...•
co 0 • CO
a re a. .0 a 10 • • a • •• de • -. •
so • a « ,..e de • • 0 ••• 0
0
0 ...I .0 0 . es
t VI • 02 01 110 F1 CA D X ...I RI
m m %. •
N -...4
ml • 6. io . 6-1 1.1 fS

2
Digest No. B703--Con.
II. Comments
Description and uses
A fishing reel is attached to a fishing rod shaft near the handle. The
reel serves to store the fishing line, to cast the line, and to play a hooked
fish. In general, there are six kinds of reels. For the most part, a reel is
matched with a corresponding fishing rod designed for a specific type of
fishing.
Bait-casting reels.--Bait-casting reels use a revolving spool that is
mounted on the top of a rod handle. They are available in a variety of
designs and sizes, and while used in saltwater fishing, find their principal
use in freshwater fishing; many incorporate a "level wind" mechanism, which
guides the line onto the reel as it is rewound.
Spin-casting reels.--Though designed for spin-casting rods, spin-casting
reels can be used with other kinds of rods, usually bait-casting rods. They
are usually mounted on top of a rod and have a hood or front cover that houses
the line and stationary spool. The line is released from the spool by
depressing a lever or button.
Spinning reels.--Since the line and spool are exposed at the front of the
reel, the spinning reel is frequently referred to as an open face reel.
Spinning reels are mounted under the rod and, like other reels, are produced
in various designs, capacities, and quality. They are used equally in both
freshwater and salfwater fishing.
Fly reels.--There are two types of fly reels--single action and
automatic. The user must turn the reel handle to retrieve the line with a

3
Digest No. • B703--Con.
single action, whereas with an automatic, he merely trips a trigger which
releases spring tension that revolves the reel spool and respools the line. A
fly reel is mounted underneath and behind the handle.
Saltwater reels.--These are many types of saltwater reels; there are
reels for surf fishing, boat and bay fishing, light trolling, reels with wide
and narrow spools, and reels for 'big game' fishing. However, saltwater reels
do have some common characteristics such as sturdy construction, strong drags,
and capacity to hold hundreds of yards of heavy-test line.
Specialty reels.--Specialty reels include those designed for trolling
with wire line, ultra-deep fishing with wire line, built in reels that are an
integral part of the rod, reels designed specifically for still fishing and
ice fishing, and spin-casting reels designed especially for under-the-rod use.
Of the types of reels described above, only spinning and spin-casting
reels are imported with a dutiable value not over $2.70 each. In 1977,
spin-casting reels accounted for *** 1/ percent of U.S. producers' shipments
of all reels to the domestic market, whereas spinning reels accounted for
62 percent of total reel imports. 2/
U.S. customs treatment •
Imported fishing reels are classified according to their dutiable value.
Those reels valued not over $2.70 each enter under TSUS item 731.20; those
valued over $2.70 but not over $8.45 each enter under item 731.22; and those
2/ Data compiled from responses to questionnaires of the U.S. International Trade Commission.

4
Digest No. B703--Con.
valued over $8.45 each enter under item 731.24. All three categories of
fishing reels were on the President's initial list of articles eligible for
duty-free treatment under the Generalized System of Preferences (GSP) in
1976. Imports from the Republic of Korea under item 731.20 exceeded the
competitive need criteria in 1980 and Korea was taken off the list of
beneficiary countries for that item in March 1981. However, Korea was
reinstated as a beneficiary country in April 1982. Item 731.22 was removed
from the list of articles eligible for the GSP in March 1980.
U.S. producers and employment
There were 8 domestic producers of fishing reels in 1977. According to
questionnaires of the U.S. International Trade Commission in connection with
its Investigation No. TA-201-34 on Certain Fishing Tackle, * * *
Since 1977, at least five of these firms have closed
their U.S. fishing reel factories and now source their reels from Korea,
Taiwan, and Hong Kong. The spin-casting reels manufactured by one U.S.
producer are currently the only U.S.-made reels which compete directly with
reels imported at a value of not more than $2.70 each on the basis of price.
Total employment in the U.S. fishing reel industry amounted to 1,294 in
1977, with 998 being production and related workers. The number of workers
engaged in the production of the spin-casting reels which compete directly
with imported reels valued not over $2.70 each was fairly stable during
1978-81, * * *

Digest No. B703--Con.
U.S. consumption and production

6
Digest No. B703--Con.
U.S. exports
There is believed to be only one U.S. exporter of low-valued fishing
reels. Whereas total U.S. exports of reels decreased each year during
1978-82, by a total of 61 percent, from 338 thousand reels to 128 thousand
reels, exports of low-valued reels averaged * * *
A
portion of U.S. exports include spin-casting reels that have been attached to
solid-glass spin-casting rods.
U.S. imports
U.S. imports of all fishing reels rose by 45 percent during 1978-82, from
7.2 million reels to 10.4 million reels (table C-1). The increase in value
was from $44.3 million to $71.1 million. U.S. imports of fishing reels valued
not over $2.70 each grew at a faster rate than total imports, expanding by 62
percent during 1978-82, from 1.9 million reels to 3.2 million reels (table
C-2). The value increased from $3.1 million to $5.4 million. The growth in
imports of low-valued reels by 1.3 million units during 1980-82, accounted for
* * *

7
Digest No. B703--Con.
Although Japan increased its share of the value of total U.S. fishing
reel imports from 51 percent to 59 percent during 1978-82, its share of the
value of imports of reels valued not over $2.70 each fell from 46 percent to
4 percent. The three countries which utilized the GSP while exporting
low-valued reels to the United States, Korea, Taiwan, and Hong Kong, increased
their collective share of the value of total imports under item 731.20 from 54
percent in 1978, to 79 percent in 1982, and 93 percent in the first 6 months
of 1983 (table C-2).
Imports of all fishing reels under the GSP peaked at 2.6 million reels in
1979 before middle-valued reels were removed from the list of GSP eligible
articles in April 1980 and before Korea lost beneficiary country status for
low-valued reels from March 1981 to April 1982 (table C-3). Imports under the
GSP accounted for 31 percent of the quantity of total fishing reel imports in
1978, 20 percent in 1982, and 25 percent during January-June 1983.
GSP imports were much more influential in the low-valued reel category.
There, GSP imports rose by 71 percent during 1978-82, from 1.1 million reels
to 1.9 million reels (table C-4). GSP imports in the first 6 months of 1983
were 70 percent larger than in the first half of 1982. Duty-free imports
under the GSP accounted for 57 percent of the quantity of imports of fishing
reels valued not over $2.70 each in 1978, 61 percent in 1982, and 89 percent
in the first half of 1983.
The ratio of imports to consumption of low-valued fishing reels was

8
Digest No. B703--Con.
* * *
The average wholesale price of low-valued fishing reels produced in the
United States rose by * * * •
whereas the average customs value of comparable imports increased by only
10 percent, from $1.57 to $1.72, adding to the price advantage of the imported
product.
A principal factor which raised the volume of imports of low-valued reels
under the GSP in 1982 and 1983 was the return of Korea to the status of a
beneficiary developing country in April 1982. Loss of beneficiary country
status after 3 months of 1981 led to a 22-percent reduction in total imports
from Korea in 1981 compared with 1980. Return of status after 3 months in
1982 brought an 11-percent rise in imports from Korea in 1982 over the 1980
level. In the first half of 1983, imports from Korea were 57 percent greater
than the comparable period of 1982.
Another important factor stimulating GSP imports from Korea, Taiwan, and
Hong Kong during 1978-82 has been the closure of some fishing reel production
operations in the United States, Japan, and Sweden by large fishing tackle
companies in favor of either setting up factories in the former countries or
having reels made there under the companies' brand names. Fishing reels are a
relatively labor intensive product, giving Korea, Taiwan, and Hong Kong an
advantage over countries with higher labor rates. According to information
obtained from questionnaries in the U.S. International Trade Commission's
Investigation No. TA-201-34 on Certain Fishing Tackle, 59 percent of all

9
Digest No. B703--Con.
imported reels in 1977 were purchased by domestic fishing tackle manufacturers,
chiefly fishing rod producers. Since one of the largest U.S. rod producers
has closed its reel factories and now imports reels from Hong Kong, this
percentage is certain to have increased.
During August 1981 to May 1982, 1,047,250 low-valued fishing reels (3
models of spin-casting reels) were assembled in Mexico from U.S. components
and imported under the provisions of TSUS item 807.00. These imports from
Mexico accounted for 17 percent of total imports under TSUS item 731.20 in
1981 and 22 percent in 1982. The closing of the foreign assembly operation
was chiefly responsible for the reduction in imports under item 731.20 in the
first half of 1983 compared with January-June 1982 (table C-2).
Position of interested parties
Zebco Division of Brunswick Corporation, as the only remaining U.S.
producer of fishing reels valued not over $2.70 each, favors removal of TSUS
item 731.20 from the list of articles eligible for GSP treatment. Failing
that, Zebco has petitioned for the removal of Korea, Taiwan, and Hong Kong from
the list of beneficiary developing countries with regard to TSUS item 731.20.
Zebco contends that the additional price advantage afforded to imports from
Korea, Taiwan, and Hong Kong through the GSP has forced other domestic manufac-
turers of low-valued fishing reels to cease production, sourcing from the
Orient instead. With the advantage of lower prices and the benefit of brand
names which fishing tackle customers associate with domestic tackle producers,

10
Digest No. B703--Con.
imports from Korea, Taiwan, and Hong Kong have taken substantial market share
away from Zebco. Zebco alleges that imports under the GSP are the principal
cause of reduced production, employment, and profitability on its low-valued
reel operations. Zebco asserts that if TSUS item 731.20 is not removed from
the list of articles eligible for GSP treatment or if Korea, Taiwan, and Hong
Kong are not removed from the list of beneficiary developing countries for
item 731.20, Zebco will no longer be able to compete in the market for
low-valued reels.
Zebco further contends that the goal of the GSP program--encouraging the
development of labor intensive manufacturing operations in developing
nations--has been accomplished in Korea, Taiwan, and Hong Kong through the
infusion of capital and technology from Japan, the United States, and Sweden.
Therefore, these countries no longer need the duty advantages offered by the
GSP to compete effectively in world markets. Zebco also proffers that if
duty-free treatment is no longer available for item 731.20, importers and/or
foreign manufacturers will probably absorb the duty increase so U.S. consumers
would not be affected. Zebco would benefit because U.S. importers would have
less profit available to direct towards adverstising and promotion and/or
foreign manufacturers would have less funding available for innovation and
development expenses.
Daiwa Corporation (a Japanese fishing tackle producer which manufactures
low valued fishing reels in Korea), the Korean Plastics Goods Exporters
Association, and the Board of Foreign Trade for the Republic of China on

11
Digest No. B703--Con.
Taiwan each submitted written briefs and gave oral testimony opposing the
removal of GSP eligibility for TSUS item 731.20
Daiwa Corporation alleges that the domestic industry producing fishing
reels is not sensitive because conditions have not changed since 1978 when the
Commission determined that imports of fishing reels were not increasing in
such increased quantities as to be a substantial cause of serious injury, or
threat thereof, to the domestic industry producing fishing reels (USITC
Investigation No. TA-201-34). Daiwa asserts that Zebco's 64 percent share of
the domestic spincast reel market precludes it from being injured by imports
under item 731.20. It adds that U.S. firms which have ceased producing
fishing reels did so prior to 1978. It contends that imports under item
731.20 are decreasing because they totaled less in the 5-year period 1978-82
than in the period 1973-77. Daiwa explains that an increase in imports from
GSP eligible countries has been offset by a decrease in imports from Japan,
meaning that Zebco has not lost market share to imports during 1978-82. It
further claims that loss of GSP for item 731.20 will result in higher prices
to the consumer for Zebco's reels as well as imported reels.
The Korean Plastics Goods Exporters Association argues that conditions
have not changed substantially since the Commission determined in 1978 that
imports were not the cause of infury to the domestic fishing reel industry.
Further, it argues that Zebco has been able to maintain its market share of
between 60 and 75 percent for spin-cast reels since that time. The increased
share of the U.S. market held by GSP beneficiaries has come at the expense of
Japan rather than Zebco. Also, elimination of GSP treatment for item 731.20

12
Digest No. B703--Con.
would defeat the purpose of the GSP program, since an increase in imports from
Japan would result.
The Board of Foreign Trade for the Republic of China argued that Taiwan
has never exceeded the competitive need limit for item 731.20 and Taiwan's
share of total imports declined during 1979-82.

13
Digest No. B703--Con.
* * *
*

14
Digest No. B703--Con.

15 .
Digest No. B703--Con.
Table A.--Fishing reels valued not over $2.70 each: U.S. producers' shipments, exports of domestic merchandise, imports for consumption, and apparent consumption, 1978-82, January-June 1982, and January-June 1983
(Quantity in thousands of reels; value in thousands of dollars; unit value in dollars per reel)
Period
: : : Ratio (per-
: Producers' : Exports : Imports : Apparent : cent) of
: shipments • : : consumption : imports to • : : consumption
Quantity
• •
1978 *** *** 1,950 : *** *** 1979 *** *** 1,728 : *** *** 1980 *** *** 1,860 : *** *** 1981 *** *** 2,182 : *** *** 1982 *** *** 3,158 *** *** January-June: :
1982 *** *** 1,809 : *** *** 1983 *** *** 1,412 : *** ***
Value
1978 *** *** 3,068 : *** *** 1979 *** *** 2,632 : *** *** 1980 *** *** 3,369 : *** *** 1981 *** *** 3,843 : *** *** 1982 *** *** 5;423 : *** *** January-June: :
1982 *** *** 3,069 : *** *** 1983 *** *** 2,741 : *** ***
Unit value
•
1978 *** *** $1.57 : *** 1979 *** *** 1.52 : *** 1980 *** *** 1.81 : *** 1981 *** *** 1.76 : *** 1982 *** *** 1.72 : *** January-June:
1982 *** *** 1.70 : *** 1983 *** *** 1.94 : ***
Source: Compiled from official statistics of the U.S. Department of Commerce and industry sources, except as noted.

January-June
by principal markets,
1978-82,
al U)
C rn -C U
0 C
U
.4) U) CU C 0
-o 4- O
10.0 WW L
a X
C z
cni • > = L
VU
m c
01 LM
C C7) IC C
N vi co O.
LL
i0
to
•
0
16
QI C
C to
•• ••
•• ••
N *0 Ct•
•• 00
1°4.•401-.0 4- M.0
N.- 4414.W•- 00=N
M
•• 00 •• •• 0* •• •• •• ••
0•ao.- MMt°4.CO WI04.N4.4.0oN CN.00 12.4)
MuNcONm 4- N.- W
01 00 •• 00 OP •• ••
WaNNNW4.-WN .04.0.0•4.WINNM ooM•UIMN.- 4.
O
In
CN N.
ul ul N
C• N.
••
N. N
Nt41.04.0.0004.• NNNWO•- ^ U100 N
•••••••••• •• ••••••••
NNOWIN WIWIWNMss'WNWI
•• •• •• •• •• •• •• 00 •• OS
NNNNWItil.- NN 4•MMMN•- •-
U1
••
In
••
N In NC.
In NU) MO4.000000 M.- WI.- NM N CD ‘o . • • • • • • • •
00w00MM0.- 0•
•••• ••••••••••••••••
oulMNWNMNN No^stoNNON • • • • • • • • •
.r.raN4- NM•-10•
•• ••• • •• •• • • •• •• ••
NIMMa4•ONI41.7 CONM4 oc0 . • • . • . • • .
N .0
.00
•• ••
M .0
O.
•• • •
Digest No. B703--Con.
N ......... M441 ,P-OWI•NIN O 4•COWIWINNMN141 00 N N
N •-•
•• •• •• •• •• •• •• •• . •• •• •• •• •• •• •••••••••••••••••••• •• •• •• •• •• •• •• •• •• •• •• ••
N 00.0N4'NN4,- N0' NoWW.- WMCNN N. Nt41.- 141o.- M.- 4° 0a00NWINN1AWI CO 4.oaMM• - 4- 4.In N NM.roNs- acoN J.- 4)4°M N N • • . • • • • • • ......... • 4.00441WIMM4.000`
co CO4.NNMM•N4° Woo •-NINN.- NNNN N O. N 4
•••••••••••••••••••• •• 00 00 •••••• •• 0*
04”-MWM4.4 o 01 m N. CD ■T v000 m4.00WINM•M0 irt N.414•WNWCNNW MNWw14'.- MW1m
00 .- 4 esi re) nl 0.0 g) cl+ 4 4 CV C•
N N
Mo•NasrNsOsoN .--------
o .ftftftft. omoONNMNNW 00 a
034- 4.4.004.4. N
al N
0
CL •• •• •• •• •• •• •• •• •• •• •• . •• •• •• •• •• •• •• •• •• •• •• •• ••
aNMWMWONN 4. MMUNWICNoWI4- MNomMWIMIo NWMWIa•so WNOM0040ce N NwomNom 4- 0• I. I. Ift 0..0 00 0•
. 4.
al NNM M .0 . . . . . •
N C coNNMWNO op N NMN to M In
N
•••••••••••••••••••• • • •• •• •• •• •• •• •• •• •• •• •• • •
..t.- ONNOMU100 O Mc040.,- NN0•N.- .0 Nco•co•aaa•- NOCONNNWW.- N. 4-MNM0441"*4- N 4. 000•NWm4.00 4.
ca Ms-N.-MMMoul N 1°.- .2"NN N. Ln 00 600000
NICNNCNO Ps.
NNNM4.40.04.M CO N 4.0•••■ ••••••••• MNN 0,
•• •• •• •• •••••••••••••••••••••••••••••••••••••••••• •••••••••••••• ••••• . .• • •• .• •
I I I I I I I I I I I I I I I I I I I I I I I
I I
I I
I I
I I I I 1..-4
I I
I I
lie 1La . .
I I 1041 I I IWVU I I 1040 al Y W L.C40 4-4 4- LMW W L.Ct. U
MM M-LCOCMUMOI--
00.-400.WO mm MLCOCMUM01-
ma-falawo MM MLCOCMUMO>
ma-loa.po z
MWM "-OCO .4C O MWM "-OCM
O 01-44 40 C00.0.NCNC4-4 CMCLMNONMC.-4 CMOCLYNMC.-o 40.00 M7400 L.-.-4 MDMO Oanoe=zi.Loa oanW=zWen< 0.4nw=z1Lcna
(1,00
0 do
llars
)
Unit value (p
er pie
ce
)
Compiled from officia
l statis
tics of
the U.
S. Department of Commerc
e.

982, and
imports fo
r consumption, by prin
cip
al sources, 1978-82, January-June
• woo O CO
IA •-• W C Au
0'1 C L
••• • C IA
LL
•-•■
C.3
4 0
17
Digest No. B703--Con.
CO
• • • •
•• ••
.•
CO O.
03
61.
• •
N CO
me.
• •
••• CO 0.
•
O O
?.• CP. ••■
•
CO P. cr.
VI
AlU
0.
3% 44
C
3 a
• • *0
qr p. oo .- UN .- CD 4 ND PI OD C. P. ND U,
.- 03 t. .- 42
OS.- N MS UI CD ND eg rN eg rl O eg ar ar
N N
•• •• •• •• •• 00 •• •• •• 06
OPSSPCO NP UN CO N CD UM N OM 01 ND ml CO Its 01 e4
••■ .6 06 66
eg PI ■- le) UN Mt 4 10 N O. cN M rl 10 CO .- 42 ar ra ND
N
•• •• •• •• • • •• 00 •• •• ••
UN ND CO CO NP N NO CN CD ON C) CD 03 CD C) 4 03 eg cy CO .......
rg 4 eg UN .- 4 UN PO un Ps ts 01 CO N 4- 4- pm .- P. UN 4
01
00 •• •• •• •• •• 00 •• •• ••
CD ON P. ON CD CD CD eg ND 4 t. 0 P. .- UN 04 CD 00 cm Its Al 00
N .......
SM 0• 4 CO PI ND 10 P. NI ek . MI ND N U1.0 4 .- UN MM
4 eg
• • •• • • • • • • • • • • • • •• • •
co ul 01 ml cr CO 0005 N so 01 ar eg C. CD CO ON CD ON N UM P.,
CN ND CD 4 4 OD 0/ eg Ps P. uN 0 01 N PI NO MI NI um MI
M eg
•• •• •• .• .• ••
uN 01 uN cD Ps CD ar N CD Ps UN UN uM eg ND UN UN N. ar ND C2
N N. N. CO ON C• NI ar 00 00 NO P- r4 CN MI NI ar • •
•• •• •• •• •• •• ••• •• •• ••
P. CD P. its N CO 0 UI 'ft CD uN
NSMNOCO .7
NIA CO 01 .43 01 un P. .- CO sO 01 .0S w
01 .-
•• • • • •• •• • • ••
0.6
.4
.4 0
13
O C2 CD
Al
00 ••
CD CO 0,0 UI 0 6,1 I CO res CD 0 ND UN 4 NO PP ON eg eg CO 01
C) O 4 eg
• • • • •• .• •• •• • • • • • • • •
Ps N P. O. O. .D 4 P. CD ON - .- UM ND UI cr cr o 01 0 un C2 eg
UN 03 4* .- eg
• • •• •• •• •• •• •• •• ••
O. SP its N .- ND 0D ND cr N CO cr so Its
sO O its CO ca h
.- at to .- S .-
•• •• 60 • • 04 •• •• • WO
S eg UN ao ar ao C• CO .- .0 r. N1 00 Ps .- 4.-00.-0Na:1Np its
P. N CO N 01 .-
•• • • •• .• • • •• • • • • • • • •
co M/ ar 1 in ND CO ON WI CD UM UN IA um UN un cD 01V
Ps 01 .- ru
•• •• •• .• •• •• •• •• •• ••
CD 4 4 OD C) CD I MOP CI C• P. CO CO Ch eg NO ND 0• 4 4* .7
4' CO t••• N
PM 4 N Cr. 111 ON I r, nJ 00 03 0 0 Ps
NO C2 CV NI U1 r, N
NI NO P. NO N
• • • • • • • • • • • • •• • • • •
PS
0.
L.
3.
0/ 3 04
C
•• • • • •
ONONN re• I UI CO ••••Nst 01 0, 0 M . - • • ' • • •
IT 4 N O. eg 02 40 N
NN.- ND ND CD ND COOS N. un S 03 03 Cr 11 PN • • • • • • • •
c. at .- es e4 .- ND 40 eg
•• •• •• •• •• •• •• •• •• 60
OP.- C. NI UN ND P. rl 01 P. WI ON uN CO .DO
O. • • • • • • • • • • 4 01 O.- N .- PI WI
40 04 .-
• • • • •• •• •• •• •• •• •• ••
NI III eg NI O.- O. ru U1 cr. 0. 00 .0 01 st • • • • • • • •
03 4, CD CD .- ru O. 4 40 N .-
•• •• •• •• •• • • • • •• •• ••
CO 0N ND ON P 0. I NI ND N/00.- CP. 11.1
• • • • • . • •
cr 0% eg .- /0 MS C- 40 NI .- N
•• .• • • • • • • • • •• • • • • ••
.DP CD mreg 01 I M000 sT pri CO 4 eg ON CD • • • • • •
N. 4 0. •••• •••• N. ark
•• •• •• • • • • • • •• •• . •• ••
.- so N Ps CO 00 1 CD• ON NO OD CD NI 03 C4 • • • • • • •
un M O. O,-N ar rn 410 4.■ m■
•• • • • • • • • • • • • • • • •• • •
0 O.
SD
•• •
4 OD
ND
CD
4
• • ••
01 c)
P-
.- •••
•
• •
CN
st,
•• •
ND w■
ao
• • • I I I I I I I I I I I I I I I I I I I I I I I I I I I I I I I I I 111 I I 1,.. .4 I I L. ••■ I I L. 01 I I 0 Ie I I 01 0/ I I 0 0 0. 01 .0 .0, 0. 01 •C 4.0 O. 01 .0 L. 07C111 C001.4+0 0 C 117 C 0 01 4.0 0 0 C CU C 0 01 .1., 0/
CCX01U 00UC01••• C CIC IL U 0 I) C 0 H C DC sr u go u c o 3 tn CO 9 C •••• ••••
09 Al 9 C 0.L....... W 13 C WC - - <
O.L X W 44 X bd r4 CL L. X X .4 X id .4 CL I. 0 CO 44 X OIC wi 003 L 0010 .4 C003 I. mold) .4 002 L. wow ..4 ',UMW HEE= ■LC "I le tn u. P 2C DC 0 0C "I IC 0 U. E4 = 3: = 4
Department of Commerce.

CO r. ch
U U L. 3 0 Vi
O. U C
o.
D.
imports for consumption,
•
02.70 each:
L.
0
4.7 0
C
0
3
a
U
L.
Table
C-2
.--F
i sh
i n
g
••
N D3
O
•••
0 0 . 0 O. 00 • •
00 06 .0 00
co
0 0 00 SID • •
U i.• 3 0
CON
cr•
Value
(1,
000 dollars
)
••
••
••
••
••
••
18
CO .■ 4'1031111 4' 03 Ch ,T PI
•• 00 00
M M.? .1 .- 1 M N .0 N C) qr. - P V/ . Ch
•• •• •• 00 •• •• 00 00 GO
.?M CO MI CD 1 h. 02 N CD
.■ 0. O. N
N•-•
•• •• •• •• •• •• ••
P. 04 0 I I ct■ N 4:7 u) p. .1.
•• •• •• •• •• •• •• •• •• • •
4) PO .0 cr P∎ 03 P. U)
U1 4.. O. 1 PI 1 I 1 CO
4) 1. IA
0 • 00 00 SO 00 0 0
co pn MN I P1 I I I er. .■
CD UM
••
••
••
••
.0 C. PO I .0 I I I I 03 O O.
• • • N
41),
•• •• •• •• •• •• •• •• •• ••
OD P. ■T WO PO P. CD Mg I U) MI 00 CO
• • • • • • • • N.- e4 N CD OD
O P.
• • •• •• •• •• •• •• •• •• •• ••
MP .0 UM .0 Ps CO N I N Ln C. MI COO CD 03 P.
• • • • • • • • ra •-• C) N C2
•• •• 00 0 • •• •• . •• 011 •• ••
.-Ut U1 .-P I I pl Ln
• • • • • N NI ••• •••
•• •• . •• 00 •• •• •• •• . 0. ••
w. 6.1 1 CO 1 11 1 Ch1.11 .■
• • •U1 CO
N e)
•• • • • • •• • • • • • • • • •• • •
•-pscp1c0NI I IN COMP .0 •40 In
• • • • • N
•• •• •• •• •• •• •• 00 •• OD ••
%0 CD 1 .0 1 I 1 CD P.
• • •
a.
••
0
O. CO U
0.
L.
O.
3
C
Department of Commerce.
•
0
ID
(A
+7
ti
U 4- 4- 0
E O
4- • C V CM U M
C 0. E
.0 0 +7 C.)
N • 111
ar U -1
3 0
Digest No. B703--Con.
CD UI ON 000 CD 03 O. hJ PO Ch CD
Ch P. 1,1 CO O. VD N PO
•• •• •• •• DO •• •• •• •• ••
CI Ch CI CD CD C$ O C) UN .42* C. CD CP 4' CS CD
P. Co P. MI CD N
P. VD IS %). N WM UN •
.-NP 03 r. •T MN N .0
•• 00 •• •• 00 00 •• •• 00
CI WO Ch C2 .0 CD CD CD UN C.? CD UI.? 00 CD P. ••••• C2 MI CD CV
NP .?J .OU1U1 .- N CN C2 03 MI O .0 111 V) N
•• •• •• •• •• •• ••
O IV N CD CP CD CD VD CD 42 PO Ul UN CD .- 111 P. N1 42 UP ....ft
.■ C. CD MN 4' M4 e-
h. .? PO MI
• • • • •• • • • • • • • • • • • •
CO VD CD CD CD C2 CD C2 PJ S P. pn
,0 MI C. N CN •0 CO
CP N
•• •• •• . 40 00 00 00
N N CD C) CD CD C)
UI MI CD P. UI rN .-N
CD CD C$
P. NO CO P. MI
00 •• •• •• e• •or •• •• •• .
N.1 .0 CD U) CD C) C2
111 No .4,
1.■ MI PI N
PI CD P. VP UM
I I I I I I I I I I I I I I I I I I I I I I I I I I 7 I I I I I I L. ..1 I I I L. .4 I I I GI 10 I I I Or 0 0. Cr, V .o 4a 0. 01 12 Of CO 017 1 047 0 W CO 41 41 04•7 0 DC 0 0 U c u N cu o I- cc ,,,0 o 1.1 c u 1.1 ID 0 t-
ad at .- W C 4, '0 r... De ••• • C •1J 13 IP I..." X MOS ••■ t1/1 I. • .1 IC CL OS ••• 1$ F.. ,-1
0 co 01 di CO L. 3 3 .• 0 oj 01 0 0 L. 3 3 •-• be E..' X E --) U. 0 LO Di he E/ X E '') LL tn fro 4
Quantity (pieces
)
I I I I I I I I I I I I I I 01 I I I L 01 I I I ill X O. en V .0 L.
Co 1114134.7W IXECDUCUP/0/03
7 7 be - CO C 47 V De L 47.1 x c.a..- 0.4 0 03 01 01 111 L 3 3 •-1 heE-I=EnU• til tii 4C
•• •• •• •• •• OS •• •• •• •• •• •• •• . •• •• •• •• •• •• •• •• •• •• &a •• Ow •• •• •• •• •• ••

19
4 0% 1•1 an • N 0% C N 0% 1.4 sr •lo •-4 N rl Col oA Pe• N
• • • • • • • • •
1-♦ 0 42 0% 0, • VI •-I
I0 ICI P. .4' CO r4 N Cot N
• • • • • • • • • •
02 t•• r•• ■13 C0 0% Cr) 0% in
• 0 • 4 42 et 4' CO 0 tit •0
• • •• •• •• •
0 00 40 0 ▪ N N el 01 CO
•• dio
.0 N N 43 4 VI
• • • • • • • • •
04 CO CO 0 40 In el
1"
N r4 r14 N tO in CA
r4
•• •• •• •• ••
VI OD CO el
0
CO 40 4
N at r4
0% f N
rI •
• • • • • • • • • •
CO 0 N 0 1-4 VI N N
00 r1 C) 00 VI *0 41 ♦ rl
r4
• • • • • • • • • •
•r
•
t •for a
cr•
■
V1
8-1
••
.4)
N •
N
03
••
N
cr,
e•
N
N In O N N
••
r4
• •
2,4
78,20
• •
0%
N
O
r•••
4
N • •
O 00
■
N O N
N
44 O
g •••■
▪ C
▪
•1 N CO
'0 • • • .4 a d r-I 0
1•2 RI I • On O la • II O 0 •
14 • • d 40
.0r2
13 0
14 13 VI •
•0 14.1 •• •• •• • 0 • 0 r4 • N •
CO m • O 0' .0 1.1 O 14 a r4
N 00
fora le
0 1.4
1 g ° a a .0 I.. a 1st O 14 0 1-4 •• •• •• . O d .44 1-4
a 0
RI 0 • •0 O d a
414 r4 a d *re
4, PA CO ▪ N • cr• ▪ oo •• O I • r4
CU 40 d • 1••• • •
•••I 0% •
r4 •• •• •• ••
02 • a •0 a •
• Cr 01 re.
1. .1.)
•• a ere r4 U 0 .0
I-I a a
14 A a NO • a CO
•••■ • At 0 ob
erd • pq S4 I •
41.4 • 0
lam
•
Janu
ary-
June
• • • • • • •
• • • • • • • •
• • • • • • •
• 1.
0
• 0
10
N IA u^t 00 I••• N N 441 t••• • N
• • • • • • • • •
00 00 Q I VI 0 •11 4.0 f •
• • • • • • • • • •
4' 0 42 I 43 0 CO N
•• 401 r4
• • • • • • • • •
I-1 0% 02 I N N CO I.. 00
rl •
• • • • • • • • •
C) 0, N I 60 el 0 0' 0' 0
r•
N CO in %0 rt or 00 re
Cf• • • •
r4 r1 0 44 r4
rl
• • • • • • • • • •
fy) 42 VI I 02 VI rl • • •
1-4 N
• • • • • • • • •
as 0 40 I 01 .0 0.
• • • N r4 •4
• • • • • • • • •
•of 40 in I N tre
• • • 411' r4 N
• • • • • • • • •
r4 C)0 r ♦
• • • •-I Cot
40
• • • • • • • • •
CO e-I C•1 a C•1 • • • 41' 1-• N
• • • • • • • • • • • • • •
4 00 N • N CI% • • •
r4 r4
0 er;
Unit
va
lue
0
••
0
N
• •
0
co
• •
CO co en eh
N
•• ••
00
N •
• • • •
O N
•• •
1,••
Col
• • • • • • • • • •
• • • • • • • • • •
CO PI OD 1% r4 • tre
V1
••
N 0%
•
• •
o%
• •
Digest No. B703--Con.
• • • • • • • • • • I I I I I I I I I I I I I 11 I I I I I I I I I I I I I 1 I I I I I I I I I I I I I I I I I I •
d I I I 41 I "I I d 11 60 • IN d r4 • 10 44 r•I • 0044 VI M 0 0 0 14 0 0 0 te 0 0 II 0 0 ••4 4) 0 0 .0 4.) 0 0 ••4 • IN 0 IN 4.)
Pe 0 IN : Id As 0 Id 0 Id 4.1 IP
• 0 a II.4 0 0 40 • )1 ID • • It Id • • 31 40 •
Ste «4 0 Id th •■• 0 id it• .0 0 Id • 0 0 te •0014 0 0 0 Se DI I-I M ill Di 14 = 4 OS PI M ad
•• oe o0 00
• 0 RI
a
•
0
• •C
44 0
al
..4
10
a
▪
t
•
1-4
.44 44
414
'0 • r4
0
• • • Re

Unit
va
lue
•• •• •4 ••
1.• 03 4e Ot 0 *0
*0 *It
• • • • • • • •
0 0* *0 N GO CO tri 0 0+
•• v-4 r4
• • • • • • •
r4 003 CO
Cr)
a
• • ••
CO CO
••
N 141 0
N
••
1.1 1••• 0 0 0 0 111 •4 *0
r4
1-1
• • • • •• • • •• •• •• •• •• •• •• •• •• • • •• I I I I I I I I I I I I I I I I I I I . I I
el I I d I B0
O ED 10 f•1 0 NO 0 ••
oII 0 14 0 14 U 0 41 0 0
ft 0 1d o 10 0 10 LI 0 I-I d 0 0
• IS NO • * 10 o a+ .4 a 0..4 a co • 0 0 • 0 o OS 14 M OS 14 M
•
0 .0 of
414 0
a U
•••11
a
4.1 a
.14
IN O
O /4•1
1:1
r-1 •••1
0
• • • • • • •
CO
N
at
r♦
• •
1-i 0 to
C•1
••
a- ct 0
N
••
*0 P•• 0
Cr)
• • • •
ra
.
co
V
co co
r4 0
14.4 0
• • • •
w 1-4 01 • 4)
• 14 r-1
a
•• .•9 •• ••
0 *0 Co) N Irt rl
• • • N
4,
• • • • • • • •
rf Ca .0 r-1 e's
• • • CSi r4 r4 41.
• • • • • • • •
rI t-1 N o r4
• • • N rIN
• • • • • • •
• • • • • • • •
*0 40 00 ▪ r4 0%
• • • r4 e-4 411.
• • • • • • •
4) • v4
4'
• • • • •• •• I I I I I I I I
d I I O 10 r4 oLa 0
0 41 IN 0 IN 0
10 E4 • 31 10
13• ..4 • 0 01 M
0 Ca r4 0 a1 04 N
• r4 N 0% IA tet CO
N
O N r ♦
02 trf N
.-1
••
0
1•••
• • • • • • • • • •
O r■ r•-• 4t
vs . •
cel C11 N CO 0 ts VI
0 GO 03 0 0* 03 r) th a%
In a a a
co cri el o en sr en
• • • • • • • •
O • rl
v-1
to co *0
1••
0
ri
0 *0 0 0 43' 1••••
1-1
r) r,. •0 CO 41' N
*0 r4 411'
CO of •
• r4
• • • • • • • •
•• • •
CO 0 *0
N N
•
Cr/ •
v-1
N
N
••
*0 re
I ♦
Jan
uar
y-J
une
N C1
• • • • • • • •
• . a Rc csa al co
•-I ot r-1 r4 0
▪ •• • • •• • •
0 r-1 0
GI 0 V RI
r4 d 0 • O v-1 0 .0 41 La
el ▪ •• •• •• •
• 0 1:1
0 r4 d
CO 0*
•• O 1-1 O v-1
✓4 O a 0
•• •• •• • ..4
• 0, 0 0 •94 R at
a1 n 12 a 41 O 0 ..4 r4 0 1-1 0 0 O 0 d 0* Le 0
os •• •• •• •
r•I O LI O Or CO Gf f•••
ca.4 cri 10 0 ra
g a 4)
••=8
• Ief I CO I. .0
4e 0 I N
(.) spa
ROi O el
1-4 1.1 0 .0
•
0 00
a C9
ca er .♦ yf 0
1.1 • 0
1•3 O I
11**
d O 0
.t.)
g mr a a
Id 0 U N •
la 03 O cr.
r4
• 0 41 0 14 0 O 11 0. I
1 La 10)
• 0 01 13
• el O n
•• 04 01 CO ▪ I 0 CO O r.
0 1-1 • .
N 40 0
U Le Le O 0 a 0 O 01
• • • • •• •

41' CO
N v1 Co v1 r4 . . • • • • • N
03 P. VA OP 0 43 *ID •C) oa •0 •
•
0
0
44 0
AA a
a 14 • at 0
O
0
yf
44 0
• C)
44
44 4)
rl
4.)
44 0
44 044 414 0
a 0 La
44
'0 0 r4
• 0 IJ
••
0 o 1.
0 co
a 0
a
00 0 . 00 •0 0• 00 00 60 0 , •• •• OO •• 1 1 1 1 I I I 1 1 1 1 1 • •• I 1 I I I I I I 00 N I I I I 1 1 0 00 00
0001 CD 11.4 04 •C0'01 r. P. CO OD 03 DI P2 r4 r4 Ca Ca of Ca Ca r4 r4 r4 r4 ri
••
Value
(1,
0 00 do
llar
)
•• •• •• •• •• •• •• •• •• •• ••
•• •• •• •• •• •• •• •• •• •• ••
•• •• •• •• •• •• •• •• •• •• ••
•• •• •• •• •• •• •• •• •• •• ••
0* 00 •• 0* 00 0* OP 66 ilpe *0 Oe
43 CP CO VI MI P. r4
P. 40 04 p. 0 O N
N IO on OI N
4t el CP CP 0 7.•
OW 42 WI 4:10 . el CO r4
r4
OD 03 r4 4.4 4.` 4 1
41' 0 r-1 o-1 r.1 N N 1-1
a a 4r ws el
WI 00 Iff CA I 1 I 0 VD .0 4' N N
04 04 r4 GI 4, 0 03 01 VI GO r4 • 4t UI VI
Digest No. B703--Con.
21..
a 0 44
.ee 44 a 0 0
en rI 41 CO
0 12 0 a 1-4
000 O 0 La 0
C1G 44 0
o 0 P2 Ci4 .0 0 I
4.1 ••4 to .0 14 .0 a GL R4 0 0 0
•
0 La 7 0 Cla 04 a • E 0l t" .4 0 0
0 0 •11 • 44 a
110 4) Ca el • a. o g .•N
• • CO •• r4 0.
•I0 0 0 r4 0 0 0
44 • 0 14 0
0 Id 0 44 0 P)
43' 44 1 • 0 .0 01
404.1 0 1. 40 to d
o 44 0 Re De
r4 0
0 • 0 44 ■••4 0 0
41 toe N 0 44 0 CO 0 0 I
.0 a co 4.)
0 a • Sr 04
.0 0 r4 0 M
0 0 - h. a
• a a N ►4 0
e-1 1-1 0 a
0 o44 0 0
to 14 4.) 0 fa cla 0 0. Br'
0 04 Lo 0
10 0 ca ...a • .0 .0 to ca
44 • • • •
• 44 Os 0 0 44 01
to 0 o
LI 0 44
0 0
• 4 r4 41 • Cie 4.) a 0 0
01
0
U
•• ••
0
oft CO
'~ 000
• 14 0 0 0 It Id
44 0 0
0 • M
O. CD •3
CM a •
a 0 0 14 d W a
.4 al
0 11.4
.0
• • • •
0
a d 0
0L
• 0 0 0 14 = 0
II 0
44 0
•• ••
r4
0 14
4) a 0
0 a.
•
a
•
0*
••
a NI• e0 10 • • • • •
en aI en if) • 1 4t .0 i .0
00 40' CT 40 CO P. in 02 0. Cr) el 42 4, 0 N
a a •
r4 GP CP 4e CP 03 00 CP Cb 0 rlr-Cprl
0
r4 rl rl 1.4 N
•• •• •• •• •• ••
OD 4, GI 4, CD
em Ow r4 40 0 N10P-v,
00 4: •C) •0 C4 C4 el C)
rl
.• • r4 e-1
4t • • O r4 111 GI
O• 4t el el IO el o •
OD CD 4e CP 04 4r
0 •
r4
•• •• ••
C) 0 0 C) WI
N
40 0 0 S 0 •• •• 4•► •• •• •• •• •• •• •• •• •• •• 04 .4
Le 0 0 SO 0 14 Re 0
04 0
.4 r4 oo
C
40 04 04 41. c) 4, co CA Co CD co el es
co c)
0 = 414 KO
La 0 0 x° IL
0 woo. VI N P. p.
•0 0 •0 C el 01 r4 • •■ 0 0 0 0 ■ 40 CD • • • •• •• •• •• •• •• •• •• ••
1.4 0 0 0 .44 0 • Id al
0w .4 0
.4C .0 0 0 o r4 4r en
00
d 4.4 1.■ r40' • 110 10 0.
a-4 0 44 La .4 Ot 0 0 0 d 0 41.1 • el 4' 0 • M 1-1 •0 0 Le al 0
44 •0 • 0 •• •• 61) 1.4 0 41
.rat 10 •d 0 a
4) 44 C4 CO OW C) co el le) c) co
00
.0 0 0 C 0 Id m
pl CD a 04
O 1 • • •
00 I-1 tJ
0 0
• Le 10 0 0 Id ad
00 VI C) VI aaaa o
r4 04 e4 04 04 47 Ps 4r CP, 40 4,
r4
0 141
41 44 .4 00 0• •• 00 00 00 00 0 0 6• 0• •• •• •• 60
1 1 1 I I I 11 C) LI .0 I I I I o• 1 I
• • 0 0 I I I I ION el 0 42 14 ate 44 I I I I I 1 0 10 0:1 r4 0 0 it OD CA C) C4 • 0 CP CP .00 4‘111 O P. P. Co CO OD0 P2 r• r4
0. CP aCP CP Cb d


N 00 0, 1-1
10 JJ
0 0. E
to
• - C 0
JJ
0 VLa
.1.41
Lo
1144 444 .41
13
C 0
U to '0
.0
7 C
E 42
02 ▪ E•1
6.4 H (.4
Description
0
Certain glass containers
• 4.1 NI 0 Ca3 144 03 0
• 0 CV 0 • 13. 4-1 •
E 4-• ••• Cos
• • • • • • • •
N aJ CP 0
• .141 HI 0 0 Lo 44.4 U 0
N 03 OT
0
• 03 O. 04 I 4-1 0 1
1980 : 1981
• • • • • • • •
•0 C
.1J
E. JJ
OD
Of
03 N Jir 4-4 1.1
•••.. • 01 V
' .0
•••• 0 ••.. • V. 4 H.0 •••• O 40
I 4.4 V
r•1 1•41
• 0 4/ O 0 0 • Li 1.4 N. 14. Is.
011 •••■ VI •IA
V 0 in • 0 40 Li 0 .0 0
• 00 • t-1 4.-1 0 0.
•••. 0V V 0 0, • CO Lo 0 .0 0
• 01 • N 01
• •••. •••. 0 V V 0 .0 HI 4 HI • W
• OD • .0 I.. 41' 0 44 44
04 •■
•••• 0 V •••. •04 0 03 • V •
1.1 .0 .0 • 60 • • In 0 0
04 •••• • 44. 03 v ✓ 0 DI • V •
r•I .0 • 60 • rl • 4.4 .0 0 0
•041 •••.. ✓ 0 n•• V • P3 N .0 H .0
• 60 • • 03 0 0
V) •••.
03 V •••• Vo 0 NJ • V • .0 4 PI .0 •••■ .0
• 60 • • .• 0. 0 0
• .41. 041.
Crl 03 03
0. 0, 0. O 4 • 4 4
to .0
0 It WI 4 00 •••. CO HI 00 • V • •••. •
•••4 1-4 ri• N V I-1
••••• ••••N ••••• 14-1
4-.1 0 0
i • V .0 1
1.I • 15 1 C -, 4.3 ••••• 003 C
. ..A.I .1
01.10... C 0 O 66 0 I. 0 i .... .0 0 •- '. 0 tia 0.
•••■ X 2 ri 10 44 . 20 .1.1 O 0 C C 66. C .6.) 1. 0 .0 C
0 .0 •••• 0 0 ••. 0 .... 7 al • •.... ...,. • c
.63 0.4' 0 43 . ... .e at 0 of of ,-.1 C
5 . 0 .0 0 0 ...., 0 0 .•I .3.) ...,
La 0 $.. 0 0 • .-I 0 0 Lo .0 = CV 0 04 0 L/ v•I 0 L./ H OD •••• .444
.1.1 Vi.. 0 E 0 v-1 of 0 0 0. .-4 C. .-) 0. C ‘0001.00 0 0 V 0 40 0 E ,.t ...) e .1.) 4 ,-1 i., O 0 La 0 C 0 • 00 0 0 4' 4/ 0 14 0 41 ••• .0 oco .c d. g o > .. > O 0 0 C 0 a) 0 v. 0 .1.) 1.., .... 0 01 0
in 00 > oa 0 oa 0 .-I 0 .0 0 w1., • 0 0 .•. 0 e C Lo Ur 4•446 0 U 0 AO 0 .0 .1.1 44 *1 42* an o. ad .od '0 m e .c ... to - V oi o -II
0 44 0 0 0 0 0 44 42 0 0 LI .-■ r-1 = r-1
...004001.0...0 vi 0 0 0 0
0/ 0 ck, g of 0 C. ob 0 at 0..0 X 2 = 43 43 O 0 0
• V
. 4 4 N N
0.1 N an
.04 Q 41.
Y1 WI 1f1

2
Digest No. C-501--Con.
II. Comments
Description and uses
This digest covers those glass containers (with , or without their closures
and whether or not coated with plastics materials) designed for the packing,
transporting, or marketing of merchandise other than perfume or other toilet
preparations, and includes narrow neck and wide mouth glass food containers
and refillable beverage containers. These containers can also be used for
home canning and preserving. For TSUS classification purposes, these
containers come in three sizes: holding not over 1/4 pint (item 545.21);
holding over 1/4 pint but not over 1 pint (item 545.25); and holding over 1
pint (item 545.27). These glass containers are principally used to hold
beverages, foods, drugs and medicines, and household and industrial chemicals.
The major portion of these glass containers are manufactured by
continuous, automatic processing machines which press and blow molten glass
into glass container molds of various shapes and sizes. The containers can
then be decorated, sandblasted, polished, or annealed in secondary treatments.
U.S. customs treatment
The three TSUS items covered in this digest have been eligible for
duty-free treatment under GSP since its inception in 1976. Since that time,
no eligible countries have been excluded.
U.S. producers and employment
There are approximately 18 glass container producers operating about 110
plants in 30 states. The 12 largest companies manufacture nearly 80 percent
of the glass containers produced in the United States. Glass plants in New
Jersey, California, Illinois, Pennsylvania, and Indiana accounted for

3
Digest No. C501--Con.
approximately 58 percent of industry shipments in 1982. Total employment in
the U.S. glass container industry in 1982 was 61,000 workers, 54,000 of which
were production and related workers. This industry is considered to be
localized, generally serving area markets due to high shipping costs.
U.S. consumption and shipments
Estimated apparent U.S. consumption of certain glass containers
fluctuated in a narrow range during 1978-82, rising from 306 million gross
($3.9 billion) in 1978 to 313 million gross ($4.4 billion) in 1980 and then
declining to 301 million gross ($4.9 billion) in 1982 (table A). U.S. imports
of certain glass containers accounted for 1 percent or less of apparent U.S.
consumption during the period. The high weight to value ratio of glass
containers discourages long-distance shipment of these items. As a result,
estimated U.S. producers' shipments are approximately the same in units and
value as apparent U.S. consumption. The decline in apparent consumption and
producers' shipments is attributed to the economic slowdown and intense
competition with substitute articles, particularly plastics.
U.S. exports
During 1978-82, estimated U.S. exports of certain glass containers
accounted for 1 percent or less of U.S. producers' shipments primarily due to
high transportation costs and the localized nature of the market. U.S.
exports rose to 1.7 million gross ($30 million) in 1980 from 1.4 million gross
($22 million) in 1978 (table B). U.S. exports then declined during 1981-82 to
1.3 million gross ($32 million).

Digest No. C501--Con.
Canada was the principal market for U.S. exports, accounting for 40
percent of this total in 1982. Jamaica and Venezuela were secondary export
markets.
U.S. imports
U.S. imports of certain glass containers rose gradually from about 1
million gross in 1978-79 ($14-16 million) to 3 million gross ($54 million) in
1982, a 200-percent increase (table C). During January-June 1983, U.S.
imports totaled 3.3 million gross ($29 million), up 136 percent from the
corresponding period of 1982 (1.4 million gross, valued at $28 million) and
surpassing total U.S. imports in all of 1982. The principal U.S. supplier in
1982 was Canada, with 74 percent of U.S. imports. Mexico and France were
secondary sources of supply.
The level of U.S. imports from GSP countries varied during 1978-82,
rising from 80,000 gross ($1.5 million) in 1978 to 117,000 gross ($1.3
million) in 1979 before falling to 63,000 gross ($1.3 million) in 1980 (table
D). These imports then increased roughly five-fold to 303,000 gross ($4.5
million) in 1982, approximately 10 percent of total U.S. imports of these
products. During the first six months of 1983, U.S. imports from GSP
countries totaled 895,000 gross ($5.2 million), compared to 74,000 gross ($1.2
million) during the corresponding period of 1982. About 27 percent of total
imports for January-June 1983 was accounted for by imports from GSP
countries.
Mexico was the principal GSP source of these imports, accounting for 53
percent of total imports from GSP countries in 1982. During January-June

5
Digest No. C-501--Con:
1983, imports from Mexico accounted for nearly 90 percent of GSP imports,
compared to 22 percent during January-June 1982.
Due to the prohibitive cost of transporting empty glass containers, most
trade in this market is limited to border trade with Canada and Mexico.
Generally, imports from these countries most seriously affect the domestic
glass container plants that serve the border area markets. Both the foreign
and domestic glass containers are of like quality and end-use, and a
significant price differential is generally the determining factor when
purchasing the merchandise. As an example, the unit value per gross for
imports from Mexico was $14.30 in 1982; the estimated unit value for
comparable U.S. products was $16.33 (based upon data in tables A and C).
Position of interested parties
The Glass Packaging Institute, the petitioner, which represents a
majority of U.S. glass container producers, testified in favor of GSP
graduation of Mexico, citing the import-sensitivity of the glass industry,
injury to the U.S. industry, and the threat of further injury if GSP treatment
for Mexico continues.
The principal Mexican producer of these products, Vitro Envases, and the
major U.S. importer testified in opposition to GSP graduation of Mexico,
stating that the low level of glass container imports could have no effect on
the U.S. industry which is in good health. Further it would provide benefits
to the U.S. consumer.
Vitro Envases testified that there was a problem of misclassified imports
of certain glass containers into TSUS provisions subject to this GSP
investigation (545.21-.27) and asserted that about 75 percent of these imported

6
Digest No. C-501--Con.
items would be more appropriately classified in TSUS provisions for containers
used for perfume or toilet preparations. 1/ '

7
Digest No. C501--Con.

8
Digest No. C501--Con.
* * *

Digest No. C501--Con.
Table A.--Certain glass containers: U.S. producers' shipments, exports of domestic merchandise, imports for consumption, and apparent consumption, 1978-82, January-June 1982, and January-June 1983
(Quantity in thousand ross• value in thousands of dollars) :
Period ' Producers ' shipments
1/
' ' Exports 1/
• .
:
:
Imports
:
: Apparent consumption
cent) of
: : : • .
Ratio (per-
imports to consumption
Quantity
: : : • . : 1978 : 306,044 : 1,388 : 1,098 : 305,754 : 2/ 1979 : 309,069 : 1,567 : 1,044 : 308,546 : 2/ 1980 : 313,689 : 1,689 : 1,440 : 313,440 : 2/ 1981 : 311,371 : 1,340 : 2,563 : 312,594 : 1 1982 : 299,000 : 1,328 : 3,022 : 300,694 : 1 January-June: : : : :
1982 : 157,500 : 676 : 1,435 : 158,259 : 1 1983 : 3/ : 617 : 3,314 : 3/ : 3/
Value
1978 : 3,888,335 : 22,328 : 13,779 : 3,879,786 : 2/ 1979 : 4,076,673 : 27,439 : 16,493 : 4,065,727 : 2/ 1980 : 4,379,008 : 30,161 : 24,261 : 4,373,108 : 1 1981 : 4,760,550 : 33,160 : 44,101 : 4,771,491 : 1 1982 : 4,882,066 : ,'31,713 : 54,117 : 4,904,470 : 1 January-June: : : : : :
1982 : 3/ : 16,525 : 28,207 : 3/ : 3/ 1983 : 3/ : 14,429 : 28,888 : 3/ : 3/
1/ Estimated by staff of the U.S. International Trade Commission. 2/ Less than .005 percent. 3/ Not available.
Source: Compiled from official statistics of the U.S. Department of Commerce, except as noted.

1 0
0010=0,.N.-cr. wln W000P.N 0M CO1.0NMICI
Pee
00 00 60 00 00 041 S O ISO 00 4.41
M1f)N.-0W00c. MwMM.orloW.- oNcorsoo.00.0
ft
06 00 DO DO 00 00 00 00 041 00
WM0.00M01..a.- 0000.0MW0.10 • 06 Se
ele,0■ 10, 0•
.0 00 .04, 00 00 00 WO 00 OS 00
000MOWMPs0U1 4-...4=00t■ WW•0 w00ccio0W1■ 00.•*
Os ••
NO) N CO
00 46 . 0. Se .0 00 ee 00 00 00
0WW.40M0M000
WW .- 0W4=0•w . de
••• re.
•••
60 4.0 4.11 041 •• 410 00 e• Oe 00
NN.-P, 0000M
W001.0.0N
N N o- Co
• •
• •
CO N 141
cr. N
• •
N
••
• ■•
• •
M M
• •
•••
• •
•• •• • • • • •• •• •• • • •• • • •• •• es • • • • so or• es es • • • • •• •• •• 00 00 •• se
1111 III 1111 I I I 1 III III 1 I 1 I I L 1111 1010
M .-IL•.0 M "- CIVIC- 0140 0 MNL...E7CL
0O
MOOMMMW CCOELCUM.4. 410•...11100 0702 -201==.44IC
ON.W.- 00MO.N.0 W.- NM.
••••
•• •• •• •• • • • • 00 00 •• •• • •
oM01....ONWWW owNNWN.- .- WN
•• •• •• •• •• •• •• •• •• ••
NN00.0WoMW M0WN.0WMN.0
• • • • •• •• •• •• •• 00 00 ••
NO, W=0.-MMm 0
DO 0• 00 00 ISO •• O. 00 •• OS
• •
CO N M
• •
M
• •
• •
woM.0WNNM .0M
eib 00 00 00 Oe 0. 00 60
Mo0.42000.0Wn 'Ti.') MNNM0.-.0 0W Wirs
(1,000 dollars
)
7
• • • • 0 0 • • • • • • •• • • • • • •
W•M0000•..0•.000 0N.- NN000
WN
(1,000 gross
)
4'
C
a
y princip
al markets, 1978-82,
co N
-o • C
ro
U
E
U
In
E 0
ai C =
L ro
CO
C OO
N CO
00 .1 00 00
4.0 00 00 00
O
•
0 MC XD 0/ -)
0 L • 0 = D
a.
OM
ro
0 00
Digest No.
C501--Con.
Depart
ment of Co
mmerce.
•
0
0
In 0
4)
0
0
U •-1 44 44 0
0 0 II 4•
a)
• 0 0 0 4.4 0
2 0)
0 , 0

(0 co co
CO
O
■•••
•••
O •■•
.2•
0) U P
0 0
0
a) E
td
A
• • • • • • •• • • • • • • • • • • • •
.431,..00W00MO
•••
• • • • • • • • • • • • • • • • • • • •
..t ,OWNW/NM NNN
• • • • •• • • • • • • •• • • • • • •
0=N•0t= 111 ,rirl
••• •••
••
cv
IM•
to
te)
In •
cv
• • • • • • • • • • • • • • • • • • • •
tmcN00.1t.140on ••• - co oct 4 111
M cv
• • • • • • • • • • • • • • • • • • • •
WIM000 ■0.- 00NWI
••
In"Irn .Nr
• • • • • • • • • • • • • • • • • • • •
resMr-soWtheelW ,*- N
•• •• ••
. Co .- 41.0
pal so
urc
es,
1978
-82
, January
-
C - L a
C O
-p 0- E z
C 0
L O 4-
u.) -p L 0 a E
tm 00
• 0, (11.—
=(1
•
1 C
Lon L I W > CL
M7 4' C CM 0 -)
• 0
MM to
CO C
•••-
L C W 7
C.)
I-
•
00
00
01
L
O cf)
• • • • • • • •
C■1 CO
W1.0M1MON.- 0.100 .co st .-WIN NI,
OMN
In 0 N 0...-N00 03 •-• o *.0 .o (Si
te/ 6.1)
• • • • • • • • •• •• • • • • • • • • • • • • • • • • 0* •• •• •. •• •• •• co
...a. ov,insotoo......1..cvo 00 NWI4:04- 1,..00.- - in in 00 •• r-.4 ••• , 11 .0 Os CV CV •-• inN 43 0) in et* cv .1 in. Mr..N^W ON ..0 o •• a L ... a 4-1 L ..-. •- (0 cr.. cv .1 01 -I - cv 44
-.4 o O o = m co 0 u
O ,-1 ••• 0 4.4 ••••• 00 •• •• •• •• •• •• •• •• •• •• 0 • • • • • • •• •• • • •• • • •• • • ca
- -r4 > WIP.00NOONO•sr
-
ohr...1011W1stre) 4.3 -I' 0 COI CV . .
▪
1 •.o. - lel re) 0.. .0 In cr. al co ......= cnrain vp rs4 4..)
4.) .. 01 •• •• W C — 7 N .•• .0 (0 -1 .- 4...,...1 = ni cd cr > -t-i
I 11 I II 1 II I L a)
I W U la
10OW.-4 M(040 MUUM>EECO 0
CXMNMCMM•.I MML 40,57 OELLZI-I0L(IM.5
C.)
Na
• • • 00 •• • • •• •• • • •• • • • • •• •• •• •• •• •• •• •• •• 0
4-tv■ or..00rm1n00 1110.1irm11innJoso *.• tea'
o er• Os 0 00 Ph 14 •■ 4.4
CP•
- a)
E 0
I I II I II I L.-4 I 01 f0
MM
▪
O-M0 M
•
00M>EEC01-.
C
•
XMNMCMIC...i Malt. 4JM7 OELL=1.411.0= 4C

12
Digest No. C501--Con.
Table D.--Certain glass containers: U.S. imports for consumption under the GSP, by principal GSP sources, 1978-82, January-June 1982, and January-June 1983
(Quantity in thousand gross; value in thousands of dollars) : : • . • . •
January-June--
Source' 1978 • 1979 • 1980 • 1981 • 1982 • : .
' . •
. • 1982 1983
• • • • : . . .
Quantity
Mexico- : 10 : 6 : 5 : 14 : 162 : 16 : 801 Taiwan--- : 69 : 110 : 53 : 42 : 40 : 16 : 44 Guatemala : 0 : 0 : 1 : 15 : 27 : 11 : 5 Panama : 0 : 0 : 0 : 4 : 21 : 1 : 20 All other : 1 : 1 : 4 : 55 : 53 : 30 : 25
Total : 80 : 117 : 63 : 130 : 303 : 74 : 895
Value
Mexico : 923 : 732 : 745 : 1,139 : 2,874 : 656 : 4,248 Taiwan : 605 : 573 : 494 : 393.: 264 : 118 : 167 Guatemala : - : - : 17 : 231 : 465 : 174 : 61 Panama : - : - : - : 78 : 516 : 84 : 490 All other : 17 : 30 : 69 : 414 : 392 : 197 : 200
Total : 1,545 : 1,335 : 1,325 : 2,255 : 4,511 : 1,229 : 5,166
Source: Compiled from official statistics of the U.S. Department of Commerce, except as noted.

TITLE: Porcela
in-on
-ste
el cooking and kit
che
n ware (
Taiw
an)
item numbe
r; de
scr
iptio
n; tarif
f ra
te informatio
n; U.
S. impor
ts in
19
82
tO N 0 .0 COO
•CO 4 On 0 0 rd •
O al .-1 a e
•••• •••••
• • • • • • . •
N .0 • 0
• .0 9 •-■ • o LI U 0
CO
Co ri
If 1 ao
• 0
• a.
. •
CO
N CO
.•
Cents per 1980 !
1981
C O
CL
•
8
•• ••
'0
•
C
0 0
e•1 • •
•
▪
▪
• 1 C • 0
e a •••• • • .0
• •
0
o. N
•• •• •• ••
4
0
.0
•O'
• 43
ra
C 0
A 0.• .0 .0
•••• M
• •••• '0
•A
C •• 7 00
.■••• •■•) •-I C a1 CO ,I11 O •-1
.1.1 • 0 • • CO Id M .0 •
0. • CO 1.• (el 0 •
A • I
C A 0
Os .0 07 .1.) O L. • ▪ 0 e-1
41.4 4
*GA
0 44d 1.•1
.0 • • •••• 01 r•1 10 •
▪ 16,
.1.
▪
1
•
• ln
• • ri
• r 4••• .it
.0 10 ••• • 0 ea •••• •••• ▪ 1.1 4.1 ▪ .0 •
•e a_ a •
C 0.•1 • u 0
0 O 110 Le • C
9 Os
▪
rd • 0 111
•-.1 ••• 11 V C C 10 • • ••• 9 '0 10 • Op to 9 Id •
O Id 11% 0. M • • •••• • C La A • 4/ 4.0 Le C Id 4/ 0 A • • 9
C
••••
▪
IS
• 40
.0 a d • 41 .0 A C •■•• .1.1 •
0. • n, • A C .11 it •
• +• 0.
M .•.0 010 u .4
so 0 •• • 4 r•I 01/ • 0 .0 ID 0. O 0 Z • C 4/ 42 ••• • .0 '0 Id 0 0 • C
•••• 41.1 •
• A
•
° 01. 4 a. s • 8
▪
.• 44 r 0.
O 0 0 •
•••• fa • * 4) • • 4.) as a
•
) a • a • so in •
• aa Cow O Cw '41
.0 •••1 • • Ai 41 0 •
• 0 •C 0 1.1 0 01
• •••• Sd 0 ••• ell
• a
110 Ni
0 •

2
Digest No. • C601--Con.
II. Comments
Description and uses
The products covered by this digest are porcelain coated cooking and
kitchen ware of steel (teakettles, pots, pans, skillets, roasters, and similar
articles), not having self-contained electrical elements. These consumer
products, which are commonly referred to as porcelain-on-steel cooking and
kitchen ware, are widely used in many households and food preparation
institutions.
U.S. customs treatment
Porcelain-on-steel cooking and kitchen ware is provided for in item nos.
654.0215(pt.), 654.0224, 654.0227, and 654.0228(pt.) of the Tariff Schedules
of the United States Annotated (TSUSA). 1/
The current column 1 or most-favored-nation (MFN) rate is 3.1 percent ad
valorem. The rate which is applicable to such imports from least developed
developing countries (LDDC) is 2.7 percent ad valorem, and the column 2 rate
which is applicable to imports from Communist countries is 35.5 percent ad
valorem.
On January 16, 1980, Presidential Proclamation 4713 provided for a
separate statistical breakout for porcelain-on-steel cooking ware valued not
over $2.25 per pound. The rate of duty for imports of these products was
temporarily modified under item 923.60 of the appendix to the TSUS to provide
for additional duties of 20 cents per pound effective on or after
1/ Although statistical provisions 654.0215 and 654.0228 include cooking and kitchen ware of iron or steel, those products of iron are helieved to account for less than 5 percent of total imports.

3
Digest No. C601--Con.
January 17, 1980. These additional duties were reduced to 15 cents per pound
on January 17, 1982, and to 10 cents per pound on January 17,
1983. 1/
Import relief is scheduled to terminate at the close of January 16, 1984,
unless extended by the President. . During the period of import relief,
eligibility under the Generalized System of Preferences and under the LDDC
provisions is suspended on porcelain-on-steel cooking ware imported under item
654.0224.
U.S. producers and employment
Since 1978 there has been only one U.S. preducer of porcelain-on-steel
cooking and kitchen ware.
U.S. consumption and Production
*
1/ The total duty collected on VFN imports may not exceed 53.3 percent ad valorem. The column 2 rate may not be less than the applicable VFN rate assessed under that item; i.e., it may vary from 35.5 percent to 53.3 percent ad valorem.

4
Digest No. C601--Con.
U.S. exports
U.S. exports of porcelain-on-steel cooking and kitchen ware followed the
same irregular trend of shipments during 1978-82, declining from 2 million
units ($3 million) in 1978 to 1 million units ($4 million) in 1982 (table B).
Based on quantity, exports to Canada accounted for 60 percent of total U.S.
exports of porcelain-on-steel cooking and kitchen ware during 1982.
U.S. imports
U.S. imports of porcelain-on-steel cooking and kitchen ware declined from
21 million units ($44 million) in 1978 to 10 million units ($27 million) in
1981. During 1982, such imports increased to 13 million units which were
valued at ($42 million) (table C).
Based on quantity, the ratio of imports to apparent consumption declined
from 75 percent in 1978 to 59 percent in 1981, before increasing 6 percentage
points to 65 percent in 1982. Japan, Taiwan, Spain, and Mexico, together,
accounted for approximately 85 percent of the quantity of total U.S. imports
in 1982.

5
Digest No. C601--Con.
The composition of U.S. imports varied considerably among the major
foreign sources. Imports from Spain and Taiwan consisted primarily of
low-priced (valued not over $2.25 per pound) multi-piece fashion sets. These
imports compete with the products of the U.S. producer on the basis of quality
and price, often undercutting the moderatly priced lines of the domestic
producer. The bulk of the imports from Japan (valued over $2.25 per pound) do
not compete directly with U.S. cooking and kitchen ware, since these products
are not manufactured in the United States.
U.S. imports of porcelain-on-steel cooking and kitchen ware from GSP
countries declined from 9 million units ($11 million) in 1978 to 2 million
units ($5 million) in 1982, or by 78 percent (table D). Imports from Taiwan,
the major source of imports under the GSP during the last five years, declined
from 3 million units ($5 million) in 1978 to 449,000 units ($1 million) in
1980. During 1980-82, imports from Taiwan increased about 100 percent,
totaling 903,000 units ($4 million) in 1982.
The lower levels of imports during 1980-82, as compared to imports during
1978-79, can be partially attributed to the import relief that went into
effect on imports of cooking ware of steel, valued not over $2.25 per pound
(item 654.0224) and the suspension of GSP eligibility for that item.
Position of interested parties
The petitoner, General Housewares Corporation, requests the removal of
GSP status on porcelain-on-steel cooking and kitchen ware (TSUS 654.02 pt),
for Taiwan. General Housewares Corporation asserts that the Taiwanese

6
Digest No. C601--Con,
producers are internationally competitive and have been successful in the U.S.
market, increasing the volume of sales despite import relief imposed in 1980.
The domestic producer further contends that Taiwanese prices have been reduced
specifically to undersell a domestic product which was competitively priced.
While precise figures were not presented for the Taiwanese product lines, in
this particular instance, the Taiwanese dropped their price approximately 25%
immediately after the introduction of a new line by the domestic producer
designed to compete with Taiwanese products.
Counsel for the Board of Foreign Trade, Republic of China on Taiwan,
testified in opposition that GHC has in fact improved its financial condition,
with increases in net income and a 25 percent sales gain in the second quarter
of 1983. GHC has also recently imported some products that GHC does not
produce themselves, and the argument was made that the company was using GSP
review to gain competitive advantage for its own source of imports.
A separate statement submitted on behalf of M. Kamenstein, Inc. urged
that enamelware teakettles from Taiwan not be removed from GSP eligibility.
The company argued that the domestic industry does not need protection from
duty-free imports as it has expanded and modernized its production facilities
for teakettles. The statement also argued that Taiwan needs GSP status in
order to maintain its competitive edge against Japan, the number one producer
of teakettles imported into the U.S. market. Finally, the statement points
out that removal of GSP would not spur development in less-developed GSP
countries, pointing out that Mexico, the principal GSP competitor in
teakettles, produces a product not directly competitive with those of Taiwan.
Taiwan's GSP status is, therefore, not restraining Mexico's growth.

7
Digest No. C601--Con.

8
Digest No. C601--Con.

Digest No. C601--Con.

10
Digest No. C601--Con.
Table A.--Porcelain-on-steel cooking and kitchen ware: U.S. shipments, exports, imports, apparent consumption, 1978-82, January-June 1982, and January-June 1983 '
uantit in thousands of units• value in thousands of dollars
Period *Shipments 1/ • - .
Ratio (per- Apparent cent) of
Exports :Imports 2/: consumption ;mports to •
: consumption
Quantity
• 1978 *** 1,808 : 21,052 : *** *** 1979 *** 2,235 : 18,352 : *** *** 1980 *** 1,995 : 11,388 : *** *** 1981 *** 2,147 : 10,340 : *** *** 1982 *** 1,477 : 12,890 : *** *** January-June :
1982 *** 824 : 5,407 : *** *** 1983 *** 1,077 : 8,616 : *** ***
Value
1978 : *** : 2,932 : 43,513 : *** *** 1979 : *** : 4,773 : 47,494 : *** *** 1980 : *** : 3,762 : 38,160 : *** *** 1981 : *** : 4,355 : 27,141 : *** *** 1982 : *** : 3,711 : 41,521 : *** *** January-June : . : :
1982 : *** : 1,981 : 16,194 : *** *** 1983 : *** : 2,520 : 27,761 : *** ***
1/ Reported to the U.S. International Trade Commission by domestic producers. 2/ Imports are believed to include less than 5 percent of cooking and
kitchen ware of iron.
Source: Compiled from official statistics of the U.S. Department of Commerce.

0
2,
0 0
CV
C. cD cD CD CD .- p4 S cg
CO
yo •• 0* •• 60 •• •• 04
so v2 cD CD UN 00 os on • so C4 so
•• •• 00 00 •• •• ••
pn uN pn C. in so NM CO 0 .- ts7
•• •• Oa 06 66 •• 00 00 00
S— CD CD CD so P.-
00
00 0. 00 110 •• •• 6.
• ul cD r cD un uN S uN UN
DO 00 Po 00 O. 60 00
NO CD sf. sr O P P.? CN 4. r rft M
. •• 00 •• •• 00 06
O UN CD eV sr .42 Sr 00 PI
•• . •• 0. •• • • • ••
I 1 I
1 I I I i
1 L .4
I 0 0 •C
0 ND 0 .0 4, 0
C '0 E 0 1- 100000.C.- C aY > >,•x CO CO CO 12 ON 7. 0 0 C.3 ->eruhlual-Et..+.4
O 00
•• •• . ••
a
1 1 Dicv-st No. C601--Con.
M c4 1 1 1 Sr CY on
N pq P
- • • • • • • • • • • • • • •
N 1 I 01 ..1*
N N N eV .3' CV In
•• •• •• •• •• DO ••
Cc 1 1 1 00 Pc C. 0 CD oD so so
. • • • •
sO sr C4 a•
UN sr I 1 0 sr N sr MI 0.o CD sr C. CD • • • • • • •
v. UM M NI csi sr PI co
•• 60 •• 04
N
NP In .- O OS CO Os 00 Cs C. CD 47 un sO MO SOP so ul cD 00 C. 00 sO CD cD to P.O In N .0 ••••
csl
• • • • • • • Ln In sr Pn st /0 0 WI
0 UM N
•• •• 60 40 60 06 00 OD •• •• •• •• .• •• .• .• .• .•
0. 1 1 1 10 .46 N 1 I I c• le) N 1.• CO O
• • • • • • ft U) wl so sr on N
Pr) co
04 06 •• 00 40 •• NO 00 • 01
O sO I .43 1 7. on N 03 NN I V) 1 CN pn N In S on c4 PI sr OD on
7 S 4, • • • • . .- U1 pn oN r4 0
N C 4•3 .0 •I••
0 4- 0 07 0
CD C0 0 04 04 Oa Of •• 00 . •• 00 at •• •• 06 •• •• •• •• ••
co .- op 1 UN on CO O siO pn iv 1 C. csi S S S S v2 C. CO Sr OP. CD uN qt. IN N Sr P • • • • • • •
.m•N WI,. C14 0 40
• 03 C
.-•
•• 06 66 64 64 Os 60 00 06 4- 4-
C. I U3 OD cri Cs PO so N I OD 0P. op 0 st C. V, C4 0 Os OD c4 40 .. •14 C- • • • • • • • E . cv N.— UN r4 csi 0
40 II
•0
O. Ow •• •• •• • • • 00 • •• •• • •• •• 06
I 1 0* •• •• •• •• •• 06
1 • • • •• •• ••
I 1 0 1 1 1 I C) I. 1 1 i 0 L. ...I L. 01 01 0 1 0/ tY •C L.
0 '0 0 O 0 0 •0 0 .0 Y W C L 0 3 4, ••• u E 0 I- C L •0 — LI E 0> =
0 0 10 10 0. C ••• 0 C 0.Y 2 >,•x •-•
00100:100— 0 4C 0. 4.. 7 >, x
0 cn
013301.7Cn I.00 .4 CO CO 01 U 01 L CD O ••• ■ 0. ILI W HEU <
Department of Commerce.

CM.
• sr UN NI Ps .2. co co uN 03 UN v4 0 CO UN UN .- CD UN V4
WI Ps 1.1 w-
•••
•
••
0)
• • • • • • • •
N CO cP.
CO
• • •• • • ••
O 0 CP.
•• •• •• •
NI V4 sr N st 0s UN N1 NI st st UN Op Ch CD CD N cr. CD
01 04
0
.0
••
UN 00 yr ON .- M N cn uN re, un UI MP sO ts Ps Vr Vr
61.
• • • • • • • • • • • • .• • • • • • •
0 .0 < 00 CD P1 CD NI CO Cn o. 03 Ps 10) ND PI Vr V) v) pn
sr N
•• •• •• •• •• •• •• •• •• ••
4- 04 .- 1.1 ml cn yr N 03 NI CD sr N Cr's N • V4 04 03 CY NI
46 0.
N ss .- 04
•• •• •• 6. •• •• •• • • •• ••
Ps .- UN UN CD .- CD CY CV Os rg 04 sr 01 UN 03 CD UN ey NN
NI 04
N co M.- VI WI, MN • st CD Ps P.OUN '0 CP. NI NI C) Ps .- NI UN
NI N UN N
•• •• •• •• •• •• . 06 ••
C2 UN Ps C) CD WI PI J ca Ps UN Vr 0 V4 V) 03 NON .- Ps N
WI MI cv N
O
O
• •
0 co )0)
••
N
CO
••
••
O
0
•• ••
12
• • • • • • • • • • -• • • • • • • • •
O sD CD pn 03 b.0 P .- UN .- N wo 0 03 st UN UN sr 4' 04
Ps N 04 .-
• • • • .• • • • • • • • • • • • • • •
Ps 03 V4 es V4 V4 Vr Yr yr CP. V4 CD Ps 03 03 CO pn in .- yr CD NI N
CD Ps 111 N
•• •• •• •• . •• •• •• •• ••
rs .4f UN UN N < UN NI 03 NI On In P.-.O CP. CP. PI Cn sr < .- PI st
O J MN.- -
•• •• •• 66 66 •• •• ••
P N QN Olt N PM co 0. p. 00 NI se. 4. CV p-.O .7 MS CN NI
•• 04 OD .1. M M
•• •• •• •• •• •• •• •• •• ••
CN 04 .- 03 M P Ps Vr CD CD Ps CD MN • Ps UN .- Ch N VI CD
.2. N 04
00
.7 0 0. 10 Ps P O CO CP. N Ps 42 P .0 co op N 01 N Ps N UN
sr N. N -M
.14
• •
••
•••
••
Diges+ Nu.
co un un un CD '0 0. MI 0) C) LI 0, CO C" es f,
st 101 n? v- o r. .0 c) c
•• •• •• • • • • • • •• • • • • • •
CO Itt NO .- .- CV s- UN CD 03 CD Vr On 0.0 • • • • • • • • •
• pn .- Ps Ps ul CD 40
•• •• • • •• •• •• •• • • • • • •
os.
N
NN un N PI uN Ps b .- Vr CO CV • . • • • • • •
• rn re) gr.. CO CO .4) 0 rn
C 0)
• • • • • • • • • •• • • •• • • • • •• •• • • •• •• •• •• •• •• •• •• •• •• •• •• •• •• •• •• • • • • •• • • • • • • • • •• • • •• • •
I I I 1 1 i I i 1 1 I 1 1 1 CU I 1 1 L 01 1 1 I 0.1 CO
4.# E V .0 4, 4-) E '0 .0 .I.. .1.• E V .0 L.
0 L. 01 C '0 4, 0 0 L. 01 C • 3 4.• 0 0 I- V C • 3 •1,0 0/
CIOCUIDUI0C01.... C 01 C U II U 110 C 0 1■ CCOCUOIUCOCOD.
/0 C ..- ..- CD C .-I CO 0 C -- -- W C^+ 0 CD C -- - CD C .-6 al < O..-0) X 10C.-1 .-I 0.--01 X COC.-••-• 12...-01X 40 C.-I.-4 03 .0 Et. 111 L. IL • ■-. 0 .-I 01.0 0. 0/ IL L. •... 0 4.4 CS .0 0. CC L. L. •.. 0 •.I '', C.3 Ul 3C cc. U. u. O. < -1 C.) Ln 3E U. LL LL CI. .4 n C.,1 N E U. U. U. C1<
U
O In
I I 1 1 1 I I I I I I I I 1 I
• 1 I I I. ..• 1 I I 0 CO
1 1 1 1 I 1 1 1 T 1 1 I I 1 1 1 I I IL •■■
1 1 I V V
U)
0
•• •• •• •• •• •• •• • • • • • • • • ••
co NI UN ul sr N PI CD CD CV • CN Ps CD yr 03 CD CO CV v2 • • • • • • • .
n, CD Ps CD .- 04
•• •• •• • • •• •• . •• 60 • • • ••
P vs ill ON CD 0 NI its Its ▪ pn .o PM Ps PI cn r CD n1 • • • • • • • • •
.3. Cy P1 .- Ps rs .- to
•• • • •• •• •• •• •• •• •• •• ••
vs NJ CD St CN 04 ON < 0 Os CD .- .- UN
. . . • . .
1 .1-03.4*
40
• • • • •• • • • • • • • • • • • • • • • • • •
PM.-.0 S C3 UN 03 Ln UN 0 CD yr Ps N .- CD • • • • • • • • •
N .- cv o• ul Its ca NIN 40
O L.
c., I. o Cu
0 E 0
3 0
0
4.1 C
•X •0
NI is CO
L.: 0.
V 01 C O
tf)
4. O
•
4-, .o
C.)
4- t., o
trN VI

13
Digest No. C601--Con.
Table D.--Porcelain-on-steel cooking and kitchen ware: U.S. imports for consumption under the Generalized System of Preferences, by principal sources, 1978-82, January-June 1982, and Janaury-June 1983
Source • •
• •
1978 1979 • • 1980 • •
1981 • • • •
1982 January-June--
1982 1983
Quantity (1,000 units)
• . • . • . • . • . • . Taiwan : 3,166 : 2,322 : 449 : 553 : 903 : 235 : 825 Mexico : 2,187 : 2,765 : 890 : 1,641 : 1,189 : 605 : 537 Hong Kong : 905 : 548 : 64 : 32 : 139 : 26 : 337 South Korea : 1,152 : 1,169 : 66 : 20 : 89 : 87 : 27 All other : 1.298 : 986 : 54 : 90 : 26 : 2 : 31
Total : 8,708 : 7,790 : 1,523 : 2 336 : 2.346 : 955 : 1.755
Value (1,000 dollars)
• • Taiwan : 4,834 : 4,672 : 1,352 : 2,196 : 3,572 : 928 : 3,597 Mexico : 2,310 : 2,800 : 695 : 997 : 794 : 443 : 283 Hong Kong : 372 : 367 : 39 : 30 : 186 : 47 : 246 South Korea : 1,766 : 1,961 : 122 : 51 : 135 : 131 : 42 All other : 1,358 : 905 : 84 : 88 : 81 : 6 : 89
Total : 10.640 : 10,705 : 2.292 : 3.362 : 4.768 : 1,555 : 4,257
Unit value (per unit)
• . • . • . • . • . Taiwan : $1.53 : $2.01 : $3.01 : $3.97 : $3.96 : $3.95 : $4.60 Mexico : 1.06 : 1.01 : .78 : .61 : .67 : .73 : .52 Hong Kong : .41 : .67 : .60 : .94 : 1.34 : 1.81 : .73 South Korea : 1.53 : 1.68 : 1.85 : 2.55 : 1.52 : 1.50 : 1.68 All other . : 1.05 : .92 : 1.56 : .98 : 3.12 : 3.00 : 2.87
Average : 1.12 : 1.26 : 1.56 : 1.81 : 2.20 : 2.20 : 2.08
Source: Compiled from official statistics of the U.S. Department of Commerce.


N .0 a00
C0 C. 5, 0 0 1.4 0. a C N
0
0
0
wr
E 0
)-1
4.)
0 a.
• to
O
rr 0
• 0
0
0
44d 464
0 rr
O r. O.
Ca C) 0 0 V
0 .0
0
.&J
4-1
0 .0
0 O I
0 I
.5 •
17 0 SA
4.1 0 0
44.. La S0.1 0
AO
0 V V 0
444 0 o 4)
OS 0
0 0 r•S 0
1.4
• LI 1.40 0
0 rJ CO
TITLE: Portabl
e air pur
ifie
rs (H
ong
Kong
, Taiwan
)
Desc
rip
tio
n
0 0
al •••• NI
1.1 Z I rl 4' 0 0 1.1 • V 0. P.
0 41.
TSUS it
em
-I
0
P
aD
O• 1.4
•Cr 00
CO
1-1
co
ao a,
0 10
0 0
0.
IC U) th
It
df
It
p0
irt
It
that th
e item is
currently
de
sig
nated as an elig
ible
artic
le fo
r du
ty-fr
ee treatmen
t un
der
the
U.S.
Ge
neraliz
ed
O
C 0
h.
0 0 4•4 rr
0 SA 0 .4 •
a a a. 0
o e
.0 •••• a a a 0 ao (4. 0b
a 0.4 al a I.. Yr .0
0. • E
44 0 *I OB
03 00
m c41 Note: % de
note
s per
cen
t ad
valo
rem.
Digest No. C602
i
-0 I •0 e a La a e 0 5 a sr a O 0 .1i .-I .... at 0
A A 11 •••• 0 .5 0 ... 0044) -+ g cr .0 .0 444
Cr a) a .... .... 11.■ ....
..0 id 0 .4 Yr 0 La LI •••■ 0 • 0 a 0
.0 .0 '0 1.1 0. .00 0 .1.4 1..4 0 0 ,I V
.4 0 0 0 0 4. ...I 0 la ••.. a ..... 0 as a ...1 464 0 . 0
00 5 0 ga ow. .. he • . C 0 Yr 1.. 0 0 C • • 0 0 •••• 4.) 0 0 0 .... 40 .-I 0 4.60114C.-1100 0 .0 00 0.1 la 0 .... 0 0 00 0 0 0 ...• 0 .0 0 ... 00 0 la • • 00 41.1 la 0. ,I la .0 C. 0 Le tr ... 0 0..... 4) 14 Cr 0 .0 4) 0 la 0. 04r 10 0 0W .0 .5 0. .0 4) a 0 0
0.7
.. .. ,.. .. .. ..

2
Digest No. C602--Con.
II. Comment
Description and uses
A portable purifier (air cleaner) is an electric-or battery-powered
appliance that purifies and deodorizes air and adds a pleasant fragrance. The
principal components of an air purifier include an electric motor, a filter,
and a casing made of metal or plastic. According to industry sources, the
production process for this item is very labor intensive. Replacement filters
for use in these air purifiers are made of a foam-like material treated with
activated carbon or chemicals which absorb gaseous contaminants.
U.S. producers and employment
There are currently only 2 U.S. producers of portable room-size air
purifiers. They are located in Chicago, Illinois, and Sanford, Florida.
Although specific data are not available, industry sources indicate that
employment has increased since 1978. The actual number of workers, however,
fluctuates with seasonal demand.
U.S. consumption and shipments
Estimated apparent U.S. consumption of portable room-size air purifiers
and filters increased annually during 1978-82, rising from $4.4 million to
$84.8 million (table A).
Estimated shipments followed the same trend as that of consumption,
rising from $3.9 million in 1978 to $72.1 million in 1982. Industry sources
indicate that the increase in shipments was due to rising consumer demand for
the product.

3
Digest No. C602--Con.
U.S. exports
Estimated U.S. exports of portable room-size air purifiers and filters
increased from $195,000 in 1978 to $7.2 million in 1982 (table A). Industry
officials indicate that Canada was the major foreign market for exports during
the period; information on other export markets is not available.
U.S. imports
U.S. imports (estimated) of the products considered herein increased from
$670,000 in 1978 to $19.9 million in 1982 (table B). Estimated U.S. imports
fell 38.5 percent during January-June 1983 to $5.3 million compared with the
same period of 1982. These imports were supplied by Hong Kong, Taiwan and
Japan. The ratio of imports to consumption declined from an estimated 15.3
percent in 1978 to 9.8 percent in 1981. The level of import penetration then
increased to an estimated 23.5 percent in 1982. The increase was caused by
increased consumer demand for the product and increased importing by a large
retailer who had previously purchased these purifiers from domestic sources.
The ratio of imports to consumption was estimated to be 19.1 percent in the
first six month of 1983, compared with 23.0 percent in the same period of
1982. However, industry spokesmen indicate that the import penetration in
quantity is much higher, and that due to the low price of imports, the actual
effect on the industry is understated. The estimated percentage of imports of
portable air purifiers and filters entering the United States under the
Generalized System of Preferences has increased in recent years as Hong Kong

4
Digest No. C602--Con.
and Taiwan became important suppliers in this market. Although exact data are
not available, estimates indicate that GSP imports accounted for approximately
68 percent of estimated total U.S. imports in 1982, compared with 3 percent in
1978 (table C).
Imported portable room-size air purifiers are considered interchangeable
with comparable domestically produced products by U.S. consumers. The U.S.
industry, however, asserts that the quality of imports is lower because such
products are not capable of removing as many of the impurities from the air,
due to a substandard filtering systems. These imports are priced much lower
than domestically-produced models.
Position of interested parties
The petitioner, Associated Mills, Inc., and the other U.S. producer,
Rush-Hampton Industries, Inc., request that duty exemption be withdrawn for
room-size air purifiers and filters imported from Hong Kong and Taiwan, and
that the column 1 rate of duty (4.7 percent ad valorem) be imposed. This
would necessitate an individual import breakout for these products presently
classified under TSUS category 661.95. During the Commission hearing on
September 27, 1983, both these U.S. producers indicated that if the large
volume of imports continued, and importers' market share continued to rise,
U.S. manufacturers will be forced to locate their operations offshore to
remain competitive. This will result in significant unemployment in the
industry.
The Board of Foreign Trade, Republic of China on Taiwan, opposed the
petition on the grounds that import penetration has risen because of increased

5
Digest No. C602--Con.
demand. In the first six months of 1983, imports from Taiwan dropped
precipitously, from $4 million in 1982 to $2 million. Demand is expected to
increase, and the domestic industry will likely improve its already
satisfactory financial condition.

6
Digest No. C602--Con.
* * * * *

(760? Cu.
Table A.—Portable air purifiers: U.S. pcoduccrY shipment:;, exports of
domestic merchandise, imports for consumption, and apparent consumption, 1978-82, January-June 1982, and January--June 1983
• : • : Ratio of
Period . .
Producers' shipments
: Exports : Imports Apparent
: cormptic:n
.
: :
imports to consumption
1,000 dollars-- Percent
1978 • : 3,900 : 195 : 670 : 4,375 : 15.3
1979------ : 7,600 : 380 : 1,101 8,V21 : 13.2
1980 : 15,120 : 1,510 : 1,880 : 15,490 : 12.1
1981 : 60,590 : 5,900 : 6,010 : 60,480 : 9.8 1982 : 72,090 : 7,200 : 19,900 : 84,790 : 23.5
January-June : : : 1982 32,050 : 3,100 : 8,650 : 37,600 : 23.0
1983 : 25,000 : 2,500 : 5,320 : 27,820 : 19.1
Source: Estimated by the staff of the U.S. International Trade Commission from official statistics of the U.S. Department of Commerce.

8
Digest No. C602--Con.
Table B.--Portable air purifiers: U.S. imports for consumption, by sources, 1978-82, January-June 1982, and January-June 1983
(In thousands of dollars)
principal
• • January-June-- Source. ' 1978 ' 1979 • 1980 • 1981 ' 1982
1982 1983
: : • Hong Kong--: 1 : 6 : 130 : 2,047 : 7,326 : 2,904 : 2,076 Taiwan : 1 : 4 : 54 : 85 : 6,547 : 2,883 : 1,523 Japan : 668 : 1,091 : 1,696 : 3,878 : 6,027 : 2,863 : 1,721
Total : 670 : 1,101 : 1,880 : 6,010 : 19,900 : 8,650 : 5,320
Source: Estimated by the staff of the U.S. International Trade Commission from official statistics of the U.S. Department of Commerce.
Table C.--Portable air purifiers: U.S. imports for consumption under the Generalized System of Preferences, by principal sources, 1978-82, January-June 1982, and January-June 1983
(In thousands of dollars)
Source ! 1978 ! 1979 ! 1980 ! 1981 ' 1982 January-June--
1982 1983
Hong Kong--: 1 : 1 : 86 : 2,007 : 7,084 : 2,750 : 1,969 Taiwan : 1 : 3 : 51 : 68 : 6,541 : 2,881 : 1,508
Total : 2 : 4 : 137 : 2,075 : 13,625 : 5,631 : 3,477
Source: Estimated by the staff of the U.S. International Trade Commission from official statistics of the U.S. Department of Commerce.

Desc
rip
tion
N 0
• 1•1 of .0 0 C.) 0 •3
r. ao •-•
0
.0
at c0 GU I 0.
I ro 0 144
.0 0
.0 Of 1.3 N
CO 1.1
0 0 1-1 0.0 a. 11.1
0 0
111.1 1.1 11.1 0 .0 ar co
O. A 0 F1
0 V 2 0
14 144 0 0 .0r•
C 03 m 0 CO 01 F .0 01 10 0 14 r4U
U Fl
.004 • 0 CO F01 o v-1
0 co
- • • • • • • •
at •••.. .4.) NI
1 WS r♦ I 13 0 •
0. 0 0
Digest No. C603
CO 02
WI N
N • CO CO 0
Ca.0 CI. 0 • 4.. F
0 1-I . O C411.
Dr
ill
ing machines
va
lued un
der *2,
50
0 eac
h (Ta
iwan)
1.4 H
Item numbe
r; de
scrip
tio
n; tariff ra
te inform
ation; U.
S. im
por
ts in
1982; competit
ive sta
tus
M N
'CI 00 0
I 0 00 •• 0 al ••M C 1.1 ..-.. r4 6 WI Fl .... 4 00 0/ • . 0 .0 10
I. .4 ...I 0 C •• la 10 ••••I 0 0 10 0 •••• ■-• W ••••• 0 •• 0 1:1 ...4 4O •
• • C 0 la •••• C 13 1.1 0 0 40 0 0 0 •• W WI A to ..4 4.) •3 SM 7M 111 0 0 ••••• 01 .0 Id 2 4 0 r4 Ai .0 F .0 0 .0 F. .0 0 0 5 0 N 0 0 is W •• •3 1.1 G• Li 5 4) F4 V .... L. .0 0 IN 0 0000000 0005,1 .0
1 .e •. I.. e ,..4 0 Le 0 0 0 ••• .0 CO .0 5 W IC 01 2
al .0
0
0 0
114 I
O. .0 V3
C.3 O
0 la A 0 ✓
14 0 0
0 .0 •••• 0 A
110 0
1.4 ••••• .0 .••■ 00 0
in. Li r4 of dt
0 W
C
0 V 0 0
01 00 C C 00 F.
0. tO 0 0.1 12 0
A 1-4 ID 4)
A 1.• 0
14 art 0 0
10 100
M.
al
0
FI
S .* .0 • .4.) 5 0
.0CO .0 .0 ' 0 1-4 .0
C al F
5 • 0 C 5 W 5 W C 1-4
0 11 Le 0 0
1.• 0. S
0r 0
0.
44.. 0. 0
0 0
•••1 5 0 0
5 00 A0
•••• CO 10 5 Y. 0 13
•11 5 14 0
0 •••• .0 .0 1-1 0 CO
W •••• F) C NI
C.3 674.
3227k :
Note: % de
note
s percent
ad
valo
rem.

2
Digest No.' C603--Con.
II. Comment
Description and uses
This digest includes certain drilling machines, other than used or
rebuilt, valued under $2,500 each, used for drilling holes in metal. They are
made in a variety of different sizes, ranging from small, bench-mounted
machines used by hobbyists to large, floor-mounted, machines used in light
industry. The small drilling machines used by hobbyists are normally priced
from $250 to $600 and have a fixed number of speeds. The larger, light-
industrial, machines range in price from $600-$2,400 and have transmissions
capable of providing infinite speed changes and high torque at low speeds.
U.S. producers and employment
There are approximately 16 producers of drilling machines valued under
$2,500 in the United States. These producers are located primarily in the
North East Central States (especially Ohio and Michigan) and the Pacific
States (particularly California). The number of producers has decreased only
slightly since 1978, however, the number of production workers has declined
from about 1,500 in 1978 to about 1,100 in 1982. 1/
U.S. consumption and production
Apparent consumption of drilling machines valued under $2,500 fluctuated
during 1978-81, increasing from $33 million to $45 million. In 1982, apparent
consumption decreased 11 percent to $40 million. U.S. shipments increased
from $22 million in 1978 to $26 million in 1979 and then decreased erratically
to $15 million in 1982 (table A).
1/ SIC 35412--Metal cutting drilling machines.

3
Digest No. C603--Con.
U.S. exports
U.S. exports of drilling machines valued less than $2,500 fluctuated
during 1978-82, increasing from $1.1 million in 1978 to $1.6 million
in 1981, and decreasing to $912,000 in 1982 (table B). Exports as a percent
of shipments increased from 4.8 percent in 1978 to 7.7 percent in 1981 and
decreased to 5.9 percent in 1982. During the period 1978-82, Canada accounted
for 25 percent of U.S. exports and Mexico accounted for 15 percent. Other
major markets were Singapore, the Republic of South Africa, and Australia.
U.S. imports
U.S. imports of drilling machines valued under $2,500 increased from
$11.6 million in 1977 to $25.9 million in 1981 and decreased to $25.5 in 1982
(table C). The ratio of imports to consumption increased from 35.5 percent in
1978 to 63.8 percent in 1982.
In 1982, drilling machines valued under $2,500 were imported from over 20
countries, however, those imported from Taiwan under TSUSA item 674.3227
accounted for 87 percent of total imports. Canada was the next largest source
in 1982, accounting for 5 percent of total imports. Throughout 1978-82,
Taiwan and Sweden were the principal sources of imports of drilling machine
valued less than $2,500, accounting for 90 percent of total imports.
According to industry officials, the lower end of the market for drilling
machines, i.e., those drilling machines valued under $600, is dominated by
lower quality, lower priced, imports. Domestic producers do not compete in
this market where the average selling price of the domestic machine is 300
percent higher than the average selling price of the imported machine.

4
Digest No. C603--Con.
Domestically produced machines are generally sold to small job shops and light
industry where high quality is important to the buyer'. A small percentage of
domestically produced drilling machines are used in home workshops.
Imports of drilling machines valued under $2,500 from all designated GSP
countries accounted for an average of 87 percent of total imports during
1978-82 (table D).
Position of interested parties
Mr. William J. Ferrick, Executive Vice President, Wilton Corporation
(petitioner), requests that duty exemption be withdrawn from Taiwan and that
the maximum duty be imposed on all drilling machines valued under $2,500
imported from Taiwan under TSUSA item 674.3227. According to Mr. Ferrick, the
domestic drilling machines industry, especially that segment consisting of
drilling machines valued under $600, has been severely affected by imports.
No submissions were received from other interested parties.

5
Digest No. C603--Con.

6
Digest No. C603--Con.
Table A.--Drilling machines valued under $2,500 each: U.S. producers' shipments, exports of domestic merchandise, imports for consumption, and apparent consumption, 1978-82, and January-June 1982 and January-June 1983
Period Producers'
• shipments Exports : Imports :
Apparent con- :
sumption 1/ . .
Ratio (percent) of imports to consumption
1,000 dollars : Percent
1978 22,167 : 1/ 1,073 :1/ 11,617 : 1/ 32,711 : 1/ 35.5 1979-- 25,938 : 1/ 1,227 :1/ 15,665 : 1/ 40,376 : 1/ 38.8 1980 18,590 : 950 : 17,005 : 34,645 : 49.1 1981 20,209 : 1,565 : 25,907 : 44,551 : 58.2 1982 --- - 15,375 : 912 : 25,488 : 39,951 : 63.8 Jan.-June--
1982 7,898 : 418: 15,173 : 22,653 : 67.0 1983 2/ 357 : 12,918 : 2/ 2/
1/ Estimated by the staff of the U.S. International Trade Commission from official statistics of the U.S. Department of Commerce.
2/ Not available.
Source: Compiled from official statistics of the U.S. Department of Commerce, except as noted.

7
Digest No. C603--Con.
Table B.--Drilling machines valued under $2,500 each: U.S. exports of domestic merchandise, by principal markets, 1978-82, January-June 1982, and January-June 1983
(In thousands of dollars)
Market ;1978 1/!1979 1/ ; 1980 1981 1982 January-June--
1982 1983
: • : Singapore---: 19 : 19 : 131 : 104 : 185 : 118 : 14 Republic of : : :
South . • . : • . • . : Africa----: 23 : 31 : 44 : 71 : 116 : 37 : 24
Nigeria : 12 : 2 : - : 45 , : 87 : - : - Canada : 333 : 385 : 182 : 459 : 85 : 40 : 74 Australia : 49 : 55 : 25 : 35 : 68 : 68 : 42 Arab : : • • . :
Emirates : 13 : 9 : - : 64 : 68 : 49 : 50 Japan : 24 : 35 : 19 : 9 : 63 : 6 : 32 Mexico : 93 : 124 : 206 : 378 : 62 : 28 : 40 All other : 507 : 567 : 342 : 400 : 177 : 73 : 81
Total : 1,073 : 1,227 : 950 : 1,565 : 912 : 418 : 357
1/ Estimated by the staff of the U.S. International Trade Commission based on official statistics of the U.S. Department of Commerce.
Source: Compiled from official statistics of the U.S. Department of Commerce.

8
Digest No. C603--Con.
Table C.-- Drilling machines valued under $2,500- each U.S. imports for consump- tion, by principal sources, 1978-82, January-June 1982, and January-June 1983
(In thousands of dollars)
• Source 1978 1/ 1979 1/ . 1980 • 1981 1982 • January-June--
! 1982 ! 1983
Taiwan 9,757 : 13,185 : 14,622 : 22,519 : 22,270 :13,291 : 11,81 Canada 163 : 259 : 243 : 283 : 1,364 : 743 : 32 United Kingdom 118 : 101 : 92 : 758 : 458 : 242 : 16 Sweden 477 : 874 : 1,202 : 969 : 375 : 224 : 18 .
Japan--------------: 310 : 124 : 208 : 358 : 263 : 228 : 5 Spain 205 : 173 : 144 : 171 : 186 : 82 : 10 Portugal 195 : 180 : 186 : 239 : 151 : 88 : 5 France 101 : 60 : 111 : 65 : 123 : 65 : 9 All other 291 : 709 : 196 : 544 : 299 -: 211 : 12
Total : 11,617 : 15,665 : 17,005 : 25,907 : 25,488 :15,173 : 12,91
1/ Estimated by the staff of the U.S. International Trade Commission based on official statistics of the U.S. Department of Commerce.
Source: Compiled from official statistics of the U.S. Department of Commerce, except as noted.

Digest No. C603--Con.
Table D.--Drilling machines valued under $2,500 each: U.S. imports for consumption under the Generalized System of Preferences, by principal sources, 1978-82, January-June 1982, and January-June 1983
(In thousands of dollars)
Source . 1978 1978 1/ :.
• 1979 1/.
• 1980 :
1981 :
'January-June--1982 • .
• 1982 : 1983
: . • Taiwan- : 9,716 : 13,130 : 14,555 : 22,347 : 22,010 :13,071 : 11,771 Portugal : 194 : 180 : 186 : 239 : 151 : 88 : 54 Brazil : 1 : 82 : 2 : 2 : - : - : 7 Republic of Korea : 46 : 83 : - : - : 4 : 4 : 6 Hong Kong : - : - : - : 47 : 43 : 17 : - Mexico : 4 : 11 : 5 : 37 : 5 : - : - India : 10 : 15 : 11 : 19 : - : - • - Philippines - : 19 : .- : - : - : - : - All other : 1 : 65 : - : - : - : - : -
Total----- : 9,972 : 13,585 : 14,759 : 22,691 : 11,838 22,213 :13,180 :
1/ Estimated by the staff of the U.S. International Trade Commission based on official statistics of the U.S. Department of Commerce.
Source: Compiled from official statistics of the U.S. Department of Commerce, except as noted.


12-volt lead-acid s
torage batteries
(Rep
ubl
ic of Korea
)
I. TSUS(A) it
em n
umber; descrip
tio
n; tariff rate
informatio
n; U.S. impor
ts in 198
2; competit
ive sta
tus
O O CV
It
It
IK
K
ao
4) as • ▪ 0
0 w so so cm Ls .1 0 ▪ 4.) to 0
•0 0. 4) 41 41 A.) 0
L.
0
1 14 ✓ 41
.0
0 0
0
oa
01 CV CO 0
V3 LI 0, 0 •0
• 01 - e e 1-1
40 So.
0 as O.
4, O. m 1 W I L I•I aa.
03 co,
■-•
03
CO
0 03
ra
0 4.1 Ni
Z
H. t■
1 r•4 O -0 S. • m 1,1 41.1
0 0
• • • • • • • •
•0
N
Li
▪
• 0 0
I-1 O .0
so
VI ..•I • e
m o e
.4+ 41
Li Ca O it •0 0 O .4
• 03 0 -1-4
4.1 GS .0 O A.)
• 0
1.
•
0 11.4 1 r
▪
1
4.) O 4.1 "0 0
1.1 O 0
4.4
r-1 • 0
• -1 a. C
e 40
.0 4,
▪
1
40 -0 M 41
4) 4.■
O 0 O 0
m m as
no is O 0
O C. O A.) ao O
•
0 4/ 0 0
.1.)
•
O. O
0 v ♦
O
▪
m 0 'V
0
41 O 4.) • 1.1 4-1
a) 4.) .0 as 4.) F 0
4./ 03
4.) o ra
01 41 M 4./13 /0 0 0 • 1-3
13
▪
▪
2 0 0 4C 4.)
0
0 O 0
41 4.M 4.) L.
O 0 0 60 414 41
... O 4.1 10 I. 4. 4) 0. 0
44 0 ..1
• V .0 0 4 01 IV 0 DS
O
HI es NI
Descrip
tio
n
Note
: % denote
s percent ad valo
rem.

2
Digest No. C604--Con.
II. Comment
Description and uses
Storage batteries are devices used for the direct transformation of
chemical energy into electrical energy through chemical reactions which can be
reversed to a high degree. Reversal is accomplished by causing an electric
current to flow in the opposite direction of discharge. The term "storage
battery" is normally applied to an assembly of identical units or cells
connected in series but may also be applied to a single cell. Twelve-volt
lead-acid storage batteries have a nominal electrical potential (voltage) of
12 volts and a sulfuric-acid electrolyte. These batteries are most commonly
used for the starting, lighting, and ignition (SLI) of motorcycles and other
motor vehicles.
U.S. customs treatment
As the result of a petition filed in 1981 by the Yuasa-General Battery
Corporation, the current petitioner, Taiwan was removed from the list of
eligible GSP beneficiaries with respect to 12-volt, lead-acid storage
batteries on )!arch 31, 1982. This was accomplished by dividing the former
provision for lead-acid storage batteries (TSUS item 683.10) into 12-volt
storage batteries (TSUS item 683.05) and other lead-acid batteries and parts
(TSUS item 683.07).
U.S. producers and employment
There are currently only three U.S. producers, including the petitioner,
of lead-acid storage batteries for motorcycles. Employment by these firms

3 .
Digest No. C604--Con.
was approximately 450 persons in 1982. For the entire storage battery
industry, total employment was approximately 23,000 in 1982, having fallen
from nearly 26,000 in . 1977, or by approximately 12 percent. Employment data
is not available separately for 12-volt, lead-acid batteries, however,
lead-acid batteries currently account for nearly 90 percent of the total value
of storage battery shipments; further, 12-volt batteries are estimated to
represent between 75-80 percent of total lead-acid battery shipments.
While there are currently at least 50 U.S. producers of storage
batteries, seven of these producers account for approximately 85-90 percent of
total industry shipments of 12-volt lead-acid batteries. Many of these
companies are divisions of much larger multiproduct, multinational
corporations.
U.S. consumption and shipments
Estimated apparent U.S. consumption of 12-volt lead-acid batteries
increased from $1.5 billion in 1978 to $1.8 billion in 1979, declined to $1.7
billion in 1980, then rose to $1.9 billion in 1982 (table A).
U.S. shipments of 12-volt lead-acid batteries followed the same trend as
that for apparent U.S. consumption while rising irregularly from an estimated
$1.6 billion in 1978 to $1.9 billion in 1982, or by 19 percent.
This increase was accounted for by increased prices of batteries during
the period as the net quantity of battery shipments declined by nearly 12
percent during 1978-82. The decline in unit shipments of batteries, the
majority of which were for use in motor vehicles, has been associated with

4
Digest No. C604--Con.
increased battery life (particularly with respect to new maintenance-free
batteries), stagnant U.S. original equipment motor-vehicle sales, and recent
milder than normal winters (the prime cause of battery failure).
U.S. exports
U.S. exports of 12-volt lead-acid batteries increased from an estimated
$35.8 million in 1978 to $50.5 million in 1981, or by 41 percent, before
declining by 3 percent to $49.2 million in 1982 (table B). The principal
export market during the period was Canada which share of total U.S. exports
ranged from a low of 34 percent in 1981 to a high of 42 percent in 1979.
These exports were principally of automotive SLI batteries. Saudi Arabia and
the United Kingdom were also significant U.S. export markets with 12 and 5
percent shares, respectively, of U.S. exports in 1982.
U.S. imports
U.S. imports of 12-volt lead-acid batteries increased from an estimated
$7.5 million in 1978 to $12.3 million in 1980, declined to $11.0 million in
1981, then increased to $12.2 million in 1982 (table C). Imports during
January-June 1983 were $9.9 million, up 65 percent over the $6.0 million
imported during January-June 1982. Most of this increase was in imports from
Japan, Taiwan, and Korea. Imports from all of these countries are
predominantly motorcycle batteries as evidenced by the low average unit values
recorded in 1982 and during January-June 1983. The latter period represents

5
Digest No. C604--Con.
imports only under the new tariff provision for 12-volt lead-acid batteries
(TSUS item 683.0500), while all other periods contain some or all data for
12-volt batteries extrapolated from the former provision for lead-acid
batteries (TSUS item 683.10).
Japan was the leading source of imports throughout the period. Imports
from Japan rose irregularly from $4.1 million in 1978 to $5.9 million in 1982,
or by 44 percent. These imports reached a low of $3.4 million in 1981,
principally due to depressed U.S. shipments of new motorcycles in that year.
Imports of 12-volt lead-acid batteries from Korea increased irregularly from
an estimated $31,000 in 1978 to $329,000 in 1982. Imports during January-June
1983 were $1.0 million, substantially higher than the $58,000 recorded during
January-June 1982. Virtually all of the imports to date from Korea have been
entered under the duty-free provisions of the GSP (table D). While still at a
comparatively low level in terms of value, the Korean imports have reportedly
• entered the U.S. market at prices 30-35 percent below comparable U.S.-produced
battery prices. Petitioner and those in opposition debate whether the quality
of these batteries is equal to that of U.S.-produced products. The ratio of
imports to consumption for all 12-volt lead-acid batteries was less than 1
percent from 1978-82. The import-to-consumption ratio for motorcycle 12-volt
lead-acid batteries is considerably higher, however, estimates of shipments,
exports, and imports of these battery types are not available to permit a
reasonable computation of such ratios.

6
Digest No. C604--Con.
Position of interested parties
The U.S. petitioner, Yuasa-General Battery Corp., has taken the position
that the rapidly increasing level of Korean battery imports, together with
their low price and high quality, indicate that these products, and the
foreign industry producing them, are competitive with comparable domestically-
produced merchandise and thus should be removed from GSP eligibility status.
The Korea Battery Industrial Cooperative takes the position that the
current level of Korean imports is small both absolutely and relative to total
imports with import penetration only 3.4 percent. They also have argued that
Korean batteries are of substantially lower overall quality than U.S.
batteries. It was indicated that Korean batteries generally have a service
life of one to two years compared to three to five years of U.S. merchandise,
and it is this difference which accounts for the 30-35 percent lower costs of
Korean batteries.

7
Digest No. C604--Con.

8
Digest. No. C604--Con.
Table A.--12-volt lead-acid storage batteries: U.S. producers' shipments, exports of domestic merchandise, imports for consumption, and apparent consumption, 1978-82, January-June 1982, and January-June 1983
Period • • • .
Producers' shipments 1/
-
.
• • -
: Exports : Imports
:
: : :
Apparent :
consump- :
tion 1/ : : 1,000 dollars :
• . . • . 1978-- : 1,560,000 : 35,755 : 7,499 : 1,531,744 : 1979 : 1,820,000 : 32,842 : 10,892 : 1,798,050 : 1980-- : 1,765,000 : 40,580 : 12,262 : 1,736,682 : 1981 : 1,800,000 : 50,475 : 11,038 : 1,760,563 : 1982 : 1,925,000 : 49,185 : 12,191 : 1,888,006 : January-June-- : •
1982 : 1,060,000 : 24,524 : 6,003 : 1,041,479 : 1983 : 1,000,000 : 22,697 : 9,947 : 987,250 :
Ratio of imports to consumption
Percent
0.5 .6 .7 .6 .6
.6 1.0
1/ Estimated by the staff of the U.S. International Trade Commission based on official statistics of the U.S. Department of Commerce.
Source: Compiled from official statistics of the U.S. Department of Commerce, except as noted.
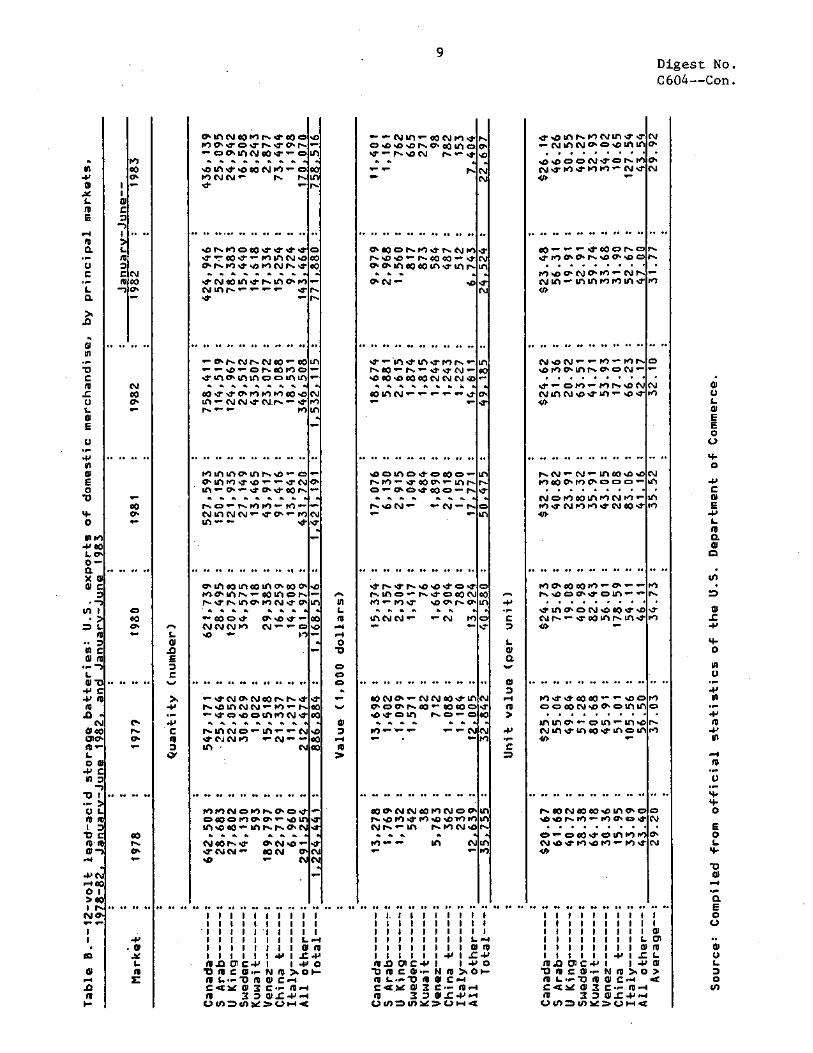
• • • • •• •• • • • •• •• •• •• • • •• • • • • 6. • • •• •• • • • • •• • • .. • • • • •• •• • • •• • • • •
as
N.
M
•••
M
UI
UI
I.
M
4•.00NMNIII ■t ■T
• • • • • • . •
.0•000N ■f 0 NIM N ■I'MSMMN ■T
•• • • •• •• 0 • •• •• • • 1. ••
00 v■ ^ .s. c0
%T Pe) Ps 4J CD • • • • • • • •
NO.'"U-1(MMMUI.f
•• •• •• •• •• •• •• •• •• ••
Cd .0 CV .."• w'• M.."' Mrs • rl cp. In O• CD C4 • • • • • • • • •
CD hi Mr...00J N C■I .41. ■T
NOV."' CV Ul 00 4, .0 MOO Fl O. CD CD CD •••••••••
NOMWOMINM ,.- MsTNMM‘TNW4"
• • • • • • • • • • • • • • • • • • • •
tei CN 0.0 00 MI 0.- w- N4J004-01110-..- • • • • • • • •
Ul Ch CD N .000 ..7.t.0 4- 01 ul
1. •• •• •• •• 40 •• •• •• ••
1.1 4'4. 00 00 ^ ^ 0CD 4moWcv.aa.caulm
• • 1 • • • • •
triCN 4:2 Ul . 410 NM 4' Ul 00 4- MI CD Ul
I* •• •• •• • • OS • • •• • •
No0N00sairia.o 00NM*-Ai1a•o.s . • • • • • • • •
MCDW ■fOMMM
M
M
N
. .
sT
UI
• •
UI 00
u!) r. S
CD Ul
CD 00 141
CD
• •
■t 00
• •
UI
Ul M
value (p
er un
it)
C
• ul 04 pn CD CK ■t ■t P■ ■t C.
.`'047•IfINW ■T.m'CIU1 • •■ OS Oa Oa ••
.0111.f.000NPO000 MN0.1.• N Nal ■1' ^ p.
CD 00 00
N r.
ND hi CD 03 4'4" 4' 4' .2-.7 CO00S^ MI:1044j • N MS.O 01 NI*. 4'
• Cd 00 Ul S C. Ul M Cd 41 C. "'" •"- ■T
111 •••••
CV
(C1
%D., CD N COM CD st0001(1,0001/1
•■ •• 80 60 •■ ea
00..TO'CI•MMM00.4 111."'NN ■I'MN.-' ■T r.
• • • • .. • • • • • • .• • • • . • • . •
PI Ul Cro. r....0vm. c,
. Cr, hl ••• ',fed In-a.-- 4' Cr, ■T 00r,
■•• • 01.
in
Co
as000010triaswas bi.c• Ln N. 0- 00010, N N NIn c• NS as
^
▪
00 ea Ci■ • C.1 in N^^ CD 4J
• •
•• •• •• •• •• •• •• •• •• •• • •
.67 CV ■T
• • • • • • • • • . .. • • • • • 1 ..
• • • • •• •• 01 •• ••
▪ 4'040%0400 I,. p. Ng) UINN^M^ n
ft ft ft ft . r1 U, eg CD N 4*NNM UI •
•• •• •• •• •• •• •• •• •• ••
MMNOMN0•0..t OMOMCNO,,,'.00 (11 .000^Ln N N ON 04
NON.? C^N.O.., .7NN.- 00N O.
CV
CO 00
.0 CO CO
• •
Value
(1,000 dollars
)
Quantity (n
umber
)
Co NM'S CD .0 .0.0 N. WW1 CD 4r.- NV, N ■T
C. .m•
•• •• •• •• •• •• •• •• ••
0.MONM.S•NNM N V, .0 p. 03 00 w. ,T CP. O. ul CO co Ln S Inn a. ICSJ
•• •• •• •• •• •• •• •• ••
qC ••• •Ul ■tumt .4r re, N."' fs. 00 w" ....f.Cred.m* .000 .Oa000NN NV0
...... CO N
111.
•• •• •• •• •• •• •• •• .
NO CD Ul CD S C, 00 CD ps pl.- *OCT YIN CD.- 004'000.- rs
NNDN."'
• • • • 111 • • •• • • • • • • • • • •
grfs.. 'T r.% 4J VD st CD • Ul CD ^I. gr CD 00 Cg • bi S .0 C. NC. ft 1 . Oft ft .
M
• • • • •• •• 0 • • • • • • • • • • •
MNO“.'NNW ■tin 0•00•N00.- WW0 .04'01C1 N0.".0 . ft . ft ••
p0,00..1.011
• • •• •• •• •• • • •• • • • •
00O4 NN00MN00, N.OM■tIMV>VXIMM
NC, 111 1•••• MOJ
••••
0) t 01 C MMC01.-NM).01.- coL-mrocuo.-1 c<Nem3c-m-4
3=Mt.o.-1 00=0M>00-la
MMDCW Mr000INM>01 (OLMMOCP.1 C<)4 0 3 C..- fp 370.C.P.-o 00=0M90o-i<
Compiled from officia
l sta
tis
tics of the U.
S. Department of Commerc
e.
U
O LO
•• • • ••
•• OS •• ••
•=0
00
•• •• • • ••
0' r. O.
•• 00 • • ••
00 rs•
•• 00 •• ••
-v
Digest No.
C604--Con. by princip
al markets,
GI C o
ft o C
Cl VI
C
U
0 E
U
In 0 E 0
IF
10
0
Into) -P 00 L O-a x cu m C
7
tr) I • >
ML
C 01f0
rr. L CI M
C •IJ Vu
.0
0100
m-
o -V C N
"0 I
0 L M fl) I 7
MC RI ID CI -)
-1) N
CI >0 IN
NCN
0
fI I-
•■I
M 00
00 P
00

N 00
00 P. CN
by principal sources,
O
a
. In C 0
O
L O a E
N I
00 Cr■ ri
•• •• •• .•
NI
O CO rn
NI
a' r, a'
(NI
-41
Co r, IT
Cl U
o O
10
Co CD NI I", 00 ▪ 00 hn fele° vD Su1N5 cz
•• 4' • N
•• •• •• •• •• •• •• •• •• ••
hi CD r.1 N 111 00 Pel etleq 1.-MC.100.T WI.- N111 1L1 NO m .2* N IN ft .
oj w-
•• •• •• •• •• •• .• •• •• ••
• 00a. ••• g) 0. N. pe) S N ul te) 00 .1- 4' MN
•• •. •• •• •• •• •• •• .• ••
MsporsNc..4sOoM N01■ 0NNeqrsr...4, %TN.=
N
•• • •• •• •• •• •• •• •• •• ••
NO040 005111M%C*
••
rnNN
•• •• •• •• •• •• •• •• •• ••
M.- 00111.- 111NMI*.. WIML(1111M
••• ••
▪ N ^ •••••
•• •• •• •• •• •• •• •• •• ••
M0•0NN5.- 0 ..000.0NWM%0M5 C2Nr--Mv, N
• •-•
Value
(1,
000 dollars
)
value (p
er un
it)
O CD CD CD CD CD CD CD CD CD
(number
)
C IO
CY
• rs ul re) .0 00. ill 00 ../• is. 00 CN N N.- •••• NJ CN Ul Ne4NN.-
MWC•N M.- N.- • ul - c•
N 00
•• •• •• •• •• •• •• •• •• ••
N.7NOS No u1 NN o5^ Ul N N CN Cr, U10• ND MM
C^ 4* 4- M
• • •• •• •• •• •• •• •• •• ••
00 cr•
P.
N
('Si.- 0000 NN WW M N N0NNLIINO•Wc•0N 000M.- v01
NW1*-.0 ON CD • •D In
•••- N
•• •• •• •• •• •• •• •• •• ••
CD CD CD CD CD CD CD CD CD
•• •• •• •• •• •• •• •• •• ••
CD CD CD CD CD CD CD CD C,
•• •• •• •• •• •• •• •• ••
000000000
• •
• •
N
c
▪
r•
Cr
▪
,
CO M
. .
N
N
N
N cr• 00
• OM .00 =a,
MO) W C
W
•
I
4)L. MM .0 7
ClC M
CT-)
LM O C wm 0
MN
OCN M.-
1 "0 Cl • c
o
w>
O M > D IC NM
1
U
•
0•4 .0
11 I 11 11 1 11
11 I 11 11 1 11
11 I 11 11 1 II
II I l...4 II 1 1...-.1
II I WM II I WM
WE a ZW WE a .C4.,
M L00101W4, 0 M LOWCW4.0 0
CTIMWUOLCUOI- CMMMUWCO3 01-
MMCC.0 ..-C MMCO.,- ....c
ac- xi.hcm-4 ac- XLhCM.-1
10M.CLW0 L....1 1O1O-CLW0 L.-1
7LIULLEY=1.L4 -)UULLEhe=1.1.4
Digest No. C604--Con.
0)
0) •• •• •• •• •• •• •• •• •• ••
0
C•..o.DNMMC•I11N C.) • • • • • • • • •
Nv0.-Nkr1r.N C, 44 - 0 u
.- Ms2-
E N E E 0 4-1 P
•• •• 11 •• •• •• •• •• •• •• •• W 4- P. 0
1111111111 •0 C • 0
E • W
L
a N
•• •• •• •• •• •• •• •• •• 4.4 •
0 0 1 1 I I 1 1 1 1 1
• U 0 =
0.rA 0 1.44.) W M 4,
PN.I-) 4- CO 0
CO CO u)
•• .• •• •• •• • • •• •• • • • • • 4. •• 1J•••
■1 W 1111111111 m
• U •1-1 4j rl 4-1 fp
44 w o 4-1 c.) o C) 0 m
"o O a)
•• •• •• .• •• •• •• •• .• c..) La 4. m
4-J.0 o
E • W 0
L
H E 4- •-.1
O 4J 0
O
•
a) or a W E
1 1 1 11 P o
1 1 I, 0 CO 4..)
1 1 1 1 o
1 1 I L cn 4-1 1 om rl'61
.ve a ..cL Om u IT) Lot:Liam-pm P L
cmmmurecuo> mmco- -c o sac- x *L. M •-•1 INI ul mm=Lmo -, UULI-EbeM 144
0$ C
c-Ni
C N IC 00
• %.1" c) CD Ul ▪ CO 0 ••- h. •=,
• • • • • • • • •
CD .40 00 ul .t 0 • NI PIN" %DONN) <I>
•• •• •• •• •• •• •• •• •• ••
1....00oNWIWNIA1 ••••••••
WnuThirloCNMN
. .
•C
▪
•
N
•• •• •• •• • • •• •• •• •• • •• •• •• •• •• •• •• • • •• •• • •• • •• •• o• •• •• •• •• •• •• •• • •• • •• co, •• ••

11
Digest No. C604- Con.
Table D. 12-volt, lead-acid type storage batteries: U.S. imports for consumption under GSP, 1979-82, January-June 1982, and January-June 1983
• Item
• :
: 1979 1/ _ .
• :
• . 1980 1/ .-
• :
1981 1/ : • • :
January-June-- 1982 1/ _ .
• 1982 .
1/ • 1983
Value (1,000 dollars) •
Brazil : - : 123 : - : - : - : Hong Kong : 16 : 27 : 131 : 2 : 1 : Israel : -: -: 2 : -: -: Republic of Korea : 8 : 6 : 122 : 329 : 165 : 1,015 Macao : - : - : 1 : - : - : - Mexico : 1,289 : 1,545 : '2,089 : 419 : 242 : 6 Taiwan : 1,532 : 2,497 : 1,070 : 581 : 292 : S Uruguay : - : - : 3 : - : - : 23
GSP total : 2,845 : 4,198 : 3,418 : 1,331 : 700 : 1,049
1/ Estimated by the staff of the U.S. International Trade Commission based on official statistics of the U.S. Department of Commerce.
Source: Compiled from official statistics of the U.S. Department of Commerce, except as noted.


Ignit
ion wir
ing se
ts fo
r motor ve
hicles
(Taiw
an)
item
num
ber;
descr
iption;
tar
iff ra
te in
forma
tion;
U.S. imports in 1
982;
competit
ive sta
tus
fd 1-1
O 4)
44 C,
40 • t
• 4)
.5 4
-
.0 .0
U 0 0 W W w 0 0
11.% 0
%I V 0
44 0 0 .0
0
o O 0
•-■
• w 0 O
4,
to
• tel
E Ol fa
I 1-1 0 4 • V
0 44 U 0
TSUS ite
m Desc
rip
tio
n
r••
DD O. r-4
0
44. O
ml
ml
ml
ml
0 O 6.1 • 10 0 SI 0
1.4 O 0
40 .0
as m 0 0 0
10 10 0 •••• DI 0 • W .0 .0 m wo m 0 .0 X m e 04
O 00 0 4 o 4 •••■
...1 oaf 44 id 0 MM 0 • O )1 0 0
4
0 0 N
m I
O
03 OD
m
•
I
Co
CO
1.4
a•
•er 03
m
O. ■••1
C01 03 P
03 43• v-I
0 03
01
.0
60
O
44.1 1.1
TSUSA, are
percent ad
valo
rem.
% de
note
s
0
N.
dt
41
02
4,
7
4)
O
•
0 E
0 ea la 0
•••■
0 0 •-•
4)- 414
0
• 1.1 .0 .0 ▪ C C 60 0
0 O 40
01 0a0
I■1 • 0 • 0 Le Ir V
O 0
O el •••• a.l•
la V e 0 0 O 0 0
0 aa .
▪
0 0
0 .0 0 0 .0 00 to
.1) 0. Ai 0 I•I 0
.00 Of 0 .0 •• A 0 1-1 0 .0 0 j.
•••• • 4.1
0 110 0 O 0 0 10
• w• r2 01 M C) : 0 la ••••• .0 0
: V•d V
0 V .4 0
• la al • 0. 0
O
•
0 0 0 .0 C 0
4' m M to O fa .0 0 C 0 0 60 ea 0
•••• m cm .0 O 0 ea 0 al SY 0 0 V
fo m 0 O 0 .0 .0 0 0 6-1 01 OS 0
••••amI 0 rl l cal tot Z

2
Digest No. C605--Con.
II. Comment
Description and uses
Ignition wiring sets for motor vehicles and other transportation
equipment consist essentially of electrical wiring harnesses and ignition
cable sets. Wiring harnesses are used for the wiring of instrument panels,
lights, horns, windshield wipers, and a variety of other electrical devices in
motor vehicles and other transportation equipment. Ignition cable sets are
principally employed in the starting and ignition circuits of the above
mentioned equipment. The predominant type of these assemblies are spark plug
wire sets. These devices are primarily consumed by the motor-vehicle and
aircraft industries in original equipment applications, although considerable
demand exists, particularly for spark plug wire sets, in replacement
applications.
U.S. customs treatment
Ignition wiring sets were designated for duty-free treatment under the
Generalized System of Preferences (GSP) on January 1, 1976. On
February 29, 1976, Mexico was removed from the list of eligible GSP
beneficiaries by virtue of the fact that imports from Mexico in 1975 exceeded
50 percent of total imports under TSUS item 688.1200. Mexico continues to be
the only GSP beneficiary country excluded from duty-free eligibility status.
U.S. producers and employment
There are currently 14 U.S. companies producing ignition wiring sets
compared to approximately 25 producers in 1977. No estimates of industry
employment are currently available; but due to the substantial rationalization

3
Digest No. C605--Con.
of industry production operations in Mexico utilizing the provisions of TSUS
item 807.00, employment is estimated to have dropped dramatically in recent
years. Only a few U.S. producers, including the petitioner, have not moved a
large part of their production operations offshore.
U.S. consumption and shipments
Apparent U.S. consumption of ignition wiring sets for motor vehicles
increased from an estimated $264.5 million in 1978 to $298.8 million in 1981,
or by 13 percent, before declining slightly to $297.0 million in 1982 (table
A). During January-June 1983, apparent U.S. consumption was an estimated
$142.0 million compared to $130.4 million in the corresponding period of 1982,
or nearly 9 percent higher. U.S. producers' shipments of ignition wiring sets
declined from an estimated $300.0 million in 1978 to $260.0 million in 1982,
or by 13 percent, before increasing by nearly 10 percent to $285.0 million in
1982. Estimated shipments in January-June 1983 were $150.0 million, or 17
percent higher than during January-June 1982. The increases in 1982 and in
the first half of 1983 are associated with a recovery in the replacement
market for wiring harnesses and cable sets, increased domestic prices, an
increase in original equipment automotive production in early 1983, and
increased exports of these products.
Exports
Exports of ignition sets for motor vehicles increased from $78 million in
1978 to $152 million in 1982 (table B). Exports reached $118 million during

C605--Con.
January-June 1983 compared with $73 million during the corresponding period in
1982. Canada provided the largest export market during the period although
Canada's share decreased each year, declining from 91 percent in 1978 to 56
percent in 1982. Exports of ignition sets to Canada are related to the
integration of the U.S. and Canadian automotive industries. Mexico also
accounted for a large share of U.S. exports, increasing $3 million in 1978 to
$57 million in 1982. Exports to Mexico are related to U.S. producers'
rationalization of production along the Mexican border. Canada and Mexico
combined account for over 90 percent of U.S. exports.
Imports
U.S. imports of ignition sets for motor vehicles increased from $43
million in 1978 to $166 million in 1982 (table C). During January-June 1983,
imports were valued at $88 million compared with $61 million during the
corresponding period in 1982. The ratio of imports to consumption increased
from 16 percent in 1978 to 55 percent in 1982, and then to nearly 78 percent
during January-June 1983. Most of this increase was accounted for by Mexico
which was the largest supplier during the period, accounting for from 53 to 83
percent of total imports. Virtually all of the imports from Mexico were en-
tered under TSUS item 807.00, reflecting the Mexican border operations of U.S.
producers. Imports of ignition sets from Taiwan increased from $14 million in
1978 to $20 million in 1982. Imports from Taiwan reached $16 million during
January-June 1983 and were 90 percent higher than during the corresponding
period in 1982. Virtually all of the imports from Taiwan were entered

5
Digest No. C605--Con.
duty free under the GSP, accounting for almost all of the GSP imports of
ignition wiring sets during the period 1978-June 1983 (table D). During 1982,
imports entered under the GSP accounted for about 12 percent of total
imports. Mexico is ineligible for GSP treatment, having exceeded the
competitive need limitation in every year since 1974. Ignition sets produced
domestically are interchangeable with imported sets with respect to quality
and function; however, sets imported from Mexico have been reported by
industry sources to be up to 30 percent lower in price.
Position of interested parties
National Industries, Inc. (National), the petitioner, reports significant
difficulty in competing for domestic contract awards as the result of intense
price competition from imports of wiring harnesses from Taiwan. The
petitioner asserts that it is currently being undersold by 5-20 percent in the
U.S. market and argues that GSP benefits are largely benefiting the Japanese
owners of the predominant Taiwanese producer. National feels that the
quantity and price competitiveness of the imported products from Taiwan are
significant evidence that Taiwan no longer needs the provisions of the GSP to
further its industry's development and thus should be graduated from the list
of eligible GSP beneficiaries.
Spokesmen for American Yazaki, the largest Taiwanese producer of wiring
harnesses, have indicated that the elimination of GSP benefits to Taiwan would
hamper the development of their facilities in Taiwan. They have suggested
that the loss of the 5 percent duty preference might eliminate the incentive

6
Digest No. C605--Con.
for the Japanese parent company to source wiring harness components in Taiwan
in order to satisfy the 35 percent value added requirement of the GSP.
Representatives for the Taiwan Board of Foreign Trade (SOFT) essentially
concurred with the statements of American Yazaki while asserting that smaller,
and considerably less competitive Taiwanese producers of wiring products other
than harnesses also stood to lose U.S. market position should the decision be
made to deny Taiwan GSP eligibility under TSUS item 688.12.
Both the SOFT and American Yazaki also suggested in prehearing
.statements, that the graduation of Taiwan from GSP beneficiary status could
result in the decreased competitiveness and subsequent reduction in supply of
wiring products to the U.S. market. They further argued that National did not
currently have the necessary capacity to fill this supply void in an expanding
domestic market, thus placing U.S. purchasers of these components in a severe
adverse position. National, however, has consistently indicated in its oral
and written statements, that it has sufficient unused production capacity to
respond, in a timely fashion, to any short supply condition in the U.S. market.

7
Digest No. C605--Con.

8
Digest No. C605--Con.

9
Digest No. C605--Con.
Table A.—Ignition wiring sets for motor vehicles: U.S. producers' shipments, exports of domestic merchandise, imports for consumption, and apparent consumption, 1978-82, and January-June 1982 and January-June 1983
:
Producers' • Period : .shipments 1/: . Exports :
: Imports :
Apparent con- • : gumption 1/ ;
Ratio (percent) of imports to consumption
1.000 dollars : Percent
1978 : 300,000 : 78,354 : 42,826 : 264,472 : 16.2 1979 : 280,000 : 71,104 : 69,658 278,554 : 25.0 1980 : 263,000 : 66,556 : 96,782 : 293,226 : 33.0 1981 : 260,000 : 119,959 : 158,733 : 298,774 : 53.0 1982 : 285,000 : 151,610 : 163,571 296,961 : 55.1 Jan.-June-- : : : • : :
1982 : 128,000 : 72,952 : 75,375 : 130,423 : 57.8 1983 : 150,000 : 118,160 : 110,124 : 141,964 : 77.6
1/ Estimated by the staff of the U.S. International Trade Commission based on official statistics of the U.S. Department of Commerce.
Source: Compiled from official statistics of the U.S. Department of Commerce, except as noted.

M co Os
0 C 7
L
0 C ro N CO
N co 0'
CO
00 0'
00
0.
•• •• •• ••
L .
Department of Commerce.
• U1
=
N -C
O
U
UI
Ill
U
* 4- O
E O
at
a E 0
aI U L 7 0
Digest No. C605--Cor.
ND.- Ul hl COP+ U71 CD CK P. N ND N N. co 00 ON N .0 NO NW) U1 C\I rel
▪ Ul CV 6.1
CO CO "-
•• •• •• •• •• •• •• • •• ••
PIMP. °Or+ ND %CI hl CO POO r. ND CO 111 .- VIM') U1 C.1 sr ND CO In Ul hl
44.
co CO N
ul P. M
ul P.
te) 00 os
0 C
L
C N 00
CO
0'
0"
cps 00 re) re) ••••••• re) N CO C> N1 CV Cr, CN N re) sj:,
CD CD sr (\I ■- M N
•• •• •• •• •• •• •• •• • • • •
• NN N re) co ,- cp.- 14100 CD te) CD CD hl Oh re) CS.1 Ch P1 ND
•• •• •• • • •• •• •• • • •• ••
.- sr CD Os a'N CN 0041 CT U1 N N.- .0p,
•-•
0, 00
ND sr U1^U1 Nr CD .D00 N CNN Nt NY NY 0 00.1- .- C. Ul CD re) s:r r+
O O. •• c-.. ^ N N • —
•• •• •• •• •• •• •• •• •• ••
MI OND ON .2' r, CO Ch CD CD ND Ul N . U) C.c.-Os= P. Op .-
N N
•
.-
•• •• •• • • • • •• •• • • • • • • •• I I I I
I I I I I I I I I L. I I M
E -P O C. al 04 03 0.1.1-■ 0 U 'UCalU C 0 I-
C no 4.7 C ro •- a C -C ro L L
EC> -, u. u. o_ •ca
••• 4,44.
.14.4
Ul
M NO
M r+
00 Ul
N 00 rs.
42/
00 Ul
'0
00
N
•• •• •• ••
•• •• •• ••
CO CO
41■
Os
•• •• •• ••
co 0'
•• •• •• ••
of U L
0 (.0
Department of Commerce
.
cn
0 _C
4- 0
UI U
-P Ul
VU
U 4- 4- 0
0 L
al
.- CL
0
U
O U)
•• •• •• •• •• • • •• •• •• ••
^tNN .DCD111 ■- 04 Ch CO
4- cm- cm
NOV PO NO
•• •• •• •• • • •• • •
• U-1 In N r••• sr sr 0 C^,O. In
hr) DO r.
P
▪
.
O sO •••■•
00
N al Os
N r.
CD
s4D
111
Ch U1
a'
NO U1 U1
43 NO
•
O
10
rp a
U C
•.- L CI
al N
C re
U
E
U
4J
al E
. 0 "0 PM
Co 4- as 0-
111 C
L o al X 0,
L r0
• 0 C
• 10
O in C
IV re - # -•
N 0 _C co 10 al cm > - 4-
0 L al O C-
7 -0 O C E I rro
> L L O M 4- 7 .0
C M
--) C
UIN .
Cnc0 C l
.- L
3 ^
C O In
-P -P ••- • L OI 111
E
• co
al
I-
p. CO CD CD 111U1 NY ND 1171P+ NY Ch CD N.- CO WI.'" .1- NM N CD
CO 0 ND
•• •• •• •• O. •• •• •• 04 ••
• Os 00 CD Ch. CD P.P. ▪ hi CZ VDU/ Ill n N Os N Ch
N • N
•• •• • • •• •• •• • • •• •• ••
Co .- P.C. rs. No re) ND WI .- ND .- sr ND ON r. N O CO ND r. CO PN ND 111 hl rg at ND NY CV 00 111
•• •• •• •• •• • • •• ••
0'00^n ^ °Ohl ND r+ NY 111 r, r.,0 CV Ul r. CV 00
h
00 MM Is. re)
•• •• •• •• •• •• •• •• ••
LI/ CO U1.- NO .1* rel CN ND II/ ul s:r re) Ul ul C. NC P. 00 ^U1U1^O
P. N ^ Pe)
••■• N.
so-
Op rs.
•• •• •• •• •• • •• •• . ••
I I I I I I
I I L I al m E
r0 0 OL 01 L -1-1 0 -00r0 •- CCOJoi-ro c r0 C X - ase r0 01 C M rO IU L
E C.> Ct. M IL a
CO Is-
al U
O
to Q.
..- U C
L a.
C
.0
0
-P a
U) C 0 U
L 0
L 0 a E
• M
• co
•• U)
In al L • C r9 -I 7 r4
-
•
1 - I 0 .0 OS L > r0 4-
0 L C O m UI
-0 0 E D to
C Ul L r0 0 O 0 4- . -C
N in co
C
•••- 1-1 in
aJ ▪ C C L I
3 L ro
C O C
CrIN N 00
U
al ti
I-
.0

11
Digest No. C605--Con.
Table D. Ignition wiring sets for motor vehicles: U.S. imports for consumption from designated GSP countries, 1979-82, Jan.-June 1982, and Jan.-June 1983
(In thousands of dollars)
Item : . : 1979
• • . •
1980 • • . 1981
• • 1982
•
January-June__
1982.1/ •
• 1983
Brazil : 383 : 332 : 367 : 244 : 122 : 116 Hong Kong : 16 : 67 : 30 : 19 : 9 : 2 Republic of Korea---: 45 : 8 : - : - : - : 27 Mexico : - : - : 7 : - : - : - Philippines : 273 : 351 : 134 : 2 : 1 : 2 Taiwan : 11,591 : 12,456 : 16,947 : 20,018 : 10,009 : 15,236
Total : 12,308 : 13,214 : -17,490 : 20,283 : 10,141 : 15,383
1/ Estimated by the staff of the U.S. International Trade Commission based on official statistics of the U.S. Department of Commerce.
Source: Compiled from official statistics of the U.S. Department of Commerce, except as noted.


722.1212A
rNa
N
722.
1205A
N
0
fixed-focus cameras--: 10%
N 44 0 44
• 44 •.-1 0 0 0 44 -0 0 al
• • - • • • - •
0 4)
ea 4)
•-1
.0 C
.44 el
0 14
.044 0 ea
44.1 404 o
aN 0
•0
444 41 0 41
0 0
m 0 la 1,-4
4-1 0
•0 Y be
441 CO
a 0
Pt 0 N
M m
.0
K
O.
a
• .01
.0 7 44 0 .0 0
44 al 14 .0 4.1 0 0 •
.41 U 0 C
•• a aao u1as
1.. m O a 01 O 0 C
@ .0 U
••4 d 0 404
0 0 Ca 4 14 0 .0 44 C
C 1 0 0 j1 .0 1-4
0 0.. O 0 a
1.• at
C41
4
N
N
0
• 02
0 .c .14
00
0
44 0 0a
0 0 14 CO
r.1
44 0
0 14 • •-.1 0 04 C4 44 0 •-4 O
01 N 1-1 0 N 4.1 .0 1•••
4.1
Ls 1 a 0 0 0
O1 a .-1 0 .01 .0 .-1 0
.0 00
0 •••4 4 0 44
0 0 2 1.4 0
1-4 01 a 00 0 0
15 0 0 0 ... .61 La3. 0 41 0 CC 00 0 13. ... 0 41
0 Ile so
a 46..
12. .01
C 0 0
0 0 44 e
11 .141 0
m
EI Ls 0 M 01
0..
C 0 0 - .0.0 • N .0) 0 1.4
.0) r-1 ".1 47•°° 0 0 I-1 N .c
44 -
r•I C
0 .4.1 • 0 .61 C
4.3.1 Owl
II 0 .4
VJ
:
1.4 NC.; 0 1•••
1.• 4)0.0
tri 0 0
C o U 0 .0
0 la .01 .0)
0 CP 0 0 00 401 0 C
0 4., 01 4 era 0 0 O. a414
44.4 CO 0 0 .1
0.1
co 14 El 12
4o: ml ••••
4.1
•••• .0
0 a.
0
a N ea CO 44
0 4-I tO
C1.4 0 0 2 a. 0
••••
I•4 0 a.
-
4) 44 0 • ••
C 0
614 .44 0 .0
.0 0
.o a
at
00
0 0.1 w_
00 La C 0 .01
01 0 14 L.
0.
u ea co
V
0
I 0
9 44
C
4
• •
ad 14 1.1
Pe ■-• •
CO
e•I
,0 CO 0,
1-1
co O.
ao
40
co
03
0 co

2
Digest No. C701--Con.
II. Comments
Description and uses
The photographic cameras covered in this digest (TSUSA items 722.1205,
722.1212, and 722.1225) are all of the fixed-focus, hand-held type; instant-
print cameras and cameras having a photographic lens valued over 50 percent of
the value of the article are excluded. TSUSA item 722.1205 consists of 110
cartridge cameras with a built-in electronic stroboscopic flash. TSUSA item
722.1212 consists of all other 110 cartridge cameras, or more specifically,
those cameras without a built-in electronic stroboscopic flash. For the past
ten years the 110, or "pocket" camera, has been a popular model among casual
photographers interested in picture-taking that is both simple and
inexpensive. The 110 camera uses a cartridge that contains film 13mm in width.
TSUSA item 722.1225 is a basket provision and consists primarily of 126
cartridge cameras, inexpensive fixed-focus 35mm cameras, and the new disc
cameras. The 126 camera uses film cartridges containing film 28mm in width
and was the first camera to utilize a cartridge rather than the traditional
film spool. This camera was popular in the 1960's, and although the 110
camera system supplanted it in the 1970's, there is still a market for 126
cameras. The disc camera, which was introduced by a U.S. manufacturer in
1982, is also classified in TSUSA item 722.1225, and is characterized by a
flat rectangular body that usually incorporates an aspheric lens with a short
focal length. These features allow the photographer to shoot subjects in
focus from four feet to infinity, and to achieve picture resolution as high as

3
Digest No. C701--Con.
350 lines per millimeter. The disc camera is used primarily by casual
photographers. Hereafter, the products discussed above will be referred to as
fixed-focus cameras.
U.S. producers and employment
There are currently two U.S. producers of these cameras, down from three
in 1978. They are located in New York and New Jersey. Estimated employment
in the apparatus divisions of these companies increased from 15,000 in 1978 to
20,000 in 1981, and declined to 16,000 by June of 1983. 1/ Lagging sales in
both foreign and domestic markets have led the largest U.S. photographic
manufacturer to lay off a large number of employees and to offer incentives to
almost 80 percent of its total work force to leave the company.
U.S. consumption and production
As shown in table A, apparent U.S. consumption declined irregularly from
$494.1 million in 1978 to $486.3 million in 1982. Consumption for January to
June, 1983, was estimated at $192.7 million, an increase of about 18 percent
from the corresponding period in 1982. The overall decline in apparent U.S.
consumption from 1978 to 1981 was due to economic conditions and a saturation
of the U.S. 110 camera market. The increase that followed in 1982 and the
first six months of 1983 developed due to the new product technology of the
disc camera and ensuing consumer interest.
1/ The apparatus division includes facilities for production of cameras and other photographic hardware, such as photofinishing equipment and projectors.

4
Digest No. C701--Con.
The ratio of imports to consumption declined from 8.8 percent in 1978 to
6.0 percent in 1979, and then increased to 7.8 percent by 1981. The U.S.
introduction of the disc camera in 1982 brought the ratio of imports to
consumption down to 5.6 percent in that year, but an increase in imports
caused by the rapid proliferation of foreign disc camera manufacturers in Asia
increased the ratio of imports to consumption to 10.9 percent for the first
six months of 1983.
U.S. producers' shipments of certain fixed-focus cameras increased from
an estimated $482 million in 1978 to $498 million in 1979, and then declined
to $442 million by 1981. A significant upturn developed in 1982 due to the
successful introduction of the disc camera. U.S. producers' shipments in 1982
were an estimated $582 million, an increase of about 32 percent over 1981.
Shipments for the first six months of 1983 showed a 2 percent increase over
the same period in 1982.
U.S. exports 1/
U.S. exports of certain fixed-focus cameras increased from 1.6 million
units valued at $31.4 million in 1978, to 2.0 million units valued at $51.2
million in 1979, before declining to 1.3 million units valued at $27.5 million
in 1981. Exports increased in 1982 to 4.7 million units valued at $123.1
million as the new disc camera stimulated foreign demand (table B). U.S.
exports for the first six months of 1983, however, declined by about 25
1/ Due to the aggregate nature of Schedule B statistical reporting, export figures include instant-print cameras.

Digest No. C701--Con.
percent in terms of quantity, and 20 percent in terms,of value, from the same
period in 1982. This downturn was caused primarily by the appearance of
foreign competitors who, for the most part, have been licensed to manufacture
their own disc camera models. Canada, Japan, and the United Kingdom were the
principal export markets during 1978-1982.
Japan, Taiwan, Hong Kong, and South Korea are the major competitors of
the United States in international markets. The labor-intensive nature of
camera production gives the low wage-rate countries of Asia a distinct
advantage in price competition. Although U.S. manufacturers produce a camera
that is generally higher in price, they are able to compete on the basis of
the long standing reputation of a major U.S. photographic manufacturer for
production of a quality product. More effective competition on the part of
U.S. manufacturers in the international market is inhibited in part by trade
barriers to other producing countries such as Taiwan and South Korea.
U.S. imports
U.S. imports of certain fixed-focus cameras decreased irregularly from
4.8 million units valued at $43.5 million in 1978 to 3.0 million units valued
at $27.4 million in 1982. U.S. imports for the first six months of 1983,
compared to the same period in 1982, increased 37 percent in terms of quantity
to 1.6 million units, and 126 percent in terms of value to $21.1 million
(table C-1). Taiwan, Japan, Hong Kong, and South Korea were the major
suppliers during 1978-82. These countries were particularly successful in

6
Digest No. C701--Con.
increasing their shipments to the United States in 1983 due to their early
purchase of the disc technology from the U.S. manufacturer and the , existence
of production facilities in these countries that were easily converted to the
production of disc cameras. Imports increased substantially in the first six
months of 1983 as Hong Kong and Japan, major world camera producers, began
production of disc cameras. The product imported from Taiwan, Hong Kong, and
South Korea is often less expensive than the domestic product due to low labor
costs, but the domestic product is generally considered to be of higher
quality since it is made to more rigid specifications and of more durable
components. Imports from Taiwan, Hong Kong, and South Korea are usually
marketed through discount stores, catalog showrooms, and department stores,
while the domestically produced product is sold in these outlets and in
specialty camera stores.
Imports under the Generalized System of Preferences, which accounted for
60 percent of all imports of certain fixed-focus cameras during 1978-82,
declined from 3.4 million units valued at $21.1 million in 1978 to 2.3 million
units valued at $16.8 million in 1980, increased to 2.8 million units valued
at $23.4 million in 1981, and then declined to 2.6 million units valued at
$17.3 million in 1982. GSP imports increased significantly from the first
half of 1982 to the first half of 1983, growing from 1.1 million units valued
at $7.4 million to 1.5 million units valued at $12.1 million, for increases of
27 percent in terms of quantity and 62 percent in terms of value (table C-2).
In 1982, Taiwan, Hong Kong, and South Korea accounted for 95 percent of GSP
imports. Taiwan was the single .largest supplier of GSP imports and these

7
Digest No. C701--Con.
accounted for approximately 43 percent of total imports of certain fixed-focus
cameras in 1982. GSP imports from Hong Kong and South Korea accounted for
about 14 percent and 5 percent, respectively, of total imports in 1982.
Position of interested parties
The petition for removal of Taiwan, Hong Kong, and South Korea from GSP
eligibility for TSUSA items 722.1205, 722.1212, and 722.1225, was submitted by
the National Association of Photographic Manufacturers (NAPM). In the
petition, its sole submission, NAPM contends that GSP imports from these
countries have contributed to domestic unemployment and the exit of a U.S.
producer from the photographic industry.
The Board of Foreign Trade, Republic of China (Taiwan) opposes the
removal of GSP eligibility from Taiwan. This petition states that imports
from Taiwan have not exceeded the competitive need limit and that the U.S.
photographic industry is not threatened by the current level of GSP imports.
Written testimony was also presented by W. Raking Enterprises, Limited,
.of Hong Kong, in opposition to the petition. Counsel argued that significant
increases in U.S. exports of subject cameras demonstrates that the U.S.
industry is internationally competitive, and that imports from GSP countries
have substantially decreased from 1978-82. Injury suffered by the domestic
industry is not the result of GSP imports, since market penetration is small,
especially when compared with Japan. If GSP treatment were removed, Japan
would benefit rather than the domestic industry and prices to the U.S.
consumer would go up.

8
Digest No. C701--Con.

9
Digest No. C701--Con.

10
Digest No. C701--Con.
Table A.--Certain fixed-focus cameras: U.S. producers' shipments, exports of domestic merchandise, imports for consumption, and apparent consumption, 1978-82
Year . Producers'
shipments 1/ :
Exports
2/ : Imports
.
. .
. .
Apparent
consumption
:
:
:
Ratio (percent)
of imports to
consumption : 1,000 dollars :
1978--. : 482,000 : 31,397 : 43,493 : 494,096 : 8.8 1979 : 498,000 : 51,157 : 28,744 : 475,587 : 6.0
1980 : 497,000 : 39,551 : 31,963 : 489,412 : 6.5
1981 : 442,000 : 27,522 : 35,238 : 449,716 : 7.8
1982- : 582,000 : 123,128 : 27,390 : 486,262 : .5.6
January- . :
June-- : :
1982 : 200,000 : 41,740 : 9,324 : 167,584 : 5.6
1983 : 205,000 : 33,354 : 21,065 : 192,711 : 10.9
1/ Estimated by the staff of the U.S. International Trade Commission from information supplied by industry sources.
2/ Includes instant-print cameras.
Source: Compiled from official statistics of the U.S. Department of Commerce, except as noted.

NO V/ C2 J c4 J N PI P. P. 02 J cr CD 04 NO U v. CO
•• .• •• .• •• .•
PN PI C. 03 4t C. PI VI N CV N P. on r. on • PI .- CV
•• .• •• •• .•
u% 41 UN In PI Mt v. .- PI ND CD P C. on U1 V2 U1MJM rr
• • • • • 1. •• • • • • • • • • •
CO PI P. 03 0 P. PI PI .?In In 42. CO ro ID
4. v■
00 0 0 • • 40 00 • • 04 •• • • ••
CD PA 40 PI OOP CO 4r .0 P. P. P. NO P.
.11. •••
• •
04 • • 0 0 00 • • •• • 0 0 0 • 0
P. CO Pr PN .Or 141) cr U1r O0 ru ON PP
(Si.-.- CV
(1,000 do
llars
)
O
60 •• •• ONO 06 111. 00 00 O0 •
Or Or.p CJ PP 410 IA P. cr Nr VI C2 CV
• • •• • • • • se 00 •• •• •• 60 0• . • 1 11111 1 11111 1 11111 1 1 1 1 L .4 1 1 1 1 11 0
E -. IA .0 • CM L. W LU 40 V 40 ▪ C C 01 4,1 L •-■ O p- CO • w. CD Cart C 0. sr a a a S O L. L 4.0*.4 C.) -1 U. U. 4( 4t Z 4(
0
•
4.1 O
A
V C
= U
so -4 a en CO
UV) .4
r Y g
W E ► ) O 1
›, ed
4- 2 0 C
w in 4/.0 L O 0 O.
X tV Yap co
LW .01 O
,
g
a•P., 1.1 o
CO CV
0 CO O 1 4..1 CO
• 1 Ps •2 OT
44
•
. 44 •
C 11) .1L • 1-1
4.) g w
e.2
•
e-1 1 cd
1:11. •,1
Oa U
ID ,4 .4 10
A CI-O
N
• • •• • •
CO
00 • ••
O O
0. . . .
C 2
O O 0
04
C O
a
CO
Department of Commerce.
UM
0
01
40
4- O
U
40 •
IA
.4 •
U
14. 0
E 0
4-
.0 40 .4
E
u L
O LI
1 1
Digest No. C701--Coh.
CM O CO
PI
••
P. P. SA
NT
••
UN CO CD
.o
06 06
P. .0 4.
• • •
•• •
• •
60 •• ••
O
.4r UN
PI
CV
C.
(.1
0. 4r 4r
UN
OD 4. UI
03
••
0 P. 4r
.1'
*0
N
M
PI
• •
'0 .0
P.O.-
•• ••
a P.
CO
•
•
• C •
0'40
UN
P.
••
O.
UM UM
P.
••
CD CD 0
PI
••
41. 4, PI
eft
Se
N
40
• •
41.
rui
•
•
Jr0
• ••
C • CL 0
........
....ft
P.O
00
PI
C.
4. UN P.O
PI
••
UN C. U10r PP
••
P. 40 NO NO P 4D
O. co.
4* Oa
40 04 111 40
CO r
r
• • • •
03 C. N CD .-
0.0
• DO 60
UN NO N C) CO CO 0 UN
ro tne
• ••
PI P. P.
0 IA .Or
N
•• • I I I
E CA 1. C 01
4.0
1. I. u•
.......
CD
rU1N r
0 ND a r4 CD 4r .0 No C.
PI
• • N. • • ••
MI 40 a P. CV
UM M P
• 4 •• ••
4r P/ 4r OD P. P. CM P. 00
o2 u) .t
00 6.0 •• ••
J N N r4 NO PI 0 0
CV (Si.?
• • • • • • • • •
C. CD 40 O.0 111 cr In UN 4r
0 • • •440••
CM MN ND P. C. CV P r P.
PN PI 4.
0 ••
PI 40 CO In .ON
C. UN
r cr
• • • •• 0. 06
1 1 1 1 II)
1 1 1 1
1 1 1 1.
1 1 1 11 /-1 Int r
01 ILI • V r LI 4 C .0 40 .0 AI • IA .10
L. 01 46c <
66
• •
••
6.4
• •
00 1
1 -1 a
0 I.-
• •
2
•
C
es
•• ••
4,
C. CV
• • ••
UN
WS 40
04 Of
.0 P.
CD PI 40
66 ••
CO 00
00
40
• • •
.0
uN
•
N 03
M CY 40
•• ••
I
UN
AI 40
.0
PJ .
rr •
•
•
03 141
•
CV
OD J
• 01 CV
00
0. NO
• OD ru
• •
0. O
•
MI
• ON
UN C.
• co IA
•
• C O
.
PI
00
a) 44"
NO
0 r- •
•
N
• ••
40
• Sat 441
••
NO r-
• P. r
06
SO PI
• OD r
0 •
D 4r •
f4
•
PN P.
• .-
• 0. AL N
.-NOINOP.40
1:1CCWU
P. CV
on 4T
Nr
171
-OUf .0 MI
• UN UN CO c4
•• SO
co ND 4.1
• • ND 4r
N N
•
UN NO .o o2
. • .0 PI AI CV
•• 66
CD CD P P.
• • P. 4r r r
N NO C.
• • r PN N r4
• 0 •
03 UN • •
r 11.4
• •• 44
0) CV A)
• • a3 N
•• •• I
• 1 1 I
E L.
L. A. IL. U.
clei .0 40 PI 4. p.
.. • • • C. P. AI r C4 .0
.0 •• •• •••
NT 03 PI un Ps
• • • • PI C2
N N PI UN
•• 00 164 • 0
.- P. P. 110 PN
• • • 04 p.
PJ C4 PI
00 616 ••
NO OD 4. CV CV NO
• • • • O N Cr r PI .0
00 •• •• ••
PN UN
• • • • CO co op
• • • • 66
C;) ed. IA VI 410 UN
• • • • 40
r r 4r r
• • • • •• • •
.14 CD CP UN UN .1-
• • • • N N C4
•• 00 •• •• 1 1 1 1 1 1 1 I 1 1 1 1 1 1 1 1. 1 1 1 W ••.0
II ILI • 12 r L. .4 0
C .0 4+ • IV IA 40 .4
1.0 01 •4 « Z <
co
••
• • 66
tS •
.0.
DO ••
06
• 0 •
40 •
In N
• • 0 •
•
14.
• • •• 1 I
01
w
10 0 W
0 LI
0 4-4
Cu
IS 0 CI3 4.1
rl
m '0 o .. u C
\ .41

st N 43 .- 42 Ch I I. un cn 00 .- O st Oh .42 VD CD m.
• UN
•• •• •• •• •• •• •• •• ••
F- 01 P. v3 ftl VD I .- 00 ON cv rn U100 COOV 4'
•• •• •• •• •• •• •• •• ••
.- N V) .- CD CN P. vD OD sc) ND cN O cD OD st 01 P 141 P O nn ch UN
• N.T nn
•• •• •• •• •• •• •• ••
▪ so P. P. m1 I OD .- UN st OD UN CO VD N. N. nn un
N U1 .0 01 st
•• •• •• •• •• •• •• ••
44 1.■ UN .1 CD 1 V2 Ps In CO v) OM CD Ps I.11
OD 44 Ul J VD
••
•• •• •• •• 60 •• •• •• ••
P. .0 04. cn I .- O s
•
t .- CO st CO C4 U1 C4 .- 01
CO .0 .0 U1
• • • • • • • • • • • • • • • • • •
Ps un n. nn co I 1 NI Cro MI 0. .- 03
un OD CD
•• •• •• •• 60 •• •• •• •• •• I I I I I I I I I I I I I I I I I I L .4 I I I ID a 01 a E J: 4+
cn c a L .4 4.1 C C 1304 a 0 a o •- De CD W
4; CL DC L. U L .4 M a CA 0 L. a IA .4 F.1OSYLLS rr <
•43
O
4.1 V) V ,0 01 .42 CD 1 0. CP% CV CD J CD CN CO CO CO • • • • • • •
u1 0/ C4 C4 01 CO WI .- N 4.6 sr C4 .-
•• •• •• •• •• •• •• •• •• ••
CN VI 0 Os 00 40 CV I 0 N. 0 0 CO • • • • •
43, • rn
• M
1:1 1 UN N. 01 so sO 4h CV CV
m■
V,
•• •• •• 00 00 •• •• •• 00 00 •• ••
UN C4 C4 UM cv un NV P. Ps CV C4 t1.1 V2 Ch N un N • • • • • • • •
VI CV IV w- 1.■ 4-
•• •• •• •• •• •• •• •• •• ••
Cr• CO CD U1 CD CD CV 1 • CO OD 4* 00 CO NN CO ./3 1.11 • • • • • • •
Vi Ch CO CP. sr C4 V4 41)
•• •• •• •• •• 00 •• •• •• •• •• ••
In cr. Al N N V> I 0 0 10 NJ N N. trt
• • • • • • • • 42 CD C4 V 4. P. un Np 0. 4A .1- CV .4.
• • • • • • • • • • • • • • • • • •
NJ .- 03 03 P. VD 0. P/ sO 03 MI 42 M Oh • • • • • • •
P. 6. 03 J V2 V2 CO 40 .- J .- r4
•• •• •• •• •• •• •• 60 •• •• •• ••
r4 CO P. UN .3* r4 I I on st CD sO CN N. C3 • • • • • •
U1 P NUIPN MP 41A
•• •6 •• •• •• •• •• •• •• •• •• •• I I I I I
I I I I I I I I I I I L.
I I v 01 O. 5
01C a L
0 .4
4,
C.■
• • • • •
•• • I I
CT • L 11
F4C001:0010100> • a A- NC CD a a AC
•Al IL 30 L. U L. CO a 01 0 L. a VI •-4
1-1 1 9 2 Y u.
Department of Commerce.
• cn
=
4- O
U
IA
0
▪
1
.4 117
U
4.
O
O
4.
17
GI .4 CD 41
E re' 0 4 C.) 4.1
• • CO
w U
0 **"••_, -"" 0
12
Digest No. C701--Con.
cc
OD
CT
0 O
CC
C c0 •re-I
P. C)
.0 0
i
.4 co 4-, 0 10- E ro O CC 4J co
ON ,4-1 CO
Cr,
1.J 1.1
O. O E
1
Ci") •
co 0
CC
0
1
u,
0 41
C.)
0
W C
co 0 C
.•
• • ..
•• ••
O
CsJ O
■
e4 c0 ON
f• CO a,
CD C0 P
.• • •
P n P .-
ap r. P
•• ••
0) U L 0 0 0
••
es
.-
0
O O O
Ds 4 .- 4- C CD 0
Or
•• ••
••
••
••
••
••
111
cN
•• ••
N P. O. 01 P.
•• ••
in N
0 00 Cs. 00 CO NJ
•• ••
m. CO 4" .M
st J\ N. Cs1 CD 01
.-
•• ••
01 CD VD cn M1.
•• ••
I I I
I I I 0
3 •H 0 co E.4 -1
V.- 01
••
P.
••
01 M
ss
••
••
a •. Q. 3.0
coCCOCL
.-Is0
••
st CN C) U1 U1 N. .- NC
•• 00 •• ••
CD N.S. CO. 01 42 N
•• •• •• ••
n. cn 03 CD CD CV CO Lft
N.1 sT CN DO Ul CO .40 CV 01
•• •• •• ••
P. NI P. C) M N .0 Aft 03 Al 01
03 VI un .3- .- .-
r4 01 -
.-
•• •• •• ••
CD CD 01 CD N ND UN UN
•• •• •• ••
I I I I I I I I I I I I I I I 010. E
01 G 01 L
IC CD CO L 13
of o L. = 2Y U.
CD
••
CD
••
r4
••
CD
o
••
CD
m in 2 h4
1110010(-
••
..4
••
••
••
0
•• I I I L 01
4,
a s. ..4
.4
.4
.C.I.,
•• I I I
..•■ CO
0
••
0
CO .4 .4
O O
O O O
Cu
.4
••
••
••
••
••
••
• •
•• ••

Ti
a
a cr) o co ri 0.•'
E E W
CI)
O
•
f U
1.4 I-1 ro 0
W ro
(i) 4.; s-4 -0 o
E 0
VI ON
cn ctl
CI) E co U In
o O C•I
14-1 CO cr•'
rl 1- • *
•
co
C
ro ra.. cr)
a)
4-1
6 a) 0 ro
E—I
Janu
ary
—Ju
ne
I I I fa P.
•
• P Wft P. 0 p. A MP f Wa p. • .
0 P. A.• Mw M .4 p.
Digest No. C701--Con.
4P rd fa 44 I 0 I I 44 • d4 dB 40 0 44
•• • • • 411 84 r4 Ca la 44 114 r4 r4
•• •• • • • • • • • • • • • • • • • • • • • •
PI w yr N I N I I I f P4 ea . . . .
wi 01 40 AP A
• • • • .• • • • • • • • .
g g ti; g 1 0 I 1/ 1/ ;110. • • • •
P. f4 44 P. 4) fa am P1 01
• • • • • • • • • • • • • • • • • • • • • • •
=2 =2 A gt :41 11 i • %, • 40 44 dr 44 44 a& pd
• • • • • • • • • • • • • . • • • • • • • • • •
44 .4 4, 0 I 0 I I I ..41
•: -'' 1.1 • • • •
P. V, 4# 0 ed1 P. 60 r4
.• .
O ^
...lrd I IP• I I I 0
M0• ea 0
• • • • • • • •
I • •
U.S
. In
tern
at
ion
al
Tr
ade
Com
eis
sio
a, e
xcep
t
Witt 's
lue
CO dr v4 44 fa
• • • • • • • • • • • • • • • • • • • •
I I I
13
41 44 4. 44 pa 1
71; 1; "4 . .
4.1 41 r4
• • • • • • • • • • • • • • • • • • • • C4 f 44 •1 I 0 I I I P. CP ma 41 .4 or • 0 4, rd
A Pa pd 141
44 4, 44 CP I 01 I FS P. dB 40 Ma rf 4• • '4 114 N
N • 41 A
• • • • • - • • • • • • • • • • • • • •
r4 a4 r4 411 I 44 40 1 I .4 v4 44 44 r4 CS CP ed oo on - - -
• f PI
• • • • • • • • • • • • • • • • • • • •
411. 0 4P 4014PIII O 00401 IA 0 •11 W$ ft • 0 411.
• • • • • • • • • • • • • - • • • • • • 0 P.
4P PI N 4I I I 94 I I I
• ed
4,
0 • dr p4
• • .• .• • •
• a •
• • 3
0
a0 • • • la OW•414.11.4 411 .44
.0 11 O. Y 14 • •4 • '0 41.0 • • .• a la • ▪ 21 ma MI re 0 a. 0 ”.
0
II
• • • • Ur.
N •
• • 3
• • •
0
N • 0 661
1161 • 0
• • • • • •
0 • 0 •-•
• • • • • •
•
• •
*ID • • O• • • 60 • • • • • • •
• • 0
v4 •
06 RI .60 0 •
AR ra 7:•" go 2 . aa• ■! II A 2 It A
• r •
• •
• • a.
• • •• • • ••
• O •
en 44 44, a, I r4 I I I 661 0 P. CP 4r
•• •• ,• •• •• •• •• •• •• ••
.4 44. 4. 0, I ed I I I • CV 1 •
• • • • • • • • - • • • - •
P. 0 I CP 44 p. 40 • C2 • .4 • 41 rd
A
• • • • • • • • • . • • • • • • • • •
• M dr 1.4 I .• I 14 • P. 4,• fa 40 0 ed
AB 40 4P 41, I 48 44 I I P. .4 14 04 0 A • 04
.4
•• •• ••
p • "...111411 0 1 I I
p. Croft N A .4
• • • • • • • • • • • • • • • • • • • •
fa 44 41P I I dB I I I 0 0 111 CO Pa 4, f4 RI


Pian
os (Republ
ic of Korea
)
item
num
ber;
descrip
tion; tarif
f ra
te informatio
n; U.
S. impor
ts in
198
2; competit
ive sta
tus
• N N
O. 03 0
14 0 O 14 0
a .4 ••
• • • • •
• • • • • • • •
0 • .1
44
0 0.
4 r1 .0
e
•
•
1. 0
0 • •
I4 0. 0
04
.0 OD 0
44 0 0 .0a
• 0
4.4 • • •
re1
• 0
•0 0 SO 0
03
co
4-I
CO
.4
CO
rl
In Cl
N co C.
al 15• ri
0 tO
Descr
iptio
n
a • ra
0 0 0 Ca C-#
•
0 •
0.1 • i. 0 a •
C4
0 .0
0 a 7
44 a
• • • 4..
• 0
fr • O 0. 0. VI 0
ri • .0
• Le Le
0
0 ri A r♦ 10 wre
ao rO .r1 • 04
• a 0 •
0 • •
0 • • re
• .0 0
0 0
m
• 0 00 a
*0* re CY0 .0
re1 • •
to 0 *
0
a to M a
a • •
0.1 M a
a • • .0 .0 - al 0
01 03 .-1
• 0 ri
.0 .0 • r.1
• .0 .4)
4) a • V • • C
0 'V 0 c 4.1
CO LI i i7 0 4
• 0. C • 3 LI0
a >
• at
• • • ‘44
• 10 ILI 4 11. •
' 1 0. 4. •
NI
OS
3%
N O. ntn ri
• 01 tO N r4
g g as
KK ca
In In
KK to In
DI 10 n.
Dt
00 CO
KK VI in
OD 00
instrumen
ts--
-;
4 • "
0 0
le■ ir%
Pa.

2
Digest No. C702--Con.
II. Comments
Description and uses
This digest covers pianos which are imported under TSUS items 725.01 and
725.03. Pianos are keyboard string instruments classified according to the
way they are strung. Upright or vertical pianos (TSUS 725.01) are strung
vertically within a rectangular case. Products entering under TSUS 725.03
include grand pianos, which are strung horizontally in a somewhat wing shaped
case, and harpsichords, clavichords and similar instruments, which are
precursors to modern pianos. Grand pianos comprised 95 percent of the
quantity of imports under TSUS 725.03 during 1978-82.
Uprights are grouped according to the height of the case. Those
traditionally used in the home include spinets, measuring 36 to 37 inches;
consoles, 38 to 42 inches; and studio uprights, 43 inches and higher.
Uprights for use in schools, churches, small nightclubs, and other
institutions usually range from 46 to 52 inches in height. Grand pianos
usually range in length from about5 to 9 feet, but can be as long as 11
feet. Grand pianos are used chiefly in the entertainment industry, although
the so-called parlor or baby grands are frequently found in homes. Grand
pianos are generally regarded as superior to uprights in terms of tone, tuning
stability, touch, beauty, and performance capability. Harpsichords and
clavichords are used in the performance of 16th to 18th century music.

Digest No. C702--Con.
U.S. customs treatment
TSUS item 725.03 became eligible for GSP treatment' on January 1, 1976,
pursuant to section 502(a)(3) of the Trade Act of 1974. TSUS item 725.01
became eligible for GSP treatment on March 30, 1980, pursuant to Executive
Order 12204. Since that time no beneficiary countries have been excluded.
U.S. producers and employment
Fifteen U.S. firms produced pianos in 1982; the four largest together
accounted for 72 percent of domestic production in eight establishments. In
addition to domestic plants, these firms own piano production facilities in
Canada, Mexico, Korea, the United Kingdom, and Austria. Another company owns
a subsidiary in West Germany. The other 11 U.S. firms operated 1 plant each.
Of the 19 total U.S. establishments, 9 were in the Midsouth (Tennessee,
Mississippi, North Carolina, and Arkansas), 5 were in East North Central
States (Indiana, Ohio, and Michigan), and the remaining 5 were located in New
York, Connecticut, California, and Utah. Domestic production of harpsichords
and clavichords is negligible. Industry sources indicate that the largest
harpsichord manufacturer employs from 4 to 6 people and produces 20-25
instruments per year.
All U.S. piano manufacturers make uprights, but until 1977, most grands
were supplied by three firms. After 1977, other producers began to place more
emphasis on the grand market, and by 1982, a total of seven U.S. producers
manufactured grands.
The production of pianos is characterized by a high degree of labor
intensity. Although assembly-line-type operations are used to a great extent,

4
Digest No. C702--Con.
the production process has not undergone significant changes over the years.
There has been an increase in the use of automated equipment, with a few
producers using computer-controlled machinery. Efforts toward automation have
been concentrated on production of upright pianos; however, the degree of
automation varies considerably among the producers.
U.S. employment of all persons in establishments producing pianos
decreased by 33 percent during 1978-82, from 6,089 to 4,059. The number of
production workers engaged in producing pianos also decreased over the period,
from 5,180 in 1978 to 3,244 in 1982, or by 37 percent, as plant closures and
layoffs were effected by some manufacturers. Production workers accounted for
85 percent of the workforce in 1978, but by 1982, they amounted to 80
percent. There was a somewhat larger percentage decline in workers assigned
to the manufacturing of uprights, compared with those manufacturing grand
pianos.
During 1978-82, the domestic piano industry experienced diminished
profits. Net sales increased by 4 percent from $257 million in 1978 to $265
million in 1982; however, operating income fell by 80 percent from $23 million
to $4 million during 1978-82, and net income declined from $18 million in 1978
to a loss of $3 million in 1982.
Overall, increased manufacturing costs and operating expenses in
conjunction with increased interest expense for maintaining inventories were
principal causes of the decreased profitability.

5
Digest No. C702--Con.
U.S. consumption and production
During 1978-82, apparent consumption of upright pianos fell from 234,024
units to 167,166 units, or by 29 percent; however, the value decreased only
slightly from $183.0 million to $182.2 million (table A-1). In terms of
quantity, the import penetration ratio increased from 7.9 percent to 14.3
percent; in terms of value the ratio increased from 6.7 percent to 12.7
percent. The share of apparent U.S. consumption of uprights supplied by
imports from Korea increased from 0.9 percent to 2.5 percent. U.S. producers'
shipments of upright pianos dropped from 215,574 units to 143,336 units, or by
34 percent; the value of such shipments declined from $170.7 million to $159.0
million, or by 26 percent. The decline in apparent consumption and production
of upright pianos during 1978-82 was due principally to a drop in demand for
smaller models, such as spinets, as consumers switched to higher quality
pianos.
During 1978-82, apparent consumption of grand pianos rose from 19,278
units to 20,143 units, or by 5 percent; the value increased from $52.7 million
to $69.9 million, or by 33 percent (table A-2). In terms of quantity, the
import penetration ratio increased from 49.7 percent to 70.0 percent; in terms
of value the ratio increased from 36.4 percent to 50.8 percent. The share of
apparent U.S. consumption of grand pianos supplied by imports from Korea
increased from 5.9 percent to 18.4 percent. U.S. producers' shipments of
grand pianos decreased from 9,703 units to 6,048 units, or by 34 percent; the

6
Digest No. C702--Con.
value of such shipments increased slightly from $33.5 million to $34.4
million. The increase in consumption of grand pianos is a reflection both of
the shift in consumer tastes to a higher quality sound and the increasing
availability of relatively low-priced grand pianos from Korea and
moderately-priced, high-quality grand pianos from Japan.
U.S. consumption of harpsichords, clavichords, and similar instruments is
principally accounted for by imports, which increased from 1,179 units in 1978
to 1,435 units in 1982. The value of these imports increased from $700,000 to
$1.6 million during the period (table C-3). These increases reflect an
increased interest in 18th century music.
U.S. exports
U.S. exports of pianos have traditionally consisted almost entirely of
uprights, which accounted for 98 percent of U.S. exports during 1978-82. U.S.
piano exports decreased during 1978-82, from 19,252 units to 11,681 units, or
by 39 percent (table B). The value of exports decreased by only 6 percent
during the period, from $14.1 million in 1978 to $13.3 million in 1982;
however, the average unit value rose by 55 percent, from $734 to $1,136.
Exports in January-June 1983, compared to that in January-June 1982, decreased
by 9 percent in quantity from 5,139 units to 4,666 units, whereas the value
decreased by 23 percent from $6.1'million to $4.7 million.
Important export markets during 1978-82 included Canada, the Netherlands,
and West Germany with Canada, the largest single-country market, consistently
purchasing about one-third of U.S. exports of pianos.
U.S.-produced upright pianos increased in popularity in foreign markets
during 1978-80 by 35 percent in quantity and 56 percent in value, before

7
Digest No. C702--Con.
decreasing by 50 and 43 percent, respectively, by 1982. The causes of the
sharp decline in U.S. exports of pianos in 1982 have been attributed primarily
to the effects of the worldwide recession.
U.S. imports
Upright pianos.--U.S. imports of upright pianos increased by 29 percent
during 1978-82, from 18,450 units to 23,830 units (table C-1); the value of
such imports increased by 89 percent, from $12.2 million to $23.2 million.
U.S. imports of upright pianos during January-June 1983, compared with
January-June 1982, decreased by 15 percent in quantity to 11,319 units from
13,361 units and by 10 percent in value,to $11.3 million from $12.6 million.
The share of imported uprights supplied by Japan (the largest supplier)
slipped from 77 to 76 percent, despite a 29 percent increase in quantity
during 1978-82; the quantity from Korea (the second largest supplier) more
than doubled and boosted its share from 11 to 18 percent. In addition, the
average unit value of uprights from Korea increased by 56 percent, and those
from Japan by 36 percent.
Upright pianos received GSP eligibility in 1980 and, during 1980-82,
total imports of upright pianos under the GSP increased from 528 units to
4,257 units. By 1982, such GSP imports accounted for almost 18 percent of
total imports. The value of these imports increased from $0.4
million to $4.2 million (table D-1). Korea was the principal supplier; other
suppliers were Taiwan, Israel and Hong Kong.
Imports of upright pianos from Korea with a polyester finish totalled
approximately 3,801 units in 1982 and 3,039 units during January-June 1983.

8
Digest No. C702--Con.
Grand pianos.--U.S. imports of grand pianos increased by 47 percent
during 1978-82, from 9,575 units to 14,095 units (table C-2); the value of
such imports increased by 85 percent, from $19.1 million to $35.5 million.
U.S. imports of grand pianos during January-June 1983, compared with
January-June 1982, decreased by 4 percent in quantity to 7,355 units from
7,628 units and by 2 percent in value, to $18.1 million from $18.4 million.
The share of imported grand pianos supplied by Japan (the largest
supplier) decreased from 82 percent to 71 percent, despite a 28-percent
increase in quantity during 1978-82. The share of imported grand pianos
supplied by Korea (the second largest supplier) increased from 12 percent to
36 percent as imports from Korea tripled in quantity.
Imports of grand pianos from Korea with a polyester finish totalled
approximately 3,344 units in 1982, and 2,850 units during January-June 1983.
During 1978-82, U.S. imports of grand pianos under the GSP increased from
1,147 units to 3,730 units; or by 225 percent. By 1982, such GSP imports
accounted for over 26 percent of total imports. The value of these imports
increased from $2.0 million to $8.1 million, or by 304 percent (table D-2).
Most grand piano imports entering under GSP were sourced from Korea, which
supplied about 99 percent of the quantity and value of such imports during
1980-82.
Harpsichords, clavichords, and similar instruments.--U.S. imports of
harpsichords, clavichords, and similar instruments increased by 22 percent
during 1978-82, from 1,179 units to 1,435 units (table C-3); the value of such

9
Digest No. C702--Con.
imports increased by 125 percent, from $0.7 million to $1.6 million. Imports
during January-June 1983, compared with January-June 1982, increased by 45
percent in quantity to 556 units from 383 units and by 43 percent in value to
$0.8 million from $0.5 million. Principal suppliers in 1982 were Korea, Japan
and the United Kingdom.
Imports of harpsichords, clavichords, and similar instruments under the
GSP increased erratically from 104 units to 803 units during 1978-82 (table
D-3). By 1982, such GSP imports accounted for 56 percent of total imports.
The value of these imports increased from $53,000 to $953,000. Korea was the
principal supplier; other suppliers were Uruguay, Brazil, the Dominican
Republic, Cameroon, and the Philippines.
Conditions of competition
Competition in the U.S. market for pianos is based on a variety of
factors, the most important of which are price; perceived quality in terms of
tone, tuning stability, workmanship, beauty, and durability; styling; brand
name; availability; and service. Each brand of imported and domestically
produced pianos has its advantages. Some imports offer price advantages over
U.S.-made pianos in some models, particularly grands. The continental styling
of uprights and the polyester finish used on both uprights and grands are also
viewed as an advantage for the imported pianos in appealing to a segment of
the market. Some piano purchasers feel that U.S.-produced pianos have a more
mellow tone, need voicing less often, and stand up to U.S. climate variations
better than imports; other consumers prefer the sharper tones of some brands

10
Digest No. C702--Con.
from the Orient. Imports are aimed at establishing market niches in the
larger, professional quality uprights and lower priced grands, and offer
styling and the polyester finish that is available only on a limited basis
from U.S. producers. However, when all of the factors are taken into account,
imported and domestically produced pianos are extremely competitive.
In addition, pianos produced in Korea benefit from labor rates lower than
those in the United States. This is a factor which is more significant in the
production of grands, and enables many Korean-produced grand pianos to sell at
wholesale prices significantly lower than those of U.S.-made grand pianos.
For grand pianos measuring from 5'6" to 6'1", the most popular sizes, the
Korean-made pianos were priced * * *
Demand for harpsichords, clavichords, and similar instruments is
essentially one for a relatively high-priced, labor intensive musical
instrument for use by classical enthusiasts interested in reproducing the
exact sounds of period music and as collectors' items. Although interest in
period music has increased, the instruments are purchased on a sporadic basis.

3.1'
Digest No. C702--Con.
Position of interested parties
The petitioner for removal of GSP eligibility for pianos from Korea is
the National Piano Manufacturers Association of America, Inc. (NPMA). NPMA is
an industry trade association comprised of U.S. firms which manufacture pianos
and supply piano parts, and whose members account for approximately 90 percent
of U.S. piano production. NPMA submits that continued GSP treatment for
pianos from Korea would harm the U.S. industry by maintaining an unnecessary
competitive price advantage for Korean piano manufacturers in the U.S. market.
Importers opposed to removal of GSP eligibility include Daewoo America,
Samick America Corp., and Young Chang America, Inc. These importers account
for nearly all the imports of pianos from Korea. Submissions by the importers
state that removal of GSP eligibility for Korean-made pianos would not benefit
the American piano industry. Korean pianos are most similar in styling to
Japanese pianos and any decline in imports from Korea would benefit the
Japanese who have greater brand name recognition. Further, the removal of GSP
benefits would injure the American consumer by restricting the availability of
less expensive piano models.
CONFIDENTIAL

12
Digest No. C702--Con.

13
Digest No. C702--Con.

14
Digest No. C702--Con.

15
Digest No. C702--Con.
Table A-1.--Upright pianos: U.S. producers' shipments of U.S.-made pianos, imports for consumption, exports of domestic merchandise, and apparent consumption, 1978-82
uantit in units• value in thousands of °liars• unit value in dollars
Producers' Ratio of imports to--
: • .Exports : Apparent : ;Imports shipments • :consumption: Consumption
: Producers'
Quantity
1978 : 215,574 : 18,450 : 18,481 : 234,024 : 7.9 : 8.6 1979 : 208,103 : 16,842 : 19,739 : 224,945 : 7.5 : 8.1 1980 : 168,080 : 15,605 : 19,345 : 183,605 : 8.5 : 9.3 1981 : 165,314 : 18,812 : 20,284 : 184.126 : 10.2 : 11.4 1982 : 143,336 : 23,830 : 11,217 : 167,166 : 14.3 : 16.6
January- : : : : : June : : : :
1982 : 76,129 : 13,361 : 4,935 : 89,490 : 14.9 : 17.6 1983 : 70.784 : 11.319 : 4,481 : 82.103 : 13.8 : 16.0
Value
1978 : 170,737 : 12,242 : 13,566 : 182,979 : 6.7 : 1979 : 177,718 : 12,513.: 17,082 : 190,231 : 6.6 : 1980- 162,112 : 11,405 : 19,245 : 173,517 : 6.6 : 1981 : 171,787 : 16,727 : 21,330 : 188,514 : 8.9 : 1982 : 158,986 : 23,172 : 12,739 : 182,158 : 12.7 :
January- : : : : : : June : : : : : :
1982 : 82,019 : 12,613 : 5,880 : 94,632 : 13.3 : 1983 : 80.232 : 11,278 : 4,484 : 91.510 : 12.3 :
7.2 7.0 7.0 9.7
14.6
15.4 14.1
Unit value
• 1978 : $792 : $664 : $734 : $782 : - : 1979 : 854 : 743 : 865 : 846 : - : 1980 : 964 : 731 : 995 : 945 : - : 1981 : 1,039 : 889 : 1,052 : 1,024 : - : 1982 : 1,109 : 972 : 1,136 : 1,090 : - :
January- : : : : : : June : : : : : :
1982 : 1,077 : 944 : 1,192 : 1,057 : - : 1983 : 1,133 : 996 : 1,001 : 1,115 : -
Source: Producers' Shipments of U.S.-made pianos, compiled from data submitted in response to questionnaires of the U.S. International Trade Commission and from data supplied by the National Piano Manufacturers Association of America; imports compiled from official statistics of the U.S. Department of Commerce; exports compiled and computed from official statistics of the U.S. Department of Commerce.
Year
shipments •

16
Digest No. C702--Con.
Table A-2.--Grand pianos: U.S. producers' shipments of U.S.-made pianos, imports for consumption, exports of domestic merchandise, and apparent consumption, 1978-82
(Quantity in units; value in thousands of dollars; unit value in dollars)
Ratio of imports to-- : Producers' • • : Apparent : Year 'Imp rts ' : shipments :
Exports -43 :consumption: : .Producers' : Ptoducers'
• •
• shipments
• •
Quantity
1978------: 9,703 : 9,575 : 771 : 19,278 : 49.7 : 98.7 1979------: 9,940 : 10,347 : 822 : 20,207 : 51.0 : 104.1 1980---- 8,222 : 9,754 : 806 : 17,976 : 54.3 : 118.6 1981------: 7,978 : 11,284 : 840 : 19,262 : 58.6 : 141.4 1982------: 6,048 : 14,095 : 464 : 20,143 : 70.0 : 233.1 January- :
June--: • 1982----: 3,505 : 7,628 : 204 : 11,133 : 68.5 : 217.6 1983----: 2,879 : 7,355 : 185 : 10,234 : 71.9 : 255.5
Value
• 1978 33,520 : 19,147 : 565 : 52,667 : 36.4 : 57.1 1979------: 40,395 : 22,396 : 712 : 62,791 : 35.7 : 55.4 1980------: 39,565 : 20,080 : 802 : 59,645 : 33.7 : 50.8 1981 41,110 : 26,812 : 889 : 67,922 : 39.5 : 65.2 1982 34,398 : 35,469 : 531 : 69,867 : 50.8 : 103.1 January- :
June : • 1982 : 18,470 : 18,439 : 245 : 36,909 : 50.0 : 99.8 1983 : 16,959 : 18,056 : 187 : 35,015 : 51.6 : 106.5
Unit value
1978 $3,510 : $1,948 : $733 : 2,732 : - :
1979 4,044 : 2,165 : 866 : 3,107 : 1980 4,812 : 2,059 : 995 : 3,318 : 1981 5,123 : 2,376 : 1,058 : 3,526 : - :
1982 : 5,688 : 2,516 : 1,144 : 3,469 : - :
January- : June :
1982 : 5,270 : 2,417 : 1,201 : 3,315 : 1983 : 5,891 : 2,455 : 1,010 : 3,421 : - :
Source: Producers' shipments of U.S.-made pianos, compiled from data submitted in response to questionnaires of the U.S. International Trade Commission and from data supplied by the National Piano Manufacturers Association of America; imports'empiled from official statistics of the U.S. Department of Commerce; exports compiled and computed from official statistics of the U.S. Department of Commerce.

O O.
0)
CO W co
N O
O •• •• •• ••
r, O.
N • O
UI
••••
O. 4.)
03 La
U
•• •• •• ••
••••
•• O.
• •• •• ••
O) 111
O
U
E
U
•••
I. OM 00
•10 In
• 0
•
• .111,
it• O
tes VI CO
4.)
x
• •• •• ••
W
• , CO ' N " N
• L
•
'0 C
'co •• ••
•I• • a,
CD Y
111 -
a
I-
17 Digest No C702--Con.
03 VI N N UN V) PI sr N UN N Pl SO N. CO ap V.- .-MN
•• •• •• . •• •• •• •• •• .•
SS C) c0 CD 41 Ps 01 UN pl .O T 01 in an rn vt m .1 N
•• • • •• •• are •• •• •• ••
CS CD 41 CD N un 4r no NHS NJ.t CO CD •t) CO .1 03 NI )I1 01 0* .1 •O'
• • • • •• • • • • -• • • •• ••
WI sr In .- CD NN Sr CO an pl CO .0 1. os so rh N UN CO MM
sO .- 04
▪ •• •• •• •• -
O4 CD si) N sr UN sa, V2 st UN CO N UN CO N
Os N .7 *1 ul CD cD N
4.• fg v■
•• •• •• •• •• •• •• •• •• ••
.- CO cD CD ON CD 00 sD UN UN sD cD M.- ON CO UN CO so NS CD N.-
Sr 04' .-N
▪ •• •• •• •• •• •• •• ••
• P Nr N UM on Vi sT CO 03 .0 SO O• .00 43 pI •iy, N PI N 42 .-
I I I I I
I I I I I
I I I I I
I I I L •-)
I I 0
0 E .4 J: 4+ 40 13 L 0 W cn w 4+ 0
• 3 ^40LICI.C4.1 . 0 I-0 J: CO •- W 4, •C
C 4, X CC Id 0 ■4 COWL0400 L .4
z U. 2: -7 a - 0
N CO C. V) CD NN .- N cD III v2 gl st Ch 03 ul .- el 04
•• •• •• •• •• •• •• ••
CD u1 01 CI uN CO CD 01 uN pI UN so .- sr vs. 111 PI
•• •• •• •• •• •• . . • •
Ps 01 ul Ps N CO ND Ps ND N. Iv M N cr. op .- N co sD sD sO N gf
.- .- an .- 4r O.- N O. C• 4. UN WI ND UM PI CD CO CD 4- Sr
.O.- 04 04
• • • • • • • • • • • • • • • • • •
oNs vr O. "I' MO SD .- CD N Ps CO Is CO in N .O .O O. an Is
O IV
• • • • • • • • • • •• • • •• • • • •
CO .4P OK UI .P 00 sr Ps co .4r on OS N N 4r TM.- PI UN CD .ON
01 .- 04
•• •• •• •• •• ••
1, so 04 CD N an .- c) .- CD P1 Ps 4' 03 Ch CO UN sr N 01 N uN NN
WI
I I I I I I I I I I I I I I I I I I L .4 I I I 0) 0 ul E .-1 .c •I••
O 13 L 0 CO en w 44 o • 2 -4WUCILCUO I- O J: CD -- W 4, .... C c 4., X a IA tid 40 •4 CO01.000 I- .4 C2 0: U. 3C -2 .4 O LL .0
so UN CD ru M 04 Ps 01 in CD CO N NN UM N an CD an • . • • • • • •
✓n a. Ps CD sr an CO pI MO N Ps Ps CD on so TO Ch c• in us CO 47 4o
•• •• •• •• •• Oa •• •• • • ••
CO O. N *1 sr ON in UN 411 CD .- UN on OS CD 40 • • • • • • • •
Ps CS OD NO VN N. .- ND CO UN CD .- OS 03 CD On CD an N cD N w-
.■ 0
•• •• . •• • • •• •• •• •• •• •• ••
stl CD Sr sr sO 00 N • ps so On aD Sr Sr • • • • • • • •
CO 04 Sr OD .- PI C3 a CO C, N 0. *1 re) ch CD On On 40 Ps .- CV .-
4o
•• •• •• •• •• •• •• •• ••
Sr N F- UM o in PI ND V2 N. sr VD N PI v. fg • • • • • • • •
v■ op 6, Ns sr 01 cD Ch 00 O 0 UN sO so sD st U1 Os Co an un st 0 0 0 co
•• •• •• •• ••
N N.- CD ND Ps N 01 On CO 4' UM UM PI CO CO • • • • • • • •
an .- CD Sr ND CD un .- sr Ps 00 CD ON CS PM CD N Oh CP CO CP UI CV O. eh CD CD O. 40
••••
•• •• •• •• •• •• •• Oa, •• •• • • ••
UM UN sr sr C2 .- 0, 04 uN 04 CP. n.0 cD 01 On N 'a sr • • • • • • • • •
sal sD N rI S ON on ps in
Ps CD CD Ps ul .- OD uN NO CO p. 02 so *1 a N CD CO CO
ft
w■ e■ m■
•• •• •• •• •• . •• •• ••
03 UN Is st UN 4' sO 00 OD CD • C) PI I. .t N C• .T CD • • • • • • • •
CP *3 .- u) of
sr O. MI C• N. N c) nn UN CO N CD Os OD Ps CO N
I I I I I I I I I I I I I 1 w I I I L. 01 I I I w
E L ▪ 1:1 6.0 o
-
cno4, w • 3 .44UUCLCUO
.
•
0 CD -- C C 4, X O. 2C M ■4 COML.00= L .4
0
C =
3s 4'
C . co
0 .4 .4 0
a O O
.4
0
4,
C
O
O.
St O
in
CO
O
CO
•• • •• •• .6 •• •• •• •• •• •• •• •• •• •• •• •• •• •• •• •• •• •• -•• •• •• •• •• •• •• •• •• •• •• •• •• •• •• •• •• ••
Department of Commerce.

18
*0 0 sO NI' 1 w 1 Pi • Cs. 1". •43 cf1
Cs. Cel
•• •• •• •• •• •• •• 00 ••
• aD ND S r4 I rec O N 040 re/ PA O
O •••
00 • • •• • • • • • •
ON No Nr Ps .- CO CJ .- CD P Ch Ps st 4. WI .P CV .-
O S
•• •• •• •• 00 • •
Ca 03 02 141 I sO • .- UN PI P. P. UN VJ
N
•• 00 I. 00 •• •• 00
%TAT IN) eu 1 02 o 03 03 ND Lin Nr M a2 N st CV O qr.
•• •• •• •• •• •• •• • • 00
• Ps 03 I CO uN ,st C) C4 4, N N .D CD MI
• • 00 •• • • . . . . 00
N ND P. in w PI P. 50 0. .0 EC 4 .- NI* eu pl
O .-
N O
N CO 0.
•••
CO 0.
O co
• • •• •• ••
• U
• • • O U
0
4' C 111 •
40
• 0. • a
• Pa 40 .
16, 0
CI
•
40 •
U •
sc. •
• 0
*O-
M • -I
• O ca
• U ti
y principal sources, 1978-82. January-June
imports for consumption.
N CO
• 1. = • • •• 00
•
0
C I
0*
• •••
• IJ
.0 O1 )
•• •• •• •• O. C 7 CO
1 O/
1 L.
0 • ci)
0 CES
Ps Ns •T 42 0 O. On • Pl 03 W) CV V' 4*
•• •• •• •• •• •• •• • • • •
• os PI P. Ul 44 CD N N CO uN •- cn 0 4
•• •• •• 00 011 •• •• 00 90 ••
P. ml 03 03 st 0 S IV .- N ml PI PI co re) N Cs/ NO
ft 07
•• •• •• • • •• •• •• 0. •• ••
• um O cw o. CD 0 • 10 el w m■ m- Ve 03 v2 .-
S eu
• • •• • • • • •- • • •• • • •• • •
0 CD un S C) CO .0 Cf CV ch .0 qr .■ S eV Pl UN PI
PI
• . • • • • • • • • • • • • • • ••
CO N P. CO CD Pn .0 P. NO V) st 03 al al P. N PI 03
pl
•• •• • • • • •• • • •• • • •• ••
.- cc) No pl .- 0 UN 141 qe 03 1.0 OJ • CD CD
st N r4
1 1 1 1 1 1 1 1 1 1 1 1 1 1 1 1 1 1 1 1 1 1 1 1
I 11 1 1 S. ••/ 1 11 MOM 0. E 13 10Y in 4: 4.1 • Cn L. C 04+ 0
C OC C 001. 111.w 0 • .. 0 .4 CL CL L DE C PI O 0 L. .■ J: • .4
04 :3 LL IL 4C C) 2C 4C
I 1 1 1 1 1 1 1 I 1 1 1 1 1 1 1 1 1 1 1 1 1 1 1 I 1 1 1 1 1 ` -. I 1 1 1 1 1• o O. 6 'CI • •0 u1 .0 40 • 01 L C 40 0
C oc C • W L. 5 .4 0 1- • •-0.-4 +0 C.0 0. L7t C • 0 L. .0 • .*
bd u. 41C
Digest No. C702--Con.
CD eh .0 UN I Os I hl M un P. al N .0 • • • • • •
• ■C %, Ur M S WI P. Lm ul 01 Os 0 M. w C2 CO UN
EP
▪ • • •• .
pl Ws b Ch CD P. I C) Pl c. 0 MI .0 CD • • • • • • •
• P CD P s0 .- CO P. sO UN al 01 va CO Os O•wwNM 4 40 •
N N
• •• 00 00 VP •• PO ry ••
ON CD VD ht 00 03 Nt Cp CD VIN 03 w Nt P0 Sr • • • • • •
• CO P. MI UM an %r
N • Ch 40 V) O CD PI 4? 00.w UN 0 No N,
.••w
▪ N N •••
•• •• 00
•P.
MC EN CP. CO N *0 I PI P. NO 0) 101 04 PI
• • • • • • • UN OS 4. C• P. C2 PI • Ca ON un UN CN OS cw uN 0 ri UN CO
N
IA O O
•• at •• •t •• •• er OP et
O. P. I IN op 0 0 V) nt eV No • • • . . • N UN st M OS sO p. Lm ru Ne 44 P. P. w CO 0, NO UN
•• •• •• •• ••
• eg NI' CP I 0 NO Nt Cp UN e4 NO CD 0' 01
• • • • • •
eu uN p. o7 p 0. No CD PI P w iff UN OA 03 P. cw MAN N0
• *9 •• •• e• •
WM ON 0 0 WM 04 MN P0 ▪ eV 0) C7 CD on UN U1 WM • • • • • • • • •
. 0 No .. p. pN pol qt ND .0 Ch a. P. 4. CO P.Ow Pi siD 42 mv V, 41
1 1 1 1 1 1 1
1 1 1 1 1 1 1 0 1 1 i 1 1
1 1 1 1 1 1. 01
0. • • .c • 01 1. C •••• 111
Ca COW1.10 04 0) • 4- LO 40 C < 0. C. 01g C • 40 •••1 10 0 If. •••• o •C • •4
. 7 WO :2 U. U. oC t) 1g
VI
C
C
a Unit valu
e
Nt
O• CP•
a
O a
a
OS •
N 4
•• •• •• •• •• . •• •• •• •• . . • •• •• •• •• •• •• •• •• •• •• •• fro N •• . op •• N •' ••

111. Ps Nr N AI AI eu Nr ON CD la PA O.- N .- -.
•• 00 00 00 •• •• 00
CO N Nr 03 CD N CD 40 CO Al un an .-
rm in
•• •• •• •• •• •• 06 00 00
▪ CN Ul Jin NM IMAIOONA1 CA
•• •• •• •- •• •• •• ••
N ND Nr Cr UN N PI UN CD P. UN CD CD Ps w-
CD
•• 00 06 06 •• •• •• •• 66 ••
IA CD Al Or Cr AI in D ak 0 OD P. In .- N • r-
an .-
e• •• •• 60 00 e• •• ••
• cp M ar ON PI CD in OS U3 N st N. sr rl 00 Al
0 -I
O 0
o • •• 6. •• •• •• •• •• •• ••
Ps an N No ND 0.O NO OD Al ND N .• ND ea .-
a+ C O
.4
•• •- •• •• •• •• ••
•• -• •• •• •• •• •• •• 0.
CP.
C.1 PI. Nr P. P. N i um CD un rm .- CD in • ND NO 111
ND
•• •• 00 00 •• 6. •• •• •• ••
ND Al A. P. oD rm un In ar CI• Al ND .- rl Or Nr Nr
NO •••
19
ND ND CD .- ar N NOM w- ND ar No re)
O .- Nr rm
C3 VD
•• •• •• •• •• ••
▪ Nr eu 4- el 03 CD C4 Nr O O. un M N CD ar un
Nr
CD CO CD P. tor J p. • OD 0 01* Nr CD CD PI NO N
UN OD N
MI AI AI 42 VD Al M O Ps C) Al r. 03 UN rt 111 UN a Cr
C3 in mo■
N
•• •• •• •• •• •• 66 00 ••
•• •• •• •• 06 •• •• •• •• ••
w- U3 Nr \ 1 CD to P. UN Al rq P. CD ar No .-
Nr N
a
C
.4
•• • •• •• •• •• 1.0 06 00 06 be
• • •• •• •• •• •• •• •• •• ••
an P ar PI CO O0 N OD ND O N OM.00M .o N • • • • • • • • •
CD IA ONO 4. ra cn nq NO .4p co 0••1111 00 N a 0 - n, cv 4- op .D r-
Al CV ND ND un .- ea 411
•• •• •• •• .• .• •• -• •• ••
UN N A') 0 10 PI Or 4- ND OD CV *.3' C3 MI ON • • • • • • • •
C3 .0 ON UM NS 4. CD OD O P. NO CD .- ND Or UN Nr CD CD P. ND P. ND
■ ■
N Al Ps N U3 Nr 410
MI SD ON .- N C3 MI um O. 00 ND ON CD MI CO • • • • • • • •
Ps ON ak O eV •0 ON P. CO .0 iwn 111 w- 00 0 CD un P. NI CD 03 4D N N NO OD OM .......
0.1 A. CV NO .- 01
•• 0. •• •• •• •• 00 •• •• •• •• ••
••
Ce•
In •
N
ON C3 P. 0 ND CD I CD • Nr Nr o0 OD • • • • • • •
00 P. 1111 CD rl CD N
w- Cr P. 03 A. CD Al 111. OD Nr P. P. IA
UN Nr Nr
•• •• •• •• •• •• •• •• •• •• •• ••
43
• CO
O
M N
•
U
aai
0 C)
O
C
4.1
0.
0
• t.n
•
'C
4- O
4,
.4
4- 4- O
O
O •ID co a to
C 0. E
.0 0
.0 I • • • • • • • •
C O
0
0. Or E 0 In C a
•• •• •• ••
0 4-
'0 C
C L CO
0 N
C$ E-1
U 1..
0
Digest No.
C702--Con.
ar .- CD P. C2 00 CD CD CD op 03 N cs.1 03 .- 0 Cr
• • • • • • • . N 4- CD Nr P. UN CD Ps Nr 43 rn rel PI .0 CV to un un to CN ON ON UN um un ar . . . .
st 0')
O Nr rm J op CD 0 1 rm ar Ps ND ND CD CD 1M • • • • • • •
. . Or P. UN ND .- UN Oa un CD N CD an ar CD 43 Or Or ND rl PI rl M. P.
UN PJ SP. a'
•• •• .• •• •• •• •• .•
03 CSI CD .- P. ND OD 1 Ps ts ts un un P. eu VD CD 4• • • • • • • • •
Ps 01 OD ra so rm op n ON r- un rm .- CD P. CD • Cr OD N. Or PI CD P.M .00•
ft
• •
•• •• •• •• .• . •• •• •• •• .• .• •• •• •• •• •• •• •• •• •• •0 6• •• •• •• •• •• •• •• •• •• •• 1111 I I I 1111 1 1 I 1111 I I I 1111 $ 1. .-I
1 0 0 CL E W I. 4.1 4.1
L • ■ cn O W 4.1 0 C OCCOLC 0010 01 CO 4d.- E 4 c CL L IA be 1. W •- ▪ 12L0 CUL. J: .4 -)Y LLQO CD LL L) 4t
I I 1 I 1 1 1 1 1 1 I 1 1 1 1 1 1 I I I 1 1 1 1 I 1 L.4 1 1 1 1 1 01 0 O. E 0 1. .1J .0 41 0) L. 01 0 0) J., 0
C IM 0 1. C U CO 0 I- a 0.1.1 ..-ECC O. 1. IA Se 1. CO •- .4 CO 0 L. 0 IA L. .0 .4 n ad u. 4 = CD U. C.) NC
I I I I I I I I I I I 1 1 1 1 1 1 1 1 1 ID 1 1 1 I 1 L. cn I i 1 1 I W CO CL E 01 L. .1.1 4: L. CU L. .- CACI 0 4.1 W
c OCOL.0 UMO> CO 0 4.. ...... E C C AC CL I. 111 3C L M ... .4 M 0 11.= Oli. J: .4 'I 31C U. 4C :7 CD U. C.) 4C

Deportment of Commerce.
•
.0
4- O
U
44 a
U
4. 4. O
0 1. M.
17
0. 5 0
U I.
O U1
G . C
U
C
cs
N O CP.
• •0 M
C
•
NI
7 cn
COI
W I CO >,
• ;el
T
E T.4 C CO
• 0 C CO C■1
I On 0
U •cl
cr, o .c
CO
U
On
O -c
O.
•
0.1
.o
61 U
0 ui
20 U, un - un -. I ND Q0 .. rn r. rn
I. 1....1 N CO C• On 00 I ,r1 ... so 0 NO .. 43
...T
.42. 00 .4 r, .. N .-1 .. c.
¢ 0 un OD N CD CO r, I n 00
011 131 .O en . . • • . . . .
1 -a sa N aD CD Nso en -.1' i e.. ,T Cn un CD .• •• rn 0
r4 cv C. CD 03 00 ON OD ...1. . . . . .
...• ..+ rss en -a- .••
Unit
valu
e
00 Oe C C en I est I S.0 T. a, U,
rn N N .0 rn CD CO 00 eg 00 rsi
NI wm 03 cD aD rsi OD un
so IN
• N1 CD ON .0 cD un CD un r- N
CN N M N un rl un CD 4.1- v2 OT r4 .1 sr 4-
st CO 0 O. in to .0 ct C) nT 03 03 • .-
11111 11111 11 1 1
I I I 1 1 1.-4 I I I I 101 0 O. E In 01 DC 4: 4+
ON 6. CO 10 .4 4+ 0 COCCWID 11.010
-- •L 4, C C. CL Y C 4, la -4 O M 1.60024: AC -I :3 U. CD 3: 4 CA 4C
un o n0.p I I r, en en N en
M co Sr .- M cD 00 r-un cD N- N N .- Cr, .r
CD rn NI. .0 I NO CV • CN un rl rn
rl CP. .1 I. 03 1 u1 I Ul N r, un N
• P ul N. CV I O nt N nr
U1 IN
•• 0 • •• • • • • • • • • • • • •
rl 00 n1 rl 46, nt I MOW) a• 03
I I 1 1 1 1 1
1 1 I 1 I
I I I I I I I L.
I 1 I • CO O. E N • Z •C • 01 I. • 4, 0
oc C C • 13 •-•. I. co o
of - CU CO •C C I. 0.Y C 40 Ul ••••• • ■ 0 • 1.8 • 0.0.-4
Z4 GA 4C
44 0000 I CD 1 r.0
CD v1 CD 0 CD C) so aq • • • • • • -7 TOO CD CD VD 00 • In so CD CD CD so eq
c■ -.7 0 0 Lel •-4
▪ CNI 4,0
0, ,0 Ch CD r. CD N :r M ca .1 4' 1• Ps ul Lin 4D In. na • • • . • • • •
v, ,r cD 4 ul 00 N GO un ■••■ CO ▪ ,r Cr. cD r4 r N ••■ CD
PI NI un 4 AM
U10. .- 00 N I CD rn rn • ,r ru .- an •0 O rn r4 . •
CO un rl CD NOON NI on M ... 00 .- r4 .r 611 • ru r4 .- O. rl 00 PI
v. MS NI AM
C) P. U1 st OD 1 03 0 a) 6.1 n On 0 • • • • • •
I. I. CI v) P nt CO 0 ws r. CO O-r- CU CD n1 .- 40
N
• • • • •• • • • • • • • • •• •• • • • • • •
C) CO C) N 03 P. CD I C3 no Ul 03 u1 O. N • • • • • • • M M tn 04 UN .- 42 Sr Ch N r u1 r 04 P. 01 N N 0 ,r ,r 40 4- N .4
11.0
N an um N CD 11 I nt CO CO.- u1 c4 4- • • • • • • •
In 43. 04 0 4. O. Ch Or AA Ch MM co U1 0% m■ w. 04 O
N
I I 1 1 1 1 1 I I t 1 1 1 1 1 I 1 1 1 1 41 1 I 11 I C. 01 I I I I I co • 0. II vo • E .c s. O 01 L. • 13 ..- 40 0 Og C C 0/ 13 ..4 6. • o v
• •,-, 1.5 •L .1., c 4 L o. iC C 4+ la ••• .4 O 0 lip el 0 3 .0 .4 ac -s = E. I.,1 Z ,1C 1..) 4
M
41,
.0
• • • • • • • • • • • • • • • • • • •• • • • • • • • • • • • • • • • • •• •• • • • • •• •• SO •• 00 00 •• • • •• • • • • • • • • •
Quan
tit
y (unit
s)
k.rn Un
Valu
e (1,
000 dollars
)
CO

21
Digest No. C702--Con.
Table D-1.--Upright pianos: U.S. imports under the GSP, 1978-82, January-June 1982 and January-June 1983
Source • 1978 • 1979 • 1980 • 1981 • January-June--
1982
Quantity (units)
Korea : Taiwan : Israel- : Hong Kong-- :
Total :
- • - • - : - • - •
- : -: - • - : - :
510 : -:
18 :
- : 528 :
2,641 :
- •
5 :
32 •
2,678 :
4,220 :
34 :
3 :
- :
4,257 :
1,889 : -:
3 :
- •
1,892 :
3,428
3,428
Value (1,000 dollars)
Korea : Taiwan--------- Israel : Hong Kong- :
Total- :
- : - : - : - : - :
- • - : - • - : - :
395 :
- :
27 :
- : 422 :
2,493 :
- :
7 :
15 :
2;515 :
4,199 :
42 :
5 :
- :
4,246 :
1,828 :
- :
5 : -
1,833 :
3,325
3,325
Unit value
Korea Taiwan Israel Hong Kong
Average
- : - : - : -: - :
- : - : - • -: - :
$775 •
- :
1,500 : -:
799 :
$944 :
- : 1,400 :
469 :
939 :
$995 :
1,235 :
1,667 :
- :
997 :
$968 :
- : 1,667 :
- :
969 :
$970
970

22
Digest No. C702--Con.
Table D-2.--Grand pianos: U.S. imports under the GSP, January-June 1982 and January-June 1983
1978-82,
Source 1978 • 1979 • 1980 1981 : 1982 : January-June--
1982 ! 1983
Quantity (units)
Korea : Taiwan :
1,147 : -:
1,080 : 841 : 1,686 :
-: -: -: 3,716
14 : :
1,529 12
: :
3,153 2
Total : 1,147 : 1,080 : 841 : 1,686 : 3,730 : 1,541 : 3,155
Value (1,000 dollars)
Korea : Taiwan-- -
2,011 : -:
2,054 : 1,593 : 3,475 :
-: -: -: 8,088
26 : :
3,494 21
: :
6,069 3
Total 2,011 : 2,054 : 1,593 : 3,475 : 8,114 : 3,515 : 6,072
Unit value
Korea : Taiwan :
Average :
:
$1,753 :
- :
. . .
$1,902 : $1,894 : $2,061 :
- : - : - : $2,177 1,857
. : : $2,285 1,750
. : :
$1,925 1.500
1,753 : 1,902 : 1,894 : 2,061 : 2,175 : 2,281 : 1,925

23
Digest No. C702--Con.
Table D-3.--Harpsichords, clavichords, and similar instruments, n.s.p.f.: U.S. imports under GSP, 1978-82, January-June 1982 and January-June 1983
Source • : 1978 .
• 1979 • 1980 • 1981 •
January-June-- 1982 .
• .
1982 • 1983
Quantity (units)
: : • . • : Korea : 104 : - : 4 : 51 : 803 : 118 : 365 Uruguay : - : - : 3 : - : - : - : - Dom. Rep : - : 500 : - : - : - : - : - Brazil : -: 1 : -: -: -: -: Cameroon : - : — : - : 152 : - : - : - Phil. Rep - : - : 7 : - :
Total : 104 : 501 : 14 : 203 : 803 : 118 : 365
Value (1,000 dollars)
Korea : 53 : - : 3 : 56 : 953 : 135 : 447 Uruguay : - : - : 7 : - : - : - : - Dom. Rep : -: 5: -: -: -: -: - Brazil : -: 1 : -: -: -: -: Cameroon : - : - : - : 1/ : - : - : Phil. Rep - : - : 1/ : - :
Total : 53 : 6 : 10 : 56 : 953 : 135 : 447
Unit value
Korea : $510 : - : $750 : $1,098 : $1,187 : $1,144 : $1,225 Uruguay - : - : 2,333 : - : - : - : Dom. Rep : - : $10 : - : - : - : - : Brazil : - : 1,000 : - : - : - : - : - Cameroon : - : - : - : - : - : - Phil. Rep- : - : - : - : - :
Average : 510 : 12 : 714 : 278 : 1,187 : 1,144 : 1,225
1/ Less than 500.
Source: Compiled from official statistics of the U.S. Department of Commerce.


APPENDIX A
U.S. Trade Representative Request of July 21, 1983, for Probable Effect Advice

THE UNITED STATES TRADE REPRESENTATIVE
WASHINGTON
20506
July 21, 1983
The Honorable Alfred E. Eckes, Jr. Chairman United States International Trade
Commission 701 E Street, N.W. Washington, D.C. 20436
Dear Chairman Eckes:
In accordance with sections 503(a) and 131(a) of the Trade Act of 1974 (the Act), and pursuant to the authority of the President delegated to the United States Trade Representative by sections 4(c) and 8(c) and (d) of Executive Order 11846 of March 31, 1975, as amended, I hereby notify the International Trade Commission that the articles identified in Part A of the attached list are being considered for designation as eligible articles for purposes of the United States Generalized System of Preferences (GSP), set forth in Title V of the Act.
Pursuant to sections 503(a) and 131(a) of the Act, I request that the Commission provide its advice, with respect to each article listed in Part A of the attached list, as to the probable economic effect on United States industries producing like or directly competitive articles and on consumers of the elimination of United States import duties under the GSP. The Commission, in Investigation No. TA-503 (a)-7, recently submitted advice on several items in the attached list. In these cases, it will be necessary to submit new advice only for those items for which the Commission would now modify the advice reported in that investigation.
In providing its advice, I request the Commission to assume that benefits of the GSP would not apply to imports that would be excluded from receiving such benefits by virtue of
A-2

2
the "competitive-need" limits specified in section 504 (c) of the Act.
At the direction of the President, pursuant to section 332 (g) of the Tariff Act of 1930, I further request, with respect to each article listed in Parts B and C of the attached list, that the Commission provide its advice as to the probable economic effect on United States industries . producing like or directly competitive articles and on consumers (1) of the removal of articles in Part B of the list from eligibility for duty-free treatment under the GSP and (2) of the removal of the GSP duty-free status from articles in Part C of the list which are imported from the respective countries specified.
Section 504(d) of the Act exempts from one of the competitive-need limits in section 504(c) articles for which no like or directly competitive article was being produced in the United States on the date of enactment of the Trade Act of 1974. Accordingly, pursuant to the authority of section 332(g) of the Tariff Act of 1930, I request that the Commission provide advice with respect to whether products like or directly competitive with those described in Part A of the attached list were being produced in the United States on January 3, 1975.
Under the provisions of the Act, the Commission has six months to provide the advice requested herein on Part A of the attached list. However, it would be greatly appreciated if all of the requested advice could be provided by November 15, 1983, in order to permit that any action taken on these items be included in the Executive Order which should be issued in March 1984.
WEB:stmbw

OFFICE, OF UNITED STATES TRADE REPRESENTATIVE A-4
Notice of Public Hearings
Summary: The purpose of this notice is (1) to announce the acceptance for review of petitions to modify the list of articles eligible to receive duty-free treatment under the Generalized System of Preferences -(GSP); (2) to announce the timetable for public hearings to consider petitions accepted for review; and (3) to announce that the list of articles herein is to be sent by the United States Trade Representative to the United States International Trade Commission with respect to designating articles as eligible for GSP.
I. Acceptance of Petitions for Review
Notice is hereby given of acceptance for review of petitions requesting modification of the list of articles eligible to receive duty-free treatment under the GSP, as provided for in Title V of the Trade Act of 1974 (19 U.S.C. 2461-2465). These petitions were submitted, and will be reviewed, pursuant to regulations codified at 15 CFR, part 2007.
1. Requests for "Graduation" of Products from Countries
As part of this product review, a special effort will be made to include on the GSP list products of interest to low income beneficiary countries. In addition, requests to add products to or remove them from the list of articles eligible for GSP duty-free treatment will be evaluated in accordance with the "graduation" policy. In considering GSP eligibility for products, limitations on GSP benefits will be considered for the more economically advanced beneficiary developing countries in specific products where it is determined that they have demonstrated international competitiveness. This approach will help to ensure that a greater share of GSP benefits is reserved for less competitive beneficiaries. Three criteria will be taken into account when any such "graduation" action is considered: the development level of individual beneficiary countries, their competitive position in the product concerned, and the overall economic interests of the United States. The GSP Subcommittee will review information for the relevant United States industry as enumerated in 15 CFR 2007.1 (5) when considering the removal of any beneficiary developing country from GSP eligibility with respect to a specific designated product or from proposed GSP eligibility with respect to a petition requesting the designation of a new item.
Product designations announced at the conclusion of the review process, therefore, may be made on a differential basis. This means that certain beneficiary developing countries may not be designated for GSP benefits on certain products even though those countries are not excluded under the competitive need provisions set forth in Section 504(C)

A-5
(1) of the Trade Act of 1974, as amended. It also is possible to withdraw GSP treatment from certain beneficiary developing countries rather than remove the product entirely from GSP coverage. The competitive need limitations of the program will continue to apply to countries remaining eligible for GSP treatment with respect to particular products.
The implementation of this policy is designed to provide increased opportunities for less developed, less competitive beneficiary developing countries to benefit from GSP treatment. In accordance with U.S. trade policy toward developing countries, this action is designed also to promote continued graduation of more advanced developing countries from GSP benefits in products where they have demonstrated competitiveness. Over time, such action should provide a more balanced distribution of GSP benefits among developing countries by helping to shift more of the program's benefits to the less competitive developing countries.
For additional information on this policy, refer to the Report to the Congress on the First Five Years' Operation of the U.S. Generalized System of Preferences (GSP), transmitted by the President of the United States on April 17, 1980. A copy of the report is available for inspection at the GSP Information Center, - Office of the United States Trade Representative, 600 Seventeenth Street, N.W., Room 316, Washington, D.C. 20506. Information also can be obtained by calling the GSP Information Center at (202) 395-6971.
2. Information Subject to Public Inspection
Information submitted in connection with the hearings will be subject to public inspection by appointment with the staff of the GSP Information Center, expect for information granted "business confidential" status pursuant to 15 CFR 2003.6 and 15 CFR 2006.10. Parties submitting briefs or statements containing confidential,information must indicate clearly on the cover page of each of the twenty copies submitted and on each page within the document, where appropriate, that confidential material is included. - Non-confidential summaries of all confidential material must be submitted in twenty copies, in English, at the same time that confidential submissions are filed.
3. Communications
All communications with regard to these hearings should be addressed to: GSP Subcommittee, Office of the United States Trade Representative, 600 Seventeenth Street, N.W., Room 316, Washington, D.C. 20506. The telephone number of the Secretary of the GSP Subcommittee is (202) 395-6971. Questions may be directed to any member of the staff of the GSP Information Center.

3
A-6
Acceptance for review of the petitions listed herein does not indicate any opinion with respect to a disposition on the merits of the petitions. Acceptance indicates only that the listed petitions have been found to be eligible for review by the GSP Subcommittee and the TPSC, and that such reviews will take place. -
II. Deadline for Receipt of Requests to Participate in the Public Hearings
The GSP Subcommittee of the Trade Policy Staff Committee invites submissions in support of or in opposition to any petition contained in this notice. All such submissions should conform to 15 CFR 2007, particularly parts 2007.0, 2007.1(1), 2007.1(2), and 2007.1(3).
Requests to present oral testimony in connection with public hearings should be accompanied by twenty copies, in English, of all written briefs or statements and should be received by the Chairman of the GSP Subcommittee no later than the close of business Friday, September 16, 1983. Oral testimony before. the GSP Subcommittee will be limited to five minute presentations that summarize or supplement information contained in briefs or statements submitted for the record. Post-hearing briefs or statements will be accepted if submitted in twenty copies, in English, no later than close of business Friday, October 14, 1983. Rebuttal briefs should be submitted in twenty copies, in English, by close of business Friday, October 28, 1983.
Parties not wishing to appear may submit written briefs or statements in twenty copies, in English, in connection with articles under consideration in the public hearings, provided that such submissions are filed by October 14 and conform with the regulations cited above.
Hearings will be held on September 26 and 28, beginning at 10:00 A.M. in the AmphitheAter of the Federal Home Loan Bank Board, 1700 G Street, N.W., Washington, D.C. The hearings will be open to the public and transcripts will be made available for public inspection or purchase from the reporting company. •
III. List of Articles Which May Be Considered for Designation as Eligible Articles for Purposes of the GSP and On Which the United States International Trade Commission Will Be Asked to Provide Advice
1. In conformity with Sections 502(a) and 131(a) of the Trade Act of 1974 as amended (19 U.S.C. 2463 (A) and 2151 (A)), notice is hereby given that the articles listed herein may be considered for designation as eligible articles for purposes of the GSP.

4 A-7
An article which is determined to be import sensitive in the context of the GSP cannot be designated as an eligible article. Recommendations with respect to the eligibility of any listed article will be made after public hearings have been held and advice has been received from the U.S. International-Trade. Commission on the probable effects of GSP designation on industries producing like or directly competitive articles and on consumers.
2. Advice of the United States International Trade Commission
On behalf of the President and in accordance with Sections 503(A) and 131(A) of the Trade Act of 1974 as amended, the United States International Trade Commission is being furnished with a list of the articles published herein for the purpose of securing from the Commission its advice on the probable economic effect on United States industries producing like or directly competitive articles, and on consumers, of the designation of such articles as eligible articles for purposes of the GSP.
Frederick L. Montgomery Chairman, Trade Policy Staff Committee

A- 8
Annex I
Petitions Accepted for Reviev
TSUS or : • TSUSA Article Petitioner ' item No. •
Case No.
[The bracketed language in this list has been • included only to clarify the scope of the numbered
items which are being considered, and such language is not itself intended to describe articles which are under consideration.)
A. Petitions to add products to the list of eligible articles for the Generalized System of Preferences.
Garden and field seeds:
83-1 126.01 Alfalfa Government of Chile
Berries, fresh, or prepared or preserved: [Fresh or in brine; dried; frozen) Otherwise prepared or preserved:
83-2 146.85 Strawberries
do.
Mustard, ground or prepared: [Ground)
83-3 161.60 Other
Cyclic organic chemical products in any physical form having a benzenoid, quinoid, or modified benzenoid structure, not provided for in subpart A or C of part 1 of schedule 4 of the Tariff Schedules of the United States:
[Articles provided for in items 402.00 thru 402.32)
Other: [Hydrocarbons; halogenated hydrocarbons) Other hydrocarbon derivatives:
83-4 403.05 p-Toluenesulfonyl chloride
Alcohols, phenols, ethers (including epoxides and acetals), aldehydes, ketones, alcohol peroxides, ether peroxides, ketone peroxides, and their derivatives:
83-5 403.16pt. 2,6-01.-tert-butyl-p-cresol
Carboxylic acids, anhydrides, balides, acyl peroxides, peroxyacids, and their derivatives:
83-6 404.04 Benzoic acid
Government of Peru
Government of Korea
Cydsa Group, Mexico
Government of Colombia
1/ Tariff Schedules of the United States Annotated (19 U.S.C. 1202).

Annex A-9
Petitions Accepted for Review
Came No.
TSUS or TSUSA 1/ it No.
Article Petitioner
A. Petitions to add products to the list of eligible articles for the Generalized System of Preferences (con.)
Cyclic organic chemical products, etc. (con.): Other (con.):
Amines having one or more oxygen functions, and their derivatives:
(Articles provided for in items 404.92 thru 405.02)
Other: (Products provided for in the Chemical Appendix to the Tariff Schedules)
83-7 405.09pt. Potassium-D-(-)-N-(1-methoxycarbonyl- propen-2-y1)-a-amino-p-hydroxy- phenylacetate (Dane salt) Kaneka America Corp.,
New York, NY
Heterocyclic compounds and their der-ivatives (including lactones and lactams but excluding epoxides with three membered rings, anhydrides and imides of polybasic acids, and cyclic esters of polyhydric alcohols with polybasic acids):
83-8 406.16 2,2'-Dithiobisbenzothiazole Cydsa Group, Mexico, Government of Mexico
(Articles provided for in items 406.20 thru 406.32)
Other: (Articles provided for in item 406.36)
Other: 83-9 406.40pt. 1,2-Dihydro-2,2,4-tri-
methylguinoline polymer; 2-Mercaptobenzothiazole; N-(Oxydiethylene)benzo-thiazole-2-sulfenamide Cydsa Group, Mexico,
Government of Mexico
1/ Tariff Schedules of the United States Annotated (19 U.S.C. 1202).

A-10 Annex I
Petitions Accepted for Review
Case TSUS or No. TSUSA 1/ : Article Petitioner
item No. :
A. Petitions to add products to the list of eligible articles for the Generalized System of Preferences (con.)
Cyclic organic chemical products, etc. (con.): Other (con.):
Sulfonamides, sultones, sultams, and other organic compounds:
Sulfonamides:
83-10 406.48pt. 4-Amino-6-chloro-m-bezene- disulfonamide Pliva of Zagreb,
Yugoslavia
Products suitable for medicinal use, and drugs: Obtained,. derived, or manufactured in whole or in part from any product provided for in sub- part A or 8 of part 1 of schedule 4 of the Tariff Schedules of the United States:
Drugs: (Articles provided for in items 410.68 thru 411.27)
Other: (Alkaloids and their salts and other derivatives)
Antihistamines, including those chiefly used as antinauseants:
(Articles provided for in item 411.52)
Other:
83-11 411.56pt. Meclizine hydrochloride do.
1/ Tariff Schedules of the United States Annotated (19 U.S.C. 1202).

A-11 As I
Petitions Accepted for Review
TSUS or TSUSA lj Article Petitioner item No.
Case No.
A. Petitions to add products to the list of eligible articles for the Generalized System of Preferences (con.)
Products suitable for medicinal use, etc.. (con.): Obtained, derived, or manufactured, etc. (con.):
Drugs (con.): Other (con.):
Anti-infective agents: Anti-infective sulfonamides:
(Articles provided for in items 411.80 and 411.81)
Other: 83., 12 411.83pt. Acetylsulfisox-
azole; sulfamer-azine, sodium Pliva of Zagreb,
Yugoslavia
(Articles provided for in items 411.98 thru 412.67)
Other: 83-13 412.69pt. Chlorpropamide;
chlorothiazide do.
1/ Tariff Schedules of the United States Annotated (19 U.S.C. 1202).

A- 12 Annex I
Petitions Accepted for Review
Case No.
TSUS or TSUSA 1/ item No.
Article Petitioner
A. Petitions to add products to the list of eligible articles for the Generalized System of Preferences (con.)
Glass (whether or not containing wire netting), in rectangles, not ground, not polished and not other-wise processed, weighing aver 4 oz. per sq. ft.:
(Cast or rolled glass) Other, including blown or drawn glass, but excluding pressed or molded glass:
Colored or special glass:
83-14 542.57 Weighing over 4 oz. but not over 12 oz. per sq. ft Government of Mexico
83-15 542.67 Weighing over 12 oz. but not over ' 16 oz. per sq. ft do.
Weighing aver 16 oz. but not over 28 oz. per sq. ft.:
83-16 542.71 Measuring not over 40 united inches do.
83-17 542.73 Measuring over 40 but not over 60 united inches do.
83-18 542.75 Measuring over 60 but not over 100 united inches do.
83-19 542.77 Measuring over 100 united inches do.
Weighing over 28 oz. per sq. ft.:
83-20 542.92 Not over 2-2/3 sq. ft. in area do.
83-21 542.94 Over 2-2/3 but not over 7 sq. ft. in area do.
83-22 542.96 Over 7 but not over 15 sq. ft. in area do.
83-23 542.98 Over 15 sq. ft. in area do.
1/ Tariff Schedules of the United States Annotated (19 U.S.C. 1202).

A- 13 Amex I
'NW
Petitions Accepted for Review
case TSUS or , ;
No. TSUSA 1/ item No.
Article Petitioner
A. Petitions to add products to the list of eligible articles for the Generalized System of Preferences (con.)
Glass (including plate glass and float glass), whether or not containing wire netting, in rectangles, ground or polished on one or both surfaces in whole or in part, but not further
83-24 83-25
543.21 543.23
processed: Ordinary glass:
Not containing wire netting: Measuring not over 15/32 inch in thickness:
Not over 2-2/3 sq. ft. in area Over 2-2/3 but not over 7 sq. ft. in area
Government of Mexico
am.
83-26 543.27 Over Z sq. ft. in area do. 83-.27 543.31 Measuring aver 15/32 inch in thickness do.
Colored or special glass: Measuring not over 15/32 inch in thickness:
83-28 543.61 Not over 2-2/3 sq. ft. in area do. 83-29 543.63 Over 2-2/3 but not over 7 sq. ft. .
in area do.
83-30 543.67 Over 7 sq. ft. in area do. 83-31 543.69 Measuring aver 15/32 inch in thickness do.
1/ Tariff Schedules of the United States Annotated (19 U.S.C. 1202).

Annex I A-14
Petitions Accepted for Review
TSUS or TSUSA 1/ : Article Petiti-oner item No. :
Case No.
A. Petitions to add products to the list of eligible articles for the Generalized System of Preferences (con.)
Radiotelegraphic and radiotelephonic transmission and reception apparatus; radiobroadcasting and television transmission and reception apparatus, and television cameras; record players, phonographs, tape recorders, dictation recording and transcribing machines, record changers, and tone arms; all of the foregoing, and any combination thereof, whether or not incorporating clocks or other timing apparatus, and parts thereof:
Radiotelegraphic and radiotelephonic transmis- sion and reception apparatus; radiobroadcasting and television transmission and reception apparatus, and parts thereof:
Television apparatus, and parts thereof: [Television receivers and parts thereof) Other television apparatus and parts thereof:
83-32 685.1915 Antennas Government of Malaysia
Dolls, and parts of dolls including doll clothing: (Doll clothing imported separately) Other:
Dolls (with or without clothing): [Stuffed)
83-33 737.24pt. Handmade, of wood or clay Government of Thailand
Buttons: 83-34 745.32 Of acrylic resin, of polyester resin, or
of both such resins Government of Colombia, Government of Malta
Button blanks and molds, and parts of buttons: [Button blanks of casein)
83-35 745.42 Other Government of Colombia
1/ Tariff Schedules of the United States Annotated (19 U.S.C. 1202).

Annex I
Petitions Aceelited for Review
TSUS or ! TSUSA V : Article Petitioner
' it No. • :
Case No.
B. Petitions to remove products from the list of eligible articles for the Generalized System of Preferences.
Products obtained, derived, or manufactured in whole or in part from any product provided for in subpart A or B of part 1 of schedule 4 of the Tariff Schedules of the United States:
Pesticides: Not artifically mixed:
(Fungicides] Herbicides (including plant growth regulators):
•
(Articles provided for in item
Other: 83-36 408.22pt. 2,4-Dinitro-6-sec-butyl-
phenol Vertac Chemical Corp., Memphis, TN
83-37 425.1020
83-38 425.74
83-39 610.62
83-40 610.63
83-41 610.65
83-42 610.66
Nitrogenous compounds: Cyanuric chloride, melamine, and other compounds containing a triazine ring:
Melamine
Acids: Citric
Pipe and tube fittings of iron or steel: Cast-iron fittings, not malleable:
For cast-iron pipe: Cast iron, other than alloy cast iron
Alloy cast iron
Not for cast-iron pipe: Cast iron, other than alloy cast iron Alloy cast iron
Melamine Chemicals, Inc., Donaldsonville, LA
Pfizer, Inc., New York, NY
American Pipe Fittings Association, iiashington, D.C.
do.
do. do.
1/ Tariff Schedules of the United States Annotated (19 U.S.C. 1202).

Annex A-16
Petitions Accepted for Review
TSUS or TSUSA 1/ : Article Petitioner item No. :
Case No.
B. Petitions to remove products from the list of eligible articles for the Generalized System of Preferences (con.)
Pipe and tube fittings of iron or steel (con.): Cast-iron fittings, malleable:
Not advanced in condition by operations or processes subsequent to the casting process:
83-43 610.70 Cast iron, other than alloy cast iron American Pipe Fittings Association, Washington, D.C.
83-44 610.71 Alloy cast iron do.
83-45 610.74 Advanced in condition by operations or processes subsequent to the casting process do.
83-46 610.80 Other fittings do.
Furniture, and parts thereof, not specially provided for:
Of rubber or plastics: (Of reinforced or Laminated plastics)
83-47 727.50 Other Waterbed Hanufacturers Association, . Washington, D.C.,
General Foam Plastics Corp., Norfolk, VA
Pillows, cushions, mattresses, and similar furn-ishings, all the foregoing, whether or not fitted with covers and with or without electrical heating elements, fitted with springs, stuffed, or both, or of expanded, foamed, or sponge rubber or plastics:
[Of cotton) Other:
83-48 727.8630 Mattresses Waterbed Manufacturers Association, Washington, D.C.
Fishing reels and parts thereof: Reels:
83-49 731.20 Valued not over $2.70 each Zebco' Division Brunswick Corp., Tulsa, OK
1/ Tariff Schedules of the United States Annotated (19 U.S.C. 1202).

Annex I A-17
Petitions Accepted for Reviev
TSUS or TSUSA 1/ : Article Petitioner item No. •
•
Case No.
C. Petitions to remove duty-free status from a beneficiary developing country for a product on the list of eligible articles for the Generalized System of Preferences.2/
Containers (except ampoules) chiefly used for the packing, transporting, or marketing of merchan-dise, and containers chiefly used for home canning and preserving, all the foregoing, of glass, with or without their closures and whether or not coated with plastics materials:
[Ordinarily used for perfume or other toilet preparations, or if fitted with or designed for use with ground glass stoppers) Other:
83-50 545.21 (Mexico)
Holding not over 1/4 pint Glass Packing Institute, Washington, D.C.
83-51 545.25 Holding over 1/4 pint but not over 1 pint do. (Mexico)
83-52 545.27 Holding over 1 pint do. (Mexico)
Articles not specially provided for of a type used for household, table, or kitchen use; toilet and sanitary wares; all the foregoing and parts thereof, of metal:
Articles, wares, and parts, of base metal, not coated or plated with precious metal:
Of iron or steel: Enameled or glazed with vitreous glasses:
83-53 654.02pt. Porcelain-on-steel cooking (Taiwan) and kitchen ware General Housewares, Corp.,
Stanford, CT
1/ Tariff Schedules of the United States Annotated (19 U.S.C. 1202). 2/ The country or countries named are those beneficiary developing countries specified by the petitioner. While the Trade Policy Staff Committee's (TPSC) review will focus on those countries, the TPSC reserves the right to address removal of GSP status for countries other than those specified by the petitioner.

Annex I A-18
Petitions Accepted for Review
TSUS or ! TSUSA 1/ : Article Petitioner item No. :
Case No
C. Petitions to remove duty-free status from a beneficiary developing country for a product on the list of eligible articles for the Generalized System of Preferences (con.)2/
Centrifuges; filtering and purifying machinery and apparatus (other than filter funnels, milk strainers, and similar articles), for liquids or gases; all the foregoing and parts thereof:
[Centrifuges and parts thereof; Other:
[Cast-iron (except malleable cast-iron) parts, not alloyed and not advanced beyond cleaning, and machined only for the removal of fins, gates, sprues, and risers or to permit location in finishing machinery)
83-54 661.95pt. Portable air purifiers, not specially (Hong Kong, designed for industrial use, and Taiwan) filters thereof
Machine tools: Metal-working machine tools:
Boring, drilling, and milling machines, including vertical turret lathes:
Drilling machines: (Used or rebuilt)
83-55 674.3227 Other, valued under $2,500 each (Taiwan)
Associated Mills, Inc., Chicago, IL
Wilton Corp., Des Plaines, IL
83-56 683.05 (Republic of Korea)
Storage batteries and parts thereof: Lead-acid type storage batteries, and parts thereof:
12-volt batteries Yuasa-General Battery Corp., Reading, PA
1/ Tariff Schedules of the United States Annotated (19 U.S.C. 1202). 2/ The country or countries named are those beneficiary developing countries specified by the petitioner. While the Trade Policy Staff Committee's (TPSC) review will focus on those countries, the TPSC reserves the right to address removal- of GSP status for countries other than those specified by the petitioner.

Annex I A-19
Petitions Accepted for Reviwr
TSUS or : TSUSA 1/ : Article Petitioner it No. :
Case No.
C. Petitions to remove duty-free status from a beneficiary developing country for a product on the list of eligible articles for the Generalized System of Preferences (con.)2/
Insulated (including enamelled or anodized) electrical conductors, whether or not fitted with connectors (including ignition wiring sets, Christmas-tree lighting sets with or without their bulbs, and other wiring sets):
With fittings:
83-57 688.12 ignition wiring sets and wiring sets (Taiwan)
designed for use in motor vehicles and craft provided for in part 6 of schedule 6 of the Tariff Schedules of the United States National Industries, Inc.,
Montgomery, AL
Photographic cameras (other than motion-picture cameras), photographic enlargers, and combination camera-enlargers:
[Having a photographic lens valued over 50 percent of the value of the article) Other cameras:
Fixed-focus: Hand-held type:
110 cameras:
83-58 722.1205 With built-in electronic (Hong Kong, stroboscopic flash National Association of Republic Photographic Manufac- of Korea, curers, Inc., Taiwan) Harrison, NY
83-59 722.1212 Other do. (Hong Kong, Republic of Korea, Taiwan)
Other: [Instant-print cameras)
83-60 722.1225 Other do. (Hong Kong, RepUblic of Korea, Taiwan)
1/ Tariff Schedules of the United States Annotated (19 U.S.C. 1202). 2/ The country or countries named are those benef.iciary developing countries specified by the petitioner. While the Trade Policy Staff Committee's (TPSC) review will focus on those countries, the TPSC reserves the right to address removal of GSP status for countries other than those specified by the petitioner.

Ames A-20
Petitions Accepted for Revive
Case • TSUS or ' No TSUSA 1/ Article Petitioner
item No.
C. Petitions to remove duty-free status from a beneficiary developing country for a product on the list of eligible articles for the Generalized System of Preferences (con.)21
Stringed musical instruments: Pianos (including player pianos, whether or not with keyboards): harpsichords, clavichords, and other keyboard string instruments:
83-61 725.01 Pianos (including player pianos, whether (Republic or not with keyboards), except grand of Korea) pianos National Piano Manufac-
turers Association of America, Inc., Chicago, IL
83-62 725.03 Other do. (Republic of Korea)
1/ Tariff Schedules of the United States Annotated (19 U.S.C. 1202). 2/ The country or countries named are those beneficiary developing . countries specified by the petitioner. While the Trade Policy Staff Committee's (TPSC) review will focus on those countries, the TPSC reserves the right to address removal of GSP status for countries other than those specified by the petitioner.

APPENDIX B
U.S. International Trade Commission Notice of Investigation and Hearing

B-2
UNITED STATES INTERNATIONAL TRADE COMMISSION Washington, D.C.
(TA-503(a)-11 and 332-166)
PRESIDENT'S LIST OF ARTICLES WHICH MAY BE DESIGNATED OR MODIFIED AS ELIGIBLE ARTICLES FOR PURPOSES OF THE U.S. GENERALIZED SYSTEM OF PREFERENCES
AGENCY: United States International Trade Commission
ACTION: In accordance with the provisions of sections 503(a) and 131(b) of the Trade Act of 1974 (hereinafter referred to as "the Act") (19 U.S.C. §§ 2463(a) and 2151(b)) and section 332(g) of the Tariff Act of 1930 (19 U.S.C. § 1332(g)), the Commission has instituted investigation No. TA-503(a)-11 and 332-166 for the purpose of obtaining, to the extent practicable, information of the kind described in section 131(d) of the Act. This information is for use in connection with the preparation of advice requested by the U.S. Trade Representative (USTR) with respect to certain listed articles as to the probable economic effect on U.S. industries producing like or directly competitive articles and on consumers of the modification of the list of articles eligible for duty-free treatment under the United States Generalized System of Preferences (GSP), set forth in Title V of the Act.
EFFECTIVE DATE: August 5, 1983
FOR FURTHER INFORMATION CONTACT: (1) Agricultural products, Mr. Robert Roeder (202-724-1170). (2) Chemical products, Mr. John Gersic (202-523-0451). (3) Minerals and metals, Mr. Larry Brookhart (202-523-0275). (4) Machinery and equipment, Mr. Aaron Chesser (202-523-0353). (5) Miscellaneous manufactures, Mr. Walter Trezevant (202-724-1719).
All of the above are in the Commission's Office of Industries. For information on legal aspects of the investigation contact Mr. William Gearhart of the Commission's Office of the General Counsel at 202-523-0487.
SUPPLEMENTARY INFORMATION: On July 27, 1983, in accordance with sections 503(a) and 131(a) of the Act and pursuant to the authority of the President delegated to the USTR by Executive Order 11846, as amended by Executive Order 11947, the USTR requested advice in four areas related to the GSP: (1) the addition of certain articles to the list of GSP eligible articles (see Annex, Part A), (2) the removal of certain articles from the GSP list (see Annex, Part B), (3) the removal of duty-free status under the GSP for certain beneficiary developing countries for certain articles ("graduation") (See Annex, Part C), and (4) a determination of whether or not certain articles are like or directly competitive with any article produced in the United States on January 3, 1975, for purposes of section 504(d) of the Act (see Annex, Part A).
For each article being considered for addition to the list of eligible articles, the Commission will advise the USTR as to the probable economic effect of the addition on U.S. industries producing like or directly competitive articles and on consumers. For each article being considered for removal or graduation, the Commission will advise the USTR as to the impact on U.S. industries producing like or directly competitive articles and on consumers of continued GSP status for the articles and countries in question.

B-3
ln providing its advice, the USTR requested the Commission tc assume that benefits of the GSP would not apply to imports that would be excluded from receiving such benefits by virtue of the "competitive need" limitations specified in section 504(c) of the Act.
Section 504(d) of the Act exempts from one of the competitive-need limits in section 504(c) articles for which no like or directly competitive article was being produced in the United States on the date of enactment of the Act. Accordingly, pursuant to the authority of section 332(g) of . the Tariff Act of 1930, and in conformity with the delegation of authority from the President to him of Executive Order 11846 as amended by Executive Order 11947, the USTR requested that the Commission also provide advice with respect to whether products like or directly competitive with any articles contained in the TSUS(A) items in the Annex, Part A, were being produced in the United States on January 3, 1975.
A list giving detailed descriptions of the articles contained in the TSUS(A) items identified in the Annex is available upon request from the Secretary, U.S. International Trade Commission, 701 E Street NW., Washington, D.C. 20436 (202-523-5178).
The USTR announced the items which have been sent to the Commission for probable effects advice in the July 21, 1983 Federal Register (48 F.R. 33400).
Public hearing A public hearing in connection with the investigation will be held in the
Commission Hearing Room, 701 E Street NW., Washington, D.C. 20436, beginning at 10:00 a.m., e.d.t., on September 27, 1983, to be continued on September 29, 1983, if required. All persons shall have the right to appear by counsel or in person, to present information, and to be heard. Requests to appear at the public hearing should be filed with the Secretary, United States International Trade Commission, 701 E Street NW., Washington, D.C. 20436, not later than noon, September 20, 1983.
Written submissions In lieu of or in addition to appearances at the public hearing,
interested persons are invited to submit written statements concerning the investigation. Written statements should be received by the close of business on September 21, 1983. Commercial or financial information which a submitter desires the Commission to treat as confidential must be submitted on separate sheets of paper, each clearly marked "Confidential Business Information" at the top. All submissions requesting confidential treatment must conform with the requirements of section 201.6 of the Commission's Rules of Practice and Procedure (19 CFR § 201.6). All written submissions, except for confidential business information, will be made available for inspection by interested persons. All submissions should be addressed to the Secretary at the Commission's office in Washington, D.C.
By order of the Commission.
Attachment
Issued: August 9, 1983

Annex
A. Petitions to add products to the list of eligible articles for the Generalized System of Preferences
126.01 412.69(pt) 7 543.23 146.85 542.57 543.27 161.60 542.67 543.31 403.05 542.71 543.61 403.16(pt) 1/ 542.73 543.63 404.04 542.75 543.67 405.09(pt) 2/ 542.77 543.69 406.16 542.92 685.1915 406.40(pt) 3/ 542.94 737.24(pt) 8/ 406.48(pt) 4/ 542.96 745.32 411.56(pt) 5/ 542.98 745.42 411.83(pt) 6/ 543.21
1/ 2,6-Di-tert-butyl-p-cresol 2/ Potassium-D-(-)-N-(1-methoxycarbonylpropen-2-y1)-a-amino-p-
hydroxyphenylacetate (Dane salt) 3/ 1,2-Dihydro-2,2,4-trimethylquinoline polymer; 2-Mercaptobenzothiazole;
N-(Oxydiethylene) benzothiazole-2-sulfenamide 4/ 4-Amino-6-chloro-m-bezenedisulfonamide S/ Meclizine hydrochloride 6/ Acetylsulfisoxazole; sulfamerazine, sodium 7/ Chlorpropamide; chlorothiazide 8/ Handmade dolls, of wood or clay
B. Petitions to remove products from the list of eligible articles for the Generalized System of Preferences
408.22(pt) 1/ 425.1020 425.74 610.62 610.63
610.65 610.66 610.70 610.71 610.74
610.80 727.50 727.8630 731.20
1/ 2,4-Dinitro-6-sec-butylphenol

B-5
-2-
C. Petitions to remove duty-free status from a beneficiary developing country for a product on the list of eligible articles for the Generalized System of Preferences
545.21 (Mexico) 545.25 (Mexico) 545.27 (Mexico) 654.02(pt) (Taiwan) 1/ 661.95(pt) (Hong Kong, Taiwan) 2/ 674.3227 (Taiwan) 683.05 (Republic of Korea) 688.12 (Taiwan) 722.1205 (Hong Kong, Republic of Korea, Taiwan) 722.1212 (Hong Kong, Republic of Korea, Taiwan) 722.1225 (Hong Kong, Republic of-Korea, Taiwan) 725.01 (Republic of Korea) 725.03 (Republic of Korea)
1/ Porcelain-on-steel cooking and kitchen ware 2/ Portable air purifiers, not specially designed for industrial use, and
filters thereof


APPENDIX C
List of Witnesses Appearing at the Commission Hearing

C-2
TENTATIVE CALENDAR OF PUBLIC HEARING
Those listed below appeared as witnesses at the United States International Trade Commission's public hearing on the President's List of Articles which may be Designated or Modified as Eligible Articles for Purposes of the U. S. Generalized System of Preferences (Investigation Nos. TA-503(a)-11 and 332-166). Sessions are being held in the Hearing Room of the United States International Trade Commission, 701 E Street, N.W., in Washington, beginning at 10:00 a.m., on September 27, 1983.
Witness and organization: Subject:
Thorp, Reed & Armstrong--Counsel Washington, D.C.
on behalf of
National Piano Manufacturers Association Pianos
H. B. Comstock, President, Pratt-Read Corp.
Peter M. Perez, Chairman & Chief Executive Officer, Aeolian Pianos, Inc.
Elmer F. Brooks, Jr., Chairman, Aeolian-American Corporation
Ronald J. Thyen, Executive Vice President, Kimball Piano and Organ Co., Piano Div.
Roger M. Golden )_ OF COUNSEL Preston T. Scott)
Daniels, Houlihan & Palmeter--Counsel Washington, D.C.
on behalf of
Young Chang America, Inc., Samick America Corporation Pianos and Daewoo America
Donald B. Cameron, Jr.--OF COUNSEL
Kilpatrick & Cody--Counsel Washington, D.C.
on behalf of
General Housewares Corporation
Gary L. Riles, President, Cookware Group
Joseph W. Dorn--OF COUNSEL
Porcelain-on-steel kitchen and cooking ware
- more -

C-3
Witness and organization: Subject:
Italo H. Ablondi, P.C.--Counsel Washington, D.C.
on behalf of
Board of Foreign Trade, Republic of China on Taiwan
Italo H. Ablondi)__
Porcelain-on-steel kitchen and Cooking ware
Sturgess Sobin ) OF COUNSEL
Stein, Shostak, Shostak & O'Hara--Counsel Washington, D.C.
on behalf of
Vitro Envases of Monterrey, Mexico Glass containers and Riekes Container Co., Richardson, Texas
Juan M. Holguin, Vitro Envases
Avrum Fitch, Riekes Container Co.
Irwin P. Altschuler) x--OF COUNSEL Donald Stein
Collier, Shannon, Rill & Scott--Counsel Washington, D.C.
on behalf of
Glass Packaging Institute Glass containers
C. F. Flynn, Executive Vice President, Latchford Glass Company
Jack L. Zarfoss, District Sales Manager, Brockway, Inc.
William H. Ellis, Vice President, Chattanooga Glass Company
Lewis D. Andrews, Vice President, Legislative Affairs, Glass Packaging Institute
Bruce Malaschevich, Vice President, Economic Consulting Services, Inc.
Brian Rubenking, Staff Economist, Economic Consulting Services, Inc.
Michael R. Kershow--OF COUNSEL
- more -

C-4
Witness and organization: Subject:
Wald, Harkrader & Ross--Counsel Washington, D.C. on behalf of
Associated Mills, Inc. (AMI)
Room-size air purifiers
Richard J. Stern, President
Mark R. Joelson--OF COUNSEL
Ruch-Hampton Industries, Inc., Sanford, Florida
Hal Sumrall, Vice President
Room-size air purifiers
Italo H. Ablondi, P.C.--Counsel Washington, D.C.
on behalf of
Board of Foreign Trade, Republic of China Room-size air on Taiwan purifiers
Italo H. Ablondi)_ OF COUNSEL Sturgess Sobin )
Barnes, Richardson & Colburn--Counsel Washington, D.C.
on behalf of
Pfizer, Inc.
Frank P. Chapman, Vice President-Marketing, Chemical Division
Eileen R. Walton, Corporate Counsel
James H. LUndquist--OF COUNSEL
Kaplan, Russin & Vecchi--Counsel Washington, D.C.
on behalf of
Gadot Petrochemical Industries Ltd. of Israel
Leon Brenton, Consultant
Dennis James, Jr.--OF COUNSEL
Citric acid
Citric acid
- more -

C-5
Witness and organization: Subject:
Beveridge & Diamond, P.C.--Counsel Washington, D.C.
on behalf of
Vertac Chemical Corporation, Memphis, Tennessee Certain chemicals
Alexander W. Sierck--OF COUNSEL
Dow, Lohnes & Albertson--Counsel Washington, D.C.
on behalf of
Pliva Pharmaceutical, Chemical, Food and Certain chemicals Cosmetic Industry, Zagreb, Yugoslavia
William Silverman )__ OF COUNSEL Margaret B. Dardess)
Stein, Shostak, Shostak & O'Hara Washington, D.C.
on behalf of
Monterey Manufacturing Co., Los Angeles, Waterbed mattresses California
Steven P. Kersner--OF COUNSEL
Webster, Chamberlain & Bean--Counsel Washington, D.C.
on behalf of
Waterbed Manufacturers Association Waterbed mattresses
C. Michael Deese--OF COUNSEL
- more -

C-6
Witness and organization:
Mayer, Brown & Platt--Counsel Washington, D.C.
on behalf of
The Zebco Division of Brunswich Corporation
Gene Howard, Vice President--Planning and Administration
William B. Hoffman--OF COUNSEL
Stein, Shostak, Shostak & O'Hara--Counsel Washington, D.C.
on behalf of
Subject:
Fishing reels
Daiwa Corporation Fishing reels
Warren Marr, Vice President
David R. Amerine ) Steven P. Kersner)__ OF COUNSEL
Daniels, Houlihan & Palmeter, P.C.--Counsel Washington, D.C.
on behalf of
Korean Plastic Goods Exporters Association Fishing reels
Donald B. Cameron, Jr.--OF COUNSEL
Italo H. Ablondi, P.C.--Counsel Washington, D.C.
on behalf of
Board of Foreign Trade, Republic of China Fishing reels on Taiwan
Sturgess Sobin--OF COUNSEL
McClure & Trotter--Counsel Washington, D.C.
on behalf of
American Pipe Fittings Association Pipe fittings
Paul Engle, Executive Director, APFA
Peter Buck Feller) _ OF COUNSEL Robert W. Johnson)
- more -

C-7
Witness and organization: Subject:
Kaplan, Russin & ecchi--Counsel Washington, D.C.
on behalf of
Korea Flange Company, Ltd. Pipe fittings
Dennis James, Jr.--OF COUNSEL
Italo H. Ablondi, P.C.--Counsel Washington, D.C.
on behalf of
Board of Foreign Trade, Republic of China on Pipe fittings Taiwan
Sturgis Sobin--OF COUNSEL
Plaia, Schaumberg & deKieffer--Counsel Washington, D.C.
on behalf of
Taiwan Association of Machinery Industry and Pipe fittings Sequoia International, Inc.
Joel D. Kauffman--OF COUNSEL
Kadison, Pfaelzer, Woodard, Quinn & Rossi--Counsel Washington, D.C.
on behalf of
Fundicao TUPY, S.A. Pipe fittings
Gary Meyers, President, TUPY American Foundry Corporation
Robert Crandall, Senior Fellow, Brookings Institution
Gary L. Stanley--OF COUNSEL
- more -

C-8
Witness and organization: Subject:
Stewart and Stewart--Counsel Washington, D.C.
on behalf of
PPG Industries, Inc., Flat glass and products
AFG Industries, Inc.
Ron Tiller, Vice President, Sales
Eugene L. Stewart--OF COUNSEL
Stein, Shostak, Shostak & O'Hara--Counsel Washington, D.C.
on behalf of
General Battery Corporation and Yuasa-General Batteries Battery Corporation, Reading, Pennsylvania
Douglas Thompson, General Battery Corp.
Bruce Retter, Yuasa-General Battery Corp.
Steven P. Kersner)__ OF COUNSEL Irwin Altshuler
Korea Trade Center, Washington, D.C. Batteries
On behalf of: Korea Battery Industrial Cooperative
Jong Man Choi, First Assistant Director
Jin Woo Lee, Assistant Director
Adduci, Dinan & Mastriani--Counsel Washington, D.C.
on behalf of
National Industries, Inc., Montgomery, Alabama Automotive
June Collier, President wiring harnesse ,
V. James Adduci, II--OF COUNSEL
- more -

Witness and organization:
Sonnenberg & Anderson--Counsel Chicago, Illinois
on behalf of
American Yazaki Corporation
Edward Mayne, Principal, Mayne & McKinney
Steven P. Sonnenberg--OF COUNSEL
Subject:
Automotive wiring harnesses
Italo H. Ablondi, P.C.--Counsel Washington, D.C.
on behalf of
Board of Foreign Trade, Republic of China Automotive on Taiwan wiring harnesses
Sturgis Sobin--OF COUNSEL
Italo H. Ablondi, P.C.--Counsel Washington, D.C.
on behalf of
Board of Foreign Trade, Republic of China on Taiwan
Sturgis Sobin--OF COUNSEL
Italo H. Ablondi, P.C.--Counsel Washington, D.C.
on behalf of
Board of Foreign Trade, Republic of China on Taiwan
Sturgis Sobin--OF COUNSEL
Pazianos Associates, Washington, D.C.
The CYDSA Group, Monterrey, Mexico
Eduardo Martinez, Export Sales Manager
E. George Pazianos, President, Pazianos Associates
PVC pipe furniture
Fixed-focus cameras
Rubber processing compounds


Related Documents