PRESENTING LABORATORY FINDINGS THROUGH A CREATIVE FORMAT by Joshua Koo A professional paper submitted in partial fulfillment of the requirements for the degree of Master of Science in Science Education MONTANA STATE UNIVERSITY Bozeman, Montana July 2015

Welcome message from author
This document is posted to help you gain knowledge. Please leave a comment to let me know what you think about it! Share it to your friends and learn new things together.
Transcript
PRESENTING LABORATORY FINDINGS THROUGH A CREATIVE FORMAT
by
Joshua Koo
A professional paper submitted in partial fulfillment
of the requirements for the degree
of
Master of Science
in
Science Education
MONTANA STATE UNIVERSITY
Bozeman, Montana
July 2015

©COPYRIGHT
by
Joshua Koo
Year
All Rights Reserved

ii
TABLE OF CONTENTS
1. INTRODUCTION AND BACKGROUND ....................................................................1
2. CONCEPTUAL FRAMEWORK ....................................................................................3
3. METHODOLOGY ..........................................................................................................7
4. DATA AND ANALYSIS ..............................................................................................12
5. INTERPRETATION AND CONCLUSION .................................................................20
6. VALUE ..........................................................................................................................22
REFERENCES CITED ......................................................................................................24
APPENDICES ...................................................................................................................27
APPENDIX A Alternative Method Option Lab 1: Genetics28
APPENDIX B Alternative Method Option Lab 2: Evolution ...............................33
APPENDIX C Alternative Method Option Lab Lab 3: Biodiversity ....................43
APPENDIX D Lab Write-up Report Format .........................................................46
APPENDIX E Alternative Method Outline ...........................................................48
APPENDIX F Alternative Method Grading Rubric ..............................................50
APPENDIX G Pre-intervention Lab Report Quiz .................................................52
APPENDIX H Student Pre-intervention Survey ...................................................54
APPENDIX I Post-intervention Interview Questions............................................56
APPENDIX J Lab Specific Questions from Unit Exams ......................................58

iii
LIST OF TABLES
1. Data Triangulation Matrix .............................................................................................12
2. Pre-Intervention Survey Responses: Question ONE .....................................................15
3. Pre-Intervention Survey Responses: Question TWO ....................................................15
iv
LIST OF FIGURES
1. Comparison on Individual Scores on Specific Questions .............................................19
2. Comparison of Lab Assignment Grades .......................................................................20
v
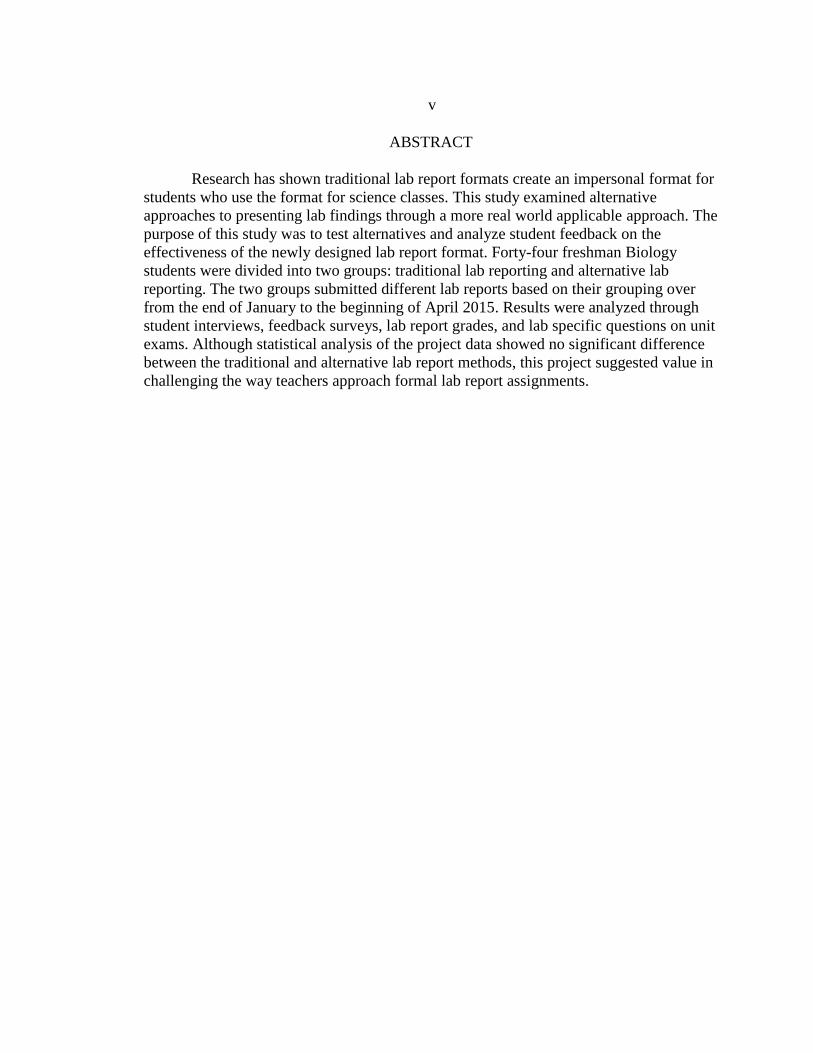
ABSTRACT
Research has shown traditional lab report formats create an impersonal format for
students who use the format for science classes. This study examined alternative
approaches to presenting lab findings through a more real world applicable approach. The
purpose of this study was to test alternatives and analyze student feedback on the
effectiveness of the newly designed lab report format. Forty-four freshman Biology
students were divided into two groups: traditional lab reporting and alternative lab
reporting. The two groups submitted different lab reports based on their grouping over
from the end of January to the beginning of April 2015. Results were analyzed through
student interviews, feedback surveys, lab report grades, and lab specific questions on unit
exams. Although statistical analysis of the project data showed no significant difference
between the traditional and alternative lab report methods, this project suggested value in
challenging the way teachers approach formal lab report assignments.

1
INTRODUCTION
Glenview, Illinois is a predominantly affluent northwest suburb of the greater
Chicagoland area. The estimated median household income for 2012 was $99,089, yet
the percentage of low-income students was at a 19.9% during that very school year. This
statistic alone shows the polarizing disparity we see in the 2,700+ students at Glenbrook
South High School. When driving through Glenview, it is typical to see neighborhoods
with sprawling estates and then drive to the outskirts of the unincorporated areas where
public housing is the norm. According to the 2014 Illinois State Board of Education
Report Card, Glenbrook South High School’s student demographic consisted of 73%
Caucasian, followed by 16% Asian, 7% Hispanic, and 4% Other.
Academics and extracurricular activities are a huge emphasis in the culture of this school.
Teachers, parents, and administration alike, all strive to produce “top tier graduates”
every year. Students frequently arrive at school at 5:00am to go to an athletic practice so
that they can attend a review at 7:00am for an upcoming test. Students also frequently go
to school on the weekends to attend an Advanced Placement reviews or stay after school
regularly for several hours to receive additional help regardless of class or academic
standing. This academically rigorous culture is evident in the lessons and activities in the
classroom as we have lower level freshman biology students create cell cultures and
regular level biology students run gel electrophoresis tests.
Teaching & Classroom Environment
Regardless of the location of the school or the subject of the course, there is an
underlying expectation for students in science to develop a certain level of competency in

2
how they reflect on the content. Teachers utilize many different formats to have students
display their reflective understanding of their learning and experiences in the classroom.
One of the most common formats is in the form of a scientific lab report. The style of
writing in a scientific lab report is initially unusual to students. The objective style of
consistent connection to evidence is a far cry from the colloquial mannerisms they have
been so accustomed to. This creates an educational chasm. On one side, there are science
teachers, who have for years, used the lab report model as a means to assess
understanding. On the other side there are students who are using an unfamiliar format to
display this deeper understanding of the content, which results in a true lack of
personalization and real world application to the content.
Regular level Biology students at Glenbrook South High School appear to
struggle in acclimating themselves to the scientific style of writing. I suspect the
reasoning to be two fold. First, freshman students have been conditioned to write in a
colloquial and subjective manner, where opinions are emphasized and evidence is
optional. Second, assessment at the middle school level is primarily recall tests, projects,
and presentations. Students go into high school without any previous exposure to the
scientific lab report format and thus it becomes intimidating. The science department at
Glenbrook South High School places an immense emphasis on students’ abilities to apply
the content learned.
Focus Question
For my action research project, I investigated alternative formats to the traditional
lab report to create alternative avenues for students to fully display their understanding of
3
the content learned through laboratory experiments. The alternative method encouraged
students to present their findings through a format where they are given a specific role
and need to present it to a specific audience. For example, after collecting data and
concluding results from a pill bug preference lab, a student then presented their findings
as a children’s book author to an audience of fourth graders. In another assignment,
students who completed the stem cell research simulation lab presented their findings as
an oncologist, specializing in treating patients with leukemia, to patients by using an
infomercial addressing questions about receiving a stem cell transplant. Students were
given examples and templates of role-audience formats to select from to better assist
them. The purpose was to allow personalization of content and also to show examples of
real world ways experimentation could be applied to their lives. The primary research
questions of this project were:
1. What are my biology students’ initial understanding and proficiency of scientific
writing?
2. What are my biology students’ initial attitudes towards traditional lab reports?
3. Are my students able to realize the real world application of this alternative
format?
4. Did the new lab report format allow for better display of student understanding
of the content and laboratory?
CONCEPTUAL FRAMEWORK
Laboratory experiments have always been synonymous with science classrooms.
They have long been the summative pinnacle of applying learned content and knowledge.

4
It is suggested that, “if designed properly, the science laboratory has the potential to play
an important role in attaining cognitive skills such as scientific thinking, inquiry skills as
well as understanding the process of scientific protocols… communicating and defending
scientific arguments.” (Hofstein, Shore, & Kipnis, 2004). Furthermore, the presentation
of experimental findings through a laboratory report has followed the experimentation
process as a means of assessment within the science curricula for as long as labs were
used in the classroom.
Educators have used laboratory reports to assess summative understanding, yet
often times, teachers often use reports without any clear thought out purpose (Haagen-
Schuetzenhoefer, 2012). Ideally, reports should be the well-prepared culmination of not
only student understanding, but also the educator’s design to help affirm importance and
significance of the laboratory to the content being learned. Yet as research has found, this
is often not the case. “Ritualized and restricted lab procedures leaving hardly any
opportunity for students to engage individually frequently results in poor quality lab
reports and moderate learning processes” (Haagen-Schuetzenhoefer, 2012, p. 430).
Simply put, when asked, students do not understand the purpose and relevancy of
reporting restrictive experimental findings in an irrelevant traditional format.
Considering the sheer complexity of changing restrictive lab procedures, this
action research project focused more specifically towards improving the latter issue of
enhancing the reporting experience. The underlying challenge with traditional laboratory
reports is students find the format and style very “unnatural” and “exclusive” to a science
classroom. The justification of the traditional format relies on its effectiveness to assess
5
students’ understanding of an experiment and also to promote the relevancy and
application of science concepts. However, if students have difficulty realizing the value
of learning to write in a laboratory report style beyond an assignment grade, then what
can be done to enhance the laboratory reflection, while maintaining the assessment
component? An alternative format for laboratory data presentation was explored to
further benefit the students’ understanding of the content and to enhance perceptions of
writing in science (Brydon et al., 2010).
To remedy the “unnatural” and “irrelevant” stigma traditional laboratory reports
have, the target audience of the report was changed from the teacher to another group
(Hofstein, et al., 2004). The students took on a specific “role” and reported their data to a
target audience as means of explaining their experimental findings. Research states that
there are distinct benefits of writing to audiences other than teachers (Gunel, Hand, &
McDermott, 2009). Changing the dynamic in the presentation format elicits a higher level
of motivation and understanding. This is because students need to take their results of
their experiment and then translate the language of science into a comprehensible,
everyday language. In order to complete this degree of translation, students must have a
deeper understanding of the content and conclusions drawn from the laboratory. Through
this translation, students must think about and present the material in a fashion most
appropriate to a particular audience (Hand & Prain, 2006). As a result, connections
between concepts are strengthened, objectives are elaborated upon, and the important
element of personalization is utilized because “if learners are able to construct relations

6
both within and between different representations, they can acquire a deeper
understanding” (Seufert, 2003, p. 227).
Scientific writing is essential to developing a deeper understanding of science
(Dianovsky & Wink, 2012). What the traditional form lacks is the foundational element
of true ownership of the product. To enhance the overall experience, the alternative
method looked to highlight that area while still maintaining the academic rigor and
integrity brought forth by a traditional report. Research has also indicated when students
are placed in situations where argumentative writing is encouraged, “they tend to use
multiple modal representations to explain their ideas” (Chen, 2013). This further
enhances their understanding as they seek different ways to present the same information.
It was also found that students who use alternative modes in their written text
were more successful on unit assessments (McDermott & Hand, 2013). Thus, for this
project, a format was created where application could be explicitly experienced and then
used in summative writing assessments. In turn, students could potentially find a more
robust level of ownership of the objective.
Studies, such as one by Midgeffe, Haria, & MacArthur (2008), have shown when
scientific writing is effectively implemented, students exhibited evidence of
metacognitive thinking. They are then able to “think critically and logically to make the
relationship between evidence and explanation” (National Research Council, 1996).
Writing incorporates another layer of dynamic learning in which the students spend more
time interacting with ideas and less time interacting with the apparatus (Gunstone, 1991).
The practice of blending several complex ideas including prior knowledge, collected

7
data, and researched rationale allows for students go deep into a level of understanding
that becomes rich and personal. “By reading well-written scientific text and by
endeavoring to write it, students familiarize themselves with the conceptual relations that
form the basis of real scientific understanding” (Glynn & Muth, 1994). In this situation,
the students can learn to cross borders between specialist and more popular readerships,
which results in students who display much greater understanding and reasoning skills
(Hand & Prain, 2001). “Such writing can also develop student’s strategies for self
directed learning of science and provide positive affective engagement with science for
all students (p. 742).”
METHODOLOGY
Through this action research project, students had an opportunity to display their
understanding of the content learned in the laboratory in a real world applicable way.
During the project, I taught two regular Biology courses. Thus, the research project was
set up as a comparison between traditional and alternative methods. The traditional
method class was the comparison group and the alternative method class was the
treatment group respectively. The students in the comparison class continued writing
traditional lab reports. The treatment group was expected to present their summative lab
findings in the new alternative format. The treatment group also continued to report all
summative lab findings in this manner during the full duration of the data collection
period. Both groups completed three reports for specific labs during the span of the
research project. The specifically targeted labs were: Genetic Pedigree Lab, Evidence For
Evolution, and Bread Mold Investigation (Appendix A-C).

8
As we were on the block schedule, I saw two different sets of students every other
day. Conveniently for this action research project, I taught Biology the third block of both
days, which meant both groups had lunch before my class. This allowed for an additional
layer of control between variables.
Participants
The comparative group consisted of 24 students, 10 males and 14 females.
Twenty-three of the students were freshman, and one was a sophomore. When compared
to the treatment group, this comparative group was more vocal and expressive in
classroom interaction. However, they were also consistently scored 2-3% lower on first
semester unit tests than the treatment group.
The treatment group consisted of 22 students, of which only six were males.
Similar to the comparative group, all students were freshman with the exception of one
sophomore. Although quieter than the comparative group, they consistently performed
better on unit tests. However, when it came to first semester lab report grades, both
groups were similar in average scores. The comparative group scored an average of an
83% compared the treatment groups 82%. Both groups were part of the same general
Biology course offered at the high school, thus placement of the students into the
respective classes was based on the same criteria.
Intervention
During the first semester, both sections had already completed four traditional
laboratory reports. Those laboratory reports were scored based on a specific grading
rubric shown in the Lab Write Up Format (Appendix D). At the time when this

9
alternative format was introduced, all students, including the treatment group, had a clear
understanding of what was expected from a traditional laboratory report because of a
semesters experience in writing using the traditional format. Thus, they were capable of
justly reflecting their opinions on the traditional method in its effectiveness to display
understanding through surveys and interviews that were conducted before the
intervention and upon the completion of the data completion period. The comparative
group continued to follow the traditional model.
The treatment group was given an alternative opportunity to report their data
found in the laboratory experiment. Each alternative format report focused on a specific
role the students had to become and thus relay their findings to a specific role audience
report outline (Appendix E). For example, in the third and final report of the research
project, students investigated the rate of mold growth on bread. Students were to change a
single variable of a controlled model to see the effects on mold growth. While the
comparison group continued to report their findings through the traditional format, the
treatment group was given the option of presenting their findings as local health officials
through means of a Public Service Announcement. The treatment group’s primary
objective was to inform the public how different variables may enhance or reduce the
amount of mold growth on their bread. The treatment completed the same experiment and
collected same means of data as the comparison group. The only difference was instead
of following the standard Lab Write Up Format (Appendix D), the treatment group
created the suggested public service announcement to present their findings following the
Role Audience Report Grading Rubric (Appendix F).

10
For each alternative method opportunity, students were given the freedom to
follow the suggested alternative template or generate their own role-audience format as
long as the format was pre-approved by me in order to ensure quality of focus. This
further allowed the personalization of the assignment.
Data Collection
Students in the treatment group took a quiz before the first alternative report in
order to assess their understanding of the structure of a traditional laboratory report. The
comparison group took the same quiz. The Pre-Intervention Lab Report Quiz (Appendix
G) assessed students on their basic understanding of traditional lab report formats.
Students had to accurately explain the purpose and importance of various report elements
such as the claim and reasoning. The quiz was administered as an indicator, along with
their first semester traditional laboratory report grades, to better understand students’
perceptions and opinions of the traditional report format. Additionally, students were able
to express their personal feelings and reflections of their first semester traditional reports
through a Student Pre-Intervention Survey (Appendix H). The survey was issued as an
opportunity for students to voice their attitudes towards the traditional format on a non-
graded platform.
Both formats focused on the students’ ability to effectively present their findings
with substantial evidence and reasoning. Thus, the grading rubrics of both formats placed
the greatest amount of importance in the conclusion portion of the report. This was
intentionally done to create parity between formats. Rubrics were consistent throughout
the data collection period.
11
At the end of the data collection period (January-April 2015), ten students were
chosen from the alternative report class to be interviewed about their experiences. Two
students were selected from each letter grade tier (“A”-“F”) based on the cumulative
average of all three reports. They were asked questions specific to their projects as well
as the format overall using the R.A.R. Interview questionnaire (Appendix I). The purpose
of the post project interviews was to identify students’ attitudes towards the new format
and collect feedback to its effectiveness. They were reminded that their feedback was
voluntary and had no bearing on their standing in class.
As the teacher grading both formats using the previously mentioned rubrics, I
primarily focused on the students’ ability to connect the experimental findings to the
content learned in class. I evaluated if students understood the bigger picture to why their
results came out to what they were, and if they were not as expected, how they used
research to refute or support their initial claims.
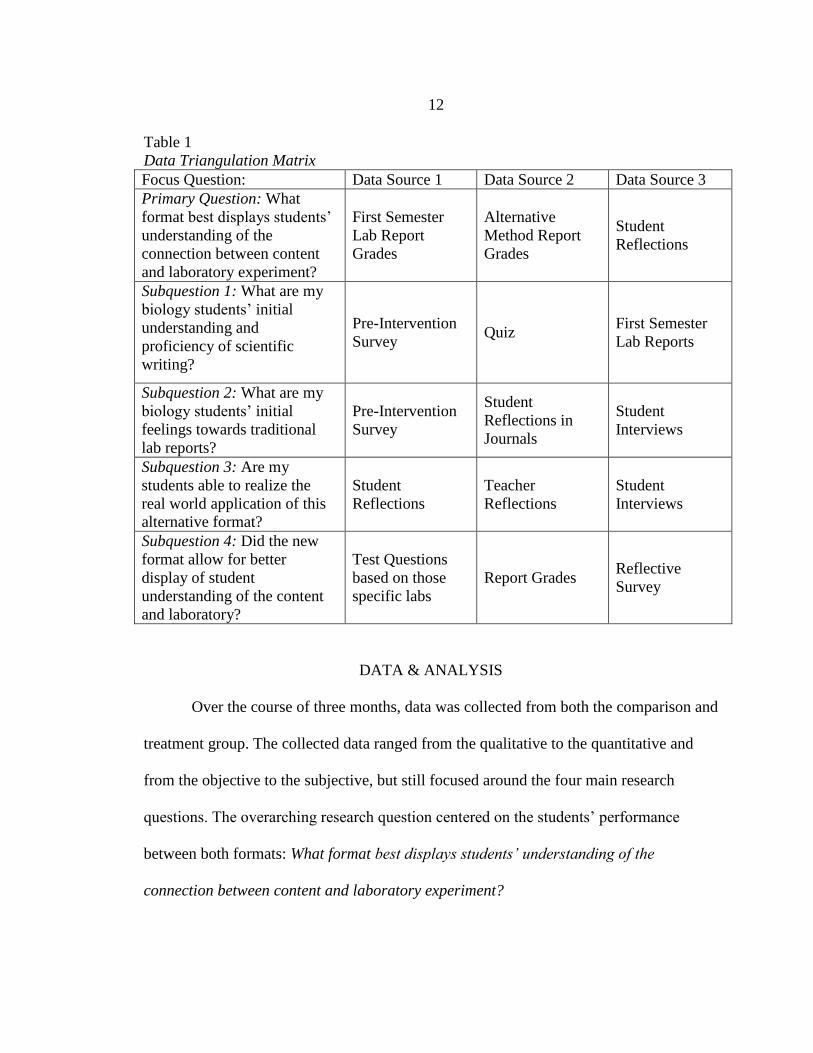
The Data Triangulation Matrix (Table 1) exhibits the different data collection
methods used throughout this action research project pertaining to specific research
questions, which were asked and analyzed.
12
Table 1
Data Triangulation Matrix
Focus Question: Data Source 1 Data Source 2 Data Source 3
Primary Question: What
format best displays students’
understanding of the
connection between content
and laboratory experiment?
First Semester
Lab Report
Grades
Alternative
Method Report
Grades
Student
Reflections
Subquestion 1: What are my
biology students’ initial
understanding and
proficiency of scientific
writing?
Pre-Intervention
Survey Quiz
First Semester
Lab Reports
Subquestion 2: What are my
biology students’ initial
feelings towards traditional
lab reports?
Pre-Intervention
Survey
Student
Reflections in
Journals
Student
Interviews
Subquestion 3: Are my
students able to realize the
real world application of this
alternative format?
Student
Reflections
Teacher
Reflections
Student
Interviews
Subquestion 4: Did the new
format allow for better
display of student
understanding of the content
and laboratory?
Test Questions
based on those
specific labs
Report Grades Reflective
Survey
DATA & ANALYSIS
Over the course of three months, data was collected from both the comparison and
treatment group. The collected data ranged from the qualitative to the quantitative and
from the objective to the subjective, but still focused around the four main research
questions. The overarching research question centered on the students’ performance
between both formats: What format best displays students’ understanding of the
connection between content and laboratory experiment?

13
Student’s Initial Understanding of Lab Report Format
To create a baseline for comparison, the initial understanding and proficiency in
scientific writing of the biology students was determined by means of a quiz and
reviewing previous report scores. Over the course of one semester, there were three lab
reports, which were assigned to emphasize this skill and learning goal. However, students
consistently struggled and voiced their displeasure in the “relevancy” of the report
format. During the first semester, the treatment group students averaged 72% (n=22,
SD=9.66) on their lab reports. The greatest area of weakness was in their conclusions. In
the conclusions students are asked to make claims, provide evidence for their claims and
most importantly be able to rationalize their findings. As noted in the Lab Report Rubric
(Appendix D), students are asked to “connect the results to relevant biological concepts
and characteristics of life” and “relate results to personal experiences by including
statements like, ‘this makes sense/doesn’t make sense because….’ or ‘from my research,
I found…’.” In these portions, a significant portion of these students, 37% (n=22,
SD=9.66), were not able to make accurate connections between the evidence and the
claim and often times made inaccurate or exaggerated connections in their reasoning
portion. This was emphasized in the Pre-Intervention Survey taken by the students.
Eighteen out of the twenty two students felt they were not able to better understand the
content through writing a traditional lab report. Many expressed the same concerns, as
one student noted, “not understanding the point of them.”
A quiz was initially administered to all the students to gauge their current
understanding of science writing components (Appendix G). An average score of 76.8%

14
(N=46) on the quiz and an 84% (N=46) on the conclusion specific questions showed
there was a foundational level of understanding the components of a conclusion across
both groups. Thus the issue was not if they knew ‘what’ the elements were, but moreover
‘why’ the combined pieces was important to understand. The challenge of teaching
deeper understanding through lab report writing was to help students understand the
deeper relationship between data results and their daily lives.
Student Attitudes Towards The Traditional Method
Beyond the lackluster grades from first semester grade reports, there seemed to be
student dissatisfaction in the lack of traditional lab reports’ abilities to further enhance a
deeper understanding of the content. Thirty out of forty-six students mentioned in some
form that there was “little to no relevance” in how they could apply what they learned
from writing traditional lab reports to their daily lives. For example, one student stated, “I
feel lab reports are designed to present teachers an easy way to grade things, but as a
student, I really don’t understand how writing one will help me understand things better.”
Another student went on to say, “Lab reports are more for a grade than to help me see
science in [my daily] life.” The few positive comments centered on the idea that learning
how to write lab reports were beneficial to their career goals. A student stated, “It gives
me needed practice for when I go to college and take science courses.” Another student
stated, “I heard you write a lot of lab reports in Chemistry and Physics so it is good
practice for me now.” Although positive, those comments lacked the true heart of why
science teachers in my department assign lab reports. It was clear, there was an obvious
disconnect between students and the educational value in lab reporting. Additionally, the
15
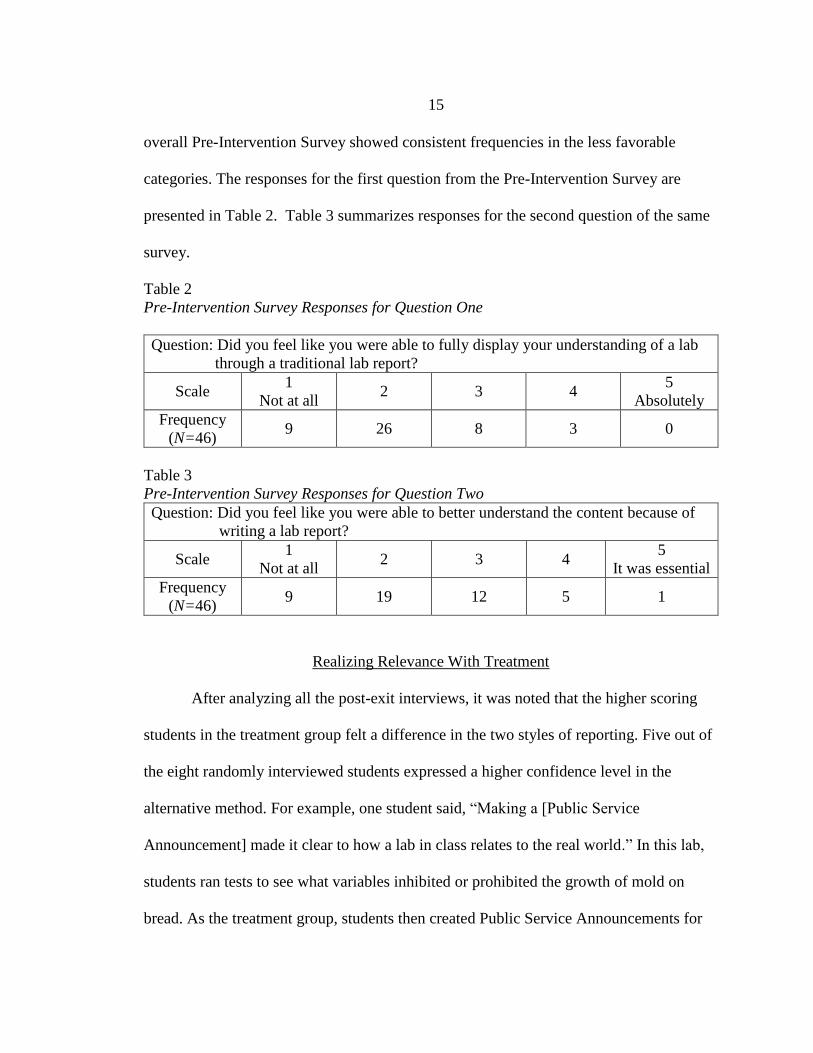
overall Pre-Intervention Survey showed consistent frequencies in the less favorable
categories. The responses for the first question from the Pre-Intervention Survey are
presented in Table 2. Table 3 summarizes responses for the second question of the same
survey.
Table 2
Pre-Intervention Survey Responses for Question One
Question: Did you feel like you were able to fully display your understanding of a lab
through a traditional lab report?
Scale 1
Not at all 2 3 4
5
Absolutely
Frequency
(N=46) 9 26 8 3 0
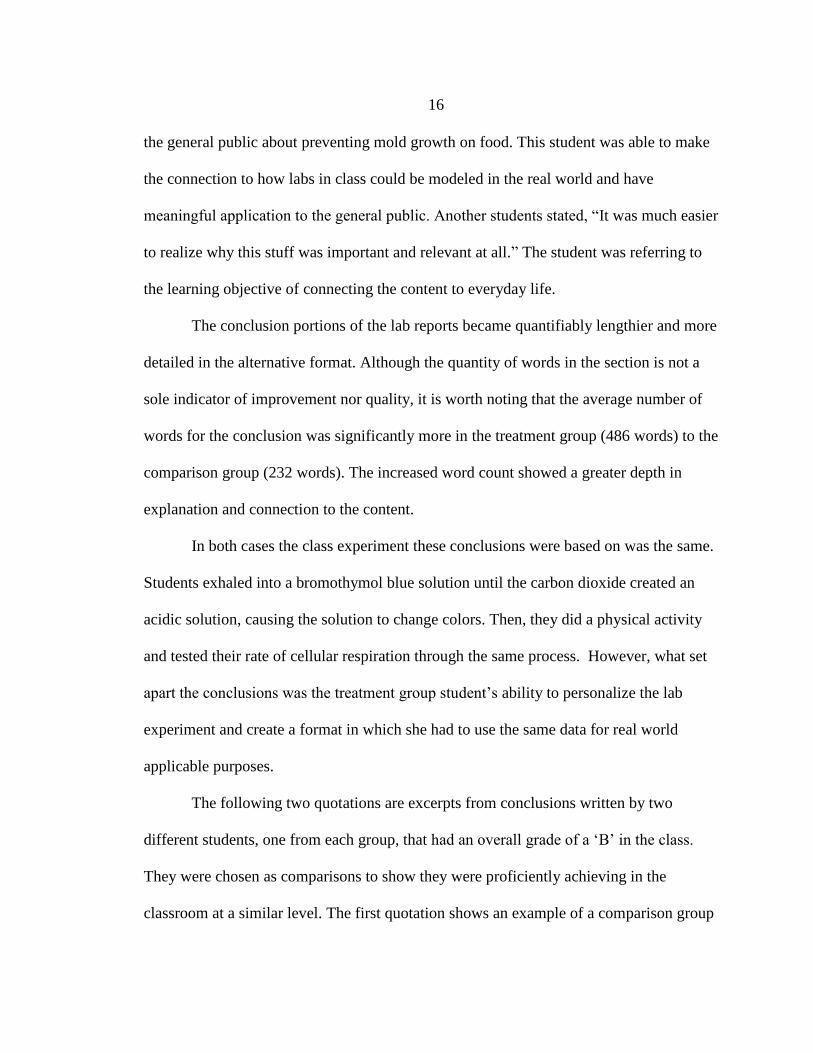
Table 3
Pre-Intervention Survey Responses for Question Two
Question: Did you feel like you were able to better understand the content because of
writing a lab report?
Scale 1
Not at all 2 3 4
5
It was essential
Frequency
(N=46) 9 19 12 5 1
Realizing Relevance With Treatment
After analyzing all the post-exit interviews, it was noted that the higher scoring
students in the treatment group felt a difference in the two styles of reporting. Five out of
the eight randomly interviewed students expressed a higher confidence level in the
alternative method. For example, one student said, “Making a [Public Service
Announcement] made it clear to how a lab in class relates to the real world.” In this lab,
students ran tests to see what variables inhibited or prohibited the growth of mold on
bread. As the treatment group, students then created Public Service Announcements for
16
the general public about preventing mold growth on food. This student was able to make
the connection to how labs in class could be modeled in the real world and have
meaningful application to the general public. Another students stated, “It was much easier
to realize why this stuff was important and relevant at all.” The student was referring to
the learning objective of connecting the content to everyday life.
The conclusion portions of the lab reports became quantifiably lengthier and more
detailed in the alternative format. Although the quantity of words in the section is not a
sole indicator of improvement nor quality, it is worth noting that the average number of
words for the conclusion was significantly more in the treatment group (486 words) to the
comparison group (232 words). The increased word count showed a greater depth in
explanation and connection to the content.
In both cases the class experiment these conclusions were based on was the same.
Students exhaled into a bromothymol blue solution until the carbon dioxide created an
acidic solution, causing the solution to change colors. Then, they did a physical activity
and tested their rate of cellular respiration through the same process. However, what set
apart the conclusions was the treatment group student’s ability to personalize the lab
experiment and create a format in which she had to use the same data for real world
applicable purposes.
The following two quotations are excerpts from conclusions written by two
different students, one from each group, that had an overall grade of a ‘B’ in the class.
They were chosen as comparisons to show they were proficiently achieving in the
classroom at a similar level. The first quotation shows an example of a comparison group

17
conclusion, which lacked a display of deeper understanding. The student had a basic a
framework of the content, in this specific case, cellular respiration; however, deeper
connections to content were never expressed.
This makes sense because, when we exercise or run, our bodies need more
oxygen. The more oxygen we inhale, the more carbon dioxide we exhale. Because
we exhale more carbon dioxide when exercising, then the rate of cellular
respiration is faster, because a product of cellular respiration is carbon dioxide.
This data is reliable because as we ran, there was a significant rate difference
from when we were resting.
In comparison, the second quotation shows a segment of a conclusion of a treatment
group in which the student displayed a deeper understanding of the content. The creative
format she chose was to create a public health pamphlet of the benefits of proper eating
before and breathing during and physical exercise.
The data collected in the study showed BTB turned yellow the fastest in active
participants. This makes sense because after any type of physical activity, people
breathe a lot faster and harder while resting. This means that more carbon dioxide
is being released after physical activity. This is why it is so important to exhale
completely when exercising because having a good breathing pattern ensures your
working muscles are getting enough oxygen. In the “real world”, athletes work so
hard that their bodies need to go into fermentation (fermentation is releasing food
molecules by producing ATP when oxygen isn’t present). They could probably
turn the BTB yellow in under a second!

18
The student went on to explain the pathway of oxygen and carbon dioxide during
breathing and how that connects with the steps of cellular respiration.
When asked in interviews, treatment group students mentioned how it was easier
to make connections to the real world. One of the student reflections said, “It was much
more straight forward for me to brainstorm connections because the whole project was
based on doing so”. Another wrote:
I knew what you wanted to me mention in the first semester [comparison] reports,
but it was sometimes hard to write it what I was trying to say. The new formatt
[sic] makes it easier because the project is built on applying it to real life.
I observed many students brainstorming and debating possible formats for each report.
The Treatment And Effect on Understanding
When interpreting the scores of test questions based on lab specific questions
from unit exams (Appendix J), the data revealed a four percent increase in the treatment
group. The control group (N=24) scored an average of 74.55%, with a standard deviation
of 7.10, while the treatment group (N=22) scored an average of 78.09% with a standard
deviation of 6.07. However, according to t-test analysis results, it was not statistically
significant, t(44)=1.855, p=.0702. Figure 1 shows the scores of both comparison and
treatment groups on those specific test questions. It is clear there the treatment group
performed better than the comparison group collectively.
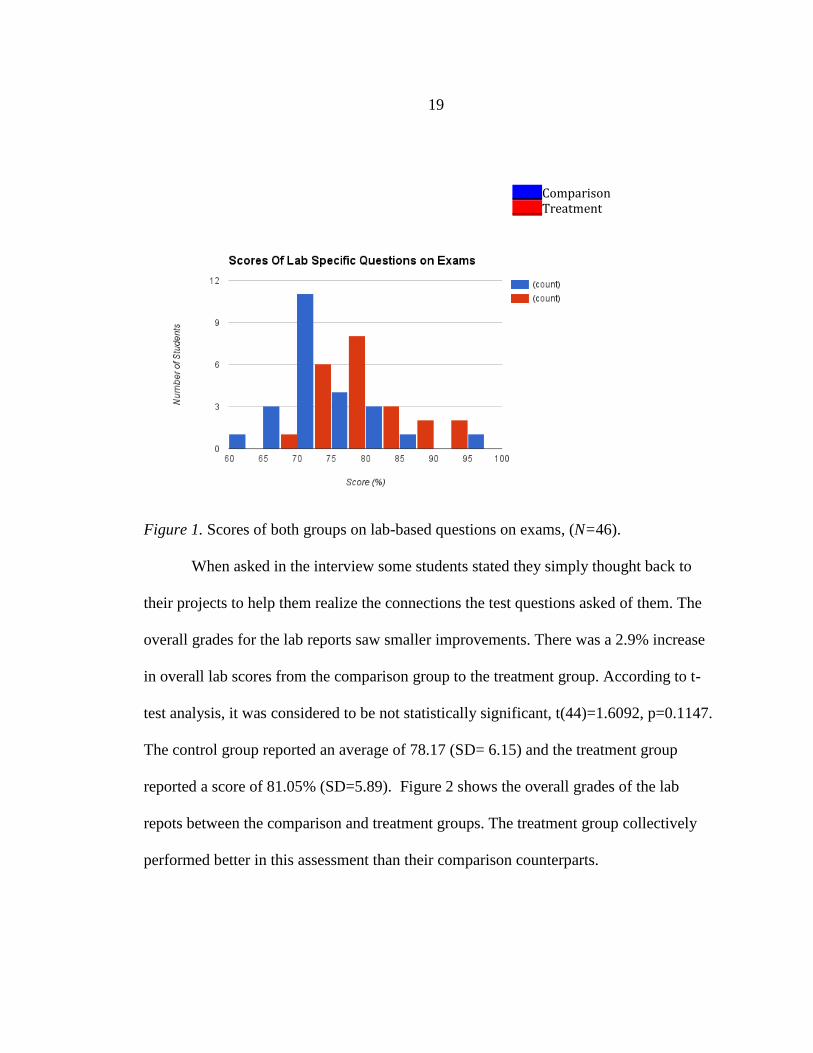
19
Figure 1. Scores of both groups on lab-based questions on exams, (N=46).
When asked in the interview some students stated they simply thought back to
their projects to help them realize the connections the test questions asked of them. The
overall grades for the lab reports saw smaller improvements. There was a 2.9% increase
in overall lab scores from the comparison group to the treatment group. According to t-
test analysis, it was considered to be not statistically significant, t(44)=1.6092, p=0.1147.
The control group reported an average of 78.17 (SD= 6.15) and the treatment group
reported a score of 81.05% (SD=5.89). Figure 2 shows the overall grades of the lab
repots between the comparison and treatment groups. The treatment group collectively
performed better in this assessment than their comparison counterparts.
______Comparison ______Treatment

20
Figure 2. Comparative scores for lab report assignments, (N=46).
INTERPRETATION AND CONCLUSION
The initial proficiency of scientific writing of all the students in this research project
was less than satisfactory based on the previous lab semester’s reports, pre-intervention
surveys and quiz. Additionally, students had negative attitudes towards the traditional lab
report format as they failed to see the relevance in learning and practicing the format and the
effect it has on their daily lives. Thus, the framework of the alternative project provided a
more explicit avenue for students to realize the application to the real world.
Students were better able to make real world connections using the alternative
method than they did when they used the traditional method. This isn’t to say every treatment
______Comparison ______Treatment

21
group student was able to do so, but there was improvement in the quantity of students
compared to the comparison group and also the quality of writing done by the treatment
group. The alternative method gave a clear and distinct format for students to see how
classroom work was exampled in today’s society. The students’ abilities to make those
necessary connections to evidence and real world relevancy became much stronger when
the alternative method was implemented.
Anecdotally, I was satisfied with my findings; however, I was rather disappointed
in the lack of statistical significance to support personal interpretations. I understand the
sample size was small and the window in which the data collected was short; however, I
had expected a higher volume of stronger opinions on surveys and a greater gap between
assessment scores. The statistical insignificance doesn’t mean there was no value in the
difference between groups, just that there wasn’t enough to support my initial claim. I
had originally expected the gains from lab reports to be far more significant than of the
test grades due to the fact the format was more familiar and preferable to the students.
However, the data shows the overall change was minimal.
A possible explanation for the less than expected margins could be because of
habits and perceptions the students formed throughout the prior lab reports. For example,
if a student has had a history of devoting low amounts time on traditional lab reports and
receiving acceptable grades, the level of attention and preparation would be similar as the
student knows what the outcome could roughly be in correlation to the amount of time
devoted to the report. Because of such extraneous variables, there was not enough
evidence to state there was any statistically significant improvement in the grades.

22
To a certain extent, I am encouraged by the results because a continuation and/or
expansion of the research project may lead to more significant results. The gains, albeit
small, were seen as students responded more positively with the treatment approach than the
original method. Students seemed to make more genuine connections and appreciate the
intent of the labs. In the exit interviews, only two students from the treatment group
expressed a neutral or negative attitude towards the new method. One stated, “I can see how
it was supposed to help us see it in the real world, but it was harder for us to do”. This
student’s quotation highlights the underlying goal of deeper thinking where the student is
asked to develop an argument. Developing an argument implies there is a baseline of
knowledge and understanding of the content. It also implies an argument can be developed to
persuade the specific intended audience, which is critical for the effective learning (Berland
& Forte, 2010).
The purpose of this study was to find a way in which students still were able to
display their understanding of the lessons learned from a lab and do so in an applicable
manner. I believe implementing this particular treatment created that opportunity for the
students, which in turned, as noted by the data, resulted in overall improvement. As
previously mentioned research such as the works of Seufert (2003), Hand (2006), and Prain
(2003) stated true realization of applicability comes when personalization of the content is
fully harnessed. Even with the lack of statistical significance, I am encouraged as it may be
a preliminary step to seeing desired results as continued implementation and expansion of the
treatment method occurs.

23
VALUE
In the ever-changing landscape of science education, there has been a strong recent
push to shift the focus from content laden to process-oriented curriculum that challenges
students to ask “why” and “how”. The Next Generation Science Standards, which spearhead
this movement, has been adopted in 26 states in the country, including my home state of
Illinois. The newly framed standards emphasize the creation of environments in which
students find reason to connect with the curriculum. The connections made in my treatment
group paved the way for greater interest and understanding in the lessons. My students were
able to answer “why we were doing the lab” and “how it applied to our lives”. This deeper
and more robust understanding of lab purpose allowed for greater retention and appreciation.
After the data collection period had ended, I implemented the alternative treatment
method to the comparison group, and they too were responding in a very similar fashion to
how the treatment group responded originally. Students mentioned it was a “refreshing
alternative” that was “long overdue”.
The nature of science relies on inquiry and unique perspectives. In order for students
to each a lens to see things in such a way, they need to be given a direct reason to personalize
or give importance to a topic. This study has taught me the importance of placing relevance
to how I not only design labs, but my curriculum as a whole. Even if I am required to teach a
specific concept or content that initially may seem to have little relevance, this study has
taught me the valuable lesson of finding that unique perspective finding meaning and
application for it will pay great dividends to the overall student learning experience.

24
REFERENCES CITED

25
Berland, L., & Forte, A. 2010. When Students Speak, Who Listens? Constructing
Audience in Classroom Argumenation. International Conference of the Learning
Sciences. 1, 428-435
Brydon, B., Guarienti, K., Painter, H., Passmore, C., Porter, R., & Robb, J. (2010).
Writing better lab reports: A teacher research project to improve the quality of
students' writing. The Science Teacher, 77(1), 43.
Chen, Y. 2013. Writing An Argument To A Real Audience: Alternative Ways To
Motivate Students In Writing About Science. Teaching Science. 59(4), 8-12.
Dianovsky, M.T., & Wink, D. J. 2012. Student Learning Through Journal Writing In A
General Education Chemistry Course For Pre-Elementary Education Majors.
Science Education. 96(3). 543-565.
Glynn, S.M., & Muth, K. 1994. Reading & Writing To Learn Science: Achieving
Scientific Literacy. Journal of Research In Science Teaching. 31(9), 1057-1073.
Gunel, M., Hand, B., & McDermott M. A. 2009. Writing For Different Audiences:
Effects on High School Students’ Conceptual Understanding of Biology.
Learning And Instruction. 19(4), 354-367.
Gunstone, R. 1991. Reconstructing Theory From Practical Experience. American Journal
of Educational Research. 2(8), 67-77.
Hand, B., & Prain, V. 2001. Teachers Implementing Writing To Learn Strategies in
Junior Secondary Science: A Case Study. Science Education. 86(6), 737-755.
Hand, B., & Prain, V. 2006. Moving From Border Crossing To Convergence of
Perspectives In Language and Science Literacy Research and Practice.
International Journal of Science Education. 28(2-3), 101-107.
Haagen-Schuetenhoefer, C. 2012. Improving The Quality of Lab Reports by Using Them
As Lab Instruction. The Physics Teacher. 50(7), 430-433.
Hofstein, A., Shore, R., & Kipnis, M. 2004. Providing High School Chemistry Students
With Opportunities To Develop Learning Skills In An Inquiry-Type Laboratory:
A Case Study. Research Report. International Journal of Science Education.
26(16), 47-62.
Illinois Report Card. (2014). Retrieved July 3, 2015, from
http://illinoisreportcard.com/District.aspx?source=StudentCharacteristics&source
2=StudentDemographics&Districtid=05016225017.

26
McDermott, M., & Hand, B. (2013). The Impact of Embedding Multiple Modes of
Representation Within Writing Tasks on High School Students’ Chemistry
Understanding. Instructional Science. 4 (1), 217-246.
Midgette, E., Haria, P., & MacArthur C. (2008). The Effects of Content and Audience
Awareness Goals for Revision on the Persuasive Essays of Fifth and Eighth-
Grade Students. Reading and Writing. 21(2), 131-151.
National Research Council. 1996. The National Science Education Standards.
Seufert, T. 2003. Supporting Coherence Formation In Learning From Multiple
Representations. Learning and Instruction. 13(2), 227-237.

27
APPENDICES
28
APPENDIX A
ALTERNATIVE METHOD OPTION LAB 1: GENETICS

29
Genetic Pedigree Lab
Who’s The Real Son?
Cindy is happily married to Cody. They have a son together, Paul, whom they spoil, as he is their
only child...or that’s what they thought. One day a man named Frank, who is similar to Paul’s
age, shows up at their front door claiming to be their real son. He claims he was switched at birth
with Paul at the hospital and as a result was forced to live abroad until now. Confused, shocked,
and disturbed, Cindy began to investigate Frank’s claims. She had everyone in her extended
family take a blood test and this is what she found out.
First the family tree:
Cindy’s grandpa, Rob, is married to Julie.
Rob and Julie have four daughters: Rachel, Linda, Cassie, and Stacy.
Rachel married Bill and have a son, Andy.
Stacy married Brian (who has a twin brother Stephen) and had a daughter Cindy.
Cindy is married Cody and have a son (Paul or Frank?)
Based on the given information:
Build a family pedigree
Complete the blood types chart below by testing given samples
Decide who Linda’s real son is.
FILL CHART BELOW:
Name Blood
Genotype
Blood
Type
Rob
Julie
Stacy
Cassie
Linda
Rachel
Bill
Andy
Brian
Stephen
Brian’s mom
Brian’s dad
Cody IB IB
Cindy
Frank
Paul
Name A Allele? B Allele?
Rob
Julie
Stacy
Cassie
Linda
Rachel
Bill
Andy
Stephen
Brian
Brian’s mom
Brian’s dad
Cody
Cindy
Frank
Paul
Blood Test Results
30
FAMILY PEDIGREE
Cindy & Cody’s real son: ___________________________
Supporting Evidence:
Pedigree Lab Part 2
Objective:

31
Using the samples, materials, pedigree, and research information given at
your station, you and your group need to determine the possible outcomes
of the genetic cross (between A and B) and then accurately identify which
of the three tested genetic diseases is autosomal recessive, sex-linked
dominant, and sex-linked recessive.
RESULTS:
32
Genetic Disease #1 __________________________________
Genetic Disease #2 __________________________________
Genetic Disease #3 __________________________________
You will be writing a formal lab report for this lab.
33
APPENDIX B
ALTERNATIVE METHOD OPTION LAB 2: EVOLUTION
34
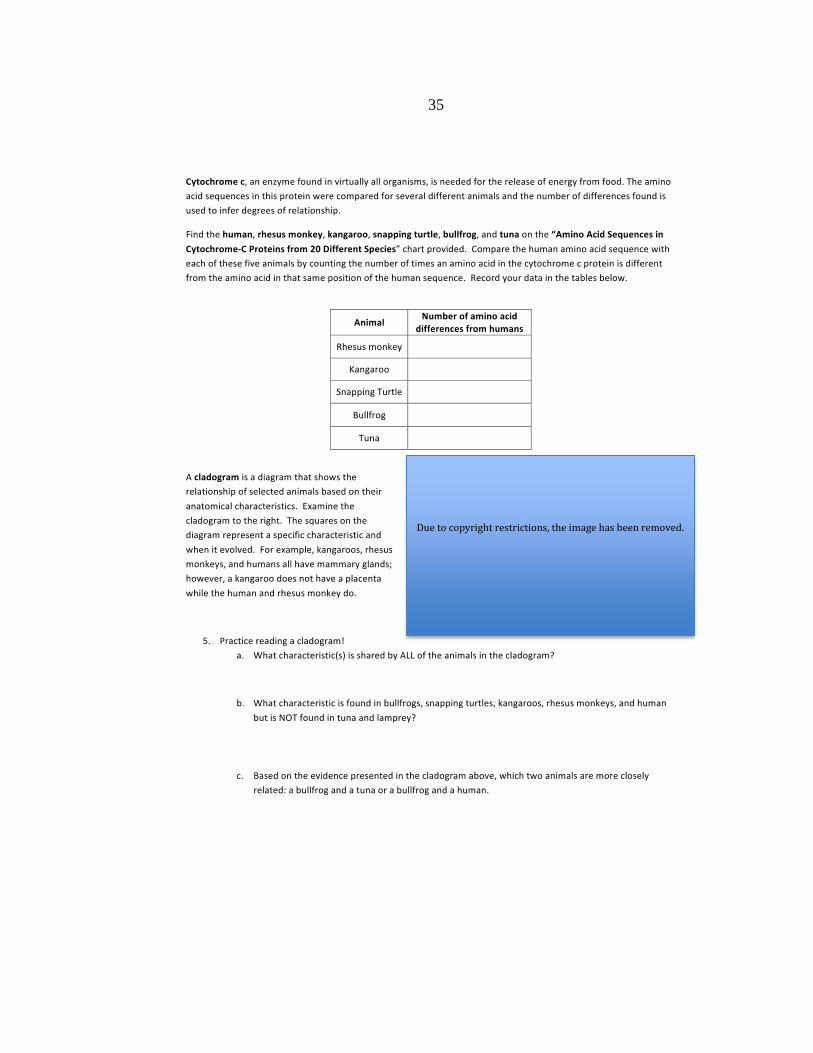
Name%_______________________________________________%Date%_________________%Period%______________%
Evidence(for(Evolution(
When%Darwin%laid%out%his%hypothesis%and%published%On#the#Origin#of#Species,%he%had%no%knowledge%of%genetics,%
molecular%biology,%or%any%our%modern%understanding%of%life%on%earth.%%While%evolution%and%Darwin’s%ideas%about%
natural%selection%are%considered%to%be%theories,%much%scientific%research%has%sought%to%provide%support%for%this%
theory.%%This%evidence%of%evolution%includes,%but%is%not%limited%to%studies%in%the%areas%of%biochemistry,%embryology,%
anatomy,%and%paleontology.%%In%this%investigation,%you%will%examine%different%pieces%of%evidence%which%provide%
support%for%Darwin’s%basic%ideas%about%evolution.%%%
Those%types%of%evidence%include:%Molecular%Evidence,%Fossils,%Comparative(Embryology,%Comparative(Anatomy%
(Vestigial,%Homologous,%and%Analogous(Structures),%and%Current(Research(on(Natural(Selection.%%%
Molecular(Evidence(
1. Do%you%think%a%mouse%will%be%more%similar%to%a%chicken%or%a%whale?%%Explain%your%reasoning.%%%
%
%
%
Hox(genes%are%responsible%for%laying%out%the%basic%body%plans%for%many%animals%including%human,%flies,%worms,%and%
mice.%%These%sequences%instruct%the%developing%embryo%as%to%where%to%place%the%head,%tail,%legs,%etc.%Since%so%many%
animals%have%Hox%genes,%examination%of%these%genes%can%provide%evidence%for%evolution%and%contribute%to%our%
understanding%of%how%species%are%related%to%each%other.%%Examine%the%small%sequence%of%DNA%for%the%Hoxc8%gene%in%
the%following%animals:%mouse,%baleen%whale,%and%chicken.%%%
2. What%percentage%of%the%nucleotides%in%the%baleen%whale’s%DNA%are%different%from%the%mouse?%%________%
(HINT:%Divide%the%number%of%nucleotides%which%differ%by%the%total%number%of%nucleotides.%Multiply%by%100)%%
%%%
3. What%percentage%of%the%nucleotides%in%the%chicken%is%different%from%those%of%the%mouse?%___________%
%
4. On%the%basis%of%molecular%similarities,%do%you%think%the%mouse%is%more%closely%related%to%a%baleen%whale%or%a%
chicken?%%%%
%%%%
%
%
%
%
%
Due to copyright restrictions, the image has been removed.
Due to copyright restrictions, the image has been removed.
35
Due to copyright restrictions, the image has been removed.

36
Due to copyright restrictions, the image has been removed.
Due to copyright restrictions, the image has been removed.
Due to copyright restrictions, the image has been removed.
37
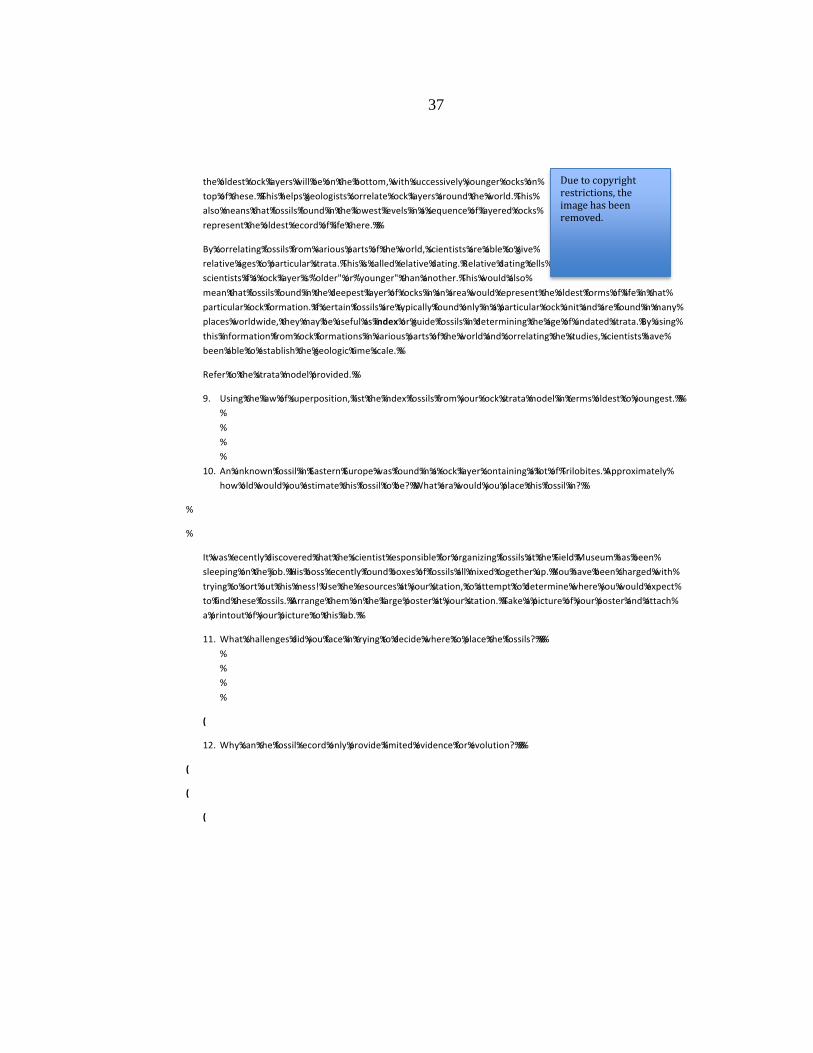
the%oldest%rock%layers%will%be%on%the%bottom,%with%successively%younger%rocks%on%
top%of%these.%%This%helps%geologists%correlate%rock%layers%around%the%world.%This%
also%means%that%fossils%found%in%the%lowest%levels%in%a%sequence%of%layered%rocks%
represent%the%oldest%record%of%life%there.%%%
By%correlating%fossils%from%various%parts%of%the%world,%scientists%are%able%to%give%
relative%ages%to%particular%strata.%This%is%called%relative%dating.%Relative%dating%tells%
scientists%if%a%rock%layer%is%"older"%or%"younger"%than%another.%This%would%also%
mean%that%fossils%found%in%the%deepest%layer%of%rocks%in%an%area%would%represent%the%oldest%forms%of%life%in%that%
particular%rock%formation.%If%certain%fossils%are%typically%found%only%in%a%particular%rock%unit%and%are%found%in%many%
places%worldwide,%they%may%be%useful%as%index%or%guide%fossils%in%determining%the%age%of%undated%strata.%By%using%
this%information%from%rock%formations%in%various%parts%of%the%world%and%correlating%the%studies,%scientists%have%
been%able%to%establish%the%geologic%time%scale.%%
Refer%to%the%strata%model%provided.%%
9. Using%the%law%of%superposition,%list%the%index%fossils%from%your%rock%strata%model%in%terms%oldest%to%youngest.%%%
%
%
%
%
10. An%unknown%fossil%in%Eastern%Europe%was%found%in%a%rock%layer%containing%a%lot%of%Trilobites.%Approximately%
how%old%would%you%estimate%this%fossil%to%be?%%What%era%would%you%place%this%fossil%in?%%
%
%
It%was%recently%discovered%that%the%scientist%responsible%for%organizing%fossils%at%the%Field%Museum%has%been%
sleeping%on%the%job.%%His%boss%recently%found%boxes%of%fossils%all%mixed%together%up.%%You%have%been%charged%with%
trying%to%sort%out%this%mess!%Use%the%resources%at%your%station,%to%attempt%to%determine%where%you%would%expect%
to%find%these%fossils.%%Arrange%them%on%the%large%poster%at%your%station.%%Take%a%picture%of%your%poster%and%attach%
a%printout%of%your%picture%to%this%lab.%%
11. What%challenges%did%you%face%in%trying%to%decide%where%to%place%the%fossils?%%%%
%
%
%
%
(
12. Why%can%the%fossil%record%only%provide%limited%evidence%for%evolution?%%%%
(
(
(
Due to copyright restrictions, the image has been removed.

38
Comparative(Embryology((
As%we%learned%previously,%fertilization%occurs%from%the%union%between%sperm%and%
egg.%%The%resultant%zygote%then%begins%to%divide,%forming%an%embryo.%%Even%
during%the%earliest%stage%of%blastocyst%formation,%the%embryos%of%animals%from%
different%groups%share%many%characteristics.%%In%comparisons%of%vertebrate%
embryos%many%similarities%exist%well%beyond%the%initial%differentiation.%%As%the%
embryos%grow%and%develop,%they%become%less%and%less%alike.%%Therefore,%
scientists%can%use%the%studying%of%embryos%to%determine%how%closely%related%organisms%may%be.%%%
At%your%station,%you%will%find%several%drawings%three%stages%of%embryo%development%for%a%fish,%turtle,%chicken,%
pig,%and%human.%%%
13. Make%a%prediction!%%Which%animals%would%you%expect%to%have%embryos%most%similar%to%each%other?%%Give%
arguments%for%your%reasoning.%%%%
%
%
%
%
%
Remove%the%drawings%from%the%envelope%and%for%each%animal,%try%to%arrange%them%in%order%from%the%earliest%
stage%embryo%to%the%latest%stage.%%When%you%are%finished,%check%your%answers%and%answer%the%questions%below.%%%
14. Examine%the%embryos%in%the%proper%order.%%What%similarities%do%you%observe%in%the%embryos%all%of%the%
species?%%Identify%AT%LEAST%3%characteristics%that%can%be%observed%in%all%of%the%species%examined.%%%
%
%
%
%
15. Examine%the%embryo%characteristics%in%the%SECOND%row.%%What%characteristics%would%help%you%to%determine%
which%embryo%goes%with%which%animal?%%%
%
%
%
16. Based%on%the%evidence%presented%in%this%exercise,%which%animals%are%most%closely%related%to%each%other?%%%
%
(
(
(
(
Due to copyright restrictions, the image has been removed.
Due to copyright restrictions, the image has been removed.
39
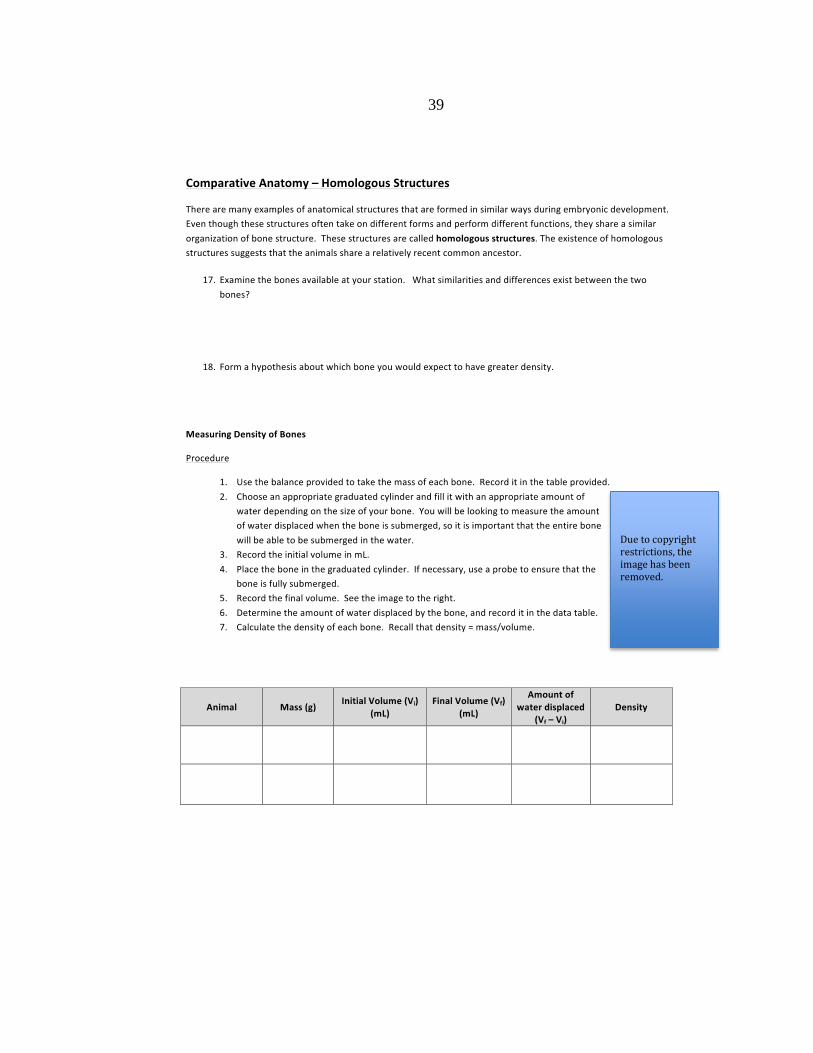
Due to copyright restrictions, the image has been removed.

40
19. How%do%your%results%compare%to%your%hypothesis?%%%
%
%
%
20. %Why%do%you%think%there%was%a%difference%between%the%densities%of%these%two%bones?%%Be%sure%to%discuss%the%
density%of%the%bone%in%relation%to%its%function,%the%animal’s%environment,%and%the%animal’s%survival.%%
%
%
%
%
%
%%
21. In%general,%how%would%you%expect%the%density%of%a%fish%bone%to%compare%to%a%human%bone?%%Explain%your%
reasoning.%%%
%
%
%
Comparative(Anatomy(–(Analogous(Structures(
There%are%also%many%examples%of%body%structures%in%animals%that%are%very%similar%in%function%and%superficially%similar%in%form,%however,%they%develop%very%differently.%%These%structures%are%called%analogous(structures.%%The%evolution%of%analogous%structures%leads%a%pattern%of%evolution%known%as%convergent(evolution.%%%
%%
22. Consider%the%three%animal%figurines%at%your%station:%a%shark%(a%
cartilaginous%fish),%a%whale%(a%mammal),%and%an%ichthyosaur%(an%extinct%reptile).%%Identify%3%physical%
characteristics%shared%by%all%three%organisms.%%%%
%
%
%
%%
23. Using%your%understanding%of%natural%selection,%explain%HOW%these%three%species%evolved%to%have%such%a%
strong%resemblance%for%each%other%despite%the%fact%that%they%are%not%closely%related.%%%
%
%
%
%
%
Due to copyright restrictions, the image has been removed.

41
%
24. %Provide%2%different%examples%of%pairs%of%animals%(not%mentioned%above)%which%exhibit%analogous%structures.%%%%
%
% Animals( Which(structures(are(analogous?(
Example(1( % %
Example(2( % %
%
Comparative(Anatomy(D(Vestigial(Structures(
Vestigial%structures%refer%to%parts%of%an%organism%which%have%lost%most%or%all%of%
their%original%function%in%the%course%of%evolution.%%The%existence%of%vestigial%
structures%provides%clues%as%to%the%evolutionary%origins%of%a%species%because%
vestigial%structures%are%remnants%of%the%species%ancestors.%%%
25. Examine%the%diagram%of%a%whale%skeleton.%%Although%a%whale%does%not%have%legs,%you%might%notice%the%
presence%of%a%pelvis%and%femur.%%These%bones%are%considered%to%be%vestigial.%%What%does%the%presence%of%
these%bones%suggest%about%the%ancestor%of%a%whale?%%
%
%
%
%
%%
26. What%structures%might%be%considered%vestigial%in%humans?%%Complete%the%following%table.%%%
%
%
Name(of(Structure(What(do(you(think(our(ancestors(
used(this(structure(for?(((Why(don’t(we(use(this(structure(
anymore?(((
% % %
% % %
% % %
Due to copyright restrictions, the image has been removed.
42
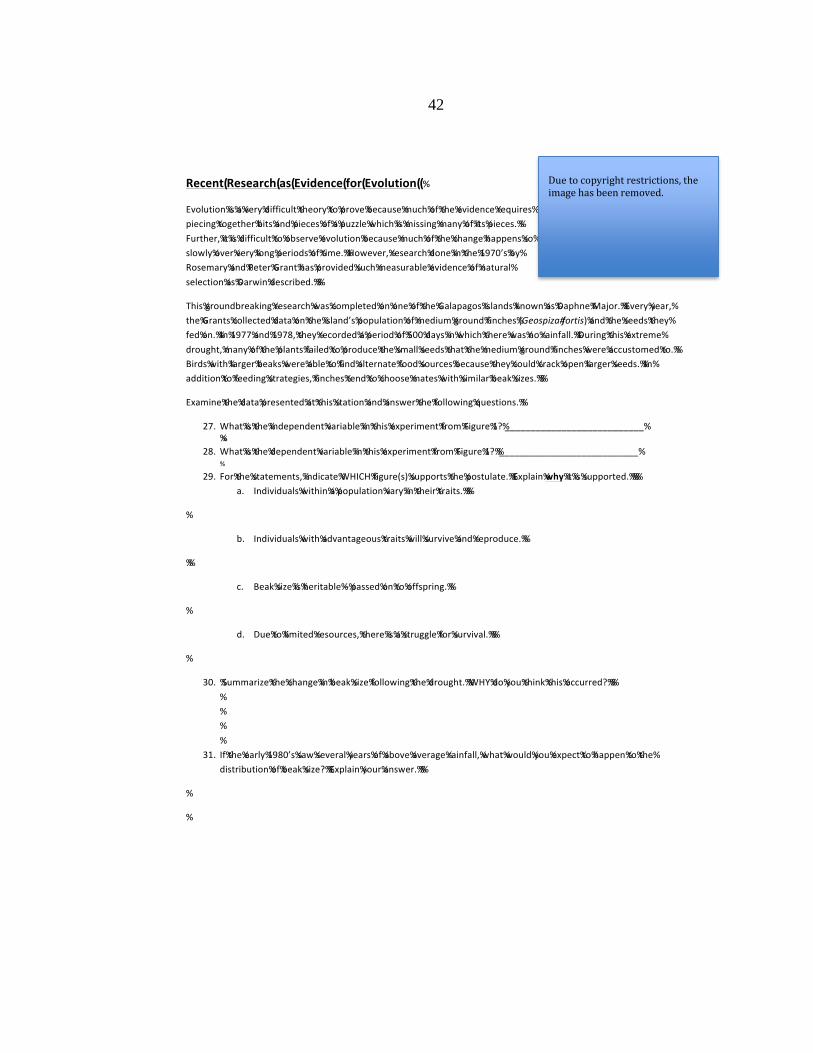
Recent(Research(as(Evidence(for(Evolution((%
Evolution%is%a%very%difficult%theory%to%prove%because%much%of%the%evidence%requires%
piecing%together%bits%and%pieces%of%a%puzzle%which%is%missing%many%of%its%pieces.%%
Further,%it%is%difficult%to%observe%evolution%because%much%of%the%change%happens%so%
slowly%over%very%long%periods%of%time.%%However,%research%done%in%the%1970’s%by%
Rosemary%and%Peter%Grant%has%provided%such%measurable%evidence%of%natural%
selection%as%Darwin%described.%%%
This%groundbreaking%research%was%completed%on%one%of%the%Galapagos%Islands%known%as%Daphne%Major.%%Every%year,%
the%Grants%collected%data%on%the%island’s%population%of%medium%ground%finches%(Geospiza#fortis)%and%the%seeds%they%
fed%on.%%In%1977%and%1978,%they%recorded%a%period%of%500%days%in%which%there%was%no%rainfall.%%During%this%extreme%
drought,%many%of%the%plants%failed%to%produce%the%small%seeds%that%the%medium%ground%finches%were%accustomed%to.%%
Birds%with%larger%beaks%were%able%to%find%alternate%food%sources%because%they%could%crack%open%larger%seeds.%%In%
addition%to%feeding%strategies,%finches%tend%to%choose%mates%with%similar%beak%sizes.%%%
Examine%the%data%presented%at%this%station%and%answer%the%following%questions.%%
27. What%is%the%independent%variable%in%this%experiment%from%Figure%1?%___________________________%%%
28. What%is%the%dependent%variable%in%this%experiment%from%Figure%1?%%___________________________%%
29. For%the%statements,%indicate%WHICH%figure(s)%supports%the%postulate.%%Explain%why%it%is%supported.%%%%
a. Individuals%within%a%population%vary%in%their%traits.%%%
%
b. Individuals%with%advantageous%traits%will%survive%and%reproduce.%%
%%
c. Beak%size%is%heritable%–%passed%on%to%offspring.%%
%
d. Due%to%limited%resources,%there%is%a%struggle%for%survival.%%%
%
30. %Summarize%the%change%in%beak%size%following%the%drought.%%WHY%do%you%think%this%occurred?%%%
%
%
%
%
31. If%the%early%1980’s%saw%several%years%of%above%average%rainfall,%what%would%you%expect%to%happen%to%the%
distribution%of%beak%size?%%Explain%your%answer.%%%
%
%
Due to copyright restrictions, the image has been removed.
43
APPENDIX C
ALTERNATIVE METHOD OPTION LAB 3: BIODIVERSITY
44
Bio 163
Name____________________________ Period________
Unit 9: Biodiversity
Bread Mold Investigation
Background
Centuries ago people treated infections in a rather curious way. They often placed
decaying breads, cheeses, and fruits such as oranges on the infection. Although the
people did not have a scientific reason to do this, every once in a while the infection was
cured. What these people did not know was that the cure was due to a type of fungus,
called mold, which grows on some foods.
In 1928, the Scottish scientist, Sir Alexander Fleming found out why this treatment
worked. Fleming discovered that a substance produced by the blue-green mold
Penicillium could kill certain bacteria that caused infections. Fleming named the
substance Penicillin. Since that time Penicillin, an antibiotic, has saved millions of lives.
Have you ever seen mold growing on bread? Bread mold looks like tiny fluffs of cotton.
The fluffs are groups of long hyphae that grow over the surface of bread. Shorter hyphae
grow down into the bread and resemble tiny roots. The shorter hyphae release enzymes
that break down chemicals in the bread. The broken-down chemicals are foods for the
mold and are absorbed by the hyphae.
The tiny black spheres on bread mold are spore cases, which produce spores. The spores
are carried from one place to another through the air. When the spores land on food, they
begin to develop into a new mold.
Due to copyright restrictions, the image has been removed.

45
Hypothesis
Predict what will happen as a result of your changing one variable in the procedure
below. Will bread mold growth (when compared to the class control) be inhibited,
promoted, or not affected?
Materials
1 Ziploc Bag
1 Slice of White Bread
Tape
Spray Bottle of Water
Other materials as used (record what & how much you used)
Procedure
Control (demo as a class)
1. Place one slice of white bread in a plastic container
2. Moisten bread with 10 sprays of water
3. Seal container with tape and place in a dark cabinet (at room temperature).
Experimental
4. Follow the same procedure as for the control except change one variable so that you
can see how it affects the growth of mold. (Write what you did as this part of step 4.)
5. Observe both the control and experimental bread every day.
6. Record your observations. Be specific and descriptive!
Observations
1. Record your observations every day.
2. Include drawings and/or photographs of your experiment.
*Remember, drawings and photographs are only useful if they are detailed and labeled
well enough to be understood by someone who has not actually done the lab.
Conclusion
Was your hypothesis supported or not supported by your data? Why?
Type a formal lab report with your group to discuss your findings.

46
APPENDIX D
LAB WRITE-UP REPORT FORMAT

47
Lab Write Up Format
(out of 28 points)
Title: Describes the lab content concisely, adequately and appropriately. I deally, the title should address both the
independent and dependent variables. Titles like “Termite Lab” or “Osmosis Lab Report” are inadequate. (1 point)
Date: The date(s) the experiment was conducted. (1 point)
Purpose: May be a statement or a question. (1 point)
Introduction: A few sentences to provide the reader with the necessary background information needed to
design/conduct the experiment and analyze data. Include information about the organism you are working with
and/or any concepts or principles that are relevant to your reader. Adequate background information will be a short
paragraph and likely require to do some research (3 points)
Hypothesis: Must be stated as an IF…..(independent variable), THEN….dependent variable. (1 point)
Materials: bullet list format, detailed, quantitates should be listed. (1 point)
Procedure: Numbered, step-by-step format. Describes the procedure used to gather data. Gives enough detail to
allow for a repeated experiment by other scientists. Include pictures/ diagrams if necessary. (2 points)
Variables: Identify the independent, dependent, and controlled variables, and control group (if present). (2 points)
Safety: Note and describe all reasonable safety concerns or hazards. Indicate if none are present. (1 point)
Results and Analysis: (4 points)
Data: Data must be arranged in charts, tables, etc. Graphs should follow if appropriate. Graphs alone are
not acceptable. Include labels and titles for graphs and tables.
Data Analysis: Summarize data in narrative format. Number and answer all analysis questions from the
lab (if present) in complete sentences.
Conclusion:
Paragraph 1- CLAIM (2 points)
Answer the question posed by your purpose. In other words, now that you have completed the
experiment what do you CLAIM to be an answer to your question? Restate your hypothesis and indicate
if the hypothesis is supported or rejected based on the data.
Paragraph 2- EVIDENCE (3 points)
Summarize and interpret the data you collected and how you collected it. Include averages of numerical
data. Do not restate the entire procedure, just summarize it.
Paragraph 3- REASONING & EXPERIMENTAL ERROR (6 points)
Explain how your data supports your claim. Discuss the importance of the experiment and what was
learned. Do some research to try to explain your results and if relevant, relate the results to your personal
experiences. Include statements like, “this makes sense/doesn’t make sense to me because…” and “from
my research…”. Connect the results to relevant biological concepts and characteristics of life. Discuss
sources (or possible sources) of experimental error and their effect on data. Address the reliability of the
data and what could be done differently to improve it. It is not acceptable to say that everything went
perfect. Indicate additional questions brought about by the results or further questions that could be
explored.

48
APPENDIX E
ALTERNATIVE METHOD OUTLINE

49
Mendelian Genetics Unit Name_________________________________
Role Audience Reports
For the next three units we will replace our usual lab reports with Role Audience
Rerports (R.A.R.’s). For R.A.R’s, you need to become a specific role and present your
lab findings to a distinctive audience. For example, if this was assigned during Unit 1, a
possible R.A.R. could have been:
After collecting data and concluding results from the Pillbug Preference Lab, you will
present your findings as a children’s book author presenting the information to an
audience of 4th graders.
For this current Pedigree Lab in our Mendelian Genetics Unit, you will take the role of a
geneticist telling the Hoffman Family of the level of risk their unborn child may have to
the three genetic diseases the lab investigated. Since the Hoffman’s are not familiar with
the scientific terminology, but very interested to know the complete details, you are to
clearly explain the data you collected and how you came to your conclusions. If you
would like to do a different R.A.R., please have it pre-approve by me before starting your
report.
Evolution Unit Name_________________________________
Role Audience Reports
For this unit’s R.A.R., create a short story to another episode of Sherlock Holmes.
Sherlock and Watson are investigating the claim that “there is no evidence whales were
the evolutionary ancestor of land dwelling mammals”. You are to create a short story or
comic strip that details Sherlock and Watson’s explanation to the data found from the
Speciation Lab to prove your claim. If you would like to do a different R.A.R., please
have it pre-approve by me before starting your report.
Biodiversity Unit Name_________________________________
Role Audience Reports
For this unit’s R.A.R, you will present your findings from the Bread Mold Lab as local
health officials through means of a Public Service Announcement to inform the general
public of the best environment to reduce mold growth on food such as bread. If you
would like to do a different R.A.R., please have it pre-approve by me before starting your
report.

50
APPENDIX F
ALTERNATIVE METHOD GRADING RUBRIC

51
Grading Rubric
Your Lab:_____________________________________ Points
Introduction
- Background information is sufficiently provided.
- Rationale to why specific independent variable was selected
was well incorporated into the project.
______ / 4
Data & Analysis
- Correct type of data was collected in your experimented
- The data was properly analysed.
- The evidence (from analysis) was incorporated and
appropriately presented in your project.
______ / 6
Conclusion
- Claim was distinctly stated
- Reasoning was sufficient
-Proper explanation of overall purpose
-Why the results make sense
-additional research to support evidence
______ / 10
RAFT – Role, Audience, Format, Topic
- RAFT is well established
- Format is consistent with RAFT selected
______ / 4
Presentation
- Quality of work
- Interesting and engaging… don’t be BORING!
- Professionalism
______ / 4
Total
______ / 28
Comments:

52
APPENDIX G
PRE-INTERVENTION LAB REPORT QUIZ

53
Lab Report Quiz
Name_________________________________
1a. What is mentioned in the claim of your lab report?
1b. Why is the claim portion essential to your lab report?
2a. What is mentioned in the evidence of your lab report?
2b. Why is the evidence portion essential to your lab report?
3a. What is mentioned in the reasoning of your lab report?
3b. Why is the reasoning portion considered the most important part of your report?
4. What is the purpose of a lab report?

54
APPENDIX H
STUDENT PRE-INTERVENTION SURVEY

55

56
APPENDIX I
POST INTERVENTION INTERVIEW QUESTIONS

57
R.A.R. Student Interview
Student’s Grade In Class:_________________
Student’s Grade on R.A.R.:_______________
1. Tell me about your experience with the R.A.R. format. What do you like about it?
Dislike?
2. How was it different to our traditional report format?
3. Which did you prefer? Why?
4. How do you think the traditional format can be improved to better help you
present what you understand about the lab and content?
5. How do you think the R.A.R. format can be improved to better help you present
what you understand about the lab and content?
58
APPENDIX J
LAB SPECIFIC QUESTIONS FROM UNIT EXAMS

59
GENETICS
45. Mr. Jones, the wealthiest man in the state of Illinois, recently died. Since his death, 3
women have come forward claiming to have a child by Mr. Jones. They are demanding a
share of his estate. Can any of the three children be Jones’s?
a. Yes, X’s child could be Jones’s
b. Yes, Y’s child could be Jones’s
c. Yes, Z’s child could be Jones’s
d. No, none of these children could be Mr. Jones’s
Free Response #1
How can genetic screening be beneficial to a couple planning to have a baby?
Free Response #3
How can karyotypes be used to help determine future traits of offspring?
EVOLUTION
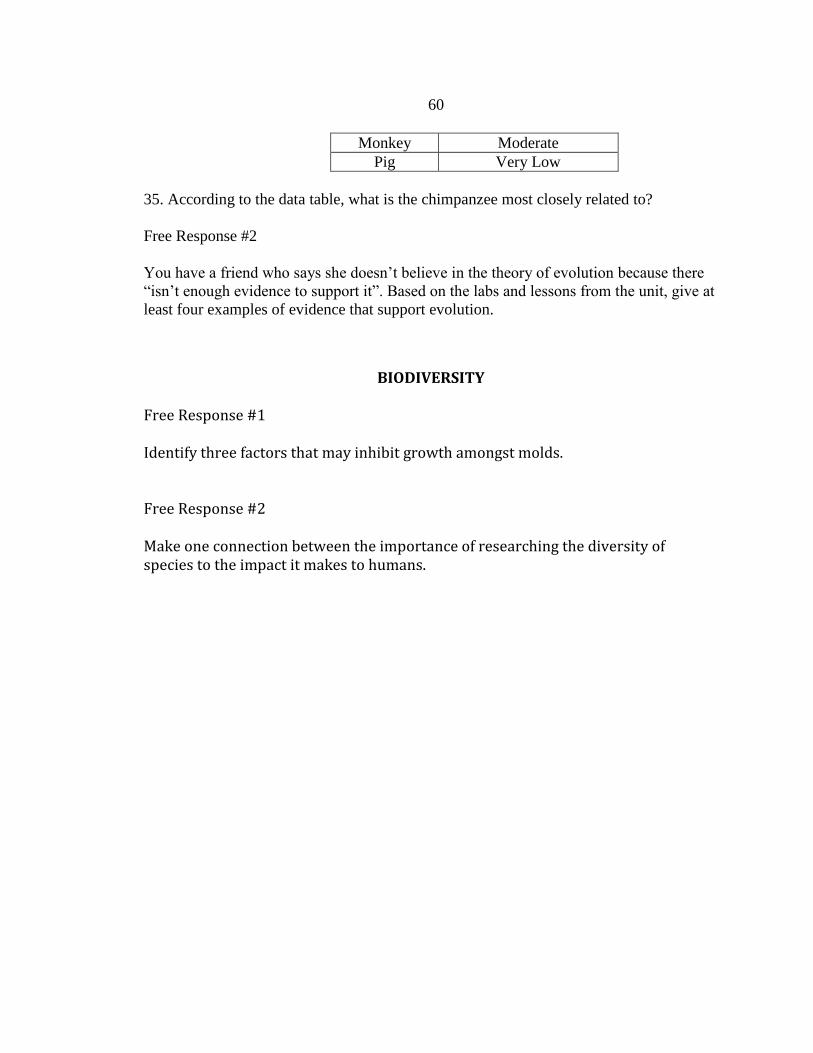
Imagine you are a biotechnologist. You have injected chimpanzee blood into a rabbit.
The immune system of the rabbit recognized the chimpanzee blood protein as foreign and
produced antibodies. The rabbit's antibodies were then extracted and developed as a
serum. When the serum is added to blood samples in different test tubes removed from of
a variety of different animals, a precipitate forms. The more precipitate forms, the more
closely related the animal is to the chimpanzee. The table below that shows the
percentage precipitate formed in this investigation.
Animal
Species
Percentage Percipitate
Formed
Gorilla Very High
Baboon High
Person Blood Type Mr. Jones O
Ms. X A Child X AB Ms. Y O
Child Y A Ms. Z B
Child Z B
60
Monkey Moderate
Pig Very Low
35. According to the data table, what is the chimpanzee most closely related to?
Free Response #2
You have a friend who says she doesn’t believe in the theory of evolution because there
“isn’t enough evidence to support it”. Based on the labs and lessons from the unit, give at
least four examples of evidence that support evolution.
BIODIVERSITY
Free Response #1 Identify three factors that may inhibit growth amongst molds. Free Response #2 Make one connection between the importance of researching the diversity of species to the impact it makes to humans.
Related Documents