2016 STATE OF THE DELAWARE INLAND BAYS Presented by The Delaware Center for the Inland Bays

Welcome message from author
This document is posted to help you gain knowledge. Please leave a comment to let me know what you think about it! Share it to your friends and learn new things together.
Transcript

PB
2 016 S TAT E O F T H E D E L AWA R E I N L A N D B AY S
Presented byThe Delaware Center for the Inland Bays

ACKNOWLEDGEMENTS
Report Authors Marianne Walch, Emily Seldomridge, Andrew McGowan, Sally Boswell, and Christopher Bason
Lead EditorSally Boswell
This report may be found at inlandbays.org.
This project has been funded in part by friends of the Inland Bays, by the Delaware Department of Natural Resources and Environmental Control, and by the United States Environmental Protection Agency under assistance agreements CE09939912 and CE09939913 to the Delaware Center for the Inland Bays. The contents of this document do not necessarily reflect the views and policies of the Environmental Protection Agency, nor does the EPA endorse trade names or recommend the use of commercial products mentioned in this document.
Design and ProductionJoanne Shipley
GIS MapsPeter Marsey, CardnoAndrew Homsey, University of DelawareAndrew McGowan, CIB
We would like to thank the following people and organizations for their invaluable assistance with data collection, preparation, analysis, editing, images, and advice for the State of the Bays 2016. Finally, without the work of the many dedicated and talented professional and volunteer scientists of the Delaware Department of Natural Resources and Environmental Control, the University of Delaware, and CIB, this report would not be possible.
The Scientific and Technical Advisory Committee, Delaware Center for the Inland BaysScott Andres, Chair
CardnoStephanie BriggsDan CallPeter Marsey
Delaware Center for the Inland BaysBrittany Burslem Robert Collins Sean FlanaganKatie Goerger James Hanes, InternSteve Maternick Roy Miller Molly Struble, InternFocus Group Participants: Susie Ball, Dennis Bartow, Carol Bason, Pat Drizd, Diane Hansen, Gary Jayne, Pete Keenan, Steve Piron, Ab Ream, Barbara Shamp
Delaware Department of AgricultureChristopher BroschRobert ColemanJimmy KroonDaniel Woodall
Delaware Department of Natural Resources and Environmental Control Michael Bott Bruce ColeJohn ClarkGlenn DavisKate FlemingJustin FothMarcia FoxAnthony GonzonMichael GrecoEdward Hale Zina HenseSergio Huerta Anthony Hummel Susan LoveHassan MirsajadiTyler Monteith Scott NewlinRobert Palmer Alison RogersonJoe RogersonKathleen SaundersRobert ScarboroughDave Schepens John SchneiderKari St. LaurentBrittany Sturgis Robin Tyler Sharon Webb David WolanskiXia XieJordan Zimmerman
Delaware Department of Health and Social Services
Delaware Office of State Planning Coordination
RK&KJim Eisenhardt
Sussex CountyJayne Ellen DickersonHans Medlarz
Sky Jack PicsTJ Redefer
University of DelawareScott AndresKevin BrinsonJohn EwartAndrew HomseyDaniel LeathersTye Pettay Jack PuleoEdward C. RatledgeJoe ScudlarkBill UllmanJennifer VolkEd Whereat
University of Maryland Baltimore CountyMatt Baker
United States Army Corps of EngineersJeffrey Gebert
United States Environmental Protection Agency
United States Fish and Wildlife Service
United States Geological SurveyJudy Denver
Top cover photo: Marianne Walch
Bottom cover photo: Andrew McGowan

3
THE INLAND BAYS WATERSHED—QUICK FACTS • The watershed of the Inland Bays is 292 square
miles of land that drains to 35 square miles of bays and tidal tributaries. Located within Sussex County, Delaware on the mid-Atlantic coastal plain of the United States.
• Rehoboth Bay and Indian River Bay are tidally connected to the Atlantic Ocean by the Indian River Inlet. Little Assawoman Bay is connected by the Ocean City Inlet 10 miles to the south in Maryland.
• The Bays are shallow, generally less than 7 feet, and have an average tidal range of 3 feet.
TABLE OF CONTENTS
Executive Summary ........................................................4–5How We Assess the Health of the Bays .............................. 6
WATERSHED CONDITION .......................................7–18Human Population Growth ................................................. 8Land Use Change ........................................................10–11Impervious Surface Coverage .....................................12–13Water Quality Buffers on Croplands ................................. 14Salt Marsh Acreage and Condition .................................. 15Natural Habitat Protection and Restoration ................16–17Indian River Inlet Flushing ................................................ 18
MANAGING NUTRIENT POLLUTION .....................20–29Input of Nutrients from Point Sources .............................. 22Input of Nutrients from the Atmosphere .......................... 23Input of Nutrients from Nonpoint Sources ..................24–25Agricultural Nutrient Management Practices ..............26–27Septic System Conversion to Central Sewer .................... 28Stormwater Retrofits ........................................................ 29
WATER QUALITY....................................................30–39Algae Concentration ........................................................ 31 Concentrations of Nutrients ........................................32–33 Water Clarity ..................................................................... 34 Water Quality Index .......................................................... 35Dissolved Oxygen Concentration................................36–37Seaweed Abundance ..................................................38–39
LIVING RESOURCES ..............................................40–54 Bay Grasses ...................................................................... 41Eagle and Osprey Nesting ............................................... 42Hard Clam Landings ......................................................... 43Winter Waterfowl Counts ............................................44–45Box: Oyster Enhancement ................................................ 46Blue Crab Abundance ...................................................... 47Fish Abundance ...........................................................48–50Box: Shore-Zone Fish ....................................................... 51Number of Fish Kills ......................................................... 52Recreational Fishing Statistics .....................................53–54
HUMAN HEALTH RISKS .........................................55–60 Bacteria Pollution ........................................................56–57Approved Shellfish Growing Waters............................58–59Fish Consumption Advisories ........................................... 60
CLIMATE ................................................................61–66Carbon Dioxide Concentration and Air Temperature ...... 62Sea Level Rise ................................................................... 63Growing Season Length ................................................... 64Precipitation ..................................................................... 65 Ocean Acidification .......................................................... 66
References ...................................................................68–70

44
The population in the watershed more than doubled between 1990 and 2010 when the last census was conducted. Population growth is driving many of the changes that are impacting the Inland Bays.
After a slowdown brought about by the recession that began in 2008, intense development is underway again, much of it near waterways where water quality impacts can be the greatest. With development comes impervious surfaces. Parking lots, roadways and roofs now cover over 10% of the watershed’s land area—a point at which studies show detrimental impacts to water quality in estuaries.
Nutrient pollution from nitrogen and phosphorus remains the greatest threat to water quality in the Bays, but actions taken to reduce nutrient inputs give reason for optimism.
The volume of tidal water passing through the inlet has increased over time. This helps flush out nutrients, but has also contributed to degradation of marshes in the Bays.
Overall, water quality in the Inland Bays remains fair to poor, though Little Assawoman Bay and open waters near the inlet are showing some improvements.
More than 6,800 homes on septic systems were connected to central sewer since 2011, and discharges from point sources are down more
than 80% since the 1990s with only two ‘point sources’ of pollution to the Bays remaining out of thirteen.
Voluntary actions to reduce nutrient pollution, prescribed by the Pollution Control Strategy for agriculture and stormwater, show little progress, highlighting the need for dedicated funding.
Human health risks continue for those using the Bays for recreation. Most tributaries and canals continue to have very poor water quality and are unsafe for swimming or for the harvest of shellfish.
As the watershed urbanizes, loss of wetlands and natural shorelines impact both migrating and resident animal populations. Blue Crab populations remain low, and recreational fishing and its local economic benefits have not yet rebounded from losses brought about by the recession. Bald Eagles and Ospreys are thriving in the Inland Bays, and hard clam populations have been stable since the 1970s. Bay grasses, a signature species of healthy coastal bays, are still largely absent from the Inland Bays due to nutrient pollution.
Global emissions of carbon dioxide are bringing higher air temperatures, a longer growing season, and warmer Bays. Sea level in Delaware is now rising at a rate of 1.1 feet per century and is projected to increase to nearly five feet by 2100.
Development driven by rapid population growth is increasing the acreage of impervious surface coverage, adding to urban pollution sources, and stressing habitats. Agricultural pollution is decreasing as land uses change. Increased flushing at the inlet has improved water quality in open Bay waters.
Watershed Condition Overview
The population of the Inland Bays watershed is growing, and the landscape is rapidly changing from farms and forests to residential and commercial development. Much of the development is concentrated around waterways where its potential impact on water quality is greatest.
Since the last report, development increased another 7.8 square miles (11%), replacing agricultural lands, upland forests, and wetlands.
With development comes more roads, parking lots and rooftops that generate polluted runoff to the Bays. The watershed as a whole has now exceeded 10% coverage by these impervious surfaces - a tipping point at which water quality has been found to degrade in estuaries. Balancing this is a reduction in the application of fertilizers that occurs when cropland is converted to other land uses.
Activities to protect natural habitats in the watershed have nearly stalled since the previous report was published. Saltmarshes are disappearing at higher rates. Funding and incentives for conservation, enhancement of forested buffers, and wetlands protection are needed.
The amount of water that moves in and out of the Bays through the Indian River inlet increased (by 11 – 24%) until 2004 and likely continues to improve water quality.
What these changes mean long-term for the watershed is uncertain. What is certain as population growth and urbanization continues is that the most effective technology for controlling storm water runoff and treating wastewater will be needed to protect the Bays.
WATERSHED CONDITION STATUS BAR
STATUS: FAIR
TREND: NEGATIVE
WATERSHED CONDITION
TREND: NEGATIVE
The remaining two point sources of nutrients should soon be removed from the Bays. Nonpoint source pollution remains above healthy limits. Septic conversions to central sewer have exceeded goals set in the Pollution Control Strategy, but other management progress has stagnated since 2011.
MANAGING NUTRIENT POLLUTION
TREND: POSITIVE
Water quality is improving in Little Assawoman Bay and in open waters near the Indian River Inlet. Algae and seaweed blooms have improved in some areas, but tributaries and canals are still murky and oxygen-starved.
WATER QUALITY
TREND: POSITIVE
EXECUTIVE SUMMARY
Restoring the Bays will require proactive planning and new environmental policies that implement the Inland Bays Comprehensive Conservation and Management Plan.
Of greatest need:
• Legislation that provides funding for the clean water projects that Delawareans say they want.
• Improved coordination between partners responsible for actions outlined in the Inland Bays Pollution Control Strategy.
• Public participation in the 2018 Sussex County Comprehensive Plan—to encourage land use and policies that protect the natural resources that are the bounty of healthy Inland Bays.
Looking down Love Creek to Rehoboth Bay Photo: TJ Redefer, Sky Jack Pics

4 5
Most tributaries and canals are unsafe for swimming or for the harvest of shellfish. Consumption advisories for Striped Bass and Bluefish caught in the Bays remain in effect.
Eagles and ospreys are commonly seen around the Bays. Clams and some fish populations are stable. Other species such as Blue Crabs and waterfowl have declined. Oysters and bay grasses are rare in the Bays.
LIVING RESOURCES
TREND: NO TREND
HUMAN HEALTH RISKS
TREND: NO TREND
Sea level rise and warming temperatures are a growing challenge for watershed communities, residents and Bay ecosystems. Increased flooding and wetlands loss can be expected.
Looking down Love Creek to Rehoboth Bay Photo: TJ Redefer, Sky Jack Pics
CLIMATE
TREND: NEGATIVE

6
How to Read the Status Bar
Status is indicated by a dot on the status bar. The farther to the left of the center the dot is, the more negative is the status of the group of indicators. The farther to the right of the center the dot is, the more positive the status. If the dot is in the center, the status is fair.
A trend arrow pointing to the left indicates a negative trend. A trend arrow pointing to the right indicates a positive trend. No trend arrow indicates a neutral or unknown trend.
HOW WE ASSESS THE HEALTH OF THE BAYS The 2016 State of the Delaware Inland Bays report is a compilation of environmental data about the Bays and their watershed. It provides communities, decision makers, and concerned citizens with robust scientific information that they can use to help restore and protect the bays and their resources.
To assess the health of the Inland Bays, a suite of environmental indicators was selected. These are specific species and conditions that are measured over time to determine how the Bays are changing and how much progress has been made toward restoration goals.
Thirty-five individual environmental indicators are grouped by subject matter and presented as the six chapters of the State of the Bays report. Each group is assigned a status and a trend by assessing its indicators together.
• The indicators are based on long-term measurements of environmental parameters and management actions
• Status and trends are assigned using best professional judgment and reviewed by scientists knowledgeable in these areas.
• For each indicator, long-term trends are addressed, as well as short-term changes that have occurred since the previous State of the Delaware Inland Bays report was published in 2011.
The State of the Delaware Inland Bays report is updated and published every five years. Most of the indicators used in developing this latest report are the same as those presented in the 2011 document. This allows us to continue to track trends and progress over the years. A few new indicators have been added in 2016, as new monitoring data have become available.
DELAWARE’S INLAND BAYS ARE COASTAL LAGOONS—bays that lie behind a narrow barrier island that separates them from the Atlantic Ocean. Traveling down Coastal Highway, through Dewey Beach, Bethany Beach and Fenwick, the Inland Bays lay to the west.
They are unique places where ‘the rivers meet the sea’…where freshwater flowing from the land and down tributaries mixes with seawater that flows through inlets carved into barrier islands.
A collage of saltmarshes, tidal flats, bay grass meadows, oyster reefs and winding saltwater creeks make up this environment. For thousands of years, the Bays have supported an abundance of fish and birds that come here to feed, reproduce, and grow. The beauty and productivity of this estuary now supports a thriving human culture and economy.
The Bays are dynamic, constantly changing in response to human activities and the climate.
Fifty or sixty years ago, the Bays were thought to be generally healthy: clear waters with plentiful bay grass meadows, productive oyster reefs, and oxygen levels that supported diverse and plentiful fish populations.
But years of accumulated nutrient pollution and habitat loss have changed the Bays to generally murky waters that are dominated by algae, have very few bay grasses or oysters, and do not support healthy oxygen levels in many areas. Habitat restoration and major pollution reductions are needed to restore water quality and achieve a healthy estuary once again.
Since the adoption of the 1995 Inland Bays Comprehensive Conservation and Management Plan and its 2012 Addendum, much progress has occurred toward these goals. Now some environmental indicators suggest that accomplishments made under the Plan are bearing fruit and may be moving the Bays back in a healthy direction. But there is still much work to be done.
VERY POOR POOR FAIR GOOD
POSITIVENEGATIVE
VERYGOOD
STATUS
TREND

6
WATERSH
ED C
ON
DITIO
N N
UTRIEN
T POLLU
TION
WATER Q
UA
LITYLIVIN
G RESO
URC
ESH
UM
AN
HEA
LTH RISKS
CLIM
ATE
7
WATERSHED CONDITIONThe population of the Inland Bays watershed is growing, and the landscape is rapidly changing from farms and forests to residential and commercial development. Much of the development is concentrated around waterways where its potential impact on water quality is greatest.
Since the last report, development increased another 7.8 square miles (11%), replacing agricultural lands, upland forests, and wetlands.
With development comes more roads, parking lots and rooftops that generate polluted runoff to the Bays. The watershed as a whole has now exceeded 10% coverage by these impervious surfaces—a tipping point at which water quality has been found to degrade in estuaries. Balancing this is a reduction in the application of fertilizers that occurs when cropland is converted to other land uses.
Activities to protect natural habitats in the watershed have nearly stalled since the previous report was published. Salt marshes are disappearing at higher rates. Funding and incentives for conservation, enhancement of forested buffers, and wetlands protection are needed.
The estimated volume of water moving in and out of the Bays through the Indian River Inlet increased by at least 11% since 1988, likely contributing to observed improvements in water quality in open Bay waters.
What these changes mean long-term for the watershed is uncertain. What is certain as population growth and urbanization continues is that the most effective technology for controlling storm water runoff and treating wastewater will be needed to protect the Bays.
Watershed Condition Overview
The population of the Inland Bays watershed is growing, and the landscape is rapidly changing from farms and forests to residential and commercial development. Much of the development is concentrated around waterways where its potential impact on water quality is greatest.
Since the last report, development increased another 7.8 square miles (11%), replacing agricultural lands, upland forests, and wetlands.
With development comes more roads, parking lots and rooftops that generate polluted runoff to the Bays. The watershed as a whole has now exceeded 10% coverage by these impervious surfaces - a tipping point at which water quality has been found to degrade in estuaries. Balancing this is a reduction in the application of fertilizers that occurs when cropland is converted to other land uses.
Activities to protect natural habitats in the watershed have nearly stalled since the previous report was published. Saltmarshes are disappearing at higher rates. Funding and incentives for conservation, enhancement of forested buffers, and wetlands protection are needed.
The amount of water that moves in and out of the Bays through the Indian River inlet increased (by 11 – 24%) until 2004 and likely continues to improve water quality.
What these changes mean long-term for the watershed is uncertain. What is certain as population growth and urbanization continues is that the most effective technology for controlling storm water runoff and treating wastewater will be needed to protect the Bays.
WATERSHED CONDITION STATUS BAR
STATUS: FAIR
TREND: NEGATIVE
WATERSHED CONDITION
TREND: NEGATIVE

8
WATERSHED CONDITION
HUMAN POPULATION GROWTHRapid population growth is changing the face of our watershed. This growth brings development, traffic, more wastewater, and pressure on natural resources. The success of protection and restoration of the Inland Bays and surrounding land is dependent on how we plan for population growth and its impacts.
The 2010 census revealed that 197,897 year-round residents lives in Sussex County, with 89,121 (or 45%) residing in the Inland Bays watershed. A method of estimating seasonal and visitor population by measuring wastewater flows found that the watershed’s population more than doubles in summer.
214,075
102,684
0
50,000
100,000
150,000
200,000
250,000
300,000
1780 1810 1840 1870 1900 1930 1960 1990 2020 2050
Resi
dent
Pop
ulat
ion
Resident Population
Dashed lines indicate projections
Sussex County
Watershed
LONG-TERM TRENDBefore 1970, population growth in Sussex County increased gradually. The land around the bays was mostly agricultural, and the beach communities hosted primarily seasonal visitors. In the early 1990s, the growth greatly accelerated.
CHANGE SINCE PREVIOUS REPORTFrom 1990 to 2010, the population of the Inland Bays watershed more than doubled.
LOOKING AHEAD By 2020, an estimated 102,684 year-round residents are expected in Inland Bays watershed.
The watershed population is expected to increase 15% between 2010 and 2020 and 46% between 2010 and 2040.

8
Looking south from Jungle Jim’s in Rehoboth Photo: TJ Redefer, Sky Jack Pics
9
WATERSH
ED C
ON
DITIO
N N
UTRIEN
T POLLU
TION
WATER Q
UA
LITYLIVIN
G RESO
URC
ESH
UM
AN
HEA
LTH RISKS
CLIM
ATE

10
WATERSHED CONDITION
1992
2012 2012 with proposed development
200714%
37%21%
11%
16%
1%
24%
31%17%
12%
16%
0.5%
22%
32%17%
12%
16%
1%

10 11
WATERSH
ED C
ON
DITIO
N N
UTRIEN
T POLLU
TION
WATER Q
UA
LITYLIVIN
G RESO
URC
ESH
UM
AN
HEA
LTH RISKS
CLIM
ATE
LAND USE CHANGEHow we use the land directly affects water quality in the Bays, since various land uses result in different types and amounts of pollutants entering waterways. For example, a dense residential area without stormwater management contributes four times as much nitrogen pollution to the Bays as a forest of the same size. Agricultural lands also contribute high levels of nutrient pollution due to unintentional loss of fertilizers to ground and surface waters.
In 2012, agriculture was the largest land use (31%), followed by developed/developing lands (24%), forested lands (17%), wetlands (16%), and water (12%).
LONG-TERM TRENDBetween 1992 to 2012, land use in the watershed changed significantly. Developed lands increased by 33.9 square miles, agricultural lands decreased by 18.2 square miles, and upland forests decreased by 14 square miles.
CHANGE SINCE PREVIOUS REPORTSince the previous report, developed lands increased by 7.8 square miles (11%), with continuing declines in agricultural lands, upland forests, and wetlands.
LOOKING AHEADAll indications are that extensive development will continue. The 2018 Sussex County Comprehensive Plan offers the opportunity to plan for growth, open space and protection of natural resources which could have a significant positive impact on the health of the Bays.
From 1992 through 2012, agriculture remained the largest land use of the watershed, but the land area decreased by 18.7mi (15.6% change over time). Developed land increased by 33.9mi (75% change).
7.81
-4.91
-1.79
0.32
-0.87 -0.85
-10
-5
0
5
10
Squa
re M
iles
Changes in Land Use from 2007 to 2012
Developed/ DevelopingAgricultureUpland ForestOpen WaterWetlandsOther
Aerial view of Longneck near Mariners Cove Photo: TJ Redefer, Sky Jack Pics

1212
WATERSHED CONDITION
IMPERVIOUS SURFACE COVERAGE The creation of new roads, parking lots, driveways, and rooftops increases the amount of polluted stormwater runoff entering streams and the Bays. These impervious surfaces reduce infiltration of rainwater into the ground and contribute to flooding. Stormwater control practices such as retention ponds, raingardens, infiltration areas, and permeable pavements reduce these impacts.
Studies have shown that noticeable degradation to the water quality of estuaries begins when their watershed exceeds 10% imperviousness.
The Inland Bays watershed as a whole has reached 10.4% impervious cover. Rehoboth and Little Assawoman Bay watersheds are even higher—13.7% and 12.7%, respectively. The most densely developed communities may exceed 50% imperviousness.
Rehoboth Bay comes to Dewey Beach September 1, 2016

12 13
WATERSH
ED C
ON
DITIO
N N
UTRIEN
T POLLU
TION
WATER Q
UA
LITYLIVIN
G RESO
URC
ESH
UM
AN
HEA
LTH RISKS
CLIM
ATE
8.52% 8.68% 8.84%
10.04%10.36%
5%
6%
7%
8%
9%
10%
11%
15,000
16,000
17,000
18,000
19,000
20,000
1992 1996 2001 2006 2010
% L
and
Are
a C
over
ed
Acr
es
Land Area Covered By Impervious Surfaces
LONG-TERM TRENDSince 1992, the percentage of land in the watershed covered with impervious surface increased by 22%. The largest increase occurred between 2001 and 2006.
CHANGE SINCE PREVIOUS REPORTDevelopment slowed during the recession that began in 2008, as did the rate of increase in impervious surface coverage. Data for years more recent than 2010 are not yet available.
LOOKING AHEADImproving economic conditions have revived development activities postponed due to the recession, so impervious surface coverage will continue to increase. Limitations on the amount of impervious surface in new developments potentially could be incorporated into Sussex County’s 2018 Comprehensive Plan.
Studies have shown that noticeable degradation to the water quality of estuaries begins when their watershed exceeds 10% imperviousness. The Inland Bays watershed as a whole has reached 10.4% impervious cover.

14
WATERSHED CONDITION
WATER QUALITY BUFFERS ON CROPLANDSAgriculture is still the largest land use in the watershed and contributes more nutrient pollution to the Bays than any other major land use. Buffers of natural vegetation between croplands and waterways can intercept and remove many of these nutrients.
Buffers vary in their effectiveness based partly on their width and type of vegetation. Wider buffers and forested buffers are more effective in removing nutrients from runoff and groundwater.
A geographic analysis was used to estimate how the average width of forested buffers between cropland and waterways has changed overtime. Only forested buffers wider than 50 feet were detected, which underestimates the actual acreage of functioning buffers. Still, this allows tracking of major changes.
100
150
200
250
300
1990 1995 2000 2005 2010 2015
Feet
Average Width of Forested Buffers Between Waterways and Croplands
LONG-TERM TRENDFrom 1992 to 2012, the average buffer width decreased from 274 feet to 206 feet (or 25%).
CHANGE SINCE PREVIOUS REPORTMean buffer width continued to decrease since the previous report, down 1.6% since 2007.
LOOKING AHEADThe outlook for changes in buffer width is uncertain. Due to long term declines in government incentives to establish and maintain buffers, their width is expected to continue to decrease.
Forested buffers can remove over 80% of nutrient pollution from waters on their way to the Bays.
Love Creek at Mulberry Knoll looking downstream to Arnell Creek and Rehoboth BayPhoto: TJ Redefer, Sky Jack Pics

14 15
WATERSH
ED C
ON
DITIO
N N
UTRIEN
T POLLU
TION
WATER Q
UA
LITYLIVIN
G RESO
URC
ESH
UM
AN
HEA
LTH RISKS
CLIM
ATE
SALT MARSH ACREAGE AND CONDITIONSaltmarshes provide highly valuable services to people. They reduce flooding and erosion from storms, filter pollutants, trap and store carbon, and provide critical habitat for fish and wildlife.
Nearshore development and sea level rise are contributing to the loss of salt marshes. A significant feature of many Inland Bays salt marshes is the appearance of open water pools in the interior of the marsh. These areas are drowning due to sea level rise and because old ditches dug to control mosquitos are now causing water to be trapped on the marsh surface.
The total acreage of salt marshes fringing the Bays was 7,300 when last inventoried in 2007—a net loss of over 3,500 acres since 1938. The loss of marshes is particularly harmful to the water quality and living resources of the Bays.
LONG-TERM TREND22% of the Bays’ salt marshes were lost between 1938 and 1968 mostly to excavation and filling for development. The decline has continued, but at a slower pace due to Delaware’s 1973 Wetlands Act that legally protected saltmarshes.
CHANGE SINCE PREVIOUS REPORTThere has been a marked increase in the amount of interior open water in salt marshes since 1992, indicating accelerating degradation and loss.
LOOKING AHEADMost direct destruction of salt marsh by human impacts has been halted. Now the major cause of tidal marsh loss is erosion and ‘drowning’ of wetlands due to land subsidence and sea level rise. With rising sea levels and nearshore development, the important services of this resource will continue to disappear.
Salt marshes reduce flooding and erosion from storms, filter pollutants, trap and store carbon, and provide critical habitat for fish and wildlife.
6,000
7,000
8,000
9,000
10,000
11,000
1930 1940 1950 1960 1970 1980 1990 2000 2010
Acr
es
Acres of Salt Marsh in the Inland Bays
0
200
400
600
800
1930 1940 1950 1960 1970 1980 1990 2000 2010
Acr
es o
f Int
erio
r Poo
ling
Salt Marsh Degradation
Salt Marsh Cordgrass Spartina alternflora

16
WATERSHED CONDITION
NATURAL HABITAT PROTECTION AND RESTORATIONMany types of natural habitats exist in the watershed, including forests, wetlands, meadows and beaches. They support a diversity of plants and animals, some of them rare. They also provide scenic beauty and recreational opportunities that are valued by visitors and residents.
Habitats are being lost due to changes in land use. Natural areas have become increasingly fragmented, stressing or eliminating some sensitive species that require large tracts of wetlands or forests.
Protecting the remaining high-quality natural areas and restoring degraded habitats are priorities for the CIB and its conservation partners. Protection is accomplished through purchase of land or conservation easements that restrict development. Restoration seeks to reestablish the natural ecosystems by reintroducing species and removing stressors.
James Farm Ecological Preserve on Indian River Bay Planting trees at Angola Neck Preserve

16 17
WATERSH
ED C
ON
DITIO
N N
UTRIEN
T POLLU
TION
WATER Q
UA
LITYLIVIN
G RESO
URC
ESH
UM
AN
HEA
LTH RISKS
CLIM
ATE
LONG-TERM TRENDSince tracking began in 2003, nearly $12 million has been spent to protect 3,000 acres and restore over 1,500 acres of natural habitat. Most of that progress occurred before 2010.
CHANGE SINCE PREVIOUS REPORTSince our previous report, progress on protection of natural habitat has nearly stalled and restoration has slowed. Since 2011, only 97 acres were protected and 530 acres restored. This slowdown is attributable to reductions in funding programs for public conservation programs and high land values for development.
LOOKING AHEAD Progress in habitat protection and restoration will be closely tied to availability of funding and incentives. New and innovative approaches to land conservation in the Inland Bays are needed if natural habitats are continued to be protected.
Protecting remaining high-quality natural areas and restoring degraded habitats are priorities for the CIB and its conservation partners.
0
500
1,000
1,500
2,000
2,500
3,000
3,500
2003 2006 2009 2012 2015
Cum
ulat
ive
Acr
es
Natural Habitat Protection & Restoration
Planting trees at Angola Neck Preserve
Brown-headed nuthatch Photo: Julie Memmolo

18
WATERSHED CONDITION
INDIAN RIVER INLET FLUSHINGTwice each day, the tides carry billions of cubic feet of salty ocean water into Indian River Bay where it mixes with freshwater entering from streams and groundwater.
Years ago, the inlet to Indian River Bay was shallow and moved around; it cut through the barrier island at various locations, blown out by one storm, closed up by another.
The inlet as we know it today was stabilized in the late 1930s by the construction of rock jetties. Since then the inlet has deepened over time, passing greater volumes of water and increasing the tidal range of the Bays. This has led to a long-term increase in the salinity of the Bays and contributed to degradation of marshes.
Increasing flushing also results in the flushing out of nutrient pollution from the Bays to the ocean. This likely contributes to improved water quality seen in the open bay waters that are most influenced by the tide.
LONG-TERM TRENDIn the late 1960s, the increase in tidal flushing accelerated, such that 20 years later the amount of water passing through during one tide cycle had increased by over four times.
CHANGE SINCE PREVIOUS REPORTA 2004 estimate indicated the volume of tidal flushing continued to increase by 11–24% compared to the previous measurement in 1988.
LOOKING AHEAD The future rate of change in tidal flushing is uncertain. However, exchange through the inlet will continue to benefit water quality in the Bays.
Years ago, the inlet to Indian River Bay was shallow and opened and closed by storms. The inlet as we know it today was deepened and stabilized in the late 1930s by the construction of rock jetties.-2,000
-1,500
-1,000
-500
0
500
1,000
1,500
2,000
2,500
1930 1940 1950 1960 1970 1980 1990 2000 2010
Mill
ions
of C
ubic
Fee
t of
Wat
er
Pass
ing
Thro
ugh
Inle
t
Indian River Inlet Flushing Over Time
Incoming Tide
Outgoing Tide
The location of the inlet naturally shifted locations, as it was opened and closed by storms, until the early 20th century when it was secured in place by the Army Corps of Engineers. Photo: Delaware Seashore State Park

18 19
WATERSH
ED C
ON
DITIO
N N
UTRIEN
T POLLU
TION
WATER Q
UA
LITYLIVIN
G RESO
URC
ESH
UM
AN
HEA
LTH RISKS
CLIM
ATEIndian River Inlet looking northwest to Rehoboth BayPhoto by Gordon Campbell / At Altitude Gallery

2020
MANAGING NUTRIENT POLLUTIONNutrient pollution is the largest problem facing the Inland Bays.
Point source pollution originates from a pipe, such as discharge from a wastewater treatment plant.
Nonpoint source pollution originates from diffuse sources and enters the Bays through groundwater and surface runoff. Sources include fertilizers, septic systems, land application of wastewater, and stormwater runoff.
Atmospheric sources originate from the emissions of power plants, automobiles, and agriculture that later deposit directly onto the surface of the Bays.
The maximum amount of nutrient pollution that a water body can receive and still support healthy environmental conditions is called its Total Maximum Daily Load (TMDL). In 1998, state regulations established target loads for the Inland Bays. The regulations require elimination of all point sources, a 40 to 85% reduction of nonpoint source loads, and a 20% reduction of loads from atmospheric deposition. In 2008, the Delaware Department of Natural Resources and Environmental Control enacted a Pollution Control Strategy (PCS) that laid out a series of regulatory and voluntary actions needed to meet the TMDL.
After decreasing by over 80% since the 1990s, point source pollution decreased only slightly since the last report, and two point sources remain in the Bays.
Nonpoint source nitrogen loads remained far in excess of healthy limits in all bays, but loads to Little Assawoman Bay may now be decreasing. Phosphorus loads on average were within healthy limits for Rehoboth and Little Assawoman Bays, but continue to exceed healthy limits for Indian River Bay.
Atmospheric nitrogen loads are now within healthy limits.
Substantial progress was made on conversions of septic systems to central sewer, far surpassing the pollution reduction goal.
Voluntary agricultural and stormwater nutrient management practices yielded very little progress, highlighting the need for dedicated funding for these most important bay restoration actions.
MANAGING NUTRIENT POLLUTION
TREND: POSITIVE

20 21
WATERSH
ED C
ON
DITIO
N N
UTRIEN
T POLLU
TION
WATER Q
UA
LITYLIVIN
G RESO
URC
ESH
UM
AN
HEA
LTH RISKS
CLIM
ATE
Excess nutrients from fertilizers, wastewater, and runoff cause blooms of microscopic algae. These, along with sediments in runoff, reduce water clarity which inhibits growth of bay grasses. Oxygen levels fluctuate naturally on a daily cycle in our shallow Bays. But when nutrient pollution is high, the cycles become extreme, and very low oxygen harms fish and invertebrates.
In a healthy bay, there is little algae, light reaches the bottom allowing bay grasses to grow, a greater diversity of fish and shellfish are present, and oxygen is plentiful and relatively stable.

22
MANAGING NUTRIENT POLLUTION
LONG-TERM TRENDAs wastewater facilities have improved treatment or removed their discharges, pollution to the Bays has decreased dramatically. From 1990 to 2009, pollution loads from point sources decreased by 407 lbs. per day of nitrogen (82%) and 44 lbs. per day of phosphorus (87%).
CHANGE SINCE PREVIOUS REPORTFrom 2009 to 2015, pollution continued to decrease slightly by 0.83 lbs. per day of nitrogen and 0.71 lbs. per day of phosphorus.
LOOKING AHEAD Pollution from point sources is anticipated to continue to decrease to zero, as required by the Total Maximum Daily Load regulation. Rehoboth plans to divert its discharge to an ocean outfall by 2018. Allen Harim is in discussions with DNREC about how to address its point source. The reduction in pollution from the removal of Millsboro’s discharge will be realized in the next report.
In 1990, thirteen point sources of pollution discharged to the Bays. Now only three remain.
INPUT OF NUTRIENTS FROM POINT SOURCESIn 1990, thirteen point sources of pollution discharged to the Bays. Now only two remain: the City of Rehoboth Beach, and the Allen Harim facility near Indian River.
Since the last report, the removal of Rehoboth Beach’s wastewater discharge from Rehoboth Bay was again delayed, while the Town of Millsboro removed its discharge from the Indian River in August of 2015. Lewes is permitted to maintain its discharge to the Lewes & Rehoboth Canal, and makes up for the small amount of pollution that reaches the Bays by funding manure relocation from the watershed.
0
10
20
30
40
50
60
0
100
200
300
400
500
600
1990 1994 1998 2002 2006 2010 2014
Pho
spho
rus
Load
(lb
s To
tal P
hosp
horu
s/d
ay)
Nit
rog
en L
oad
(lb
s To
tal N
itro
gen
/day
)
Loads of Nutrients from Point Sources
Total NitrogenTotal Phosphorus
Townsend/Mountaire processing plant removes discharge from Indian River
Rehobothupgrades treatment plant
Millsboro removesdischarge from Indian River

22 23
WATERSH
ED C
ON
DITIO
N N
UTRIEN
T POLLU
TION
WATER Q
UA
LITYLIVIN
G RESO
URC
ESH
UM
AN
HEA
LTH RISKS
CLIM
ATE
INPUT OF NUTRIENTS FROM THE ATMOSPHERENutrients are deposited from the atmosphere directly into the Bays during both wet and dry weather. Excess nitrogen in the atmosphere comes from coal-burning power plants, automobiles, and agriculture. Phosphorus in the atmosphere may originate from combustion, natural vegetation, blown soil particles, sea spray, and herbicide application.
Deposition of nitrogen is of most concern for Bay health, and now atmospheric nitrogen loads meet their pollution reduction goal on average.
Atmospheric nitrogen loads meet their pollution reduction goal on average.
LONG-TERM TRENDSSince the early 1990s, atmospheric nitrogen loads have decreased due to improved federal emission standards for power plants and automobiles. Phosphorus loads have increased slightly for unknown reasons.
CHANGE SINCE PREVIOUS REPORTSince the previous report, atmospheric inputs of nitrogen have continued a slight decrease. Retirement of coal-fired generating units at the Indian River Power Plant may have contributed to the improvement. Phosphorus loads have continued to increase slightly.
LOOKING AHEADReductions in atmospheric nitrogen loads should continue as a result of both increasing fuel economy standards and the federal Clean Air Act and Clean Power Plan that requires reduced emissions from power plants. Should phosphorus from the atmosphere continue to increase, investigation into its specific sources may be needed.
200
400
600
800
1992 1996 2000 2004 2008 2012 2016
Nitr
ogen
Loa
d (lb
s/da
y)
Nitrogen Load from the Atmosphere
Goal
4
5
6
7
8
9
1992 1996 2000 2004 2008 2012 2016
Phos
phor
us L
oad
(lbs/
day)
Phosphorus Load from the Atmosphere
No pollution reduction goal developed

24
MANAGING NUTRIENT POLLUTION
INPUT OF NUTRIENTS FROM NONPOINT SOURCESNonpoint source pollution comes from fertilizers, animal wastes, and human wastewater transported through runoff or groundwater. It is by far the largest source of nutrient pollution.
Input (or ‘loads’) of nutrients from nonpoint sources are estimated from monitoring the major streams that drain to the Bays. Many years are needed to detect changes, because stream flow is variable, and groundwater carrying nutrients may take decades before entering streams.
Inputs of nitrogen remained far in excess of healthy limits in all three Bays. Indian River Bay had average inputs more than six times the healthy limit.
Inputs of phosphorus, on average, remained within healthy limits in Rehoboth and Little Assawoman Bays, but some years exceeded limits. Phosphorus loads in Indian River Bay were nearly twice the healthy limit.
0
2,000
4,000
6,000
8,000 Indian River Bay
Goal
Goal
0
400
800
1,200
1,600
2,000
Nitr
ogen
Loa
d (lb
s/da
y) L. Assawoman Bay
0
500
1,000
1,500
2,000
2,500
3,000
Nitr
ogen
Loa
d (lb
s/da
y)
Rehoboth Bay
Goal
Loads of Nitrogen from Nonpoint Sources

24 25
0
20
40
60
80
100
120 Indian River Bay
Goal
0
10
20
30
40
50
60
Phos
phor
us L
oad
(lbs/
day) L. Assawoman Bay
Goal
0
20
40
60
80 Rehoboth Bay
Goal
Loads of Phosphorus from Nonpoint Sources
Runoff from a construction site on Dirickson Creek
25
WATERSH
ED C
ON
DITIO
N N
UTRIEN
T POLLU
TION
WATER Q
UA
LITYLIVIN
G RESO
URC
ESH
UM
AN
HEA
LTH RISKS
CLIM
ATE
CHANGE SINCE PREVIOUS REPORTSince the last report, nitrogen inputs to Little Assawoman Bay have decreased but inputs did not change to Rehoboth and Indian River Bays. No short-term trends in phosphorus inputs were observed.
LOOKING AHEAD Sustained phosphorus reductions are credited to improved nutrient management on farms and the conversion of cropland to development with stormwater controls. Sixteen years after Total Maximum Daily Load regulations were enacted, nitrogen loads have not decreased. This has been enough time to allow nearly half of the polluted groundwater to flush through aquifers and into streams.
Decreases are expected as cleaner water begins to enter streams over time. However, significant improvement hinges on the widespread implementation of all actions of the Pollution Control Strategies.
Inputs of nitrogen remained far in excess of their healthy limits in all three Bays. Indian River Bay had average inputs over six times its healthy limit.
26
MANAGING NUTRIENT POLLUTION
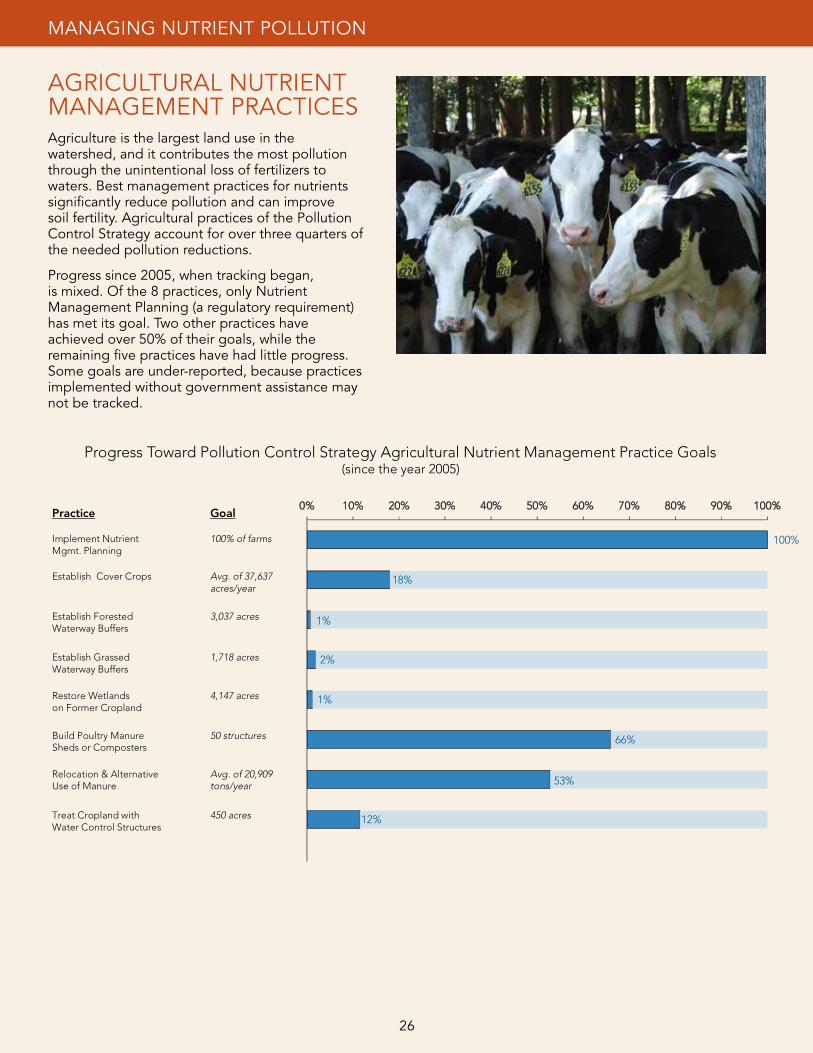
AGRICULTURAL NUTRIENT MANAGEMENT PRACTICESAgriculture is the largest land use in the watershed, and it contributes the most pollution through the unintentional loss of fertilizers to waters. Best management practices for nutrients significantly reduce pollution and can improve soil fertility. Agricultural practices of the Pollution Control Strategy account for over three quarters of the needed pollution reductions.
Progress since 2005, when tracking began, is mixed. Of the 8 practices, only Nutrient Management Planning (a regulatory requirement) has met its goal. Two other practices have achieved over 50% of their goals, while the remaining five practices have had little progress. Some goals are under-reported, because practices implemented without government assistance may not be tracked.
100%
18%
1%
2%
1%
66%
53%
12%
0% 10% 20% 30% 40% 50% 60% 70% 80% 90% 100%
Progress Toward Pollution Control Strategy Agricultural Nutrient Management Practice Goals (since the year 2005)
Practice Goal
Implement Nutrient 100% of farmsMgmt. Planning
Establish Cover Crops Avg. of 37,637 acres/year
Establish Forested 3,037 acres Waterway Buffers
Establish Grassed 1,718 acres Waterway Buffers
Restore Wetlands 4,147 acres on Former Cropland
Build Poultry Manure 50 structuresSheds or Composters
Relocation & Alternative Avg. of 20,909Use of Manure tons/year
Treat Cropland with 450 acresWater Control Structures

26 27
WATERSH
ED C
ON
DITIO
N N
UTRIEN
T POLLU
TION
WATER Q
UA
LITYLIVIN
G RESO
URC
ESH
UM
AN
HEA
LTH RISKS
CLIM
ATE
CHANGE SINCE PREVIOUS REPORTSince the last report, Nutrient Management Planning increased from 95% of farms to 100% of farms. An additional 24 poultry manure sheds or composters were built, manure relocation increased slightly, and 2 water control structures were built. Since the last report, little overall progress has been made on implementing agricultural nutrient management practices, which are by far the most important for restoring the Inland Bays.
LOOKING AHEAD Since almost all practices are voluntary, implementation is driven by government investment in subsidies. According to the Pollution Control Strategy, for all of the remaining agricultural practices to meet their goals an estimated $4 million investment per year would be needed. (Adjusted for inflation)
Since the last report, little overall progress has been made on implementing agricultural nutrient management practices, which are by far the most important for restoring the Inland Bays.
Field near Love Creek Photo: TJ Redefer, Sky Jack Pics

28
MANAGING NUTRIENT POLLUTION
CHANGE SINCE PREVIOUS REPORTSince 2011, the equivalent of 6,813 single family homes were connected to central sewer. Johnson’s Corner, Angola, and Oak Orchard sewer districts received the most new connections. During this time, the Pollution Control Strategy goal for septic conversion was far surpassed.
LOOKING AHEAD In 2016, property owners voted to include 713 homes on septics into the new Herring Creek Sewer District. Regulations requiring a greater pollution removal for new septic systems were implemented in 2014. These positive developments will continue to keep nutrients and bacteria out of the Bays.
While new septics are continually permitted, the total number of septics in the watershed has decreased thanks to central sewer expansion.
SEPTIC SYSTEM CONVERSION TO CENTRAL SEWERA properly maintained septic system leaches 10.6 lbs. of nitrogen and 0.7 lbs. of phosphorus to groundwater each year. When multiplied by the estimated 8,292 systems in the watershed, the total pollution contribution of septics is nearly 89,000 pounds of nitrogen yearly and more than 5,800 pounds of phosphorus.
Central sewer service allows a higher level of sewage treatment and eliminates pollution from septic systems.
Since the 1970s, Sussex County has facilitated the conversion of an estimated 50,801 septic systems to central sewer. While new septics are continually permitted, the total number of septics in the watershed has decreased with central sewer expansion.
43,988
50,801
20,000
30,000
40,000
50,000
60,000
1992 1996 2000 2004 2008 2012 2016
EDU
s
Cumulative Number of Equivalent Dwelling Units (EDUs)Converted from Septic to Central Sewer
Goal
Dirickson Creek Team paddling up the Creek

28 29
WATERSH
ED C
ON
DITIO
N N
UTRIEN
T POLLU
TION
WATER Q
UA
LITYLIVIN
G RESO
URC
ESH
UM
AN
HEA
LTH RISKS
CLIM
ATE
LOOKING AHEAD 4,399 acres remain to be retrofitted to meet the pollution goal. The rate of stormwater retrofit implementation is not expected to increase unless public or private investment in the practices increases. This underscores the need for stormwater regulations that protect water quality and that are enforced.
A series of attractive raingardens, ponds, wet swales, and infiltration areas were created as part of the Anchorage Canal Stormwater Retrofit Project along the Route 1 corridor in South Bethany.
STORMWATER RETROFITSAs stormwater moves overland, it picks up and carries pollutants from lawns, streets, and industrial facilities into streams and the Bays. Developments in Delaware constructed prior to 1990 were not required to control stormwater, so they contribute high levels of stormwater pollution.
Stormwater retrofits are stormwater management facilities in locations where controls did not previously exist or were ineffective. The Inland Bays Pollution Control Strategies call for the creation of stormwater retrofits to treat 4,500 acres of lands developed prior to 1990.
Currently, 101 acres of the watershed have received stormwater retrofits. The Town of South Bethany contributed the most to this goal with the completion of the Anchorage Canal Sotrmwater Retrofit Project. The CIB, working with the Delaware Department of Transportation and the surrounding communities, installed a series of attractive raingardens, ponds, wet swales, and infiltration areas were created over six years.
0
50
100
150
2010 2011 2012 2013 2014 2015 2016
Acr
es T
reat
ed
Cumulative Area of Development Retrofitted with Stormwater Controls
Pollution Control Strategy Goal = 4,500 acres
Anchorage Canal Stormwater Retrofit Project by Sea Colony

3030
WATER QUALITYMeasures of water quality are the most basic indicators of Bay health. They are key measures of the effectiveness of actions taken to reduce pollution to the Bays.
The six water quality indicators are based on the minimum requirements necessary for reestablishment of bay grasses and healthy dissolved oxygen levels. Each water quality indicator individually is useful to assess changes in the health of the Bays, and collectively they provide a clearer picture of ecological conditions.
The water quality information used in this report comes from more than 30 long-term monitoring sites located in tidal portions of the Bays. Data are collected by both the Department of Natural Resources and Environmental Control and the University of Delaware’s Citizen Monitoring Program.
Overall, water quality in the Inland Bays remains fair to poor, but is improving. Compared to five years ago, nutrient and algae concentrations have improved in some areas. Many places have seen modest long-term positive trends in phosphorus and algae levels.
Water clarity and dissolved oxygen in the Bays, however, have seen no significant long-term improvements. Although seaweed abundance is down compared to the 1990s, blooms still occur. Few areas had water quality conditions that are thought to allow bay grasses to reestablish. Most tributaries and canals continue to have poor water quality.
Water quality improvements are, however, being seen near the Indian River Inlet and in Little Assawoman Bay. With its smaller ratio of land to water, and high water tables, Little Assawoman is likely to be the first Bay to respond to improved watershed management.
Looking Ahead
Until nutrient inputs to the Bays decrease, water quality is likely to remain impaired, particularly in tributaries. Increased tidal flushing through the inlet has likely contributed to better water quality in parts of Indian River and Rehoboth Bays.
WATER QUALITY
TREND: POSITIVE

30 31
WATERSH
ED C
ON
DITIO
N N
UTRIEN
T POLLU
TION
WATER Q
UA
LITYLIVIN
G RESO
URC
ESH
UM
AN
HEA
LTH RISKS
CLIM
ATE
ALGAE CONCENTRATIONIn a healthy bay, floating microscopic algae provide food for fish, shellfish and other invertebrates. When too many nutrients are added to the water algae may grow out of control, and algal blooms appear. If blooms persist, they cloud the water so that bay grasses are deprived of light and cannot grow.
Chlorophyll a is a green pigment in algae. Concentration of this pigment in the Bays indicates the abundance of algae. Levels below 15 milligrams per liter of water are considered healthy.
From 2011 to 2015, the majority of locations sampled in the Bays (73%) met this standard. Indian River and Dirickson Creek had high levels of algae that often were much worse than the standard.
LONG-TERM TRENDOver the long-term, algae levels in a number of tributaries and Little Assawoman Bay have improved. Indian River, however, has shown no improvement.
CHANGE SINCE PREVIOUS REPORTAlgae concentrations in the Bays have decreased since the previous report was published. The number of sampling stations meeting the standard, compared to five years ago, has increased by 36%. Of all the water quality indicators, algae concentration has improved the most.
Chlorophyll a is a green pigment in algae. Concentration of this pigment in the Bays indicates an abundance of algae.

32
WATER QUALITY
Testing the waters on Love Creek Photo: Judy Britz

32 33
WATERSH
ED C
ON
DITIO
N N
UTRIEN
T POLLU
TION
WATER Q
UA
LITYLIVIN
G RESO
URC
ESH
UM
AN
HEA
LTH RISKS
CLIM
ATE
CONCENTRATIONS OF NUTRIENTSNitrogen and phosphorus are nutrients necessary for the growth of beneficial bay grasses, seaweeds and algae. But an excess of these nutrients has caused overabundances of algae and seaweeds, murky water, low oxygen levels, and disappearance of bay grasses.
Studies have determined standards for nutrient concentrations that will result in healthy oxygen levels and clear waters that allow bay grasses to reestablish.
Over the period 2011 to 2015, 52% of monitoring stations met the standard for nitrogen concentration. Most sites that met the standard are located in open bay areas near the Indian River Inlet and in Little Assawoman Bay. Tributaries generally did not meet nitrogen standards, and concentrations in Indian River and Guinea Creek are particularly high.
Forty-six percent of stations met the standard for phosphorus. More tributary sites meet the phosphorus standard than for nitrogen. Phosphorus concentrations are relatively low in Little Assawoman Bay, partly because its lower salinity keeps phosphorus bound to bay sediments and out of the water.
LONG-TERM TRENDNutrient concentrations have not changed significantly at most monitoring sites over last 10- to 15-year period. Conditions at three stations are degrading as nutrient concentrations have increased. Long-term improvements have occurred at sites closest to the Indian River Inlet, likely because the tidal flow through the inlet has increased over time.
CHANGE SINCE PREVIOUS REPORTThere are some signs of progress. Compared to five years ago, concentrations of both nitrogen and phosphorus have moderately improved. Roughly half of the sites now meet nutrient standards. Only a third did previously.
52% of monitoring stations met the standard for nitrogen concentration. 46% of stations met the standard for phosphorus.

34
WATER QUALITY
Because all plants need sunlight to grow, clear water is essential for underwater baygrasses to reestablish in the Inland Bays.
LONG-TERM TRENDWhile water clarity in Little Assawoman Bay improved over a 10- to 15-year period, five sampling sites in Indian River Bay and the Lewes-Rehoboth Canal decreased in clarity.
CHANGE SINCE PREVIOUS REPORTMore sites in Little Assawoman Bay now meet the water clarity standard than in 2011. Waters on the western side of Indian River Bay became less clear. The status of other bay areas has not changed.
WATER CLARITYBecause all plants need sunlight to grow, clear water is essential for underwater bay grasses to reestablish in the Inland Bays.
Algae, sediments, and organic matter floating in the water all reduce clarity and prevent sunlight from reaching the bay bottom to support plant life.
Water clarity is measured by lowering a black and white Secchi disk into the water until its markings can no longer be seen. When all other conditions are right, bay grasses can grow in shallow waters with an average Secchi depth of at least 2.2 feet.
From 2011 to 2015, 55% of water quality monitoring sites in the Bays met or exceeded this standard. Little Assawoman Bay and areas near the Indian River inlet were clearest, while tributaries were murky and below standard.

34 35
WATERSH
ED C
ON
DITIO
N N
UTRIEN
T POLLU
TION
WATER Q
UA
LITYLIVIN
G RESO
URC
ESH
UM
AN
HEA
LTH RISKS
CLIM
ATE
41% of monitoring sites in the Bays had an index value of at least 0.90, suggesting that bay grass restoration efforts could be successful in these areas where other physical conditions are met.
LONG-TERM TRENDThe only significant long-term trends in the index value were in Little Assawoman Bay (two stations improving, one degrading).
CHANGE SINCE PREVIOUS REPORTThe index values for Vines Creek, and lower Indian River have improved over the past five years, but both remain below standard. Parts of Little Assawoman Bay that were below standard in 2011 now meet minimum requirements for growth of eelgrass.
WATER QUALITY INDEXThe Water Quality Index combines the previous four indicators (nitrogen and phosphorus concentrations, algae concentration, and water clarity) into an integrated measure of whether conditions are present to support the reestablishment of eelgrass.
The index ranges from 0 (water quality least supportive of eelgrass) to 1.0 (water quality that will support eelgrass reestablishment when other conditions allow). Index values from 0.90 to 0.99 may support some reestablishment and growth.
41% of monitoring sites in the Bays had an index value of at least 0.90, suggesting that bay grass restoration efforts could be successful in these areas where other physical conditions are met. Again, these areas are found mostly in Little Assawoman Bay, and in the open water areas of the bays near the inlet. Two sites, in Dirickson Creek and upper Indian River, had particularly low indices of water quality.

36
WATER QUALITY
DISSOLVED OXYGEN CONCENTRATIONAll living creatures in the Bays—from swimming fish, shrimp and crabs to the clams and worms that burrow into the mud—need oxygen to survive. Dissolved oxygen levels that are high and stable support diverse and healthy populations of bay life.
Oxygen levels in shallow bays naturally cycle over 24 hours. During the day, plants and algae release oxygen into the water through photosynthesis. At night, plants, algae, and animals continue to respire and draw oxygen out of the water. But nutrient pollution makes these cycles extreme by fueling algal blooms. When the excessive algae respire at night, they can cause oxygen to drop below healthy levels.
The dissolved oxygen indicator shows the percent of summer mornings that oxygen levels fall below the healthy standard of 4 milligrams of oxygen per liter of water. Zero to 10% of mornings is considered healthy. Higher percentages increasingly impact the feeding, growth and survival of aquatic life in the Bays.
Dissolved oxygen levels in well-flushed, open water areas of the Bays meet the standard most of the time. However, many nearshore areas and tributaries have unhealthy oxygen levels.
0
1
2
3
4
5
6
7
8
8/29 12:AM 8/30 12:AM 8/31 12:AM 9/1 12:AM 9/2 12:AM
Dis
solv
ed O
xyge
n (m
g/L)
Snapshot of Continuously Monitored Dissolved Oxygen Concentrations During a Typical Period in August (2009), in Two Tidal Rivers With Contrasting Levels of
Nutrient Pollution
i ede d d
e di i ee ed
i i ee ed
Nutrient pollution causes oxygen levels to decrease and fluctuate wildly. This causes unsustainable oxygen levels for some fish, shellfish and invertebrates.

36 37
WATERSH
ED C
ON
DITIO
N N
UTRIEN
T POLLU
TION
WATER Q
UA
LITYLIVIN
G RESO
URC
ESH
UM
AN
HEA
LTH RISKS
CLIM
ATE
Oxygen levels in shallow bays naturally cycle over 24 hours. During the day, plants and algae release oxygen into the water through photosynthesis. At night, plants and animals continue to respire and draw oxygen out of the water.
LONG-TERM TRENDFour sites have shown long-term improvement, with increasing levels of oxygen on summer mornings, while four showed decline. There are no overall trends or patterns in the location of these sites.
CHANGE SINCE PREVIOUS REPORTSince the previous report, dissolved oxygen has improved in the upper Indian River at Millsboro and Herring Creek. Oxygen levels in Guinea Creek are less healthy.
Diamondback terrapin Photo: Jay Fleming

38
WATER QUALITY
SEAWEED ABUNDANCESeaweeds are a natural part of the Inland Bays ecosystem. They provide food and habitat for many invertebrates, fish, and water birds.
The amount of seaweed present in the Bays is a good indicator of nutrient pollution. When nutrients are in excess, seaweeds can grow rapidly and become overabundant. This was the case in the late 1990s when seaweeds bloomed so much that they smothered shellfish, depleted oxygen, killed bay grasses, and fouled beaches. Currently fewer dense blooms occur, but levels of seaweed are still high enough to prevent bay grasses from reestablishing in many locations.
Brant eating Sea LettucePhoto: Dennis Bartow

38 39
WATERSH
ED C
ON
DITIO
N N
UTRIEN
T POLLU
TION
WATER Q
UA
LITYLIVIN
G RESO
URC
ESH
UM
AN
HEA
LTH RISKS
CLIM
ATE
LONG-TERM TRENDSeaweed abundance dropped significantly between 1999 and 2009, perhaps in response to decreases in phosphorus loads to the Bays.
CHANGE SINCE PREVIOUS REPORTOn a whole, seaweed levels in the Bays remain below those seen in 1999. But densities of seaweed were relatively high at a few sites in 2012, and the overall average density may be increasing. The meaning of this is unclear, and more years of data are needed to determine if this is a trend.
0.0
0.4
0.8
1.2
1999 2009 2011 2012
Seaweed Abundance in Rehoboth and Indian River Bays
Seaweeds provide food and habitat for many invertebrates, fish, and water birds. But when nutrients are in excess, seaweeds can grow rapidly and become overabundant.

4040
LIVING RESOURCESAbundance—or absence—of birds, fish, and shellfish in the Bays are often the most noticeable signs of environmental changes. These living resources are useful indicators of shifts in water quality, habitat, and climate; in part because they are easy for us to observe.
Since the 2011 State of the Inland Bays Report was issued, living resource indicators continue to present a mixed picture.
On the positive side, Bald Eagles and Ospreys rebounded from pesticide pollution, and the number of osprey nests continues to increase. After declines in the 1980s, the number of Black Ducks that winter here has stabilized. Hard Clam populations have been stable since 1976 and continue to support a fishery.
On the downside, numbers of wintering Brant and Canvasback in the Bays are declining. The Blue Crab population has not rebounded. Bay Anchovy populations have also declined over the years. Bay grasses remain rare in the Inland Bays, while coastal bays in Maryland and New Jersey have thousands of acres of these highly valuable habitats. Recreational fishing and its local economic benefits have decreased, likely due to the recent recession.
Looking Ahead
Once-through cooling water withdrawal at the NRG Power Plant came to an end in 2013, along with the resulting fish and crab losses. This is expected to improve the fishery of the Indian River. Reduced nutrient inputs to the Bays should lead to future water quality improvements and, it is hoped, create conditions that allow bay grasses to re-establish.
LIVING RESOURCES
TREND: NO TREND

40 41
WATERSH
ED C
ON
DITIO
N N
UTRIEN
T POLLU
TION
WATER Q
UA
LITYLIVIN
G RESO
URC
ESH
UM
AN
HEA
LTH RISKS
CLIM
ATE
LONG-TERM TRENDEelgrass in the Bays has not increased.
CHANGE SINCE PREVIOUS REPORTBay grasses have not been surveyed in the bays in recent years.
LOOKING AHEADThe hope is that improving water clarity in the Bays will eventually allow these grasses to take hold and flourish. However, destruction of forested buffers along Love Creek threaten bay grasses there.
Bay grass meadows provide refuge, food, and nurseries for important fish and shellfish.
BAY GRASSESBay grass meadows create a rich underwater habitat that adds oxygen to the water, removes nutrients, and holds bay sediments in place. They provide refuge, food, and nurseries for important fish and shellfish.
The presence of bay grasses is a good indicator of water quality, since these plants need relatively clear water with low nutrients to grow and survive.
One of the most highly valued bay grasses is eelgrass. In the 1930s eelgrass declined dramatically due to disease and increasing pollution levels. By the late 1970s, eelgrass and most other bay grass species could not be found on the Bays.
Efforts to restore eelgrass beds to the Inland Bays have been unsuccessful due to nutrient pollution. In contrast, similar bays in New Jersey and Maryland continue to support thousands of acres of bay grasses.
In 2010, a meadow of Horned pondweed was discovered in the shallow waters of upper Love Creek. It prefers lower salinities and tolerates higher nutrient concentrations than eelgrass. This is the only significant area of bay grass known in the Bays.
Eelgrass off Pasture Point at James Farm

42
LIVING RESOURCES
EAGLE AND OSPREY NESTINGBald Eagles and Ospreys are good indicators of environmental quality because they are at the top of the food chain. In a process called biomagnification, the birds ingest chemicals that may accumulate in the fish that they eat. The Department of Natural Resources and Environmental Control estimates Bald Eagle and Osprey populations through aerial surveys of nests.
The number of eagle nests in the Inland Bays watershed has stabilized at 12–14 each year. Ninety-two active Osprey nests were counted in 2014.
The number of Bald Eagle nests in the Inland Bays watershed has stabilized at 12–14 each year. Ninety-two active Osprey nests were counted in 2014.
LONG-TERM TRENDBoth species have rebounded significantly following the 1972 ban on use of DDT pesticides, which caused the collapse of many raptor populations due to thinning eggshells. Active nests of both Bald Eagles and Ospreys around the Inland Bays have increased over time, with a significant trend upward since the early 2000’s.
CHANGE SINCE PREVIOUS REPORTThe number of active eagle nests appears to be stable since the last report. The number of Osprey nests in the watershed increased by 30% between 2007 and 2014.
LOOKING AHEAD Increased development in the watershed could potentially impact eagles, as they require nesting habitat with limited disturbance. Osprey populations may continue to increase partly because they have acclimated to nesting in close proximity to human activity.
0
5
10
15
1985 1990 1995 2000 2005 2010 2015
Num
ber o
f Nes
ts
Active Bald Eagle Nests
0
20
40
60
80
100
1990 1995 2000 2005 2010 2015
Num
ber o
f Nes
ts
Active Osprey Nests
Nest survey frequency reduced
Bald Eagle nesting Osprey

42 43
WATERSH
ED C
ON
DITIO
N N
UTRIEN
T POLLU
TION
WATER Q
UA
LITYLIVIN
G RESO
URC
ESH
UM
AN
HEA
LTH RISKS
CLIM
ATE
HARD CLAM LANDINGSHard Clams are harvested in the Inland Bays, both by recreational clammers and by commercial clammers. The commercial harvest is around 1 million clams per year, all from Rehoboth and Indian River Bays (landings). In 2016, there were 54 licensed commercial clammers.
Clams improve water clarity by filtering suspended particles from the water. Bay bottoms composed of shell or sandy mud support the highest densities of Hard Clams.
The commercial clam harvest is around 1 million clams per year.
LONG-TERM TRENDCommercial landings of Hard Clams in the Bays peaked at over 18 million in the mid-50s, when disease began decimating the oyster industry. The fishery has since declined due to the combined effects of over-harvesting and closure of harvest areas. Fifty-four commercial clamming licenses were issued in 2016.
A 2011 study by the CIB and the Department of Natural Resources and Environmental Control found that clam densities have remained stable since 1976, with Rehoboth Bay showing the highest densities.
CHANGE SINCE PREVIOUS REPORTClam landings have remained stable over the past five years.
LOOKING AHEAD Future water quality improvements in the Bays may allow the opening of more areas for harvest and increase pressure on the population from both commercial and recreational clammers.
0
2
4
6
8
10
12
14
16
18
1940 1950 1960 1970 1980 1990 2000 2010
Mill
ions
of C
lam
s
Annual Commercial Hard Clam Landings

44
LIVING RESOURCES
0
50,000
100,000
150,000
200,000
250,000
300,000
0
1,000
2,000
3,000
4,000
1975 1980 1985 1990 1995 2000 2005 2010 2015
Atl
antic
Fly
way
Co
unt
Inla
nd B
ays
Cou
nt
American Black Duck
Inland Bays
Atlantic Flyway
0
25,000
50,000
75,000
100,000
125,000
150,000
175,000
200,000
0
2,000
4,000
6,000
1975 1980 1985 1990 1995 2000 2005 2010 2015
Atl
antic
Fly
way
Co
unt
Inla
nd B
ays
Co
unt
Brant
Inland Bays
Atlantic Flyway
0
25,000
50,000
75,000
100,000
125,000
150,000
0
1,000
2,000
3,000
1975 1980 1985 1990 1995 2000 2005 2010 2015
Atl
anti
c Fl
yway
Cou
nt
Inla
nd B
ays
Cou
nt
Canvasback
Inland Bays
Atlantic Flyway

44
Tens of thousands of wintering ducks, geese, and swans depend upon the Bays’ wetlands, waters and nearby fields for survival.
LOOKING AHEAD Waterfowl hunting season dates and harvest limits in Delaware follow recommendations of the U.S. Fish and Wildlife Service, and are revised annually based on Atlantic Flyway, not state, counts. The most important actions for retaining species such as Canvasbacks and Brant in the Bays are wetlands protection and improving water quality to allow regeneration of underwater bay grasses.
Climate change will increasingly impact northern waterfowl breeding habitats and/or migration patterns.
45
WATERSH
ED C
ON
DITIO
N N
UTRIEN
T POLLU
TION
WATER Q
UA
LITYLIVIN
G RESO
URC
ESH
UM
AN
HEA
LTH RISKS
CLIM
ATE
AMERICAN BLACK DUCK
The Inland Bays watershed hosts both year-round and migratory winter populations of Black Ducks. Atlantic Flyway numbers decreased sharply beginning in the mid-twentieth century. Reasons for the decline are thought to include loss of marsh habitat, as well as
hunting pressure and interbreeding with mallards. Data suggest that since 2007, both local and regional wintering populations have stabilized.
BRANT
Brant winter in coastal environments where eelgrass is a staple of their diet. In the 1930s, a sudden die-off of eelgrass along the Atlantic coast led to a collapse of the Brant population. Since then, Brant adapted their diets to include other foods—such as
sea lettuce, salt marsh cordgrass, and lawn grass—and Atlantic Flyway populations have stabilized. However, Inland Bays populations remain low and continue to decline.
WINTER WATERFOWLTens of thousands of wintering ducks, geese, and swans depend upon the Bays’ wetlands, waters and nearby fields for survival. Observing and hunting these winter visitors are activities important to the local culture and economy.
Waterfowl populations are counted through aerial surveys conducted along the entire Atlantic Flyway in early January.
Comparing local counts of sensitive waterfowl species to counts from the Atlantic Flyway can help us understand the responses of waterfowl to changes in the Bays. Hunting pressure, weather patterns and changes in habitat at northern breeding grounds also influence the numbers of migratory waterfowl found on the Bays in winter.
Since the early 1970’s, at least 29 species of waterfowl have been observed in the Bays during these surveys. Nearly 15,000 individuals of 14 species were counted in 2016.
CANVASBACK
Historically, the Bays’ marshes and bay grass meadows supported large numbers of wintering Canvasback ducks, a species prized by hunters. After increasing somewhat after 2005, Canvasback numbers on the Bays are again very low.

46
LIVING RESOURCES
OYSTER ENHANCEMENTA healthy oyster population provides tremendous ecological benefits in an estuary. One adult oyster can filter up to 50 gallons of water per day to greatly improve water clarity. Oysters build reef ecosystems that are hotspots of nitrogen removal and desirable habitat for dozens of other bay species.
Oyster reefs used to be common around the Bays, and a healthy commercial fishery existed until disease devastated the population in the 1950s. Today, wild oysters are rare, but studies show that they are reproducing in some areas of the Bays.
For more than a decade, volunteer oyster gardeners have grown oysters in floating cages to be used in restoration projects. This program has demonstrated that oysters grow successfully throughout the Bays. Interest in the economic and environmental potential of aquaculture led to passage of a bill in 2013 that once again allows oyster and clam farming on the Inland Bays.
In 2016, two thousand bushels of oyster shell were collected from local restaurants by the CIB’s “Don’t Chuck Your Shucks’ program. The recycled shell will be used to build living shorelines and offshore reefs. The CIB is also researching the effectiveness of floating oyster cages to improve residential canals.
Bagged oyster shell headed for the Loop Canal Living Shoreline Demonstration Project on Salt Pond

46 47
WATERSH
ED C
ON
DITIO
N N
UTRIEN
T POLLU
TION
WATER Q
UA
LITYLIVIN
G RESO
URC
ESH
UM
AN
HEA
LTH RISKS
CLIM
ATE
BLUE CRAB ABUNDANCEBlue Crabs are a summer delicacy in Delaware, and crabbing is popular with local residents and vacationers. Blue Crabs play a key role in the ecology of the Inland Bays, where they are an important link in the food chain. Crabs are scavengers and predators, eating live or dead fish, clams, snails, and aquatic vegetation. In turn, they provide food for birds, fish, and terrapins.
Populations of crabs in the Bays vary from year to year, partly in response to the severity of winter temperatures. But other factors such as bay grass density, oxygen levels, predators, and harvest pressure also influence populations.
Crabs are scavengers and predators, eating live or dead fish, clams, snails, and aquatic vegetation.
LONG-TERM TRENDAnnual trawl surveys conducted in Rehoboth and Indian River Bays have shown a long-term decrease in the average catch of crabs per trawl from 1986 to the mid-2000’s. Reasons for this decline are uncertain.
CHANGE SINCE PREVIOUS REPORTBlue Crab populations in the Bays have remained low the past five years, with no trend.
LOOKING AHEAD The elimination of once-through cooling water at the NRG power plant in 2013 was expected to boost crab numbers in the Indian River, but data do not yet support this.
0
5
10
15
20
25
30
1985 1990 1995 2000 2005 2010 2015
Ave
rage
Cat
ch P
er T
ow
Blue Crabs in Rehoboth & Indian River Bays
Herring gull with Blue crab Photo: John A. Fritchey

48
LIVING RESOURCES
FISH ABUNDANCEOver a hundred species of fish live, feed and grow in the Inland Bays. The Bays’ shallow waters and wetlands offer protection, and serve as nurseries for species valued by recreational anglers and commercial fisheries.
The Department of Natural Resources and Environmental Control conducts annual trawl surveys at twelve open water locations on the Inland Bays to assess fish populations. Trends in the number of fish caught may indicate changes in the environment of both the Bays and nearby coastal waters of the Atlantic Ocean.
In 2015 surveys, 43 species of finfish were recorded. Bay Anchovy, Atlantic Silverside, Silver Perch, and Weakfish comprised over 80% of the catch.
0
100
200
300
400
500
1985 1990 1995 2000 2005 2010 2015
Ave
rage
Cat
ch P
er T
ow
Bay Anchovy
0
50
100
150
200
1985 1990 1995 2000 2005 2010 2015
Ave
rage
Cat
ch P
er T
ow
Spot
Bay Anchovy are the most plentiful fish caught in the trawl survey. Using the bays to grow and feed from spring through fall, this silvery forage fish is a critical link in the food chain between plankton and bigger fish. Numbers of Bay Anchovy are declining in the Bays.
Used for both bait and food, Spot are an important species in the Inland Bays. Because the Bays are at the northern range of this species’ distribution, the population here is subject to large fluctuations influenced by the currents and weather of a particular year.
(continued)Fish images: Integration and Application Network
Top right: PufferfishBottom right: Shorezone Fish Survey volunteers sorting their catchPhotos: Dennis Bartow

48 49
WATERSH
ED C
ON
DITIO
N N
UTRIEN
T POLLU
TION
WATER Q
UA
LITYLIVIN
G RESO
URC
ESH
UM
AN
HEA
LTH RISKS
CLIM
ATE
Over a hundred species of fish live, feed and grow in the Inland Bays.
LONG-TERM TRENDLarge year-to-year differences in the abundances of many species are common. Bay Anchovy has declined significantly over the past 30 years. The population of summer flounder has remained relatively stable in the Bays.
CHANGE SINCE PREVIOUS REPORTAbundance of Bay Anchovy continued to decrease slowly. Other species showed little change.
LOOKING AHEAD Protection of wetlands and shore-zone habitat in the Bays will be critical to maintain populations of species that use these areas. Long-term reductions in algae blooms in the Bays should lead to improved oxygen levels that will benefit young fish, particularly in tributaries. Spot appear to be moving northward along the Atlantic coast in response to climate change, and this may stabilize numbers of this fish in the Bays.

50
0
10
20
30
40
50
60
1985 1990 1995 2000 2005 2010 2015
Ave
rage
Cat
ch P
er T
ow
Weakfish
0
10
20
30
40
50
60
1985 1990 1995 2000 2005 2010 2015
Ave
rage
Cat
ch P
er T
ow
Silver Perch
0
0.5
1
1.5
1985 1990 1995 2000 2005 2010 2015
Ave
rage
Cat
ch P
er T
ow
Summer Flounder
Weakfish spawn in and near the Bays. Juveniles concentrate in tidal creeks where they feed and then migrate offshore in the fall. Formerly plentiful, Weakfish populations dramatically decreased in the late 1980’s and early 1990’s. Recovery has been slow, and the low survival of adults seen in the mid-Atlantic region is not fully understood.
Silver Perch are a lesser known fish that have increased in abundance since the 1990s. In spring and summer, they spawn in the Bays where the young grow from two to six inches before migrating offshore in late fall.
Summer Flounder support a significant recreational fishery in the Inland Bays, annually ranking among the top five in recreational landings. Young fish feed in the shore zone and move into the deeper waters of the estuary as they grow. Numbers have not changed over time.
LIVING RESOURCES

50
WATERSH
ED C
ON
DITIO
N N
UTRIEN
T POLLU
TION
WATER Q
UA
LITYLIVIN
G RESO
URC
ESH
UM
AN
HEA
LTH RISKS
CLIM
ATE
SHORE-ZONE FISH The CIB conducts a volunteer survey of fish and Blue Crab populations in the shallow waters near shorelines. These productive areas support high densities of small fishes.
The composition of fish communities in the shore-zone can be an indicator of water quality and habitat quality. Menhaden, Bay Anchovy, and Spot, for example, are sensitive to low oxygen resulting from nutrient pollution. Striped Killifish, Mummichog, and Sheepshead minnow have a higher tolerance for low oxygen levels.
Shore zone fish communities in the Bays were once dominated by oxygen-sensitive species. In the late 20th century, however, poor water quality caused Mummichog and Sheepshead Minnow to dominate. Current levels of Spot, Menhaden, and Bay Anchovy in nearshore areas may be a sign of improving conditions in the Bays.
0 10 20 30 40 50 60 70
Mummichog
Atlantic Silversides
Striped Killifish
Spot
Sheepshead Minnow
Atlantic Menhaden
Silver Perch
White Mullet
Bay Anchovy
Summer Flounder
Average Catch Per Sample
Most Abundant Shore-Zone Fish2011-2015
51
Shorezone Fish Survey volunteers seiningPhoto: George Rosenberg

52
LIVING RESOURCES
Most fish kills happen in summer when there are abundant algae, high temperatures, low oxygen, and high numbers of fish.
LONG-TERM TRENDThe number of fish kills investigated by the Department of Natural Resources and Environmental Control varies greatly from year to year. More were reported in the 2000s, but there has been no significant trend over time.
CHANGE SINCE PREVIOUS REPORTOne to two fish kills continue to be reported annually in the Bays. Those reported in the past five years have included juvenile menhaden, but in smaller numbers per incident than in the past.
LOOKING AHEAD Water quality improvements that have reduced algae concentrations should lead to fewer incidents of fish kills caused by low dissolved oxygen.
NUMBER OF FISH KILLSFish kills are an indicator of stress in the bay environment, usually caused by a combination of nutrient pollution and weather conditions. Nutrient pollution stimulates algae blooms that can cause oxygen levels to drop low enough to kill fish.
Most fish kills happen in summer when there are abundant algae, high temperatures, low oxygen, and high numbers of fish. The majority of kills in the Bays involve Atlantic Menhaden, which feed in large schools where algae is plentiful.
Roughly 60% of fish kills occurred in tidal creeks and rivers and 40% occurred in residential canals and lagoons.
0
2
4
6
8
10
12
1980 1985 1990 1995 2000 2005 2010 2015
Num
ber o
f Kill
s
Fish Kills in the Inland Bays
Menhaden fish kill on canal.

52 53
WATERSH
ED C
ON
DITIO
N N
UTRIEN
T POLLU
TION
WATER Q
UA
LITYLIVIN
G RESO
URC
ESH
UM
AN
HEA
LTH RISKS
CLIM
ATE
Recreational fishing spending in Delaware was over $165 million in 2014.
LONG-TERM TRENDFishing trips in the Bays increased over the 1990s into the 2000s, and then declined back to mid-1990s levels over the last eight years. Catches of recreationally important fish generally reflect this decline. Pounds of fish caught per trip has changed little over the last 25 years.
CHANGE SINCE PREVIOUS REPORTThe decline in fishing since the last report mirrors regional and national decreases. The effects of the economic recession on personal income and leisure time are likely responsible. Fish population changes, such as the crash of adult weakfish, and potential shifts in species distributions to cooler waters further north and offshore also have an influence on catches.
RECREATIONAL FISHINGThe Bays offer a multitude of opportunities to reel in fish. Recreational fishing also boosts the local economy—spending in Delaware was over $165 million in 2014.
The number of recreational fishing trips and total catch from the Inland Bays are estimated through angler surveys. They indicate trends in fishing, prevalence of adult fish, and maybe skill of the anglers.
Currently over 200 thousand fishing trips are made each year in the Bays, reeling in an estimated 176 thousand pounds of fish.
0
100,000
200,000
300,000
400,000
1990 1995 2000 2005 2010 2015
Num
ber o
f Trip
s
Number of Fishing Trips Per Year
survey method change
0.0
0.4
0.8
1.2
1.6
1990 1995 2000 2005 2010 2015
Poun
ds o
f Fis
h
Pounds of Fish Caught Per Trip
survey method change
Note: In 2004, the method used to estimate recreational catch was revised by the
National Oceanic and Atmospheric Administration.
(continued)
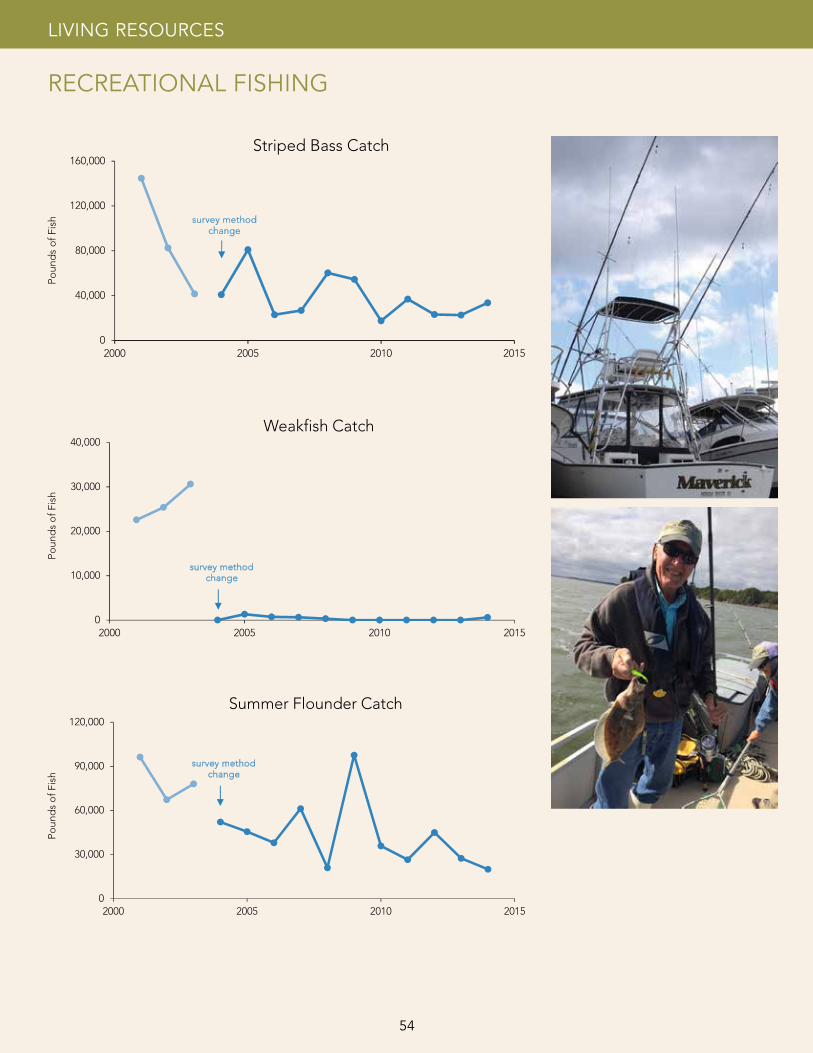
54
LIVING RESOURCES
RECREATIONAL FISHING
0
40,000
80,000
120,000
160,000
2000 2005 2010 2015
Poun
ds o
f Fis
h
Striped Bass Catch
survey method change
0
10,000
20,000
30,000
40,000
2000 2005 2010 2015
Poun
ds o
f Fis
h
Weakfish Catch
survey method change
0
10,000
20,000
30,000
40,000
2000 2005 2010 2015
Poun
ds o
f Fis
h
Weakfish Catch
survey method change
0
30,000
60,000
90,000
120,000
2000 2005 2010 2015
Poun
ds o
f Fis
h
Summer Flounder Catch

54
WATERSH
ED C
ON
DITIO
N N
UTRIEN
T POLLU
TION
WATER Q
UA
LITYLIVIN
G RESO
URC
ESH
UM
AN
HEA
LTH RISKS
CLIM
ATE
HUMAN HEALTH RISKSWater recreation and eating fresh seafood are some of the great joys of living on the coast; however, there is reason for caution when using many areas of the Inland Bays.
Pathogens—illness causing bacteria, viruses, and parasites—can enter water from many sources, including waste from wildlife, humans, and domestic animals.. Some bacteria that occur naturally in the Bays also can be pathogenic. Exposure to these pathogens through water contact may cause acute gastrointestinal illness or infect open wounds. People may also be exposed to pathogens by eating contaminated shellfish.
The open waters of the Inland Bays are generally safe for recreational contact such as swimming. However more poorly flushed tributaries and canals regularly fail to meet safe swimming standards.
Currently 61% of the Inland Bays are approved for shellfishing year- round—down 1% since the previous report. An additional 3.6% of Bay waters were moved from seasonally-approved to prohibited status.
Chemical contaminants from a variety of industrial, urban, and agricultural sources can also enter surface waters, where they accumulate in fish. Mercury and polychlorinated biphenyls (PCB’s) have been identified as ‘contaminants of concern’ present in migratory Bluefish and Striped Bass caught in the Inland Bays, though the chemicals likely are picked up elsewhere. Both species are currently under consumption advisories.
Looking Ahead
Concentrations of PCBs and mercury in fish are expected to decrease slowly but it may be decades before consumption advisories are lifted.
Removal of the Rehoboth Beach Wastewater Treatment Plant discharge scheduled for 2018 may allow reopening of some waters closed to shellfishing near the Lewes-Rehoboth Canal.
55
HUMAN HEALTH RISKS
TREND: NO TREND

56
BACTERIA POLLUTIONMost bacteria in the Bays are harmless to humans. But harmful bacteria, viruses, and parasites (pathogens) may be introduced by pollution, especially from human or animal feces. Some bacteria that live naturally in the Bays may also cause infection, particularly in people with compromised immune systems.
Bacteria of the genus Enterococcus are used as indicators of fecal contamination because they are found in the intestinal tracts of warm-blooded animals. High numbers of Enterococcus bacteria in water indicate that pathogens might also be present and pose a health risk to recreational users.
Bay waters are tested regularly for levels of Enterococcus. The concentrations measured are compared to both a single-sample safe swimming standard of 104 colonies/100 milliliters of water, and a long-term mean standard of 35 colonies/100 milliliters.
Summer samples collected from 2011 to 2015 show that the majority of open bay waters meet the single-sample safe swimming standard over 90% of the time, indicating these areas are usually safe for recreation. Most tributary sites exceed the safe swimming standard more than 75% of the time, demonstrating that these areas are frequently unsafe for recreation.
HUMAN HEALTH

56 57
WATERSH
ED C
ON
DITIO
N N
UTRIEN
T POLLU
TION
WATER Q
UA
LITYLIVIN
G RESO
URC
ESH
UM
AN
HEA
LTH RISKS
CLIM
ATE
LONG-TERM TRENDOf the twelve stations that have long-term data, two (Pasture Point and the mouth of Love Creek) have had significantly increasing bacteria levels. Other areas show no trend.
CHANGE SINCE PREVIOUS REPORTConcentrations of fecal indicator bacteria remain similar to those reported previously. Canals and tributaries continue to exceed the long-term maximum safe swimming standard, while open bay waters have consistently safe levels of Enterococcus.
LOOKING AHEAD In healthy bays, many fecal indicator bacteria come from wildlife, rather than human sources. More research is needed to determine sources of fecal bacteria in order to develop management practices that reduce public health risks.
Disease-causing microorganisms can come from many sources—malfunctioning septic systems, manure, pet waste,wildlife, sewage from boats, and stormwater runoff.
Pathogens, Algal Blooms, and Nutrient PollutionBacteria in the genus Vibrio occur naturally in estuaries and usually are harmless to humans. A small percentage, however, can cause serious food-borne illness or wound infections. The species Vibrio vulnificus is responsible for 95% of U.S. seafood-borne fatalities.
Recent research shows that Vibrio bacteria may become more abundant in the Bays when some types of algae bloom in response to excess nutrients in the water. Warmer waters also promote Vibrio growth.

58
HUMAN HEALTH
APPROVED SHELLFISH GROWING WATERSClams, oysters and mussels are filter feeders and can accumulate bacteria, viruses and other pollutants as they feed. The risk of illness from consuming contaminated shellfish is much greater than from other seafood because shellfish are frequently eaten raw.
The Department of Natural Resources and Environmental Control determines approved shellfishing areas based primarily on proximity to potential pollution sources such as wastewater discharges and marinas.
In 2016, the harvest of shellfish was prohibited in 32% of the Inland Bays. An additional 7% were approved for harvest only seasonally (December to April).
“Oysters” by Jeffrey Vary/CC BY 2.0

58 59
WATERSH
ED C
ON
DITIO
N N
UTRIEN
T POLLU
TION
WATER Q
UA
LITYLIVIN
G RESO
URC
ESH
UM
AN
HEA
LTH RISKS
CLIM
ATE
0%
20%
40%
60%
80%
100%
1962 1976 1988 1990 1995 2002 2010 2016
Perc
ent o
f Bay
Wat
ers
Shellfishing Area Designation Changes
Approved Seasonally Approved Prohibited
LONG-TERM TRENDConstruction of marinas and elevated bacteria concentrations led to an increase in prohibited and seasonally-approved areas between 1960 and 1990. Some previously prohibited areas were reopened in the early 2000’s; however, this trend has reversed.
CHANGE SINCE PREVIOUS REPORTSince 2011, 1,042 acres of approved or seasonally-approved waters were reclassified as prohibited. This included a portion of Love Creek; the northeastern corner of Rehoboth Bay also was closed because of increased flow rates at the Rehoboth Wastewater Treatment Plant.
LOOKING AHEAD Portions of Rehoboth Bay may be reopened for shellfishing when the Rehoboth Wastewater Treatment Plant’s discharge is removed in 2018.
The risk of illness from consuming contaminated shellfish is much greater than from other seafood because shellfish are frequently eaten raw.
“Oysters” by Jeffrey Vary/CC BY 2.0

60
HUMAN HEALTH
FISH CONSUMPTION ADVISORIES Consumption advisories are in effect for Bluefish and Striped bass caught in the Inland Bays, due to elevated concentrations of polychlorinated biphenyls (PCBs) and mercury. An advisory is a recommendation to limit consumption to specified quantities, species, and sizes of fish to minimize the risk from contaminants. These migratory fish may pick up the contaminants outside of the Bays.
PCBs are organic chemicals now banned from manufacture, but they still persist in the environment. Mercury continues to enter the environment from many sources, including the burning of fossil fuels. Their accumulation in fish depends on the species, size, age, and feeding area of the fish. Both contaminants have negative effects on the health of people including neurological and developmental disorders.
Consumption advisories currently are issued for Bluefish and Striped bass caught in the Inland Bays, due to elevated concentrations of polychlorinated biphenyls (PCBs) and mercury.
LONG-TERM TRENDConsumption advisories were first issued for Bluefish beginning in 2007 and for Striped bass in 2009.
CHANGE SINCE PREVIOUS REPORTBoth species remain under advisory in the Inland Bays.
LOOKING AHEAD It is projected that there will be slow, continued improvement in PCB levels in these fish. Reduced emissions from coal-fired power plants should bring about declines in mercury levels. However, it may be decades before consumption advisories change.
0
1
2
2000 2005 2010 2015
Num
ber o
f Adv
isor
ies
Number of Inland Bays Fish Species with Consumption Advisories

60 61
WATERSH
ED C
ON
DITIO
N N
UTRIEN
T POLLU
TION
WATER Q
UA
LITYLIVIN
G RESO
URC
ESH
UM
AN
HEA
LTH RISKS
CLIM
ATE
CLIMATEGlobal emissions of greenhouse gases are bringing about higher temperatures, longer growing seasons, and rising sea levels. These changes influence everything from the chemistry of bay water to the location and distribution of ecosystems like saltmarshes and bay grass meadows. The timing and degree to which migratory fish and birds use the estuary may change; species of plants and animals may shift in favor of those that prefer or tolerate warmer weather.
Increasing heat is a significant concern. The growing season will continue to lengthen, and heat waves are expected to become more extreme. As a result, the Bays will likely be warmer for a longer period each year. While no changes in average annual precipitation have been observed, increasing frequency of droughts and floods may be occurring and are projected. This could increase the transport of nutrients to the Bays, which can lead to conditions that create oxygen-depleting algal blooms.
Looking ahead
The State of Delaware has taken action to address climate change through the signing of Executive Order 41 in 2013. This order directs state agencies to address both the causes and consequences of climate change by developing actionable recommendations to reduce greenhouse gas emissions that contribute to climate change, increase resilience to climate impacts, and avoid and minimize flood risks due to sea level rise. While full implementation of this directive will result in reduced greenhouse gases, emissions must be reduced worldwide to make an impact.
CLIMATE
TREND: NEGATIVE

62
CLIMATE
CARBON DIOXIDE CONCENTRATION AND AIR TEMPERATUREGreenhouse gases act like a blanket around the earth, trapping heat in the atmosphere. Carbon dioxide, an abundant and powerful greenhouse gas, is produced from burning fossil fuels. Its presence is a good indicator of global climate change.
Global atmospheric carbon dioxide is measured at Hawaii’s Mauna Loa Observatory, located in a remote area far from industry and urban traffic. Levels increased from 315 parts per million (ppm) in the late 1950s to 402 ppm in 2015.
Over the same time period, average annual air temperatures in Delaware have also risen by about two degrees Fahrenheit. Warmer air means warmer water, especially in shallow waters such as the Inland Bays.
51
52
53
54
55
56
57
58
59
1895 1915 1935 1955 1975 1995 2015
Deg
rees
(⁰F)
Average Annual Air Temperaturein Lewes, DE
Carbon dioxide levels increased from 315 parts per million (ppm) in the late 1950s to 402 ppm in 2015.
CHANGE SINCE PREVIOUS REPORTGlobal atmospheric carbon dioxide levels continue to increase, rising 4% from 390 ppm in 2010 to 402 ppm in 2015.
LOOKING AHEADGlobal greenhouse gas emissions are projected to increase in the future unless actions are taken to reverse the trend. Climate models suggest that average summer air temperature in southern Delaware could increase eight degrees Fahrenheit by the end of the century. Delaware has taken statewide action to address this global problem by decreasing its total greenhouse gas emissions by 30% between 2000 and 2010—the most of any state in the US.

62 63
WATERSH
ED C
ON
DITIO
N N
UTRIEN
T POLLU
TION
WATER Q
UA
LITYLIVIN
G RESO
URC
ESH
UM
AN
HEA
LTH RISKS
CLIM
ATE
On the Delaware coast, sea level is rising at a rate of 1.1 feet per century.
SEA LEVEL RISEWarmer water temperatures raise the sea level by expanding ocean water and causing land-locked ice to melt into the oceans. On the Delaware coast, sea level is rising at a rate of 1.1 feet per century.
The Inland Bays are already experiencing effects from sea level rise, including increased flooding, shoreline erosion, and drowning of tidal wetlands. A combination of rising water, sinking lands, and very low elevation makes our watershed particularly vulnerable to the effects of sea level rise.
LONG-TERM TRENDSea level on Delaware’s coast has risen over the past 1,000 years at an estimated rate of 0.3 feet per century. The rate has accelerated in the last 100 years, with a total rise of more than one foot since 1900.
LOOKING AHEADSea level rise projections for Delaware depend largely on global emissions of greenhouse gasses into the atmosphere. The highest projection adds almost five feet by the end of the century. At that level, existing bayside communities and coastal habitats would be inundated. Independent of future greenhouse gas emissions, we are locked in to significant future sea level rise due to a lag time in the thermal expansion of the oceans. -1.5
-1
-0.5
0
0.5
1
1.5
1910 1920 1930 1940 1950 1960 1970 1980 1990 2000 2010 2020
Feet
Monthly Average Sea Level Rise at Lewes, DE

64
CLIMATE
GROWING SEASON LENGTHThe growing season is defined as the number of days between the last frost in spring and the first frost in fall. Changes in growing season length can affect the Bays by causing shifts in the ranges of species and stimulating growth of excessive algae and invasive species.
Currently, the statewide growing season in Delaware averages 210 days per year. Local data for estimating length of the growing season is available from Lewes, Delaware where the average is currently 230 days per year. The growing season around the Bays is relatively longer due to its proximity to the ocean.
The growing season is defined as the number of days between the last frost in spring and the first frost in fall.
LONG-TERM TRENDLocal growing season length, as measured in Lewes, has increased by at least 45 days (25%) since 1945.
CHANGE SINCE PREVIOUS REPORTGrowing season data are not available from Lewes after 2009 when the monitoring station was temporarily relocated.
LOOKING AHEADBy mid-century, the growing season in Delaware is expected to lengthen by another 20 days.
160
180
200
220
240
260
1945 1955 1965 1975 1985 1995 2005 2015
Day
s
Growing Season Length in Lewes, DE

64 65
WATERSH
ED C
ON
DITIO
N N
UTRIEN
T POLLU
TION
WATER Q
UA
LITYLIVIN
G RESO
URC
ESH
UM
AN
HEA
LTH RISKS
CLIM
ATE
On average, the state of Delaware receives 45 inches of precipitation annually.
LONG-TERM TRENDPrecipitation varies greatly from year to year, so trends must be assessed through long-term measurements. Currently, there is no trend in total annual precipitation in coastal Delaware.
LOOKING AHEADAs the climate warms, precipitation in Delaware is projected to increase annually, particularly during the fall.
PRECIPITATIONRising temperatures at the Earth’s surface causes more evaporation to occur from land and waterbodies. More moisture in the air can alter the amount and timing of precipitation which will affect the flow of freshwater to the Bays. Changes in precipitation can alter pollution inputs, salinity, and circulation patterns in the estuary affecting the types of plants and animals that can survive.
On average, the state of Delaware receives 45 inches of precipitation annually.
20
25
30
35
40
45
50
55
60
65
1890 1910 1930 1950 1970 1990 2010
Inch
es
Annual Precipitation in Lewes, DE

66
CLIMATE
OCEAN ACIDIFICATIONWarming oceans allow more carbon dioxide from the atmosphere to dissolve in the waters. Once in the ocean, carbon dioxide turns into carbonic acid, which increases the acidity of the water.
Sea life that produce calcium carbonate shells—such as corals, clams, and mussels—are vulnerable to increasing acidity. Rising acidity can damage shells and slow the growth of new shells, threatening the survival of these organisms.
Because bays are smaller systems, they are more vulnerable to change. Acidification in estuaries is more complex than in the open ocean and is less understood.
Sea life that produce calcium carbonate shells—such as corals, clams, and mussels—are vulnerable to increasing acidity.
LONG-TERM TRENDMeasurements at the Mauna Loa Observatory in Hawaii provide a good indicator of ocean acidification. There the average ocean pH has dropped 0.04 pH units since 1988. Because the pH scale is logarithmic, this means that the ocean has become 9% more acidic in 27 years.
LOOKING AHEADOceans are expected to become more acidic as climate change continues. What this means for estuaries such as the Inland Bays is uncertain. Local monitoring data is needed on pH in the Inland Bays.
8.04
8.06
8.08
8.10
8.12
8.14
1988 1993 1998 2003 2008 2013
pH
Ocean pH near Mauna Loa, Hawaii
Measuring Acidity
Acidity of water is measured on a pH scale, which ranges from 0 to 14. A pH of 7 is neutral, a pH less than 7 is acidic, and a pH greater than 7 is basic.
The pH scale is logarithmic and as a result, each one-unit change in the pH scale corresponds to a ten-fold change in acidity. For example, pH 6 is ten times more acidic than pH 7, and 100 times more acidic than pH 8.
Adapted from Dore et al., 2009.

66 67
WATERSH
ED C
ON
DITIO
N N
UTRIEN
T POLLU
TION
WATER Q
UA
LITYLIVIN
G RESO
URC
ESH
UM
AN
HEA
LTH RISKS
CLIM
ATE
Photo: University of Delaware

6868
WATERSHED CONDITION
Appledorn, M.V. and M. Baker. 2011 Report to the Delaware Center for the Inland Bays: Methodological description and medium-resolution results of spatial and temporal changes in riparian buffers and implications for stream nitrate concentrations. University of Maryland Baltimore County, Department of Geography and Environmental Systems, Baltimore, MD.
Baker, M.E., D.E. Weller, and T.E. Jordan. 2006. Improved methods for quantifying potential nutrient interception by riparian buffers. Landscape Ecology 21: 1237-1345.
Bason, C.W. 2008. Recommendations for an Inland Bays watershed water quality buffer system. Delaware Center for the Inland Bays, 40 p.
Chesapeake Community Modeling Program. 2016. Riparian Analysis Toolbox. Accessed 2016. http://ches.communitymodeling.org/about.php.
Homsey, A. 2016. Impervious surface coverage estimates data for the Delaware Inland Bays Watershed. University of Delaware Water Resources Agency. University of Delaware, Newark, DE.
Lerberg, S., A. Holland, and D. Sanger. 2000. Responses of tidal creek microbenthic communities to the effects of watershed development. Estuaries and Coasts 23: 838-853.
Mitsch, W.J., and J.G. Gosselink. 2015. Wetlands. 5th edition. John Wiley and Sons, Inc., New York.
Ocean Surveys, Inc. 2004. Inlet hydraulic measurements, Indian River Inlet, Delaware. OSI Report No. 04ES090B, 56 p.
Raney, D.C., J.O. Doughty, and J. Livings. 1990. Tidal prism numerical model investigation and analysis tasks of the Indian River Inlet Scour Study, Delaware. DER Report No. 500-183, University of Alabama, Tuscaloosa, AL.
REFERENCES
State of Delaware. 2016. First Map Open Data. Accessed 2016. http://opendata.firstmap.delaware.gov/.
Tarboton, D.G., and M.E. Baker. 2008. Towards an algebra for terrain-based flow analysis. Chapter 21 in Mount et al (eds) Representing, Modelling, and Visualizing the Natural Environment. Innovations in GIS Series. CRC Press-Taylor and Francis, London.
United States Environmental Protection Agency. 2016. National Estuary Program Online Reporting Tool (NEPORT). USEPA, Washington, D.C. Accessed 2016. http://ofmdev1-epa-ow.attaincloud.com/pls/apex_owdev/f?p=132:1.
Walsh, C.J., A.H. Roy, J.W. Feminella, P.D. Cottingham, P.M. Groffman, and R.P. Morgan. 2005. The urban stream syndrome: current knowledge and the search for a cure. Journal of the North American Benthological Society 24: 706-723.
Y. H. Jo, K. R. Philipp, R. T. Field, A. R. Homsey, C. Bason, and K. Somers. 2014. Acreage and condition trends for marshes of Delaware’s Inland Bays as an environmental indicator and management tool: A report to the Center for the Inland Bays to identify and document recent trends in the salt marshes of Rehoboth, Indian River and Little Assawoman Bays.
MANAGING NUTRIENT POLLUTION
Delaware Department of Natural Resources and Environmental Control and Delaware Tributary Action Teams. 2008. Inland Bays Pollution Control Strategy. Dover, DE.
Delaware Nutrient Management Commission. 2015. Annual Report to Governor Jack A. Markell and the 148th General Assembly. Delaware Department of Agriculture, Dover, DE.
Mirsajaki, H. and X. Xie. 2016. Dataset of nitrogen and phosphorus loads of streams in the Inland Bays Watershed. Delaware Department of Natural Resources and Environmental Control, Dover, DE.
National Atmospheric Deposition Program. 2016. AIRMoN data access page. Champaign, IL. Accessed 2016. http://nadp.sws.uiuc.edu/data/sites/siteDetails.aspx?net=AIRMoN&id=DE02.
Opinion Works. 2015. Citizen Attitudes about a Delaware Clean Water Fee. 9 pages.
Schepens, D., and K. Saunders. 2015. Dataset of onsite wastewater treatment systems in the Inland Bays Watershed. Delaware Department of Natural Resources and Environmental Control, Dover, DE.
Scudlark, J.R. and T.M. Church. 1999. A comprehensive reexamination of the input of atmospheric nitrogen to the Rehoboth and Indian River Estuaries. Report prepared for the Center for the Inland Bays and Delaware Department of Natural Resources and Environmental Control, University of Delaware, Lewes, D.E.
Scudlark, J.R., J.A. Jennings, M.J. Roadman, K.B. Baygrassidge, and W.J. Ullman. 2005. Atmospheric nitrogen inputs to the Delaware Inland Bays: The role of ammonia. Environmental Pollution 135: 433-443.
Sussex County Delaware. 2016. Proposed sewer projects and schedules. Georgetown, DE. Accessed 2016. https://www.sussexcountyde.gov/proposed-projects-schedules.
Ullman, W., J.R. Scudlark, and J.A. Volk. 2010. Standard operating procedure for the calculation of N and P deposition from the atmosphere to waters of the Inland Bays. University of Delaware School of Marine Science and Policy and the Delaware Department of Natural Resources and Environmental Control, Lewes, DE.
Volk, J.A., K.B. Savidge, J.R. Scudlark, A.S. Andres, and W.J. Ullman. 2006. Nitrogen load through baseflow, stormflow, and underflow to Rehoboth Bay, Delaware. Journal of Environmental Quality 35: 1742-1755.

68 6968
(continued)
WATER QUALITY
Batiuk, R.A., P. Bergstrom, M.J. Kemp, E. Koch, L. Murray, J.C. Stevenson, R. Bartleson, V. Carter, N.R. Rybicki, J.M. Landwehr, C. Gallegos, L. Karrh, M. Naylor, D. Wilcox, K.A. Moore, S. Ailstock, and M. Teichberg. 2000. Chesapeake Bay submerged aquatic vegetation water quality and habitat-based requirements and restoration targets: A second technical synthesis. Chesapeake Bay Program.
Delaware General Assessment Monitoring Network (GAMN). EPA STORET data warehouse. Accessed 2016. http://www.epa.gov/waterdata/storage-and-retrieval-and-water-quality-exchange.
Tyler, R.M. 2010. Seaweed distribution and abundance in the Inland Bays, 2009. Delaware Center for the Inland Bays, Rehoboth Beach, DE.
Tyler, R.M. 2013. Seaweed distribution and abundance in the Delaware Inland Bays: A declining trend documented via a simple method of collection, 13 p. https://www.inlandbays.org/wpcontent/documents/Seaweed_Report_2013_Addendum.pdf.
University of Delaware. 2016 College of Earth, Ocean, and Environment and the Delaware Sea Grant College Program. Citizen Monitoring Program. Accessed 2016. http://www.citizen-monitoring.udel.edu/.
U.S. Environmental Protection Agency Region III Chesapeake Bay Program and Office and Water Protection Division. 2003. Ambient water quality criteria for dissolved oxygen, water clarity, and chlorophyll a for the Chesapeake Bay and its tidal tributaries. EPA 903-R-03-002, Annapolis, MD.
Valdes-Murtha, L. M. 1997. Analysis of critical habitat requirements for restoration and growth of submerged vascular plants in the Delaware and Maryland Coastal Bays. MS Thesis. University of Delaware, Lewes, DE.
LIVING RESOURCES
Able, K.W. and M.P. Fahay. 2010. Ecology of estuarine fishes: Temperate waters of the Western North Atlantic. The Johns Hopkins University Press, Maryland.
Brinson, A.A. and K. Wallmo. 2013. Attitudes and preferences of saltwater recreational anglers: Report from the 2013 National Saltwater Angler Survey, Volume I. U.S. Department of Commerce, NOAA Technical Memorandum NMFS-F/SPO-135, 45 p.
Bott, M., and R. Wong. 2011. Hard clam (Mercenaria mercenaria) population density and distribution in Rehoboth Bay and Indian River Bay, Delaware.
Boutin, B., and T. Targett. 2013. Fish and blue crab assemblages in the shore zone of tidal creeks in the Delaware Coastal Bays. Northeastern Naturalist 20: 69-90.
Delaware Department of Natural Resources and Environmental Control, Division of Fish and Wildlife, Fisheries Section. 2016. Summary report of Inland Bays specific data from the Marine Recreational Fisheries Statistics Survey.
Delaware Department of Natural Resources and Environmental Control, Division of Fish and Wildlife, Fisheries Section. 2016. Dataset of trawl surveys in the Inland Bays.
Delaware Department of Natural Resources and Environmental Control, Division of Fish and Wildlife, Fisheries Section. 2016. Summary report of fish kills in the Inland Bays.
Delaware Department of Natural Resources and Environmental Control, Division of Fish and Wildlife, Wildlife Section. 2016. Summary report of wintering waterfowl survey data in Delaware.
Delaware Department of Natural Resources and Environmental Control, Species Conservation and Research Program. 2016. Summary reports of osprey and bald eagle nesting data for the Inland Bays watershed.
Devers, P. K., and B. Collins. 2011. Conservation action plan for the American black duck, First Edition. U.S. Fish and Wildlife Service, Division of Migratory Bird Management, Laurel, MD, USA.
Greco, M.J. 2016. Annual report: Coastal finfish assessment survey, April 1, 2015-March 31, 2016. Delaware Division of Fish and Wildlife. Project F-42-R-27. Dover, DE, 167 p.
Kernehan, R.J., D.H. Bartow, R.W. Miller, and A.T. McGowan. 2016. Inshore fish and blue crab survey of Rehoboth Bay, Indian River and Bay and Little Assawoman Bay for 2014. Delaware Center for the Inland Bays, Rehoboth Beach, DE. 28 p.
National Marine Fisheries Service. 2016. Fisheries economics of the United States, 2014. U.S. Department of Commerce, National Oceanic and Atmospheric Administration. Technical Memo NMFS-F/SPO-163, 237p.
Raftovich, R.V., S.C. Chandler, and K.A. Wilkins. 2016. Migratory bird hunting activity and harvest during the 2014-15 and 2015-16 hunting seasons. U.S. Fish and Wildlife Service, Laurel, MD.
Saveikis, D.E. 2014. The economics of hunting, fishing and boating: Supporting conservation and Delaware’s economy. Outdoor Delaware.
Torre, M.P., and T.E. Targett. 2016. Nekton assemblages along riprap-altered shorelines in Delaware Bay, USA: Comparisons with adjacent beach. Marine Ecology Progress Series 548: 209-218.
Zimpfer, N.L., W.E. Rhodes, E.D. Silverman, G.S. Zimmerman, and K. D. Richkus. 2015. Trends in Duck Breeding Populations, 1955–2015. Administrative Report, July 2, 2015. U.S. Fish and Wildlife Service, Division of Migratory Bird Management, Laurel, MD, 24 p.

70
U.S. Fish and Wildlife Service. 2016. Waterfowl population status, 2016. U.S. Department of the Interior, Washington, D.C.
U.S. Fish and Wildlife Service, Migratory Bird Data Center. 2016. Data from the Atlantic flyway mid-winter waterfowl survey. Accessed at https://migbirdapps.fws.gov/.
HUMAN HEALTH RISKS
Bason, C. 2009. Delaware Center for the Inland Bays environmental indicators series 2009-2010. Development of Recreational Water Quality Indicator Report, 9 p.
Delaware Department of Natural Resources and Environmental Control. 2016. Fish Consumption Advisories. Division of Fish and Wildlife, Dover, DE. Accessed 2016. www.dnrec.delaware.gov/fw/Fisheries/Pages/Advisories.aspx.
Delaware Department of Natural Resources and Environmental Control. Division of Water Resources. 7 Del.C. §6010 (2011).
Delaware Department of Natural Resources and Environmental Control. State of Delaware Surface Water Quality Standards Amended July 11, 2004. 7 DE Admin Code 7401.
Main, C.R., L.R. Salvitti, E.B. Whereat, and K.J. Coyne. 2015. Community-Level and Species Specific Associations between Phytoplankton and Particle-Associated Vibrio Species in Delaware’s Inland Bays. Applied and Environmental Microbiology 81:5703–5713.
University of Delaware. 2016 College of Earth, Ocean, and Environment and the Delaware Sea Grant College Program. Citizen Monitoring Program. Accessed 2016. http://www.citizen-monitoring.udel.edu/.
U.S. Environmental Protection Agency. 2016. STOrage and RETrieval and Water Quality eXchange (STORET) data warehouse. Accessed 2016. http://www.epa.gov/waterdata/storage-and-retrieval-and-water-quality-exchange.
CLIMATE
Boesch, D.F., V.J. Coles, D.G. Kimmel, and W.D. Miller. 2007. Coastal dead zones and global climate change: Ramifications of climate change for Chesapeake Bay hypoxia. Pew Center on Global Climate Change, Arlington, VA.
Delaware Coastal Programs. 2014. Delaware Residents’ Opinions on Climate Change and Sea Level Rise. http://de.gov/climateslrsurvey
Delaware Department of Natural Resources and Environmental Control, Division of Air Quality. 2014. Delaware’s 2010 Greenhouse Gas Emissions Inventory, 234 p.
Delaware Department of Natural Resources and Environmental Control, Delaware Coastal Program. 2012. Preparing for tomorrow’s high tide: Sea level rise vulnerability assessment for the State of Delaware, 210 p.
Delaware Division of Energy and Climate. 2016. Delaware Climate Projections Portal. Accessed 2016. http://climate.udel.edu/declimateprojections/.
Dore, J.E., R. Lukas, D.W. Sadler, M.J. Church, and D.M. Karl. 2009. Physical and biogeochemical modulation of ocean acidification in the central North Pacific. Proceedings of the National Academies of Sciences, USA. 106: 102235-12240.
Hayhoe, K., A. Stoner, and R. Gelca. 2013. Climate Change Projections and Indicators for Delaware, 56 p.
Howarth, R.W., D.P. Swaney, E.W. Boyer, R. Marino, N. Jaworski, and C. Goodale. 2006. The influence of climate on average nitrogen export from large watersheds in the Northeastern United States. Biogeochemistry 79: 163-186.
IPCC, 2014: Climate Change 2014: Synthesis Report. Contribution of Working Groups I, II and III to the Fifth assessment report of the Intergovernmental Panel on Climate Change [Core Writing Team, R.K. Pachauri and L.A. Meyer (eds.)]. IPCC, Geneva, Switzerland, 151 pp.
Kaushal, S.S., P.M. Groffman, L.E. Band, C.A. Shields, R.P. Morgan, M.A. Palmer, K.T. Belt, C.M. Swan, S.E.G. Findlay, and G.T. Fisher. 2008. Interaction between urbanization and climate variability amplifies watershed nitrate export in Maryland. Environmental Science and Technology 42: 5872-5878.
Leathers, D. 2014. Chapter 2: Delaware Climate Trends. In Delaware Climate Change Impact Analysis, 14 p.
Meehl, G.A., W.M. Washington, W.D. Collins, J.M. Arblaster, A. Hu, L.E. Buja, W.G. Strand, and H. Teng. 2005. How Much More Global Warming and Sea Level Rise? Science 307: 1769-1772.
Najjar, R., A. Ross, D. Kreeger, S. Kilham. 2012. Chapter 7-Climate change in the Technical Report for the Delaware Estuary and Basin. Partnership for the Delaware Estuary. PDE Report No. 12-01, p. 225-241.
National Oceanic and Atmospheric Administration, National Centers for Environmental Information. 2016. Climate Data Online. Accessed 2016. https://www.ncdc.noaa.gov/cdo-web/datasets/GHCND/stations/GHCND:USC00072730/detail.
National Oceanic and Atmospheric Administration, National Ocean Service. 2016. Sea level trends. Accessed 2016. http://tidesandcurrents.noaa.gov/sltrends/sltrends.html.
National Oceanic and Atmospheric Administration, Office of Coastal Management. 2016. Coastal Flood Exposure Mapper. Accessed 2016. https://coast.noaa.gov/floodexposure/#/splash.
Nikitina, D.L., J.E. Pizzuto, R. A. Schwimmer, and K.W. Ramsey. 2000. An updated Holocene sea-level curve for the Delaware Coast. Marine Geology 171: 7-20.
State of Delaware. 2014. Climate Framework for Delaware: Summary of Recommendations, 112 p.
U.S. Environmental Protection Agency. 2016. Climate Change Indicators. Accessed 2016. https://www.epa.gov/climate-indicators.
REFERENCES

70

Delaware Center for the Inland Bays39375 Inlet RoadRehoboth Beach, DE 19971302-226-8105inlandbays.org
The Delaware Center for the Inland Bays is a nonprofit organization and a National Estuary Program. It was created to promote the wise use and enhancement of the Inland Bays watershed by conducting public outreach and education, developing and implementing restoration projects, encouraging scientific inquiry and sponsoring needed research, and establishing a long-term process for the protection and preservation of the Inland Bays watershed.
Related Documents