Presented by: Jogeswari Bhatra & Group Guided by: A. K. Mishra PGT-Geography

Presented by: Jogeswari Bhatra & Group Guided by: A.K. Mishra PGT-Geography.
Dec 18, 2015
Welcome message from author
This document is posted to help you gain knowledge. Please leave a comment to let me know what you think about it! Share it to your friends and learn new things together.
Transcript

Presented by:
Jogeswari Bhatra
&
Group
Guided by:
A. K. Mishra
PGT-Geography

1.This project is a part of project work given in geography..
2.It gives comparison and analysis of weather data of different places.
3.It also provides idea about the work we have under taken during our project.

1. Explanation of our project.
2. Recording and analysis of weather data
3. Analysis of rainfall in www.allrainfallreports.com
4. Collection weather data from www.wunderground.com
5. Important links.
6. Acknowledgement.
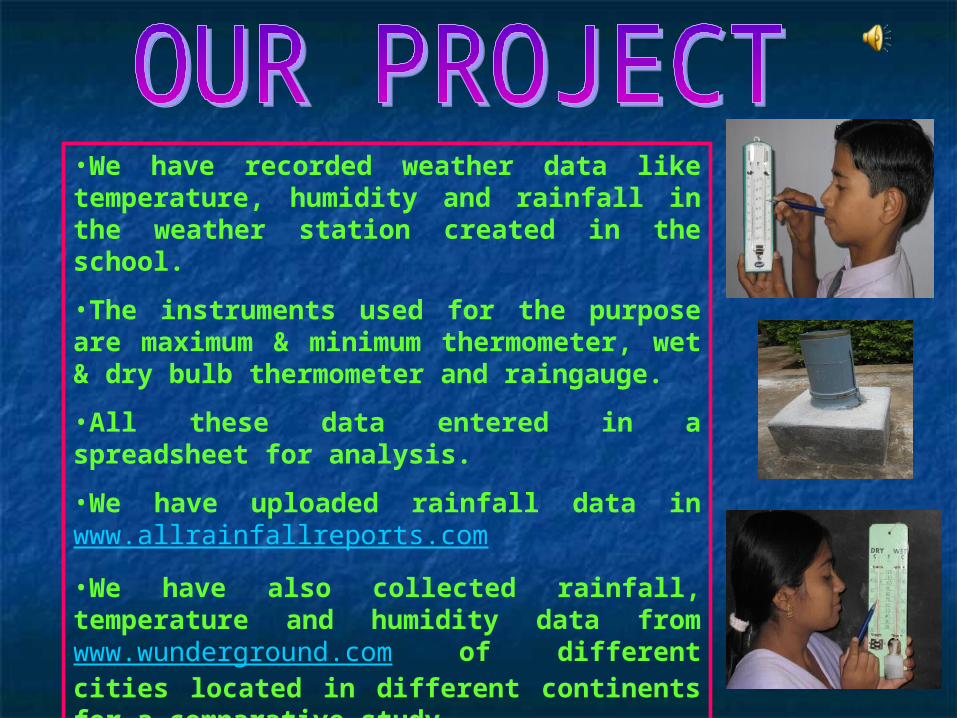
•We have recorded weather data like temperature, humidity and rainfall in the weather station created in the school.
•The instruments used for the purpose are maximum & minimum thermometer, wet & dry bulb thermometer and raingauge.
•All these data entered in a spreadsheet for analysis.
•We have uploaded rainfall data in www.allrainfallreports.com
•We have also collected rainfall, temperature and humidity data from www.wunderground.com of different cities located in different continents for a comparative study.
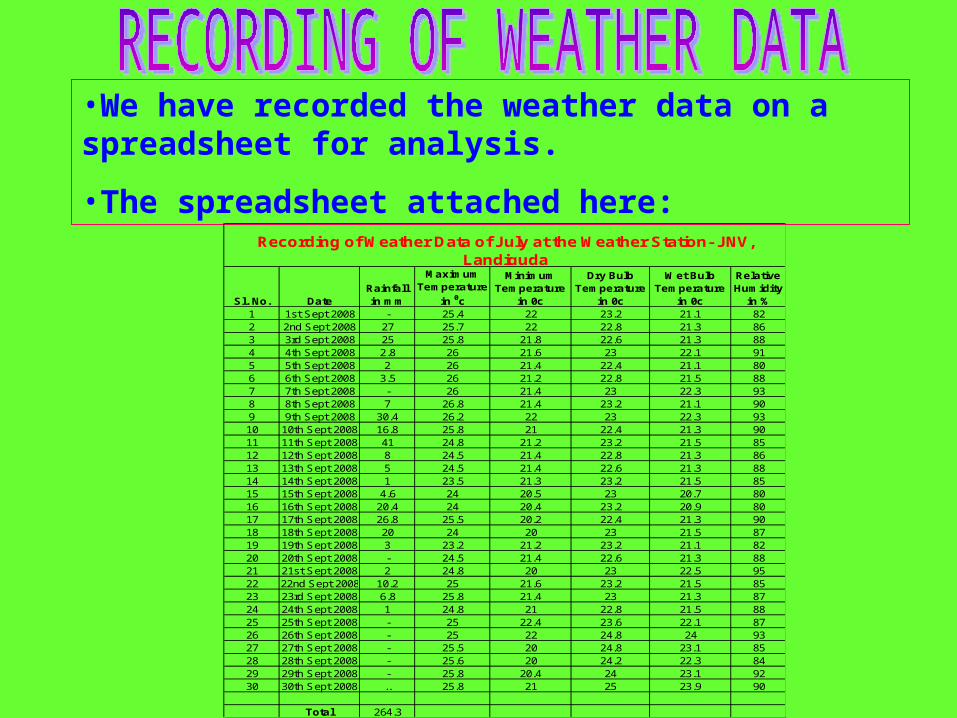
•We have recorded the weather data on a spreadsheet for analysis.
•The spreadsheet attached here:
Sl. No. DateRainfall in mm
Maximum Temperature
in 0c
Minimum Temperature
in 0c
Dry Bulb Temperature
in 0c
Wet Bulb Temperature
in 0c
Relative Humidity
in %1 1st Sept 2008 - 25.4 22 23.2 21.1 822 2nd Sept 2008 27 25.7 22 22.8 21.3 863 3rd Sept 2008 25 25.8 21.8 22.6 21.3 884 4th Sept 2008 2.8 26 21.6 23 22.1 915 5th Sept 2008 2 26 21.4 22.4 21.1 806 6th Sept 2008 3.5 26 21.2 22.8 21.5 887 7th Sept 2008 - 26 21.4 23 22.3 938 8th Sept 2008 7 26.8 21.4 23.2 21.1 909 9th Sept 2008 30.4 26.2 22 23 22.3 9310 10th Sept 2008 16.8 25.8 21 22.4 21.3 9011 11th Sept 2008 41 24.8 21.2 23.2 21.5 8512 12th Sept 2008 8 24.5 21.4 22.8 21.3 8613 13th Sept 2008 5 24.5 21.4 22.6 21.3 8814 14th Sept 2008 1 23.5 21.3 23.2 21.5 8515 15th Sept 2008 4.6 24 20.5 23 20.7 8016 16th Sept 2008 20.4 24 20.4 23.2 20.9 8017 17th Sept 2008 26.8 25.5 20.2 22.4 21.3 9018 18th Sept 2008 20 24 20 23 21.5 8719 19th Sept 2008 3 23.2 21.2 23.2 21.1 8220 20th Sept 2008 - 24.5 21.4 22.6 21.3 8821 21st Sept 2008 2 24.8 20 23 22.5 9522 22nd Sept 2008 10.2 25 21.6 23.2 21.5 8523 23rd Sept 2008 6.8 25.8 21.4 23 21.3 8724 24th Sept 2008 1 24.8 21 22.8 21.5 8825 25th Sept 2008 - 25 22.4 23.6 22.1 8726 26th Sept 2008 - 25 22 24.8 24 9327 27th Sept 2008 - 25.5 20 24.8 23.1 8528 28th Sept 2008 - 25.6 20 24.2 22.3 8429 29th Sept 2008 - 25.8 20.4 24 23.1 9230 30th Sept 2008 .. 25.8 21 25 23.9 90
Total 264.3
Recording of Weather Data of July at the Weather Station- JNV, Landiguda

•We have collected temperature, rainfall and humidity data of some of the important cities from a number of web sites for a comparative study.
•Following are example of weather data collected from this page of the web site. ie. www.wunderground.com
•The data collected in this site are given in the next page in a consolidated form.
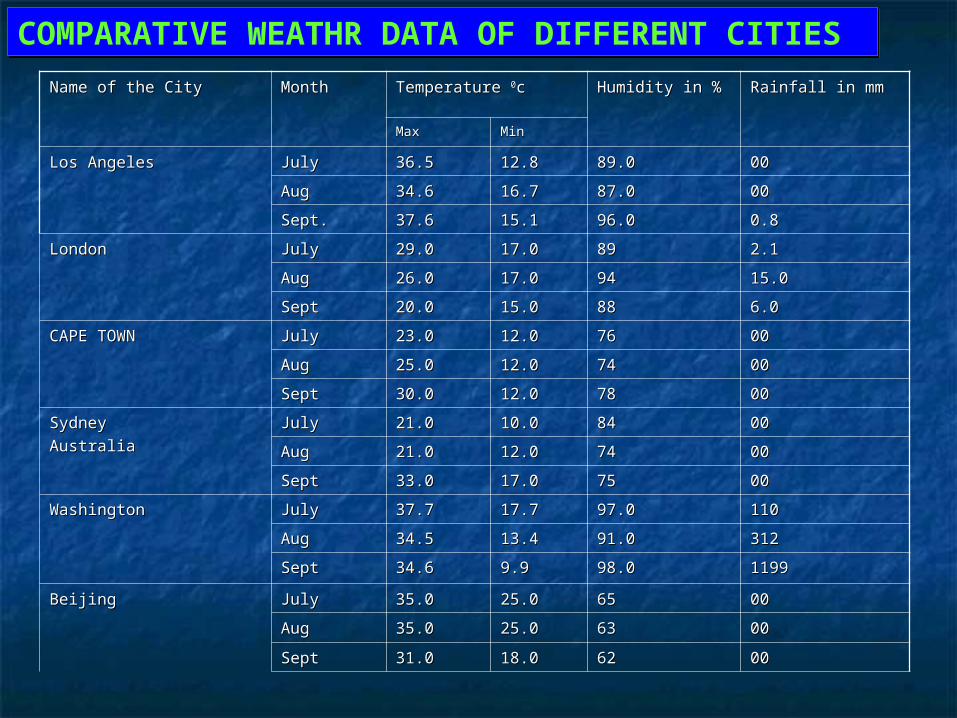
Name of the CityName of the City Month Month Temperature Temperature 00cc Humidity in %Humidity in % Rainfall in mmRainfall in mm
MaxMax MinMin
Los AngelesLos Angeles JulyJuly 36.536.5 12.812.8 89.089.0 0000
AugAug 34.634.6 16.716.7 87.087.0 0000
Sept.Sept. 37.637.6 15.115.1 96.096.0 0.80.8
LondonLondon JulyJuly 29.029.0 17.017.0 8989 2.12.1
AugAug 26.026.0 17.017.0 9494 15.015.0
SeptSept 20.020.0 15.015.0 8888 6.06.0
CAPE TOWNCAPE TOWN JulyJuly 23.023.0 12.012.0 7676 0000
AugAug 25.025.0 12.012.0 7474 0000
SeptSept 30.030.0 12.012.0 7878 0000
Sydney Sydney
AustraliaAustraliaJulyJuly 21.021.0 10.010.0 8484 0000
AugAug 21.021.0 12.012.0 7474 0000
SeptSept 33.033.0 17.017.0 7575 0000
WashingtonWashington JulyJuly 37.737.7 17.717.7 97.097.0 110110
AugAug 34.534.5 13.413.4 91.091.0 312312
SeptSept 34.634.6 9.99.9 98.098.0 11991199
BeijingBeijing JulyJuly 35.035.0 25.025.0 6565 0000
AugAug 35.035.0 25.025.0 6363 0000
SeptSept 31.031.0 18.018.0 6262 0000
COMPARATIVE WEATHR DATA OF DIFFERENT CITIESCOMPARATIVE WEATHR DATA OF DIFFERENT CITIES

0
20
40
60
80
100
July Aug Sept
LOS ANGELAS (USA)
Humidity
Rainfall
0102030405060708090100
July Aug Sept
LONDON (UK)
Humidity
Rainfall
0
10
20
30
40
50
60
70
80
90
July Aug Sept
SYDNEY (AUSTRALIA)
Humidity
Rainfall
0
10
20
30
40
50
60
70
80
July Aug Sept
CAPE TOWN (S. AFRICA)
HumidityRainfall
0
100
200
300
400
500
600
July Aug Sept
JNV, KORAPUT, ORISSA
HumidityRainfall
0
10
20
30
40
50
60
70
80
90
July Aug Sept
WASINGTON (USA)
HumidityRainfall
ANALYSIS OF HUMIDITY & RAINFALL OF DIFFERENT CITIESANALYSIS OF HUMIDITY & RAINFALL OF DIFFERENT CITIES
•These are the comparison of Humidity and rainfall of five major cities with JNV, Koraput.
•JNV, Koraput has recorded highest rainfall as well as the humidity with comparison to other.

LOS ANGELAS (USA)
0
5
10
15
20
25
30
35
40
July Aug Sept
TemperatureMax
TemperatureMin
LONDON (UK)
0
5
10
15
20
25
30
35
July Aug Sept
TemperatureMax
TemperatureMin
SYDNEY (AUSTRALIA)
0
5
10
15
20
25
30
35
July Aug Sept
TemperatureMax
TemperatureMin
CAPE TOWN (S. AFRICA)
0
5
10
15
20
25
30
35
July Aug Sept
TemperatureMaxTemperatureMin
JNV, KORAPUT, ORISSA
0
5
10
15
20
25
30
July Aug Sept
TemperatureMaxTemperatureMin
WASINGTON (USA)
0
5
10
15
20
25
30
35
40
July Aug Sept
TemperatureMaxTemperatureMin
ANALYSIS OF TEMPERATURE OF DIFFERENT CITIESANALYSIS OF TEMPERATURE OF DIFFERENT CITIES
•These are the comparison of Temperature of five major cities with JNV, Koraput.
•The temperature of rest of the stations except Sydney and Cape Town remain high as these stations are situated in northern hemisphere and other in southern hemisphere.
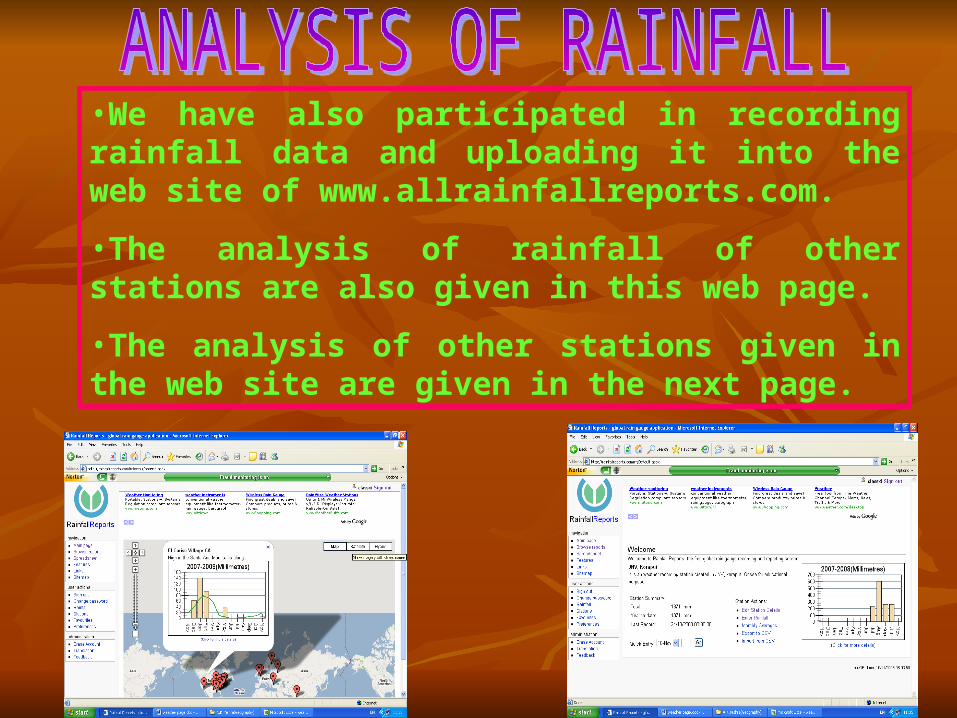
•We have also participated in recording rainfall data and uploading it into the web site of www.allrainfallreports.com.
•The analysis of rainfall of other stations are also given in this web page.
•The analysis of other stations given in the web site are given in the next page.
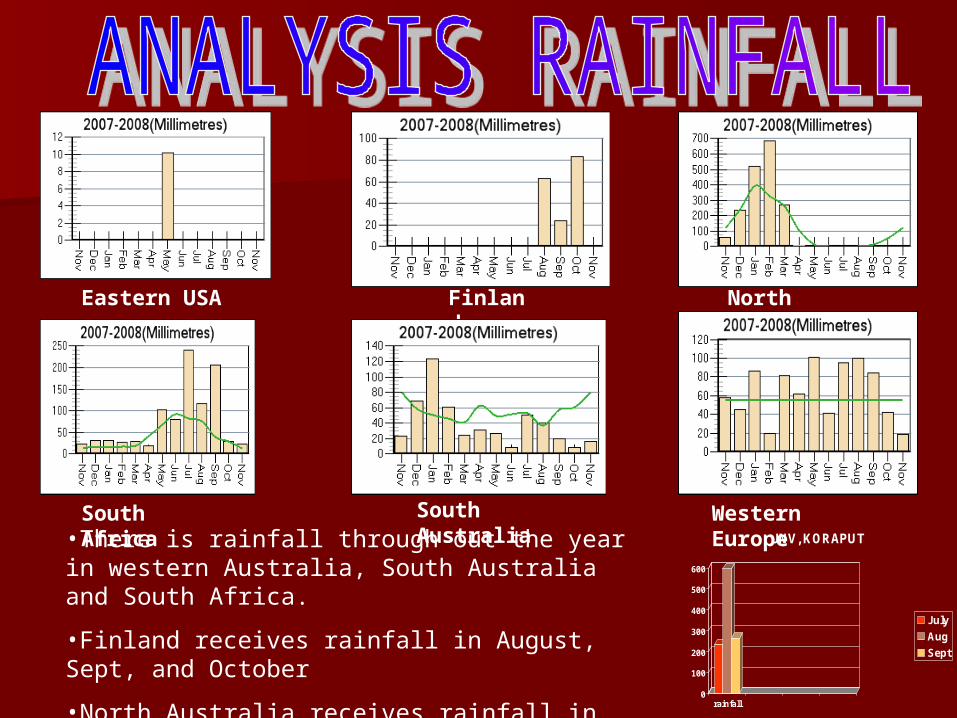
•There is rainfall through out the year in western Australia, South Australia and South Africa.
•Finland receives rainfall in August, Sept, and October
•North Australia receives rainfall in winter season
Eastern USA Finland North Australia
South Africa South Australia Western Europe
0
100
200
300
400
500
600
rainfall
JNV, KORAPUT
July
Aug
Sept

•www.allrainfallreports.com.
•www.wunderground.com
•www.wikipedia.com.
•www.youtube.com
•www.jnvkoraput.pbwiki.com
•www.jnvkoraput.blogspot.com

•Mr. S. K. Tripathy, Principal for allowing us to complete this project.
•Mr.A. K. Mishra, PGT-Geography for guiding us during the project preparation.
•Mr. P. K. Mohanty, PGT-Computer Science for giving us the technical guidance.
Related Documents