Presented by Jason Cheng-Hsien Tsai Professor, Dept. of Risk Management and Insurance Director, Risk and Insurance Research Center National Cheng-Chi University

Welcome message from author
This document is posted to help you gain knowledge. Please leave a comment to let me know what you think about it! Share it to your friends and learn new things together.
Transcript

Presented by Jason Cheng-Hsien Tsai
Professor, Dept. of Risk Management and Insurance
Director, Risk and Insurance Research Center
National Cheng-Chi University

Motivation of Part I
Raise the awareness of Taiwan government
officers about how insurance may mitigate the
damages resulted from typhoons on Taiwan and
its public finances

Implementation
Use simulation analyses to demonstrate how
Taiwan and its public finances would be under the
typhoon risks without and with insurance

Threats of Typhoon Risks on Public
Finances: Analysis Structure Model the dynamics of the typhoon risk losses and
government losses of Taiwan
A Typhoon risk model
Impose hypothetical risk management schemes:
proportion; excess of loss; excess of loss with upper
limits
This framework is in line with the nascent literature that
incorporates the structure of random shocks hitting the
domestic economy to obtain a complete distribution of
probable outcomes for the CAT risk losses, rather than
simply projecting one central scenario.

Modeling Methodologies
Original Intention
Modeling typhoon frequencies first and then
building models upon rainfall, wind speed,
and affecting duration to project severities
This did not work, however.
An Alternative Way
Modeling types of losses resulted from
typhoons directly

Data-Driven Modeling
When long-term data are available, we fit the data with
various statistic distributions using MLE and choose one of
them according to the K-S fitness measure and p-value
Casualties
House Collapses
Agricultural Losses
For the losses that have only short-term data available, we
build regression models upon the above three types of
losses
Transportation Infrastructure Losses
Aqueduct Infrastructure Losses

A Glimpse on the Data
Year CPI
Casualties House Collapses Other Loses (in 1,000 NTD)
Wounded Death & Missing Total and Partial
Losses Agriculture Railway
2,009 1.00 1,557 701 349
2,008 0.99 100 42 83 17,738,667 NA
2,007 1.02 148 16 89 14,117,900 NA
2,006 1.04 6 3 15 1,734,539 NA
2,005 1.05 145 23 169 16,633,380 NA
2,004 1.07 504 49 386 12,045,068 NA
2,003 1.09 5 7 - 3,417,647 NA
2,002 1.09 12 6 - 244,987 NA
2,001 1.09 585 354 2,624 15,819,419 1,144,949
2,000 1.09 178 110 2,159 13,087,291 514,078

Casualties and House Collapses
Data Source: National Fire Agency
Data Duration:1958 ~
Chosen Models:
Generalized Pareto Distribution for Death &
Missing and Wounded
Burr Distribution for House Collapses
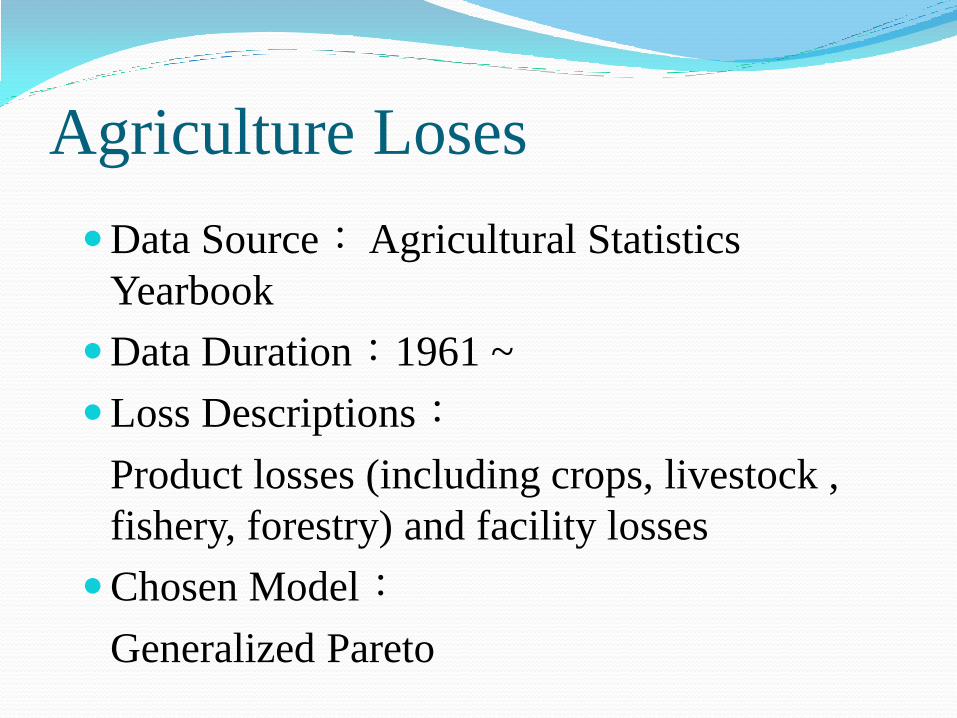
Agriculture Loses
Data Source: Agricultural Statistics
Yearbook
Data Duration:1961 ~
Loss Descriptions:
Product losses (including crops, livestock ,
fishery, forestry) and facility losses
Chosen Model:
Generalized Pareto

Transportation Infrastructure Losses
Data Source:
Statistical Report of Taiwan Railways Administration
Statistical Abstract of Transportation and
Communications
Data Duration:
From 1975 to 2001 (Statistical Report)
From 1982 to 2008 (Statistical Abstract)
Regression Model:
Railway Loss = (Death & Missing)*3,133 + 7,250,816
Trans. Inf. Loss = (Railway Loss)*5.978 + 10,601

Aqueduct Infrastructure Losses
Data Source: Water Resource Agency
Data Duration:2001 ~
Facility Descriptions :
Reservoir and Flood Control Facilities
Model:
Aqu. Inf. Loss = (Death & Missing)*25,733 +
Agr. Loss * 0.2523 + 290,850,563

Estimating Public Finance Losses
Death:200,000 NTD
Severe Injury:100,000 NTD
Re-Settlement:20,000 NTD/person; Max. 5
persons / family
Agriculture Subsidy: loss amount
12

Estimating Total Economic Losses
Death:900,000 NTD by the average sum
assured of life insurance in 2008
Injury:6,952 NTD by the average sum
assured of accident and health insurance
House Collapses :4,120,000 NTD / house
(=34.62 pin * 11,921 NTD/pin)
13

Simulation Results
Loss Min. 1st. Qu. Median Mean 3rd. Qu. Max. Std.
Death & Missing Sample 0 13 48 83 100 701 120
Gen. Pareto 0 18 46 87 104 3,670 134
Wounded Sample 0 19 47 247 344 2,055 427
Gen. Pareto 0 49 130 305 311 31,864 813
House Collapse Sample 0 54 864 6,598 3,524 41,057 11,856
Burr 0 175 1,227 7,938 6,126 666,816 23,786
Agriculture Sample 0 1,439,564 3,104,795 5,567,781 7,158,794 23,582,067 6,046,317
Gen. Pareto 510 1,863,861 4,483,056 6,967,801 9,233,682 97,995,040 7,793,143
Railway Sample 0 18,763 64,605 176,107 219,707 1,144,949 259,875
Regression 7,519 71,467 173,306 320,075 381,419 14,286,401 486,846
Transportation Proportion 75,195 714,667 1,733,059 3,200,746 3,814,190 142,864,013 4,868,462

Death & Missing
0
100
200
300
400
500
600
700
1958 1968 1978 1988 1998 2008 2018
Historical Data
80% Possibility(Lower
Bound)
80% Possibility(Upper
Bound)
Mean

Wounded
0
500
1000
1500
2000
1958 1968 1978 1988 1998 2008 2018
Historical Data
80% Possibility(Lower
Bound)80% Possibility(Upper
Bound)Mean

House Collapses
0
5000
10000
15000
20000
25000
30000
35000
40000
1958 1968 1978 1988 1998 2008 2018
"Historical Data"
"80% Possibility(Lower Bound)
"80% Possibility(Upper Bound)
"Mean"

Agriculture Losses
0.00E+00
5.00E+06
1.00E+07
1.50E+07
2.00E+07
2.50E+07
1961 1971 1981 1991 2001 2011 2021
Historical Data
80% Possibility(Lower Bound)
80%Possibility(Upper Bound)
Mean

Transportation Infrastructure Losses
1
2,000,001
4,000,001
6,000,001
8,000,001
10,000,001
12,000,001
1992 1997 2002 2007 2012 2017 2022
Historical Date
80% Possibility(Lower Bound)
80% Possibility(Upper Bound)
mean

Insurance Schemes
Proportional Insurance
Government retain 30% of losses; insurers pay
70%
Proportional with Deductible
Public Finance Losses: 1,200 million NTD
Economic Losses: 50,000 million NTD
20

Simulation Settings
15 years, 50,000 scenarios
Inflation rate: 2% annually
21

Simulated Public Finance Losses (billion NTD)
0
20
40
60
80
100
120
1 2 3 4 5 6 7 8 9 10 11 12 13 14 15
Uninsured 10%
Uninsured Mean
Uninsured 99%
Proportion 10%
Proportion Mean
Proportion 99%
Deductible 10%
Deductible Mean
Deductible 99%
22

Public Finance losses w.r.t. the annual
budget of the central government
0.0000%
0.1000%
0.2000%
0.3000%
0.4000%
0.5000%
0.6000%
1 2 3 4 5 6 7 8 9 10 11 12 13 14 15
Uninsured 10%
Uninsured Mean
Uninsured 99%
Proportion 10%
Proportion Mean
Proportion 99%
Deductible 10%
Deductible Mean
Deductible 99%
23

Individual Types of Losses
Death
1%
Severe Injury
1%
Re-Settlement
37%
Agriculture
Subsidy
61%
24

Simulated Economic Losses (billion NTD)
0
1,000
2,000
3,000
4,000
5,000
6,000
1 2 3 4 5 6 7 8 9 10 11 12 13 14 15
Uninsured 10%
Uninsured Mean
Uninsured 99%
Proportion 10%
Proportion Mean
Proportion 99%
Deductible 10%
Deductible Mean
Deductible 99%
25

Economic losses w.r.t. the annual
budget of the central government
0.0%
5.0%
10.0%
15.0%
20.0%
25.0%
30.0%
35.0%
1 2 3 4 5 6 7 8 9 10 11 12 13 14 15
Uninsured 10%
Uninsured Mean
Uninsured 99%
Proportion 10%
Proportion Mean
Proportion 99%
Deductible 10%
Deductible Mean
Deductible 99%
26
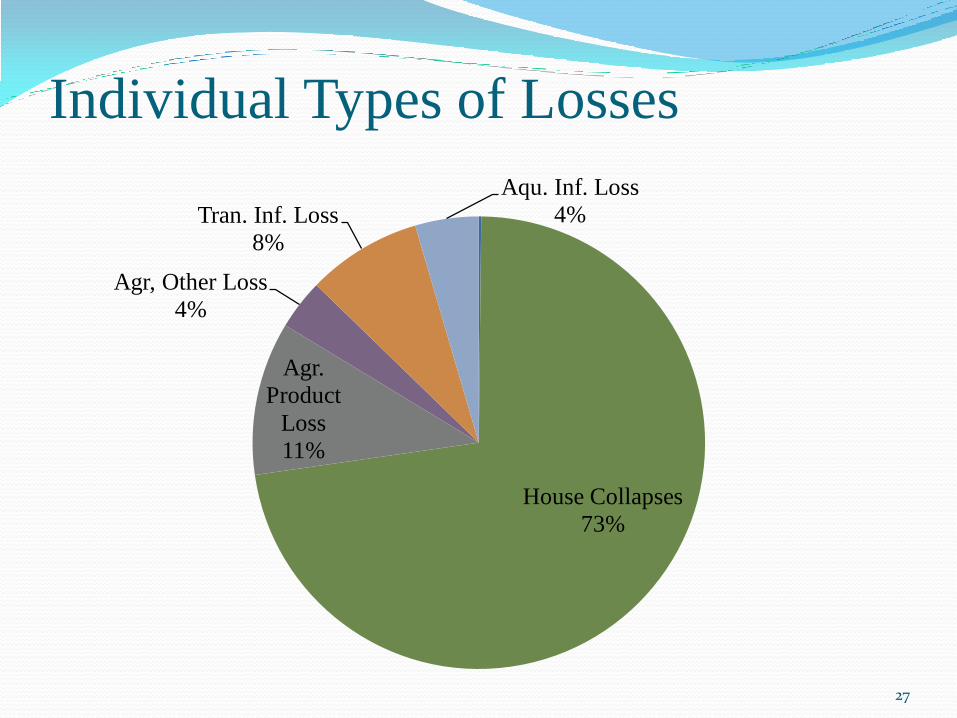
Individual Types of Losses
House Collapses
73%
Agr.
Product
Loss
11%
Agr, Other Loss
4%
Tran. Inf. Loss
8%
Aqu. Inf. Loss
4%
27

Motivation of Part II
Using empirical data to examine the typhoon
related risks of government buildings and
estimate the benefits of alternative insurance
schemes
Estimate the risks of total government
properties and study the benefits of employing
the risk management scheme similar to that of
Taiwan Residential Earthquake Insurance Fund
(TREIF)
28

Data and Simulation Estimate the area size used by governments: 350
billion square meters
Assume that the exposures of government
building contents are 5,000 NTD (including
content losses and cleansing costs)
Insurance Premiums
150% * Expected Nominal Losses
The average inflation rate (WPI) in the past 15
years was 1.7%.
29

Insurance Schemes
Proportional Insurance
30% of retention; premiums are about 1.3 billion NTD
Insurance with Deductible of 0.45 billion NTD
Insurance with both deductible and payment limit
Deductible: 0.41 billion NTD; payment limit: 8 billion
NTD according to the 99 percentile of simulated losses
30

Simulation Results of Government
Building Content Losses
0
10
20
30
40
50
60
70
80
1 2 3 4 5 6 7 8 9 10 11 12 13 14 15
單位
:億元
Uninsured mean
Uninsured 99%
Uninsured 10%
Proportion mean
Proportion 99%
Proportion 10%
Deductible mean
Deductible 99%
Deductible 10%
Cap & Deductible mean
Cap & Deductible 99%
Cap & Deductible 10%
31

Estimate the total losses of
government properties
Using the ratio of government building content
losses to total losses of government properties
resulted from Typhoon Morakot to estimate the
total losses
32

Risk Management Scheme
Layer 2 (28 billion NTD)
Layer 1
(5 billion NTD) Flood Insurance Fund
Central Government (6.5 billion NTD)
Flood Insurance Fund (7.5 billion NTD)
Reinsurers and/or Capital Markets (9 billion NTD)
Local Insurers (5 billion NTD)
33

Simulation Results
-
100
200
300
400
500
600
700
1 2 3 4 5 6 7 8 9 10 11 12 13 14 15
單位
:億元
Uninsured mean
Uninsured 99%
Uninsured 10%
Flood fund mean
Flood fund 99%
Flood fund 10%
34
Related Documents