New Research in General Error Regression Model (GERM) Significance Testing Kevin Cincotta Andrew Busick Presented at the Society of Cost Estimating and Analysis (SCEA) Conference June 8-11, 2010 San Diego, CA 1 Presented at the 2010 ISPA/SCEA Joint Annual Conference and Training Workshop - www.iceaaonline.com

Welcome message from author
This document is posted to help you gain knowledge. Please leave a comment to let me know what you think about it! Share it to your friends and learn new things together.
Transcript

New Research in General Error Regression Model (GERM)
Significance TestingKevin CincottaAndrew Busick
Presented at the Society of Cost Estimating and Analysis (SCEA) Conference
June 8-11, 2010San Diego, CA 1
Presented at the 2010 ISPA/SCEA Joint Annual Conference and Training Workshop - www.iceaaonline.com

Slide 2
Acknowledgments
• Dr. Stephen Book, for inspiring the research and for critical feedback
• Tim Anderson, for further inspiration and for sharing the original GERM data set
• Technomics, for sponsorship of research
Presented at the 2010 ISPA/SCEA Joint Annual Conference and Training Workshop - www.iceaaonline.com

Slide 3
Quotable
“It would be so nice if something made sense for a change.”
- Lewis Carroll. Alice’s Adventures in Wonderland (1865)
Presented at the 2010 ISPA/SCEA Joint Annual Conference and Training Workshop - www.iceaaonline.com

Slide 4
Outline
• Background• The Problem• The SIG Solution• The Bias Adjuster Solution• The Bootstrapping Solution• Comparison of Results• Conclusions• Ideas for Further Research
Presented at the 2010 ISPA/SCEA Joint Annual Conference and Training Workshop - www.iceaaonline.com

Slide 5
Background: GERM
• General Error Regression Models (GERM) are regression models in which no particular assumption is made about the distribution of the error term
• However, we still need to specify whether additive or multiplicative error
• We also need to specify a penalty function, e.g.:– Sum of squared errors (weighted or unweighted)– Sum of squared percent errors– Average absolute percent error with zero bias
constraint, etc.
Presented at the 2010 ISPA/SCEA Joint Annual Conference and Training Workshop - www.iceaaonline.com

Slide 6
Background: Significance Testing
• Significance testing refers to a set of methods designed to determine whether results have occurred by chance1
• In classical significance testing, the p-value is the probability that the true value of the parameter being estimated is zero
• Significance testing adds value to a cost estimating relationship (CER):– Allows for a process of nullification, wherein insignificant variables can be
dropped• Increases degrees of freedom/explanatory power of regression
– May remove bias in estimated coefficients of significant variables– Leads decision-makers down the “right path” when making cost-design
tradeoffs:• The relationship between cost and an insignificant variable, by definition,
cannot be expected to hold in the future• True cost drivers are statistically significant and can be managed as such
1. Anderson, Tim. A Distribution-Free Measure of the Significance of CER Regression Fit Parameters Established Using General Error Regression Methods. (2009)
Presented at the 2010 ISPA/SCEA Joint Annual Conference and Training Workshop - www.iceaaonline.com

Slide 7
Significance Testing: Example
Image Source: http://hubpages.com/hub/hypothesis-methods
SignificantSignificant
T Statistics
Insignificant
P Values (assuming 90% significance test)
0.10 1
InsignificantSignificant
Presented at the 2010 ISPA/SCEA Joint Annual Conference and Training Workshop - www.iceaaonline.com

Slide 8
The Problem
• Traditional significance testing is not possible in GERM– We want a p-value– Need a t-stat to get a p-value– T stat = parameter estimate / standard error– We don’t know the standard error of the parameter
estimate
• To remedy this, one author 2 proposes the “SIG Test”• We will explore this, and two other methods
2.Anderson (2009)
Presented at the 2010 ISPA/SCEA Joint Annual Conference and Training Workshop - www.iceaaonline.com

Slide 9
• Run the full model to generate estimated coefficients• Set all inputs to their means; record the CER output and its
standard error (SE) or standard percent error (SPE)• “Nullify” a variable; record the CER output & SPE
SIGmean = % change in CER output = [f(x)reduced – f(x)full] / f(x)full
SIGSPE = % change in CER SPE=1/(n-m) [ Σ ({f(xi) – yi) / f(xi)}]
SIGtotal = |SIGmean| + SIGSPE
The SIG Test (Multiplicative Error Case)
As a starting point, the parameter is deemed “significant” if SIGtotal > .1
Presented at the 2010 ISPA/SCEA Joint Annual Conference and Training Workshop - www.iceaaonline.com

Slide 10
Inconvenient Truths: SIGmean
• SIGmean = 0 in all cases in a linear (OLS) framework– OLS predictions always pass through (μx, μy)– Implies that if your GERM model happens to have a linear or
nearly linear relationship, “significance” cannot be tested using SIGmean
– But a general error method should work in the general case, a minimum criterion for which is working in this specific case
• SIGmean isn’t related to CER performance and therefore is not measuring the same thing as a t-test– It measures movement in the output of the CER, but these
outputs are never linked to the dependent variable. What if the CER “moves” in the wrong direction?
Presented at the 2010 ISPA/SCEA Joint Annual Conference and Training Workshop - www.iceaaonline.com

Slide 11
• SIGSPE does measure CER performance, because it relies upon comparison of standard percent errors, with and without the variable in question
• Unfortunately, it does not accurately replicate significance test results in the (testable) OLS case
• It is not clear how to handle negative values: – “Note that there should be no need to take the absolute value of SIGSE or
SIGSPE. If either…were negative, it would mean that the variance of the reduced CER was less than the variance of the full CER. However, this case should not happen if the optimization is done correctly. If a lower variance solution of the CER were available…then the optimization should have found that solution.”(Anderson (2009))
– Yet we have found numerous examples where SIGSPE is legitimately negative (degrees of freedom change). This has been noticed before 3
– Adding absolute value bars does not fix the problem, because then highly insignificant variables (ones with SIGSPE < 0) get rewarded!
3. Book, Dr. Stephen A. Modern Techniques of Multiplicative Error Regression. IPSA/SCEA Training Workshop: St. Louis, MO (2009).
Inconvenient Truths: SIGSPEPresented at the 2010 ISPA/SCEA Joint Annual Conference and Training Workshop - www.iceaaonline.com

Slide 12
• SIGtotal = |SIGmean| + SIGSPE
– Each component has its malcontents– We’re adding a “how much does the mean move”
metric to a CER performance metric– Percentages are being summed where the
denominators are different. This has been previously called “innumerate,” and in so doing, one is said to fall victim to Simpson’s Paradox 4
– We do not feel so harshly about the method; in fact, it can be quite useful. But is there something better?
4. Hulkower, Dr. Neal. MCR Federal LLC Vice President of Technical Planning and Quality Support. Numeracy for Cost Analysts: Doing The Right Math, Getting the Math Right. MCR (2008).
Inconvenient Truths: SIGtotalPresented at the 2010 ISPA/SCEA Joint Annual Conference and Training Workshop - www.iceaaonline.com

Slide 13
The “Bias Adjuster” Method
• Consider the GERM equationY = a + bXcWdQefType
• Regress/optimize as usual• Recognize that a is simply a bias adjuster, and would
not be needed if the zero-intercept model were unbiased
• Subtract a from both sides and take logs:ln(Y-a) = ln(b) + cln(X) + dln(W) +eln(Q) + Type ln (f)
• This gives an unbiased estimate of ln(Y-a)• This equation is linear, so p-values can be calculated• Use these p-values as proxies for p-values
associated with the original fit parameters
Presented at the 2010 ISPA/SCEA Joint Annual Conference and Training Workshop - www.iceaaonline.com

Slide 14
The Bootstrapping Method
• Recall the original problem: we don’t have reliable estimates of the standard errors around regression fit parameters derived in a GERM framework
• “Bootstrapping is the practice of estimating properties of an estimator (such as its variance) by measuring those properties when sampling from an approximating distribution… It may also be used for constructing hypothesis tests. It is often used as an alternative to inference based on parametric assumptions when …parametric inference is impossible.” 5
• This is exactly the problem at hand: if we could estimate the standard error of a fit parameter, we could also estimate its significance using standard t-tests/p-value analysis
• Bootstrapping as a technique to generate confidence intervals and significance is not new to the cost community 6
5. http://en.wikipedia.org/wiki/Bootstrapping_(statistics)6. Book, Dr. Stephen A. Prediction Bounds for General Error Regression CERs. 39th Annual DoDCAS: Williamsburg, VA (2006)
Presented at the 2010 ISPA/SCEA Joint Annual Conference and Training Workshop - www.iceaaonline.com
Slide 15
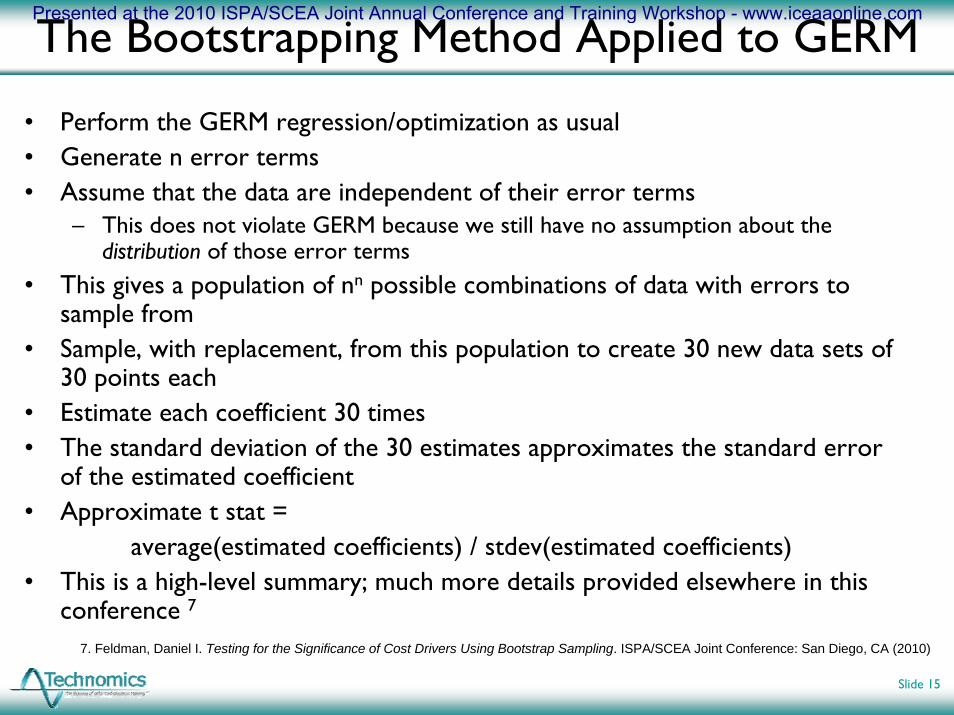
The Bootstrapping Method Applied to GERM
• Perform the GERM regression/optimization as usual• Generate n error terms• Assume that the data are independent of their error terms
– This does not violate GERM because we still have no assumption about the distribution of those error terms
• This gives a population of nn possible combinations of data with errors to sample from
• Sample, with replacement, from this population to create 30 new data sets of 30 points each
• Estimate each coefficient 30 times• The standard deviation of the 30 estimates approximates the standard error
of the estimated coefficient• Approximate t stat =
average(estimated coefficients) / stdev(estimated coefficients)• This is a high-level summary; much more details provided elsewhere in this
conference 7
7. Feldman, Daniel I. Testing for the Significance of Cost Drivers Using Bootstrap Sampling. ISPA/SCEA Joint Conference: San Diego, CA (2010)
Presented at the 2010 ISPA/SCEA Joint Annual Conference and Training Workshop - www.iceaaonline.com
Slide 16
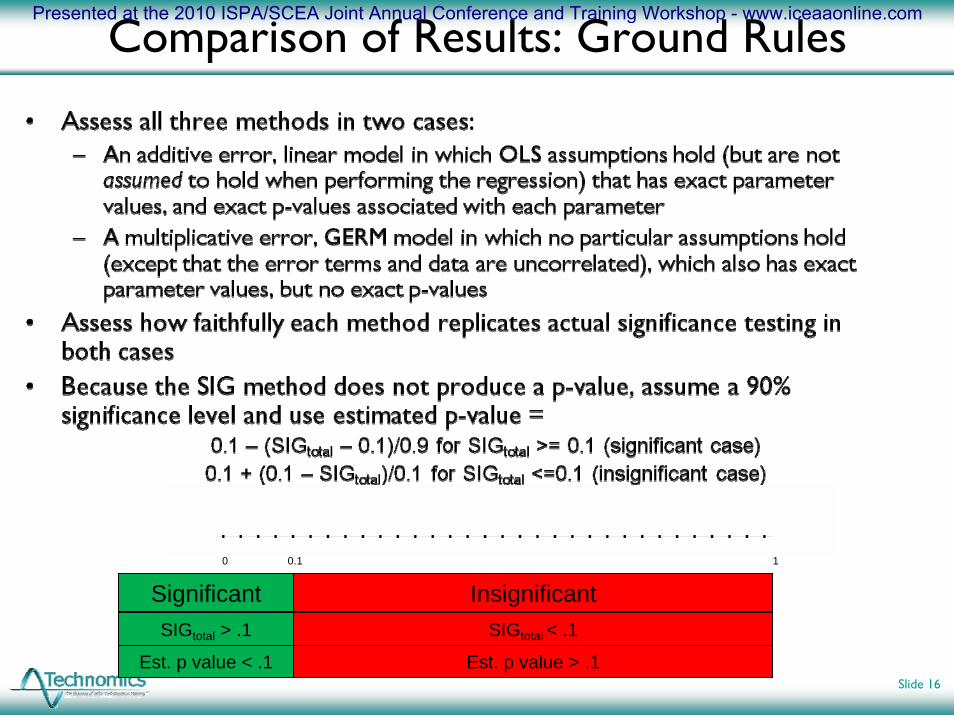
Comparison of Results: Ground Rules
InsignificantSignificant0.10 1
SIGtotal > .1
Est. p value < .1
SIGtotal < .1
Est. p value > .1
Presented at the 2010 ISPA/SCEA Joint Annual Conference and Training Workshop - www.iceaaonline.com

Slide 17
Graphical Depiction of Mapping of SIGtotalto Estimated P-Values
SIGtotal
Est. P-value
Presented at the 2010 ISPA/SCEA Joint Annual Conference and Training Workshop - www.iceaaonline.com

Slide 18
Comparison of Results: P-Values (OLS Case)Presented at the 2010 ISPA/SCEA Joint Annual Conference and Training Workshop - www.iceaaonline.com
Slide 19
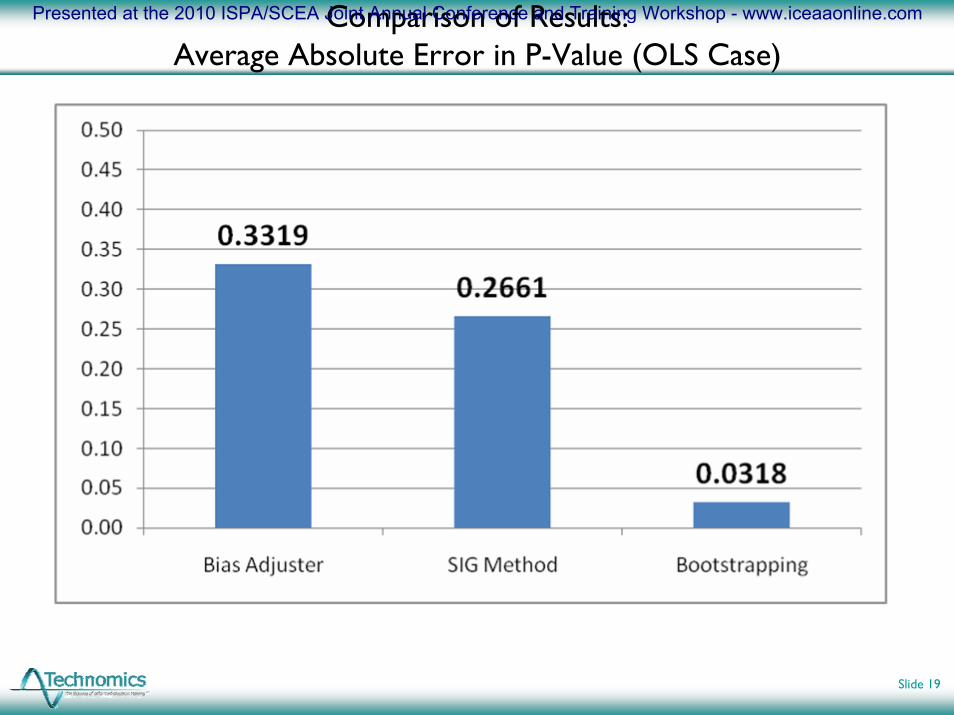
Comparison of Results: Average Absolute Error in P-Value (OLS Case)
Presented at the 2010 ISPA/SCEA Joint Annual Conference and Training Workshop - www.iceaaonline.com

Slide 20
Comparison of Results: Conclusions as to Significance (OLS Case)
Note: When the data were originally generated, only b5 was set to zero (i.e. b1 is nonzero). When compared to those “exact” values, the bootstrapping method draws the correct inference in all five cases, because it draws the correct inference about b1.
Presented at the 2010 ISPA/SCEA Joint Annual Conference and Training Workshop - www.iceaaonline.com

Slide 21
Comparison of Results: P-Values (GERM with Multiplicative Error)
Note: When the data were generated, only “e” was set to zero. So nominally, lower is better in all cases, except with “e,” where higher is better. There are bars for all methods in all columns, except Bias Adjuster for “a.”
Presented at the 2010 ISPA/SCEA Joint Annual Conference and Training Workshop - www.iceaaonline.com
Slide 22
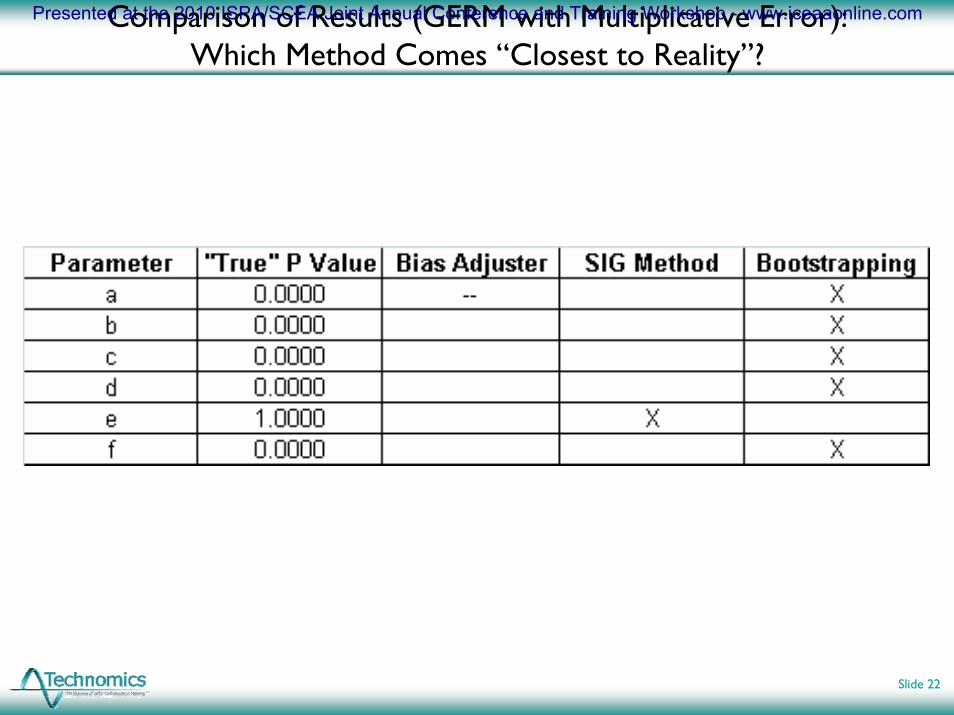
Comparison of Results (GERM with Multiplicative Error): Which Method Comes “Closest to Reality”?
Presented at the 2010 ISPA/SCEA Joint Annual Conference and Training Workshop - www.iceaaonline.com

Slide 23
Comparison of P-Value Results: Bootstrapping Applied to Original “SIG Method” Data Set
Note: Bootstrapping suggests that the parameter “e,” associated with regressor x3, is significant (at the 10% level). It was given as an example of a “relatively insignificant” variable when evaluated under the SIG method (Anderson (2009)).
Presented at the 2010 ISPA/SCEA Joint Annual Conference and Training Workshop - www.iceaaonline.com

Slide 24
ConclusionsPresented at the 2010 ISPA/SCEA Joint Annual Conference and Training Workshop - www.iceaaonline.com

Slide 25
Ideas for Future ResearchPresented at the 2010 ISPA/SCEA Joint Annual Conference and Training Workshop - www.iceaaonline.com

Slide 26
References• Anderson, Tim. A Distribution-Free Measure of the Significance of CER Regression
Fit Parameters Established Using General Error Regression Methods. Journal of Cost Analysis and Parametrics. Volume 2, Issue 1 (Summer, 2009)
• Book, Dr. Stephen A. – Modern Techniques of Multiplicative Error Regression. IPSA/SCEA Training Workshop: St. Louis,
MO (2009).– Prediction Bounds for General Error Regression CERs. 39th Annual DoDCAS: Williamsburg, VA
(2006)– and Lao, Norman. Minimum Percentage Error Regression under Zero Bias Constraints. Proceedings
of the Fourth Annual U.S. Army Conference on Applied Statistics, 21-23 October 1998; U.S. Army Research Laboratory, Report No. ARL-SR-84, (November, 1999), pp. 47–56.
– and Young, Phillip. General Error Regression for Developing Cost Estimating Relationships. The Journal of Cost Analysis (Fall, 1997)
• Davison, A. C. and Hinkley, D. Bootstrap Methods and their Application. 8th ed. Cambridge, MA: Cambridge Series in Statistical and Probabilistic Mathematics (2006)
• Feldman, Daniel I. Testing for the Significance of Cost Drivers Using Bootstrap Sampling. ISPA/SCEA Joint Conference: San Diego, CA (2010)
• Hulkower, Neal. Numeracy for Cost Analysts: Doing the Right Math, Getting the Math Right. MCR: McLean, VA (2008)
• http://en.wikipedia.org/wiki/Bootstrapping_(statistics)
Presented at the 2010 ISPA/SCEA Joint Annual Conference and Training Workshop - www.iceaaonline.com

Slide 27
Backup: OLS Model Used
• y = a + b1x1 + b2x2 + b3x3 + b4x4 + b5x5 + ε• ε ~ N(0,500)• All x’s ~ U(0,100)
Presented at the 2010 ISPA/SCEA Joint Annual Conference and Training Workshop - www.iceaaonline.com

Slide 28
Backup: GERM Model Used
• y = a + ε(bXcWdQefType)• Independent variables distributed as follows:
• ε distributed lognormally as follows:
Presented at the 2010 ISPA/SCEA Joint Annual Conference and Training Workshop - www.iceaaonline.com
Related Documents


