Presented April 2014 The 2013 Economic Impact of Tourism in Wisconsin

Presented April 2014 The 2013 Economic Impact of Tourism in Wisconsin.
Dec 16, 2015
Welcome message from author
This document is posted to help you gain knowledge. Please leave a comment to let me know what you think about it! Share it to your friends and learn new things together.
Transcript

Presented April 2014
The 2013 Economic Impact of Tourism in Wisconsin

State Overview
3
Key trends in 2013
The Wisconsin visitor economy continued to expand in 2013 with a 4.5% increase in direct visitor spending. This follows a 4.8% increase in 2012.
■ Wisconsin reached 100 million visits in 2013.
■ Visitor growth in 2013 was the fastest since 2010 as U.S. consumers’ pro-travel attitude reached and surpassed pre-recession levels.
■ Day visitation expanded in 2013 as gas prices remained stable.
■ Per trip spending also increased as prices rose in key spending categories and visitors spent more freely.
4
Key findings
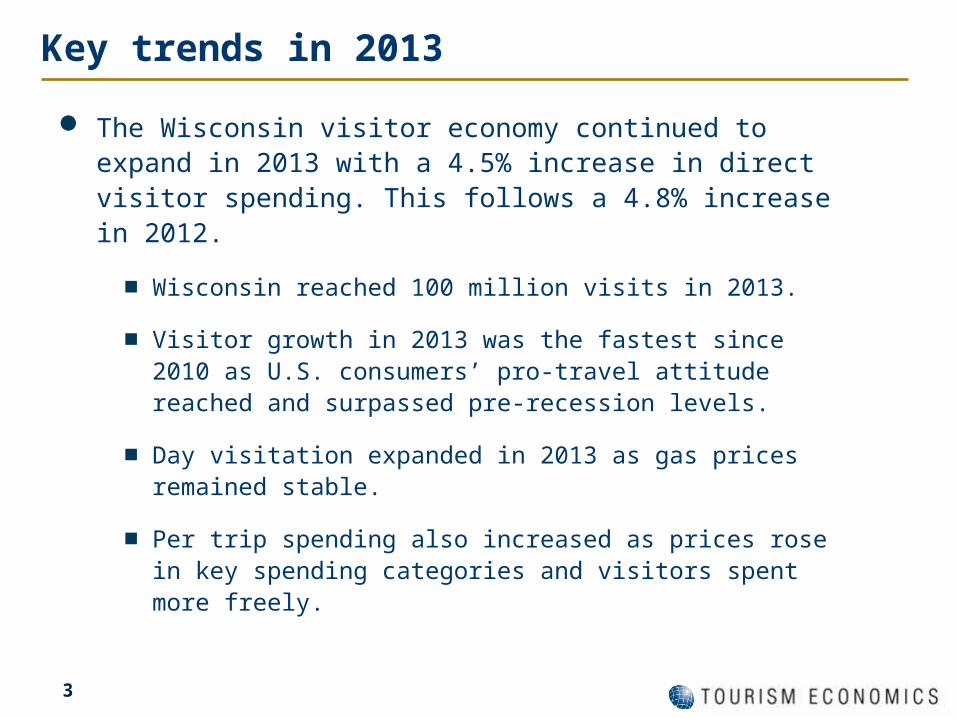
Visitor spending of $10.8 billion generated $17.5 billion in total business sales in 2013 as tourism dollars flowed through the Wisconsin economy.
Tourism activity sustained 185,500 jobs in 2013, both directly and indirectly.
These jobs represent 7.8% of total employment in Wisconsin; 1 in every 12.8 jobs in the state is sustained by tourism activity.
Including indirect and induced impacts, tourism in Wisconsin generated $1.35 billion in state and local taxes and $1.0 billion in Federal taxes last year.
In the absence of the state and local taxes generated by tourism, each Wisconsin household would need to pay $590 to maintain the current level of government services.

5
Industry indicators
Visits to Wisconsin destinations grew 3.5% between 2012 and 2013.
Hotel room demand grew 2.7% (source: Smith Travel Research).
The average daily rate increased by 3.0% in 2013 helping grow overall hotel room revenue by 5.7% (source: Smith Travel Research).
State sales tax revenue on lodging properties grew 3.2% in 2013 (source: State Revenue Office).
Tourism-related employment grew on par with overall state employment growth.

Visitor Spending
7
Overview
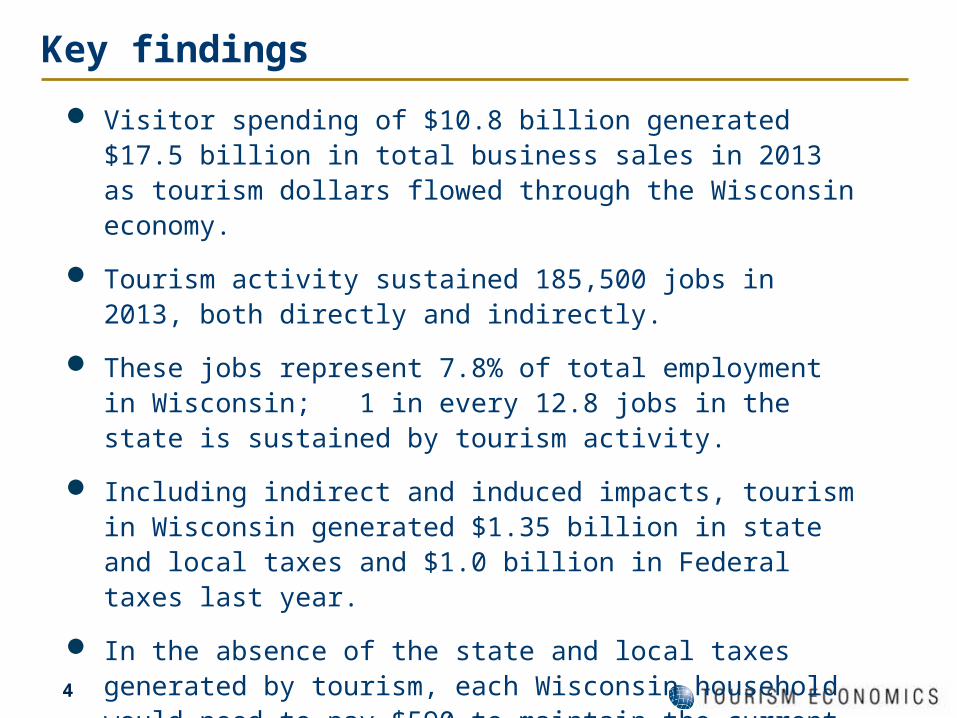
Visitor volume and spending in Wisconsin continued to grow in 2013.
Wisconsin visitor volumes reached 100 million in 2013. Visitors spent a total of $10.8 billion.
Visits grew 3.5% while spending increased 4.5% in 2013.
88
90
92
94
96
98
100
102
6
7
8
9
10
11
12
2010 2011 2012 2013Visitor Spending, bls (L) Person-Stays, mls (R)
$
Wisconsin Visits and SpendingUS$ Billions
Sources: Longwoods International, OTTI, Stats Can, Tourism Economics
Millions
8
Visitor spending
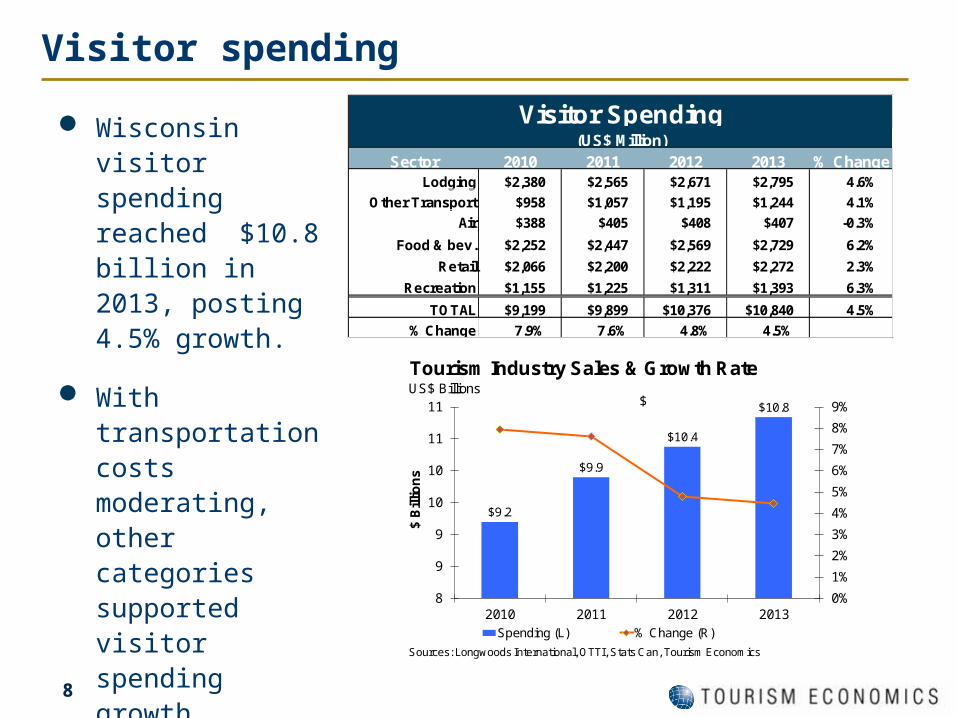
Wisconsin visitor spending reached $10.8 billion in 2013, posting 4.5% growth.
With transportation costs moderating, other categories supported visitor spending growth including F&B and recreation.
$9.2
$9.9
$10.4
$10.8
0%
1%
2%
3%
4%
5%
6%
7%
8%
9%
8
9
9
10
10
11
11
2010 2011 2012 2013
$ B
illio
ns
Spending (L) % Change (R)
$
Tourism Industry Sales & Growth RateUS$ Billions
Sources: Longwoods International, OTTI, Stats Can, Tourism Economics
Sector 2010 2011 2012 2013 % ChangeLodging $2,380 $2,565 $2,671 $2,795 4.6%
Other Transport $958 $1,057 $1,195 $1,244 4.1%
Air $388 $405 $408 $407 -0.3%
Food & bev. $2,252 $2,447 $2,569 $2,729 6.2%
Retail $2,066 $2,200 $2,222 $2,272 2.3%
Recreation $1,155 $1,225 $1,311 $1,393 6.3%
TOTAL $9,199 $9,899 $10,376 $10,840 4.5%
% Change 7.9% 7.6% 4.8% 4.5%
Visitor Spending(US$ Million)
9
Visitor spending by sector
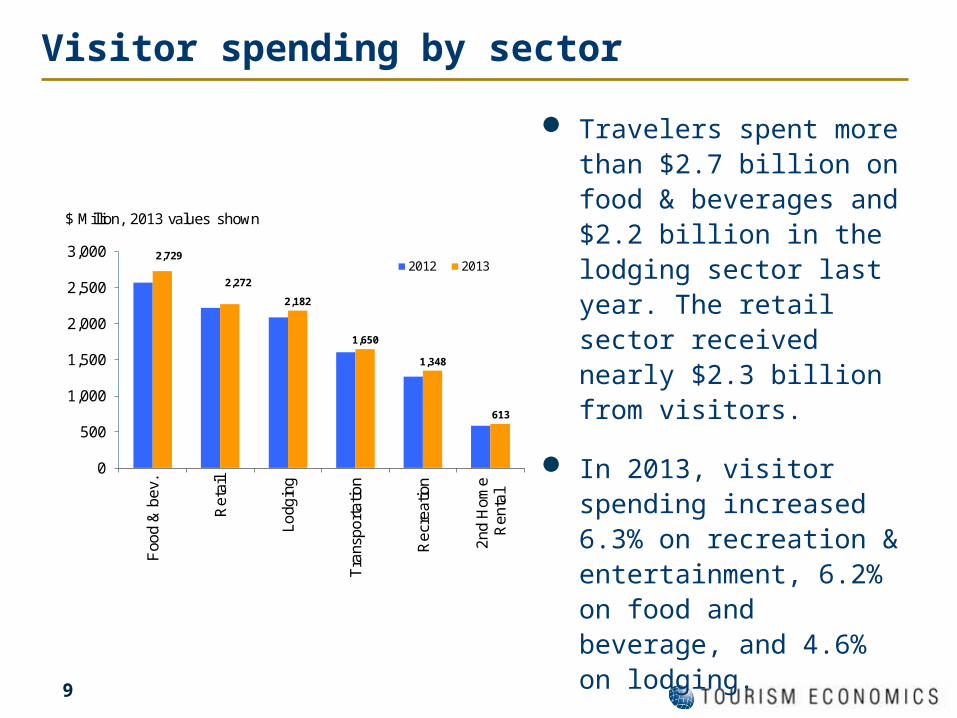
Travelers spent more than $2.7 billion on food & beverages and $2.2 billion in the lodging sector last year. The retail sector received nearly $2.3 billion from visitors.
In 2013, visitor spending increased 6.3% on recreation & entertainment, 6.2% on food and beverage, and 4.6% on lodging.
2,729
2,272
2,182
1,650
1,348
613
0
500
1,000
1,500
2,000
2,500
3,000
Foo
d &
bev
.
Ret
ail
Lodg
ing
Tra
nspo
rtat
ion
Rec
reat
ion
2nd
Hom
eR
enta
l
2012 2013
$ Million, 2013 values shown

10
Visitor spending distribution
Strong growth in day visits with increased spending on recreation pushed the recreational share of the traveler dollar to nearly 13%.
The share of the traveler dollar spent on lodging, the largest sector, remained level at 26% in 2013.
Food & beverage spending ranks second, capturing a quarter of visitor spending, followed by retail at 21%.
Lodging25.8%
Other Transport11.5%
Air3.8%
Food & bev.25.2%
Retail21.0%
Recreation12.9%
Visitor Spending by Sector
Sources: Longwoods International, OTTI, Stats Can, Tourism Economics
11
Visitor spending trends
$2.4 $2.6 $2.7 $2.8
$1.0 $1.1 $1.2 $1.2 $0.4 $0.4 $0.4 $0.4 $2.3
$2.4 $2.6 $2.7
$2.1 $2.2
$2.2 $2.3 $1.2
$1.2$1.3
$1.4
$0
$2
$4
$6
$8
$10
$12
2010 2011 2012 2013
Recreation
Retail
Food & bev.
Air
Other Transport
Lodging
Sources: Longwoods International, OTTI, Stats Can, Tourism Economics
Wisconsin's Visitor Spending by Year, Billions of $
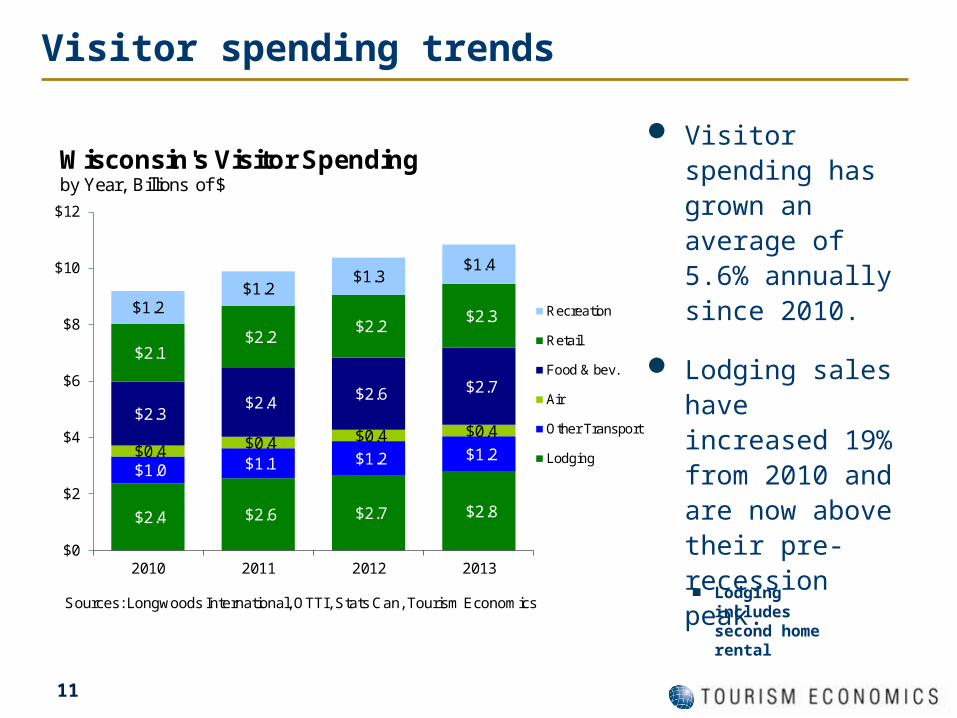
Visitor spending has grown an average of 5.6% annually since 2010.
Lodging sales have increased 19% from 2010 and are now above their pre-recession peak.
■ Lodging includes second home rental

12
Visitor spending by market segment
Leisure tourism represents 88% of visitor spending in Wisconsin.
Overnight visitors spend $7.3 billion in Wisconsin, 67% of the total.
Day visitor spending added $3.6 billion in 2013.
Domestic visitors to Wisconsin spent $10.2 billion in 2013, 94% of all visitor spending.
Business $1.3 Day $3.6 Domestic $10.2
Leisure $9.5 Overnight $7.2 Overseas $0.6
Canada $0.1
Total $10.8 Total $10.8 Total $10.8
Business 12.0% Day 33.2% Domestic 94.0%
Leisure 88.0% Overnight 66.8% Overseas 5.3%
Canada 0.7%
Stay Market
SharePurpose Stay Market
Visitor Spending in 2013(US$ Billion)
Purpose

13
Visitor spending by market segment
12.0%
33.2%
94.0%
88.0%
66.8%
5.3%
0.7%
0%
10%
20%
30%
40%
50%
60%
70%
80%
90%
100%
Purpose Stay Market
Per
cent
age
dist
ribut
ion
Leisure
Day
Overnight
Overseas
Domestic
Business
Canada
Sources: Longwoods International, OTTI, Stats Can, Tourism Economics

14
Seasonality of lodging
Tourism is a year-round industry in Wisconsin. Its peak is in the third quarter with nearly a third of all rooms rented and around 35% of hotel room revenue.
In 2013, growth was strongest in the second half of the year with room revenue growing over 5% in Q3 & Q4.
Q1=J,F,M Q2=A,M,J
Q3=J,A,S Q4=O,N,D
0
100
200
300
400
500
600
Q1 Q2 Q3 Q4
2010
2011
2012
2013
Wisconsin Hotel Room Revenue$ millions
Source: Smith Travel Research
0%
5%
10%
15%
20%
25%
30%
35%
40%
Q1 Q2 Q3 Q4
Revenue
Rooms
Wisconsin Hotel Rooms and RevenueQuarterly Share, 2013
Source: Smith Travel Research

15
Seasonality of visitor spending
Business Day
Total visitor spending also peaks in the 3rd quarter with $3.5 billion in visitor sales.
In 2013, growth was strongest in the second half of the year. Visitor spending in Q3 grew more than 5.0% and 6.1% in Q4.
$2,141
$2,776
$3,457
$2,466
0
500
1,000
1,500
2,000
2,500
3,000
3,500
4,000
Q1 Q2 Q3 Q4
2012
2013
Wisconsin Quarterly Visitor Spending$ Millions
Source: Tourism Economics
Q1 Q2 Q3 Q42012 $2,088.1 $2,672.6 $3,291.2 $2,323.7
2013 $2,141.3 $2,776.0 $3,457.2 $2,465.7
% Chn 2.55% 3.87% 5.04% 6.11%
Visitor Spending by Quarter Wisconsin
16
Seasonality of visitor spending
Business Day
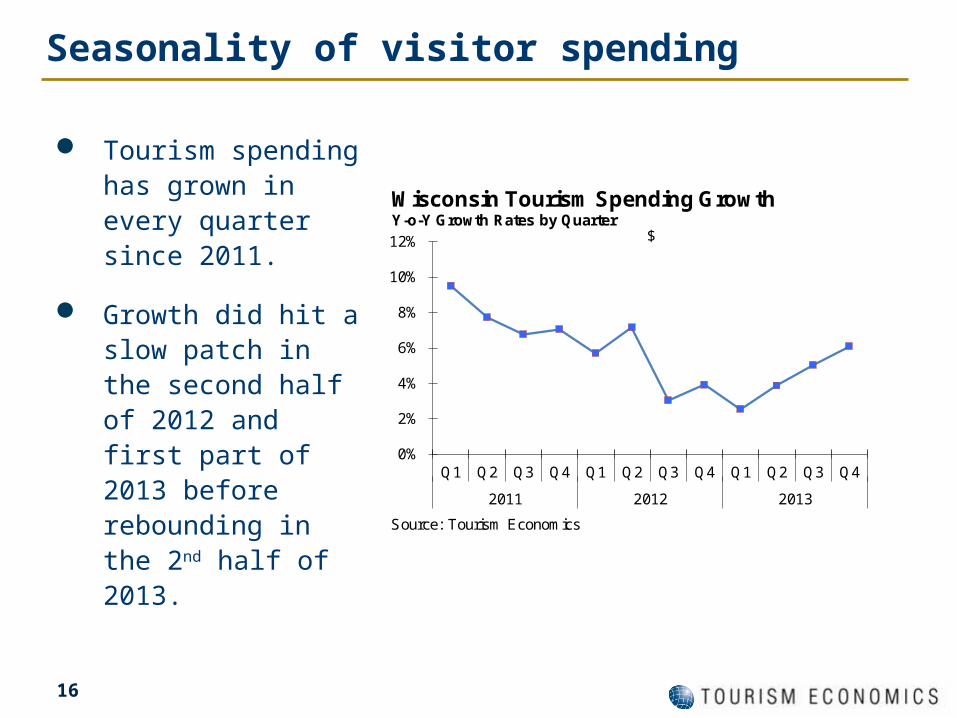
Tourism spending has grown in every quarter since 2011.
Growth did hit a slow patch in the second half of 2012 and first part of 2013 before rebounding in the 2nd half of 2013. 0%
2%
4%
6%
8%
10%
12%
Q1 Q2 Q3 Q4 Q1 Q2 Q3 Q4 Q1 Q2 Q3 Q4
2011 2012 2013
$
Wisconsin Tourism Spending Growth Y-o-Y Growth Rates by Quarter
Source: Tourism Economics

State Tourism Impacts

18
How visitor spending generates impact
• Lastly, the induced impact is generated when employees whose incomes are generated either directly or indirectly by tourism, spend those incomes in the local economy.
• Travelers create direct economic value within a discrete group of sectors (e.g. recreation, transportation). This supports a relative proportion of jobs, wages, and taxes within each sector.
• Each directly affected sector also purchases goods and services as inputs (e.g. food wholesalers, utilities) into production. These impacts are called indirect impacts.

19
Tourism sales by industry
Direct Indirect Induced TotalAgriculture, Fishing, Mining - 32.5 25.0 57.5
Construction and Utilities - 283.1 106.2 389.3
Manufacturing - 459.1 242.6 701.7
Wholesale Trade - 97.5 146.7 244.2
Air Transport 406.6 4.4 7.2 418.3
Other Transport 432.7 162.7 66.6 662.1
Retail Trade 2,272.4 15.2 280.1 2,567.7
Gasoline Stations 811.1 1.2 18.5 830.8
Communications - 241.3 118.5 359.8
Finance, Insurance and Real Estate 612.6 698.5 1,126.7 2,437.7
Business Services 66.7 710.5 222.0 999.2
Education and Health Care - 5.6 687.9 693.5
Recreation and Entertainment 1,143.2 57.8 37.8 1,238.9
Lodging 2,182.3 2.6 2.2 2,187.0
Food & Beverage 2,728.9 121.9 226.9 3,077.8
Personal Services 181.2 117.1 168.0 466.3
Government - 117.4 66.3 183.7
TOTAL 10,837.9 3,128.3 3,549.3 17,515.5
Growth Rate 4.5% 4.4% 4.3% 4.4%
* Direct sales include cost of goods sold for retail sectors
Tourism Sales
(US$ Million)

20
All business sectors of the Wisconsin economy benefit from tourism activity directly and/or indirectly.
Sectors that serve the tourism industry, like business services, gain as suppliers to a diverse tourism industry.
Tourism sales by industry
0
500
1,000
1,500
2,000
2,500
3,000
3,500
F&
B
Re
tail
Tra
de
FIR
E
Lod
ging
Re
cre
atio
n
Bu
s. S
erv
ices
Gas
Man
u
Ed
uca
tion
Oth
er T
rans
p
Pe
rson
al S
erv
.
Air
Tra
nsp
ort
Direct
Indirect
Induced
Tourism Sales by Industry$ million
21
Total tourism employment
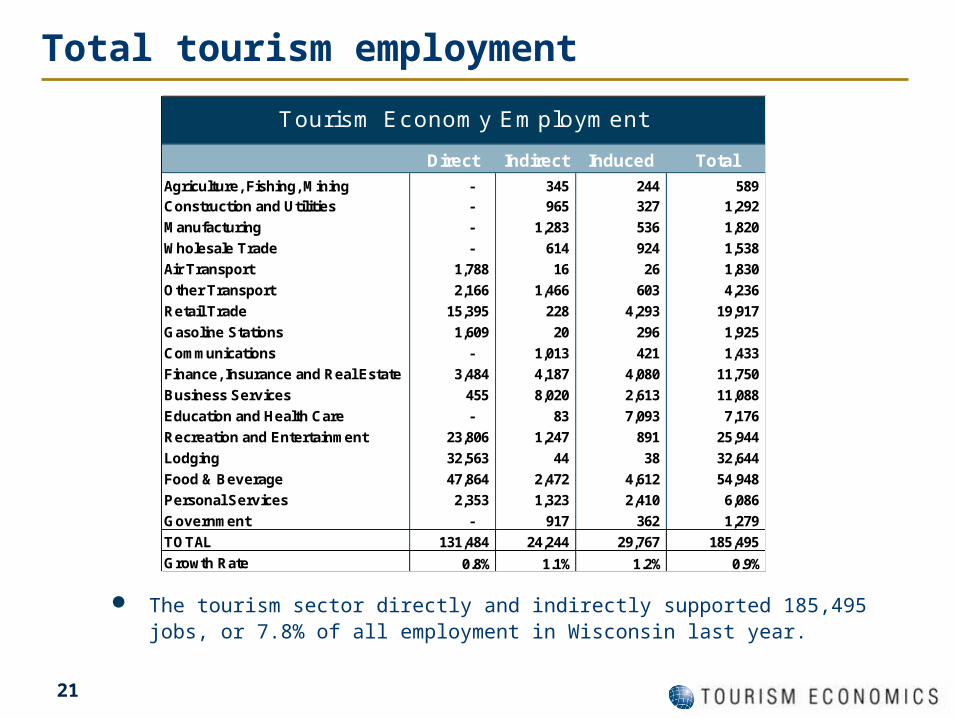
The tourism sector directly and indirectly supported 185,495 jobs, or 7.8% of all employment in Wisconsin last year.
Direct Indirect Induced Total
Agriculture, Fishing, Mining - 345 244 589 Construction and Utilities - 965 327 1,292
Manufacturing - 1,283 536 1,820
Wholesale Trade - 614 924 1,538
Air Transport 1,788 16 26 1,830
Other Transport 2,166 1,466 603 4,236
Retail Trade 15,395 228 4,293 19,917
Gasoline Stations 1,609 20 296 1,925
Communications - 1,013 421 1,433
Finance, Insurance and Real Estate 3,484 4,187 4,080 11,750
Business Services 455 8,020 2,613 11,088
Education and Health Care - 83 7,093 7,176
Recreation and Entertainment 23,806 1,247 891 25,944
Lodging 32,563 44 38 32,644
Food & Beverage 47,864 2,472 4,612 54,948
Personal Services 2,353 1,323 2,410 6,086
Government - 917 362 1,279
TOTAL 131,484 24,244 29,767 185,495
Growth Rate 0.8% 1.1% 1.2% 0.9%
Tourism Economy Employment
22
Total tourism employment
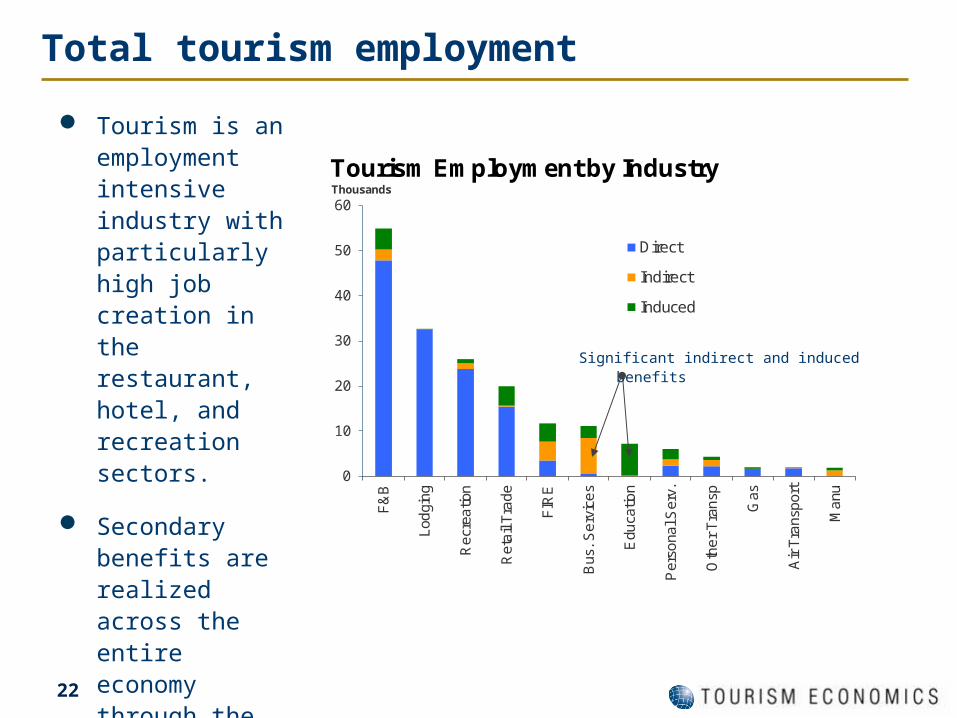
Tourism is an employment intensive industry with particularly high job creation in the restaurant, hotel, and recreation sectors.
Secondary benefits are realized across the entire economy through the supply chain and incomes as they are spent.
0
10
20
30
40
50
60
F&
B
Lod
gin
g
Re
crea
tion
Re
tail
Tra
de
FIR
E
Bus
. S
erv
ice
s
Edu
catio
n
Per
sona
l Ser
v.
Oth
er
Tra
nsp
Gas
Air
Tra
nsp
ort
Ma
nu
Thousands
Direct
Indirect
Induced
Tourism Employment by Industry
Significant indirect and induced benefits

23
Tourism employment intensity
3.7%
4.1%
22.4%
34.4%
92.2%
0% 20% 40% 60% 80% 100%
Total
Retail
Food & bev.
Recreation
Lodging
Tourism Employment Intensity by Industry
Tourism is a significant part of several industries – 92% of lodging, 34% of recreation, and 22% of food & beverage employment is directly supported by tourism spending.

24
Tourism personal income
Direct Indirect Induced TotalAgriculture, Fishing, Mining - 4.4 3.9 8.3
Construction and Utilities - 76.3 27.3 103.6
Manufacturing - 74.0 31.3 105.2
Wholesale Trade - 42.5 64.0 106.5
Air Transport 84.0 0.7 1.2 85.9
Other Transport 107.7 70.4 27.7 205.8
Retail Trade 332.6 6.3 114.3 453.2
Gasoline Stations 40.4 0.5 7.3 48.2
Communications - 54.4 24.7 79.1
Finance, Insurance and Real Estate 61.9 141.8 142.5 346.2
Business Services 21.6 370.2 120.7 512.5
Education and Health Care - 3.1 377.0 380.0
Recreation and Entertainment 403.8 22.7 14.5 441.0
Lodging 631.8 0.7 0.6 633.1
Food & Beverage 767.7 38.7 81.3 887.7
Personal Services 79.3 57.2 71.0 207.5
Government - 69.2 24.7 93.9
TOTAL 2,530.9 1,032.9 1,133.9 4,697.7
Pch Change 2.6% 4.0% 3.9% 3.2%
Tourism Labor Income (Compensation)
(US$ Million)

25
Tourism personal income
Substantial employment in F&B and recreation supports significant labor income in those industries.
Business services and the FIRE (finance, insurance and real estate) sectors depend on tourism activity as suppliers to tourism companies and their employees.
0
100
200
300
400
500
600
700
800
900
1,000
F&
B
Lod
ging
Bu
s. S
erv
ices
Re
tail
Tra
de
Re
cre
atio
n
Ed
uca
tion
FIR
E
Pe
rson
al S
erv
.
Oth
er T
rans
p
Wh
ole
sale
Tr.
Man
u
Co
nstr
uct
ion
Direct
Indirect
Induced
Tourism Labor Income by Industry$ million
Significant indirect and induced benefits

26
Tourism tax generation
Taxes of $2.4 billion were directly and indirectly generated by tourism in 2013.
State and local taxes alone tallied $1.35 billion.
Each household in Wisconsin would need to be taxed an additional $590 per year to replace the tourism taxes received by state and local governments.
Tax Type 2010 2011 2012 2013
Federal Taxes Subtotal 917.6 950.9 983.6 1,017.9
Corporate 81.9 87.4 91.5 95.6
Indirect Business 104.8 112.0 117.2 122.4
Personal Income 212.6 218.6 225.4 232.7
Social Security 518.2 532.9 549.5 567.2
State and Local Taxes Subtotal 1,202.1 1,270.8 1,313.3 1,349.5
Corporate 113.2 120.9 126.6 132.2
Personal Income 101.9 104.8 108.1 111.6
Sales 425.3 453.1 473.4 490.4
Bed 72.7 77.3 80.9 84.6
Property 370.9 391.7 397.8 400.4
Excise and Fees 108.5 113.0 116.4 119.9
State Unemployment 9.6 9.9 10.2 10.5
TOTAL 2,119.6 2,221.7 2,296.9 2,367.4
Traveler Generated Taxes
(US$ Million)

27
Tourism tax generation – state & local government
Of the $1.35 billion collected by state and local governments from traveler activity, $733 million (54%) accrued to state government.
Local government revenues from visitor activity grew to $618 million.
Property tax revenue, along with local excise and fees and lodging taxes, comprise the major revenue streams for local governments.
Tax Type 2012 2013
State Tax Subtotal 707.0 732.9
Corporate 126.6 132.2
Personal Income 108.1 111.6
Sales 438.0 453.7
Lodging 0.0 0.0
Property 0.0 0.0
Excise and Fees 24.2 25.0
State Unemployment 10.2 10.5
Local Tax Subtotal 606.3 617.7
Corporate 0.0 0.0
Personal Income 0.0 0.0
Sales 35.4 36.7
Lodging 80.9 85.6
Property 397.8 400.4
Excise and Fees 92.2 95.0
State Unemployment 0.0 0.0
Traveler Generated Taxes - State and
Local Government Revenues
(US$ Million)

Methodology and Background
29
By monitoring tourism’s economic impact, policy makers can make informed decisions regarding the funding and prioritization of tourism development.
It can also carefully monitor its successes and future needs.
In order to do this, tourism must be measured in the same categories as other economic sectors – i.e. tax generation, employment, wages, and gross domestic product.
Why quantify the tourism economy?
30
Why is this a challenge?
Most economic sectors such as financial services, insurance, or construction are easily defined within a country’s national accounts statistics.
Tourism is not so easily measured because it is not a single industry. It is a demand-side activity which affects multiple sectors to various degrees.
Tourism spans nearly a dozen sectors including lodging, recreation, retail, real estate, air passenger transport, food & beverage, car rental, taxi services, travel agents…

31
• Domestic visitor expenditure estimates are provided by Longwoods International’s representative survey of US travelers. These are broken out by sectors (lodging, transport at destination, food & beverage, retail, and recreation), by purpose (business and leisure), and by length of stay (day and overnight).
• Tourism Economics then adjusts these levels of spending based on a range of known measures of tourism activity:
• Overseas visitor spending (source: OTTI, TE)
• Canada visitor spending (source: Statistics Canada, TE)
• Bed tax receipts
• Spending on air travel which accrues to all airports and locally-based airlines
• Gasoline purchases by visitors (source: TE calculation)
• Smith Travel Research data on hotel revenues
• Industry data on employment, wages, GDP, and sales (source: BEA, BLS, Census)
Methods and data sources

32
• An IMPLAN model was compiled for the State of Wisconsin. This traces
the flow of visitor-related expenditures through the local economy and
their effects on employment, wages, and taxes. IMPLAN also quantifies
the indirect (supplier) and induced (income) impacts of tourism.
• All results are benchmarked and cross-checked and adjusted based on
the following:
• US Bureau of Labor Statistics and Bureau of Economic Analysis
(employment and wages by industry)
• US Census (business sales by industry)
• The source of the employment and wage data is the Regional Economic
Information System (REIS), Bureau of Economic Analysis, U.S.
Department of Commerce. All employment rankings are based on Bureau
of Labor Statistics (ES202/QCEW) data.
Methods and data sources

33
Selected recent economic impact clients
Cities
Baltimore, MD
Columbus, OH
Kansas City, MO
London, United Kingdom
New York City
Omaha, NE
Orlando, FL
Philadelphia, PA
Pittsburgh, PA
Rockford, IL
Countries / Provinces
Bahamas
Bermuda
Cayman Islands
Dubai
Ontario Canada
St. Lucia
United Kingdom
Associations / Companies
Center for Exhibition Industry Research (Economic Impact of Visa Restrictions)
DMAI (Event Impact Calculator for 80 CVBs)
US Travel Association (Impact of travel promotion)
InterContinental Hotels
States
California
Georgia
Maryland
New York
North Carolina
Ohio
Pennsylvania
Wisconsin
34
About Tourism Economics
Tourism Economics, headquartered in Philadelphia, is an Oxford Economics company dedicated to providing high value, robust, and relevant analyses of the tourism sector that reflects the dynamics of local and global economies. By combining quantitative methods with industry knowledge, Tourism Economics designs custom market strategies, project feasibility analysis, tourism forecasting models, tourism policy analysis, and economic impact studies.
Our staff have worked with over 100 destinations to quantify the economic value of tourism, forecast demand, guide strategy, or evaluate tourism policies.
Oxford Economics is one of the world’s leading providers of economic analysis, forecasts and consulting advice. Founded in 1981 as a joint venture with Oxford University’s business college, Oxford Economics is founded on a reputation for high quality, quantitative analysis and evidence-based advice. For this, it draws on its own staff of 40 highly-experienced professional economists; a dedicated data analysis team; global modeling tools; close links with Oxford University, and a range of partner institutions in Europe, the US and in the United Nations Project Link.
For more information: [email protected].

35
For more information:
Adam Sacks, President
Christopher Pike, Senior Economist
Related Documents