DOCKETED Docket Number: 21-IEPR-03 Project Title: Electricity and Natural Gas Demand Forecast TN #: 239170 Document Title: Presentation - Historic Zero-Emission Vehicle (ZEV) Trends Description: S2.01 Gage, Bahreinian, McBride, Aragon, Deaver, Marshall_CEC Filer: Raquel Kravitz Organization: California Energy Commission Submitter Role: Commission Staff Submission Date: 8/3/2021 12:47:51 PM Docketed Date: 8/3/2021

Welcome message from author
This document is posted to help you gain knowledge. Please leave a comment to let me know what you think about it! Share it to your friends and learn new things together.
Transcript

DOCKETED Docket Number: 21-IEPR-03
Project Title: Electricity and Natural Gas Demand Forecast
TN #: 239170
Document Title: Presentation - Historic Zero-Emission Vehicle (ZEV) Trends
Description: S2.01 Gage, Bahreinian, McBride, Aragon, Deaver,
Marshall_CEC
Filer: Raquel Kravitz
Organization: California Energy Commission
Submitter Role: Commission Staff
Submission Date: 8/3/2021 12:47:51 PM
Docketed Date: 8/3/2021

Jesse [email protected]
Historic Zero-Emission Vehicle (ZEV) Trends
IEPR Workshop on Electricity and Natural Gas Demand Forecast:Inputs and Assumptions
August 5, 2021

https://www.energy.ca.gov/data-reports/energy-insights/zero-emission-vehicle-and-charger-statistics
ZEVStats is Your Official Source for… ZEV Stats
2
• Historical on-road ZEV population
• Sales of new ZEVs, updated quarterly
• Infrastructure data such as EV chargers and H2 stations
• Medium/Heavy-Duty ZEV data in the works
• Just type “ZEVStats” in Google, Bing, or DuckDuckGo

• Record ZEV sales in 2021 and 10% sales share look likely• 1.5 million on-road ZEV by 2025 looks within reach; 5 million by 2030
may need help• Tesla is the largest ZEV maker, but not a majority• ZEV models are diversifying and will soon be offered for nearly all
light-duty market segments
Overview
3

2021 Q1-2 sales data is through June 2021 and is approximate. Source: Zevstats.
0
50,000
100,000
150,000
200,000
2013 2014 2015 2016 2017 2018 2019 2020 2021 Q1-2
Annual ZEV Sales
Hydrogen PHEV Electric Total ZEV
ZEV Sales on Pace for a Record in 2021…
4

Source: Zevstats.
EO B-16-2021
0
1,000,000
2,000,000
3,000,000
4,000,000
5,000,000
2016 2018 2020 2022 2024 2026 2028 2030
Total On-Road ZEVsEO B-48-18
… but There’s a Long Way to Go
5

Source: Zevstats.
-
50,000
100,000
150,000
200,000
2013 2014 2015 2016 2017 2018 2019 2020 2021 Q1-2
ZEV Sales by Tesla Models, and Other Manufacturers
Non-Tesla Model S Model X Model 3 Model Y
Tesla’s Sales Share is Dominant, but not Absolute
6

Source: Zevstats and staff analysis of DMV Vehicle Registration Database.
Rank Make Model Fuel2021 Q1-2
Sales
1 Tesla Model Y Electric 27,924
2 Tesla Model 3 Electric 26,671
3 Chevrolet Bolt EV Electric 10,983
4 Toyota Prius Prime PHEV 10,535
5 Toyota RAV4 Prime PHEV 2,841
6 BMW 5 Series PHEV 2,504
7 Ford Mustang Mach-E Electric 2,466
8 Nissan LEAF Electric 2,401
9 Audi e-tron Electric 2,247
10 Honda Clarity PHEV PHEV 2,236
Rank Make Model FuelAll-TimeSales
1 Tesla Model 3 Electric 186,145
2 Chevrolet Volt PHEV 79,717
3 Tesla Model S Electric 74,719
4 Nissan LEAF Electric 56,036
5 Chevrolet Bolt EV Electric 55,949
6 Toyota Prius Prime PHEV 55,486
7 Tesla Model Y Electric 49,303
8 Tesla Model X Electric 36,227
9 Ford Fusion Energi PHEV 30,361
10 FIAT 500e Electric 29,824
ZEV Sales Charts: The Top Ten
7
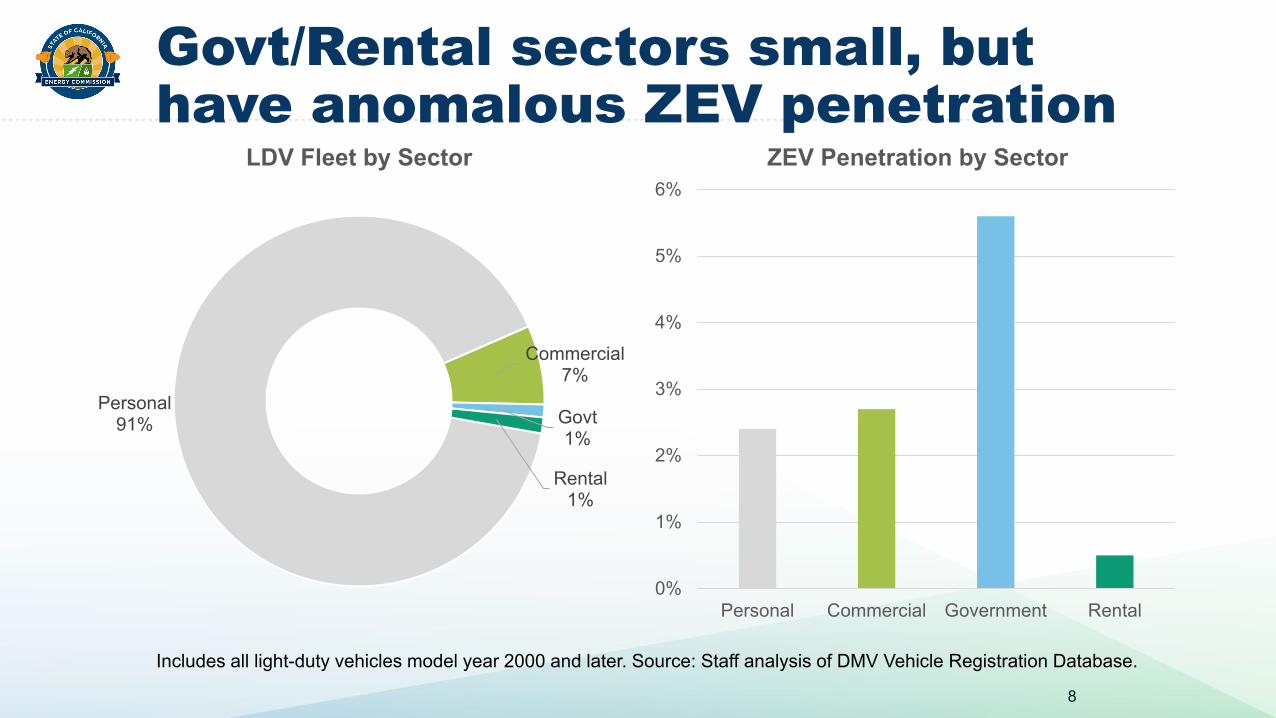
Includes all light-duty vehicles model year 2000 and later. Source: Staff analysis of DMV Vehicle Registration Database.
0%
1%
2%
3%
4%
5%
6%
Personal Commercial Government Rental
ZEV Penetration by Sector
Personal91%
Commercial7%
Govt1%
Rental1%
LDV Fleet by Sector
Govt/Rental sectors small, but have anomalous ZEV penetration
8

9
Source: Staff analysis of DMV Vehicle Registration Database.
0%
25%
50%
75%
100%
ZEV (2015) ZEV (2020) ICE (2020)
Available ZEV and ICE Models for Sale in California
PickupsVansSUVsCars
ZEV Model Availability Beginning to Look Like ICE

Source: Zevstats and staff analysis of DMV Vehicle Registration Database.
0
10
20
30
40
2013 2014 2015 2016 2017 2018 2019 2020 2021
Available Electric and PHEV Models for Sale in California
Electric PHEV
Still More PHEV Models than Electric
10
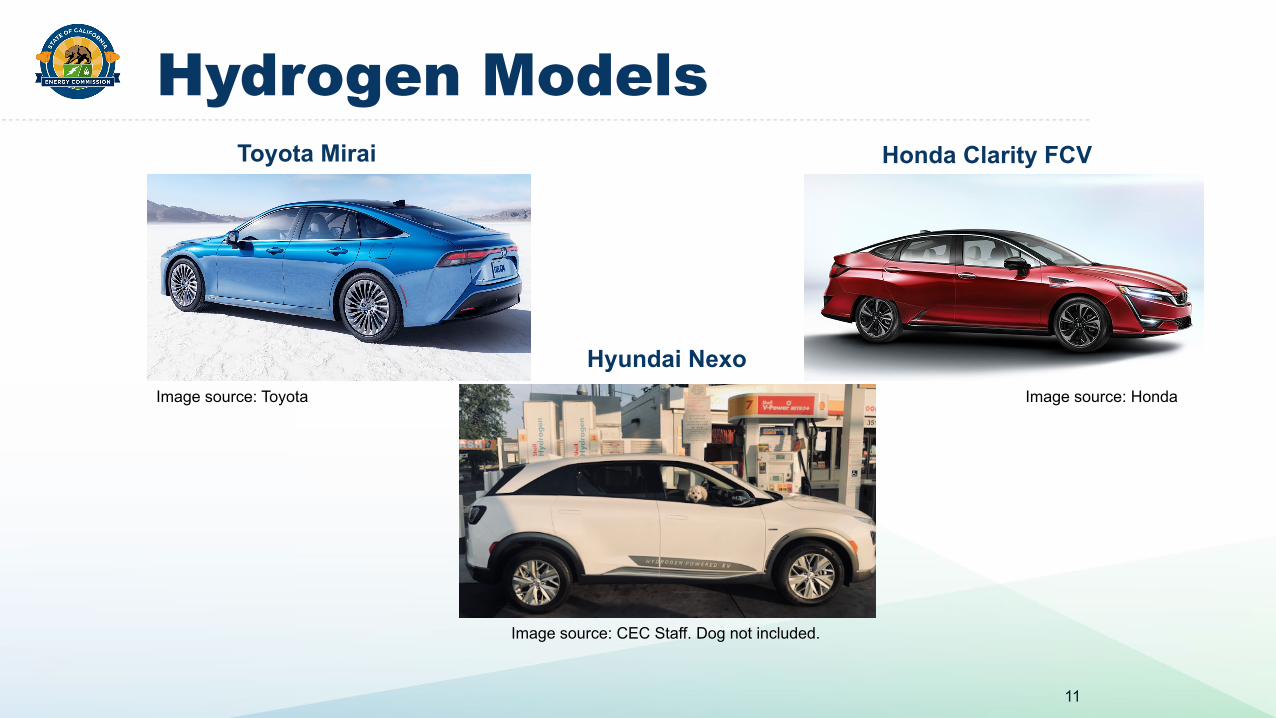
Image source: CEC Staff. Dog not included.
Hyundai NexoImage source: Honda
Honda Clarity FCV
Image source: Toyota
Toyota Mirai
Hydrogen Models
11

Thank You!

Transportation Forecasting: Light Duty Vehicle Model Updates
IEPR Workshop on Electricity and Natural Gas Demand Forecast:Inputs and Assumptions
August 5, 2021
Aniss [email protected]

Overview of Updates
2
• Forecasting Inputs• Model Updates• Light Duty Vehicle Classes

Input Updates
3
• Economic & Demographic Data,• Energy Prices,• Vehicle attribute (price, range, MPG …etc) forecasts updating:
• All attribute values, • Technology introduction & elimination schedules, • Differentiating between luxury and standard vehicle attributes,• Light duty vehicle attribute forecast scenarios includes one on the
2035 ICE sales ban for a potential ZEV demand forecast scenario.
Forecasting Horizon: 2021-2035

Model Updates
• Consumer preferences in the newly estimated models reflect the snapshot of consumer preferences, in the residential and commercial market segments, captured in the 2019 California Vehicle Survey data,
• Differentiating between luxury and standard vehicle preferences,• Higher resolution of income category; 10 income categories vs 7 in
prior forecasts,• 514 household types vs 362 household types in prior forecasts,• Rebate incentives by threshold income category, more consistent
with current CVRP practice.
4
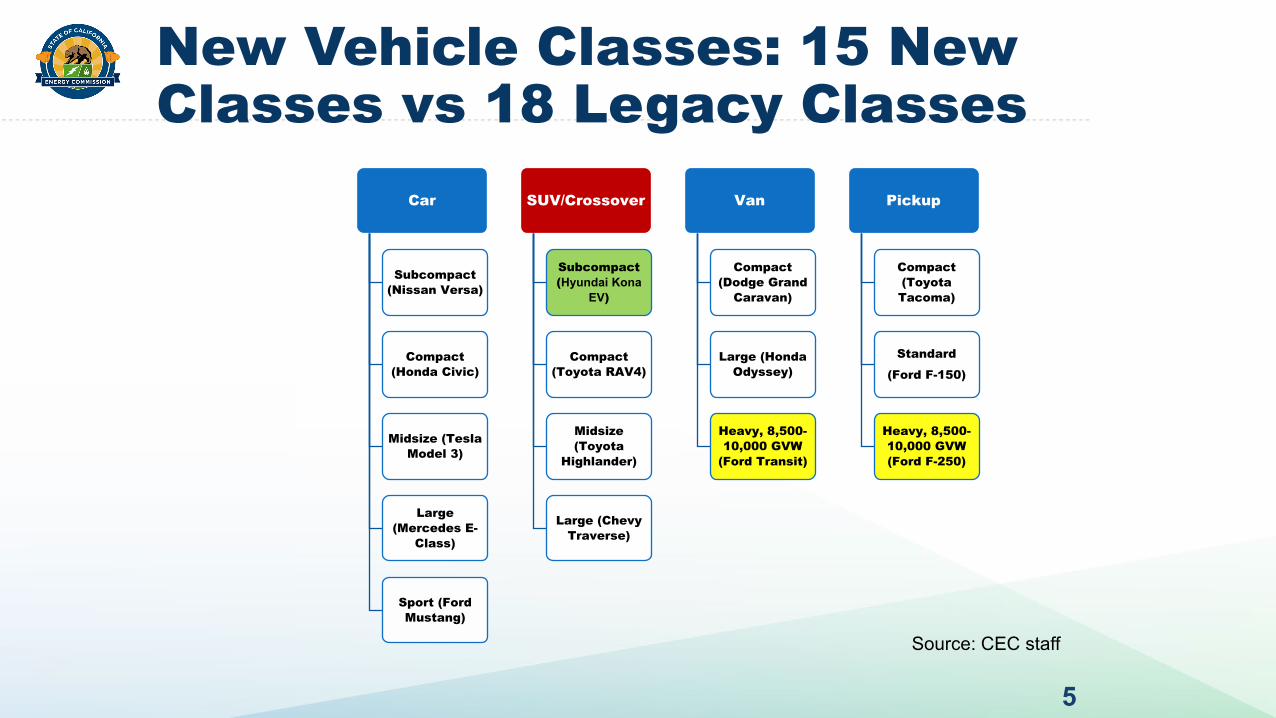
New Vehicle Classes: 15 New Classes vs 18 Legacy Classes
5
Car
Subcompact (Nissan Versa)
Compact (Honda Civic)
Midsize (Tesla Model 3)
Large (Mercedes E-
Class)
Sport (Ford Mustang)
SUV/Crossover
Subcompact (Hyundai Kona
EV)
Compact (Toyota RAV4)
Midsize (Toyota
Highlander)
Large (Chevy Traverse)
Van
Compact (Dodge Grand
Caravan)
Large (Honda Odyssey)
Heavy, 8,500-10,000 GVW
(Ford Transit)
Pickup
Compact (Toyota Tacoma)
Standard
(Ford F-150)
Heavy, 8,500-10,000 GVW (Ford F-250)
Source: CEC staff

Thank You!

Truck Choice and Freight Model Inputs and Assumptions – 2021 IEPR
Presenter: Bob McBride, Energy Commission SpecialistDate: August 5, 2021

Medium- and Heavy-duty Vehicle Classes
2
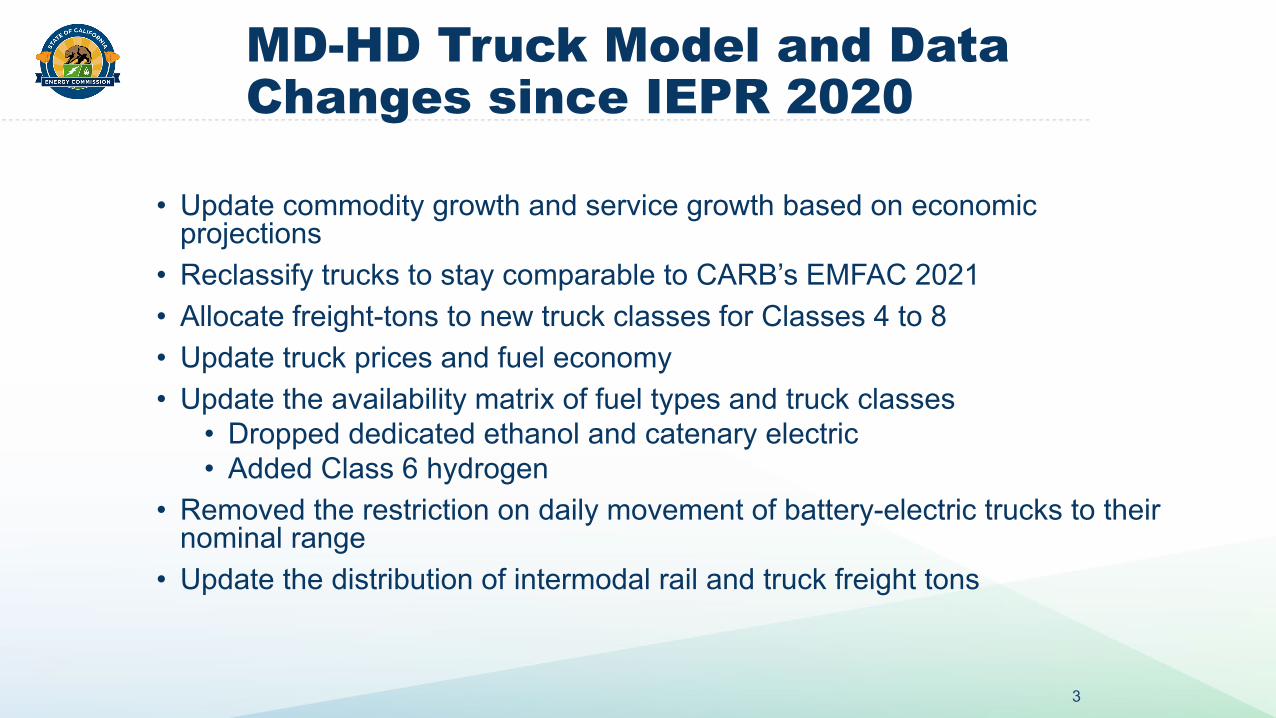
MD-HD Truck Model and Data Changes since IEPR 2020
3
• Update commodity growth and service growth based on economic projections
• Reclassify trucks to stay comparable to CARB’s EMFAC 2021 • Allocate freight-tons to new truck classes for Classes 4 to 8• Update truck prices and fuel economy • Update the availability matrix of fuel types and truck classes
• Dropped dedicated ethanol and catenary electric• Added Class 6 hydrogen
• Removed the restriction on daily movement of battery-electric trucks to their nominal range
• Update the distribution of intermodal rail and truck freight tons

Powertrain Availability Matrix (draft)
4
Source: CEC staff

Uses of CARB’s EMFAC 2021 Data• Annual miles per truck estimated using a fitted equation
from EMFAC 2021 miles per truck by class and vintage• Survival rates by model year are a statewide average of
EMFAC 2021 stock proportions through time (to represent retirements, imports, and sales of used trucks)
• Truck fuel economy values from EMFAC 2021 where they exist. Supplemented with ICF’s research for additional fuels using GREET and HD Systems data
5

Commodity Assignment to Truck Class ( Remainder Becomes Service Trucks )
6
Source: CEC staff
Pickups, Vans, Single Unit
GVWR 3
Single Unit / Straight "Other"
Classes 4 and 5Other
Class 6 Other
Class 7 Other
Class 8 Other
Single Unit Delivery
Classes 4 and 5Delivery
Class 6Delivery
Class 7 Delivery
Class 8Delivery
Tractor-trailer Combinations
GVWR8 Instate
GVWR7 Instate
Port
CA-based Interstate
(EMFAC2021 & DMV)
Out-of-State-based
Interstate (EMFAC2021)
Vocational
Class 8 Refuse and Recycling
Class 8 Dump
Assignment
One-to-one
Commodity
Commodity & Service

Questions?
7

Production Cost Model Preliminary Inputs, Assumptions,
and Results2021 Integrated Energy Policy Report (IEPR)
Presenters: Hazel Aragon, Electric Generation System Specialist IPaul Deaver, Electric Generation System Program Specialist I
Date: August 5, 2021

Topics
• IEPR Preliminary Common Case Overview• Inputs and Assumptions
• Load forecast• Renewable portfolio build• Hydro updates• Thermal fuel and price updates
• Selected Simulation Results• Natural gas demand for electric generation• Greenhouse gas emission projections• California generation
2

IEPR Preliminary Common Case Overview
3
Common Case2020 CA Energy
Demand Update Price Energy Efficiency2030 RPS
TargetHigh Energy Consumption High Low Low AAEE 60%Mid Energy Consumption Mid Mid Mid AAEE 60%Low Energy Consumption Low High High AAEE 60%
*AAEE = Additional Achievable Energy Efficiency*RPS = Renewable Portfolio Standard

Preliminary Inputs and Assumptions

CA Energy Demand for PLEXOS Simulations
5
• Preliminary IEPR simulations used 2020 CA Energy Demand Update• Hourly load and modifiers for Investor-Owned Utilities (IOUs)
• Add “Leap Day” – only modification• Annual load and modifiers for Publicly Owned Utilities
• Loads shaped using CEC-developed shape from historical data• Modifiers calculated and shaped using nearest IOU profile
• Mid-Mid / High-Low / Low-High Cases used• https://www.energy.ca.gov/data-reports/reports/integrated-energy-
policy-report/2020-integrated-energy-policy-report-update-0
Rest of WECC Loads
6
• Data obtained from various sources• Western Electricity Coordinating Council (WECC) Loads and
Resources - Peak and Energy for 2024 through 2030 only• Federal Energy Regulatory Commission 714 filings• Utility Integrated Resource Plans (IRPs)
• High and Low Cases developed using U.S. Energy Information Administration (EIA) 861 regional electricity sales forecast data by category (Residential, Industrial, Commercial)
• Adjustments made in certain areas to smooth / control growth

Rest of WECC Loads (cont.)
7
• For out of state (OOS) loads, for the mid case:• Use historical data (2014-2018) by Balancing Authority Area or
state to create average monthly load duration curves (LDC)• Create a base year LDC (2018) to order average monthly LDCs• Re-order average LDCs based on 2018 chronology
• For the low and high cases use 2020 EIA Annual Energy Outlook:• Percent difference between mid/low and mid/high to get
multipliers• Use multipliers on mid case to get low/high cases
Retirements and Additions
8
• Hitachi ABB Energy Velocity Suite subscription database / WECC Anchor Dataset (ADS) / Trade Press / IRPs
• Once Through Cooling compliance dates• “Generic” renewable additions for RPS Requirements• Updates captured through January 2021

Retirements
9
• Additional 5,450 megawatt (MW) in WECC-wide retirements by 2030 not captured in the previous IEPR cycle:
• 3,360 MW in coal capacity retiring• 1,740 MW in gas capacity retiring• Remaining 340 MW in biomass, landfill gas, hydro resources
Additions
10
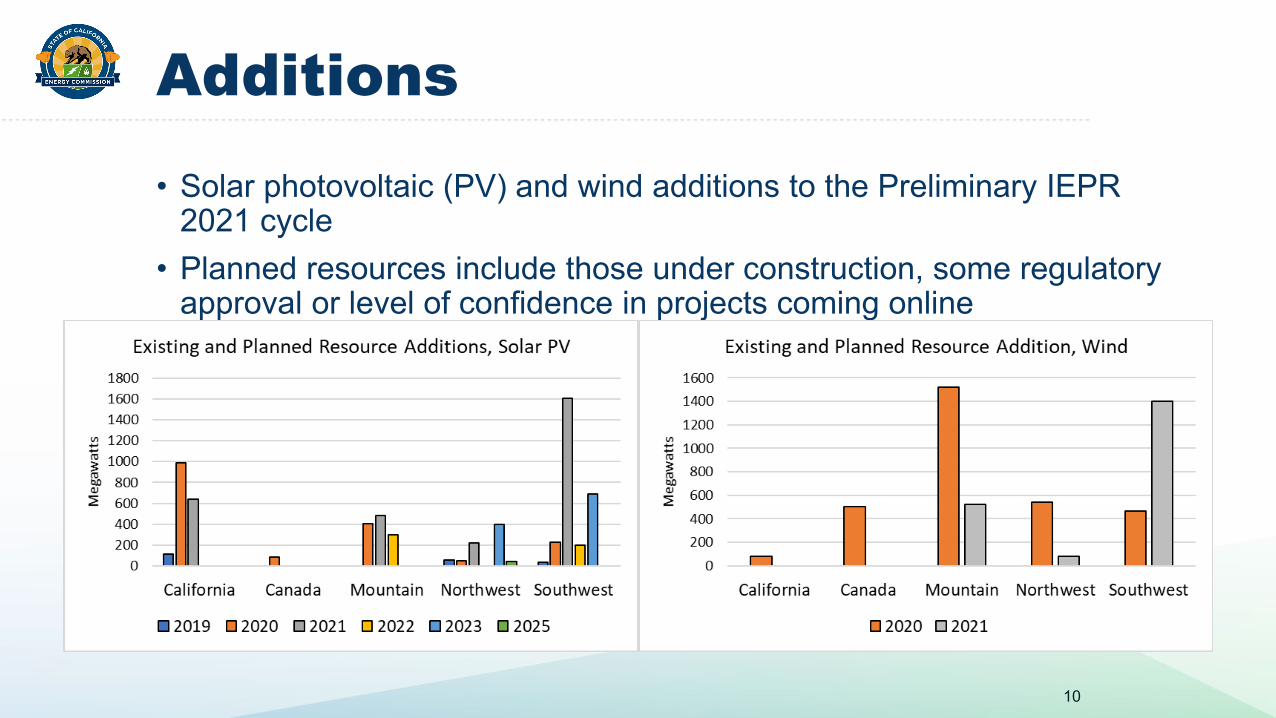
• Solar photovoltaic (PV) and wind additions to the Preliminary IEPR 2021 cycle
• Planned resources include those under construction, some regulatory approval or level of confidence in projects coming online
Additions (cont.)
11
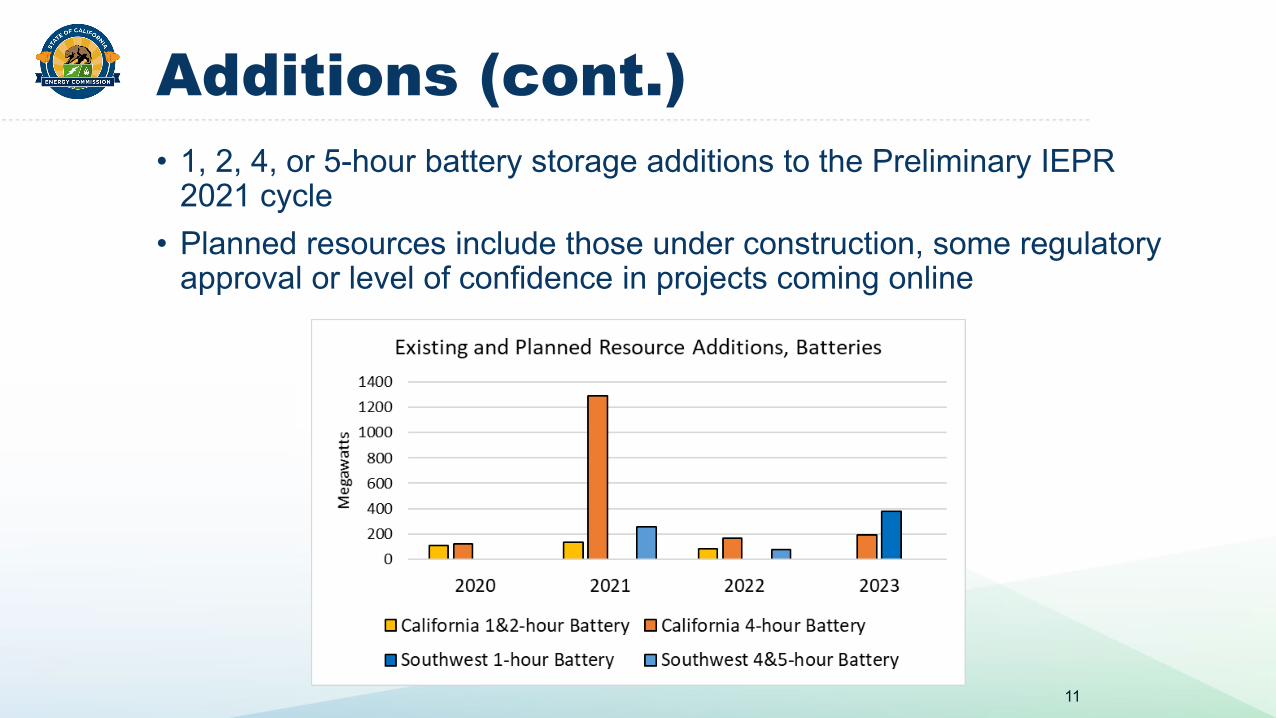
• 1, 2, 4, or 5-hour battery storage additions to the Preliminary IEPR 2021 cycle
• Planned resources include those under construction, some regulatory approval or level of confidence in projects coming online

Renewable Profiles
12
• Wind/Solar original source: • California: Use California Independent System Operator data and
aggregate• Rest of WECC: National Renewable Energy Laboratory data
• For this update: changed all times to Pacific Standard Time, and do not adjust for daylight savings
• Provides consistent estimates as solar PV generation can change greatly in an hour or two

Renewable Portfolio Build for the RPS
13
• Estimated RPS energy targets in the mid demand
State 2022 2026 2030Arizona 7,384 13,574 20,112California 89,812 117,393 143,384Colorado 10,387 10,629 11,194Montana 1,239 1,264 1,296New Mexico 3,144 7,247 9,510Nevada 8,374 9,296 13,826Oregon 7,013 11,209 14,256Utah 4,210 5,094 5,239Washington 11,834 11,901 12,149Total 143,397 187,607 230,966
Estimated Mid Demand Annual RPS Targets (GWh)
Renewable Portfolio Build for the RPS (cont.)
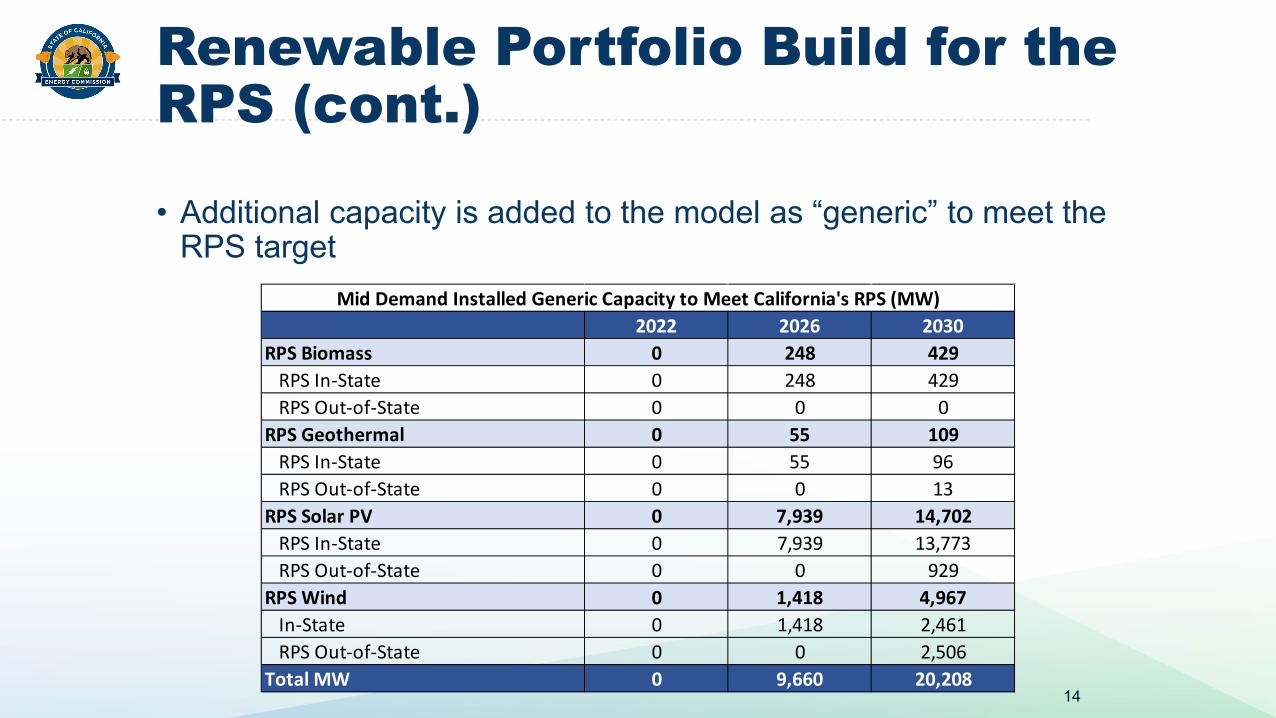
14
• Additional capacity is added to the model as “generic” to meet the RPS target
2022 2026 2030RPS Biomass 0 248 429
RPS In-State 0 248 429RPS Out-of-State 0 0 0
RPS Geothermal 0 55 109RPS In-State 0 55 96RPS Out-of-State 0 0 13
RPS Solar PV 0 7,939 14,702RPS In-State 0 7,939 13,773RPS Out-of-State 0 0 929
RPS Wind 0 1,418 4,967In-State 0 1,418 2,461RPS Out-of-State 0 0 2,506
Total MW 0 9,660 20,208
Mid Demand Installed Generic Capacity to Meet California's RPS (MW)
"Generic" Battery Storage
15
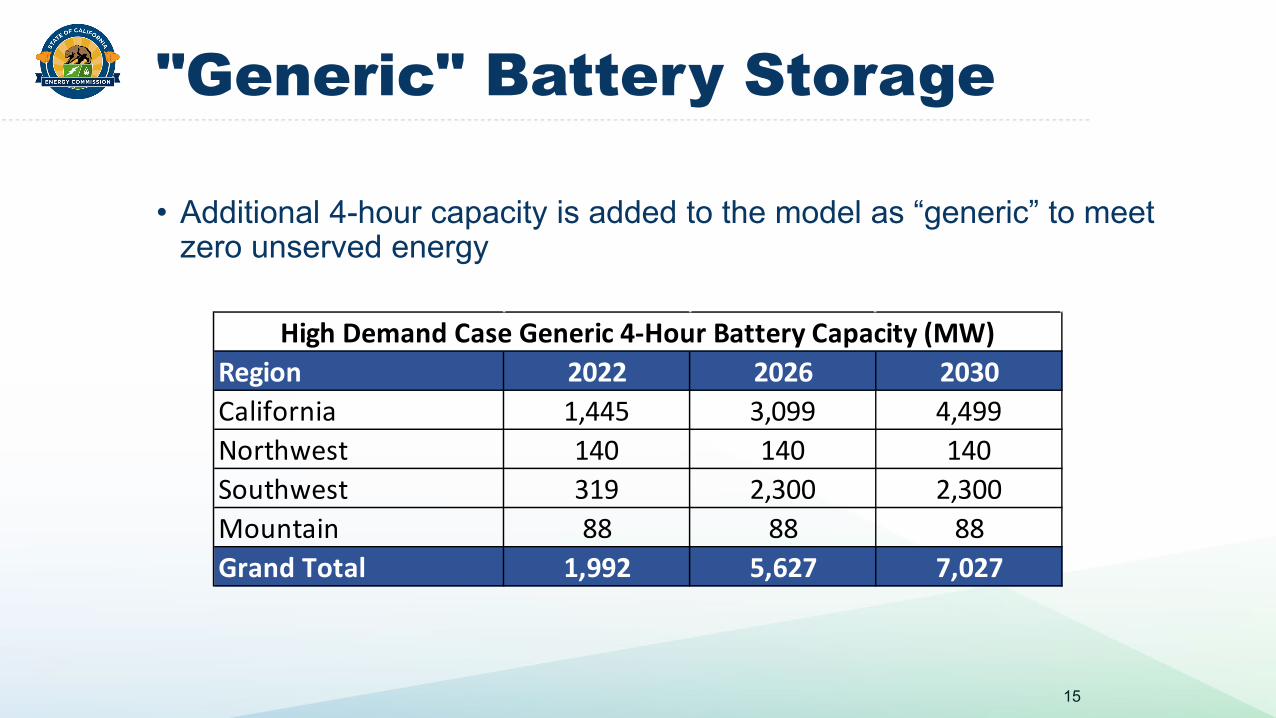
• Additional 4-hour capacity is added to the model as “generic” to meet zero unserved energy
Region 2022 2026 2030California 1,445 3,099 4,499Northwest 140 140 140Southwest 319 2,300 2,300Mountain 88 88 88Grand Total 1,992 5,627 7,027
High Demand Case Generic 4-Hour Battery Capacity (MW)

Hydro Generation Input Data
16
• 2005 to 2019 average monthly generation by plant• Quarterly Fuel and Energy Report (QFER) data for CA• EIA data (via Hitachi ABB Energy Velocity) for rest of WECC• Conventional hydro only
• California annual total generation ~ 27 terawatt-hours (TWh)• Rest of WECC annual total generation ~ 211 TWh• Constraints added to CAISO and PNW to ensure minimum generation
Nuclear Refueling Schedule
17
• Diablo Canyon / Palo Verde / Columbia Generating Station• Use historical patterns for refuel outages from EIA data• Outage duration ~ 5 weeks every 18 months• Unit outages staggered – no overlap at Diablo Canyon and Palo Verde• Diablo Canyon units retires in 2024, 2025

Heat Rate Update
18
• Use public data to update natural gas plant operating attributes• Environmental Protection Agency (EPA) Continuous Emissions
Monitoring System (CEMS)• Index of /DMDnLoad/emissions/hourly/monthly/ (epa.gov)
• For this update, used 2014-2018 hourly data to create a relationship between fuel use and output, and remove outliers
• Staff white paper describes the method in detail:• Updating Thermal Power Plant Efficiency Measures and Operational
Characteristics for Production Cost Modeling | California Energy Commission

Price Updates
19
• Deflator series – U.S. Bureau of Economic Analysis, Mood's Analytics Forecasted
• Greenhouse gas (GHG) prices – CEC, Alberta Government, British Columbia Carbon Tax
• Updates to coal and gas cold start costs and thermal variable operations and maintenance costs – WECC ADS, EIA
• June 2021 natural gas burner tip price* – CEC North American Gas-Trade (NAMGas) team

Thermal Price Updates
20
• Except for super critical coal, all other thermal technologies saw a decrease in start costs
EIA - Unit Type Plexos Child NameVO&M Cost -
2019$50-MW Biomass Plant Biomass 4.83$ 50-MW Biomass Plant Wood 4.83$ Internal Combustion Engines - Landfill Gas Landfill Gas 6.20$ Geothermal Geothermal 1.16$

Ongoing Work
21
• Items we would like to address permitting the time:• Finalize iterations with the NAMGas team on the burner tip prices• Update the renewable and battery portfolio to account for the
recent CPUC Proposal Decision, which adds 11,500 MW of NQC capacity
• Apply more emphasis on system reliability not only in the summer but also in the winter

Preliminary Results

CA Generation Results (Annual)
23
• In California, gas use decreases as solar and wind increase• Decrease from 2022-2026 is smaller than from 2026-2030
• Diablo retirement cause short term need for some gas• Biofuels, geothermal, and hydro remain constant

CA Generation Results (Monthly)
24
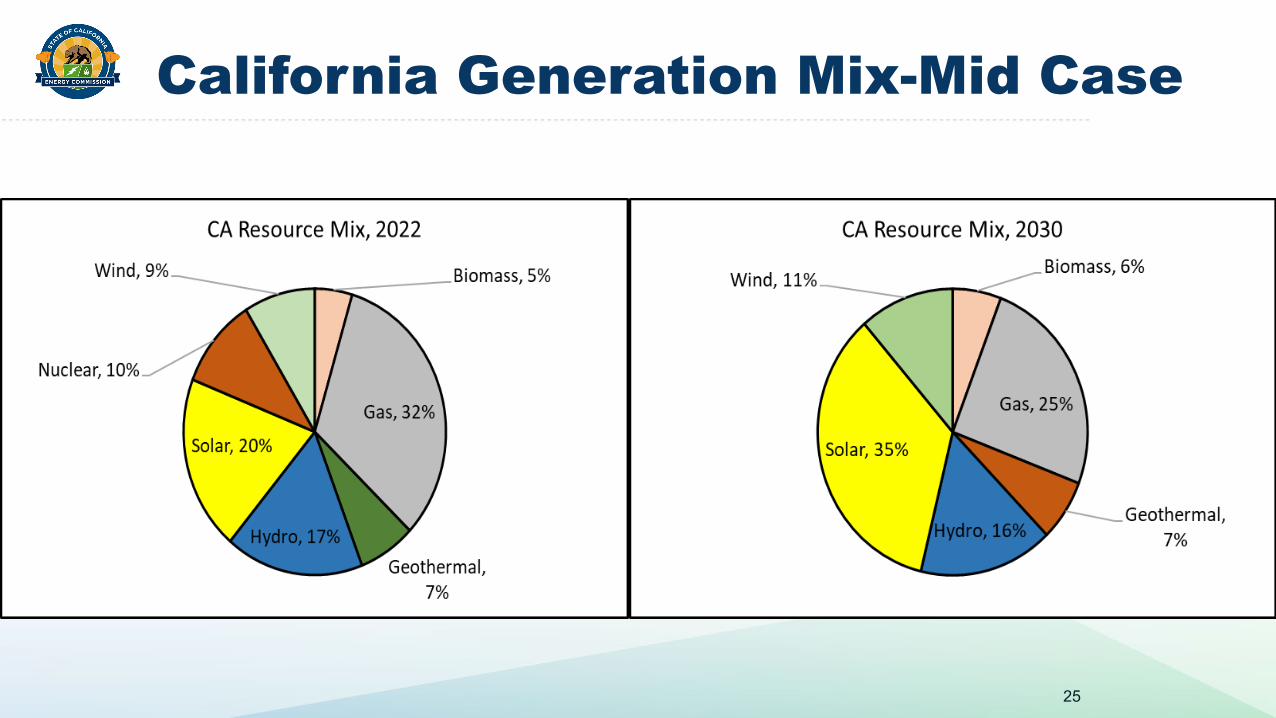
California Generation Mix-Mid Case
25

Generation by Area
26
• Southwest states generate the most, followed by CA• Pattern persists through 2030
• SW: Arizona, New Mexico, & Nevada• NW: Oregon, Idaho, and Montana• MTN: Utah, Colorado, Wyoming, and South Dakota• CAN: Alberta and British Columbia• BCN: Baja California North (CFE)

Natural Gas Use (CA and rest of WECC)
27
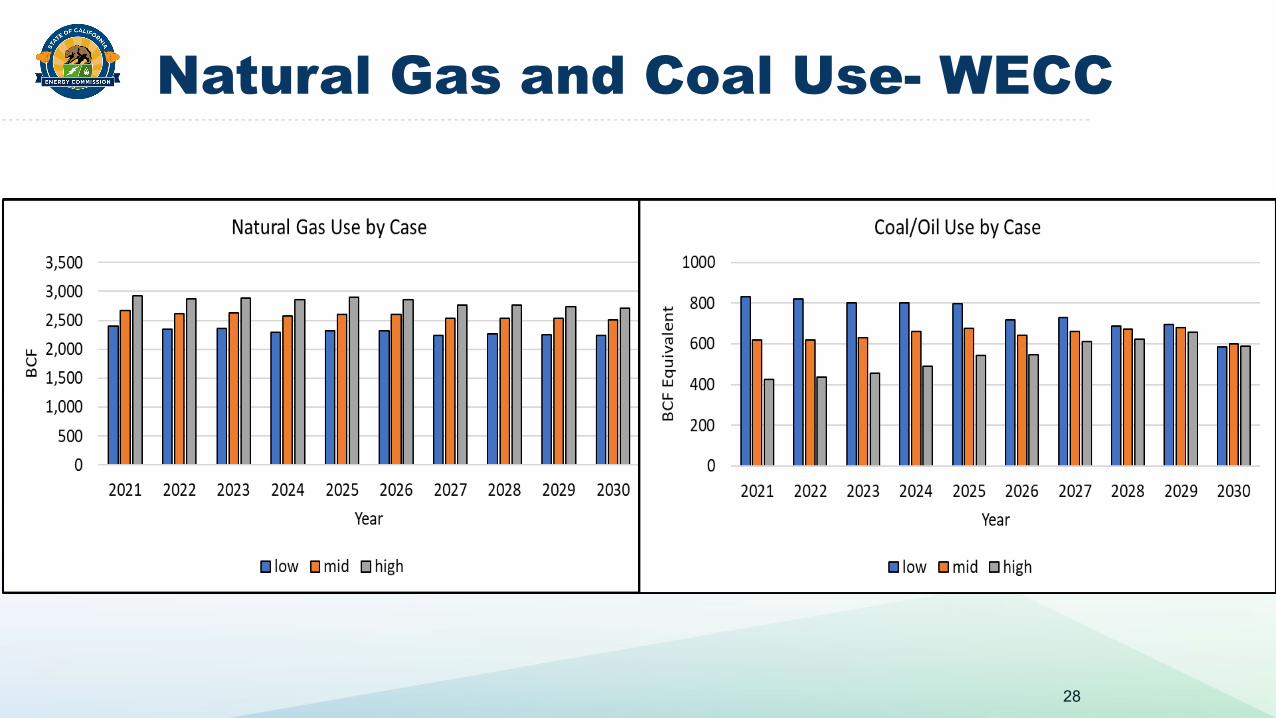
Natural Gas and Coal Use- WECC
28

Natural Gas and Coal Use-WECC
29
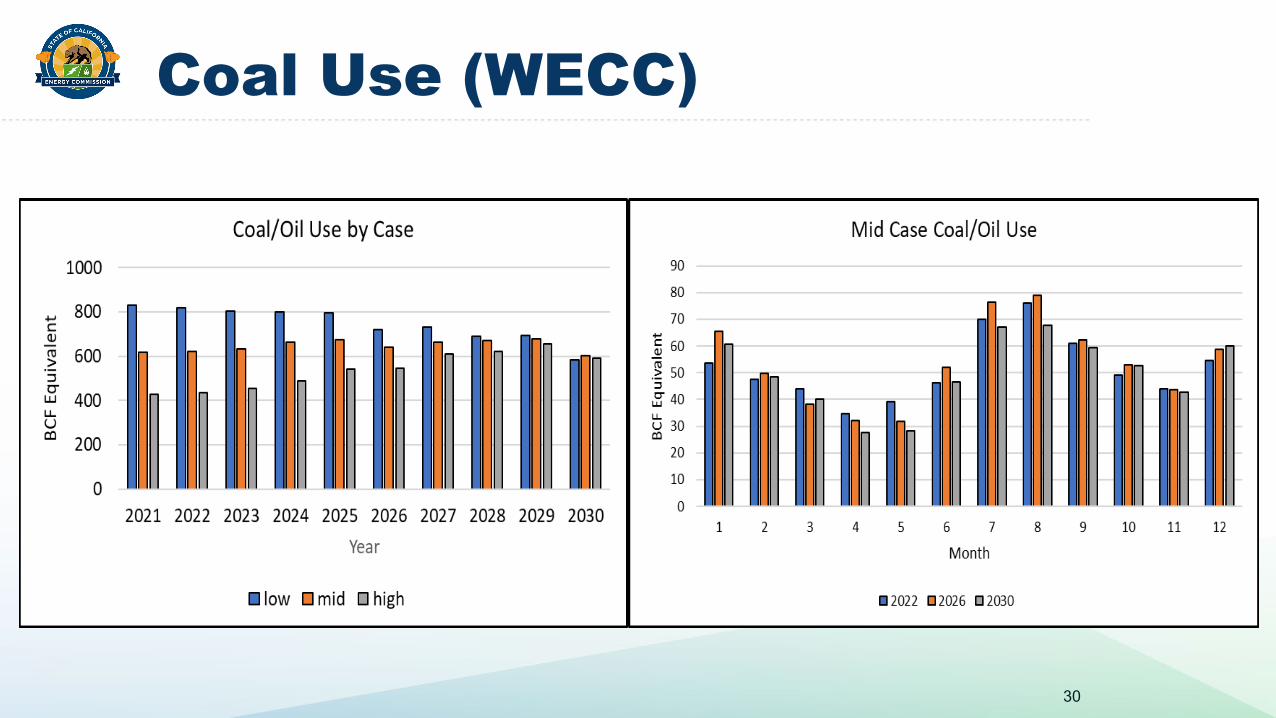
Coal Use (WECC)
30
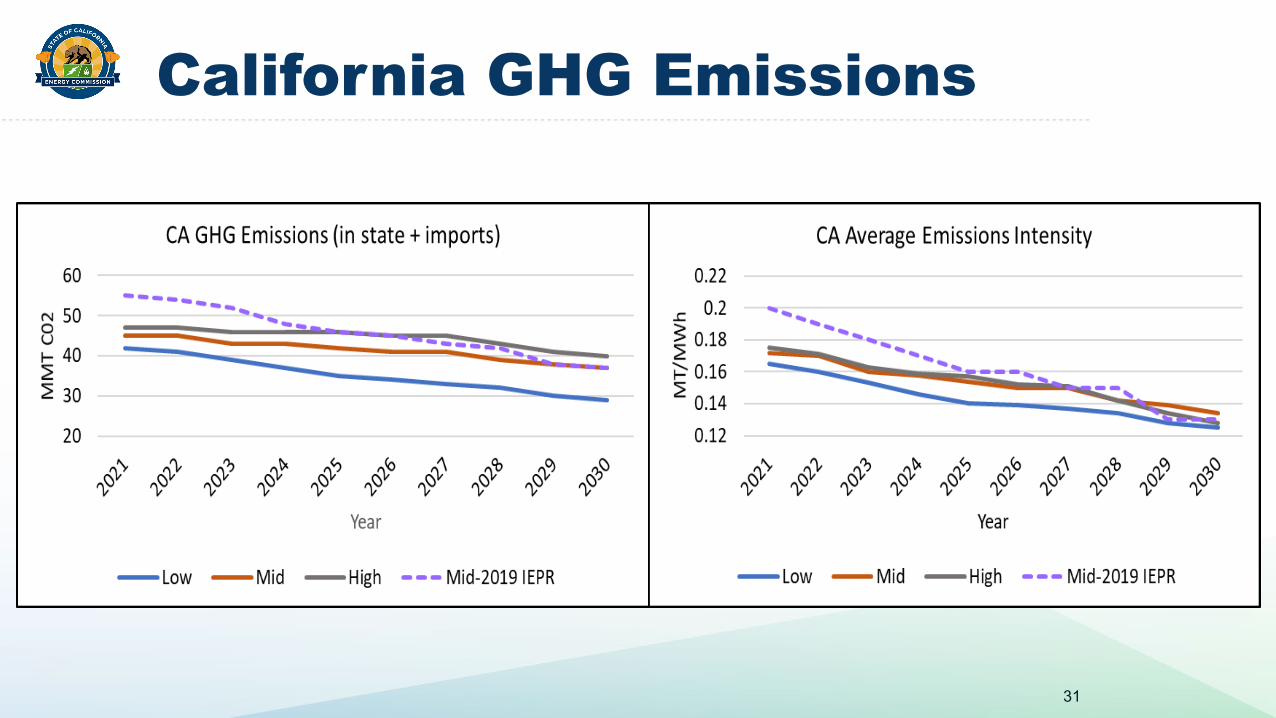
California GHG Emissions
31

California GHG Emissions Cont.
32


Electricity Rate ScenariosInputs and Assumptions
August 5, 2021
Lynn Marshall
Energy Assessments Division
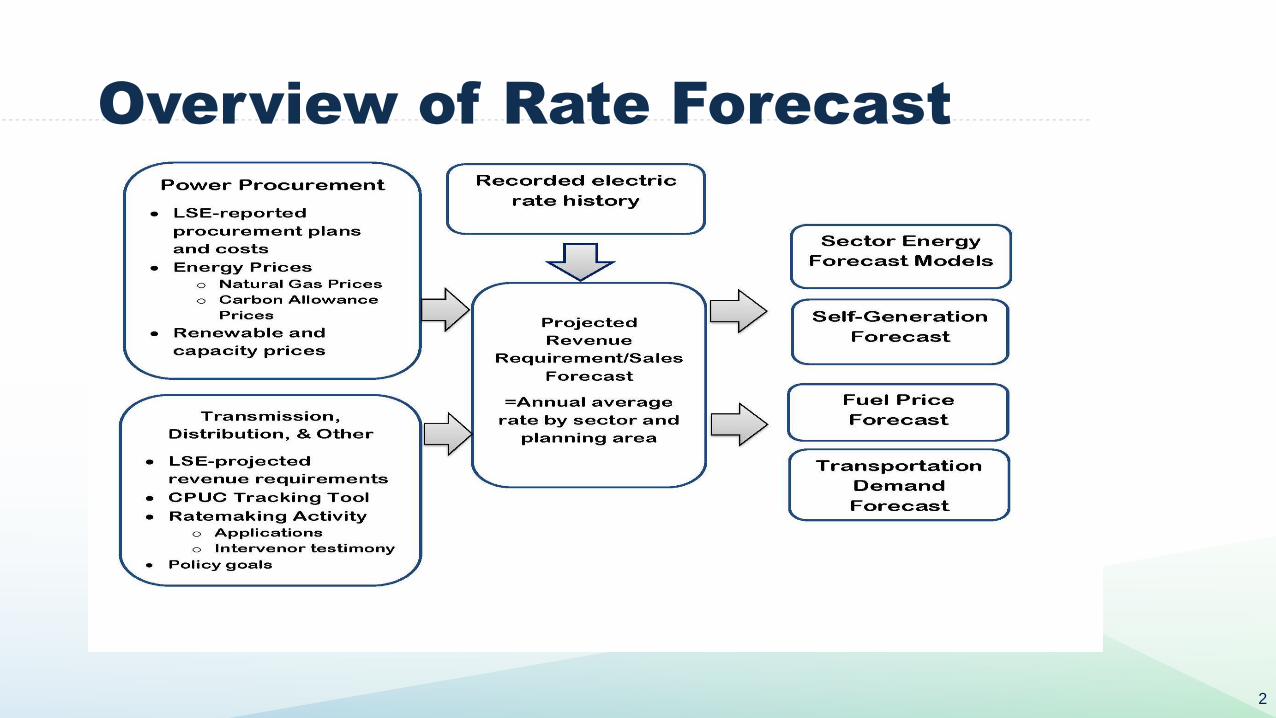
Overview of Rate Forecast
2

Natural Gas Price Scenarios
3
• While current prices are lower than previously projected, costs to maintain aging natural gas
pipeline infrastructure are projected to increase transportation rates, so citygate prices rise at faster
pace.
• Complete natural gas price forecast will be presented at the August 30th IEPR workshop
$1.00
$1.50
$2.00
$2.50
$3.00
$3.50
$4.00
$4.50
$5.00
$5.50
2018 2020 2022 2024 2026 2028 2030
SCG
City
gate
Pric
e pe
r MCF
(202
0$)

Cap and Trade Program Background
4
Electric generation is covered by the ARB cap and trade program, so allowance prices are included in PLEXOS model and are reflected in resulting prices.The current cap and trade regulation has the following features:
• A $65 (nominal) price ceiling value in 2021. • A post-2020 Reserve Tier 1 price fixed at the halfway point of the Auction Reserve Price (floor
price) and price ceiling in all years ($41.40 in 2021). • A post-2020 Reserve Tier 2 price fixed at the three-quarter point of the Auction Reserve Price and
the price ceiling in all years ($53.2 in 2021). • After 2021, tier prices and the price ceiling escalate annually at 5 percent plus inflation. The
Auction Reserve Price at the same rate.
• In analysis of this structure, Borenstein, Bushell and Wolak (2017) found probability-weighted expected prices in 2030 in the $40-$60 range, but with high probabilities of being either at the cap or floor price.
• Previously staff used the 2030 Tier 1 price ($60) for the mid case 2030 price, the Tier 2 price for the low demand (high price) case, and the Auction Reserve Price in the high demand (low price) case.

GHG Allowance Price Scenarios
5
• Prices to date have been slightly
above the floor price.
• Complementary programs, such as
the Low Carbon Fuel Standard,
provide a strong incentive to reduce
emissions and reduce allowance
demand, dampening cap and trade
prices.
• Eventual regulation changes will
likely seek to incent more GHG
reductions.
• The new mid-case 2035 price
assumes prices will increase more
slowly, but still eventually reach the
Tier 1 price.
$83 Tier 1 Price in 2035
$60 Tier 1 Price in 2030
0
20
40
60
80
100
120
2017 2019 2021 2023 2025 2027 2029 2031 2033 2035
GH
G A
llo
wan
ce
$ p
er
Metr
ic T
on
CO
2e
Low
Mid
High (Price Floor)
Mid Price (2020 Update)
Annual Average Auction SalePrice

Wholesale Energy Costs
6
• Lower natural gas and GHG allowance prices, and increased additions of
renewable and storage resources, lower energy prices compared to 2019 IEPR
mid case.
• Incremental renewable procurement costs will be valued using NREL 2021 Annual
Technology Baseline levelized costs.
0
10
20
30
40
50
60
70
2015 2017 2019 2021 2023 2025 2027 2029
Cos
t of E
nerg
y Se
rvev
d pe
r MW
H (2
020$
)
Recorded CAISO Cost
Low
Mid
High
2019 IEPR Mid Case
Capacity Costs
7
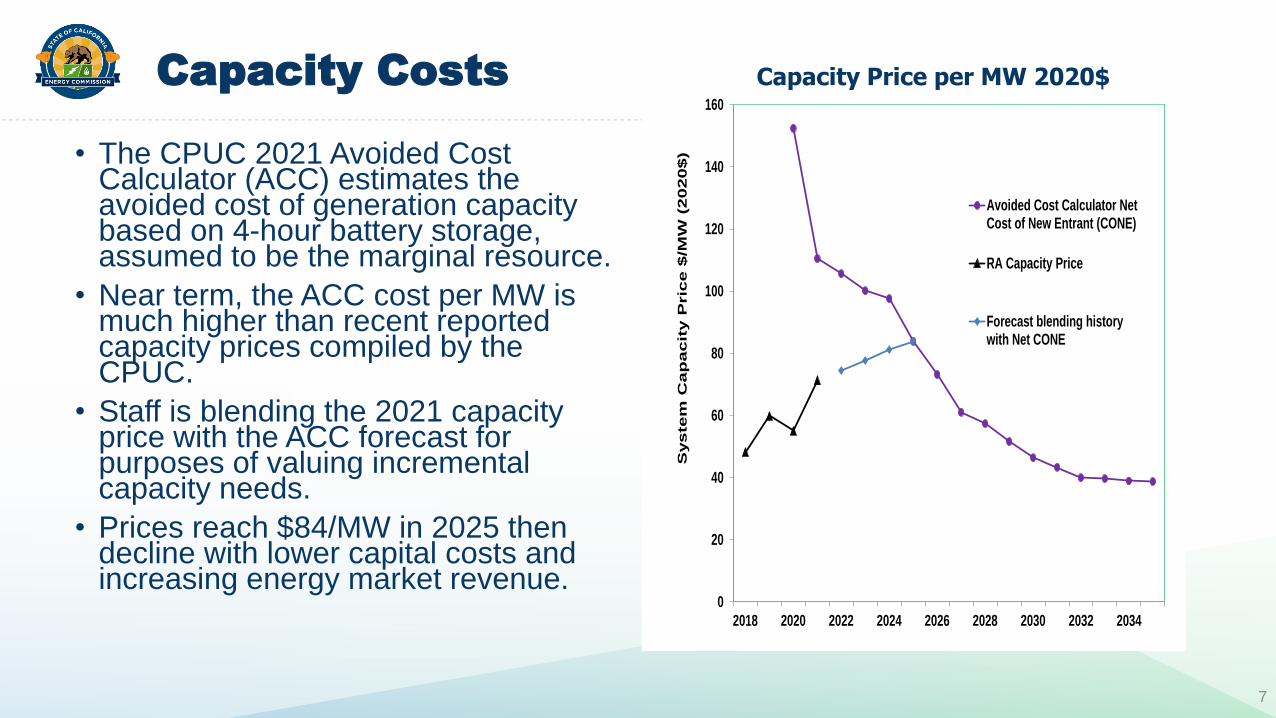
• The CPUC 2021 Avoided Cost Calculator (ACC) estimates the avoided cost of generation capacity based on 4-hour battery storage, assumed to be the marginal resource.
• Near term, the ACC cost per MW is much higher than recent reported capacity prices compiled by the CPUC.
• Staff is blending the 2021 capacity price with the ACC forecast for purposes of valuing incremental capacity needs.
• Prices reach $84/MW in 2025 then decline with lower capital costs and increasing energy market revenue.
Capacity Price per MW 2020$
0
20
40
60
80
100
120
140
160
2018 2020 2022 2024 2026 2028 2030 2032 2034
Syste
m C
ap
acit
y P
ric
e $
/MW
(2020$)
Avoided Cost Calculator NetCost of New Entrant (CONE)
RA Capacity Price
Forecast blending historywith Net CONE
8
Non-Procurement Costs
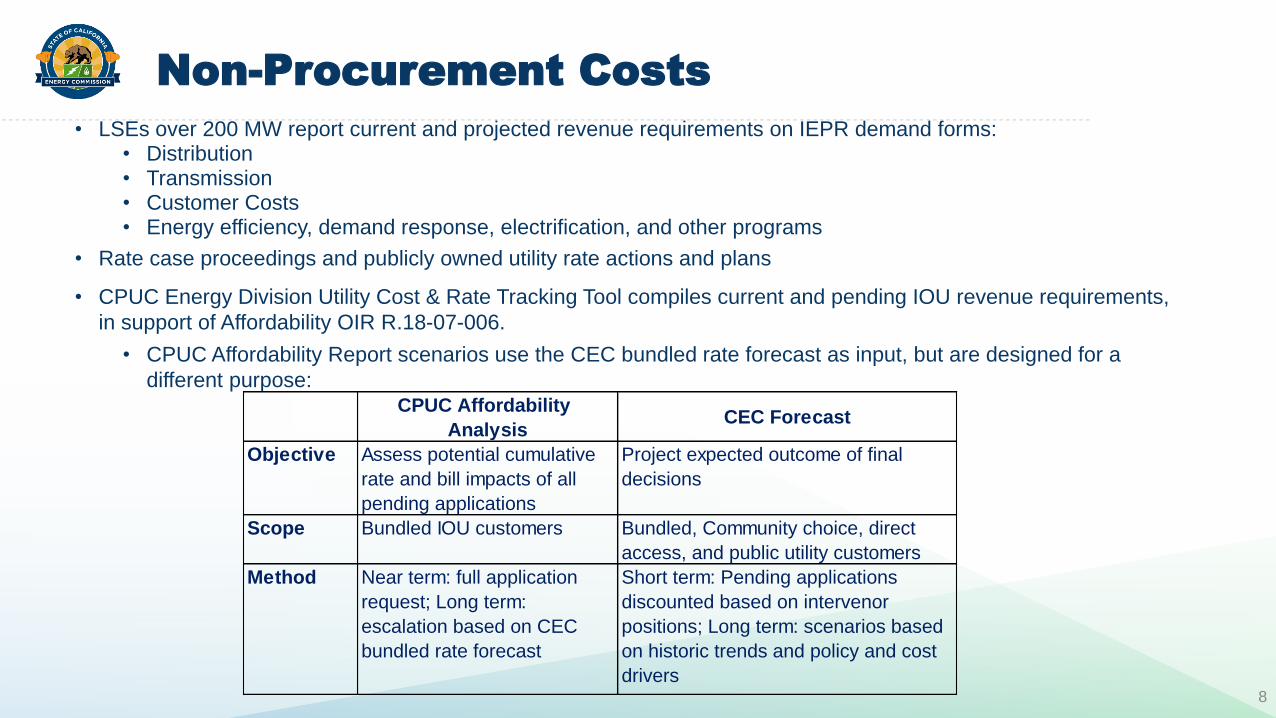
• LSEs over 200 MW report current and projected revenue requirements on IEPR demand forms:• Distribution• Transmission• Customer Costs• Energy efficiency, demand response, electrification, and other programs
• Rate case proceedings and publicly owned utility rate actions and plans
• CPUC Energy Division Utility Cost & Rate Tracking Tool compiles current and pending IOU revenue requirements,
in support of Affordability OIR R.18-07-006.
• CPUC Affordability Report scenarios use the CEC bundled rate forecast as input, but are designed for a
different purpose:CPUC Affordability
AnalysisCEC Forecast
Objective Assess potential cumulative
rate and bill impacts of all
pending applications
Project expected outcome of final
decisions
Scope Bundled IOU customers Bundled, Community choice, direct
access, and public utility customers
Method Near term: full application
request; Long term:
escalation based on CEC
bundled rate forecast
Short term: Pending applications
discounted based on intervenor
positions; Long term: scenarios based
on historic trends and policy and cost
drivers
Distribution Revenue Requirement Scenarios
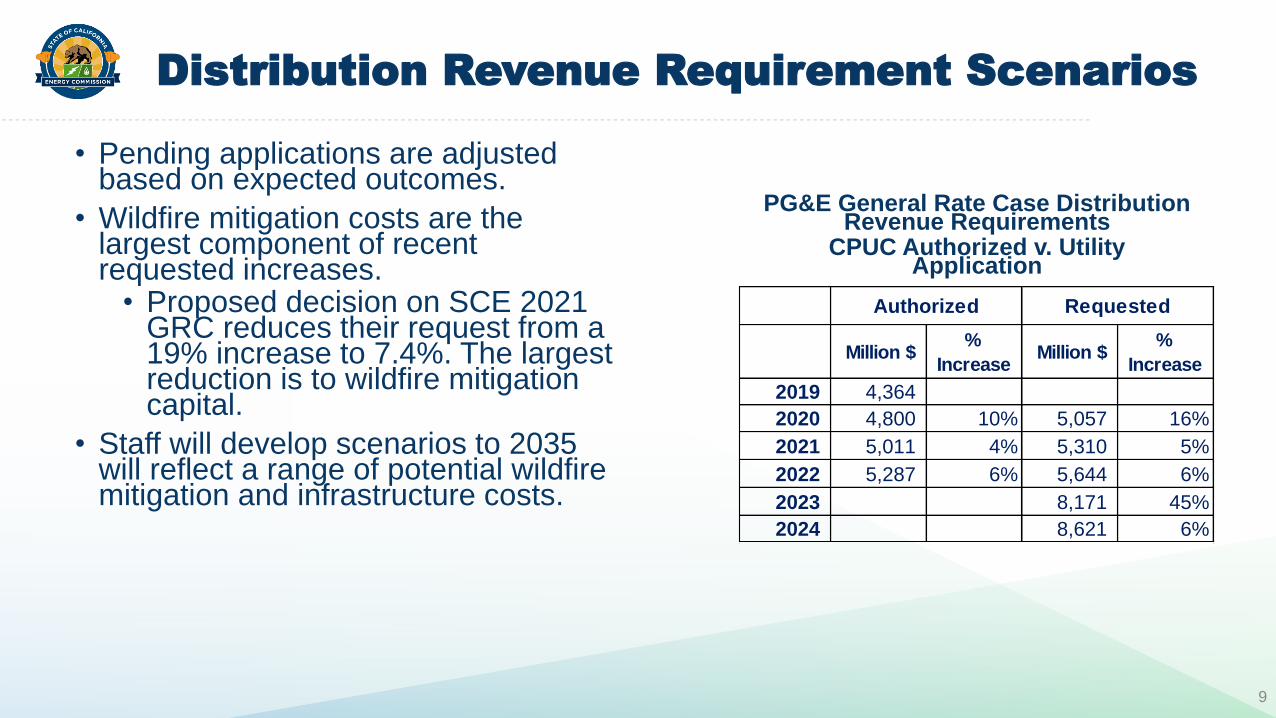
• Pending applications are adjusted based on expected outcomes.
• Wildfire mitigation costs are the largest component of recent requested increases.• Proposed decision on SCE 2021
GRC reduces their request from a 19% increase to 7.4%. The largest reduction is to wildfire mitigation capital.
• Staff will develop scenarios to 2035 will reflect a range of potential wildfire mitigation and infrastructure costs.
PG&E General Rate Case Distribution Revenue Requirements
CPUC Authorized v. Utility Application
Million $ %
Increase Million $
%
Increase
2019 4,364
2020 4,800 10% 5,057 16%
2021 5,011 4% 5,310 5%
2022 5,287 6% 5,644 6%
2023 8,171 45%
2024 8,621 6%
Authorized Requested
9
Related Documents