Temporal and spatial variability in δ(D,H 2 ): measurement time series from six EUROHYDROS stations Batenburg, A.M. , G. Pieterse, M. Krol, S. Walter, I. Levin, M. Schmidt, A. Jordan, S. Hammer, C. Yver, and T. Röckmann

Presentation overview
Jan 02, 2016
Temporal and spatial variability in δ (D,H 2 ) : measurement time series from six EUROHYDROS stations. Batenburg, A.M. , G. Pieterse, M. Krol, S. Walter, I. Levin, M. Schmidt, A. Jordan, S. Hammer, C. Yver, and T. Röckmann. Presentation overview. Introduction * Hydrogen - PowerPoint PPT Presentation
Welcome message from author
This document is posted to help you gain knowledge. Please leave a comment to let me know what you think about it! Share it to your friends and learn new things together.
Transcript

Temporal and spatial variability in δ(D,H2): measurement time series from six
EUROHYDROS stations
Batenburg, A.M., G. Pieterse, M. Krol, S. Walter, I. Levin, M. Schmidt, A. Jordan, S. Hammer, C. Yver, and T. Röckmann
Presentation overview
• Introduction* Hydrogen* Hydrogen isotopes* The EUROHYDOS network
•Results & Discussion* Station time series and cycles* Latitudinal gradient* Uptake processes
•Conclusions
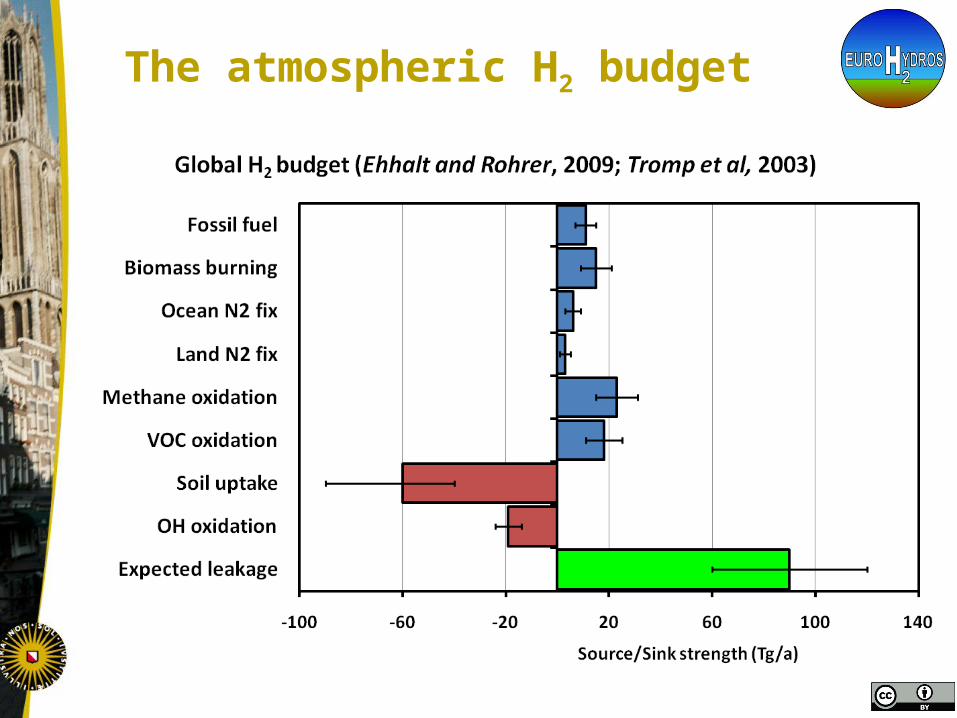
The atmospheric H2 budget

Effects of a Hydrogen Economy
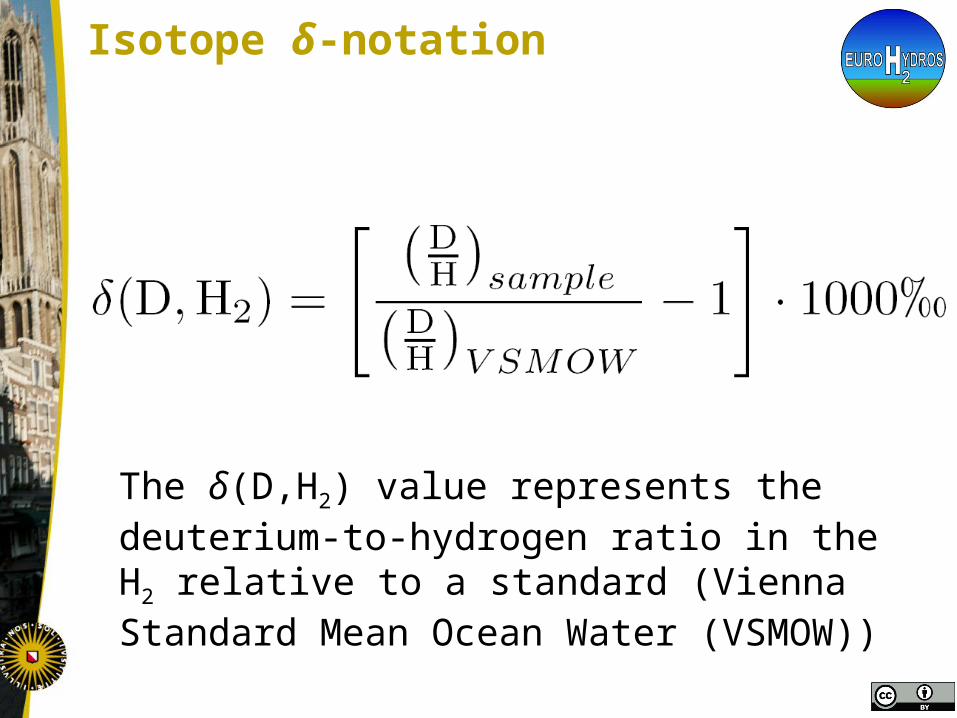
Isotope δ-notation
The δ(D,H2) value represents the deuterium-to-hydrogen ratio in the H2 relative to a standard (Vienna Standard Mean Ocean Water (VSMOW))

Isotopic source signatures
Isotopes can be used to gain information about different sources and sinks.

The EUROHYDROS network
Presentation overview
• Introduction* Hydrogen* Hydrogen isotopes* The EUROHYDOS network
•Results & Discussion* Station time series and cycles* Latitudinal gradient* Uptake processes
•Conclusions
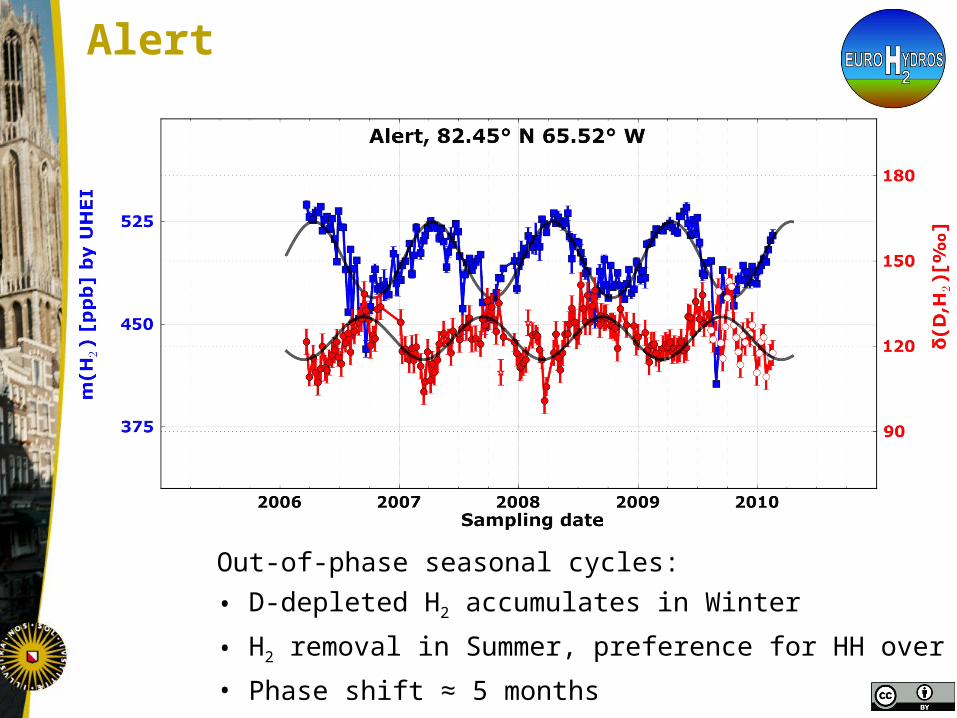
Alert
Out-of-phase seasonal cycles:
• D-depleted H2 accumulates in Winter
• H2 removal in Summer, preference for HH over HD
• Phase shift ≈ 5 months

Overview of the time series
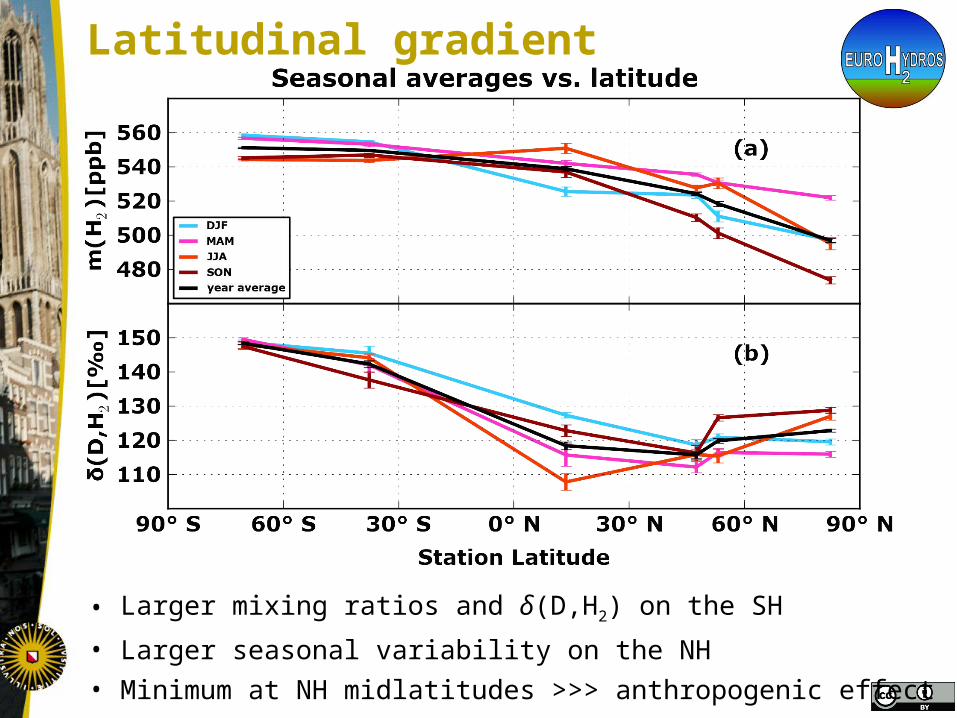
Latitudinal gradient
• Larger mixing ratios and δ(D,H2) on the SH
• Larger seasonal variability on the NH• Minimum at NH midlatitudes >>> anthropogenic effect

Sink processes
Rayleigh fractionation formula:
where m(H2,max) is the maximum mixing ratio, c a constant and α the fractionation factor:
with k the removal rate of the species
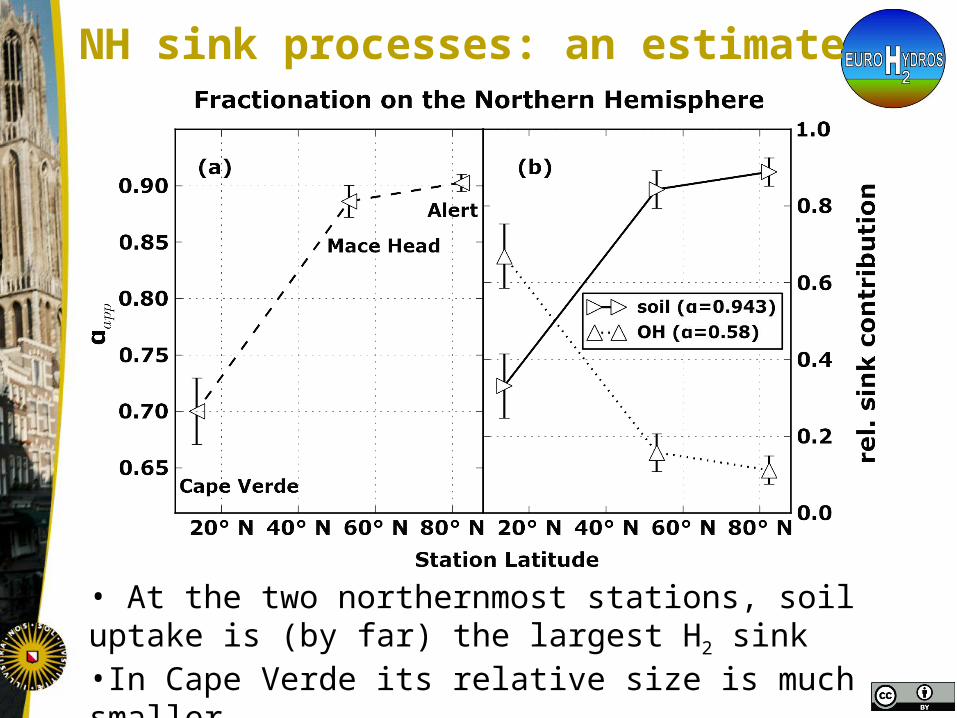
NH sink processes: an estimate
• At the two northernmost stations, soil uptake is (by far) the largest H2 sink•In Cape Verde its relative size is much smaller

Presentation overview
• Introduction* Hydrogen* Hydrogen isotopes* The EUROHYDOS network
•Results & Discussion* Station time series and cycles* Latitudinal gradient* Uptake processes
•Conclusions

Conclusions
Long records of δ(D,H2) have been collected for six globally distributed stations. These provide information on:
• Seasonal cycles of δ(D,H2)
•The latitudinal distribution of δ(D,H2)
•The sources and sinks of H2 that affect the stations

Questions?
More on these observations:• A. M. Batenburg, S. Walter, G. Pieterse, I. Levin,
M. Schmidt, A. Jordan, S. Hammer, C. Yver, and T. Röckmann, Temporal and spatial variability of the stable isotopic composition of atmospheric molecular hydrogen: observations at six EUROHYDROS stations, Atmos. Chem. Phys. Discuss., 11, 10087-10120, 2011, doi:10.5194/acpd-11-10087-2011
δ(D,H2) around the tropopause:
• Poster XY146, Today (session 3.12)
Related Documents


