Presentation on Results Q2 & H1 FY 2015-16 06 th November 2015 Proud to be part of the world’s most admired automotive brands

Welcome message from author
This document is posted to help you gain knowledge. Please leave a comment to let me know what you think about it! Share it to your friends and learn new things together.
Transcript

Presentation on Results Q2 & H1 FY 2015-16
06th November 2015
Proud to be part of the world’s most admired automotive brands

MSSL Presentation on Results Q2 & H1 FY15-16 2
• Highlights
• MSSL performance
• SMRPBV performance
• Debt status

MSSL Presentation on Results Q2 & H1 FY15-16
Highlights Consolidated
3
Q2 vs Q2
29%
EBITDA
14%
11% 15%
176% 53%
Total Sales
Sales (outside
India)
Sales (within India)
PBT PAT
H1 vs H1
MSSL: Motherson Sumi Systems Ltd; SMRP BV : Samvardhana Motherson Automotive Systems Group BV, SMR: Samvardhana Motherson Reflectec; SMP: Samvardhana Motherson Peguform
21%
EBITDA
13%
08% 14%
106% 36%
Total Sales
Sales (outside
India)
Sales (within India)
PBT PAT

MSSL Presentation on Results Q2 & H1 FY15-16
Highlights Standalone
4
MSSL: Motherson Sumi Systems Ltd; SMRP BV : Samvardhana Motherson Automotive Systems Group BV, SMR: Samvardhana Motherson Reflectec; SMP: Samvardhana Motherson Peguform
Q2 vs Q2 H1 vs H1
18%
EBITDA
09%
09% 07%
36% 38%
Total Sales
Sales (outside
India)
Sales (within India)
PBT PAT
10%
EBITDA
05%
06% 03%
40% 38%
Total Sales
Sales (outside
India)
Sales (within India)
PBT PAT
MSSL Presentation on Results Q2 & H1 FY15-16
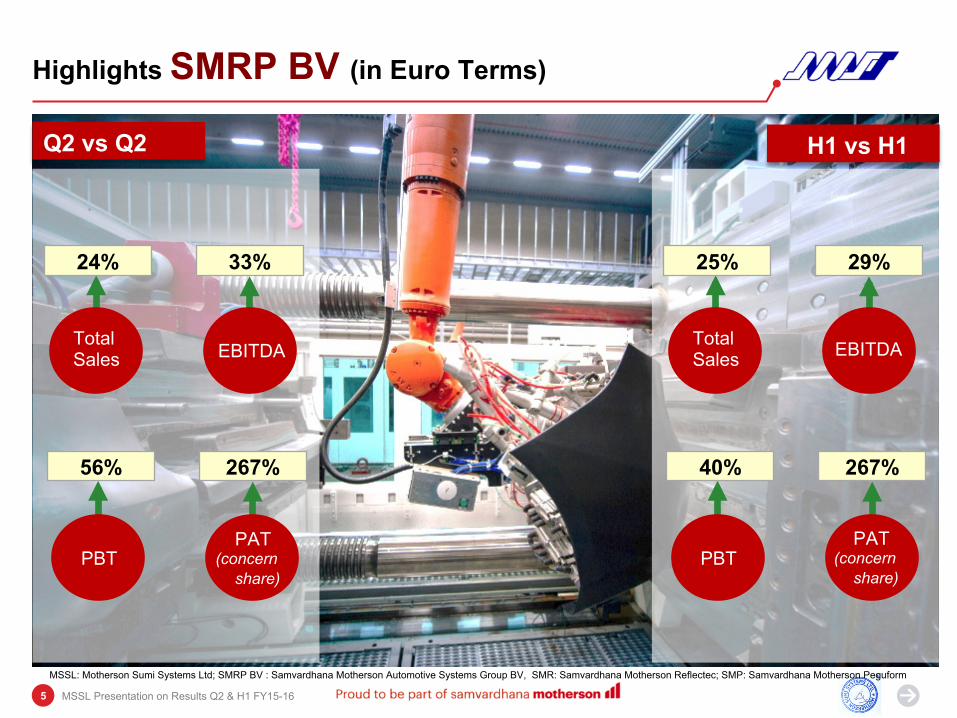
Highlights SMRP BV (in Euro Terms)
5
MSSL: Motherson Sumi Systems Ltd; SMRP BV : Samvardhana Motherson Automotive Systems Group BV, SMR: Samvardhana Motherson Reflectec; SMP: Samvardhana Motherson Peguform
Q2 vs Q2 H1 vs H1
33%
EBITDA
24%
267% 56%
Total Sales
PBT PAT
(concern share)
29%
EBITDA
25%
267% 40%
Total Sales
PBT PAT
(concern share)

MSSL Presentation on Results Q2 & H1 FY15-16
Highlights SMR & SMP (in Euro Terms)
6
MSSL: Motherson Sumi Systems Ltd; SMRP BV : Samvardhana Motherson Automotive Systems Group BV, SMR: Samvardhana Motherson Reflectec; SMP: Samvardhana Motherson Peguform
Q2 vs Q2 H1 vs H1
23%
EBITDA
14%
Sales
41%
EBITDA
31%
Sales
23%
EBITDA
19%
Sales
34%
EBITDA
28%
Sales

MSSL Presentation on Results Q2 & H1 FY15-16 7
• Highlights
• MSSL performance
• SMRPBV performance
• Debt status

MSSL Presentation on Results Q2 & H1 FY15-16
MSSL Consolidated : Q2 FY 2015-16 vs. Q2 FY 2014-15
(Rs. Crores) Q2 2014-15
Q2 2015-16
Exchange Loss / ( Gain ) on Long Term Facilities 15 39
Exceptional expenses - on Bond Issue and acquisition expenses 124 2
Notes :
1,333 1,479
6,589 7,558
7,922 9,037
-
2,000
4,000
6,000
8,000
10,000
Q2 FY 2014-15 Q2 FY 2015-16
Within India Outside India Total
724
935
9.1%
10.3%
0%
2%
4%
6%
8%
10%
12%
400
600
800
1,000
Q2 FY 2014-15 Q2 FY 2015-16
EBITDA % of Sales
396
605
104
287
-
100
200
300
400
500
600
700
Q2 FY 2014-15 Q2 FY 2015-16
PBT PAT
(Rs.
in C
rore
s)
(Rs.
in C
rore
s)
(Rs.
in C
rore
s)
{# concern share after exchange loss/(gain)exceptional expenses}
{* Before exchange loss/ (Gain) and exceptional expenses/(income)}
Sales EBITDA* / % to Sales PBT * & PAT#
8
14%
53%
176%
Currency (equal to Rs.)
Q2 2014-15
Q2 2015-16
% Change
EURO 80.26 72.38 -10%
Exchange rate for Euro
29%

MSSL Presentation on Results Q2 & H1 FY15-16
MSSL Standalone : Q2 FY 2015-16 vs. Q2 FY 2014-15
Notes :
(Rs.
in C
rore
s)
(Rs.
in C
rore
s)
(Rs.
in C
rore
s)
Sales EBITDA* / % to Sales
232 273
18.6% 20.1%
0%
4%
8%
12%
16%
20%
24%
50
100
150
200
250
300
Q2 FY 2014-15 Q2 FY 2015-16 EBITDA % of Sales
208
287
145
197
-
50
100
150
200
250
300
350
Q2 FY 2014-15 Q2 FY 2015-16 PBT PAT
1,057 1,156
190 203
1,247 1,359
-
300
600
900
1,200
1,500
Q2 FY 2014-15 Q2 FY 2015-16 Domestic Exports
(Rs. Crores) Q2 2014-15
Q2 2015-16
Exchange Loss / ( Gain ) on Long Term Facilities 13 13
Dividend Income 40 68
9
9% 18% 38%
{* Before exchange loss/ (Gain) and exceptional expenses/(income)} {# Before exchange loss/(Gain), exceptional expense/(income), including gain on sales of investment in JV and redemption of preference share and dividend income
36%
Average Q2 2014-15
Q2 2015-16
% Change
LME Copper (USD / Ton ) 6,993 5,251 -25%
INR to Euro 80.16 72.38 -10%
INR to YEN 0.583 0.532 -9%
Copper rate & exchange rates considered
PBT * & PAT#

MSSL Presentation on Results Q2 & H1 FY15-16
MSSL Consolidated : H1 FY 2015-16 vs. H1 FY 2014-15
(Rs. Crores) H1 2014-15
H1 2015-16
Exchange Loss / ( Gain ) on Long Term Facilities 26 47
Exceptional expenses- on Bond Issue and acquisition expenses 170 27
Gain on sale of investment in JV - 22
Notes :
2,581 2,783
13,638 15,506
16,219 18,289
-
2,000
4,000
6,000
8,000
10,000
12,000
14,000
16,000
18,000
20,000
H1 FY 2014-15 H1 FY 2015-16
Within India Outside India Total
1,462 1,776
9.0% 9.7%
400
600
800
1,000
1,200
1,400
1,600
1,800
2,000
H1 FY 2014-15 H1 FY 2015-16
EBITDA % of Sales
858
1,168
268 553
-
300
600
900
1,200
1,500
H1 FY 2014-15 H1 FY 2015-16
PBT PAT
(Rs.
in C
rore
s)
(Rs.
in C
rore
s)
(Rs.
in C
rore
s)
{* Before exchange loss/ (Gain) and exceptional expenses/(income)}
Sales EBITDA* / % to Sales
10
21% 36%
106%
{# Before exchange loss/(Gain), exceptional expense/(income), including gain on sales of investment in JV and redemption of preference share and dividend income
Exchange rate for Euro
Currency (equal to Rs.)
H1 2014-15
H1 2015-16
% Change
EURO 81.15 71.25 -12 %
13%
PBT * & PAT#

MSSL Presentation on Results Q2 & H1 FY15-16
MSSL Standalone : H1 FY 2015-16 vs. H1 FY 2014-15 (R
s. in
Cro
res)
(Rs.
in C
rore
s)
(Rs.
in C
rore
s)
{* Before exchange loss/ (Gain) and exceptional expenses/(income)}
Sales EBITDA* / % to Sales
450 494
18.4% 19.2%
50
100
150
200
250
300
350
400
450
500
550
H1 FY 2014-15 H1 FY 2015-16 EBITDA % of Sales
373
513
255 356
-
100
200
300
400
500
600
H1 FY 2014-15 H1 FY 2015-16 PBT PAT
2,060 2,174
388 401 2,448 2,575
-
500
1,000
1,500
2,000
2,500
3,000
H1 FY 2014-15 H1 FY 2015-16 Domestic Exports
(Rs. Crores) H1 2014-15
H1 2015-16
Exchange Loss / ( Gain ) on Long Term Facilities 16 20
Gain on sale of JV - 36
Gain on redemption of preference share - 9
Dividend Income 40 77
11
10% 38% 40%
{# Before exchange loss/(Gain), exceptional expense/(income), including gain on sales of investment in JV and redemption of preference share and dividend income
Notes :
PBT * & PAT#
5%
Average H1 2014-15
H1 2015-16
% Change
LME Copper (USD / Ton ) 6,890 5,653 -18%
INR to Euro 81.15 71.25 -12%
INR to YEN 0.584 0.527 -10%
Copper rate & exchange rates considered

MSSL Presentation on Results Q2 & H1 FY15-16 12
• Highlights
• MSSL performance
• SMRPBV performance
• Debt status

MSSL Presentation on Results Q2 & H1 FY15-16
SMRPBV : Q2 FY 2015-16 vs. Q2 FY 2014-15 (In Euro Terms**)
Notes :
(In M
illio
n Eu
ro)
(In M
illio
n Eu
ro)
(In M
illio
n Eu
ro)
{* Before exchange loss/ (Gain) and excep8onal expenses/(income)}
Sales EBITDA* / % to Sales
(In Million Euro) Q2 2014-15
Q2 2015-16
Exceptional expenses towards bonds issuance 11 0
Exchange Loss / (Gain) on Long Term Facilities
0 4
{# concern share}
55
73
7.2% 7.7%
0%
2%
4%
6%
8%
-
20
40
60
80
Q2 FY 2014-15 Q2 FY 2015-16 EBITDA % of Sales
12 16
745 926
757
942
-
200.00
400.00
600.00
800.00
1,000.00
1,200.00
Q2 FY 2014-15 Q2 FY 2015-16 Within India Outside India Total
25
39
3
11
-
10
20
30
40
50
Q2 FY 2014-15 Q2 FY 2015-16 PBT PAT- Concern Share
13
** Please refer to Note on last slide.
267%
Rs.6,067 Cr Rs.6,820 Cr Rs.438 Cr Rs.525 Cr Rs.202 Cr Rs.279 Cr
Rs.20 Cr
Rs.76 Cr
24%
PBT * & PAT#
33%
56%

MSSL Presentation on Results Q2 & H1 FY15-16
SMR : Q2 FY 2015-16 vs. Q2 FY 2014-15 (In Euro Terms**)
Sales EBITDA* / % to Sales
26 32
9.0% 9.6%
-
10
20
30
40
Q2 FY 2014-15 Q2 FY 2015-16 EBITDA % of Sales
12 16
281 319
293 335
-
50
100
150
200
250
300
350
400
Q2 FY 2014-15 Q2 FY 2015-16
Within India Outside India Total
*At exchange rate used for translation
Sales
14%
EBITDA
23%
14
(in M
illio
n Eu
ro)
Rs. 2,348 cr. Rs. 2,424 cr. Rs. 214 cr. Rs. 232 cr.
(in M
illio
n Eu
ro)
** Please refer to Note on last slide.

MSSL Presentation on Results Q2 & H1 FY15-16
SMP : Q2 FY 2015-16 vs. Q2 FY 2014-15 (In Euro Terms**)
Sales EBITDA* / % to Sales
(in M
illio
n Eu
ro)
(in M
illio
n Eu
ro)
*At exchange rate used for translation Sales
31%
EBITDA
41%
464 608
-
200
400
600
800
Q2 FY 2014-15 Q2 FY 2015-16
Rs. 3,719 cr.
29 41
6.3% 6.7%
-
5
10
15
20
25
30
35
40
45
50
Q2 FY 2014-15 Q2 FY 2015-16 EBITDA % of Sales
Rs. 4,399 cr. Rs. 224 cr. Rs. 295 cr.
15
** Please refer to Note on last slide.

MSSL Presentation on Results Q2 & H1 FY15-16
SMRPBV : H1 FY 2015-16 vs. H1 FY 2014-15 (In Euro Terms**)
Notes :
(In M
illio
n Eu
ro)
(In M
illio
n Eu
ro)
(In M
illio
n Eu
ro)
{* Before exchange loss/ (Gain) and excep8onal expenses/(income)}
Sales EBITDA* / % to Sales
(In Million Euro) H1 2014-15
H1 2015-16
Exceptional expenses towards bonds issuance 16 4
Exchange Loss / (Gain) on Long Term Facilities
1 4
{# concern share}
22 28
1,560 1,945
1,582
1,973
-
400.00
800.00
1,200.00
1,600.00
2,000.00
2,400.00
H1 FY 2014-15 H1 FY 2015-16 Within India Outside India Total
58
81
6
22
-
25
50
75
100
H1 FY 2014-15 H1 FY 2015-16 PBT PAT- Concern Share
Rs.1,041 cr. Rs.919 cr. Rs.12,842 cr. Rs. 14,059 cr. Rs.577 cr.
Rs.464 cr.
Rs.49 cr.
Rs.158 cr.
16
25% 29% 267%
** Please refer to Note on last slide.
PBT * & PAT#
113 146
7.2% 7.4%
-
40
80
120
160
H1 FY 2014-15 H1 FY 2015-16 EBITDA % of Sales
40%

MSSL Presentation on Results Q2 & H1 FY15-16
SMR : H1 FY 2015-16 vs. H1 FY 2014-15 (In Euro Terms**)
Sales EBITDA* / % to Sales
53 65
9.0% 9.3%
-
10
20
30
40
50
60
70
H1 FY 2014-15 H1 FY 2015-16 EBITDA % of Sales
22 28
565 672
587 700
-
100
200
300
400
500
600
700
800
H1 FY 2014-15 H1 FY 2015-16
Within India Outside India Total
*At exchange rate used for translation
Sales
19%
EBITDA
17
(in M
illio
n Eu
ro)
Rs. 4,766 cr. Rs.4,989 cr. Rs. 429 cr. Rs. 462 cr.
(in M
illio
n Eu
ro)
** Please refer to Note on last slide.
23%

MSSL Presentation on Results Q2 & H1 FY15-16
SMP : H1 FY 2015-16 vs. H1 FY 2014-15 (In Euro Terms**)
Sales EBITDA* / % to Sales
(in M
illio
n Eu
ro)
(in M
illio
n Eu
ro)
*At exchange rate used for translation Sales
28%
EBITDA
34%
995 1,274
-
200
400
600
800
1,000
1,200
1,400
H1 FY 2014-15 H1 FY 2015-16
Rs. 8,076 cr.
61 82
6.1% 6.4%
-
15
30
45
60
75
90
H1 FY 2014-15 H1 FY 2015-16 EBITDA % of Sales
Rs. 9,077 cr. Rs. 496 cr. Rs. 586 cr.
18
** Please refer to Note on last slide.

MSSL Presentation on Results Q2 & H1 FY15-16 19
• Highlights
• MSSL performance
• SMRPBV performance
• Debt status

MSSL Presentation on Results Q2 & H1 FY15-16
Debt status
20
Net Debt
Exchange rate used
Rs/Euro
Rs/USD
31.03.2015
67.06
62.50
30.06.2015
70.86
63.64
30.09.2015
73.30
65.58
(Rs. In crores)
387 275 303
3,241 3,794
4,566
31.03.2015 30.06.2015 30.09.2015
Standalone Consolidated
223
209
220
Debt due within 1 year

MSSL Presentation on Results Q2 & H1 FY15-16
Safe harbour & Note
Thank you
21
Safe harbour
This presentation contains forward-looking statements based on the currently held beliefs and assumptions of the management of the Company, which are expressed in good faith and, in their opinion, reasonable. Forward-looking statements involve known and unknown risks, uncertainties and other factors, which may cause the actual results, financial condition, performance, or achievements of the Company or industry results, to differ materially from the results, financial condition, performance or achievements expressed or implied by such forward-looking statements. Given these risks, uncertainties and other factors, recipients of this presentation are cautioned not to place undue reliance on these forward-looking statements. The Company disclaims any obligation to update these forward-looking statements to reflect future events or developments.
Note :
**SMRPBV, parent company for SMR & SMP prepares financial statements in Euro currency, hence comparative data is given in Euro terms. These results are consolidated in MSSL by using average year to-date exchange rates. The corresponding figures in Rupee terms have also been stated.
Related Documents