Presentation of clinical epidemiology study result Aug 8, 2017 Hirohide Yokokawa, M.D., Ph.D. Department of General Medicine, Juntendo University School of Medicine

Welcome message from author
This document is posted to help you gain knowledge. Please leave a comment to let me know what you think about it! Share it to your friends and learn new things together.
Transcript

Presentation of clinical epidemiology study result
Aug 8, 2017
Hirohide Yokokawa, M.D., Ph.D.Department of General Medicine,
Juntendo University School of Medicine
Steps of data analysis.
Presentation of analyzed data.
Implications of results.
Contents
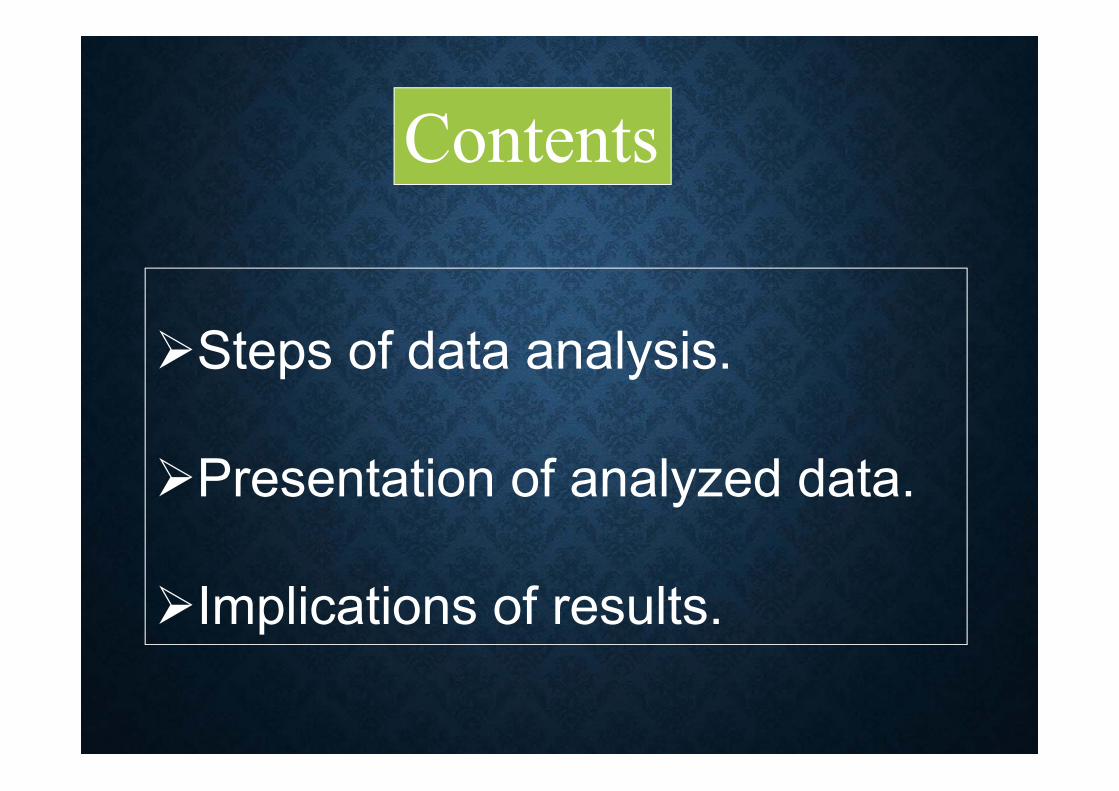
Steps of clinical epidemiology
Descriptive study(To know distribution and characteristics)
Analytic study(To know associations)
Intervention study(To know effectiveness)
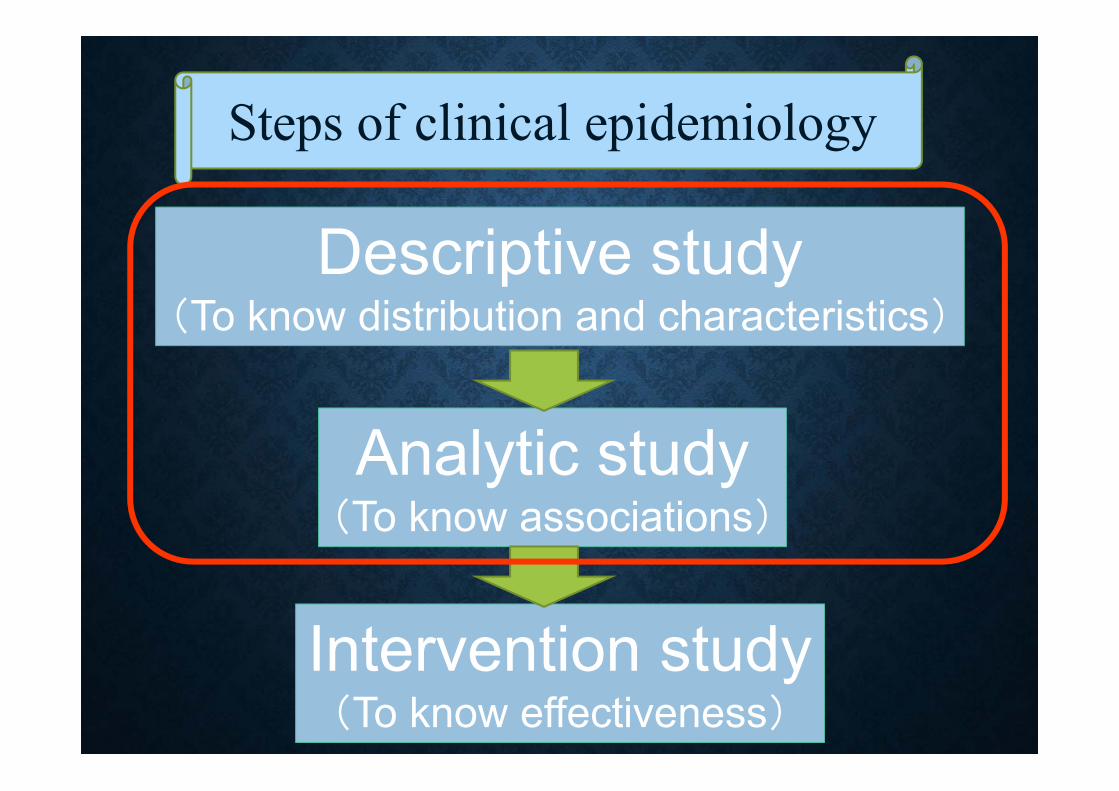
Descriptive study
Checking distribution and characteristics of the participants: To know the distribution and characteristics may lead adequate advanced analysis.
Checking errors: Data errors may be corrected before main analysis.
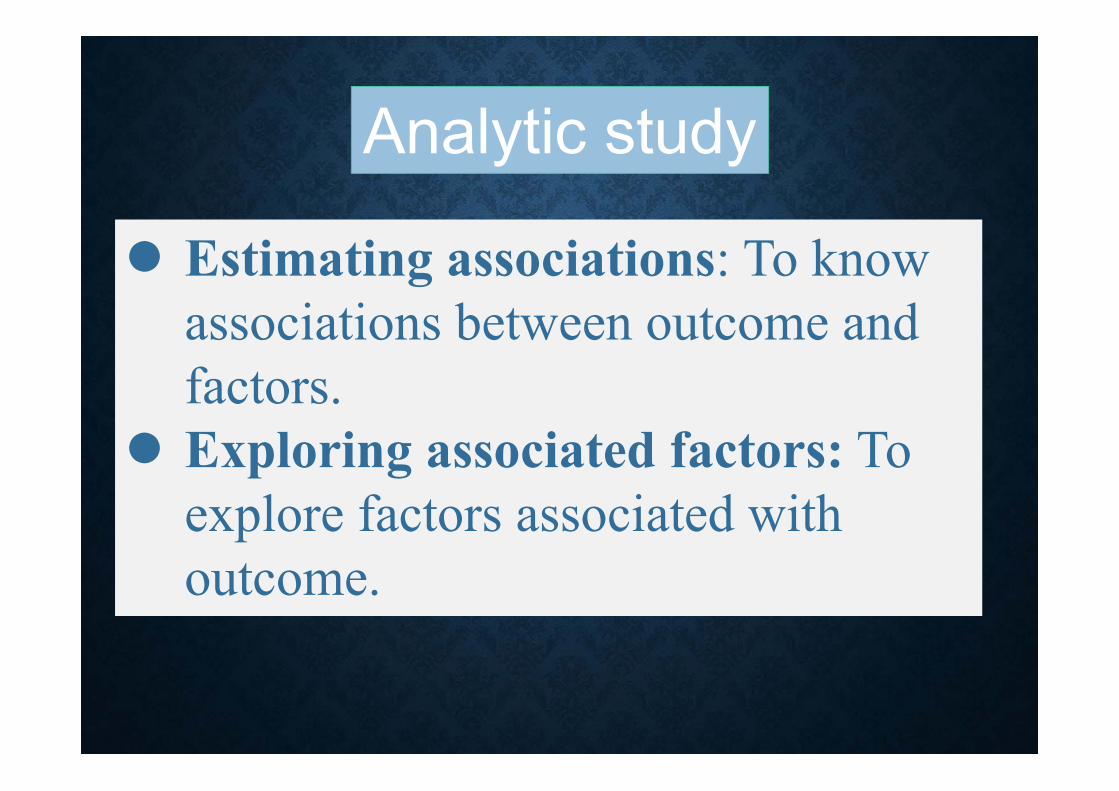
Analytic study
Estimating associations: To know associations between outcome and factors.
Exploring associated factors: To explore factors associated with outcome.
Important reminder to interpret the statistical significance.
No SBP SBP
1 A 108 B 112
2 A 119 B 141
3 A 116 B 105
4 A 103 B 125
5 A 132 B 101
6 A 97 B 126
7 A 111 B 130
8 A 114 B 143
9 A 124 B 115
10 A 124 B 94
11 A 114 B 93
12 A 118 B 117
13 A 127 B 99
14 A 125 B 108
15 A 136 B 135
16 A 120 B 108
17 A 94 B 119
18 A 105 B 135
19 A 108 B 119
20 A 115 B 135
21 A 135 B 131
22 A 114 B 128
23 A 130 B 95
24 A 134 B 152
25 A 121 B 120
26 A 97 B 114
27 A 129 B 136
28 A 135 B 162
29 A 124 B 140
30 A 136 B 121
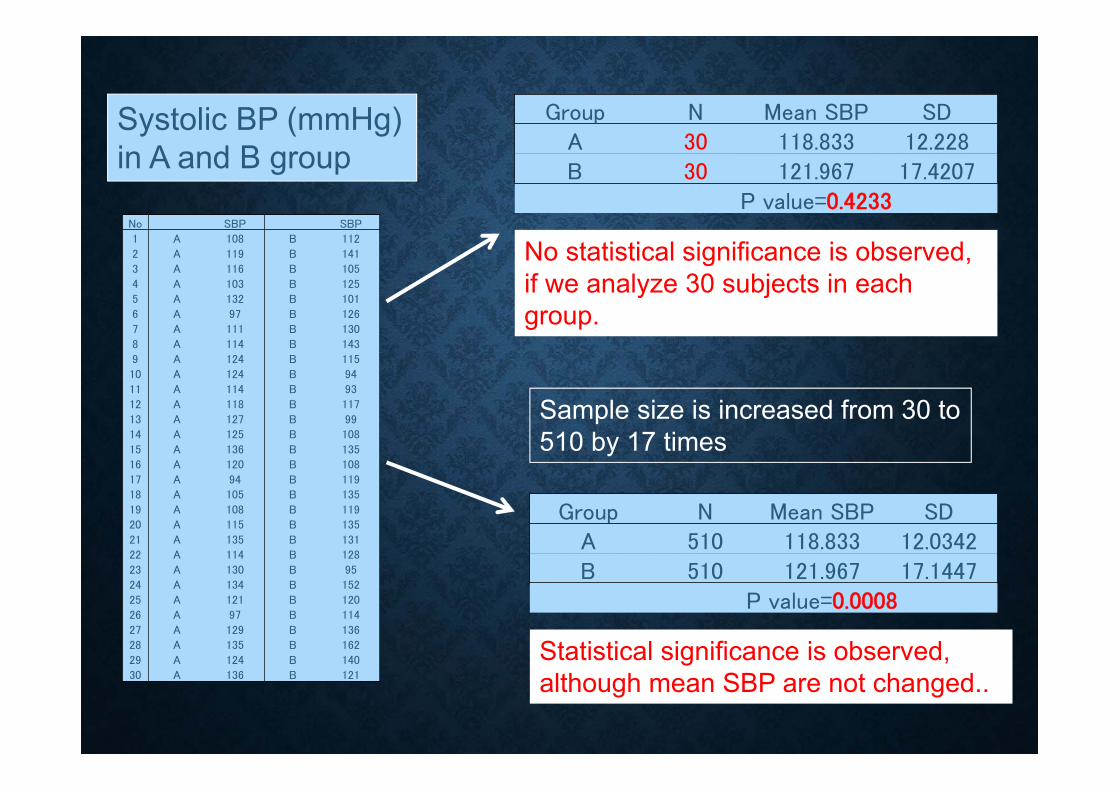
Group N Mean SBP SDA 30 118.833 12.228B 30 121.967 17.4207
P value=0.4233
Group N Mean SBP SDA 510 118.833 12.0342B 510 121.967 17.1447
P value=0.0008
Sample size is increased from 30 to 510 by 17 times
Systolic BP (mmHg) in A and B group
No statistical significance is observed, if we analyze 30 subjects in each group.
Statistical significance is observed, although mean SBP are not changed..
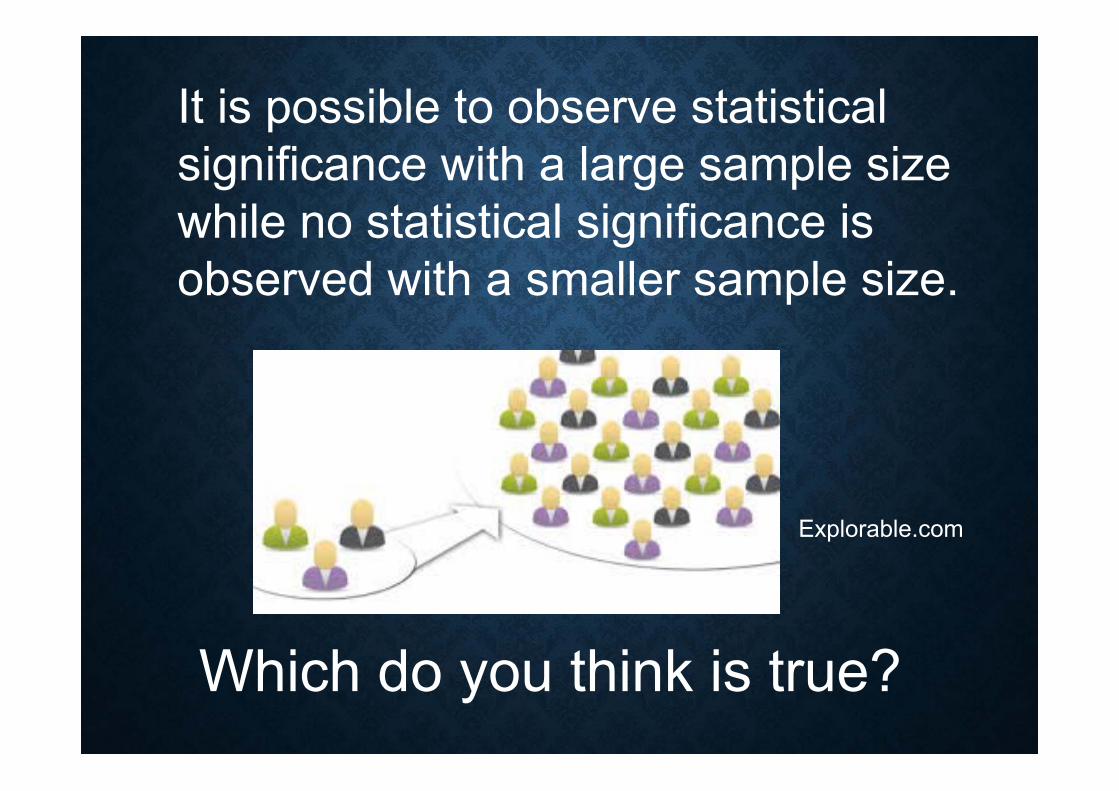
Explorable.com
It is possible to observe statistical significance with a large sample size while no statistical significance is observed with a smaller sample size.
Which do you think is true?
Which do you think is true: statistical significance with a large sample size or no statistical significance with a small sample size?
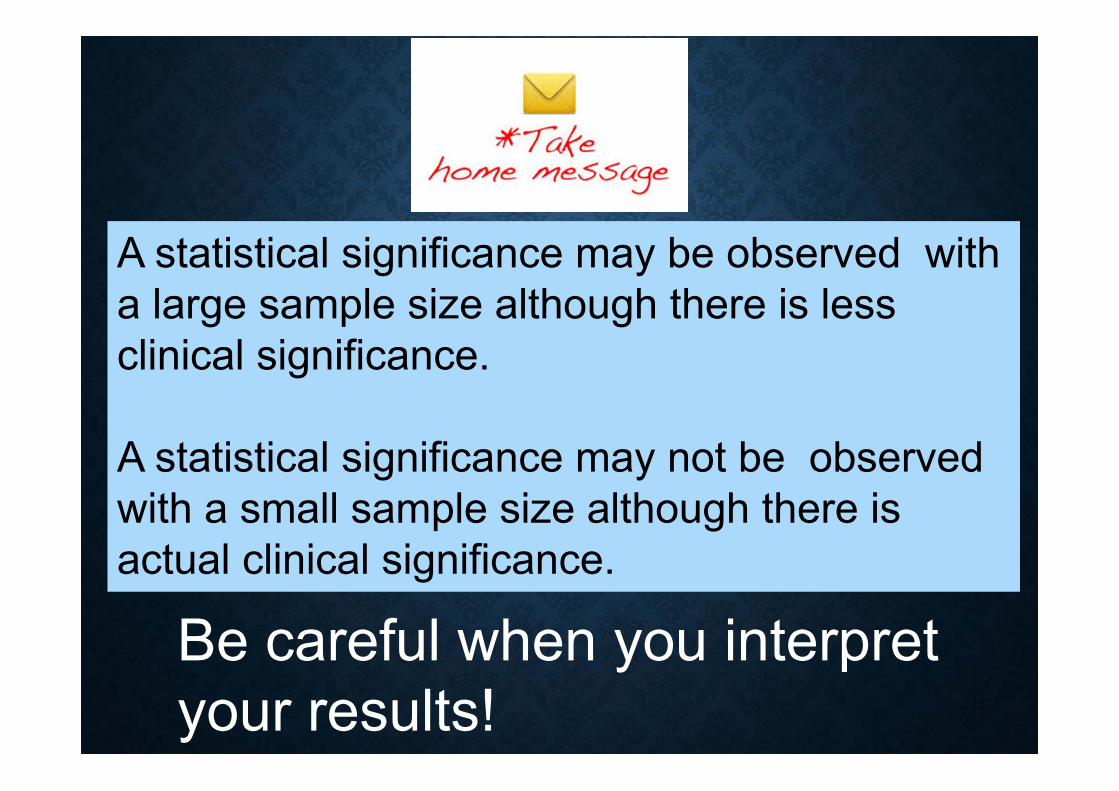
A statistical significance may be observed with a large sample size although there is less clinical significance.
A statistical significance may not be observed with a small sample size although there is actual clinical significance.
Be careful when you interpret your results!
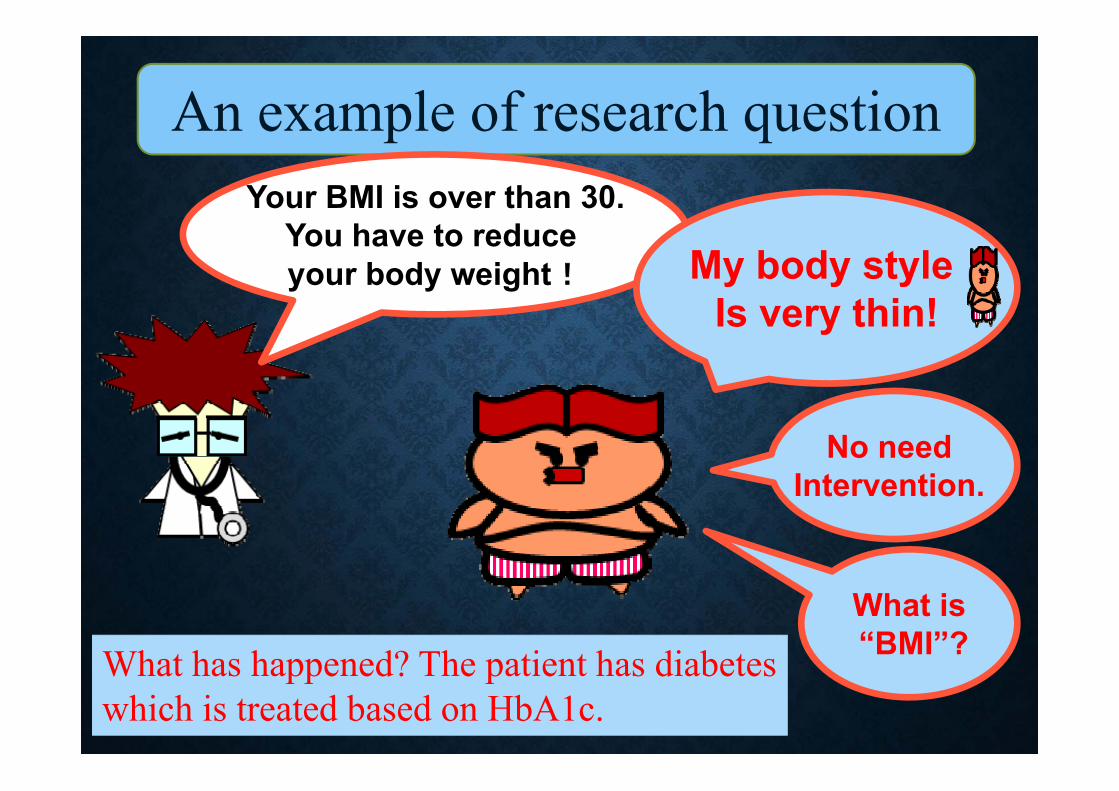
An example of research question Your BMI is over than 30.
You have to reduce your body weight! My body style
Is very thin!
No need Intervention.
What is“BMI”?What has happened? The patient has diabetes
which is treated based on HbA1c.
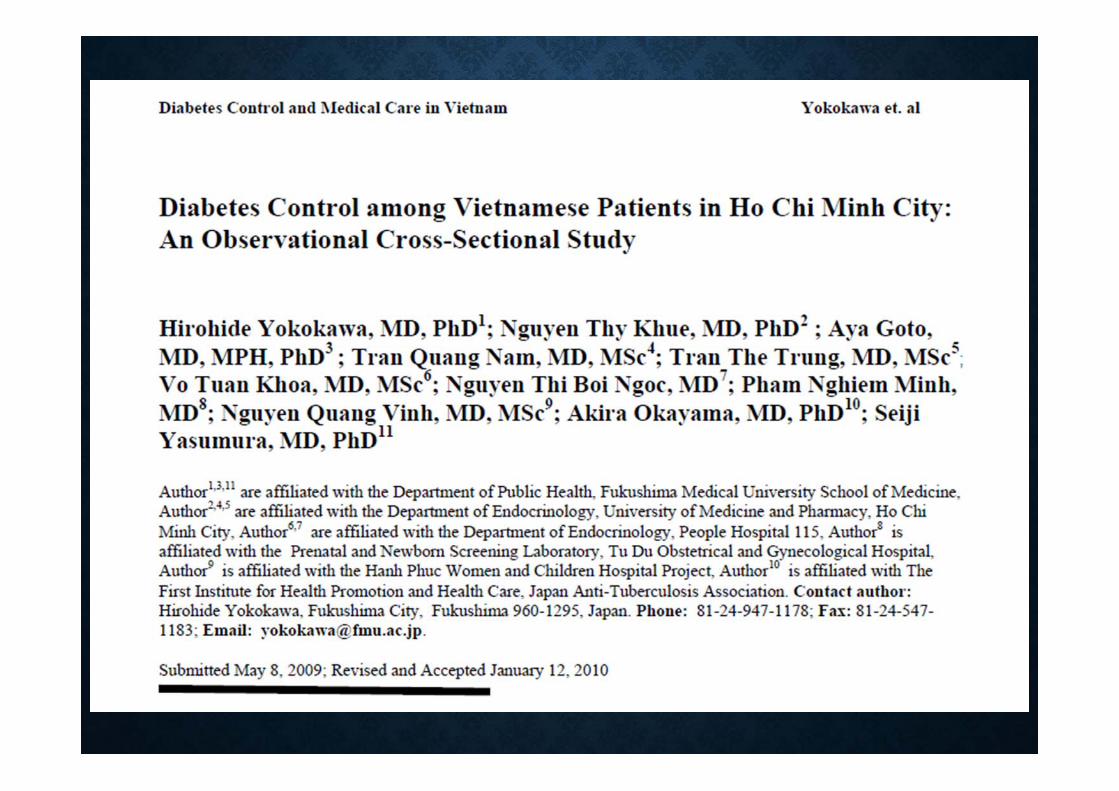
Investigators of the study
University of Medicine and Pharmacy, Ho Chi Minh City
Nguyen Thy Khue, MD,PhD Tran The Trung, MD, MSc Tram Quang Nam, MD, MSc
People Hospital115 Medic Center
Nguyen Thy Khue, MD, PhD Tran Viet Thang, MDDo Hoang Oanh , MD
Tram Quang Nam, MD, MScVo Tuan Khoa, MD, MSc Nguyen Thi Boi Ngoc, MD
Fukushima Medical University School of Medicine
Hirohide Yokokawa, MD, PhD Aya Goto, MD, MPH, PhD Seiji Yasumura, MD, PhD
Nguyen Quang Vinh, MD, MSc (Special adviser)Pham Nghiem Minh, MD (Data management)
Akira Okayama, MD, PhD (Special adviser)
This research was foundedby
Health Promotion Foundation

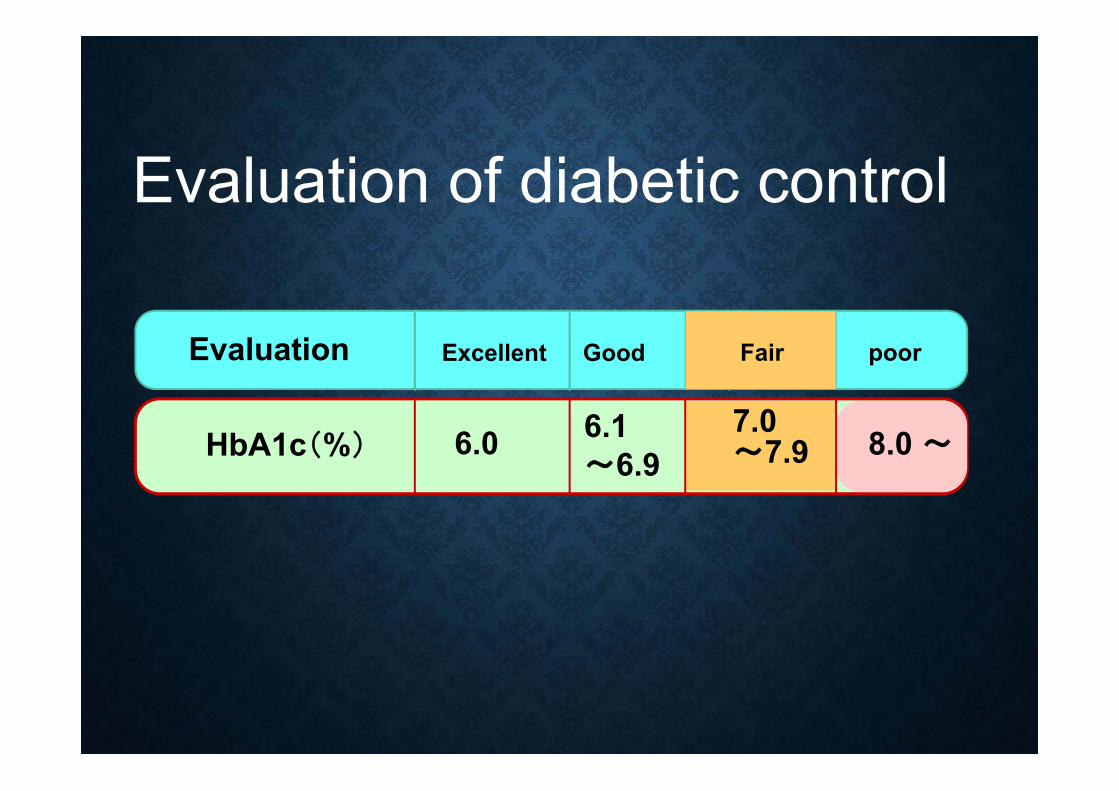
Evaluation of diabetic control
HbA1c(%) 6.0 6.1~6.9 8.0 ~7.0
~7.9
Evaluation Excellent Good poorFair
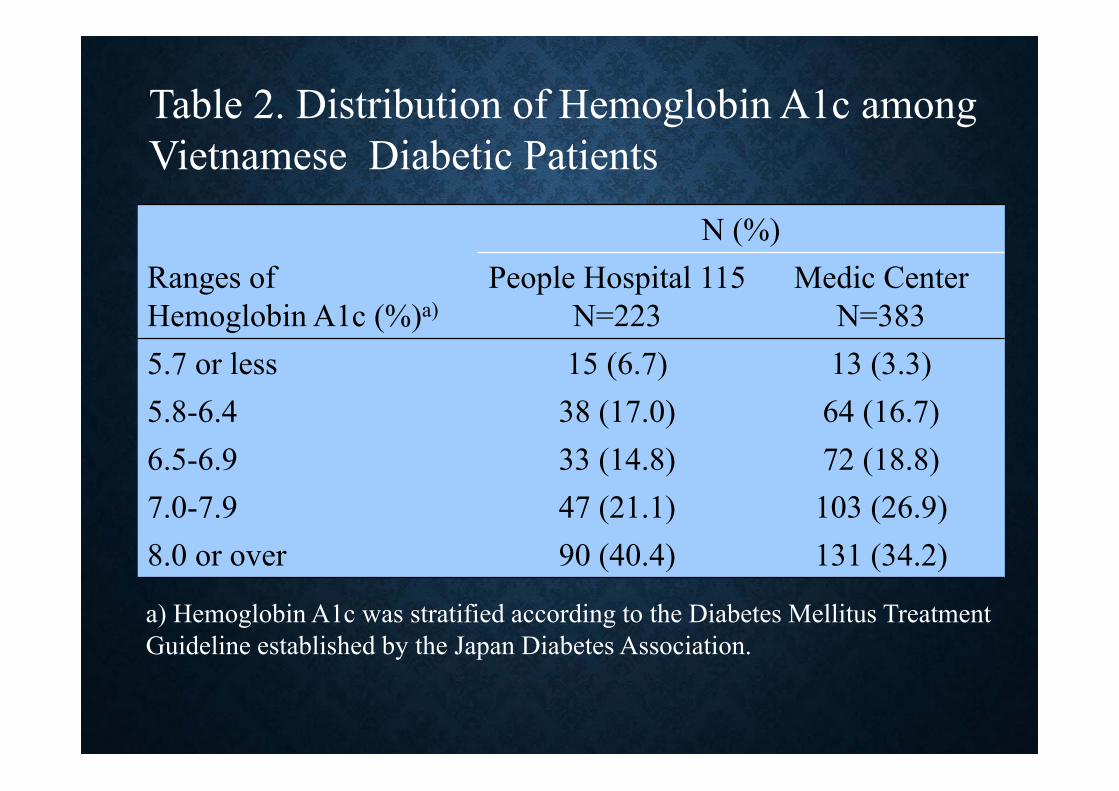
Table 2. Distribution of Hemoglobin A1c among Vietnamese Diabetic Patients
N (%)Ranges of Hemoglobin A1c (%)a)
People Hospital 115N=223
Medic CenterN=383
5.7 or less 15 (6.7) 13 (3.3)5.8-6.4 38 (17.0) 64 (16.7)6.5-6.9 33 (14.8) 72 (18.8)7.0-7.9 47 (21.1) 103 (26.9)8.0 or over 90 (40.4) 131 (34.2)
a) Hemoglobin A1c was stratified according to the Diabetes Mellitus Treatment Guideline established by the Japan Diabetes Association.
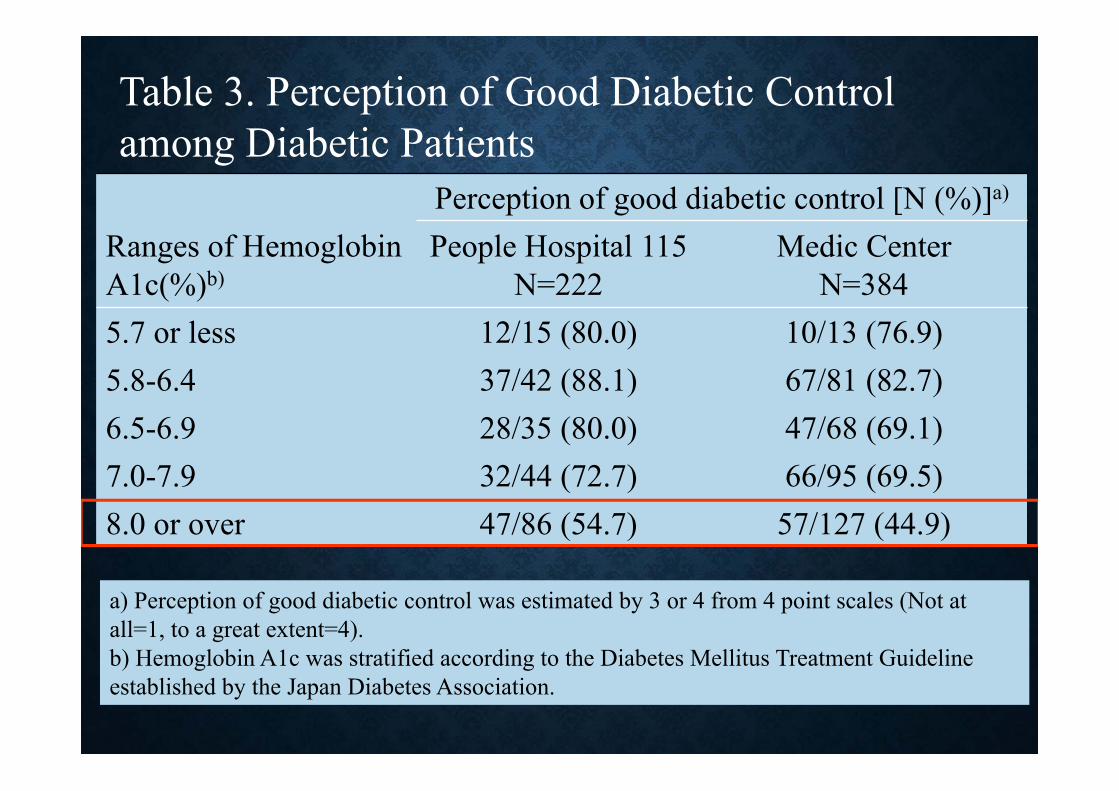
Table 3. Perception of Good Diabetic Control among Diabetic Patients
Perception of good diabetic control [N (%)]a)
Ranges of Hemoglobin A1c(%)b)
People Hospital 115N=222
Medic CenterN=384
5.7 or less 12/15 (80.0) 10/13 (76.9)5.8-6.4 37/42 (88.1) 67/81 (82.7)6.5-6.9 28/35 (80.0) 47/68 (69.1)7.0-7.9 32/44 (72.7) 66/95 (69.5)8.0 or over 47/86 (54.7) 57/127 (44.9)
a) Perception of good diabetic control was estimated by 3 or 4 from 4 point scales (Not at all=1, to a great extent=4).b) Hemoglobin A1c was stratified according to the Diabetes Mellitus Treatment Guideline established by the Japan Diabetes Association.
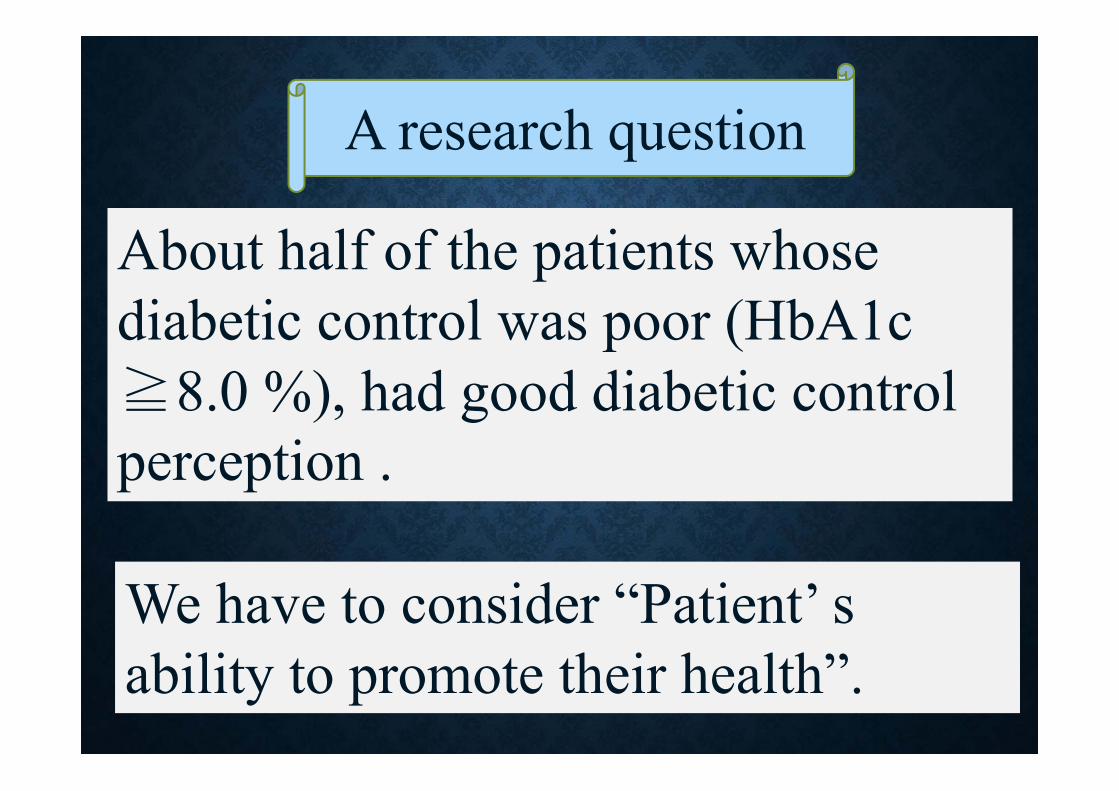
A research question
About half of the patients whose diabetic control was poor (HbA1c ≧8.0 %), had good diabetic control perception .
We have to consider “Patient’ s ability to promote their health”.
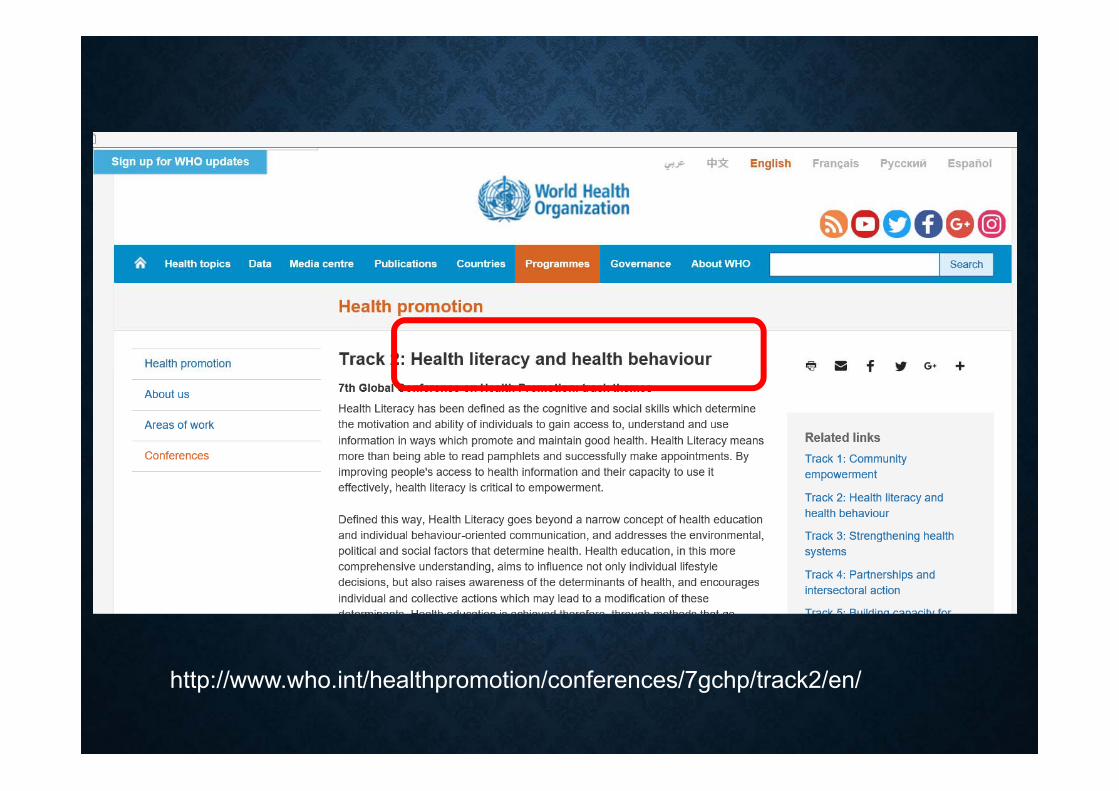
http://www.who.int/healthpromotion/conferences/7gchp/track2/en/
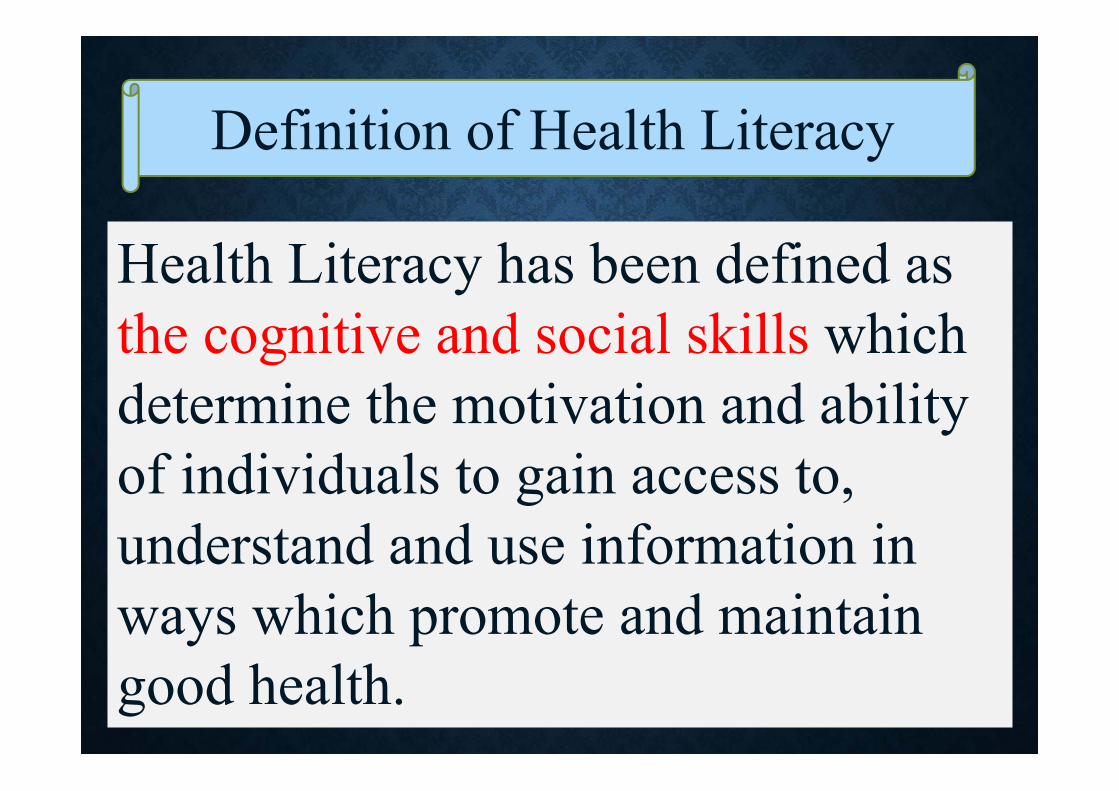
Health Literacy has been defined as the cognitive and social skills which determine the motivation and ability of individuals to gain access to, understand and use information in ways which promote and maintain good health.
Definition of Health Literacy
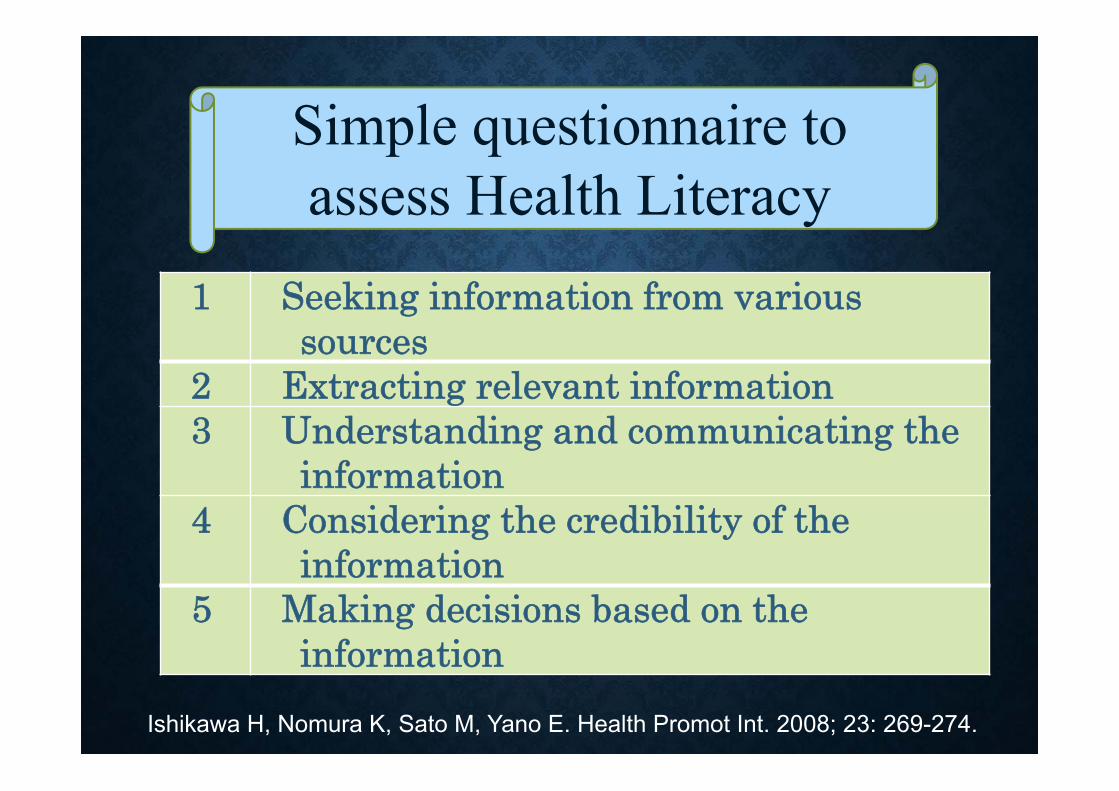
Simple questionnaire to assess Health Literacy
1 Seeking information from various sources
2 Extracting relevant information 3 Understanding and communicating the
information4 Considering the credibility of the
information5 Making decisions based on the
informationIshikawa H, Nomura K, Sato M, Yano E. Health Promot Int. 2008; 23: 269-274.
How to present distribution and characteristics? The first Table (Table 1) usually shows
distribution and characteristics.
As representative values, mean (standard deviation) for parametric data, median (minimum, maximum) for non-parametric data, percentage for categorical data are usually used.
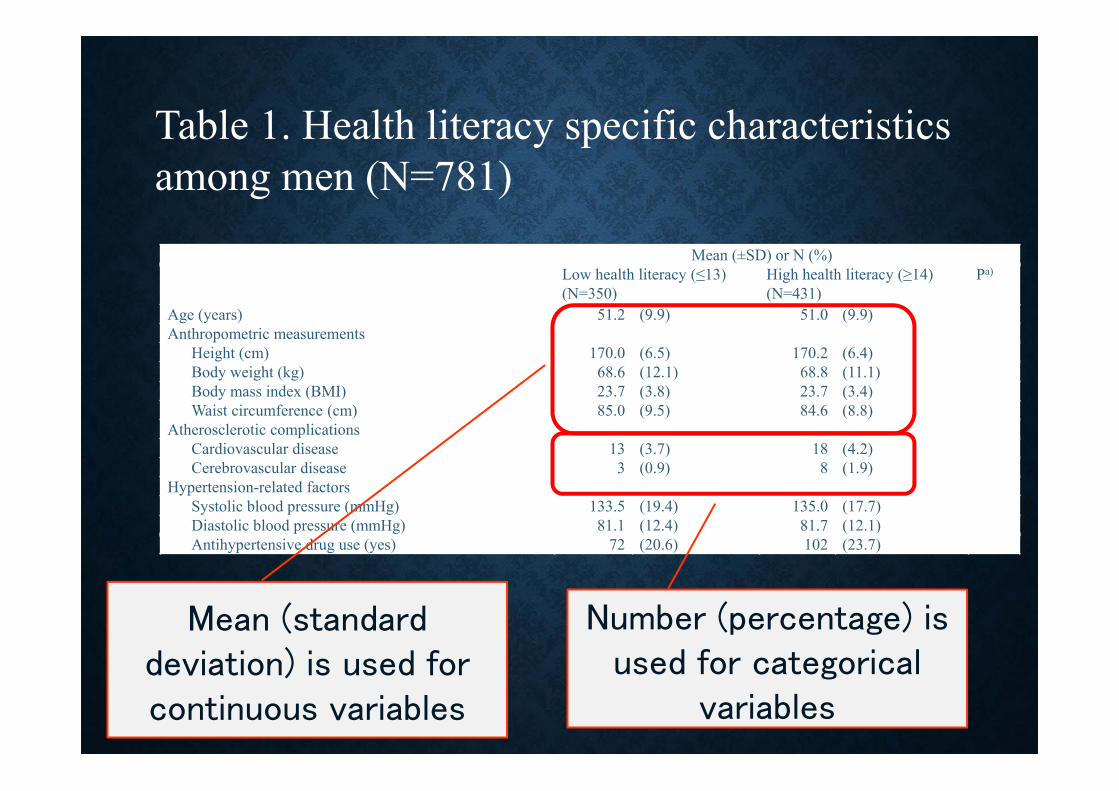
Table 1. Health literacy specific characteristics among men (N=781)
Mean (±SD) or N (%)Low health literacy (≤13) (N=350)
High health literacy (≥14) (N=431)
Pa)
Age (years) 51.2 (9.9) 51.0 (9.9)Anthropometric measurements
Height (cm) 170.0 (6.5) 170.2 (6.4)Body weight (kg) 68.6 (12.1) 68.8 (11.1)Body mass index (BMI) 23.7 (3.8) 23.7 (3.4)Waist circumference (cm) 85.0 (9.5) 84.6 (8.8)
Atherosclerotic complicationsCardiovascular disease 13 (3.7) 18 (4.2)Cerebrovascular disease 3 (0.9) 8 (1.9)
Hypertension-related factors Systolic blood pressure (mmHg) 133.5 (19.4) 135.0 (17.7)Diastolic blood pressure (mmHg) 81.1 (12.4) 81.7 (12.1)Antihypertensive drug use (yes) 72 (20.6) 102 (23.7)
Mean (standard deviation) is used for continuous variables
Number (percentage) is used for categorical
variables
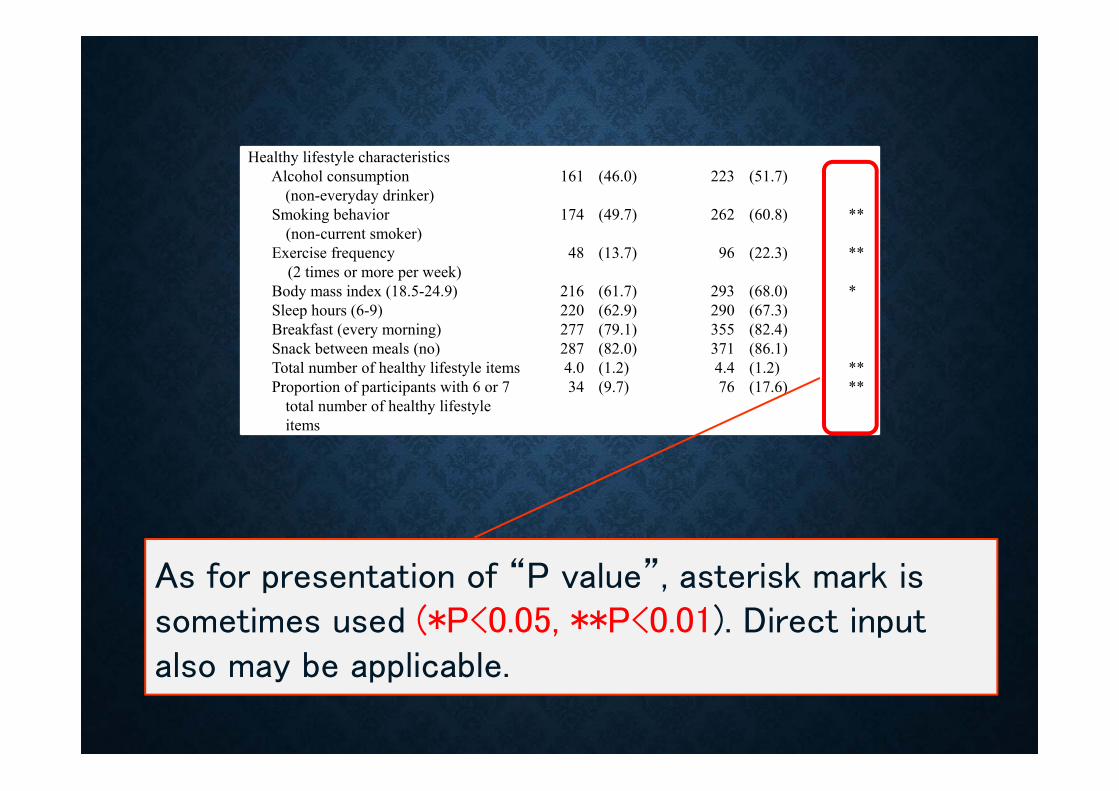
Healthy lifestyle characteristicsAlcohol consumption
(non-everyday drinker)161 (46.0) 223 (51.7)
Smoking behavior(non-current smoker)
174 (49.7) 262 (60.8) **
Exercise frequency (2 times or more per week)
48 (13.7) 96 (22.3) **
Body mass index (18.5-24.9) 216 (61.7) 293 (68.0) *Sleep hours (6-9) 220 (62.9) 290 (67.3)Breakfast (every morning) 277 (79.1) 355 (82.4)Snack between meals (no) 287 (82.0) 371 (86.1)Total number of healthy lifestyle items 4.0 (1.2) 4.4 (1.2) **Proportion of participants with 6 or 7
total number of healthy lifestyle items
34 (9.7) 76 (17.6) **
As for presentation of “P value”, asterisk mark is sometimes used (*P<0.05, **P<0.01). Direct input also may be applicable.
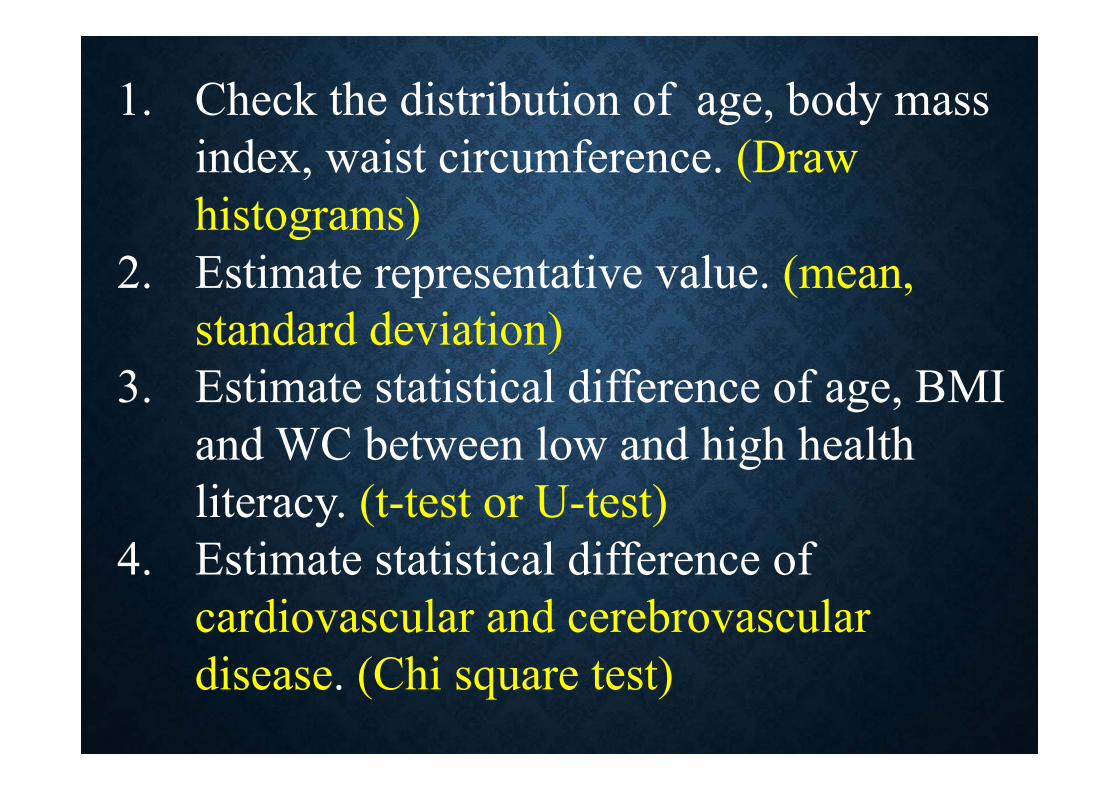
1. Check the distribution of age, body mass index, waist circumference. (Draw histograms)
2. Estimate representative value. (mean,standard deviation)
3. Estimate statistical difference of age, BMI and WC between low and high health literacy. (t-test or U-test)
4. Estimate statistical difference of cardiovascular and cerebrovascular disease. (Chi square test)
How to present analytic study data?
Which statistical methods do you use?
• Linear regression analysis• Logistic regression analysis• Correlation analysis
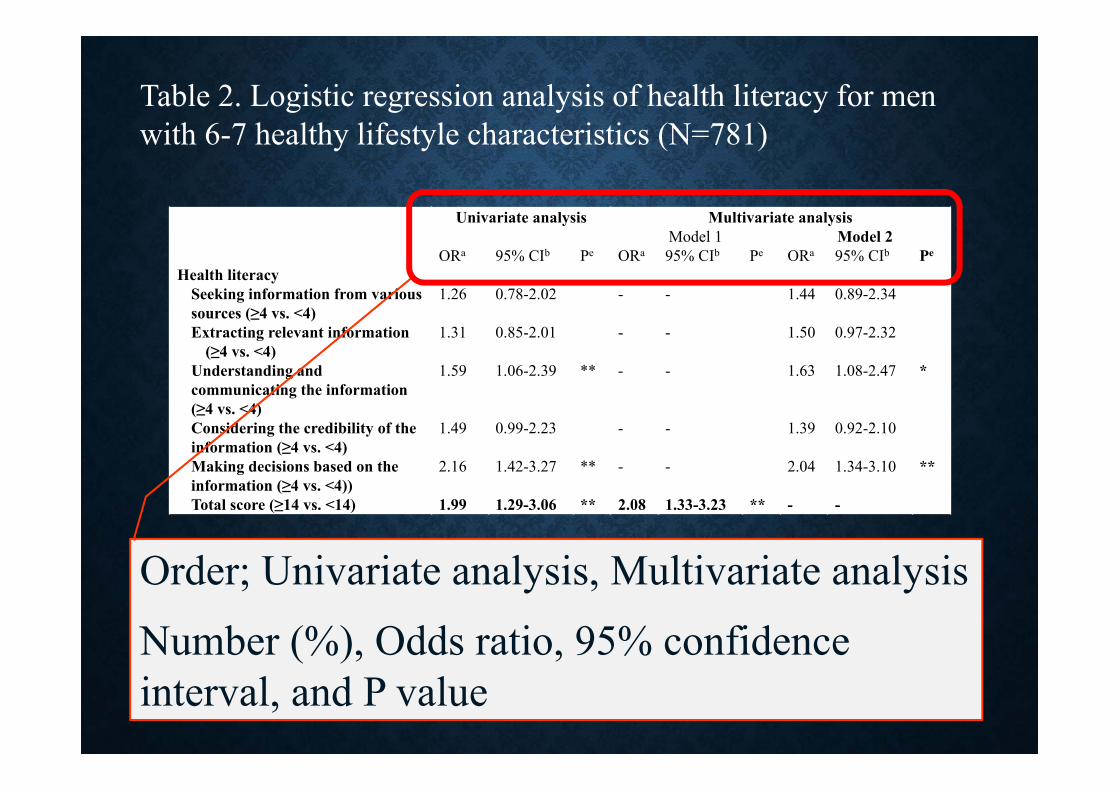
Univariate analysis Multivariate analysisModel 1 Model 2
ORa 95% CIb Pe ORa 95% CIb Pe ORa 95% CIb Pe
Health literacySeeking information from various sources (≥4 vs. <4)
1.26 0.78-2.02 - - 1.44 0.89-2.34
Extracting relevant information (≥4 vs. <4)
1.31 0.85-2.01 - - 1.50 0.97-2.32
Understanding and communicating the information (≥4 vs. <4)
1.59 1.06-2.39 ** - - 1.63 1.08-2.47 *
Considering the credibility of the information (≥4 vs. <4)
1.49 0.99-2.23 - - 1.39 0.92-2.10
Making decisions based on the information (≥4 vs. <4))
2.16 1.42-3.27 ** - - 2.04 1.34-3.10 **
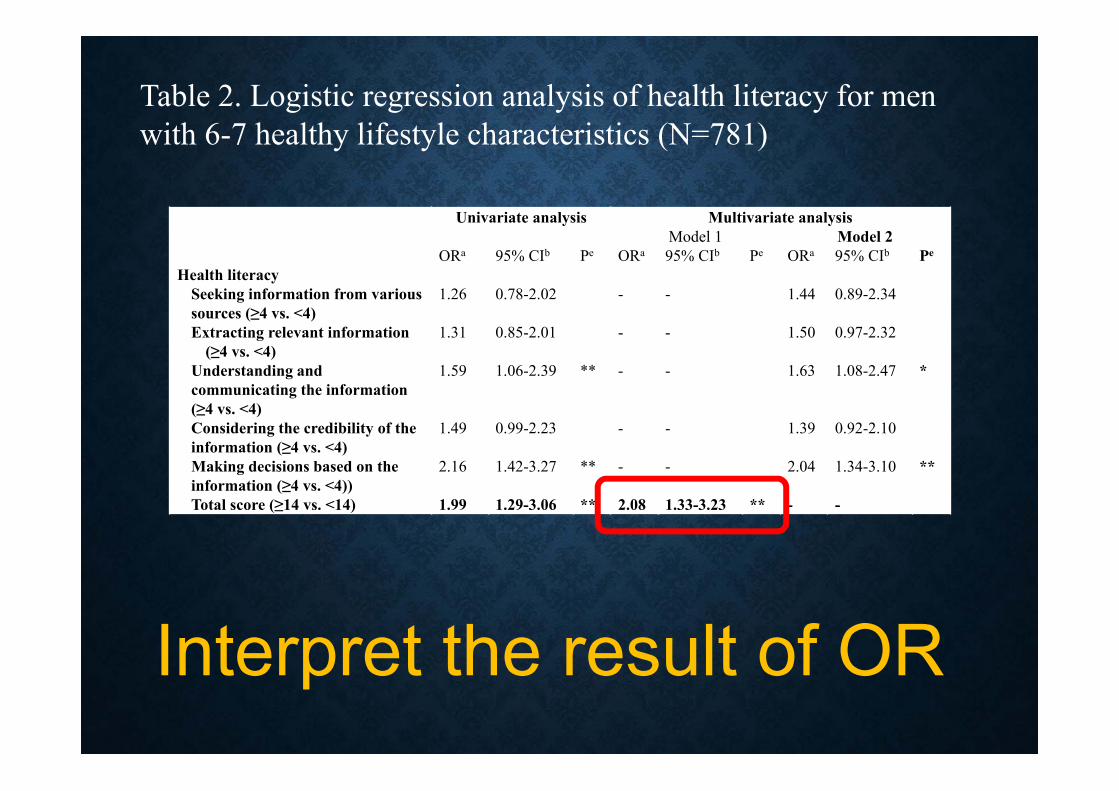
Total score (≥14 vs. <14) 1.99 1.29-3.06 ** 2.08 1.33-3.23 ** - -
Order; Univariate analysis, Multivariate analysis
Number (%), Odds ratio, 95% confidence interval, and P value
Table 2. Logistic regression analysis of health literacy for men with 6-7 healthy lifestyle characteristics (N=781)
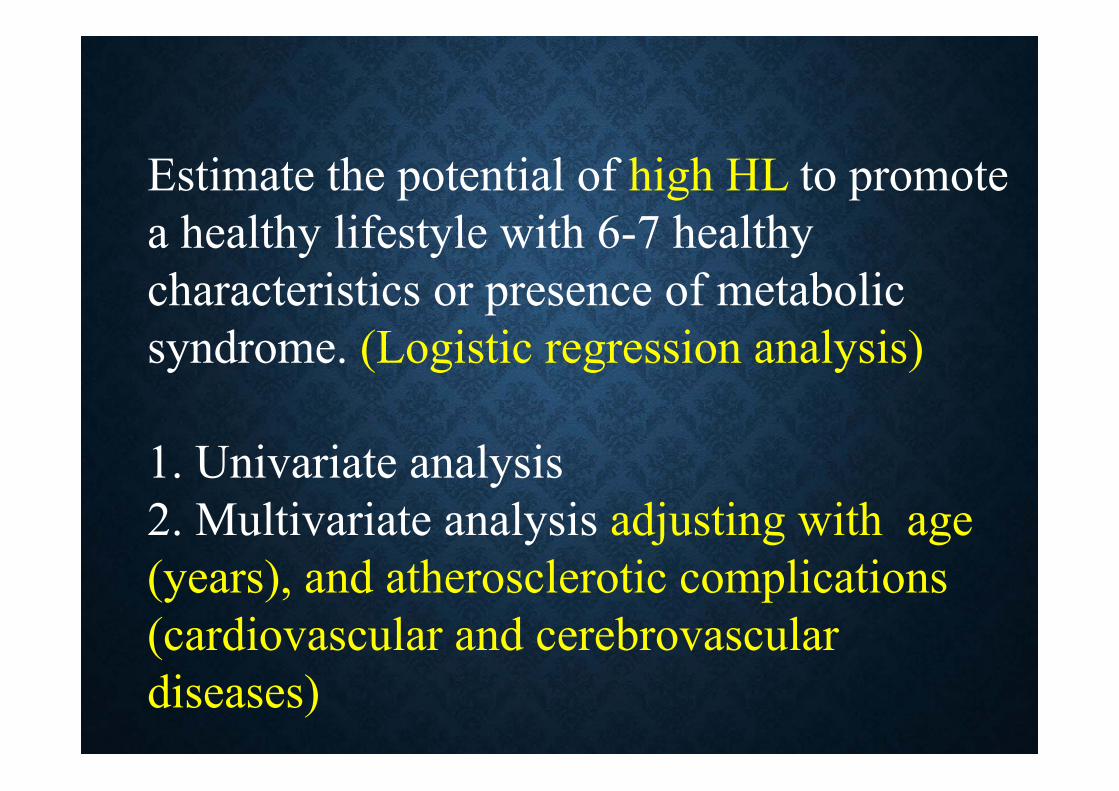
Estimate the potential of high HL to promote a healthy lifestyle with 6-7 healthy characteristics or presence of metabolic syndrome. (Logistic regression analysis)
1. Univariate analysis2. Multivariate analysis adjusting with age (years), and atherosclerotic complications (cardiovascular and cerebrovascular diseases)
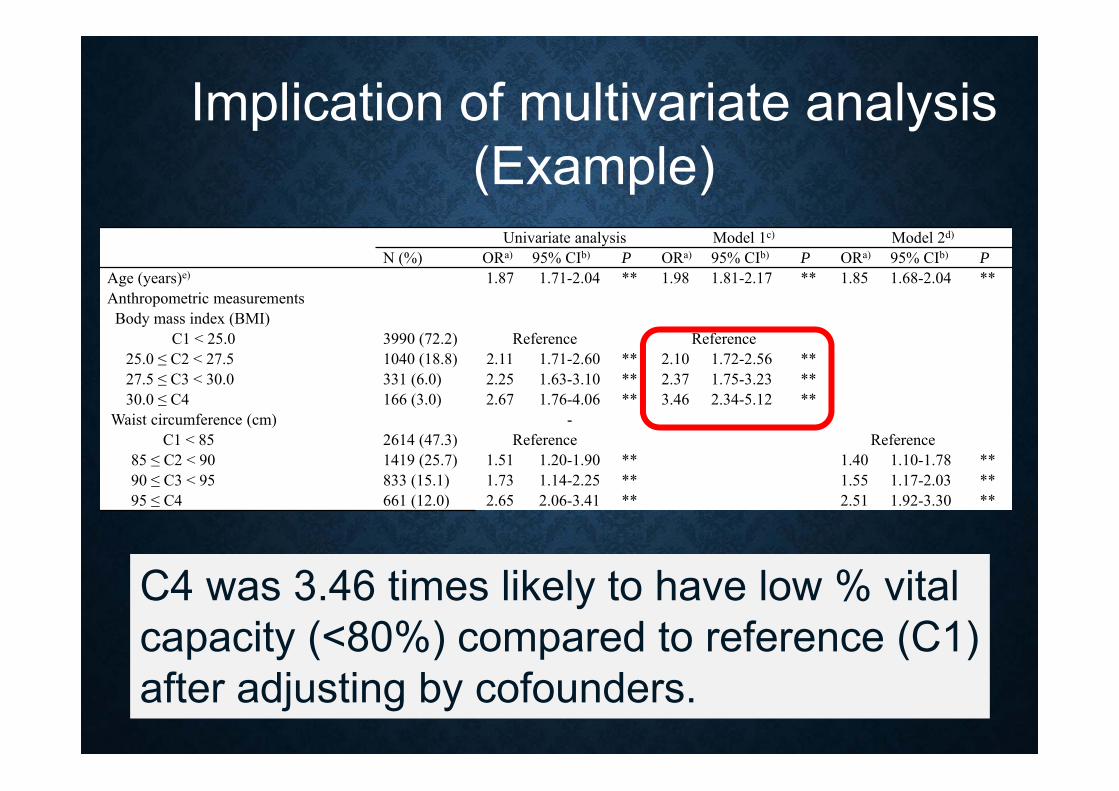
Univariate analysis Model 1c) Model 2d)
N (%) ORa) 95% CIb) P ORa) 95% CIb) P ORa) 95% CIb) PAge (years)e) 1.87 1.71-2.04 ** 1.98 1.81-2.17 ** 1.85 1.68-2.04 **Anthropometric measurementsBody mass index (BMI)
C1 < 25.0 3990 (72.2) Reference Reference25.0 ≤ C2 < 27.5 1040 (18.8) 2.11 1.71-2.60 ** 2.10 1.72-2.56 **27.5 ≤ C3 < 30.0 331 (6.0) 2.25 1.63-3.10 ** 2.37 1.75-3.23 **30.0 ≤ C4 166 (3.0) 2.67 1.76-4.06 ** 3.46 2.34-5.12 **
Waist circumference (cm) -C1 < 85 2614 (47.3) Reference Reference
85 ≤ C2 < 90 1419 (25.7) 1.51 1.20-1.90 ** 1.40 1.10-1.78 **90 ≤ C3 < 95 833 (15.1) 1.73 1.14-2.25 ** 1.55 1.17-2.03 **95 ≤ C4 661 (12.0) 2.65 2.06-3.41 ** 2.51 1.92-3.30 **
Implication of multivariate analysis(Example)
C4 was 3.46 times likely to have low % vital capacity (<80%) compared to reference (C1) after adjusting by cofounders.
Univariate analysis Multivariate analysisModel 1 Model 2
ORa 95% CIb Pe ORa 95% CIb Pe ORa 95% CIb Pe
Health literacySeeking information from various sources (≥4 vs. <4)
1.26 0.78-2.02 - - 1.44 0.89-2.34
Extracting relevant information (≥4 vs. <4)
1.31 0.85-2.01 - - 1.50 0.97-2.32
Understanding and communicating the information (≥4 vs. <4)
1.59 1.06-2.39 ** - - 1.63 1.08-2.47 *
Considering the credibility of the information (≥4 vs. <4)
1.49 0.99-2.23 - - 1.39 0.92-2.10
Making decisions based on the information (≥4 vs. <4))
2.16 1.42-3.27 ** - - 2.04 1.34-3.10 **
Total score (≥14 vs. <14) 1.99 1.29-3.06 ** 2.08 1.33-3.23 ** - -
Table 2. Logistic regression analysis of health literacy for men with 6-7 healthy lifestyle characteristics (N=781)
Interpret the result of OR

https://kdhhealthcomm.wordpress.com/category/health-literacy-3/
Diabetol Metab Syndr. 2016 Mar 24;8:30. doi: 10.1186/s13098-016-0142-8. eCollection 2016.
https://dmsjournal.biomedcentral.com/articles/10.1186/s13098-016-0142-8
Related Documents