AGORA-GeoDash: A Geosensor Dashboard for Real-time Flood Risk Monitoring Flávio E. A. Horita Institute of Mathematics and Computer Science (ICMC) – University of São Paulo (USP) - Brazil [email protected] http://www.agora.icmc.usp.br | http://www.flaviohorita.com

Welcome message from author
This document is posted to help you gain knowledge. Please leave a comment to let me know what you think about it! Share it to your friends and learn new things together.
Transcript
AGORA-GeoDash: A Geosensor Dashboard for Real-time Flood Risk Monitoring
Flávio E. A. Horita
Institute of Mathematics and Computer Science (ICMC) – University of São Paulo (USP) - Brazil
http://www.agora.icmc.usp.br | http://www.flaviohorita.com
Agenda
• Background
• Digital Dashboards
• Research Problem
• AGORA-GeoDash
• Deployment
• Evaluation
• Conclusion
2
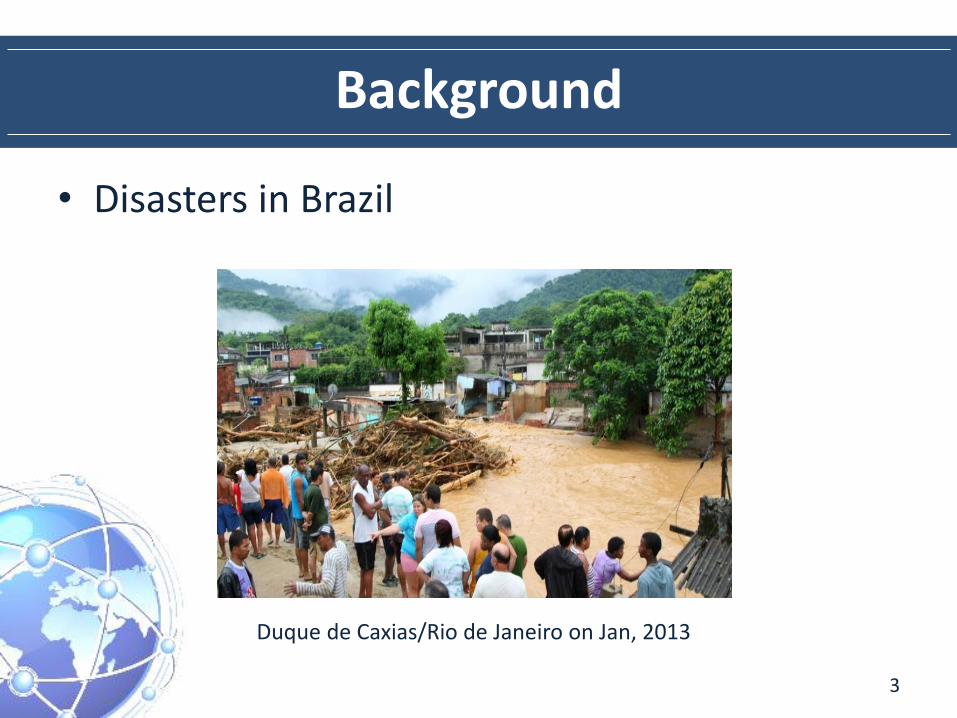
Background
• Disasters in Brazil
3
Duque de Caxias/Rio de Janeiro on Jan, 2013
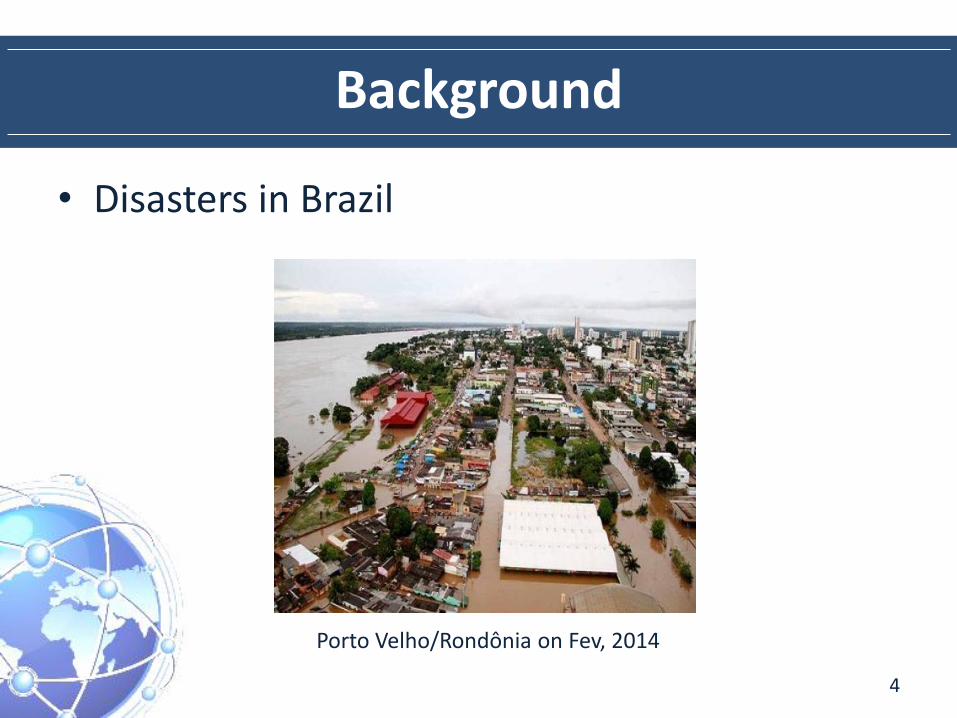
Background
• Disasters in Brazil
4
Porto Velho/Rondônia on Fev, 2014

Background
• Disaster in Brazil
5 Flood in São Carlos/São Paulo on Oct 22, 2013
2h20min – 105mm

Background
• Disasters in Brazil
6 EM-DAT – The International Disaster Database
0%
10%
20%
30%
40%
50%
60%
70%
80%
90%
1991-2000
2001-2010
2011-2013
Flood
Drought
Storms
Landslide
Background
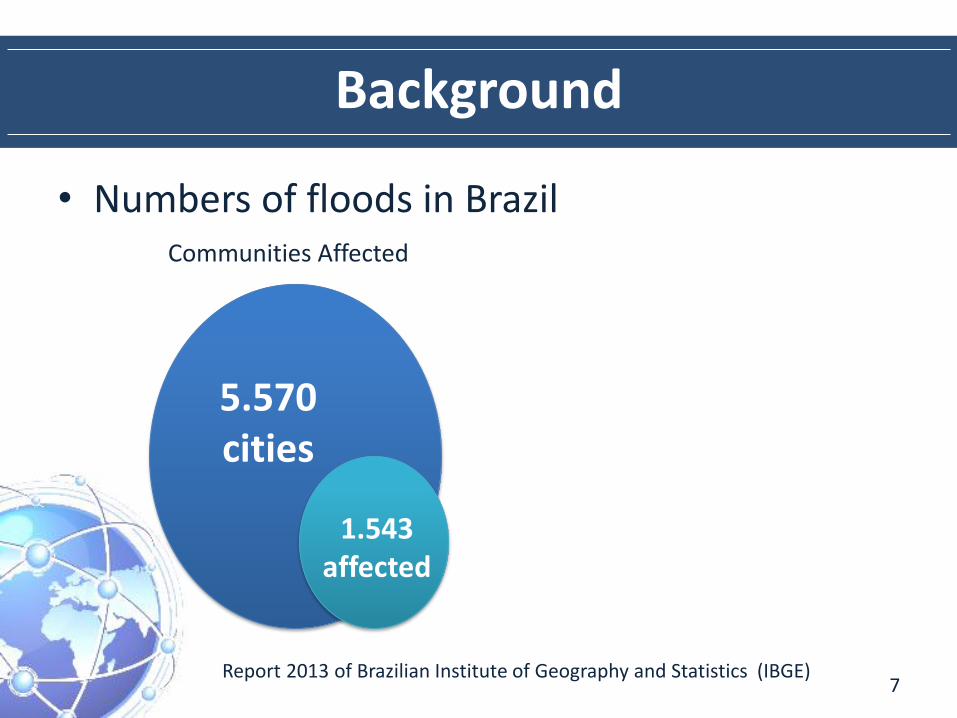
• Numbers of floods in Brazil
7 Report 2013 of Brazilian Institute of Geography and Statistics (IBGE)
Communities Affected
5.570 cities
1.543 affected
Background
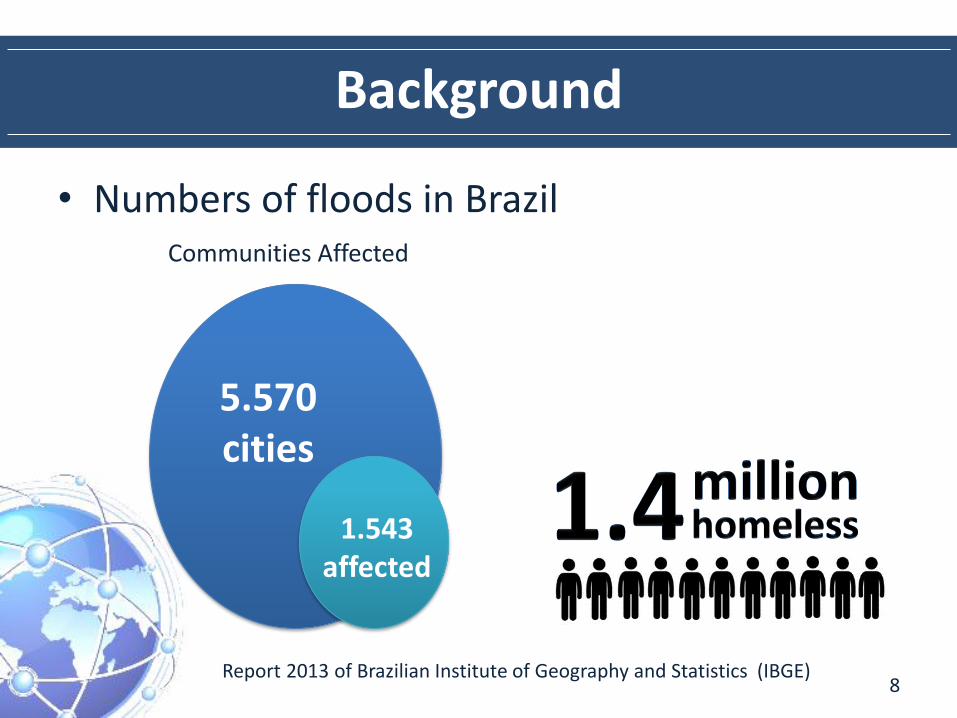
• Numbers of floods in Brazil
8 Report 2013 of Brazilian Institute of Geography and Statistics (IBGE)
Communities Affected
5.570 cities
1.543 affected

Background
• Numbers of floods in Brazil
9 Report 2013 of Brazilian Institute of Geography and Statistics (IBGE)
Communities Affected
5.570 cities
1.543 affected
Digital Dashboards
• Most important management information needed to support strategic activities (Few, 2006;
Liang and Miranda, 2001)
• Single Screen
• Performance Indicators
• User-friendly
• Drill-down function (Vasiliu, 2006)
• Decision-making faster
10
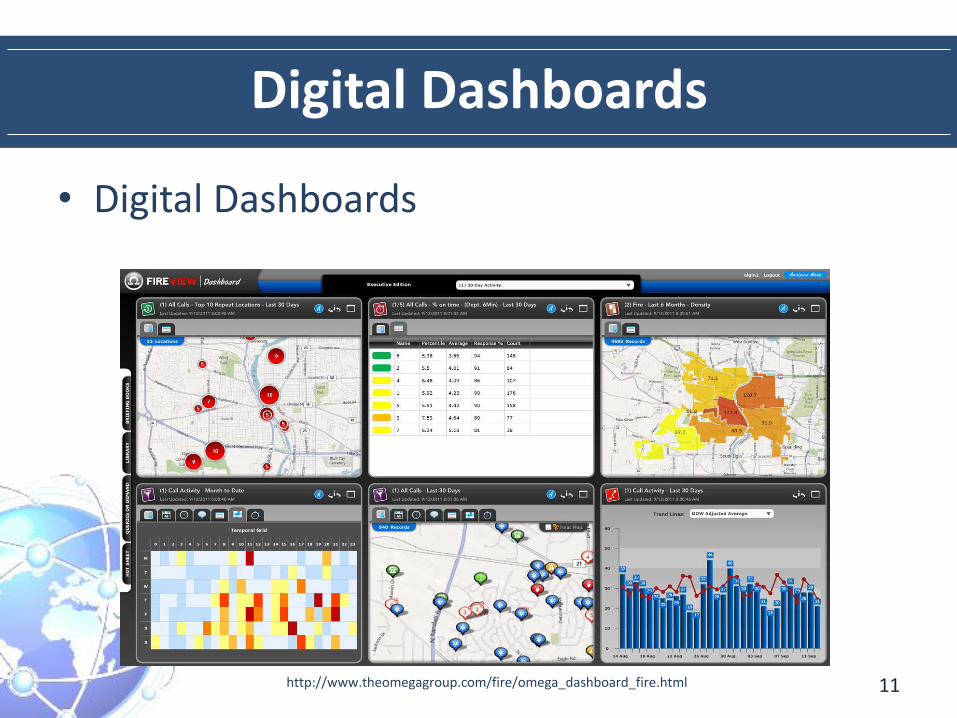
Digital Dashboards
• Digital Dashboards
11 http://www.theomegagroup.com/fire/omega_dashboard_fire.html
Research Problem
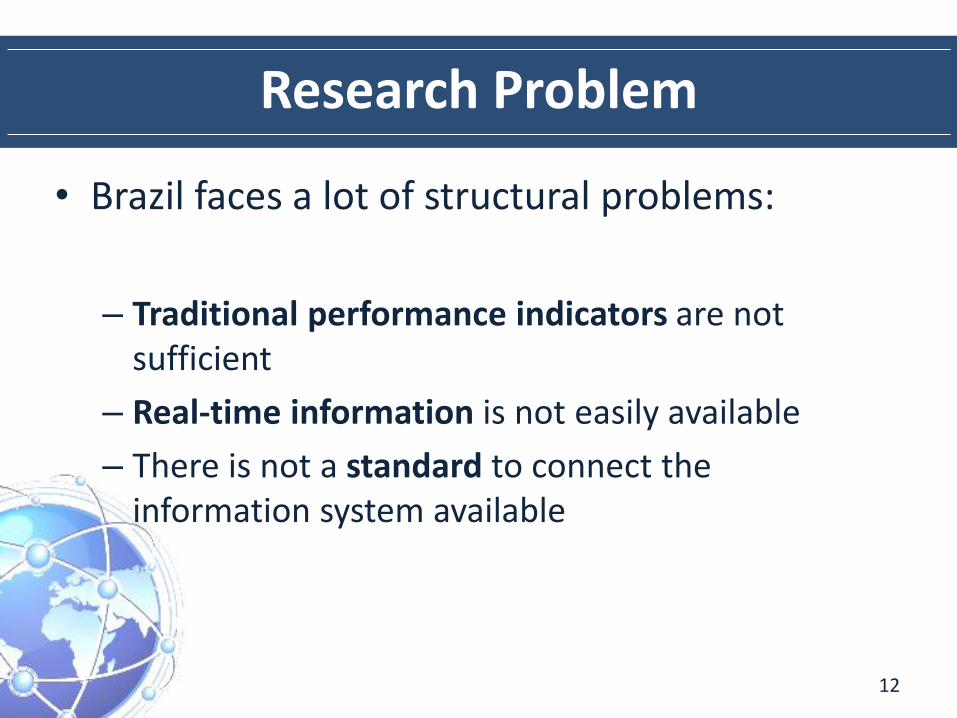
• Brazil faces a lot of structural problems:
– Traditional performance indicators are not sufficient
– Real-time information is not easily available
– There is not a standard to connect the information system available
12
Research Problem
• Main research question
How to support the real-time decision-making in flood situations through the rivers monitoring?
13
AGORA-GeoDash
• Processes real-time information
• Enables the interoperability among other information systems (OGC standards)
• Provides performance indicators essentials for flood risk monitoring
14

AGORA-GeoDash
• Layer Structure
15
AGORA-GeoDash
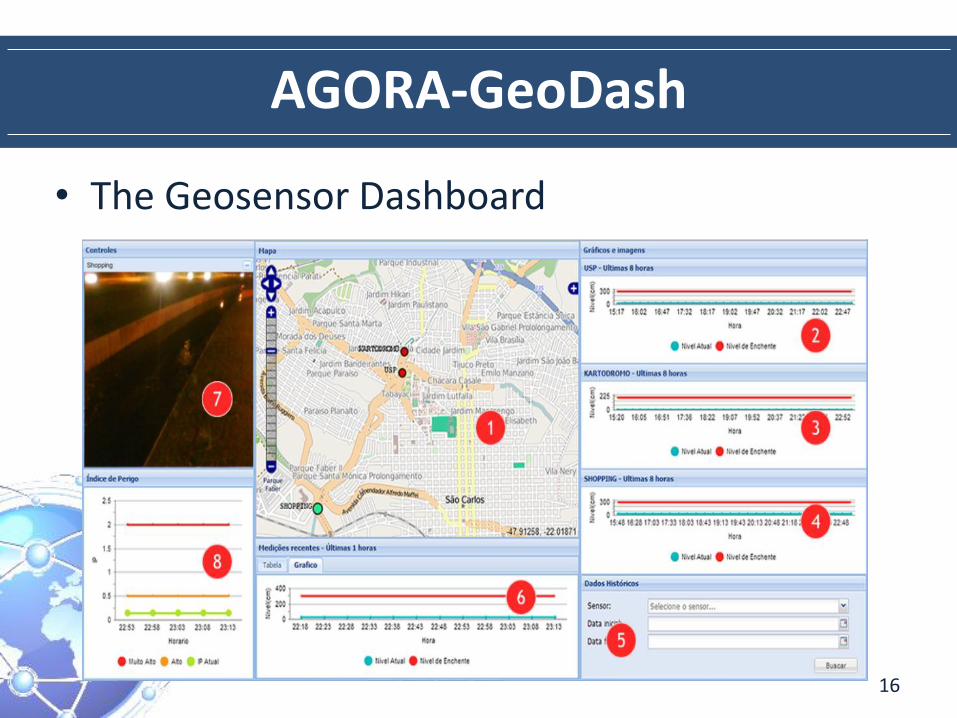
• The Geosensor Dashboard
16
AGORA-GeoDash
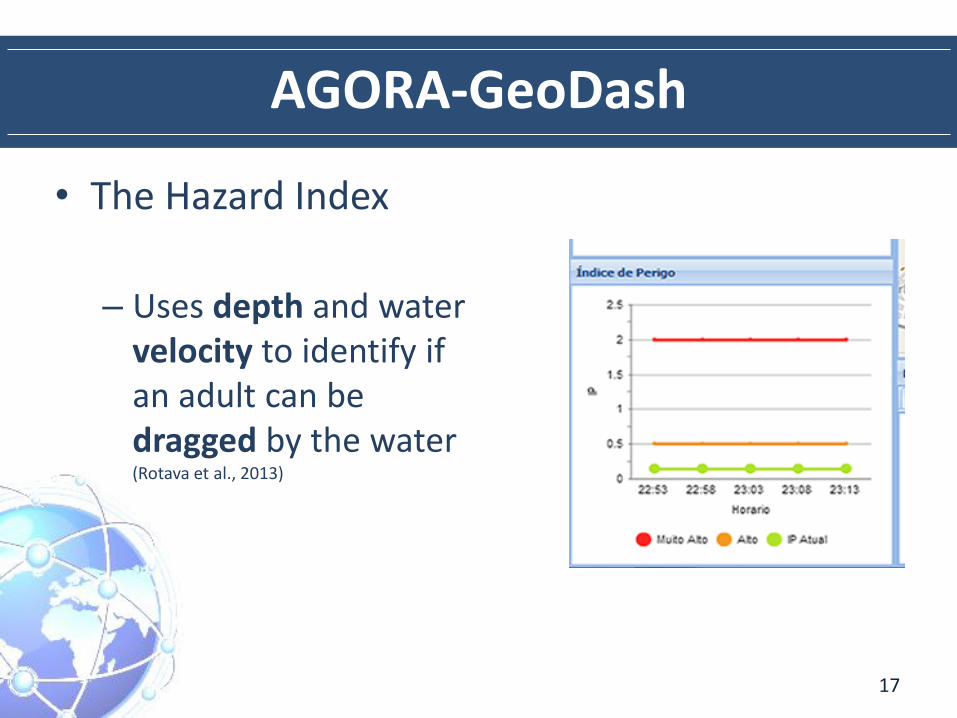
• The Hazard Index
– Uses depth and water velocity to identify if an adult can be dragged by the water (Rotava et al., 2013)
17
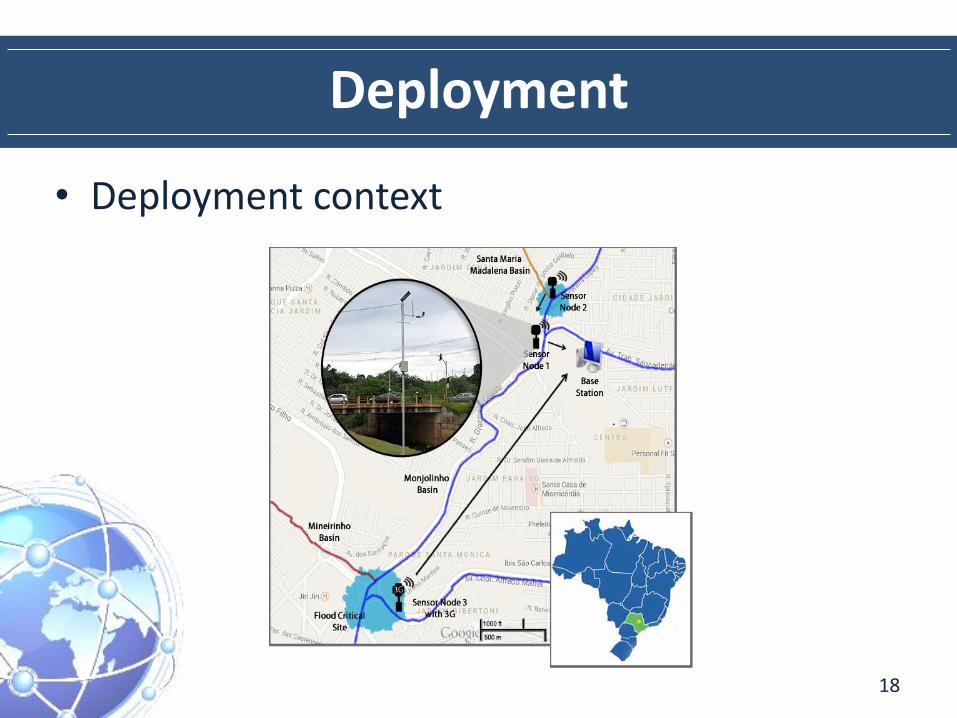
Deployment
• Deployment context
18

Deployment
• Deployment context
19
• Wireless Sensor Network with three sensors using ZigBee for the Data Source Layer
• Communication among sensors and base station via JSON
Deployment
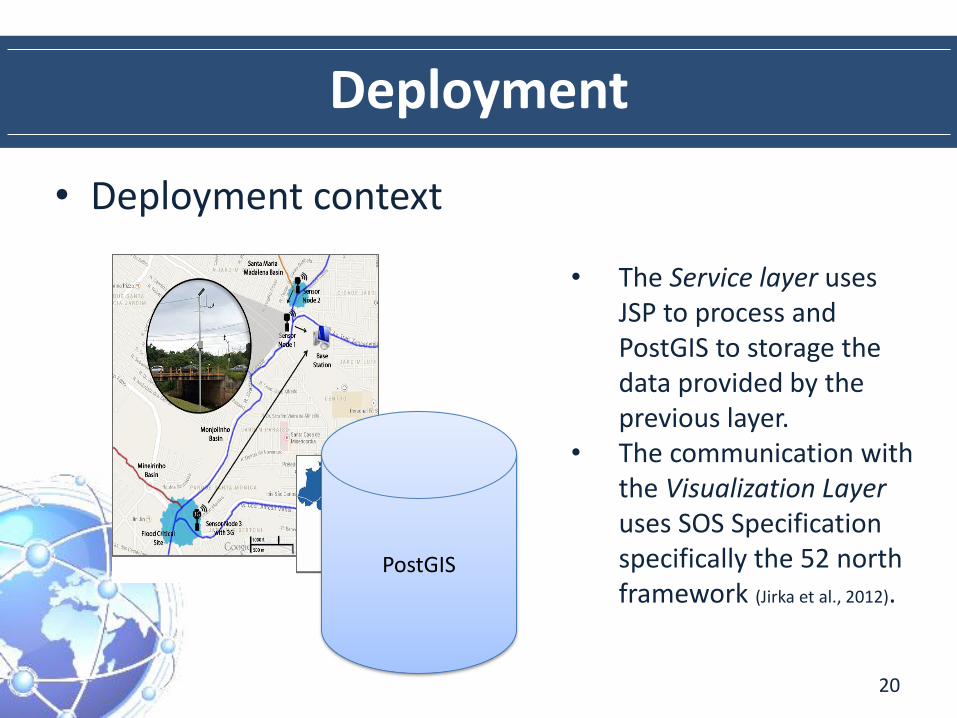
• Deployment context
20
• The Service layer uses JSP to process and PostGIS to storage the data provided by the previous layer.
• The communication with the Visualization Layer uses SOS Specification specifically the 52 north framework (Jirka et al., 2012).
PostGIS
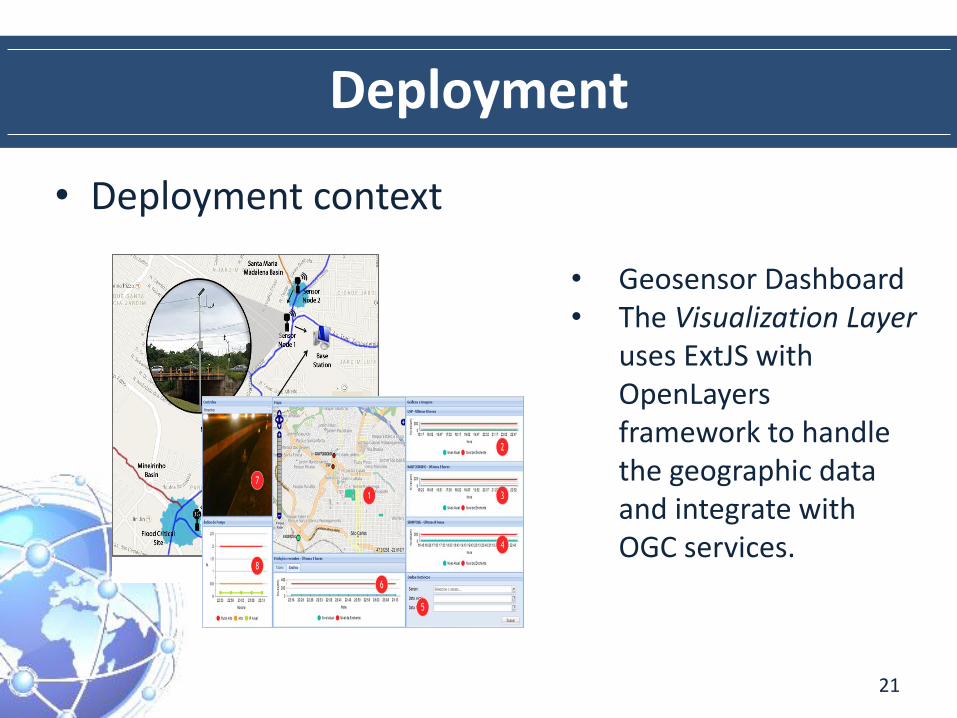
Deployment
• Deployment context
21
• Geosensor Dashboard • The Visualization Layer
uses ExtJS with OpenLayers framework to handle the geographic data and integrate with OGC services.

Evaluation
• Flood event on Oct 22-23, 2013
– 2h20m of rain with an amount of 105mm (all Dec)
22
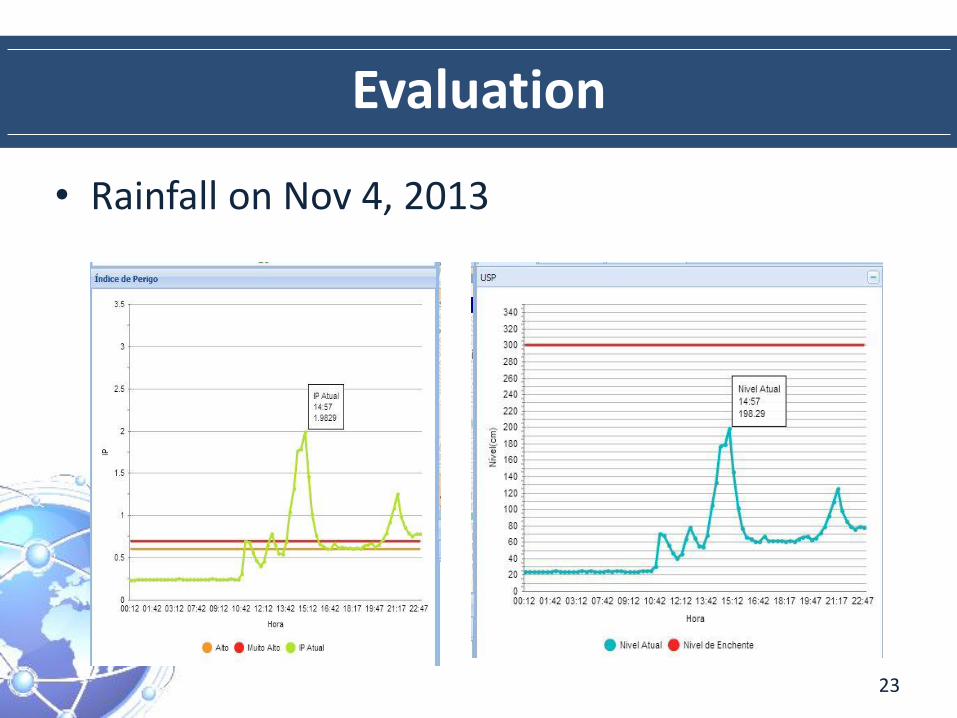
Evaluation
• Rainfall on Nov 4, 2013
23
Conclusion
• Real-time information is essential
• The AGORA-GeoDash presents itself as an important approach to support decision-making
• Hazard Index is an important performance indicator to aid in flood situations
24
Future Work
• Improve the dashboard with other performance indicators
• Integrate Volunteered Geographic Information (VGI) with other sources to provide real-time information (Degrossi & Albuquerque, 2014)
• Interface and usability analysis
25
AGORA-GeoDash: A Geosensor Dashboard for Real-time Flood Risk Monitoring
Flávio E. A. Horita1, Maria C. Fava2, Jairo Rotava2, Eduardo M. Mendiondo2, Vladimir C. Souza3, Jó Ueyama1, and João Porto de Albuquerque1
1Institute of Mathematics and Computer Science (ICMC/USP), 2Department of Hydraulic (DHS/USP), 3Center for Technology (CTEC/UFAL)

AGORA-GeoDash: A Geosensor Dashboard for Real-time Flood Risk Monitoring
Flávio E. A. Horita
Institute of Mathematics and Computer Science (ICMC) – University of São Paulo (USP) - Brazil
http://www.agora.icmc.usp.br | http://www.flaviohorita.com
Related Documents


