Welcome to Fabege’s presentation of the year-end report 2014 Christian Hermelin, CEO & President Fabege Åsa Bergström, Vice President & CFO Fabege

Presentation from Fabege's Year-end report 2014
Aug 12, 2015
Welcome message from author
This document is posted to help you gain knowledge. Please leave a comment to let me know what you think about it! Share it to your friends and learn new things together.
Transcript
Welcome to Fabege’s presentation of the year-end report 2014 Christian Hermelin, CEO & President Fabege
Åsa Bergström, Vice President & CFO Fabege

CONDENSED INCOME STATEMENT
SEKm JAN-DEC 2014 JAN-DEC 2013
Rental income 2,087 2,059
Property expenses -602 -648
Net operating surplus 1,485 1,411
Central administration -67 -62
Net financial items -664 -705
Share of profits of associated companies -72 -30
Profit from property management 682 614
Realised changes in value, properties 300 135
Unrealised changes in value, properties 1 339 739
Changes in value, derivatives and equities -454 504
Profit before tax 1,867 1,992
Tax -129 -462
Profit for the year 1,738 1,530
• Positive rental growth in
identical portfolio: 5%
• Surplus ratio: 71% (69)
• Return on investment:
22%
• Average return
requirement: 5.4%
• Earnings per share:
SEK10,51 (9,26)
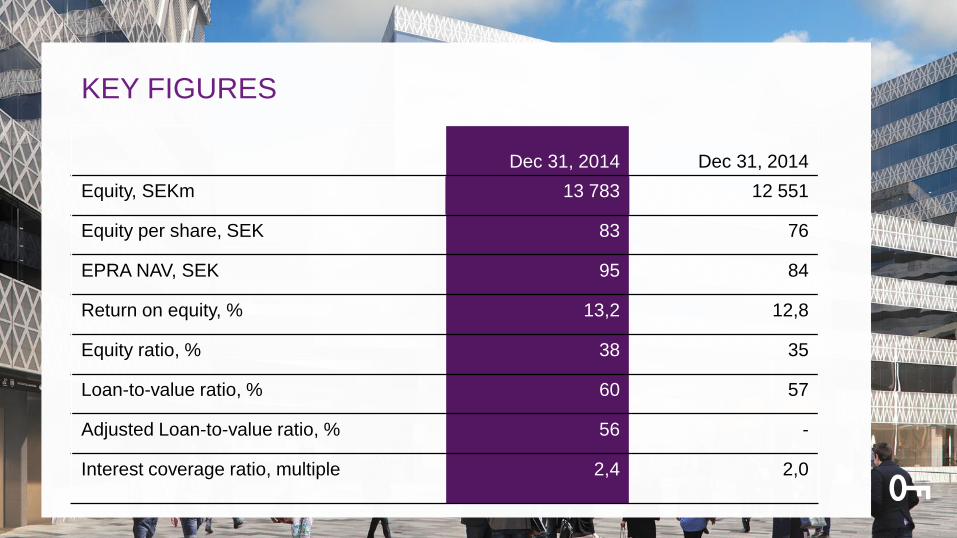
Dec 31, 2014 Dec 31, 2014
Equity, SEKm 13 783 12 551
Equity per share, SEK 83 76
EPRA NAV, SEK 95 84
Return on equity, % 13,2 12,8
Equity ratio, % 38 35
Loan-to-value ratio, % 60 57
Adjusted Loan-to-value ratio, % 56 -
Interest coverage ratio, multiple 2,4 2,0
KEY FIGURES

FINANCING - DECEMBER 31, 2014
Total facilities: SEK 24.4bn
Total loans: SEK 19.6bn
• Of which, bonds SEK 1.9bn
• Of which, corporate paper: SEK 2.9bn
Maturity period: 3.7 years
Fixed-rate period: 1.9 years
Unutilised: SEK 4.6bn
Continued excellent climate in the financial market
New SFF
Revolving
credits
Bonds
Corporate
paper
Other loans
Unutilised
facilities

Positive net lettings
Value growth through projects and attractive properties in good locations
Maintain a high rate of improvement in the portfolio
• Balance between
investments and sales
TARGETS 2014
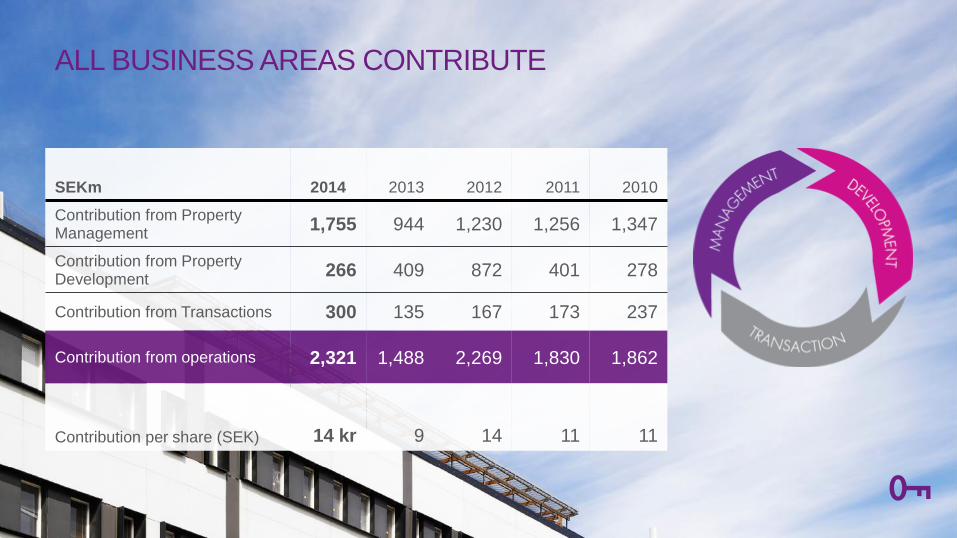
SEKm 2014 2013 2012 2011 2010
Contribution from Property Management
1,755 944 1,230 1,256 1,347
Contribution from Property Development
266 409 872 401 278
Contribution from Transactions 300 135 167 173 237
Contribution from operations 2,321 1,488 2,269 1,830 1,862
Contribution per share (SEK) 14 kr 9 14 11 11
ALL BUSINESS AREAS CONTRIBUTE
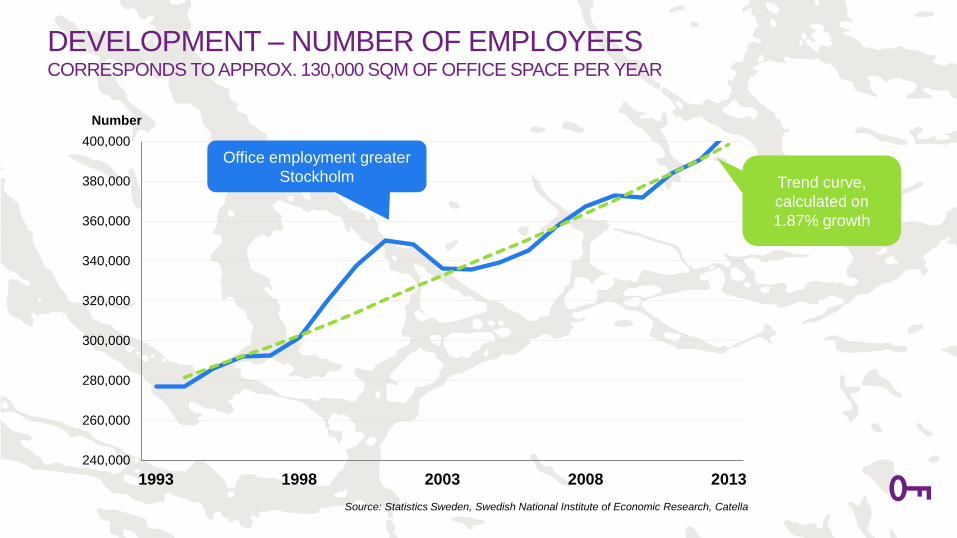
DEVELOPMENT – NUMBER OF EMPLOYEES CORRESPONDS TO APPROX. 130,000 SQM OF OFFICE SPACE PER YEAR
240,000
260,000
280,000
300,000
320,000
340,000
360,000
380,000
400,000
1993 1998 2003 2008 2013
Number
Source: Statistics Sweden, Swedish National Institute of Economic Research, Catella
Trend curve,
calculated on
1.87% growth
Office employment greater
Stockholm
0,0
2,0
4,0
6,0
8,0
10,0
12,0
14,0
16,0
0
1000
2000
3000
4000
5000
6000
85 86 87 88 89 90 91 92 93 94 95 96 97 98 99 00 01 02 03 04 05 06 07 08 09 10 11 12 13 14
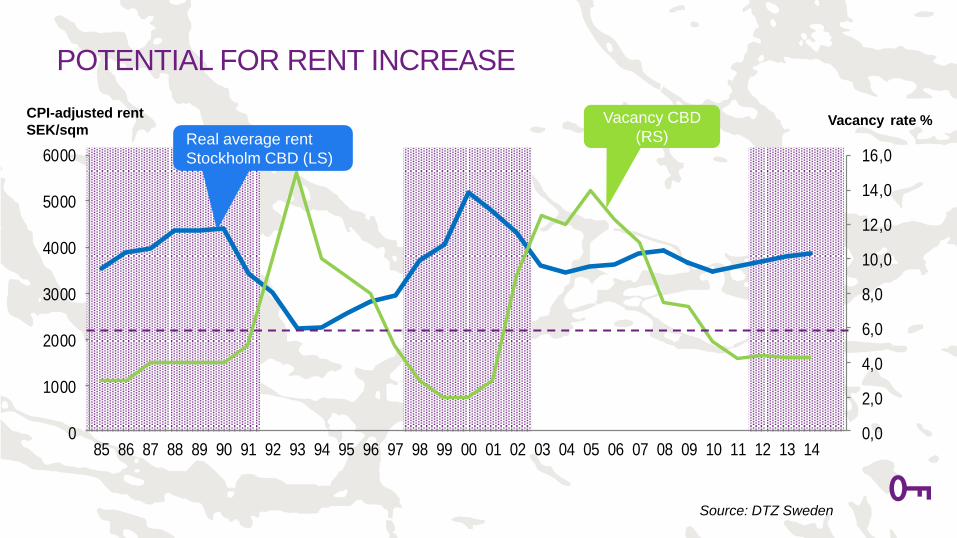
Source: DTZ Sweden
CPI-adjusted rent
SEK/sqm Vacancy rate %
POTENTIAL FOR RENT INCREASE
Real average rent
Stockholm CBD (LS)
Vacancy CBD
(RS)
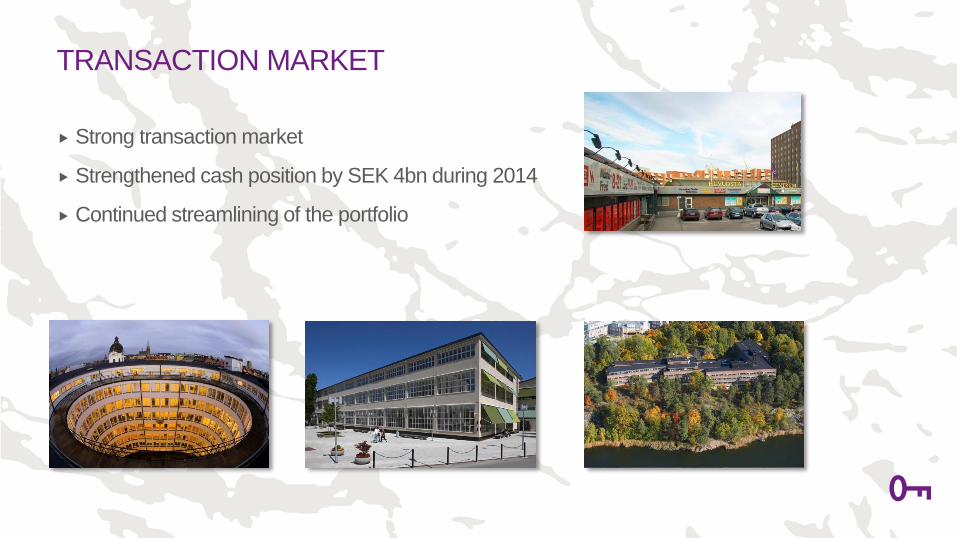
TRANSACTION MARKET
Strong transaction market
Strengthened cash position by SEK 4bn during 2014
Continued streamlining of the portfolio
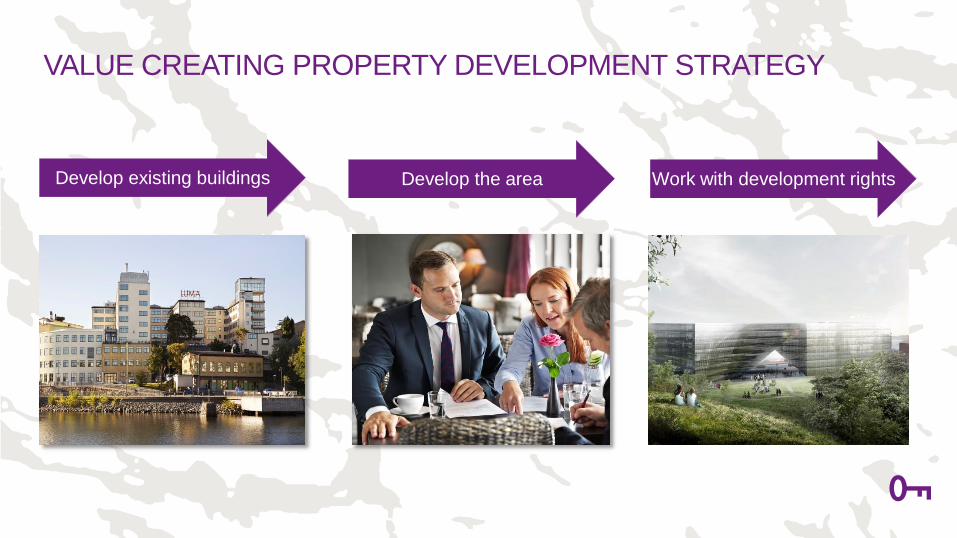
VALUE CREATING PROPERTY DEVELOPMENT STRATEGY
Develop existing buildings Develop the area Work with development rights

ON-GOING PROJECTS
Over 150,000 sqm under production
Occupancy rate approx. 90 %
High demand
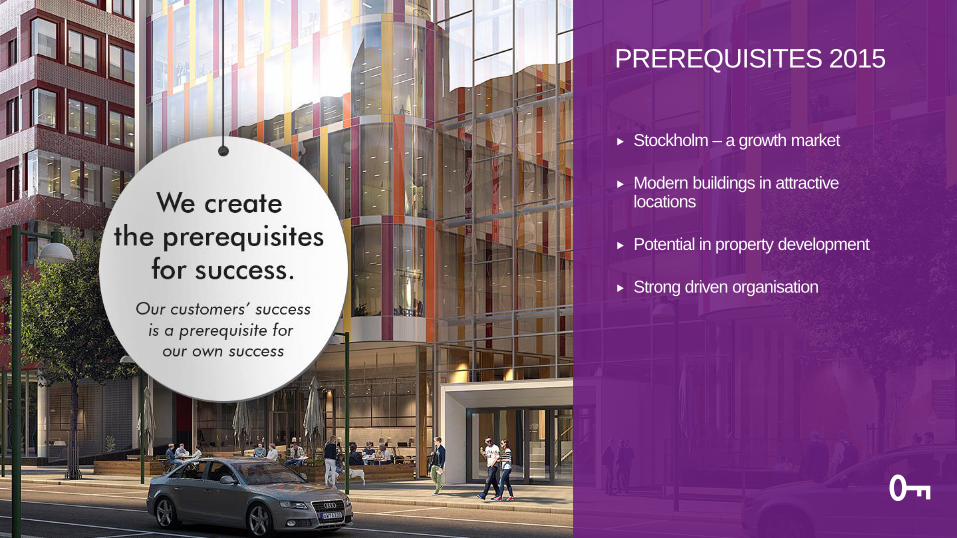
Stockholm – a growth market
Modern buildings in attractive locations
Potential in property development
Strong driven organisation
PREREQUISITES 2015

QUESTIONS
Related Documents