Presentation for the current results on red blood cell study Jia-Rong, Yeh March 6, 2009

Presentation for the current results on red blood cell study Jia-Rong, Yeh March 6, 2009.
Dec 21, 2015
Welcome message from author
This document is posted to help you gain knowledge. Please leave a comment to let me know what you think about it! Share it to your friends and learn new things together.
Transcript

Presentation for the current results on red blood cell study
Jia-Rong, Yeh
March 6, 2009
Contents
Aims of this study Data format Movie player Mode function Spectral analysis Linguistic analysis
Aim of this study
Health of red blood cell (RBC) affects the results of blood transfusions.
The fluctuation on surfaces of RBC performs nonlinearly dynamical property.
As a pilot study, we try to quantify the dynamical property of RBC as a factor for aging of RBC.
In this study, many different analysis techniques have been used to quantify the dynamic property of RBC
Saving movies using a new data format The original data was saved pixel by pixel
and frame by frame. I developed a new data format to store a
movie with a small requirement of space. Space using the original format is 800 MB,
but only 130 MB using the new data format for a movie.
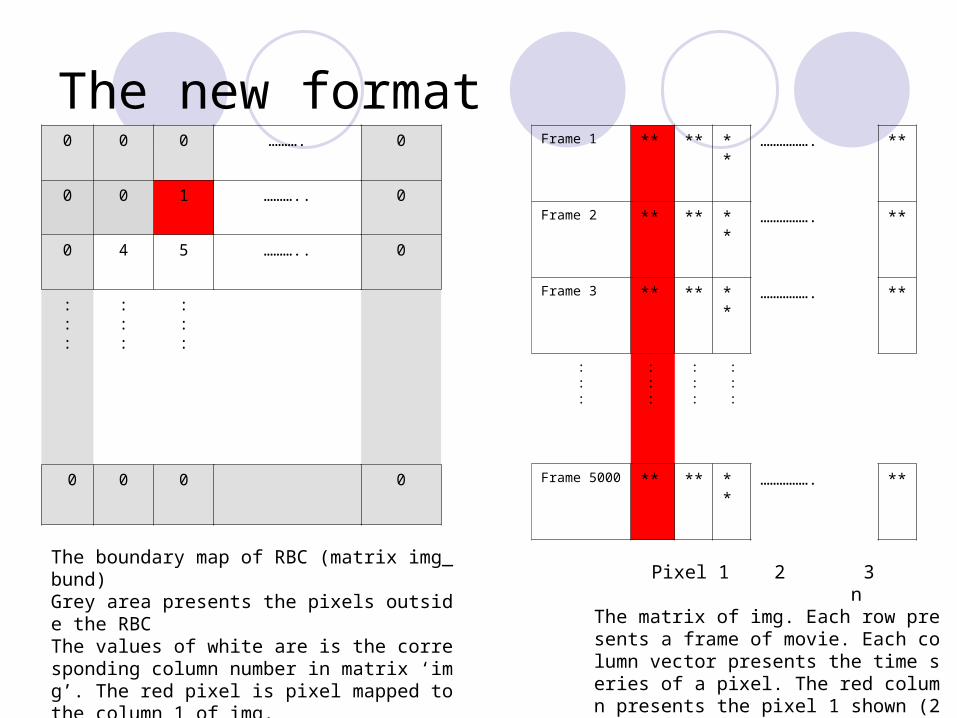
The new format
The boundary map of RBC (matrix img_bund)Grey area presents the pixels outside the RBCThe values of white are is the corresponding column number in matrix ‘img’. The red pixel is pixel mapped to the column 1 of img.
Pixel 1 2 3 nThe matrix of img. Each row presents a frame of movie. Each column vector presents the time series of a pixel. The red column presents the pixel 1 shown (2,3) in img_bund.
0 0 0 ………. 0
0 0 1 ……….. 0
0 4 5 ……….. 0
:::
:::
:::
0 0 0 0
Frame 1 ** ** ** ……………. **
Frame 2 ** ** ** ……………. **
Frame 3 ** ** ** ……………. **
:::
:::
:::
:::
Frame 5000 ** ** ** ……………. **

Movie player
The data can be saved in one fourth of the original space using the new data format
Movie player is a Matlab program used to convert the 5000 row vectors to a sequence of frames as a movie.
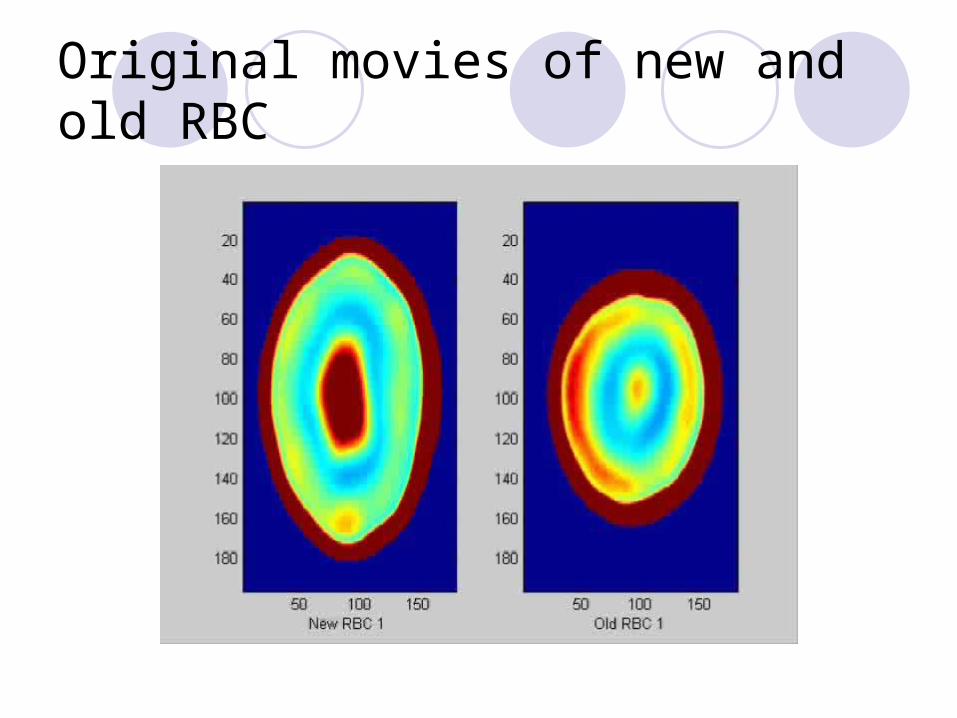
Original movies of new and old RBC

Mode decomposition using EMD
Before mode decomposition, the resolution of movie had been reduced to save calculation time.
Here, a frame with resolution around 200 × 200 had been reduced to 65 ×65
Then, the time series of each pixel inside the boundary of RBC had been decomposed into the first 7 IMFs
Movie player for mode functions
Seven mode functions can be assembled using the IMFs of pixels inside RBC.
A comparison between mode functions of old and new RBCs was shown using the first 4 mode functions of both.
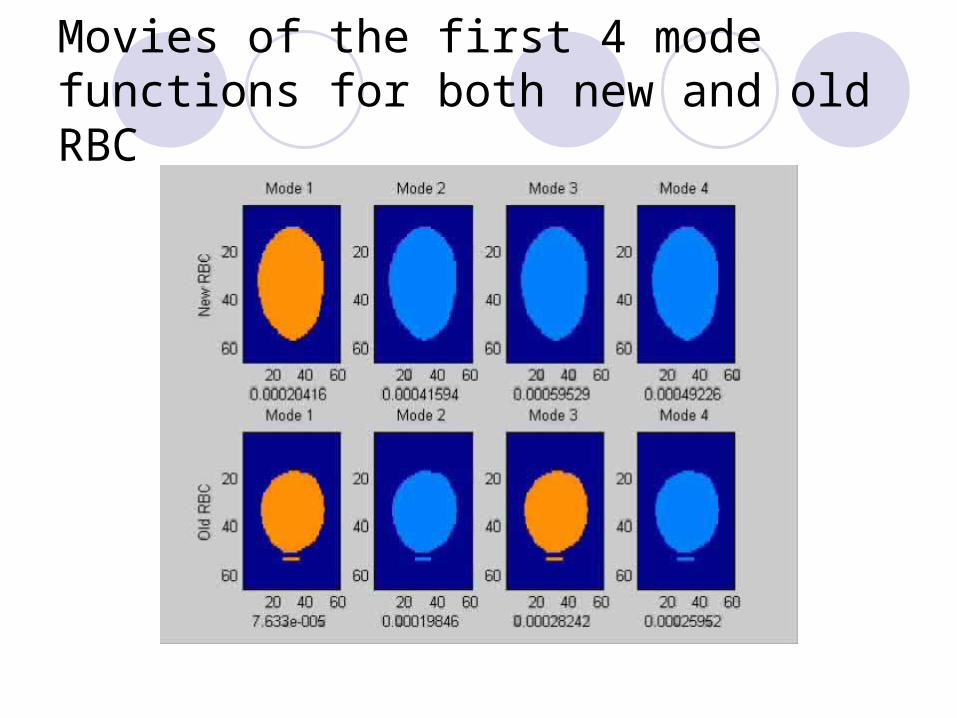
Movies of the first 4 mode functions for both new and old RBC

Spectral analysis
Based on the characteristics of IMF, energy spectrum of each IMF should concentrate on a frequency band.
Therefore, I used 3-D plots to display the energy spectra for the pixels inside the boundary of RBC.
The pixels are sorted by the total energy of fluctuation.
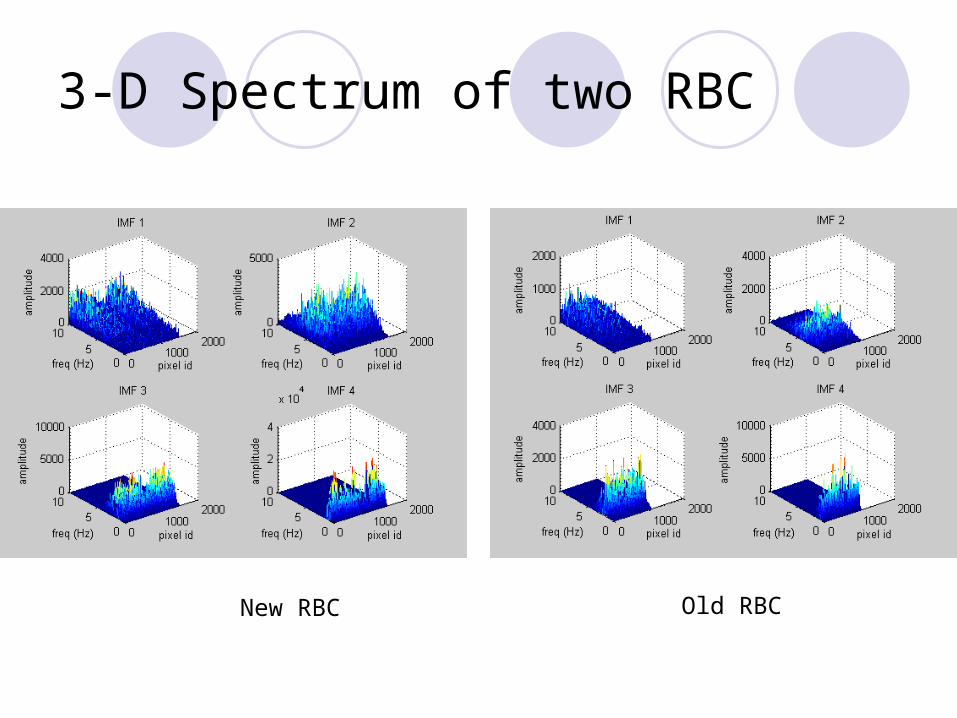
3-D Spectrum of two RBC
New RBC Old RBC

Linguistic analysis (Preparation)
Madalena gave me 26 RBCs ( 13 new and 13 old) with MSE, alfa, and SD maps
I tried to figure out the connection among the 26 RBC and the original data sources saved in directories of \RBC\original\new, \RBC\original\old, and \RBC\original\Sep-2-7
I found the original data sources saved in \RBC\original for 20 (13 new and 7 old) out from the 26 RBCs used in previous publications

Display three maps of RBC
New RBC Old RBC

Application 1 of Linguistic analysis
Divide the area inside RBC into three regions: core, core border, and ring
Sort the pixels to three groups according to the region.
Use the ensemble ranks and probabilities of words via the pixels locate on core region as the baseline to plot distance map.
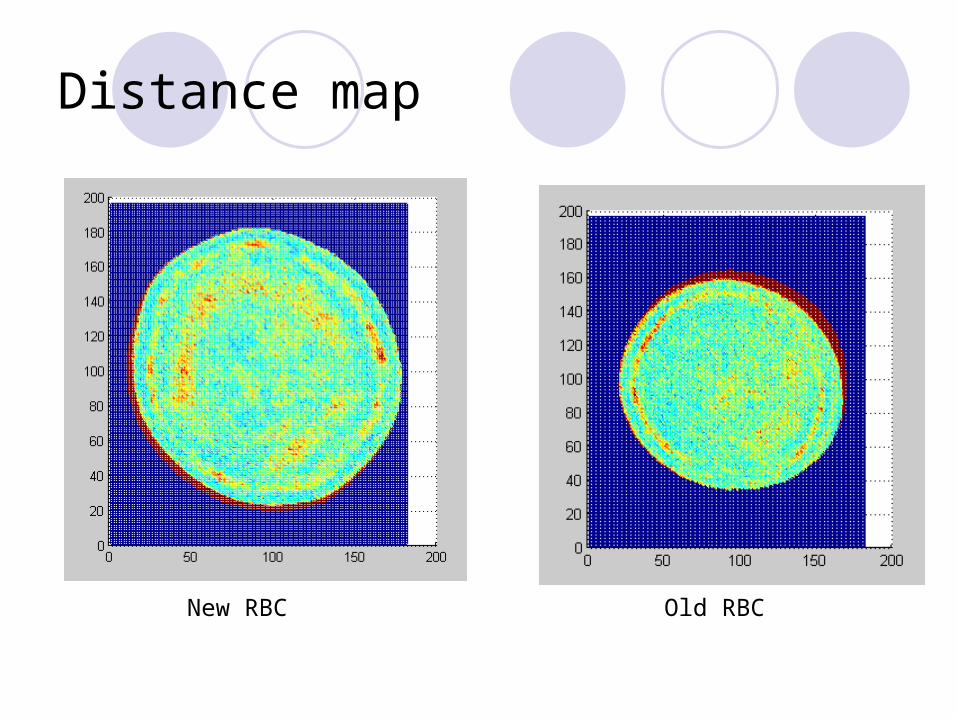
Distance map
New RBC Old RBC
Application 2 of Linguistic analysis
Plot the distributions of entropy for old and new RBC
Define the ranges of both high and low entropy for old and new RBC
Randomly select 300 pixels for both high- and low-entropy groups from 3 old and 3 new RBC
Conduct statistical analysis among groups
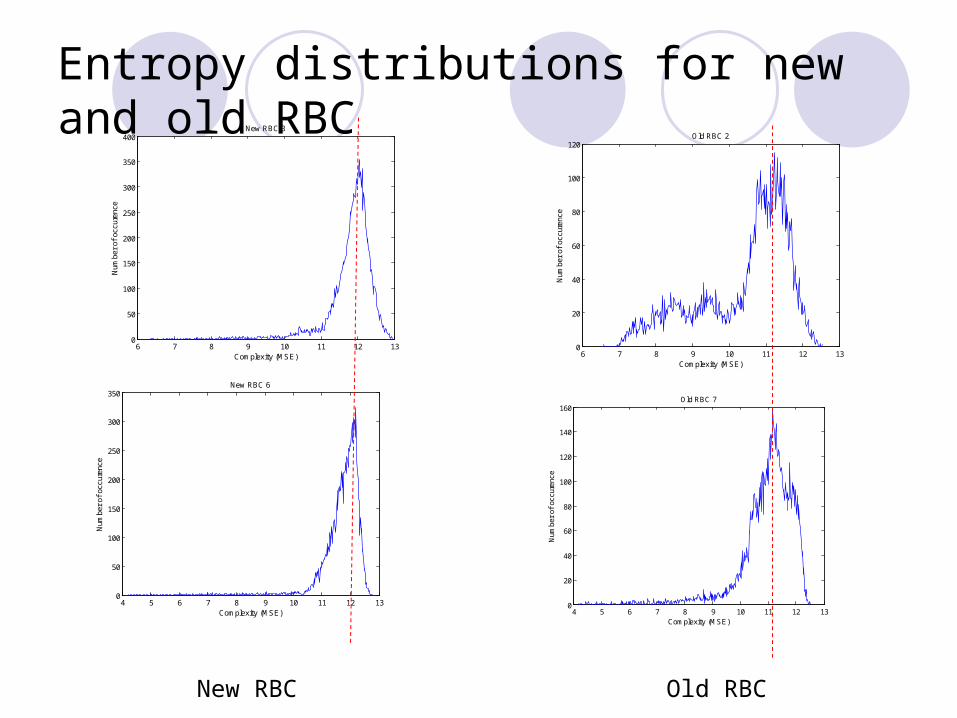
Entropy distributions for new and old RBC
6 7 8 9 10 11 12 130
50
100
150
200
250
300
350
400
Complexity (MSE)
Num
ber
of o
ccur
ence
New RBC 3
6 7 8 9 10 11 12 130
20
40
60
80
100
120
Complexity (MSE)
Num
ber
of o
ccur
ence
Old RBC 2
New RBC Old RBC
4 5 6 7 8 9 10 11 12 130
50
100
150
200
250
300
350
Complexity (MSE)
Num
ber
of o
ccur
ence
New RBC 6
4 5 6 7 8 9 10 11 12 130
20
40
60
80
100
120
140
160
Complexity (MSE)
Num
ber
of o
ccur
ence
Old RBC 7

The following analysis is being continued ……….
In fact, temporary results of linguistic analysis are not good enough to show the difference between new and old RBC.
Analysis should be continued ……..
Conclusions
Different techniques have been used to analyze the RBC data
The original data sources is messy, it is time-consumption to rearrange the database.
It is necessary to design parameters for quantifying the characteristics of mode functions.
Related Documents