Presentation Date: 6/5/12

Welcome message from author
This document is posted to help you gain knowledge. Please leave a comment to let me know what you think about it! Share it to your friends and learn new things together.
Transcript

Presentation Date: 6/5/12

Abstract
In this work, we analyze the efficiency and
accuracy of specific MapReduce
applications when their mapping functions
are allowed to drop for a certain percentage
of time. The applications chosen represent
programs whose results could fall within an
acceptable range of error. We contend that
these applications can produce reasonable
results with improved efficiency given a
certain percentage of failures during the
mapping phase of MapReduce. Our model
measures the efficiency of these applications
by the CPU time spent on each run. To
analyze accuracy we compare the results of
a zero failure run to runs with a given
probability of failure during mappings. We
saw speedups in the range of 1.25 to 3 with
very little loss in accuracy, most within
99%.
1. Introduction
Internet datacenters use a significant portion
of the world’s power consumption.
Worldwide, total datacenter power
consumption has more than doubled from
2005 to 2010. In the US, datacenters
accounted for 1.7% to 2.2% of the total
national power consumption in 2010 [4].
These datacenters rely on hardware whose
operational energy and cooling costs are
comparable to the initial cost of the
hardware itself [1]. Thus, it is in the
financial interest of datacenter operators to
innovate systems to improve data center
efficiency. Moreover, data center operators
have the unique opportunity to significantly
reduce our carbon footprint.
Energy efficiency can be improved through
hardware or software. We propose an all-
software technique for optimizing
MapReduce programs. We chose
MapReduce as the application framework
because it was invented by and is commonly
used by some of the largest Internet
companies running massive datacenters. We
chose to use the Hadoop [2] implementation
of MapReduce because it is open source and
thereby provides a clear foundation for
anyone who would like to build upon this
research.
Many applications that run on MapReduce
are dealing with fuzzy, incomplete data.
Their task is often to make estimates about
that data. We exploit this implicit tolerance
by strategically eliminating some input data.
In this paper, we explore the trade-off
between result quality and efficiency based
on this insight.
The remainder of this report is organized as
follows. Section 2 gives a brief overview of
MapReduce. Section 3 describes the general
technique used to improve efficiency.
Section 4 provides an overview of the
experiment set up and methodology. Section
5 details our results. Section 6 provides an
analysis of these results.
2. MapReduce
MapReduce was originally developed by
Google as a framework to process massive
amounts of data in parallel. Today,
MapReduce is utilized by Google to power
its search engine services, as well as other
large corporations like Amazon.com,
Facebook, Ebay, Yahoo!, and many others
[3].
MapReduce is appealing for several reasons.
First, programs written using the
MapReduce framework are automatically
run in parallel on the cluster—distributed
system. This simplifies the programmer’s
job by handling the parallelization aspect of
writing programs that are run on distributed
systems. It provides programmers with
relatively little experience in parallel
computing with the tools necessary to write
these applications. Another appeal is the low

cost of MapReduce. MapReduce can be run
on relatively cheap machines that provide a
less expensive alternative to specialized
clusters. Namely, it provides a system that
can handle fault tolerance on cheap, failure
prone machines. Moreover, MapReduce is
highly scalable. It can process petabytes of
data over thousands or millions of machines.
MapReduce applications consist of two user
defined functions. The Map function takes a
key-value pair and generates a set of
intermediate key-value pairs. The Reduce
function takes all intermediate key-value
pairs with a particular key and produces a
final set of key-value pairs. Both of these
functions are run on a distributed file system
(DFS). The partitioning of data, scheduling,
data input and output to the DFS and failure
handling is handled by the run-time system
executing the application.
The MapReduce application is executed in
several steps. There is one master daemon
responsible for coordinating the job on a
cluster of slave nodes. The input residing on
the DFS is divided into many different
chunks which are read and processed by
each Map worker node. The intermediate
key-values are stored on the Map worker
nodes and their location is reported to the
master daemon. The master daemon then
informs the Reduce worker nodes of these
locations. These Reduce nodes then read in
those intermediate key-values using a
remote procedure call. After the Reduce
worker has read all intermediate pairs, it
sorts the data by the key, applies the Reduce
function, and then outputs the results to an
output file residing on the DFS. The master
daemon also monitors whether any Map or
Reduce tasks are lagging behind and
executes backup tasks in case of failure.
Another Combine function can be provided
to reduce the amount of network traffic.
However, this work does not utilize this
feature.
3. Technique
MapReduce applications are commonly
programs that process massive amounts of
data in order to generate some sort of
analysis. E.g., applications that perform
epidemiological analysis, temperature
readings, social network analysis, or website
traffic analysis, etc. Often, these applications
may not require exact precision.
Furthermore, these programs are regularly
run on data that includes a substantial
amount of redundant information. Thus,
many of these applications are amenable to
approximate execution.
The MapReduce framework relies on
processing data via granular tasks. This
makes it is easy to discard them in a
controlled manner. Our experiment modifies
MapReduce programs to randomly drop
Map tasks with a given probability. This
consequently reduces the number of key-
value pairs that need to be stored by the Map
nodes and later processed by the Reduce
nodes. We then measure how this affects the
output quality and efficiency of these
programs. We also measure how this affects
the amount of data processed by the Reduce
nodes.
We conducted this analysis in order to show
that a MapReduce developer could take their
existing applications and improve efficiency
if they are willing to accept some
degradation in the quality of their output.
Furthermore, since our technique generally
amounts to a process of input sampling, a
developer could also use this method in
order to easily write random sampling
applications. Since the randomization of the
data is processed via the MapReduce
framework itself, it provides a simple and
efficient means of creating those
applications.

We also hope that this work will inspire new
ideas which improve upon our findings.
MapReduce has built-in fault tolerance
which spends time and energy recovering
from dropped tasks. One could design a
similar experiment which modifies the
MapReduce framework to simply ignore
these dropped tasks in a controlled manner.
While this is not explored in the current
work, it is likely that this would improve
efficiency even more.
4. Experiment
For our work, we used the Hadoop
implementation of MapReduce. It is a
popular open source implementation. It is
written in Java as are the benchmark
applications used in this work. The cluster
configurations are written in XML. All
documentation for Hadoop can be found
online [2].
Our cluster includes 9 machines, one master
node with 8 slave nodes. Each node has a
dual-core Intel Xeon @ 2.80 GHz with 2-
way hyperthreading (2 SMT threads per
core), 4 GB RAM, Gigabit Ethernet,
Maxtor 6Y080M0 (7200 RPM, 1.5 Gbps
SATA) storage, and runs Red Hat Enterprise
Linux Server 6.2 operating system (Linux
kernel 2.6.32). We used Hadoop version
0.20.205.0.
Hadoop was run in a somewhat controlled
environment. The cluster was not utilized by
any other applications while tests were being
run. However, the cluster had some shared
resources on a server that may or may not
have been utilized by others during
experimentation. To reduce the impact of
possible interference, we ran redundant runs
of the experiment and used the mean of
those runs in our results.
In order to drop Map data in each of our
applications, we modified each program’s
Map function to accept a probability of
failure parameter [0, 1.0] that would have
the Map function fail with that probability—
where 1.0 would always fail and 0 would
never. Each run included a 0, .25, .5, and .75
failure job. The data affected by the failures
in this experiment was fine grained. Each
application performed some sort of function
on the words in a text document. A failure
would only account for dropping one word
from the dataset. While this model may not
be applicable for datasets with high variation
and little redundancy or those with singular
and vital mappings, there are many
applications, like those mentioned in section
3, where this model is appropriate.
Our Hadoop jobs include: (1) WordMean, a
program that calculates the average length of
the words in a given text file; (2)
WordHistogram, a program that calculates
the frequency of the top 50 words in a given
text file; (3) TopK, a program that outputs
the top k words of a given text file (in our
experiment we used the top 500 words to
reduce the impact of common words). The
WordMean application was chosen knowing
that the average length of a word is more or
less static in a given text. It was chosen to
demonstrate the impact of map failures on
applications whose results are similar given
large and small dataset populations.
WordHistogram was chosen to demonstrate
general statistical impact that our
experiment would have on applications
whose results are distributions derived from
datasets. TopK was chosen to demonstrate
the impact of our experiment would have on
indexing and ranking applications.
We chose three data sets as input for our
experiment. For small input, we used the
complete text of Ulysses by James Joyce at
1.54 megabytes. For medium input: a 100
megabyte portion of an XML dump of
Wikipedia data. For large input: a 1 gigabyte
portion of the XML dump of Wikipedia
data.

The metrics we recorded on each run were:
(1) the CPU Time spent on each MapReduce
job as reported by Hadoop; and (2) the
amount of data output by the Map nodes.
The latter provided us with a general idea of
how dropping mappings affected the data
being stored locally at the Map nodes and
then transferred and processed by the
Reduce nodes. The later demonstrates
impact our system has on Map node storage,
communication between nodes, and Reduce
function input.
Each application’s results were compared to
a control run of the application with a 0
probability of failure during mapping. The
WordMean accuracy was calculated as:
ncontrolmea
ncontrolmeamean ||0.1
This was meant to represent programs
whose output is exact, but may have an
acceptable range of error. Moreover, since
the mean word length is fairly standard
throughout large or small populations of
words, this application represents a method
of random sampling large datasets to
produce a reasonably accurate result.
The histogram accuracy was calculated as:
controliword
controliwordiword
i _%__
|_%__%__|0.1
50
1
This accuracy was meant to model statistical
applications whose results are precise, but
may or may not fall within an acceptable
range of error. Many programs fall within
this category and we believe this model
provides a comparable benchmark for those
programs.
The TopK accuracy was calculated using
two methods. Method 1 compares the top k
results as sets, where:
|_|||
|_|0.1
SetControlSet
SetControlSet
This method allowed us to give an accuracy
metric which reflected fuzzy results in
which the ordering of the results does not
matter. A completely accurate result is
simply one in which both sets contain the
same words. We include this metric as it
illustrates a fairly large set of applications
wherein the accuracy of the results does not
depend on any specific ordering. For
example, a web search that only needs to
output site in no particular order. This model
is meant to demonstrate the accuracy of our
system for similar applications.
Method 2 compared the top k results using a
Levenshtein or Edit Distance function which
calculates the minimum number of edits
required for the two sets of words to be the
same [5]. This result was then used in the
function:
||
),(tan_0.1
Set
ControlSetceDisnLevenshtei
This method allowed us to calculate a metric
of accuracy that depends on the ordering of
our MapReduce output. In many cases, the
correctness of an application depends on the
ordering of its results. This model is meant
to demonstrate the efficacy of our system for
programs that fall into that category.
5. Results
Our results demonstrate that the CPU time
spent decreases linearly on applications
where mappings were dropped. This was
shown across all datasets, and was more
apparent when using larger datasets. The
accuracy was generally high—most within
99%—with the exception of the TopK tests
using Method 2 (Edit Distance) to calculate
accuracy. The accuracy fell considerably in
these cases. For example, with the largest
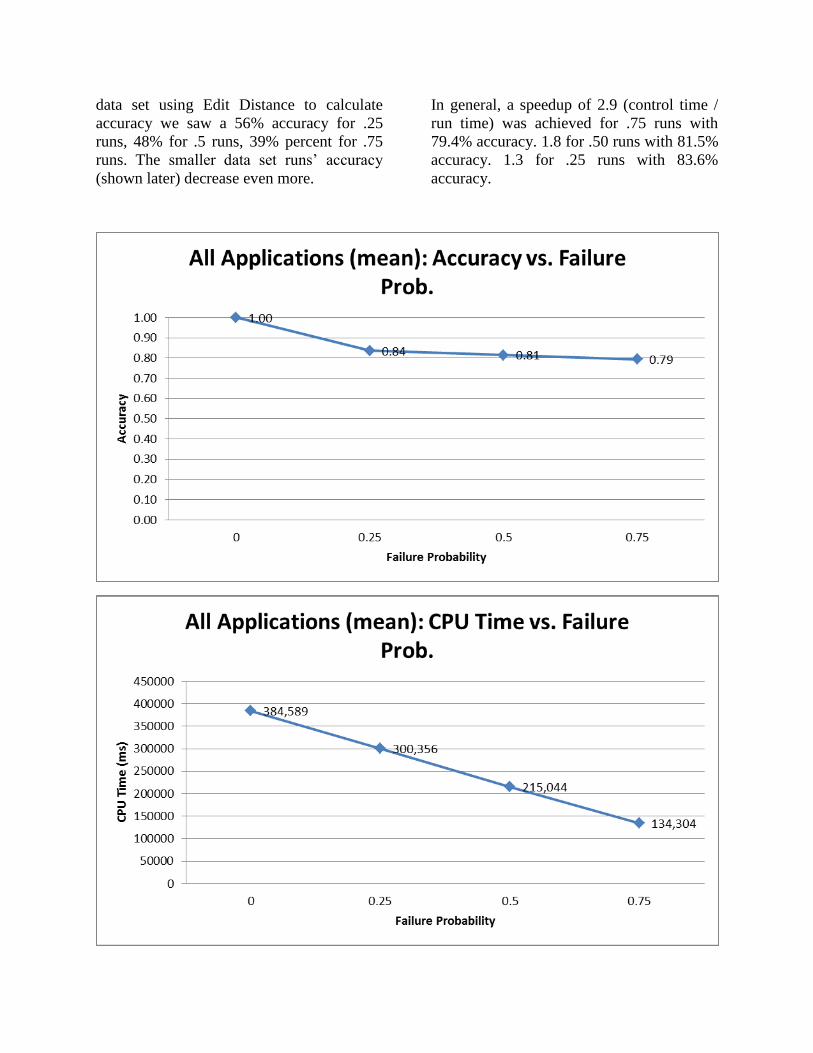
data set using Edit Distance to calculate
accuracy we saw a 56% accuracy for .25
runs, 48% for .5 runs, 39% percent for .75
runs. The smaller data set runs’ accuracy
(shown later) decrease even more.
In general, a speedup of 2.9 (control time /
run time) was achieved for .75 runs with
79.4% accuracy. 1.8 for .50 runs with 81.5%
accuracy. 1.3 for .25 runs with 83.6%
accuracy.

These results are even more promising when
eliminating the TopK method 2 results: a
speedup of 2.9 for .75 runs with 98%
accuracy. 1.8 speedup for .50 runs with
98.9% accuracy. 1.3 speedup for .25 runs
with 99.4% accuracy.
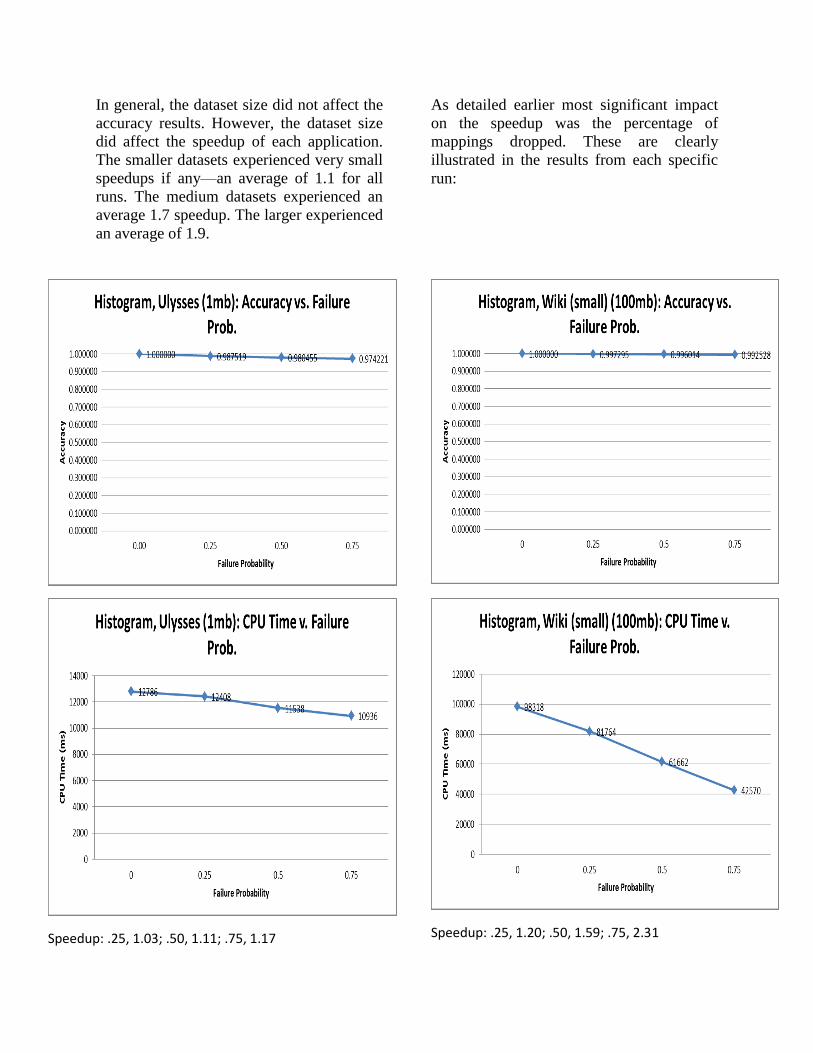
In general, the dataset size did not affect the
accuracy results. However, the dataset size
did affect the speedup of each application.
The smaller datasets experienced very small
speedups if any—an average of 1.1 for all
runs. The medium datasets experienced an
average 1.7 speedup. The larger experienced
an average of 1.9.
As detailed earlier most significant impact
on the speedup was the percentage of
mappings dropped. These are clearly
illustrated in the results from each specific
run:
Speedup: .25, 1.03; .50, 1.11; .75, 1.17
Speedup: .25, 1.20; .50, 1.59; .75, 2.31

Speedup: .25, 1.33; .50, 1.85; .75, 3.08
Speedup: .25, 1.00; .50, 1.08; .75, 1.14

Speedup: .25, 1.23; .50, 1.64; .75, 2.28
Speedup: .25, 1.27; .50, 1.84; .75, 2.99

Speedup: .25, 1.00; .50, 1.08; .75, 1.14
Speedup: .25, 1.23; .50, 1.64; .75, 2.28

Speedup: .25, 1.27; .50, 1.84; .75, 2.99
Speedup: .25, 0.99; .50, 1.09; .75, 1.19

Speedup: .25, 1.25; .50, 1.56; .75, 2.35
Speedup: .25, 1.28; .50, 1.72; .75, 2.74

The number of bytes output by the Map
nodes and processed by the Reduce nodes
decreased linearly as the failure probability
increased. This was expected considering
that the Map output is simply intermediate
key-value pairs. As one would expect, the
decrease in bytes on average was roughly
proportional to the probability of failure—
where you would see a .25 decrease in the
bytes output for a .25 failure probability.
6. Analysis / Conclusion
The results demonstrate that there is
potential for energy savings by allowing
certain MapReduce applications to fail
during the mapping phase. This method
lends itself to applications whose results
may be fuzzy or within an acceptable range
of error. Also, if there is enough redundancy
or common output in the datasets, our
random failure model provides an efficient
means of sampling these datasets without
much loss in accuracy. This is clearly
displayed in the word mean results. Of
course, this method would not be
appropriate for applications which have
singular important data mappings whose
removal would skew the results.
Nonetheless, the results show that such a
system could provide programmers with an
efficient method of gathering a random
sampling of data in order to produce
reasonable results.
In general, we saw a linear speedup of our
applications. This linear speedup was more
drastic on larger datasets and somewhat
more on applications that were more
computationally intensive. Of course, these
results would scale according to the size of
the job and cluster. Jobs that take hours
could be accomplished in a third or fourth of
the time, or possibly faster. Considering that
our datasets were relatively small in
comparison to those used by large
datacenters, the potential gains in efficiency
are encouraging.
We also saw a linear drop in the amount of
data output by our Map nodes. These are the
intermediate key-value pairs sent to Reduce
Nodes. This decrease showed that the
storage space requirements per Map node
and the memory requirements per Reduce
node could be decreased. Thus, cluster
administrators could further improve their
efficiency by fine tuning their clusters to
require fewer resources when running these
jobs. While this study does not focus on this
aspect, the results show that there is
potential to improve the general resource
overhead required by Map and Reduce
nodes.
It is important to note that some of the
applications used might have behaved
differently given other parameters. For
example, the word histogram would produce
a lower accuracy if calculating the frequency
of the top 500 or 10000 words rather than
50. However, an application programmer
using those parameters may still find that the
accuracy falls within an acceptable range—
depending on their specific requirements. Of
course, this will vary based on the
application and desired results. Nonetheless,
our study shows that programmers have the
opportunity to fine tune their MapReduce
applications in order to reduce their power
consumption or simply run their jobs faster.
In general, this study shows that certain
MapReduce applications may benefit by
introducing a similar acceptable failure
model. The range of acceptable accuracy
will vary from application to application and
may not be appropriate for certain programs.
However, we believe that there are many
MapReduce applications that fall within the
general range of the applications we tested.
Therefore, there is great potential for
software developers to control the amount of
time and energy their applications consume.
While our experimental model focused on
controlling the failures via the Map function,
one could also consider a variation of
Hadoop that controls the failures internally
via the master daemon. Such an
implementation would likely produce better
results by reducing the amount of work done
by Map nodes. In either case, we believe
there is potential to save time and energy
using a similar system.
The results shown in this paper provide a
modest demonstration that MapReduce
software developers have an opportunity to
reduce the amount of resources and time it
takes for their programs to run. When
considering the scale and reach of
MapReduce as it is used in today’s
datacenters, there is the possibility that even
a small scale adoption by of some
comparable mechanism would improve
efficiency and possibly even reduce our
carbon footprint.
7. References
[1] C. Belady. In the data center, power and
cooling costs more than the IT equipment it
supports. Electronics Cooling Magazine,
13(1):24–27, February 2007.
[2] Hadoop. http://hadoop.apache.org.
[3] Hadoop Wiki.
http://wiki.apache.org/hadoop/PoweredBy
[4] Jonathan Koomey. Growth in Data
center electricity use 2005 to 2010. Oakland,
CA: Analytics Press, August 2011.
[5] Levenshtein.
http://en.wikipedia.org/wiki/Damerau-
Levenshtein_distance
Related Documents