Economics COVID-19 June data and revised air travel outlook Brian Pearce Chief Economist 1 28 th July 2020

Welcome message from author
This document is posted to help you gain knowledge. Please leave a comment to let me know what you think about it! Share it to your friends and learn new things together.
Transcript

Economics
COVID-19June data and revised
air travel outlook
Brian Pearce
Chief Economist
1
28th July 2020
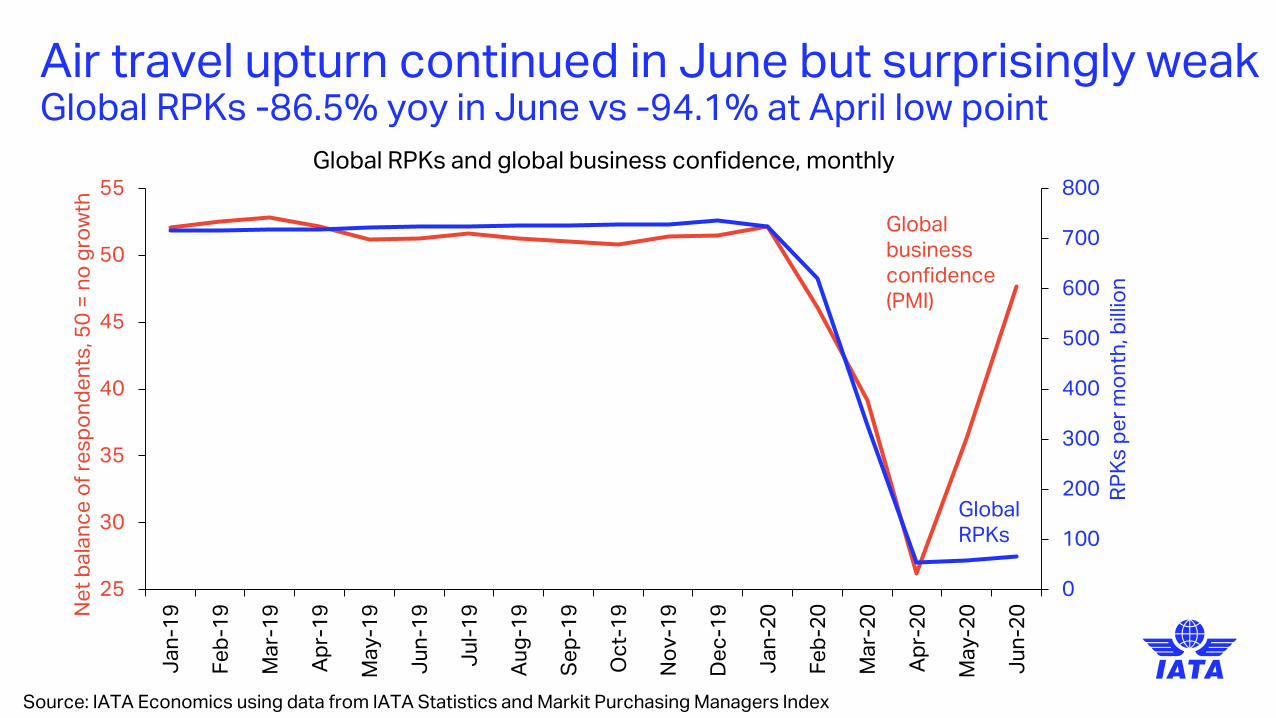
Air travel upturn continued in June but surprisingly weakGlobal RPKs -86.5% yoy in June vs -94.1% at April low point
Source: IATA Economics using data from IATA Statistics and Markit Purchasing Managers Index
0
100
200
300
400
500
600
700
800
25
30
35
40
45
50
55J
an
-19
Fe
b-1
9
Ma
r-1
9
Ap
r-1
9
Ma
y-1
9
Ju
n-1
9
Ju
l-1
9
Au
g-1
9
Se
p-1
9
Oc
t-1
9
No
v-1
9
De
c-1
9
Ja
n-2
0
Fe
b-2
0
Ma
r-2
0
Ap
r-2
0
Ma
y-2
0
Ju
n-2
0
RP
Ks
pe
r m
on
th, b
illio
n
Ne
t b
ala
nc
e o
f re
sp
on
de
nts
, 50
= n
o g
row
th
Global RPKs and global business confidence, monthly
Global RPKs
Global business confidence(PMI)

June upturn narrowly based on domestic marketsChina domestic travel growing but little growth on international markets
Source: IATA Economics using data from IATA Statistics
-120%
-100%
-80%
-60%
-40%
-20%
0%
20%
40%
Ja
n-1
9
Fe
b-1
9
Ma
r-1
9
Ap
r-1
9
Ma
y-1
9
Ju
n-1
9
Ju
l-1
9
Au
g-1
9
Se
p-1
9
Oc
t-1
9
No
v-1
9
De
c-1
9
Ja
n-2
0
Fe
b-2
0
Ma
r-2
0
Ap
r-2
0
Ma
y-2
0
Ju
n-2
0
% c
ha
ng
e y
ea
r-o
n-y
ea
r
Growth in RPKs by region of registration
China domestic -35.5%
US domestic-80.1%
All regions international-96 to -98%

Border restrictions have not yet been widely relaxedThe few travel corridors (e.g. EU) only source of international air travel
Source: IATA Timatic (www.iatatravelcentre.com)
Current Border Restrictions, as of 24 July

Load factors remain at all-time lows in most regionsJune domestic load factors 62.9% but international only 38.9%
All-time Jun low* All-time Jun high*
Industry
L. America
Asia Pacific
Europe
N. America
Middle East
Africa
Domestic China
0% 10% 20% 30% 40% 50% 60% 70% 80% 90%
Jun 2020 Jun 2019
Passenger load factors (% of available seat kms, actual)
57.6%
66.6%
63.8%
55.5%
52.4%
35.7%
16.2%
84.4%
83.3%
82.2%
87.4%
88.9%
76.4%
71.1%
*Data from 1990 onwards
69.5% 84.8%
Source: IATA Economics using data from IATA Statistics

Traffic not growing as fast as airlines adding capacityCash burn continuing as load factors still below breakeven
-100%
-80%
-60%
-40%
-20%
0%
20%J
an
-19
Fe
b-1
9
Ma
r-1
9
Ap
r-1
9
Ma
y-1
9
Ju
n-1
9
Ju
l-1
9
Au
g-1
9
Se
p-1
9
Oc
t-1
9
No
v-1
9
De
c-1
9
Ja
n-2
0
Fe
b-2
0
Ma
r-2
0
Ap
r-2
0
Ma
y-2
0
Ju
n-2
0
% c
ha
ng
e y
ea
r-o
n-y
ea
r
Domestic RPKs and ASKs, % yoy
Capacity growth
Traffic growth
Source: IATA Economics using data from IATA Statistics

Unexpectedly weak demand a growing restart problemAirline flights and schedules show faster rebound expected
Source: IATA Economics using data from IATA Statistics, DDS, FR24 and SRS Analyser
-100%
-90%
-80%
-70%
-60%
-50%
-40%
-30%
-20%
April-20 May-20 June-20 July-20 August-20
% c
ha
ng
e y
ea
r-o
n-y
ea
r
Global RPKs and ASKs, % change year-on-year
Based on bookings
Based on flights
Based on schedules

Businesses are confident GDP growth will rise sharplyBut business travel on hold so this will not be an immediate boost
Source: IATA Economics using data from Markit
10
15
20
25
30
35
40
45
50
55
60
Jan-19 Mar-19 May-19 Jul-19 Sep-19 Nov-19 Jan-20 Mar-20 May-20
Ne
t b
ala
nc
e o
f s
es
po
nd
en
ts, 5
0 =
no
gro
wth
Business confidence
China
UKUSGermany

Consumer confidence remains much weakerLeisure travel unlikely to recovery without confidence restored
Source: IATA Economics using data from IATA Statistics
60
70
80
90
100
110
120
-20
-15
-10
-5
0
5
10
Jan-19 Mar-19 May-19 Jul-19 Sep-19 Nov-19 Jan-20 Mar-20 May-20
Ne
t b
ala
nc
e o
f re
sp
on
da
nts
, in
de
x 1
00
in
Ja
n 2
01
9
Ne
t b
ala
nc
e o
f re
sp
on
da
nts
, in
de
x z
ero
in
Ja
n 1
9
Consumer confidence
China
UK
US
Germany

The outlook for global GDP could take different pathsWe’ve explored optimistic and a pessimistic scenarios for the economy
Source: IATA Economics using data from Oxford Economics Q2 Global Scenarios Service
70
75
80
85
90
95
100
105
2018 2019 2020 2021 2022 2023 2024 2025
US
$ t
rilli
on
, 20
15
pri
ce
s
Global GDP, US$ trillion, 2015 prices
Baseline forecast
Faster vaccine/ testing scenario
2nd wave COVID + financial crisis scenario

RPK forecasts downgraded; 2019 regained only by 202475% growth now forecast for 2021 but RPKs still 36% below 2019 levels
Source: IATA/Tourism Economics ‘Air Passenger Forecasts’ July 2020
0
2
4
6
8
10
12
2010 2012 2014 2016 2018 2020 2022 2024
RP
Ks
, tri
llio
n p
er
ye
ar
Global RPKs, trillion per year
Range of uncertainty
New baseline
Pre-COVID19 baseline
2019 levels recovered by

Related Documents