From Basel I to Basel III and beyond – state of the play DKF 2014 Dorothea Schäfer Munich, April 1, 2014

Welcome message from author
This document is posted to help you gain knowledge. Please leave a comment to let me know what you think about it! Share it to your friends and learn new things together.
Transcript

From Basel I to Basel III and beyond – state of the play
DKF 2014
Dorothea Schäfer
Munich, April 1, 2014

1 Basel I
2 Basel II and risk weighting
3 Basel III: state of the play and assessment
4 Beyond
Overview

Dorothea Schäfer From Basel I to Basel III
Basel I
1
3

Basel I
Initiation: Herstatt bankruptcy 1974
Publication of new rules 1988, Implementation: 1992,
Minimum capital requirement = amount of credit x 8 % x percentage
weight of risk class
Risk classes and percentage weights: no discredition for banks
• 0 % for sovereign bonds of OECD-countries (zero!)
• 20% for interbank credits (1 million) within OECD countries (16 000)
• 50% for collateralized real estate credits (40 000)
• 100% for other credit engagement including loans to corporations (80000)
Important elements
1
From Basel I to Basel III Dorothea Schäfer 4

Basel I
1. Common equity capital and retained earnings (core (Tier 1) capital)
2. Additional internal and external resources of the bank
(supplementary capital, long-term liabilities, specific provisions)
Tier 1 capital: core Tier 1 capital plus other instruments, e.g. non-
redeemable non-cumulative preferred stock
Loss taking: Common equity capital and retained earnings
Weird: other instruments than loss taking instruments qualify as bank
capital
Definition of capital within Basel I
1
From Basel I to Basel III Dorothea Schäfer 5

Basel I
• Only four risk categories
• Independency of risk weights of borrower‘s solvency
and liquidity
• Cross-subsidization of loans and credits (good
borrowers subsidize bad borrowers)
Main critique of Basel I
1
From Basel I to Basel III Dorothea Schäfer 6

Basel II
2
Dorothea Schäfer 7 From Basel I to Basel III

Basel II
2004: publication of Basel II framework
2007: implementation
Main elements
1. Basically no change in definition of capital
2. Introduction of individual risk weights
1. Ratings (ECAI External Credit Assessment Institution, e.g S&P, Moody’s,
Fitsch)[standard approach]
2. Own calculations (bank itself assesses risk)[IRB approach]
3. Calculation of a bank’s required capital
Basic Overview
2
From Basel I to Basel III Dorothea Schäfer 8
capital x 100 % ≥ 8 % (minimum capital ratio)
credit risk + 12.5 (market risk + operational risk)

Basel II
Calculation of Risk weights: standard approach
1
From Basel I to Basel III Dorothea Schäfer 9
Credit exposure to
Rating classes (coming from ECAI)
AAA A+ BBB+ BB+ B+ Below Without
to to to to to B- Rating
AA- A- BBB- BB- B-
Sovereign states/central banks (Lex EU)
0% 20% 50% 100% 150% 100%
Banks (option 1-3): according to the rating of the home state (option 1)
20% 50% 100% 150% 100%
Corporations/non-banks
20% 50% 100% 150% 100%
Asset Backed Securities
20% 50% 100% 350%
1.250 % (deductio
n from core
capital)
Basel II
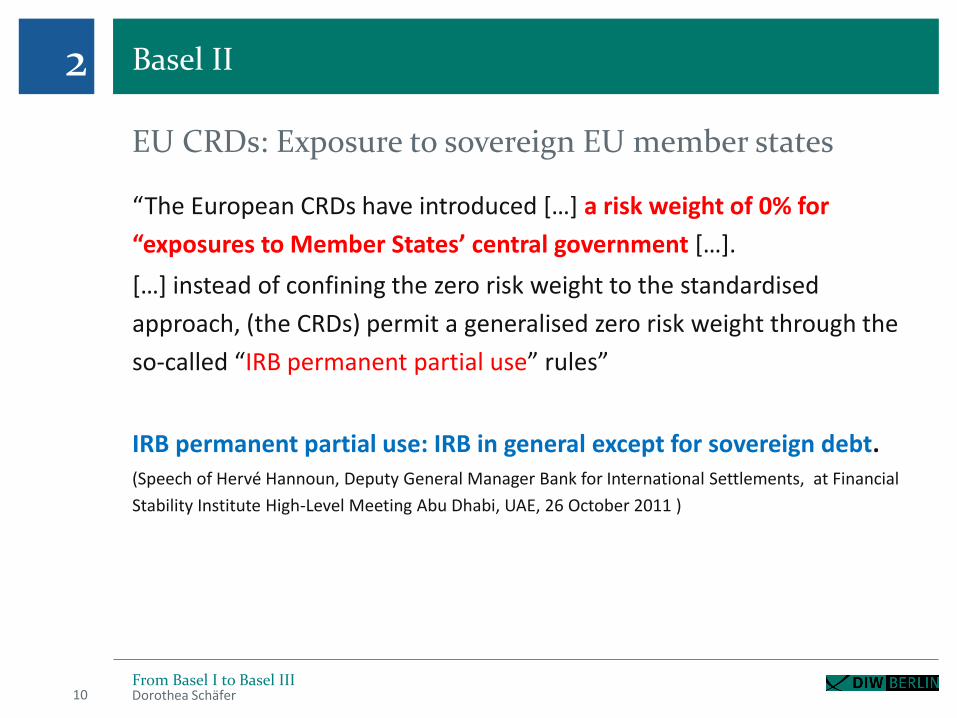
“The European CRDs have introduced […] a risk weight of 0% for
“exposures to Member States’ central government […].
[…] instead of confining the zero risk weight to the standardised
approach, (the CRDs) permit a generalised zero risk weight through the
so-called “IRB permanent partial use” rules”
IRB permanent partial use: IRB in general except for sovereign debt. (Speech of Hervé Hannoun, Deputy General Manager Bank for International Settlements, at Financial
Stability Institute High-Level Meeting Abu Dhabi, UAE, 26 October 2011 )
EU CRDs: Exposure to sovereign EU member states
2
From Basel I to Basel III Dorothea Schäfer 10

Basel II
Amount of credit (in million Euro)
Risk weight (%)
Minimum capital ratio (%)
Mimimum capital
Leverage ratio
Leverage
2 5% 8% 8000 0,40% 250
50% 8% 80000 4,00% 25
Example for the calculation of minimum
capital
1
From Basel I to Basel III Dorothea Schäfer 11
Risk weight IRB approach: RW(LGD, PD, M)

Basel II
Incentives
2
Dorothea Schäfer 12
From Basel I to Basel III
1. Investing in the zero risk weight debt of EU member
states
2. Minimum risk assessment with own models
3. Investing in highly rated securities (e.g super senior
tranches of US subprime CDOs)
4. Installing off-balance sheet vehicles with no capital
requirements (continues from Basel I, no
counterbalancing regulation present)

Basel II
Consequence
2
Dorothea Schäfer 13
From Basel I to Basel III
1. Growing of total assets without additional capital
2. Bank got bigger and bigger
3. Excessive leverage and extremely low leverage
ratios
4. Expansion of off-balance sheet vehicles

Basel II
Basis for such incentives
Leverage effet in combination with bonuses which are linked to the return
on equity
2
From Basel I to Basel III Dorothea Schäfer 14
return return on equity
return on assets
interest rate
debt/equity
If equity capital is fixed more debt brings the bank managers in the desired direction

Basel II
Trends in banking after introduction of risk
weighting
Leverage (multiple of equity capital) and ratio of risk-
weighted and total assets of the four largest banks in UK
2
From Basel I to Basel III Dorothea Schäfer 15
30
35
40
45
50
55
15
20
25
30
35
2000 2001 2002 2003 2004 2005 2006 2007 2008
Hebel (100 Prozent/Leverage Ratioin Prozent) (linke Skala)
risikogewichteteAktiva/Bilanzsumme in Prozent(rechte Skala)
Leverage (left-hand axis)
Risk-weighted assets to total assets (right-hand axis) in %

Basel II
Acceleration of a ongoing trend? Leverage Ratio of
Deutsche Bank (1870-1914)
2
From Basel I to Basel III Dorothea Schäfer 16
Basel II
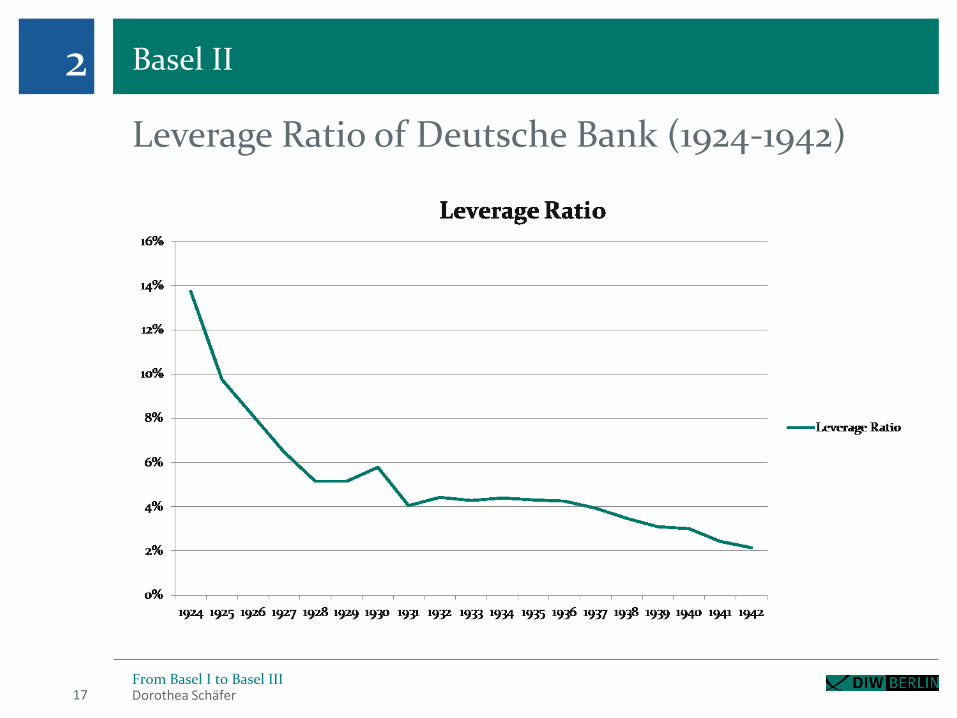
Leverage Ratio of Deutsche Bank (1924-1942)
2
From Basel I to Basel III Dorothea Schäfer 17
Basel II
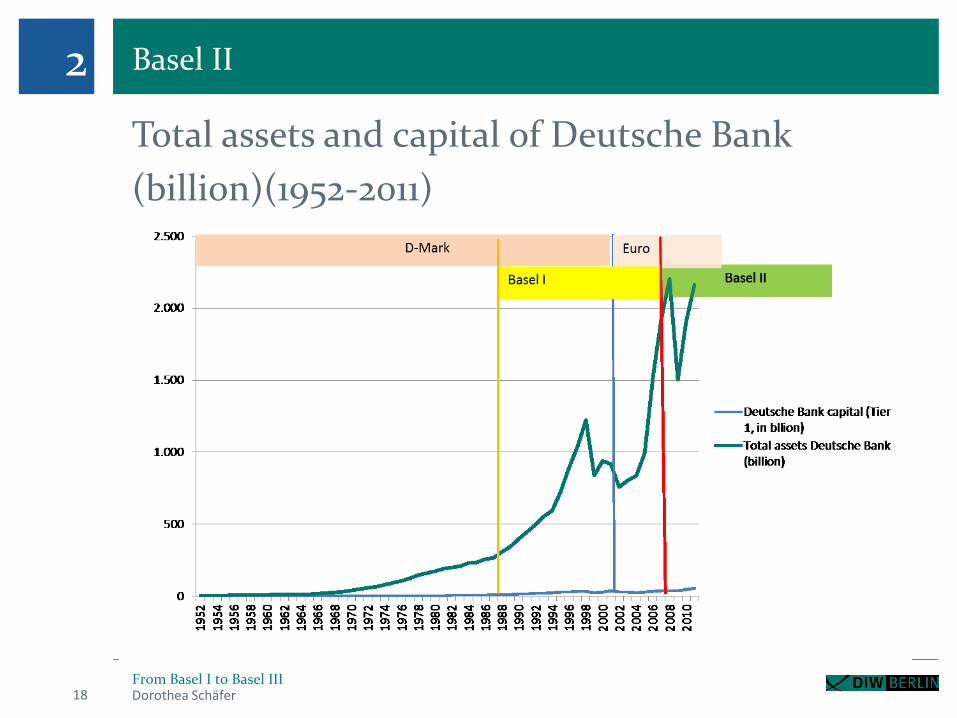
Total assets and capital of Deutsche Bank
(billion)(1952-2011)
2
From Basel I to Basel III Dorothea Schäfer 18

Basel II
Leverage Ratio of Deutsche Bank (1952-2011)
2
From Basel I to Basel III Dorothea Schäfer 19
Trend till 2019?

Basel II
More anectotic evidence: the Swedish real estate case
2
Dorothea Schäfer 20
When the Basel 2 accord came into effect in Sweden in 2007, Sweden’s
largest mortgage lenders were authorized by FI to use internal models to
calculate the risk weights in their credit exposures. The result of the
introduction of the models was that risk weights for Swedish mortgages
dropped sharply, and many of the largest players now have average risk
weights down at around 5 per cent for these exposures. This can be
compared to risk weights of 50 per cent in the regulations applicable until
2007 – the Basel 1.” (Finansinspektionen – Memorandum Nov 26, 2012)
From Basel I to Basel III

Basel II
More anectotic evidence: the Swedish real estate case
2
Dorothea Schäfer 21
When the Basel 2 accord came into effect in Sweden in 2007, Sweden’s
largest mortgage lenders were authorized by FI to use internal models to
calculate the risk weights in their credit exposures. The result of the
introduction of the models was that risk weights for Swedish mortgages
dropped sharply, and many of the largest players now have average risk
weights down at around 5 per cent for these exposures. This can be
compared to risk weights of 50 per cent in the regulations applicable until
2007 – the Basel 1.” (Finansinspektionen – Memorandum Nov 26, 2012)
From Basel I to Basel III

Basel II
Summer stress test of EBA in 2011
Starke Hebelung der Bankbilanzen großer Banken
2
From Basel I to Basel III Dorothea Schäfer 22
10 largest German banks (in million Euro)
Source: DIW Berlin, own calculations on the basis of published stress test data.
Leverage Ratio in %
If a leverage ratio of 5% is required Cap required(left)/additional cap needed right (million Euro)

Basel II
Ongoing: high leverage in banks‘ balance sheets
2
From Basel I to Basel III Dorothea Schäfer 23
IMF Financial Stability Report 2012

Basel II
The zero risk weight approach for EU member states fires
back
2
Dorothea Schäfer 24
From Basel I to Basel III
Dramatic loss of value of large proportion of EU-banks‘ assets because of downgrading Investors lost confidence in solvency of banks (and of states)
AAA
AA
A
BBB
BB
B
CCC
CC
C
SD
01.01.2009 16.05.2010 28.09.2011 09.02.2013
Rating steps 01.01.2009 - 01.09.2013
Greece Ireland Italy Portugal Spain
Source: Christopher F. Baum & Margarita Karpava & Dorothea Schäfer & Andreas Stephan, 2013. "Credit Rating Agency Downgrades and the Eurozone Sovereign Debt Crises," Boston College Working Papers in Economics 841,

From Basel I to Basel III Dorothea Schäfer 25
-500
0
500
1000
1500
2000
2500
3000
3500
4000Spreads Sovereign Bonds 2000 – 2014: losses in value until
summer 2012
Frankreich
Italien
Portugal
Irland
Griechenland
Spanien
Hans-Helmut Kotz und Dorothea Schäfer (2014), Rating-Agenturen: Fehlbar und überfordert. In: Schäfer D, Semmler W. and Young B. (Ed.), Nachhaltige Europäische Konsolidierungspolitik

Basel II
Conclusion for Basel II
2
From Basel I to Basel III Dorothea Schäfer 26
Risk weights in Basel II • have enabled banks to get larger and larger without increasing the amount of
loss-absorbing equity capital, • made banks more vulnerable, • have contributed to the European financial crisis
• because of the short distance of many large European banks to default and
• the therefore high probability that sovereign EU/Euro member states have to accumulate more debt in order to help their banks
In addition: lobby groups use risk weights to fight for lower ones (e.g. sme loans, real estate loans, energy investments). This may decrease credit costs on the micro level but decreases stability on the macro level (race to the bottom)

Basel III
Is it the answer to these problems?
3
Dorothea Schäfer 27 From Basel I to Basel III

Basel III
Important elements
3
From Basel I to Basel III Dorothea Schäfer 28
• Narrower definition of eligible capital (focus: loss absorption)
• Increase of capital requirements
• Banks in general
• Global systemically (Sifis), domestic systemically important
financial institutions
• Leverage ratio
Still dominant: risk weighting is basis for capital requirements
Struggle with US about role of rating agencies

Basel III
Important elements
3
From Basel I to Basel III Dorothea Schäfer 29
• Liquidity coverage ratio and net stable funding ratio
• Liquidity for 30 day of stress (recently postponed 2015 to
2019)
• NSFR: fighting of maturity mismatch (goal: liquid for one
year)
• Payment rules (bonus systems)
(CRD IV: EUP and EUC struggle)

Basel III
Capital requirements
3
From Basel I to Basel III Dorothea Schäfer 30
• Core capital (Common equity and retained earnings)
• Banks in general (7 %, including max. CCB: 9.5 %)
• from 2% to 4.5%
• capital conservation buffer: 2.5 % (supervisory authorities impose
constraints)
• Counter cylical buffer (CCB) from 0 to 2.5 %
• Sifis: on top between 1% and 2.5 % (depends on
importance) + 1% in addition for the highest class Sifis (in
discussion)
Reminder: Tier 1 capital ratio of German banks 11.9 % (IMF)

Basel III
Capital requirements
3
From Basel I to Basel III Dorothea Schäfer 31
CRD IV: EUP and EUC struggle about eligibility of additional
buffers (Sweden, UK)
EUP: fear of competitive advantage for buffer countries
Weird because for years lower capital requirements than the
“strong Basel II” rules were labelled as competitive advantage
(e.g. German banks complained a lot about US bank not
following the Basel II rules)

Basel III
Capital requirements
3
From Basel I to Basel III Dorothea Schäfer 32
Leverage ratio : 3 percent in 2019
• Too low for large banks
it implies a leverage of 33 x the required capital,
no constraint for the growth in size (no constraint for mh)
• Required capital is broader defined than the core capital,
therefore: required core leverage ratio is actually lower
• Too late
• Not exactly clear: mandatory or only ratio for observation

Basel III
Final remark
3
From Basel I to Basel III Dorothea Schäfer 33
Basel III is not the answer to the identified problems
• It does not effectively constrain the leveraged growth model
of banks
• It does not effectively constrain the banks’ discretion about
the risk weighting and the capital requirements
• It does not effectively remove the management’s incentive
to build on the leveraged growth model
• Limitation of the moral hazard (mh) problem of Sifis: highly
questionable

Vielen Dank für Ihre Aufmerksamkeit.
DIW Berlin — Deutsches Institut
für Wirtschaftsforschung e.V.
Mohrenstraße 58, 10117 Berlin
www.diw.de
Thanks for your attention
Related Documents