Cornell University ILR School DigitalCommons@ILR Labor Dynamics Institute Centers, Institutes, Programs 4-25-2012 Presentation: A comparison of the contribution of labor reallocation to aggregate productivity growth: Canada and the United States Charles Berube Industry Canada Benoit Dostie Institute of Applied Economics, HEC Montreal Lars Vilhuber Cornell University, [email protected] Follow this and additional works at: hp://digitalcommons.ilr.cornell.edu/ldi ank you for downloading an article from DigitalCommons@ILR. Support this valuable resource today! is Article is brought to you for free and open access by the Centers, Institutes, Programs at DigitalCommons@ILR. It has been accepted for inclusion in Labor Dynamics Institute by an authorized administrator of DigitalCommons@ILR. For more information, please contact [email protected].

Welcome message from author
This document is posted to help you gain knowledge. Please leave a comment to let me know what you think about it! Share it to your friends and learn new things together.
Transcript

Cornell University ILR SchoolDigitalCommons@ILR
Labor Dynamics Institute Centers, Institutes, Programs
4-25-2012
Presentation: A comparison of the contribution oflabor reallocation to aggregate productivity growth:Canada and the United StatesCharles BerubeIndustry Canada
Benoit DostieInstitute of Applied Economics, HEC Montreal
Lars VilhuberCornell University, [email protected]
Follow this and additional works at: http://digitalcommons.ilr.cornell.edu/ldiThank you for downloading an article from [email protected] this valuable resource today!
This Article is brought to you for free and open access by the Centers, Institutes, Programs at DigitalCommons@ILR. It has been accepted for inclusionin Labor Dynamics Institute by an authorized administrator of DigitalCommons@ILR. For more information, please contact [email protected].

Presentation: A comparison of the contribution of labor reallocation toaggregate productivity growth: Canada and the United States
AbstractThis paper contributes to the literature by computing the contribution of labor reallocation to productivitygrowth for the United States and Canada, using several different decomposition specifications, and applying aconsistent approach to data from both countries. We compute the Baily, Hulten & Campbell (1992),Griliches & Regev (1995), Foster, Haltiwanger & Krizan (2001), and Baldwin & Gu (2006) decompositions,for both three-year and five-year time frames. We focus on the manufacturing sector for both countries, andassess the robustness of the conclusions to alternate specifications that the data from one or the other countryallow us to do.
Keywordsproductivity decomposition, Canada, United States, LBD, T2LEAP
CommentsSuggested Citation
Berube, C., Dostie, B. & Vilhuber, L. (2012, April). A comparison of the contribution of labor reallocation toaggregate productivity growth: Canada and the united states. Presented at CAED, Nurnberg.
Required Publisher's Statement
Copyright held by authors.
This article is available at DigitalCommons@ILR: http://digitalcommons.ilr.cornell.edu/ldi/6

A comparison of the contribution of laborreallocation to aggregate productivity growth:
Canada and the United States
Charles Berube4 Benoit Dostie1 Lars Vilhuber2,3
1Institute of Applied Economics, HEC Montreal
2Center for Economic Studies/LEHD,
3 ILR, Cornell University
4Industry Canada
CAED 2012, Nurnberg
Berube, Dostie, Vilhuber Reallocation

Introduction Methodology Data Results Conclusion
Disclaimer
I Vilhuber’s research was supported by NSF Grant SES-0820349,SES-1042181, and SES-1042181.
I Part of the research was done while one of the researchers was aSpecial Sworn Status researcher of the U.S. Census Bureau at theCenter for Economic Studies. Research results and conclusionsexpressed are those of the authors and do not necessarily reflect theviews of the Census Bureau.
I Other data used in this paper are confidential data housed at aStatistics Canada Research Data Center, accessed through the OttawaHead Office by arrangement with Industry Canada.
I All results presented in this paper have been screened to insure that noconfidential data are revealed.
Berube, Dostie, Vilhuber Reallocation

Introduction Methodology Data Results Conclusion
Disclaimer (2)
This is work in progress, and results are very preliminary!
Berube, Dostie, Vilhuber Reallocation

Introduction Methodology Data Results Conclusion
Outline
Introduction to the paper
Methodology
Data
Results
Conclusion
Berube, Dostie, Vilhuber Reallocation

Introduction Methodology Data Results Conclusion
CAED/COST link
Cross-national analysis
I We started several years ago with Canadian survey(WES), French and US administrative data (CAED2009).
I This paper is with US and Canadian administrative data(combined in the US with firm survey data: ASM)
I “Multi-site, multi-author” replication approachI start with same code, sit in front of respective secure
terminalsI ... then see what happens....
Berube, Dostie, Vilhuber Reallocation

Introduction Methodology Data Results Conclusion
CAED/COST link
Cross-national analysis
I We started several years ago with Canadian survey(WES), French and US administrative data (CAED2009).
I This paper is with US and Canadian administrative data(combined in the US with firm survey data: ASM)
I “Multi-site, multi-author” replication approach
I start with same code, sit in front of respective secureterminals
I ... then see what happens....
Berube, Dostie, Vilhuber Reallocation

Introduction Methodology Data Results Conclusion
CAED/COST link
Cross-national analysis
I We started several years ago with Canadian survey(WES), French and US administrative data (CAED2009).
I This paper is with US and Canadian administrative data(combined in the US with firm survey data: ASM)
I “Multi-site, multi-author” replication approachI start with same code, sit in front of respective secure
terminals
I ... then see what happens....
Berube, Dostie, Vilhuber Reallocation

Introduction Methodology Data Results Conclusion
CAED/COST link
Cross-national analysis
I We started several years ago with Canadian survey(WES), French and US administrative data (CAED2009).
I This paper is with US and Canadian administrative data(combined in the US with firm survey data: ASM)
I “Multi-site, multi-author” replication approachI start with same code, sit in front of respective secure
terminalsI ... then see what happens....
Berube, Dostie, Vilhuber Reallocation

Introduction Methodology Data Results Conclusion
Replication issues
Slew of issuesI lack of common variable names
I code divergence/creepI different merge/match issuesI different variable definitions - obvious and subtle - that
affect the outcomesI access issues
Berube, Dostie, Vilhuber Reallocation

Introduction Methodology Data Results Conclusion
Replication issues
Slew of issuesI lack of common variable namesI code divergence/creep
I different merge/match issuesI different variable definitions - obvious and subtle - that
affect the outcomesI access issues
Berube, Dostie, Vilhuber Reallocation

Introduction Methodology Data Results Conclusion
Replication issues
Slew of issuesI lack of common variable namesI code divergence/creepI different merge/match issues
I different variable definitions - obvious and subtle - thataffect the outcomes
I access issues
Berube, Dostie, Vilhuber Reallocation

Introduction Methodology Data Results Conclusion
Replication issues
Slew of issuesI lack of common variable namesI code divergence/creepI different merge/match issuesI different variable definitions - obvious and subtle - that
affect the outcomes
I access issues
Berube, Dostie, Vilhuber Reallocation

Introduction Methodology Data Results Conclusion
Replication issues
Slew of issuesI lack of common variable namesI code divergence/creepI different merge/match issuesI different variable definitions - obvious and subtle - that
affect the outcomesI access issues
Berube, Dostie, Vilhuber Reallocation

Introduction Methodology Data Results Conclusion
Background
I A large literature attempts to quantify how factorreallocation contributes to productivity growth.
I Some numbers:
I Quarterly job reallocation rates are about 12% in the US(Abowd and Vilhuber 2011)
I Worker reallocation rates are about 2-3 times larger(Abowdand Vilhuber 2011)
I Labor productivity growth is an important contributor
I 50% of labor productivity growth is dependent on laborreallocation (Foster, Haltiwanger, and Krizan 2001, USdata)
I ... or is it higher: 70% (Lentz and Mortensen 2008, Danishdata)
Berube, Dostie, Vilhuber Reallocation

Introduction Methodology Data Results Conclusion
Background
I A large literature attempts to quantify how factorreallocation contributes to productivity growth.
I Some numbers:I Quarterly job reallocation rates are about 12% in the US
(Abowd and Vilhuber 2011)
I Worker reallocation rates are about 2-3 times larger(Abowdand Vilhuber 2011)
I Labor productivity growth is an important contributor
I 50% of labor productivity growth is dependent on laborreallocation (Foster, Haltiwanger, and Krizan 2001, USdata)
I ... or is it higher: 70% (Lentz and Mortensen 2008, Danishdata)
Berube, Dostie, Vilhuber Reallocation

Introduction Methodology Data Results Conclusion
Background
I A large literature attempts to quantify how factorreallocation contributes to productivity growth.
I Some numbers:I Quarterly job reallocation rates are about 12% in the US
(Abowd and Vilhuber 2011)I Worker reallocation rates are about 2-3 times larger(Abowd
and Vilhuber 2011)
I Labor productivity growth is an important contributor
I 50% of labor productivity growth is dependent on laborreallocation (Foster, Haltiwanger, and Krizan 2001, USdata)
I ... or is it higher: 70% (Lentz and Mortensen 2008, Danishdata)
Berube, Dostie, Vilhuber Reallocation

Introduction Methodology Data Results Conclusion
Background
I A large literature attempts to quantify how factorreallocation contributes to productivity growth.
I Some numbers:I Quarterly job reallocation rates are about 12% in the US
(Abowd and Vilhuber 2011)I Worker reallocation rates are about 2-3 times larger(Abowd
and Vilhuber 2011)I Labor productivity growth is an important contributor
I 50% of labor productivity growth is dependent on laborreallocation (Foster, Haltiwanger, and Krizan 2001, USdata)
I ... or is it higher: 70% (Lentz and Mortensen 2008, Danishdata)
Berube, Dostie, Vilhuber Reallocation

Introduction Methodology Data Results Conclusion
Our approach
Here: evidence on the evolution of labor productivitydecomposition ...
I ... for two countries: Canada and the United States...
I ... using several different labor productivity decompositionmethodologies, applied homogeneously to both datasets
I ... caveats at the end
Berube, Dostie, Vilhuber Reallocation

Introduction Methodology Data Results Conclusion
Our approach
Here: evidence on the evolution of labor productivitydecomposition ...
I ... for two countries: Canada and the United States...I ... using several different labor productivity decomposition
methodologies, applied homogeneously to both datasets
I ... caveats at the end
Berube, Dostie, Vilhuber Reallocation

Introduction Methodology Data Results Conclusion
Our approach
Here: evidence on the evolution of labor productivitydecomposition ...
I ... for two countries: Canada and the United States...I ... using several different labor productivity decomposition
methodologies, applied homogeneously to both datasetsI ... caveats at the end
Berube, Dostie, Vilhuber Reallocation

Introduction Methodology Data Results Conclusion
Productivity
Aggregate productivity
Pt =∑j∈J
θjtpjt (1)
θjt represents the firm’s market share (share of labor or share ofsales), and pjt is the individual firm’s productivity.
Berube, Dostie, Vilhuber Reallocation

Introduction Methodology Data Results Conclusion
Productivity growth
Productivity growth
∆Pt ,t−k =∑j∈Jt
θjtpjt −∑
j∈Jt−k
θjt−kpjt−k (2)
Berube, Dostie, Vilhuber Reallocation
Introduction Methodology Data Results Conclusion
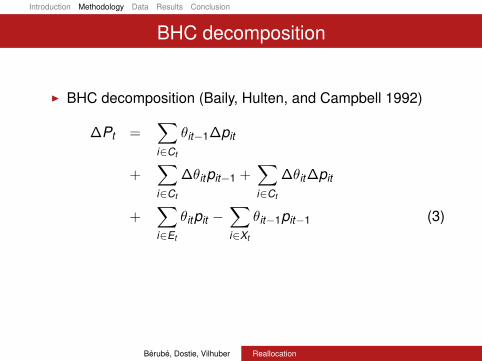
BHC decomposition
I BHC decomposition (Baily, Hulten, and Campbell 1992)
∆Pt =∑i∈Ct
θit−1∆pit
+∑i∈Ct
∆θitpit−1 +∑i∈Ct
∆θit ∆pit
+∑i∈Et
θitpit −∑i∈Xt
θit−1pit−1 (3)
= Within + Between + Cross + Entry − Exit
I where Jt = {Ct ,Et} and Jt−k = {Ct ,Xt}
Berube, Dostie, Vilhuber Reallocation

Introduction Methodology Data Results Conclusion
BHC decomposition
I BHC decomposition (Baily, Hulten, and Campbell 1992)
∆Pt =∑i∈Ct
θit−1∆pit
+∑i∈Ct
∆θitpit−1 +∑i∈Ct
∆θit ∆pit
+∑i∈Et
θitpit −∑i∈Xt
θit−1pit−1 (3)
= Within
+ Between + Cross + Entry − Exit
I where Jt = {Ct ,Et} and Jt−k = {Ct ,Xt}
Berube, Dostie, Vilhuber Reallocation

Introduction Methodology Data Results Conclusion
BHC decomposition
I BHC decomposition (Baily, Hulten, and Campbell 1992)
∆Pt =∑i∈Ct
θit−1∆pit
+∑i∈Ct
∆θitpit−1 +∑i∈Ct
∆θit ∆pit
+∑i∈Et
θitpit −∑i∈Xt
θit−1pit−1 (3)
= Within + Between
+ Cross + Entry − Exit
I where Jt = {Ct ,Et} and Jt−k = {Ct ,Xt}
Berube, Dostie, Vilhuber Reallocation

Introduction Methodology Data Results Conclusion
BHC decomposition
I BHC decomposition (Baily, Hulten, and Campbell 1992)
∆Pt =∑i∈Ct
θit−1∆pit
+∑i∈Ct
∆θitpit−1 +∑i∈Ct
∆θit ∆pit
+∑i∈Et
θitpit −∑i∈Xt
θit−1pit−1 (3)
= Within + Between + Cross
+ Entry − Exit
I where Jt = {Ct ,Et} and Jt−k = {Ct ,Xt}
Berube, Dostie, Vilhuber Reallocation

Introduction Methodology Data Results Conclusion
BHC decomposition
I BHC decomposition (Baily, Hulten, and Campbell 1992)
∆Pt =∑i∈Ct
θit−1∆pit
+∑i∈Ct
∆θitpit−1 +∑i∈Ct
∆θit ∆pit
+∑i∈Et
θitpit −∑i∈Xt
θit−1pit−1 (3)
= Within + Between + Cross + Entry
− Exit
I where Jt = {Ct ,Et} and Jt−k = {Ct ,Xt}
Berube, Dostie, Vilhuber Reallocation

Introduction Methodology Data Results Conclusion
BHC decomposition
I BHC decomposition (Baily, Hulten, and Campbell 1992)
∆Pt =∑i∈Ct
θit−1∆pit
+∑i∈Ct
∆θitpit−1 +∑i∈Ct
∆θit ∆pit
+∑i∈Et
θitpit −∑i∈Xt
θit−1pit−1 (3)
= Within + Between + Cross + Entry − Exit
I where Jt = {Ct ,Et} and Jt−k = {Ct ,Xt}
Berube, Dostie, Vilhuber Reallocation

Introduction Methodology Data Results Conclusion
BHC decomposition
I BHC decomposition (Baily, Hulten, and Campbell 1992)
∆Pt =∑i∈Ct
θit−1∆pit
+∑i∈Ct
∆θitpit−1 +∑i∈Ct
∆θit ∆pit
+∑i∈Et
θitpit −∑i∈Xt
θit−1pit−1 (3)
= Within + Between + Cross + Entry − Exit
I where Jt = {Ct ,Et} and Jt−k = {Ct ,Xt}
Berube, Dostie, Vilhuber Reallocation

Introduction Methodology Data Results Conclusion
GR decomposition
I GR decomposition (Griliches and Regev 1995)
∆Pt ,t−k =∑j∈C
θj∆pj
+∑j∈C
∆θj(pj − PJ
)+
∑j∈E
θjt(pjt − PJ
)−∑j∈X
θjt−k(pjt−k − PJ
)
= Within + Between + Entry + Exit
I within-firm productivity growth is weighted by the averagemarket shares between period t and t − k
I between effect weighted by the difference between firm’saverage productivity vs. average productivity of all firms
I productivity differences for entrants/exiters are weighted bythe contemporaneous market share of the firm
Berube, Dostie, Vilhuber Reallocation

Introduction Methodology Data Results Conclusion
GR decomposition
I GR decomposition (Griliches and Regev 1995)
∆Pt ,t−k =∑j∈C
θj∆pj
+∑j∈C
∆θj(pj − PJ
)+
∑j∈E
θjt(pjt − PJ
)−∑j∈X
θjt−k(pjt−k − PJ
)= Within
+ Between + Entry + Exit
I within-firm productivity growth is weighted by the averagemarket shares between period t and t − k
I between effect weighted by the difference between firm’saverage productivity vs. average productivity of all firms
I productivity differences for entrants/exiters are weighted bythe contemporaneous market share of the firm
Berube, Dostie, Vilhuber Reallocation

Introduction Methodology Data Results Conclusion
GR decomposition
I GR decomposition (Griliches and Regev 1995)
∆Pt ,t−k =∑j∈C
θj∆pj
+∑j∈C
∆θj(pj − PJ
)+
∑j∈E
θjt(pjt − PJ
)−∑j∈X
θjt−k(pjt−k − PJ
)= Within + Between
+ Entry + Exit
I within-firm productivity growth is weighted by the averagemarket shares between period t and t − k
I between effect weighted by the difference between firm’saverage productivity vs. average productivity of all firms
I productivity differences for entrants/exiters are weighted bythe contemporaneous market share of the firm
Berube, Dostie, Vilhuber Reallocation

Introduction Methodology Data Results Conclusion
GR decomposition
I GR decomposition (Griliches and Regev 1995)
∆Pt ,t−k =∑j∈C
θj∆pj
+∑j∈C
∆θj(pj − PJ
)+
∑j∈E
θjt(pjt − PJ
)−∑j∈X
θjt−k(pjt−k − PJ
)= Within + Between + Entry
+ Exit
I within-firm productivity growth is weighted by the averagemarket shares between period t and t − k
I between effect weighted by the difference between firm’saverage productivity vs. average productivity of all firms
I productivity differences for entrants/exiters are weighted bythe contemporaneous market share of the firm
Berube, Dostie, Vilhuber Reallocation

Introduction Methodology Data Results Conclusion
GR decomposition
I GR decomposition (Griliches and Regev 1995)
∆Pt ,t−k =∑j∈C
θj∆pj
+∑j∈C
∆θj(pj − PJ
)+
∑j∈E
θjt(pjt − PJ
)−∑j∈X
θjt−k(pjt−k − PJ
)= Within + Between + Entry + Exit
I within-firm productivity growth is weighted by the averagemarket shares between period t and t − k
I between effect weighted by the difference between firm’saverage productivity vs. average productivity of all firms
I productivity differences for entrants/exiters are weighted bythe contemporaneous market share of the firm
Berube, Dostie, Vilhuber Reallocation

Introduction Methodology Data Results Conclusion
FHK decomposition
I FHK version (Foster, Haltiwanger, and Krizan 2001)
∆Pt ,t−k =∑j∈C
θjt−k ∆pj +∑j∈C
∆θj(pjt−k − PJt−k
)+
∑j∈C
∆θj∆pj +∑j∈E
θjt(pjt − PJt−k
)−
∑j∈X
θjt−k(pjt−k − PJt−k
)
I contribution of firm’s pi , i = t , t − k now relative toeconomy/sector-wide Pt−k
Berube, Dostie, Vilhuber Reallocation

Introduction Methodology Data Results Conclusion
FHK decomposition
I FHK version (Foster, Haltiwanger, and Krizan 2001)
∆Pt ,t−k =∑j∈C
θjt−k ∆pj +∑j∈C
∆θj(pjt−k − PJt−k
)+
∑j∈C
∆θj∆pj +∑j∈E
θjt(pjt − PJt−k
)−
∑j∈X
θjt−k(pjt−k − PJt−k
)I contribution of firm’s pi , i = t , t − k now relative to
economy/sector-wide Pt−k
Berube, Dostie, Vilhuber Reallocation

Introduction Methodology Data Results Conclusion
Baldwin-Gu decomposition
I If new entering firms are taking market share away fromboth exiting and existing firms, then
∆Pt ,t−k =∑j∈C
θj∆pj +∑j∈C
∆θj(pj − PD
)+
∑j∈X
θjt−k(PN − pjt−k
)+ (SN − SX ) (PN − PD)
I between-effect: relative to the average for firms withdeclining market share, PD.
I productivity of new entrants PN measured relative to theproductivity of exiting firms pjt−k → new entrants displacingexiting firms.
I contribution to productivity growth of new entrants thatrecoup market shares from declining firms.
I SN market share of j ∈ E , SX market share of j ∈ X
Berube, Dostie, Vilhuber Reallocation

Introduction Methodology Data Results Conclusion
Data
Berube, Dostie, Vilhuber Reallocation

Introduction Methodology Data Results Conclusion
Canadian data - T2/LEAP
T2/Longitudinal Employment Analysis Project (LEAP)
I two main sources of administrative data:
I the Longitudinal Employment Analysis Program (LEAP),containing information on the employment of firms with(paid) employees
I Corporate Tax Statistical Universe File (T2SUF): covers allcompanies filing income tax, provides financial information
I excludes unincorporated businesses, non-employersI employment variable not directly measured: computed by
Statistics Canada as ratio of labor expenditures to thetypical worker’s average annual remuneration, adjusted forindustry, province, and firm size (Average Labor Unit, ALU,Baldwin and Gu (2011))
I No value-added: productivity measured as sales (receipts)per worker
Berube, Dostie, Vilhuber Reallocation

Introduction Methodology Data Results Conclusion
Canadian data - T2/LEAP
T2/Longitudinal Employment Analysis Project (LEAP)
I two main sources of administrative data:I the Longitudinal Employment Analysis Program (LEAP),
containing information on the employment of firms with(paid) employees
I Corporate Tax Statistical Universe File (T2SUF): covers allcompanies filing income tax, provides financial information
I excludes unincorporated businesses, non-employers
I employment variable not directly measured: computed byStatistics Canada as ratio of labor expenditures to thetypical worker’s average annual remuneration, adjusted forindustry, province, and firm size (Average Labor Unit, ALU,Baldwin and Gu (2011))
I No value-added: productivity measured as sales (receipts)per worker
Berube, Dostie, Vilhuber Reallocation

Introduction Methodology Data Results Conclusion
Canadian data - T2/LEAP
T2/Longitudinal Employment Analysis Project (LEAP)
I two main sources of administrative data:I the Longitudinal Employment Analysis Program (LEAP),
containing information on the employment of firms with(paid) employees
I Corporate Tax Statistical Universe File (T2SUF): covers allcompanies filing income tax, provides financial information
I excludes unincorporated businesses, non-employersI employment variable not directly measured: computed by
Statistics Canada as ratio of labor expenditures to thetypical worker’s average annual remuneration, adjusted forindustry, province, and firm size (Average Labor Unit, ALU,Baldwin and Gu (2011))
I No value-added: productivity measured as sales (receipts)per worker
Berube, Dostie, Vilhuber Reallocation

Introduction Methodology Data Results Conclusion
Canadian data - T2/LEAP
T2/Longitudinal Employment Analysis Project (LEAP)
I two main sources of administrative data:I the Longitudinal Employment Analysis Program (LEAP),
containing information on the employment of firms with(paid) employees
I Corporate Tax Statistical Universe File (T2SUF): covers allcompanies filing income tax, provides financial information
I excludes unincorporated businesses, non-employersI employment variable not directly measured: computed by
Statistics Canada as ratio of labor expenditures to thetypical worker’s average annual remuneration, adjusted forindustry, province, and firm size (Average Labor Unit, ALU,Baldwin and Gu (2011))
I No value-added: productivity measured as sales (receipts)per worker
Berube, Dostie, Vilhuber Reallocation

Introduction Methodology Data Results Conclusion
US data
ASM+CMI Available: 1973-2009 (1987-2009 used)
I CM: quinquennial census of firms (years in 2 and 7)I CM: sampled in Business Register, includes ASM
establishments in CM yearsI ASM: Certainty sample for large firms, size-stratification for
smaller firmsI ASM: about 50,000 establishments per yearI ASM: panel for 5 years, sampled in CM, refreshed based
on expansion of the frame through tax recordsI ASM/CM: information on employment, wages, sales,
value-added
Berube, Dostie, Vilhuber Reallocation

Introduction Methodology Data Results Conclusion
US data
ASM+CMI Available: 1973-2009 (1987-2009 used)I CM: quinquennial census of firms (years in 2 and 7)
I CM: sampled in Business Register, includes ASMestablishments in CM years
I ASM: Certainty sample for large firms, size-stratification forsmaller firms
I ASM: about 50,000 establishments per yearI ASM: panel for 5 years, sampled in CM, refreshed based
on expansion of the frame through tax recordsI ASM/CM: information on employment, wages, sales,
value-added
Berube, Dostie, Vilhuber Reallocation

Introduction Methodology Data Results Conclusion
US data
ASM+CMI Available: 1973-2009 (1987-2009 used)I CM: quinquennial census of firms (years in 2 and 7)I CM: sampled in Business Register, includes ASM
establishments in CM years
I ASM: Certainty sample for large firms, size-stratification forsmaller firms
I ASM: about 50,000 establishments per yearI ASM: panel for 5 years, sampled in CM, refreshed based
on expansion of the frame through tax recordsI ASM/CM: information on employment, wages, sales,
value-added
Berube, Dostie, Vilhuber Reallocation

Introduction Methodology Data Results Conclusion
US data
ASM+CMI Available: 1973-2009 (1987-2009 used)I CM: quinquennial census of firms (years in 2 and 7)I CM: sampled in Business Register, includes ASM
establishments in CM yearsI ASM: Certainty sample for large firms, size-stratification for
smaller firms
I ASM: about 50,000 establishments per yearI ASM: panel for 5 years, sampled in CM, refreshed based
on expansion of the frame through tax recordsI ASM/CM: information on employment, wages, sales,
value-added
Berube, Dostie, Vilhuber Reallocation

Introduction Methodology Data Results Conclusion
US data
ASM+CMI Available: 1973-2009 (1987-2009 used)I CM: quinquennial census of firms (years in 2 and 7)I CM: sampled in Business Register, includes ASM
establishments in CM yearsI ASM: Certainty sample for large firms, size-stratification for
smaller firmsI ASM: about 50,000 establishments per year
I ASM: panel for 5 years, sampled in CM, refreshed basedon expansion of the frame through tax records
I ASM/CM: information on employment, wages, sales,value-added
Berube, Dostie, Vilhuber Reallocation

Introduction Methodology Data Results Conclusion
US data
ASM+CMI Available: 1973-2009 (1987-2009 used)I CM: quinquennial census of firms (years in 2 and 7)I CM: sampled in Business Register, includes ASM
establishments in CM yearsI ASM: Certainty sample for large firms, size-stratification for
smaller firmsI ASM: about 50,000 establishments per yearI ASM: panel for 5 years, sampled in CM, refreshed based
on expansion of the frame through tax records
I ASM/CM: information on employment, wages, sales,value-added
Berube, Dostie, Vilhuber Reallocation

Introduction Methodology Data Results Conclusion
US data
ASM+CMI Available: 1973-2009 (1987-2009 used)I CM: quinquennial census of firms (years in 2 and 7)I CM: sampled in Business Register, includes ASM
establishments in CM yearsI ASM: Certainty sample for large firms, size-stratification for
smaller firmsI ASM: about 50,000 establishments per yearI ASM: panel for 5 years, sampled in CM, refreshed based
on expansion of the frame through tax recordsI ASM/CM: information on employment, wages, sales,
value-added
Berube, Dostie, Vilhuber Reallocation

Introduction Methodology Data Results Conclusion
US data
LBDI longitudinal research file (Miranda and Jarmin 2002)
I corrects linkages in Business RegisterI contains link id to ASM, CM, employment
Berube, Dostie, Vilhuber Reallocation

Introduction Methodology Data Results Conclusion
US data
LBDI longitudinal research file (Miranda and Jarmin 2002)I corrects linkages in Business Register
I contains link id to ASM, CM, employment
Berube, Dostie, Vilhuber Reallocation

Introduction Methodology Data Results Conclusion
US data
LBDI longitudinal research file (Miranda and Jarmin 2002)I corrects linkages in Business RegisterI contains link id to ASM, CM, employment
Berube, Dostie, Vilhuber Reallocation

Introduction Methodology Data Results Conclusion
ASM-CM schema
Berube, Dostie, Vilhuber Reallocation

Introduction Methodology Data Results Conclusion
ASM-CM schema
Berube, Dostie, Vilhuber Reallocation

Introduction Methodology Data Results Conclusion
ASM-CM schema
Berube, Dostie, Vilhuber Reallocation

Introduction Methodology Data Results Conclusion
ASM-CM schema
Berube, Dostie, Vilhuber Reallocation

Introduction Methodology Data Results Conclusion
T2LEAP schema
Berube, Dostie, Vilhuber Reallocation

Introduction Methodology Data Results Conclusion
T2LEAP schema
Berube, Dostie, Vilhuber Reallocation

Introduction Methodology Data Results Conclusion
Overview of LBD data
Berube, Dostie, Vilhuber Reallocation

Introduction Methodology Data Results Conclusion
ASM-CM-LBD schema
Berube, Dostie, Vilhuber Reallocation

Introduction Methodology Data Results Conclusion
Methodology for US
Matching methodology using LBD
I Define births/deaths/continuers in LBD
I Match to records in ASM/CM as feasibleI Create panel weight to match birth/death rates in LBD
(here: by ten size-classes)
Berube, Dostie, Vilhuber Reallocation

Introduction Methodology Data Results Conclusion
Methodology for US
Matching methodology using LBD
I Define births/deaths/continuers in LBDI Match to records in ASM/CM as feasible
I Create panel weight to match birth/death rates in LBD(here: by ten size-classes)
Berube, Dostie, Vilhuber Reallocation

Introduction Methodology Data Results Conclusion
Methodology for US
Matching methodology using LBD
I Define births/deaths/continuers in LBDI Match to records in ASM/CM as feasibleI Create panel weight to match birth/death rates in LBD
(here: by ten size-classes)
Berube, Dostie, Vilhuber Reallocation

Introduction Methodology Data Results Conclusion
Data definitions
Imputations
I We impute missing sales based on data for surroundingyears for the same firm.
I When employment is missing, we assume the plant isinactive (dead)
Adjustments
I Productivity = (real value of) sales/workerI Trim top and bottom 2% of productivity by removing from
the panel.
Berube, Dostie, Vilhuber Reallocation

Introduction Methodology Data Results Conclusion
Comparing
Common characteristicsI Long time series
I Data accessible in restricted access environmentsI Results need to pass disclosure review
Berube, Dostie, Vilhuber Reallocation

Introduction Methodology Data Results Conclusion
Comparing
Common characteristicsI Long time seriesI Data accessible in restricted access environments
I Results need to pass disclosure review
Berube, Dostie, Vilhuber Reallocation

Introduction Methodology Data Results Conclusion
Comparing
Common characteristicsI Long time seriesI Data accessible in restricted access environmentsI Results need to pass disclosure review
Berube, Dostie, Vilhuber Reallocation

Introduction Methodology Data Results Conclusion
Comparing
DifferencesI Canada is administrative data, US is administrative linked
to survey sample data
I Canada is firm-based (no establishments), US isestablishment-based
I Canada is all industries, US Economic Censuses/AnnualSurveys are by-sector (no unified dataset)
I Entity adjustment: flow adjustment in Canada,name/location linkage in US
I Productivity not quite the same: Sales receipts vs. value ofshipments
I Employment not measured the same way (averageemployment in year imputed in Canada, point-in-timeemployment in the US)
(could be adjusted in the US)
Berube, Dostie, Vilhuber Reallocation

Introduction Methodology Data Results Conclusion
Comparing
DifferencesI Canada is administrative data, US is administrative linked
to survey sample dataI Canada is firm-based (no establishments), US is
establishment-based
I Canada is all industries, US Economic Censuses/AnnualSurveys are by-sector (no unified dataset)
I Entity adjustment: flow adjustment in Canada,name/location linkage in US
I Productivity not quite the same: Sales receipts vs. value ofshipments
I Employment not measured the same way (averageemployment in year imputed in Canada, point-in-timeemployment in the US)
(could be adjusted in the US)
Berube, Dostie, Vilhuber Reallocation

Introduction Methodology Data Results Conclusion
Comparing
DifferencesI Canada is administrative data, US is administrative linked
to survey sample dataI Canada is firm-based (no establishments), US is
establishment-basedI Canada is all industries, US Economic Censuses/Annual
Surveys are by-sector (no unified dataset)
I Entity adjustment: flow adjustment in Canada,name/location linkage in US
I Productivity not quite the same: Sales receipts vs. value ofshipments
I Employment not measured the same way (averageemployment in year imputed in Canada, point-in-timeemployment in the US)
(could be adjusted in the US)
Berube, Dostie, Vilhuber Reallocation

Introduction Methodology Data Results Conclusion
Comparing
DifferencesI Canada is administrative data, US is administrative linked
to survey sample dataI Canada is firm-based (no establishments), US is
establishment-basedI Canada is all industries, US Economic Censuses/Annual
Surveys are by-sector (no unified dataset)I Entity adjustment: flow adjustment in Canada,
name/location linkage in US
I Productivity not quite the same: Sales receipts vs. value ofshipments
I Employment not measured the same way (averageemployment in year imputed in Canada, point-in-timeemployment in the US)
(could be adjusted in the US)
Berube, Dostie, Vilhuber Reallocation

Introduction Methodology Data Results Conclusion
Comparing
DifferencesI Canada is administrative data, US is administrative linked
to survey sample dataI Canada is firm-based (no establishments), US is
establishment-basedI Canada is all industries, US Economic Censuses/Annual
Surveys are by-sector (no unified dataset)I Entity adjustment: flow adjustment in Canada,
name/location linkage in USI Productivity not quite the same: Sales receipts vs. value of
shipments
I Employment not measured the same way (averageemployment in year imputed in Canada, point-in-timeemployment in the US)
(could be adjusted in the US)
Berube, Dostie, Vilhuber Reallocation

Introduction Methodology Data Results Conclusion
Comparing
DifferencesI Canada is administrative data, US is administrative linked
to survey sample dataI Canada is firm-based (no establishments), US is
establishment-basedI Canada is all industries, US Economic Censuses/Annual
Surveys are by-sector (no unified dataset)I Entity adjustment: flow adjustment in Canada,
name/location linkage in USI Productivity not quite the same: Sales receipts vs. value of
shipmentsI Employment not measured the same way (average
employment in year imputed in Canada, point-in-timeemployment in the US)
(could be adjusted in the US)
Berube, Dostie, Vilhuber Reallocation

Introduction Methodology Data Results Conclusion
Comparing
DifferencesI Canada is administrative data, US is administrative linked
to survey sample dataI Canada is firm-based (no establishments), US is
establishment-basedI Canada is all industries, US Economic Censuses/Annual
Surveys are by-sector (no unified dataset)I Entity adjustment: flow adjustment in Canada,
name/location linkage in USI Productivity not quite the same: Sales receipts vs. value of
shipmentsI Employment not measured the same way (average
employment in year imputed in Canada, point-in-timeemployment in the US) (could be adjusted in the US)
Berube, Dostie, Vilhuber Reallocation

Introduction Methodology Data Results Conclusion
Results
Berube, Dostie, Vilhuber Reallocation

Introduction Methodology Data Results Conclusion
Previous results
Enormous literatureThe literature is enormous. Many studies provide somesummary of previous studies.
I Within-plant contribution between 0.79-1.2 (Foster,Haltiwanger, and Krizan 2001)
Berube, Dostie, Vilhuber Reallocation

Introduction Methodology Data Results Conclusion
Comparing to FHK2001
Berube, Dostie, Vilhuber Reallocation

Introduction Methodology Data Results Conclusion
Comparing to Baldwin and Gu (multiple)
to come
Berube, Dostie, Vilhuber Reallocation

Introduction Methodology Data Results Conclusion
US and Canada: FHK
Berube, Dostie, Vilhuber Reallocation

Introduction Methodology Data Results Conclusion
US and Canada: BHC
Berube, Dostie, Vilhuber Reallocation

Introduction Methodology Data Results Conclusion
US and Canada: GR
Berube, Dostie, Vilhuber Reallocation

Introduction Methodology Data Results Conclusion
US and Canada: BG
Berube, Dostie, Vilhuber Reallocation

Introduction Methodology Data Results Conclusion
Variations and robustness checks
I Variations in k (3 years, 5 years, 1 year?) [easy in Canada,not in US] (already noted in Foster, Haltiwanger, andKrizan (2001))
I Robustness to firm birth/death adjustments
I Missing data [currently very simple (simplistic) impute]I Importance of measuring at firm level [only way in Canada,
only in EC years in US]
Berube, Dostie, Vilhuber Reallocation

Introduction Methodology Data Results Conclusion
Variations and robustness checks
I Variations in k (3 years, 5 years, 1 year?) [easy in Canada,not in US] (already noted in Foster, Haltiwanger, andKrizan (2001))
I Robustness to firm birth/death adjustmentsI Missing data [currently very simple (simplistic) impute]
I Importance of measuring at firm level [only way in Canada,only in EC years in US]
Berube, Dostie, Vilhuber Reallocation

Introduction Methodology Data Results Conclusion
Variations and robustness checks
I Variations in k (3 years, 5 years, 1 year?) [easy in Canada,not in US] (already noted in Foster, Haltiwanger, andKrizan (2001))
I Robustness to firm birth/death adjustmentsI Missing data [currently very simple (simplistic) impute]I Importance of measuring at firm level [only way in Canada,
only in EC years in US]
Berube, Dostie, Vilhuber Reallocation

Introduction Methodology Data Results Conclusion
Preliminary conclusions and speculation
I Much stronger role for within-reallocation, little role forentrants/exiters in Canada, in all periods
I ... due to measurement at firm vs. establishment level?I ... due to fundamentals?
I decreasing role of cross effect (all), between effect(GR,BG) in Canada?
I In the US, positive net effect of entry/exit, but secularincrease in role of entrants/decrease in role of exiters?
Berube, Dostie, Vilhuber Reallocation

Introduction Methodology Data Results Conclusion
Preliminary conclusions and speculation
I Much stronger role for within-reallocation, little role forentrants/exiters in Canada, in all periods
I ... due to measurement at firm vs. establishment level?
I ... due to fundamentals?I decreasing role of cross effect (all), between effect
(GR,BG) in Canada?I In the US, positive net effect of entry/exit, but secular
increase in role of entrants/decrease in role of exiters?
Berube, Dostie, Vilhuber Reallocation

Introduction Methodology Data Results Conclusion
Preliminary conclusions and speculation
I Much stronger role for within-reallocation, little role forentrants/exiters in Canada, in all periods
I ... due to measurement at firm vs. establishment level?I ... due to fundamentals?
I decreasing role of cross effect (all), between effect(GR,BG) in Canada?
I In the US, positive net effect of entry/exit, but secularincrease in role of entrants/decrease in role of exiters?
Berube, Dostie, Vilhuber Reallocation

Introduction Methodology Data Results Conclusion
Preliminary conclusions and speculation
I Much stronger role for within-reallocation, little role forentrants/exiters in Canada, in all periods
I ... due to measurement at firm vs. establishment level?I ... due to fundamentals?
I decreasing role of cross effect (all), between effect(GR,BG) in Canada?
I In the US, positive net effect of entry/exit, but secularincrease in role of entrants/decrease in role of exiters?
Berube, Dostie, Vilhuber Reallocation

Introduction Methodology Data Results Conclusion
Thank you.
Berube, Dostie, Vilhuber Reallocation

References
References
Abowd, J. M. and L. Vilhuber (2011).National estimates of gross employment and job flows from the quarterly workforce indicators with demographic
and industry detail.Journal of Econometrics 161, 82–99.
Baily, M., C. Hulten, and D. Campbell (1992).Productivity dynamics in manufacturing plants.Brookings Paper on Economic Activity. Microeconomics, 187–249.
Baldwin, J. R. and W. Gu (2011, January).Firm dynamics and productivity growth: a comparison of the retail trade and manufacturing sectors.Industrial and Corporate Change, 1–29.
Foster, L., J. C. Haltiwanger, and C. J. Krizan (2001).Aggregate productivity growth. lessons from microeconomic evidence.In C. R. H. . E. R. D. . M. J. Harper (Ed.), New Developments in Productivity Analysis, NBER Chapters, pp.
303–372. National Bureau of Economic Research, Inc.
Griliches, Z. and H. Regev (1995).Firm productivity in Israeli industry 1979-1988.Journal of Econometrics 65(1), 175–203.
Lentz, R. and D. T. Mortensen (2008).An empirical model of growth through product innovation.Econometrica 76(6), 1317–1373.
Miranda, J. and R. Jarmin (2002).The longitudinal business database.Discussion Paper CES-WP-02-17, U.S. Census Bureau, Center for Economic Studies.
Berube, Dostie, Vilhuber Reallocation

References
The end
$Id: Presentation-CAED2012-reallocation-appendix.tex 1083 2012-04-25 17:11:40Z vilhu001 $
Berube, Dostie, Vilhuber Reallocation
Related Documents