LFA Training Finance Clinic EFR & Budget efficiencies: The LFA role Geneva, Switzerland – February 2009 Program Finance

Welcome message from author
This document is posted to help you gain knowledge. Please leave a comment to let me know what you think about it! Share it to your friends and learn new things together.
Transcript

LFA Training Finance Clinic EFR & Budget efficiencies: The LFA role
Geneva, Switzerland – February 2009Program Finance

Agenda
• What is it and Why do it?
• Some complications
• LFA role
• Examples
What is Enhanced Financial Reporting (EFR)?
• An additional annual financial reporting form (+ phase 2)
• A basic budget vs expenditure variance analysis
• Shows costs broken down by cost categories, SDA and implementing entities
Why is the Global Fund requesting Enhanced Financial Reporting?
• Improving Performance Based Funding and Grant Management
• Increased Transparency and Accountability
• Responding to Requests from Board, Donors and Stakeholders
• Improving Value For Money Analysis
• Leveraging Additional Financial Resources
Potential Challenges of EFR
• Can expenditure be tracked against budget in these categories, especially by service delivery area (SDA)?
• Ensuring Sub Recipients provide accurate and timely financial information
• Obtaining cumulative information for oIder grants
The Role of the LFA
Expected to perform a review NOT a verification
1. Has the template been fully completed?
2. Comment on the PRs approach to completing the template including reasonableness of the assumptions
3. Comment on the variance analysis provided by the PR.

Which expenditures?
Expenditure reported
=
PR direct expenditureDisbursements to SRs should not be
considered as expenditure
+
SRs expenditureDisbursements to S-SRs should not be
considered as expenditure
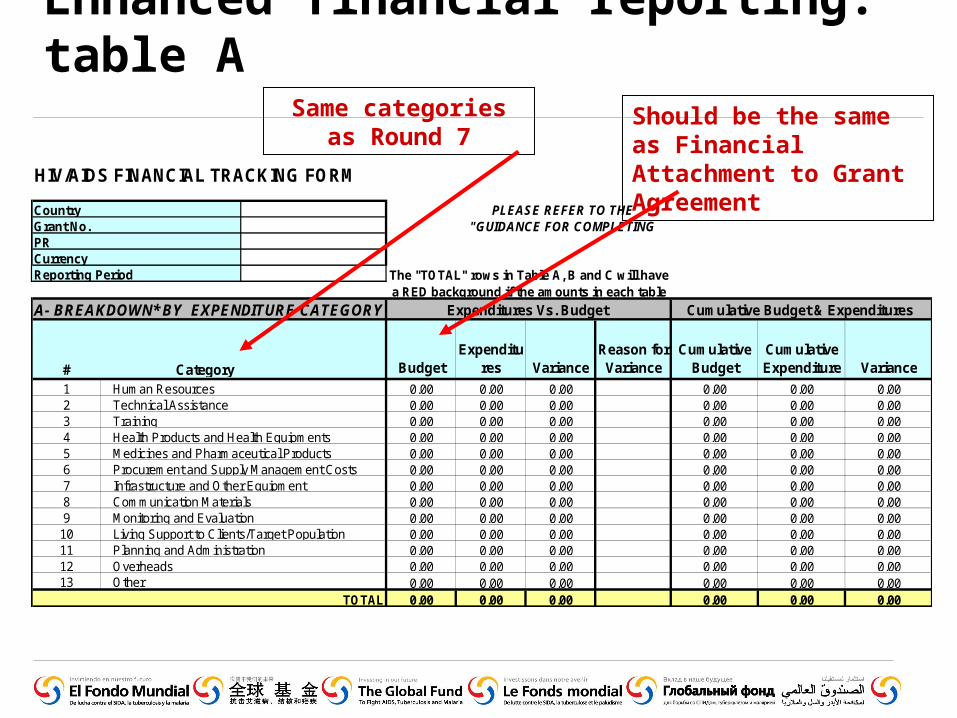
Enhanced financial reporting: table A
A- BREAKDOWN* BY EXPENDITURE CATEGORY
#
Budget
Expenditures Variance
Reason for Variance
Cumulative Budget
Cumulative Expenditure Variance
1 0.00 0.00 0.00 0.00 0.00 0.002 0.00 0.00 0.00 0.00 0.00 0.003 0.00 0.00 0.00 0.00 0.00 0.004 0.00 0.00 0.00 0.00 0.00 0.005 0.00 0.00 0.00 0.00 0.00 0.006 0.00 0.00 0.00 0.00 0.00 0.007 0.00 0.00 0.00 0.00 0.00 0.008 0.00 0.00 0.00 0.00 0.00 0.009 0.00 0.00 0.00 0.00 0.00 0.0010 0.00 0.00 0.00 0.00 0.00 0.0011 0.00 0.00 0.00 0.00 0.00 0.0012 0.00 0.00 0.00 0.00 0.00 0.0013 0.00 0.00 0.00 0.00 0.00 0.00
TOTAL 0.00 0.00 0.00 0.00 0.00 0.00
Category
Other
Grant No.
The "TOTAL" rows in Table A, B and C will have a RED background if the amounts in each table
Living Support to Clients/Target PopulationPlanning and AdministrationOverheads
HIV/AIDS FINANCIAL TRACKING FORM
Expenditures Vs. Budget
PRCurrency
Country PLEASE REFER TO THE "GUIDANCE FOR COMPLETING
Reporting Period
Human ResourcesTechnical AssistanceTrainingHealth Products and Health EquipmentsMedicines and Pharmaceutical ProductsProcurement and Supply Management CostsInfrastructure and Other EquipmentCommunication MaterialsMonitoring and Evaluation
Cumulative Budget & Expenditures
Same categories as Round 7
Should be the same as Financial Attachment to Grant Agreement

Enhanced financial reporting: table B
B- BREAKDOWN* BY PROGRAM ACTIVITY
# Macro-category Objectives
Service Delivery
Area
BudgetExpenditu
res VarianceReason for Variance
Cumulative Budget
Cumulative Expenditure Variance
1 Please Select… Please 0.00 0.00 0.00 0.00 0.00 0.002 Please Select… Please 0.00 0.00 0.00 0.00 0.00 0.003 Please Select… Please 0.00 0.00 0.00 0.00 0.00 0.004 Please Select… Please 0.00 0.00 0.00 0.00 0.00 0.005 Please Select… Please 0.00 0.00 0.00 0.00 0.00 0.006 Please Select… Please 0.00 0.00 0.00 0.00 0.00 0.00… Please Select…
Please Select… 0.00 0.00 0.00 0.00 0.00 0.00
TOTAL 0.00 0.00 0.00 0.00 0.00 0.00
C- BREAKDOWN* BY IMPLEMENTING ENTITY
# PR/SR Name
Type ofImplementing Entity
Budget
Expenditures Variance
Reason for Variance
Cumulative Budget
Cumulative Expenditure Variance
1 Please Select … Please 0.00 0.00 0.00 0.00 0.00 0.002 Please Select … Please 0.00 0.00 0.00 0.00 0.00 0.003 Please Select … Please 0.00 0.00 0.00 0.00 0.00 0.004 Please Select … Please 0.00 0.00 0.00 0.00 0.00 0.005 Please Select … Please 0.00 0.00 0.00 0.00 0.00 0.00… Please Select …
Please Select … 0.00 0.00 0.00 0.00 0.00 0.00
TOTAL 0.00 0.00 0.00 0.00 0.00 0.00
Expenditures Vs. Budget
Expenditures Vs. Budget
Cumulative Budget & Expenditures
Cumulative Budget & Expenditures
Totals should be same for all 3 tablesDrop down lists

Enhanced financial reporting: table C
B- BREAKDOWN* BY PROGRAM ACTIVITY
# Macro-category Objectives
Service Delivery
Area
BudgetExpenditu
res VarianceReason for Variance
Cumulative Budget
Cumulative Expenditure Variance
1 Please Select… Please 0.00 0.00 0.00 0.00 0.00 0.002 Please Select… Please 0.00 0.00 0.00 0.00 0.00 0.003 Please Select… Please 0.00 0.00 0.00 0.00 0.00 0.004 Please Select… Please 0.00 0.00 0.00 0.00 0.00 0.005 Please Select… Please 0.00 0.00 0.00 0.00 0.00 0.006 Please Select… Please 0.00 0.00 0.00 0.00 0.00 0.00… Please Select…
Please Select… 0.00 0.00 0.00 0.00 0.00 0.00
TOTAL 0.00 0.00 0.00 0.00 0.00 0.00
C- BREAKDOWN* BY IMPLEMENTING ENTITY
# PR/SR Name
Type ofImplementing Entity
Budget
Expenditures Variance
Reason for Variance
Cumulative Budget
Cumulative Expenditure Variance
1 Please Select … Please 0.00 0.00 0.00 0.00 0.00 0.002 Please Select … Please 0.00 0.00 0.00 0.00 0.00 0.003 Please Select … Please 0.00 0.00 0.00 0.00 0.00 0.004 Please Select … Please 0.00 0.00 0.00 0.00 0.00 0.005 Please Select … Please 0.00 0.00 0.00 0.00 0.00 0.00… Please Select …
Please Select … 0.00 0.00 0.00 0.00 0.00 0.00
TOTAL 0.00 0.00 0.00 0.00 0.00 0.00
Expenditures Vs. Budget
Expenditures Vs. Budget
Cumulative Budget & Expenditures
Cumulative Budget & Expenditures
Totals should be same for all 3 tablesDrop down lists
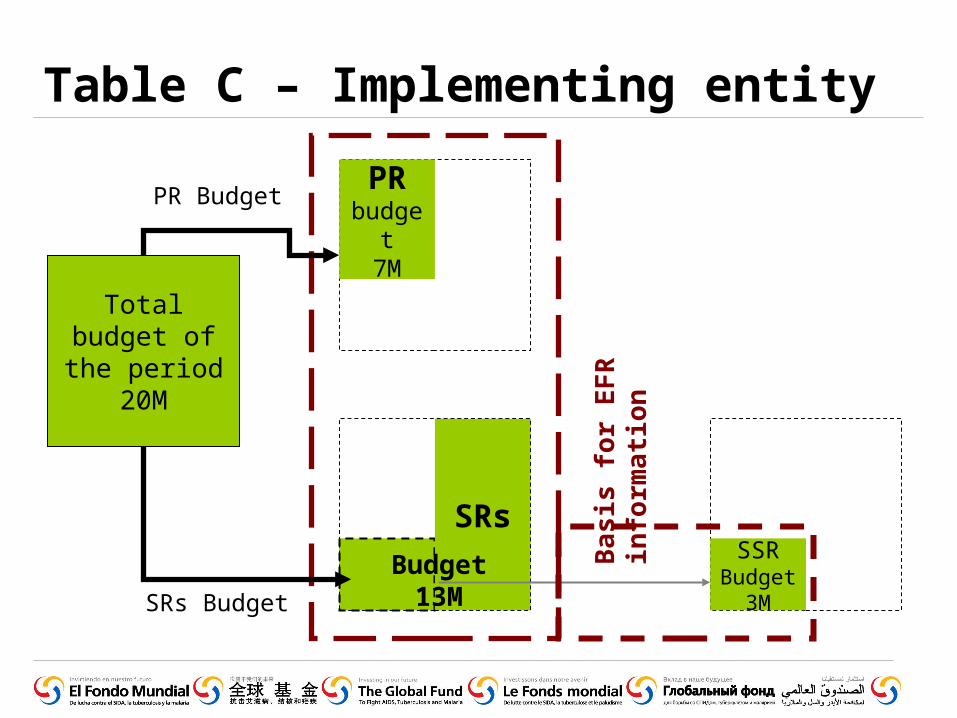
Total budget of the period
20M
Table C – Implementing entity
Ba
sis
fo
r E
FR
info
rma
tio
n
PR budget
7M
SRsSSR
Budget 3M
Budget 13M
PR Budget
SRs Budget

Budget efficiencies
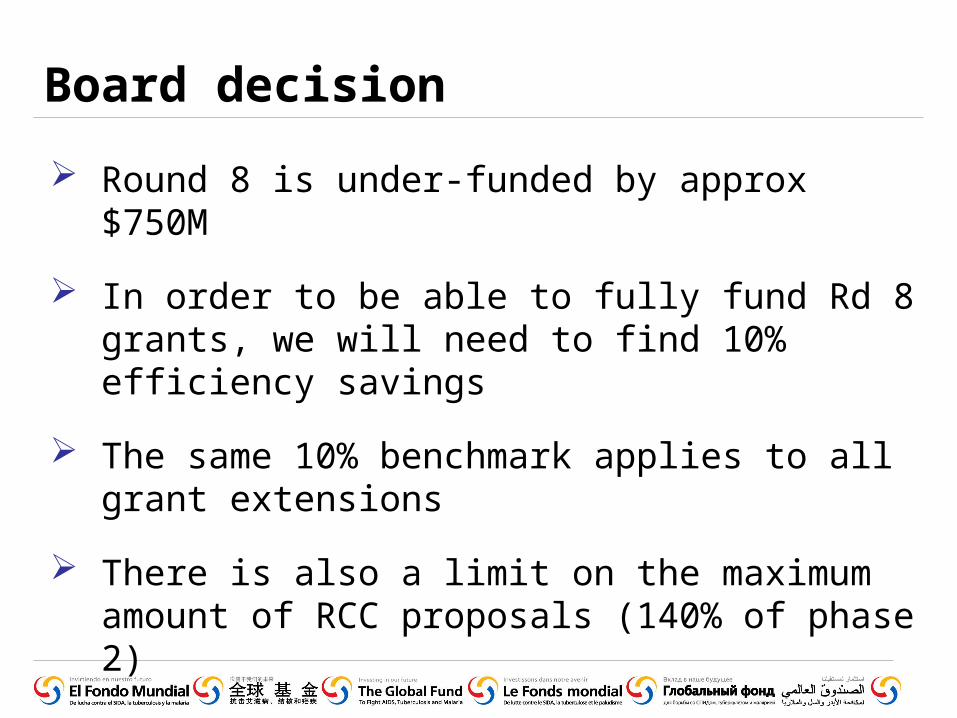
Board decision
Round 8 is under-funded by approx $750M
In order to be able to fully fund Rd 8 grants, we will need to find 10% efficiency savings
The same 10% benchmark applies to all grant extensions
There is also a limit on the maximum amount of RCC proposals (140% of phase 2)

What does it mean for LFAs?
More focus on TRP review comments
Increased importance and focus of LFA budget review (higher quality)
LFAs will be asked to strongly justify why a reduction is not possible
LFA level of budget reductions may be tracked and this used in assessment of performance
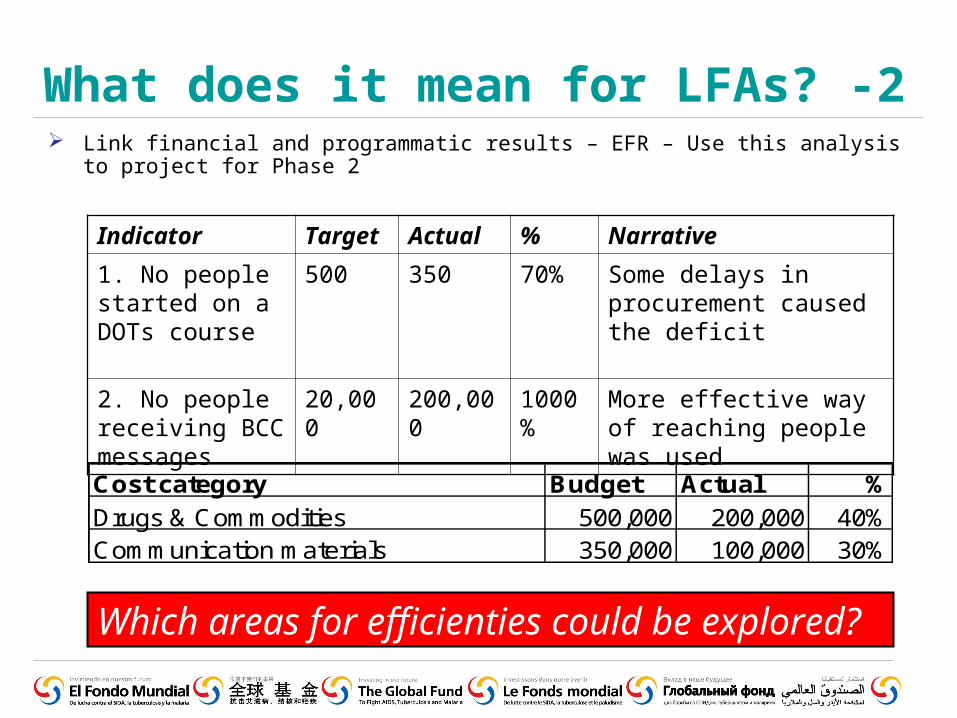
What does it mean for LFAs? -2 Link financial and programmatic results – EFR – Use this analysis to project for
Phase 2
Indicator Target Actual % Narrative
1. No people started on a DOTs course
500 350 70% Some delays in procurement caused the deficit
2. No people receiving BCC messages
20,000 200,000 1000%
More effective way of reaching people was used
Which areas for efficienties could be explored?
Cost category Budget Actual %
Drugs & Commodities 500,000 200,000 40%Communication materials 350,000 100,000 30%
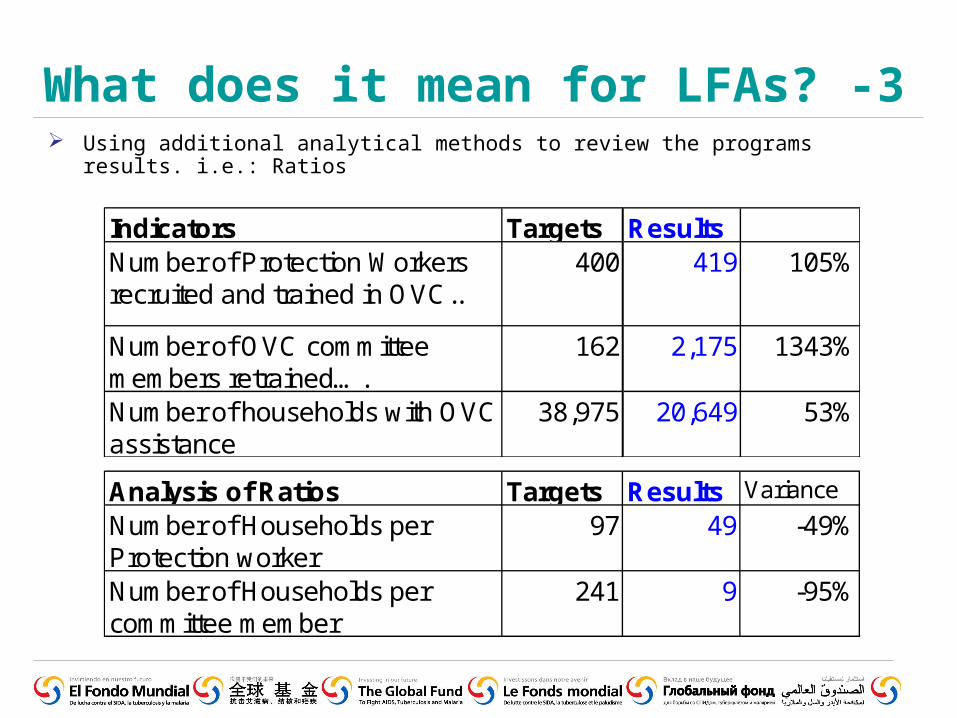
What does it mean for LFAs? -3 Using additional analytical methods to review the programs results. i.e.: Ratios
Analysis of Ratios Targets Results Variance
Number of Households per Protection worker
97 49 -49%
Number of Households per committee member
241 9 -95%
Indicators TargetsNumber of Protection Workers recruited and trained in OVC..
400
Number of OVC committee members retrained….
162
Number of households with OVC assistance
38,975
Results419 105%
2,175 1343%
20,649 53%

What does it mean for LFAs? -4 What are your references when reviewing budgets?
Activity Units U.C. TotalMotorcycles for health workers 100 1,200 120,000
Country Area Population
A 500,000 sq. km 8,000,000B 400 sq. km 150,000
Coverage per motorcycle Area Population
A 5,000 sq. km 80,000B 4 sq. km 1,500
P. 16: "1 motorcycle per health centre (100,000 people) spread over 3 years"World Health Organization, Global Malaria Programme, "Methodology for estimating the costs of global malaria control (2006–2015)"
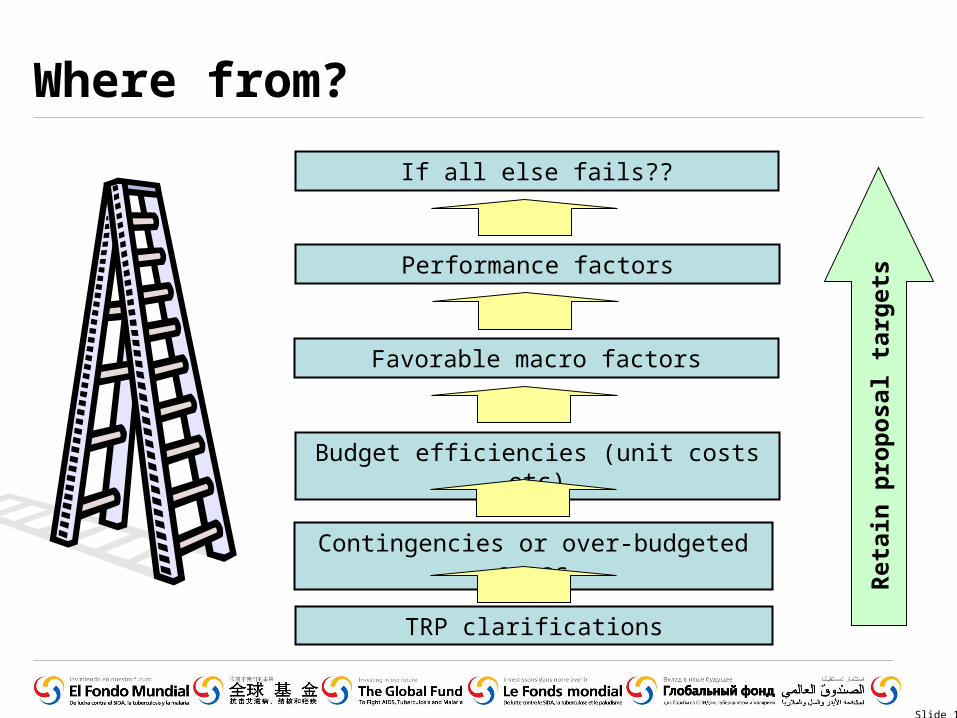
Where from?
Slide 18
Contingencies or over-budgeted areas
Budget efficiencies (unit costs etc)
Favorable macro factors
Performance factors
Ret
ain
pro
po
sal
targ
ets
If all else fails??
TRP clarifications

Where not from?
Reducing the scope and scale of successful programs
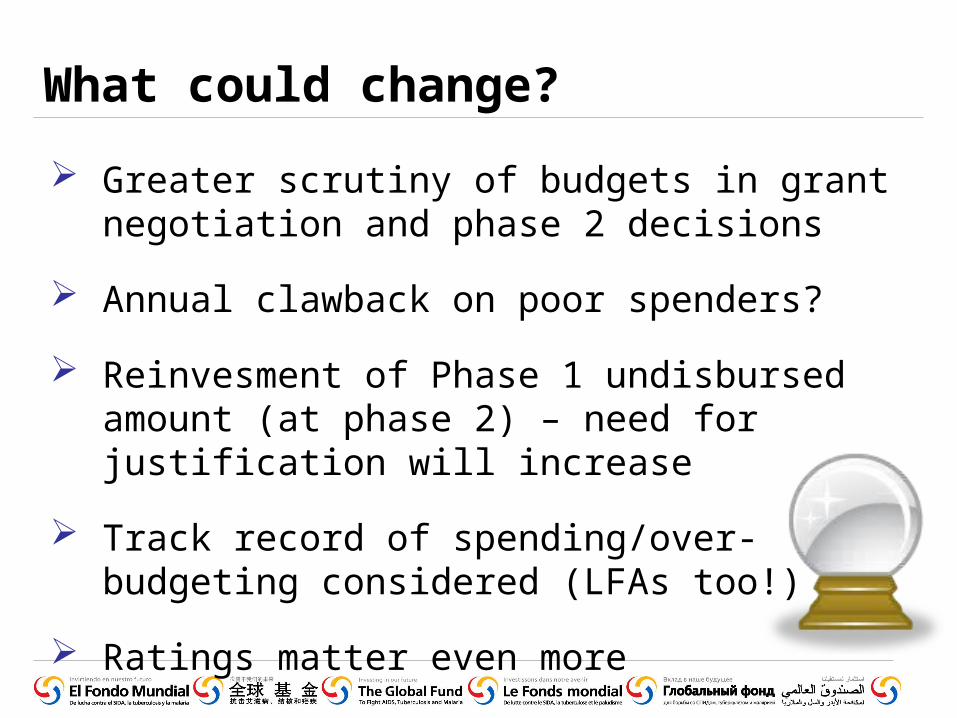
What could change?
Greater scrutiny of budgets in grant negotiation and phase 2 decisions
Annual clawback on poor spenders?
Reinvesment of Phase 1 undisbursed amount (at phase 2) – need for justification will increase
Track record of spending/over-budgeting considered (LFAs too!)
Ratings matter even more

Questions
Related Documents