Apresentação Usiminas 2T11 - APIMEC Classification of the information: Public Presentation 4Q15 and 2015

Welcome message from author
This document is posted to help you gain knowledge. Please leave a comment to let me know what you think about it! Share it to your friends and learn new things together.
Transcript

Apresentação Usiminas
2T11 - APIMEC
Classification of the information: Public
Presentation
4Q15 and 2015

Agenda
Usiminas and its
business units
Market
Outlook
Financial
Results
Usiminas
Profile
2

Company Profile
3
Complete solution for products and services
Steel company with the largest number of patents rights in Latin America
Largest Research Center in the steel sector in Latin America
First Brazilian steel company to have its quality system certified by ISO 9001 in 1992
First Brazilian steel company and second in the world to achieve the ISSO 14001 environmental
management certificate in 1996
Founded of the most enduring environmental education project of the private sector since 1984

Timeline
Operation
Start Up
Cosipa
privatization
Listing on
ADR I on
the OTC
Market
(New York)
•Acquisition
of iron ore
mines
•Acquisition
of
Zamprogna
•Creation of Soluções Usiminas
•One CNPJ: Usiminas
incorporates Cosipa
•Creation of Mineração Usiminas
•Acquisition of Codeme
and Metform stake
Automotiva
Usiminas
Divestment
•Selling of
Ternium stake
•Joint Mining
Agreements
with MBL e
Ferrous
Entrance of
Ternium /
Tenaris into
Usiminas
Control Group
(New
shareholders
agreement)
•Usiminas
privatization
•Listing on
BOVESPA
4
Listing on
LATIBEX
stock
exchange
section
Friables
Project
conclusion on
Mining
(increasing
the capacity
to 12 million
tons/year )
2011
2012 1962
2005
1994
2013
1991
2008
2010
2009
1993
2014 2015
Temporary
shutdown
of the
primary
areas in
Cubatão

Shareholding Composition
5
Usiminas shares are traded on BM&FBovespa (São Paulo), on the OTC
Market (New York) and on a LATIBEX exchange section (Madrid).
ON 49.84% 505,260,684
Voting Capital
Total Capital
1,013,786,190
PN 50.16% 508,525,506
Control Group (63.86%)
29.45%
27.66% 6.75%
36.14% Nippon Group
Ternium / Tenaris
Usiminas Pension Fund
Free Float

6
Complete Solution for Products and Services
Business Units
Mineração Usiminas
Mining
Steel
Ipatinga Plant
Cubatão Plant
Unigal Usiminas
Steel Processing
Soluções Usiminas
Capital Goods
Usiminas Mecânica
DOWNSTREAM UPSTREAM

Mining
Steel
Steel Processing
Capital Goods
Strategically Located
7

Social and Environmental Initiatives
8
Usiminas Cultural Institute
Usiminas invested over R$260 million,
encouraging around 2,000 social projects First educational institution in Brazil
to obtain ISO 9001
São Francisco Xavier School
Márcio Cunha Hospital
Reference center in healthcare all over Brazil
Xerimbabo Usiminas Project
Promotes protection and environmental education
free of charge for more than 2 million young people

Agenda
Usiminas and its
business units
Market
Outlook
Financial
Results
Usiminas
Profile
9

World Crude Steel Market in 2015
Million Tons
Source: World Steel Association 10
Capacity
2,351
Production
1,647
Excess of Capacity 704
22.9
33.2
31.5
42.7
71.1
69.7
89.6
78.9
105.2
803.8
Ukraine
Brazil
Turkey
Germany
Russia
South Korea
India
USA
Japan
China

10% 2%
8%
7%
3% 1%
50%
18%
World Crude Steel Production
971 million tons 1,665 million tons
11 Source: World Steel Association
2014 2003
*Except China
20%
2%
12%
13%
4% 2%
23%
24% European Union
Europe (Others)
Others
North America
South America
Africa
China
Asia and Oceania *

Largest Producers in 2014
Source: World Steel Association/ Instituto Aço Brasil 12
Brazilian Flat Steel Producers World Crude Steel Producers
6,054
4,456
5,368
745
34
Usiminas CSN ArcelorMittal Aperam Gerdau
1 ArcelorMittal
2 Nippon Steel & Sumitomo Metal Corporation
3 Hebei Steel Group
4 Baosteel Group
5 Wuhan Steel Group
6 POSCO
7 Shagang Group
8 Ansteel Group
9 Shougang Group
10 JFE
62 Usiminas
Thousand Tons

1980 2000 2014
China 34 98 531
South Korea 160 818 1,166
Japan 611 601 573
United States 376 425 376
Germany 469 475 512
Spain 202 435 246
Brazil 101 93 140
Chile 56 97 178
Mexico 120 142 215
World Average 152 133 217
Source: World Steel Association
Crude Steel Consumption per Capita
Kg per habitant
13

Brazilian Flat Steel Market
14
Million Tons
Source: Instituto Aço Brasil / Usiminas – Excludes Slabs
15.7
14.3
11.9
15.2 14.3
14.9 15.0 14.3
13.4 12.5
13.1
10.2
14.5 13.6 14
14.8
13.2
10.7
5% 7%
11%
22%
14% 13% 12% 15% 15%
2007 2008 2009 2010 2011 2012 2013 2014 2015
Production Consumption Imports

Auto Industry
and Autoparts Oil and Gas Pipelines
Agricultural and
Road Machinery
Heavy Plates and
Hot Rolled
Civil
Construction
Household
Appliances
Cold Rolled and
Galvanized
15
Flat Steel Consumption Markets
Hot Rolled,
Cold Rolled and
Galvanized
Heavy Plates,
Hot Rolled,
Cold Rolled and
Galvanized
Heavy Plates and
Hot Rolled
Heavy Plates and
Hot Rolled

Agenda
Usiminas and its
business units
Market
Outlook
Financial
Results
Usiminas
Profile
16

HDG Placas Laminados a
Quente
Eletrogalvanizados
2,200
Optimized
Rolling
Capacity
4,200 1,900 1,020 350
Cubatão Plant - 1,200 -
3,700 Nominal
Capacity 8,000 2,000* 9,500* 1,050 360
-
Ipatinga Plant 1,050 360 2,500 3,600 1,000 5,000
Flat Steel Capacity of Production
17
Thousand Tons
Slabs Hot Coils Cold Coils Heavy Plates Slab Caster EG
Galvanized
* Temporary shutdown of the primary areas of Cubatão
2,100 ** 1,000** 4,500*
2.300
** Temporary shutdown of the rolling mills

Sales Volume
Steel Business Unit – Thousand Tons
18
12%
88%
15%
85%
24%
76%
19%
81%
12%
88% 73%
81% 88%
64% 67%
27%
19% 12%
36% 33%
1,247 1,256 1,275
1,179 1,205
4Q14 1Q15 2Q15 3Q15 4Q15
Exports Domestic Market

19
Sales Volume
Steel Business Unit – Thousand Tons
25% 18%
27% 13%
17%
75% 82% 73% 87%
83%
27%
73%
6,565
5,916
6,881
6,220
5,541
4,915
2010 2011 2012 2013 2014 2015
Exports Domestic Market
27%
73%
17%
83%
13%
87%
27%
73%
18%
82%
25%
75%

20
Steel Business Unit
Exports – Main Markets
18%
16%
13% 13%
11%
6%
5%
5%
5%
8%
4Q15
25%
18%
15%
7%
7%
4%
4%
2% 1%
16%
2015 USA
Argentina
Turkey
China
Vietnam
Germany
Italy
Spain
United Kingdon
Others

18.8%
14.8%
12.7%
10.9%
10.0%
10.3%
7.8%
7.1%
5.3% 2.3%
4Q15
Labor (direct and indirect) Coal and Coke
Iron Ore and Pellets Energy and Fuels
Depreciation Other Raw Materials
Inventories Variation Spare Parts
Structural Expenses Others
19.0%
13.6%
11.1%
10.7%
10.6%
10.5%
8.9%
7.3%
5.6% 2.7%
3Q15
Steel Business Unit
21
Cost of Goods Sold - COGS

Steel Business Unit – R$ Million
Adjusted EBITDA and EBITDA Margin
22
268 337
206
(82)
(179)
11%
13%
9%
-4%
-8%
4Q14 1Q15 2Q15 3Q15 4Q15
Adjusted EBITDA Adjusted EBITDA Margin
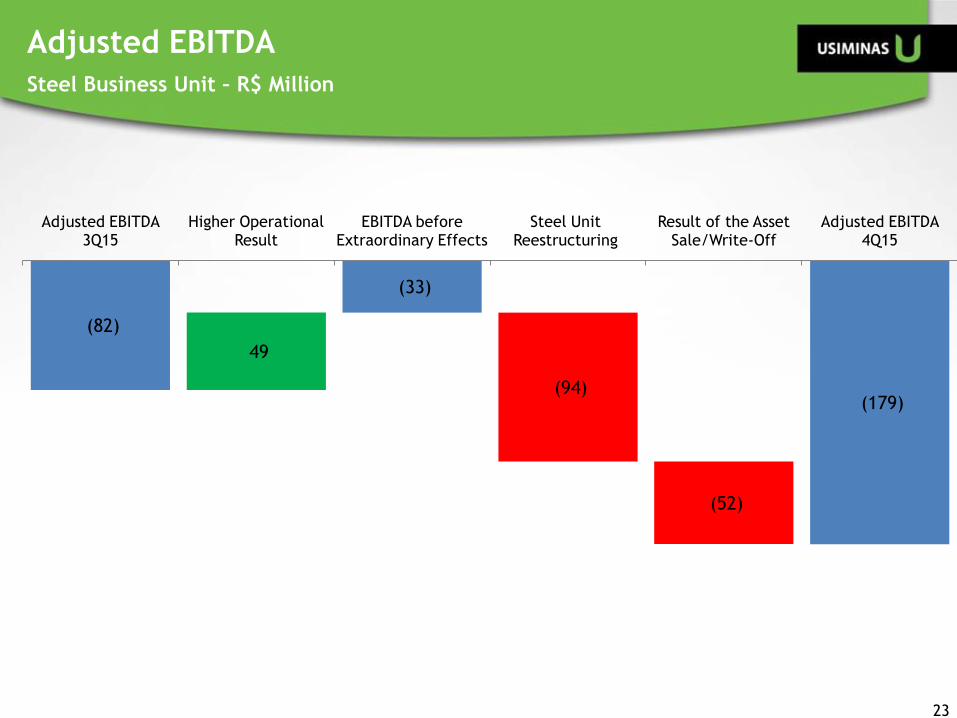
Steel Business Unit – R$ Million
Adjusted EBITDA
23
(179) (94)
(52)
49
(82)
(33)
Adjusted EBITDA 3Q15
Higher Operational Result
EBITDA before Extraordinary Effects
Steel Unit Reestructuring
Result of the Asset Sale/Write-Off
Adjusted EBITDA 4Q15

24
Steel Business Unit – R$ Million
Adjusted EBITDA and EBITDA Margin
912
1,819
463 697
1,806
1,546
282
9%
16%
4% 5%
14% 14%
3%
2009 2010 2011 2012 2013 2014 2015
Adjusted EBITDA Adjusted EBITDA Margin

25
Steel Business Unit – R$ Million
Adjusted EBITDA
282
(323)
(30)
(813)
(94) (45)
42
1,546
1,193
380
Adjusted EBITDA 2014
Excluding the Sale of Surplus Electric Energy
in 2014
Excluding the Result of the
Assets Sale/Write-Off
Adjusted EBITDA in 2014 without Sale of Electric Energy and the Assets Sale/Write-Off
Lower Operational
Result
EBITDA before Extraordinary
Effects Sale of Surplus Electric Energy
Steel Unit Reestructuring
Result of the Assets
Sale/Write-Off Adjusted
EBITDA 2015

Capacity increase to generate finished products
7.2 million t 9.7 million t
(2010) (2014)
Investments
26
Steel Business Unit
Slabs
Heavy Plates
Hot Rolled Cold Rolled
Hot dip galvanized Electrogalvanized

Start up in 2010
Meets the requirements of
Petrobras, focused on pre-
salt, besides the
shipbuilding sector
CLC Technology (Accelerated Cooling Process for Heavy Plates)
Galvanizing Line
Start up in 2011
Double the capacity to 1
million tons /year
Higher expertise in ultra-
resistant steel production
(dual phase)
27
Investments
Steel Business Unit

Start up in 2012
Capacity to process 2.3 million
tons / year
Improving products’ portfolio
(beams, ultra resistant wheels,
higher grades API’s)
Hot Strip Mill
Start up in 2013
Capacity to process 1.7 million
tons / year
Better thickness tolerance,
flatness and surface controls
of materials for wheels, beams
and compressors
Pickling Line
28
Investments
Steel Business Unit

o Met coke with adequate specifications for pig iron production in the blast furnace process
o Started up on May 2015
29
Coke Plant Revamp - Ipatinga
o Reduction of particle emissions, gases and volatile substances
o Coke gas to be used in the operational
facilities of Ipating Mill and electric energy
production
o Coke plant total capacity of 1,1 million
tons/year
Mainly Investment Concluded in 2015
Steel Business Unit

30
• Flat steel consumption in
the domestic market: fall of
12% in 2015 x 2014, with no
expectation of recovery
• Excess of global production
capacity: 704 million tons
• Continually decrease of
international prices
• High tax burden
• Unfair competition with
steel imports
• High energy costs
• FX Rate devaluation,
increasing raw materials costs
Low demand and
low
competitiveness
require structural
adjustments in
scale and
productivity
USIMINAS STRATEGY
Temporarily shutdown of the primary
areas of Cubatão plant (Sinter and
Coke plants, Blast Furnaces and
Steelworks), remaining in operations
its hot and cold rolling lines and port
terminal
Scale adjustment and increase on
competitiveness
Industrial Reconfiguration
Outlook

o Located in Serra Azul/Minas Gerais state
o 4 mining sites, acquired from J. Mendes in February, 2008
o Reserves of 2.6 billion tons of iron ore
o It has 20% of voting shares of MRS Logistica, being part of the Control Group
o Retroarea in Itaguaí Port
Description
31
Mining Business Unit
70%
30%
Shareholder Composition Production Capacity
Lump 2 million
Sinter Feed
4 million
Pellet Feed
6 million

MBL
Arcelor Mittal
Ferrous (Santanense)
Comisa Emicon
MMX
Ferrous
MUSA Pau de Vinho
MUSA Leste
Minerita
MUSA Central
MUSA Oeste
Itatiaiuçu
Igarapé São Joaquim De Bicas
Mineração Usiminas
Location
Mining Business Unit
32

MODAL Cargo
Terminal
Mineração
Usiminas
CUBATÃO Plant
TCS - Sarzedo
Cargo Terminal
Sepetiba/Itaguaí
Port
Export
40 Km
60 Km
IPATINGA Plant
Logistics
Mining Business Unit
33

Mining Business Unit
Retroarea in Itaguai Port
34

35
Mining Business Unit – Thousand Tons
Sales Volume
1,122 1,048 1,071
734 658
39 91
135
41
12
1,161 1,139 1,206
775
670
4Q14 1Q15 2Q15 3Q15 4Q15
Sales to 3rd parties - Domestic Market Sales to Usiminas

36
Mining Business Unit – Thousand Tons
Sales Volume
4,981 4,322 4,331 4,219 4,110
3,511
521
457 446
2,036
833
279
526
785 1,338
499
680
0
6,028
5,564
6,115
6,754
5,623
3,790
2010 2011 2012 2013 2014 2015
Exports Sales to 3rd parties - Domestic Market Sales to Usiminas

Iron Ore Price – PLATTS (62% Fe CFR China)
US$/ton
37
74
62 58
55
47
4Q14 1Q15 2Q15 3Q15 4Q15

Iron Ore Price – PLATTS (62% Fe CFR China)
US$/ton
38
135
90
56
2013 2014 2015

39
Adjusted EBITDA and EBITDA Margin
Mining Business Unit – R$ million
24 43
(6) (24)
(102)
27%
36%
-5%
-27%
-119%
4Q14 1Q15 2Q15 3Q15 4Q15
Adjusted EBITDA Adjusted EBITDA Margin

40
Adjusted EBITDA
Mining Business Unit – R$ million
(102)
(163)
84
(24)
61
Adjusted EBITDA 3Q15 Higher Operational
Result EBITDA before
Extraordinary Effects Mining Unit
Reestructure Adjusted EBITDA 4Q15

41
Adjusted EBITDA and EBITDA Margin
Mining Business Unit – R$ million
638 604
439
582
277
(89)
67%
62%
49% 51%
37%
-22%
2010 2011 2012 2013 2014 2015
Adjusted EBITDA Adjusted EBITDA Margin

42
Adjusted EBITDA
Mining Business Unit – R$ million
(89)
(56)
171
163
24
277
221
50
Adjusted EBITDA 2014
Excluding the Sale of Surplus Electric
Energy in 2014
Adjusted EBITDA in 2014 without Sale of Electric Energy
Lower Operational Result
EBITDA before Extraordinary
Effects Sale of Surplus Electric Energy
Mining Unit Reestructuring
Adjusted EBITDA 2015

o 8 industrial units in different Brazilian states:
MG, SP, RS, ES, BA and PE
o Processing capacity of 2 million tons of
steel/year
o Net Revenue of R$1.9 billion in 2015
Description
Soluções Usiminas - Steel Processing
43
Porto Alegre
São Paulo Guarulhos
Taubaté
Recife
Serra
Betim
Santa Luzia

o Facilities in Ipatinga/Minas Gerais state, Congonhas/Minas Gerais state and in
Cubatão/São Paulo state
o Market Segments: Steel Structures, Shipbuilding and Offshore, Oil and Gas, Industrial
Assembly and Equipment, Foundry and Railcars
o Net Revenue of R$869 million in 2015
Usiminas Mecânica - Capital Goods
Description
44
Brasília 3rd Bridge
44
Steel Structures

Agenda
Usiminas and its
business units
Market
Data
Financial
Results
Usiminas
Profile
45

46
Adjusted EBITDA and EBITDA Margin Consolidated – R$ million
302 380
227
(65)
(250)
12%
14%
8%
-3%
-10%
4Q14 1Q15 2Q15 3Q15 4Q15
Adjusted EBITDA Adjusted EBITDA Margin

47
Adjusted EBITDA Consolidated – R$ million
(250)
(257)
(50)
11
111
(65) (54)
57
Adjusted EBITDA 3Q15
Excluding the Result of the
Assets Sale/Write-Off on the 3Q15
Adjusted EBITDA in 3Q15 without the Assets Sale/Write-
Off Higher Operational
Result
EBITDA before Extraordinary
Effects Business
Reestructuring
Result of the Assets Sale/Write-
Off Adjusted EBITDA
4Q15

48
Adjusted EBITDA and EBITDA Margin Consolidated – R$ million
1,486
2,650
1,264
697
1,806 1,863
291
14%
20%
11%
5%
14%
16%
3%
2009 2010 2011 2012 2013 2014 2015
Adjusted EBITDA Adjusted EBITDA Margin

49
Adjusted EBITDA Consolidated – R$ million
291
(379)
(54)
(891)
(257)
(57)
65
1,863
1,430
540
Adjusted EBITDA 2014
Excluding the Sale of Surplus Electric Energy
in 2014
Excluding the Result of the
Assets Sale/Write-Off
Adjusted EBITDA in 2014 without Sale of Electric Energy and the Assets Sale/Write-Off
Lower Operational
Result
EBITDA before Extraordinary
Effects Sale of Surplus Electric Energy
Business Reestructuring
Result of the Assets
Sale/Write-Off Adjusted
EBITDA 2015

50
Comparing Adjusted and CVM 527 EBITDA Consolidated – R$ Thousand

Cash Position and Debt Profile
51
Consolidated – R$ million
1,720
1,134 1,188
536
933
316
13 11 30
304
786 637
1,622
82
598
0 0 0
Cash 2016 2017 2018 2019 2020 2021 2022 2023 on
Local Currency Foreign Currency
1,825
1,016
914
13 30 11
2,158
Duration: R$: 28 months
US$: 24 months 1,920
2,024

Cash and Indebtedness Consolidated - R$ million
52
2,852 2,621 2,889 2,397
2,024
3,850 4,528 4,716 5,714
5,862
6,702 7,149
7,605
8,111 7,886
4Q14 1Q15 2Q15 3Q15 4Q15
Cash Net Debit Gross Debit

CAPEX
53
Consolidated - R$ million
3,070
1,849
976
600
964
622
41
365
555
317
94
112
81
276
112
64 52
50
3,192
2,490
1,643
981 1,110
784
2010 2011 2012 2013 2014 2015
Others Mining Steel

Consolidated - R$ million
G&A Evolution
54
134 122
108 101
109
5.2%
4.6%
4.0% 4.2%
4.5%
4Q14 1Q15 2Q15 3Q15 4Q15
G&A G&A/Net Revenues

Working Capital
Consolidated – R$ billion
55
2.4
2.7 2.7
2.4 2.3
4Q14 1Q15 2Q15 3Q15 4Q15

56
Inventory
turnover
(days)
Thousand Tons
Working Capital – Steel Inventories
886 932
911
747
639
4Q14 1Q15 2Q15 3Q15 4Q15
64 67 64 67 48

208
(3,685)
2014 2015
Net Income (Loss) - Consolidated R$ Million
(1,042)
(1,627)
3Q15 4Q15
57
1,039
(331)
Impairment of Assets (Net of
Withholding Taxes)
Net Income (Loss) without
Extraordinary Effects Business Reestructuring
1,688
257
257
(1,740)

Income Statement Per Business Unit – R$ million
Note: All intercompany transactions are made at arm´s length basis 58

Income Statement
59
Per Business Unit – R$ million
Note: All intercompany transactions are made at arm´s length basis

Declarations relative to business and perspectives of the Company, operating
and financial results and projections, and references to the growth of the
Company constitute mere forecasts and were based on Management´s
expectations in relation to future performance, these expectations are highly
dependent on market behavior, on Brazil´s economic situation, on the industry
and on international markets, and are therefore subject to change.
ADR
Level I
www.usiminas.com/ri
Cristina Morgan C. Drumond Head of IR
Phone: 55-31-3499-8772
Fax: 55-31-3499-9357
Renata Costa Couto IR Analyst
Phone: 55-31-3499-8619
Leonardo Karam Rosa IR Manager
Phone: 55-31-3499.8550
Diogo Dias Gonçalves IR Manager
Phone: 55-31-3499-8710
Related Documents


