November 27, 2021 BSE Limited Dept of Corporate Services Phiroze Jeejeebhoy Towers, Dalal Street, Fort, Mumbai 400 001 Scrip Code: 543396 PaYtm National Stock Exchange of India Limited The Listing Department Exchange Plaza Bandra Kurla Complex, Mumbai 400 051 Symbol: PAYTM Sub.: Earnings Conference Call - Presentation Dear Sir/ Madam, In continuation to our letter dated November 25, 2021 and in terms of regulation 30 of the SEBI (Listing Obligations and Disclosure Requirements) Regulations, 2015, please find enclosed presentation made during the earnings conference call held on Saturday, November 27, 2021. The Presentation will also be hosted on the Company's website, www.paytm.com. Request you to kindly take the same on record. Thanking you A C Encl: As above ications Limited & Compliance Officer One 97 Communications Limited compliance.officer@pam.com Corporate Office-B 121, Sector 5, Noida 201301, India T: +91 120 4770770 F +91 120 4770771 CIN: U72200DL2000PLC108985 Registered Office-136, First Floor, Devika Tower, Nehru Place, New Delhi - 110019

Welcome message from author
This document is posted to help you gain knowledge. Please leave a comment to let me know what you think about it! Share it to your friends and learn new things together.
Transcript
November 27, 2021
BSE Limited Dept of Corporate Services Phiroze Jeejeebhoy Towers, Dalal Street, Fort, Mumbai 400 001
Scrip Code: 543396
PaYtm
National Stock Exchange of India Limited The Listing Department Exchange Plaza Bandra Kurla Complex, Mumbai 400 051
Symbol: PAYTM
Sub.: Earnings Conference Call - Presentation
Dear Sir/ Madam,
In continuation to our letter dated November 25, 2021 and in terms of regulation 30 of the SEBI (Listing Obligations and Disclosure Requirements) Regulations, 2015, please find enclosed presentation made during the earnings conference call held on Saturday, November 27, 2021.
The Presentation will also be hosted on the Company's website, www.paytm.com.
Request you to kindly take the same on record.
Thanking you
A
C
Encl.: As above
ications Limited
& Compliance Officer
One 97 Communications Limited
Corporate Office-B 121, Sector 5, Noida 201301, India
T: +91 120 4770770 F +91 120 4770771 CIN: U72200DL2000PLC108985
Registered Office-136, First Floor, Devika Tower, Nehru Place, New Delhi - 110019
Quarter Ending September 2021
Earnings Presentation PaYtm
DisclaimerBy attending the presentation or by reading the presentation
slides you agree to be bound as follows:
This Presentation is prepared by One 97 Communications
Limited (“Company”) and is for information purposes only
without regards to specific objectives, financial situations or
needs of any -particular person and is not and nothing in it shall
be construed as an invitation, offer, solicitation,
recommendation or advertisement in respect of the purchase or
sale of any securities of the Company or any affiliates in any
jurisdiction or as an inducement to enter into investment activity
and no part of it shall form the basis of or be relied upon in
connection with any contract or commitment or investment
decision whatsoever. This Presentation does not take into
account, nor does it provide any tax, legal or investment advice
or opinion regarding the specific investment objectives or
financial situation of any person. Before acting on any
information you should consider the appropriateness of the
information having regard to these matters, and in particular,
you should seek independent financial advice. This
Presentation and its contents are confidential and proprietary to
the Company and/or its affiliates and no part of it or its subject
matter be used, reproduced, copied, distributed, shared,
retransmitted, summarised or disseminated, directly or
indirectly, to any other person or published in whole or in part
for any purpose, in any manner whatsoever.
The information contained in this Presentation is a general
background information of the Company and there is no
representation that all information relating to the context has
been taken care of in the Presentation. We do not assume
responsibility to publicly amend, modify or revise any
information contained in this Presentation on the basis of any
subsequent development, information or events, or otherwise.
This Presentation includes certain statements that are, or may
be deemed to be, “forward-looking statements” and relate to the
Company and its financial position, business strategy, events
and courses of action.
Forward-looking statements and financial projections are based
on the opinions and estimates of management at the date the
statements are made and are subject to a variety of risks and
uncertainties and other factors that could cause actual events or
results to differ materially from those anticipated in the forward-
looking statements and financial projections. Representative
examples of factors that could affect the accuracy of forward
looking statements include (without limitation) the condition of
and changes in India’s political and economic status,
government policies, applicable laws, international and
domestic events having a bearing on Company’s business, and
such other factors beyond our control.
Forward-looking statements and financial projections include,
among other things, statements about: our expectations
regarding our transaction volumes, expenses, sales and
operations; our future merchant and consumer concentration;
our anticipated cash needs, our estimates regarding our capital
requirements, our need for additional financing; our ability to
anticipate the future needs of our merchants and consumers;
our plans for future products and enhancements of existing
products; our future growth strategy and growth rate; our future
intellectual property; and our anticipated trends and challenges
in the markets in which we operate. Forward-looking statements
are not guarantees of future performance including those
relating to general business plans and strategy, future outlook
and growth prospects, and future developments in its
businesses and its competitive and regulatory environment.
These forward-looking statements represent only the
Company’s current intentions, beliefs or expectations, and no
representation, warranty or undertaking, express or implied, is
made or assurance given that such statements, views,
projections or forecasts in the Presentation, if any, are correct or
that any objectives specified herein will be achieved.
We, or any of our affiliates, shareholders, directors, employees,
or advisors, as such, make no representations or warranties,
express or implied, as to, and do not accept any responsibility
or liability with respect to, the fairness, accuracy, completeness
or correctness of any information or opinions contained herein
and accept no liability whatsoever for any loss, howsoever,
arising from any use or reliance on this Presentation or its
contents or otherwise arising in connection therewith. The
information contained herein is subject to change without any
obligation to notify any person of such revisions or change and
past performance is not indicative of future results.
This document has not been and will not be reviewed or
approved by a regulatory authority in India or by any stock
exchange in India. No rights or obligations of any nature are
created or shall be deemed to be created by the contents of this
Presentation.
Use of Operating Metrics
The operating metrics reported in this Presentation are
calculated using internal Company data based on the activity of
our merchants, consumers and other participants in our
ecosystem. While these numbers are based on what we believe
to be reasonable estimates of engagement, for the applicable
period of measurement, there are inherent challenges in
measuring usage across our large online, offline, in-store and
mobile presence. The methodologies used to measure these
metrics require significant judgment and are also susceptible to
algorithm or other technical errors. We regularly review our
processes for calculating these metrics, and from time to time
we may discover inaccuracies in our metrics or may make
adjustments to improve their accuracy, which can result in
adjustments to previously disclosed metrics. In addition, our
metrics will differ from estimates published by third parties due
to differences in methodology.
PaYtm
To bring Half-a-Billion Indians
to the Mainstream Economy through
Technology-led Financial Services
PaYtm PaYtm
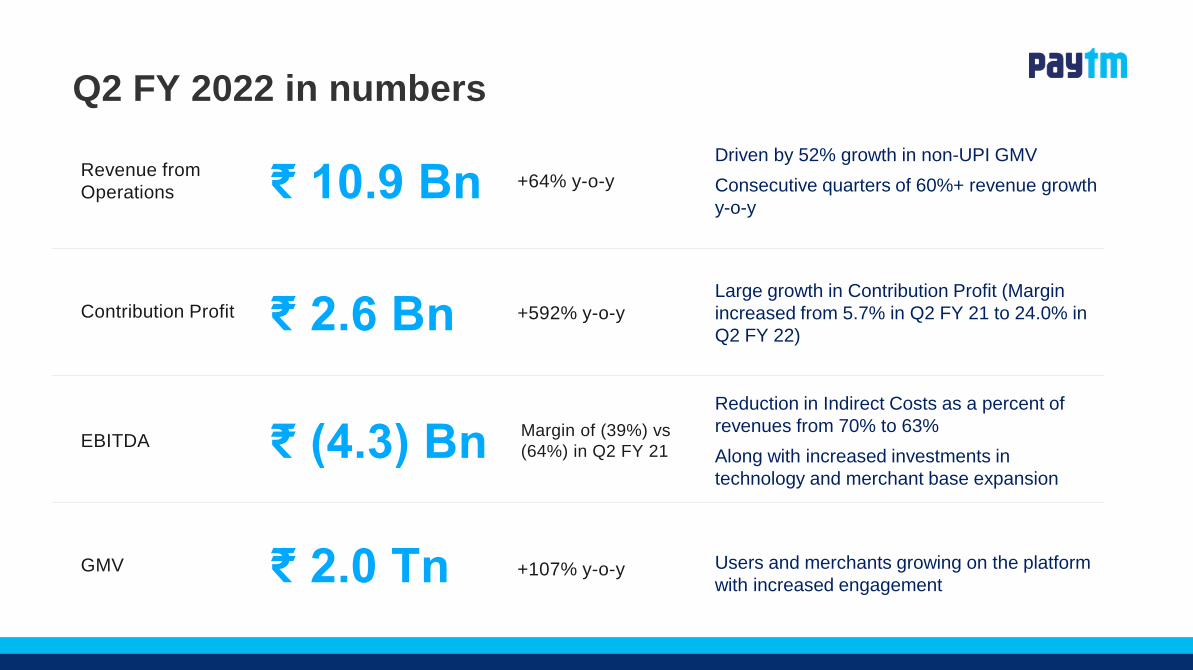
Q2 FY 2022: Operational HighlightsQ2 FY 2022 in numbers
Contribution Profit
Revenue from
Operations
EBITDA
₹ 10.9 Bn +64% y-o-y
+592% y-o-y₹ 2.6 Bn
₹ (4.3) Bn
GMV ₹ 2.0 Tn +107% y-o-y Users and merchants growing on the platform
with increased engagement
Driven by 52% growth in non-UPI GMV
Consecutive quarters of 60%+ revenue growth
y-o-y
Large growth in Contribution Profit (Margin
increased from 5.7% in Q2 FY 21 to 24.0% in
Q2 FY 22)
Reduction in Indirect Costs as a percent of
revenues from 70% to 63%
Along with increased investments in
technology and merchant base expansion
Margin of (39%) vs
(64%) in Q2 FY 21
PaYtm
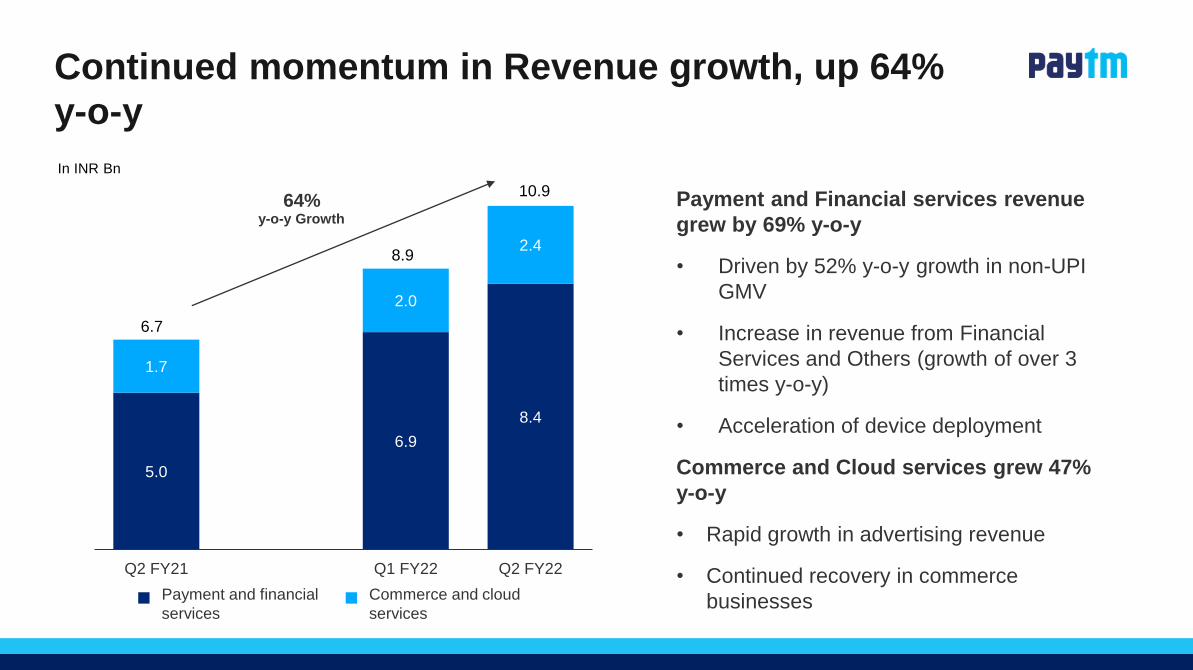
Continued momentum in Revenue growth, up 64%
y-o-y
5.0
6.9
8.4
1.7
2.0
2.4
Q2 FY21 Q1 FY22 Q2 FY22
64%y-o-y Growth
In INR Bn
Payment and Financial services revenue
grew by 69% y-o-y
• Driven by 52% y-o-y growth in non-UPI
GMV
• Increase in revenue from Financial
Services and Others (growth of over 3
times y-o-y)
• Acceleration of device deployment
Commerce and Cloud services grew 47%
y-o-y
• Rapid growth in advertising revenue
• Continued recovery in commerce
businesses
6.7
8.9
10.9
Payment and financial
services
Commerce and cloud
services
PaYtm
■ ■
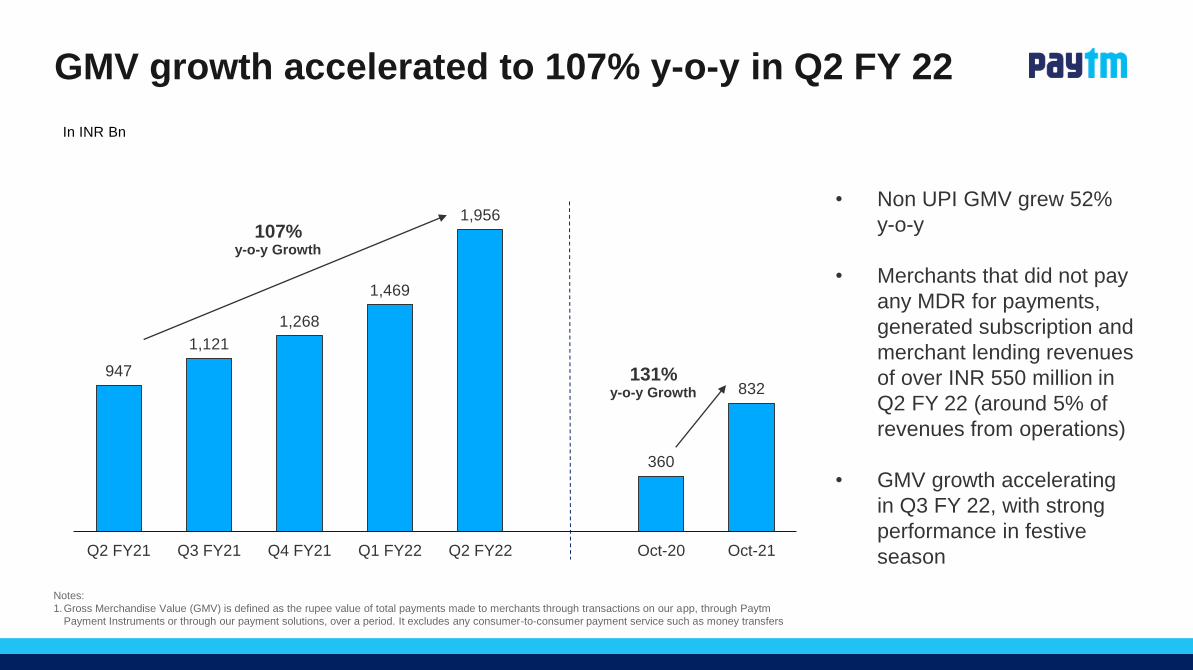
GMV growth accelerated to 107% y-o-y in Q2 FY 22
947
1,121
1,268
1,469
1,956
360
832
Q2 FY21 Q3 FY21 Q4 FY21 Q1 FY22 Q2 FY22 Oct-20 Oct-21
• Non UPI GMV grew 52%
y-o-y
• Merchants that did not pay
any MDR for payments,
generated subscription and
merchant lending revenues
of over INR 550 million in
Q2 FY 22 (around 5% of
revenues from operations)
• GMV growth accelerating
in Q3 FY 22, with strong
performance in festive
season
In INR Bn
107%y-o-y Growth
131%y-o-y Growth
Notes:
1.Gross Merchandise Value (GMV) is defined as the rupee value of total payments made to merchants through transactions on our app, through Paytm
Payment Instruments or through our payment solutions, over a period. It excludes any consumer-to-consumer payment service such as money transfers
PaYtm
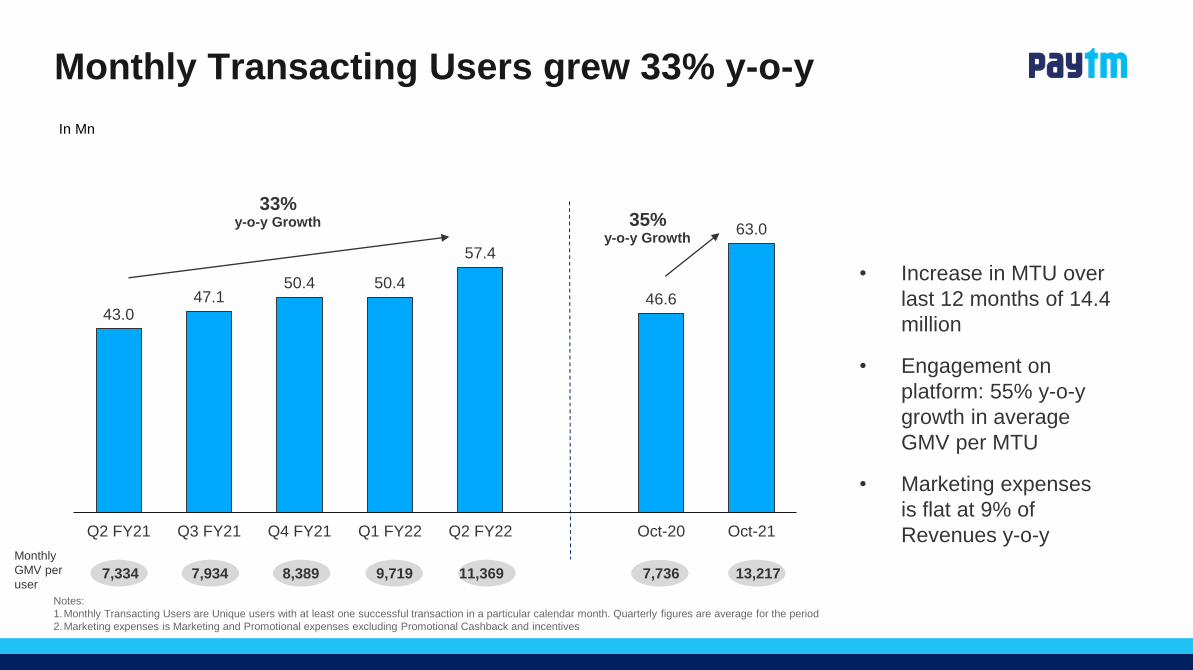
43.047.1
50.4 50.4
57.4
46.6
63.0
Q2 FY21 Q3 FY21 Q4 FY21 Q1 FY22 Q2 FY22 Oct-20 Oct-21
Monthly Transacting Users grew 33% y-o-y
• Increase in MTU over
last 12 months of 14.4
million
• Engagement on
platform: 55% y-o-y
growth in average
GMV per MTU
• Marketing expenses
is flat at 9% of
Revenues y-o-y
In Mn
Monthly
GMV per
user
33%y-o-y Growth 35%
y-o-y Growth
7,334 7,934 8,389 9,719 11,369 7,736 13,217
Notes:
1.Monthly Transacting Users are Unique users with at least one successful transaction in a particular calendar month. Quarterly figures are average for the period
2.Marketing expenses is Marketing and Promotional expenses excluding Promotional Cashback and incentives
PaYtm
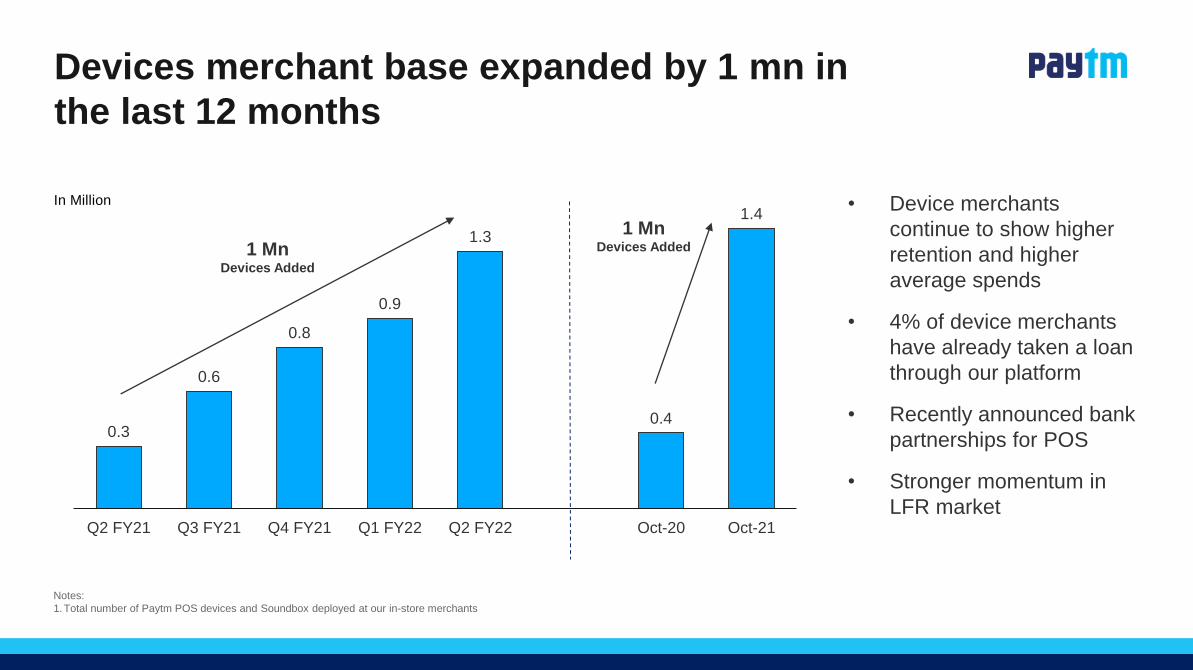
0.3
0.6
0.8
0.9
1.3
0.4
1.4
Q2 FY21 Q3 FY21 Q4 FY21 Q1 FY22 Q2 FY22 Oct-20 Oct-21
Devices merchant base expanded by 1 mn in
the last 12 months
• Device merchants
continue to show higher
retention and higher
average spends
• 4% of device merchants
have already taken a loan
through our platform
• Recently announced bank
partnerships for POS
• Stronger momentum in
LFR market
In Million
1 Mn Devices Added
1 Mn Devices Added
Notes:
1.Total number of Paytm POS devices and Soundbox deployed at our in-store merchants
PaYtm
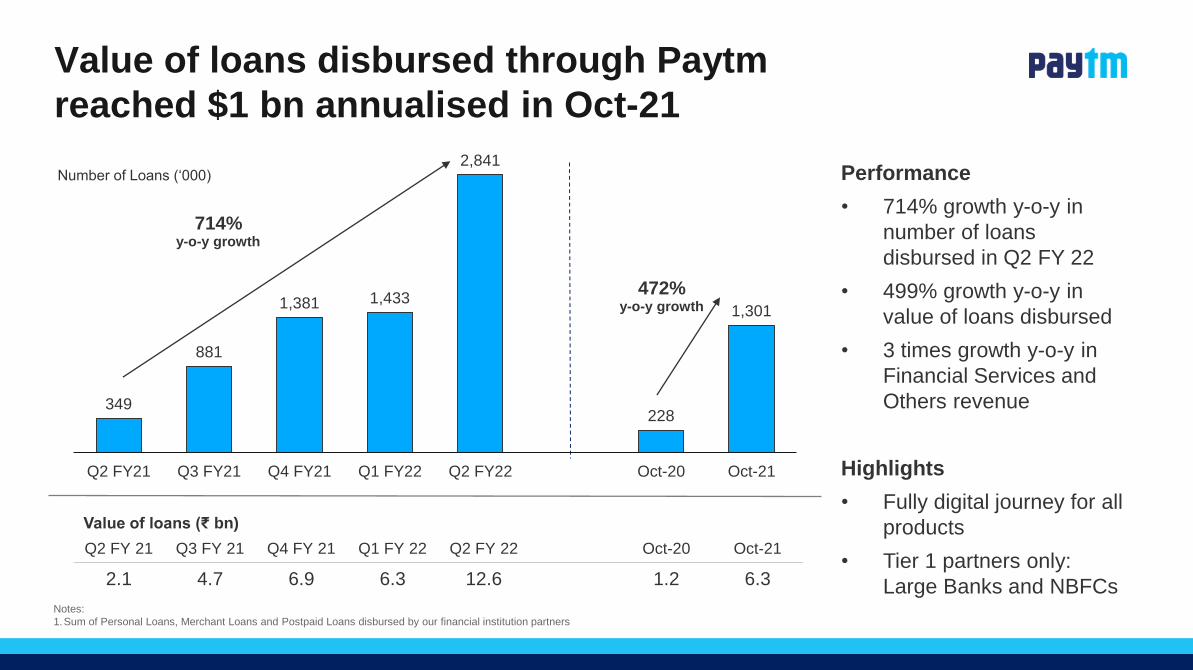
Value of loans disbursed through Paytm
reached $1 bn annualised in Oct-21
Performance
• 714% growth y-o-y in
number of loans
disbursed in Q2 FY 22
• 499% growth y-o-y in
value of loans disbursed
• 3 times growth y-o-y in
Financial Services and
Others revenue
Highlights
• Fully digital journey for all
products
• Tier 1 partners only:
Large Banks and NBFCs
349
881
1,381 1,433
2,841
228
1,301
Q2 FY21 Q3 FY21 Q4 FY21 Q1 FY22 Q2 FY22 Oct-20 Oct-21
714% y-o-y growth
472% y-o-y growth
Number of Loans (‘000)
Notes:
1.Sum of Personal Loans, Merchant Loans and Postpaid Loans disbursed by our financial institution partners
Q2 FY 21 Q3 FY 21 Q4 FY 21 Q1 FY 22 Q2 FY 22 Oct-20 Oct-21
2.1 4.7 6.9 6.3 12.6 1.2 6.3
Value of loans (₹ bn)
PaYtm
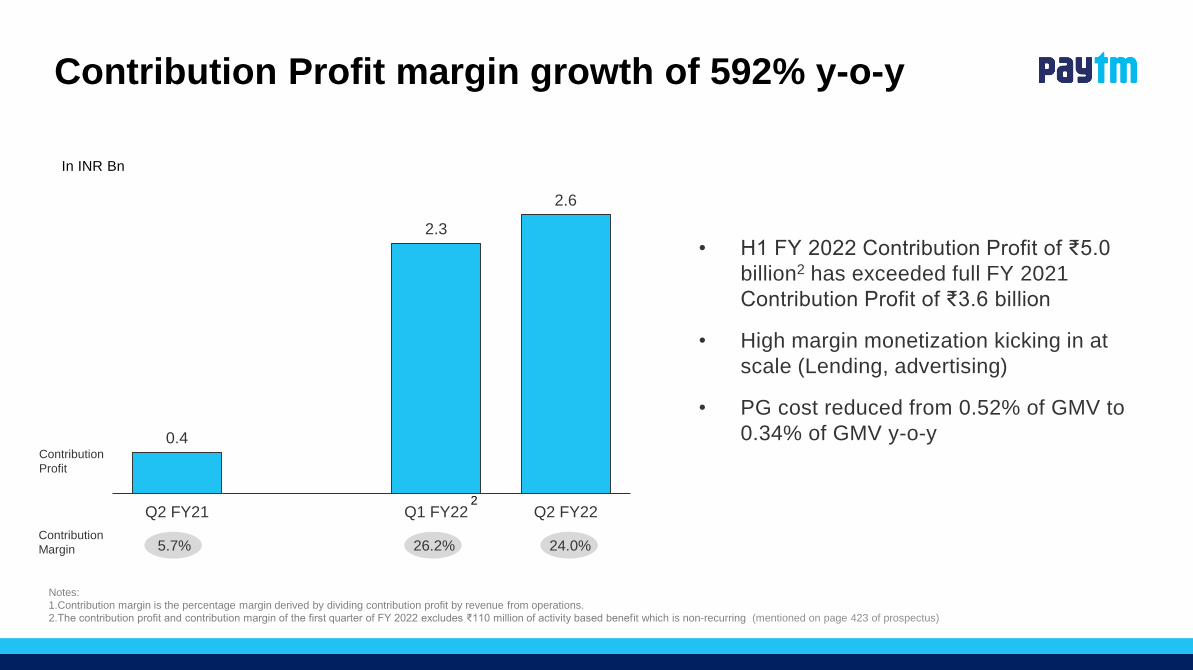
Contribution Profit margin growth of 592% y-o-y
0.4
2.3
2.6
Q2 FY21 Q1 FY22 Q2 FY22
In INR Bn
Contribution
Profit
Contribution
Margin
• H1 FY 2022 Contribution Profit of ₹5.0
billion2 has exceeded full FY 2021
Contribution Profit of ₹3.6 billion
• High margin monetization kicking in at
scale (Lending, advertising)
• PG cost reduced from 0.52% of GMV to
0.34% of GMV y-o-y
5.7% 26.2% 24.0%
Notes:
1.Contribution margin is the percentage margin derived by dividing contribution profit by revenue from operations.
2.The contribution profit and contribution margin of the first quarter of FY 2022 excludes ₹110 million of activity based benefit which is non-recurring (mentioned on page 423 of prospectus)
2
PaYtm
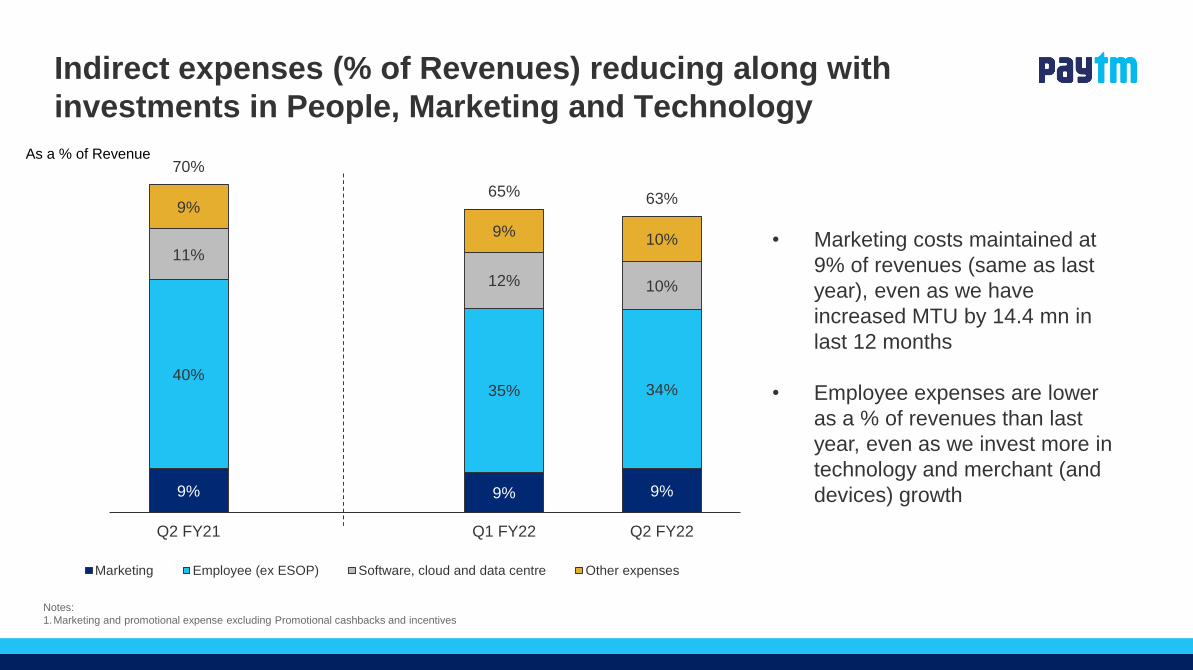
Indirect expenses (% of Revenues) reducing along with
investments in People, Marketing and Technology
9% 9% 9%
40%35% 34%
11%
12% 10%
9%
9%10%
70%
65% 63%
Q2 FY21 Q1 FY22 Q2 FY22
Marketing Employee (ex ESOP) Software, cloud and data centre Other expenses
• Marketing costs maintained at
9% of revenues (same as last
year), even as we have
increased MTU by 14.4 mn in
last 12 months
• Employee expenses are lower
as a % of revenues than last
year, even as we invest more in
technology and merchant (and
devices) growth
As a % of Revenue
Notes:
1.Marketing and promotional expense excluding Promotional cashbacks and incentives
PaYtm
■ □ □ □
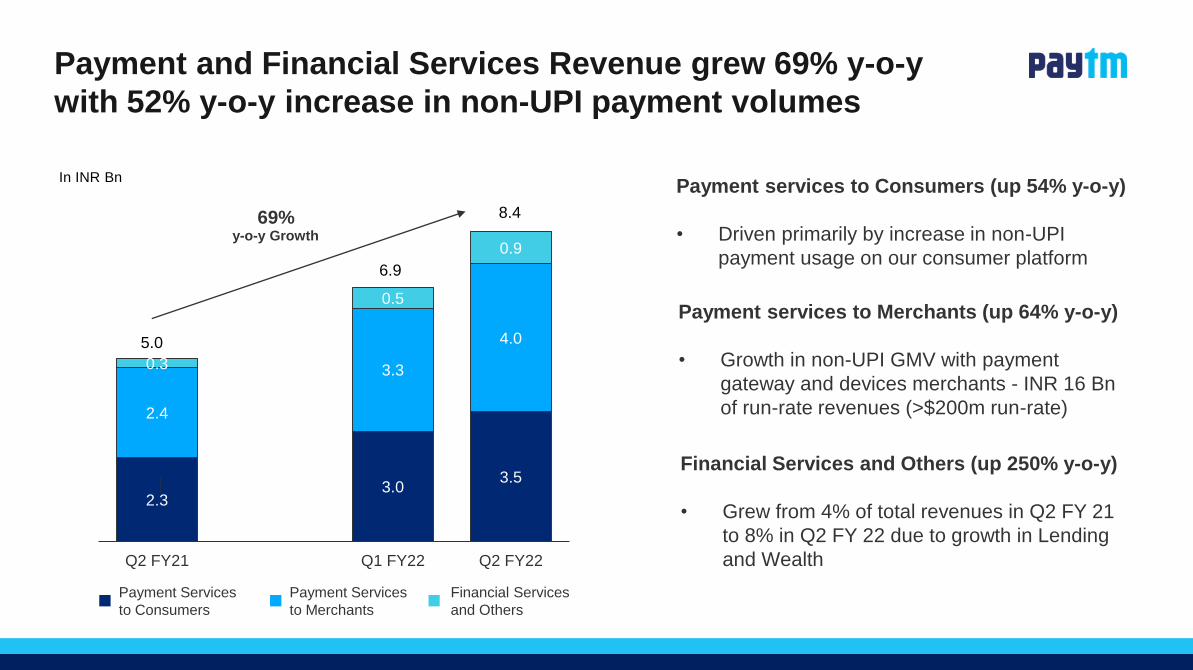
2.33.0
3.5
2.4
3.3
4.0
0.3
0.5
0.9
Q2 FY21 Q1 FY22 Q2 FY22
Payment and Financial Services Revenue grew 69% y-o-y
with 52% y-o-y increase in non-UPI payment volumes
69%y-o-y Growth
In INR BnPayment services to Consumers (up 54% y-o-y)
• Driven primarily by increase in non-UPI
payment usage on our consumer platform
Payment services to Merchants (up 64% y-o-y)
• Growth in non-UPI GMV with payment
gateway and devices merchants - INR 16 Bn
of run-rate revenues (>$200m run-rate)
Financial Services and Others (up 250% y-o-y)
• Grew from 4% of total revenues in Q2 FY 21
to 8% in Q2 FY 22 due to growth in Lending
and Wealth
Payment Services
to Consumers
Payment Services
to Merchants
Financial Services
and Others
5.0
6.9
8.4
PaYtm
■ ■ ■
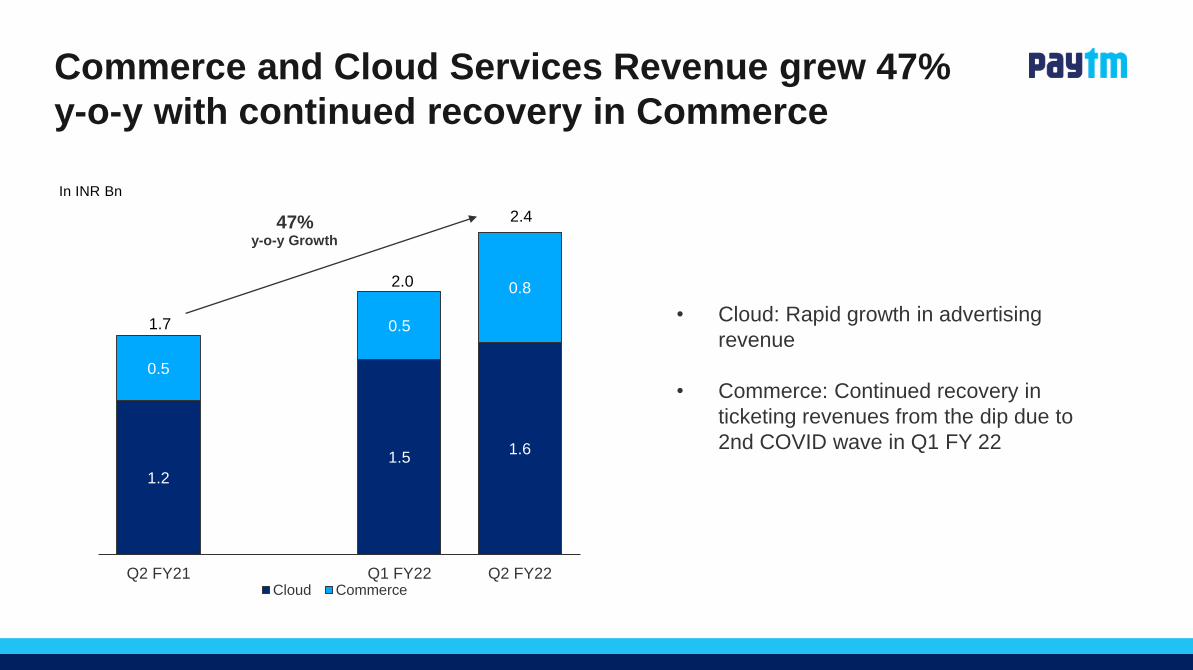
1.2
1.51.6
0.5
0.5
0.8
Q2 FY21 Q1 FY22 Q2 FY22Cloud Commerce
Commerce and Cloud Services Revenue grew 47%
y-o-y with continued recovery in Commerce
47%y-o-y Growth
In INR Bn
• Cloud: Rapid growth in advertising
revenue
• Commerce: Continued recovery in
ticketing revenues from the dip due to
2nd COVID wave in Q1 FY 22
1.7
2.0
2.4
PaYtm
■ ■
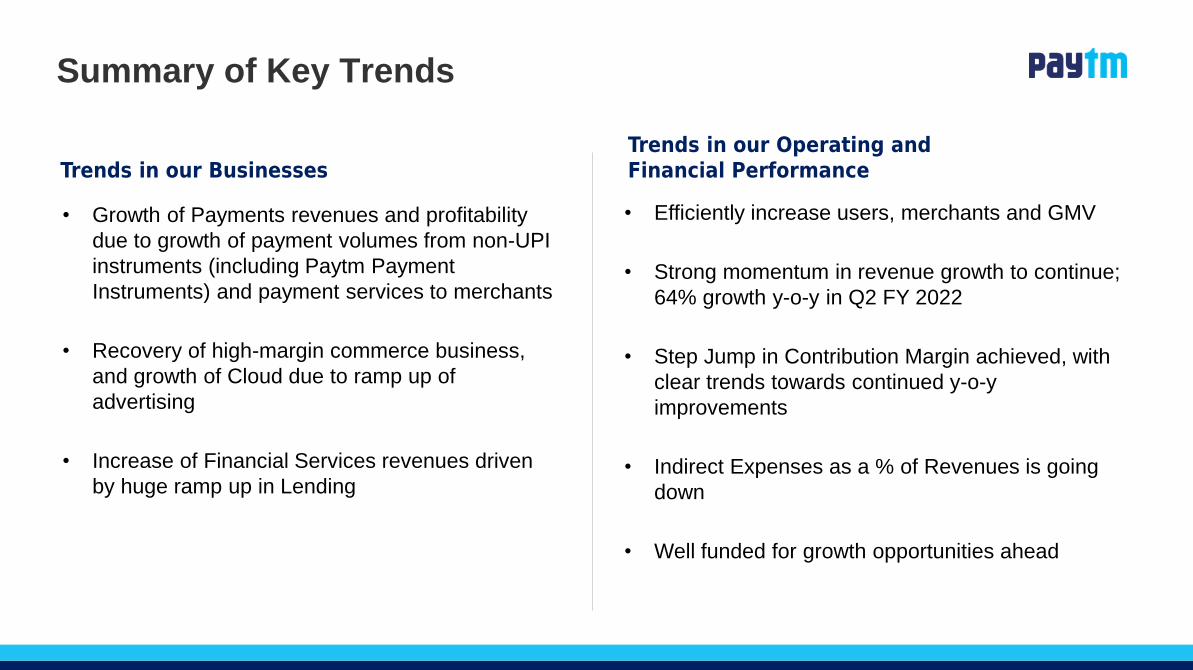
Summary of Key Trends
• Growth of Payments revenues and profitability
due to growth of payment volumes from non-UPI
instruments (including Paytm Payment
Instruments) and payment services to merchants
• Recovery of high-margin commerce business,
and growth of Cloud due to ramp up of
advertising
• Increase of Financial Services revenues driven
by huge ramp up in Lending
• Efficiently increase users, merchants and GMV
• Strong momentum in revenue growth to continue;
64% growth y-o-y in Q2 FY 2022
• Step Jump in Contribution Margin achieved, with
clear trends towards continued y-o-y
improvements
• Indirect Expenses as a % of Revenues is going
down
• Well funded for growth opportunities ahead
Trends in our Operating and Financial PerformanceTrends in our Businesses
PaYtm

Thank you
PaYtm

Annexure
PaYtm
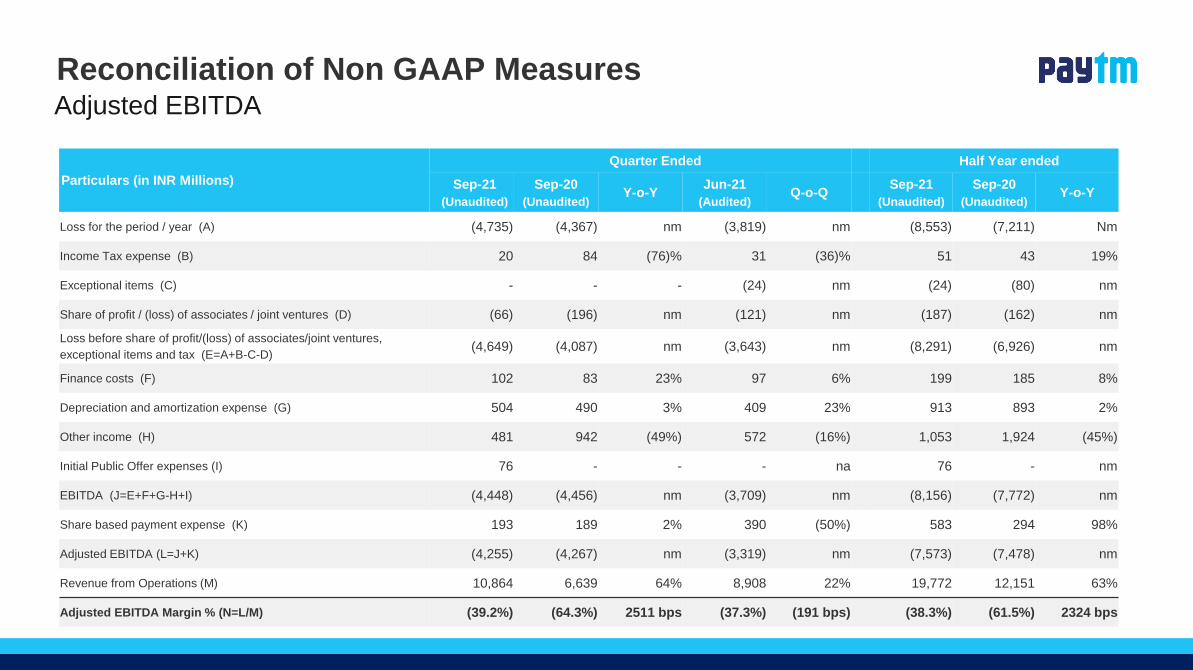
Reconciliation of Non GAAP MeasuresAdjusted EBITDA
Particulars (in INR Millions)
Quarter Ended Half Year ended
Sep-21
(Unaudited)
Sep-20
(Unaudited)Y-o-Y
Jun-21
(Audited)Q-o-Q
Sep-21
(Unaudited)
Sep-20
(Unaudited)Y-o-Y
Loss for the period / year (A) (4,735) (4,367) nm (3,819) nm (8,553) (7,211) Nm
Income Tax expense (B) 20 84 (76)% 31 (36)% 51 43 19%
Exceptional items (C) - - - (24) nm (24) (80) nm
Share of profit / (loss) of associates / joint ventures (D) (66) (196) nm (121) nm (187) (162) nm
Loss before share of profit/(loss) of associates/joint ventures,
exceptional items and tax (E=A+B-C-D)(4,649) (4,087) nm (3,643) nm (8,291) (6,926) nm
Finance costs (F) 102 83 23% 97 6% 199 185 8%
Depreciation and amortization expense (G) 504 490 3% 409 23% 913 893 2%
Other income (H) 481 942 (49%) 572 (16%) 1,053 1,924 (45%)
Initial Public Offer expenses (I) 76 - - - na 76 - nm
EBITDA (J=E+F+G-H+I) (4,448) (4,456) nm (3,709) nm (8,156) (7,772) nm
Share based payment expense (K) 193 189 2% 390 (50%) 583 294 98%
Adjusted EBITDA (L=J+K) (4,255) (4,267) nm (3,319) nm (7,573) (7,478) nm
Revenue from Operations (M) 10,864 6,639 64% 8,908 22% 19,772 12,151 63%
Adjusted EBITDA Margin % (N=L/M) (39.2%) (64.3%) 2511 bps (37.3%) (191 bps) (38.3%) (61.5%) 2324 bps
PaYtm
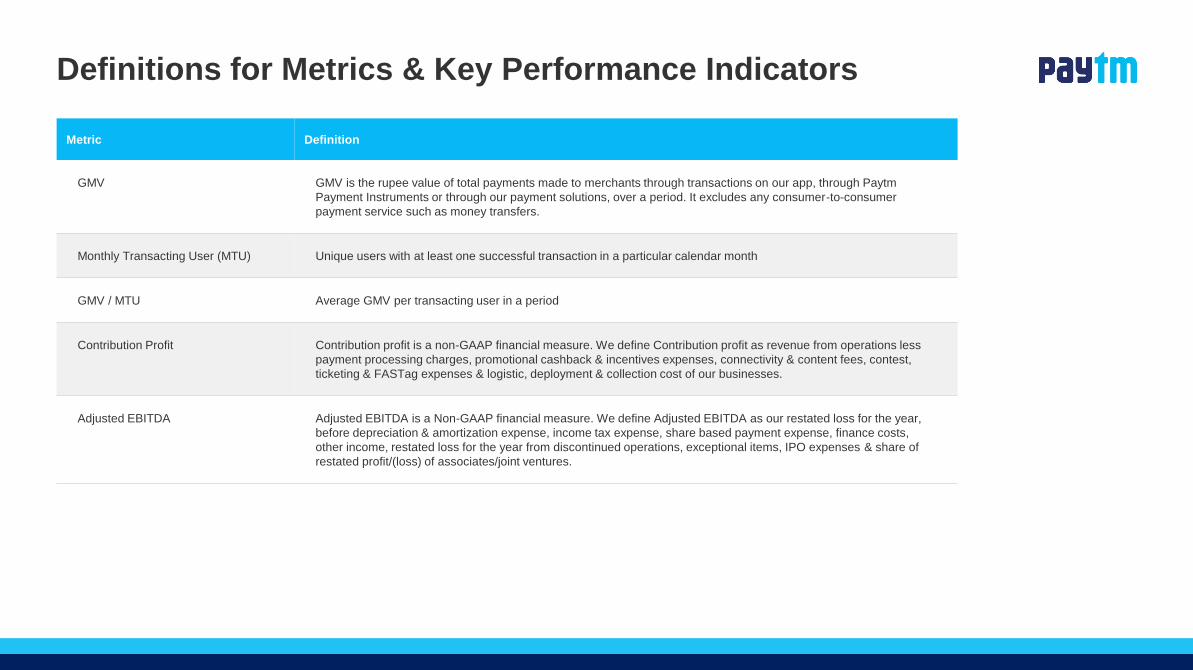
Metric Definition
GMV GMV is the rupee value of total payments made to merchants through transactions on our app, through Paytm
Payment Instruments or through our payment solutions, over a period. It excludes any consumer-to-consumer
payment service such as money transfers.
Monthly Transacting User (MTU) Unique users with at least one successful transaction in a particular calendar month
GMV / MTU Average GMV per transacting user in a period
Contribution Profit Contribution profit is a non-GAAP financial measure. We define Contribution profit as revenue from operations less
payment processing charges, promotional cashback & incentives expenses, connectivity & content fees, contest,
ticketing & FASTag expenses & logistic, deployment & collection cost of our businesses.
Adjusted EBITDA Adjusted EBITDA is a Non-GAAP financial measure. We define Adjusted EBITDA as our restated loss for the year,
before depreciation & amortization expense, income tax expense, share based payment expense, finance costs,
other income, restated loss for the year from discontinued operations, exceptional items, IPO expenses & share of
restated profit/(loss) of associates/joint ventures.
Definitions for Metrics & Key Performance Indicators PaYtm
Related Documents