Infrastrucure to 2030: opportunities and challenges April 14th 2010

Presentacininfrastructureto2030opportunitiesandchallenges 100506130120-phpapp01
Jul 17, 2015
Welcome message from author
This document is posted to help you gain knowledge. Please leave a comment to let me know what you think about it! Share it to your friends and learn new things together.
Transcript

Infrastrucure to 2030: opportunities and challenges
April 14th 2010

Infrastructure to 2030: opportunities and
challenges
by Pierre-Alain SchiebCounsellor, Head of OECD
Futures Projects
April 14th 2010Mexico City

Who are we?Advisory Unit to the Secretary-General
(SGE/AU)International Futures Programme (IFP)
• Multidisciplinary team, created in 1990, reporting directly to the Secretary-General of the OECD
• Mission = Identify and explore emerging policy issues to 2030 (management of new emerging risks, the security economy, bioeconomy, migrations, infrastructure, future shocks…), discuss policy options..
• Participation / Project Funding = Involvement of governmental bodies and private sector actors in each (self-financed) project
© OECD International Futures Programme 3

Examples of OECD/IFP projects
Infrastructure2006
Space2005
Infrastructure2007
Space2004
© OECD International Futures Programme 4

Why infrastructure in OECD countries?
• Economic benefits in OECD countries were deemed « unconclusive » in the 80’s (Ashauer, 1989, A. Munnel..)
• Cost of opportunity in 2000s: shortages, market failures, ageing infrastructure..
• Attractiveness (Krugman): what if you have science parks and universities but no more 24/24 power, clean water, efficient public transportation?
• Many kinds of social benefits (Lewis Mumford etc)• And now, keynesian approaches (stimulus packages)
© OECD International Futures Programme 5

Italy Blackout (2003)
6© OECD International Futures Programme

Rail congestion in Europe (2006)
http://www.cemt.org/online/Congestion07/UIC.pdf 7

Water stress by major water basins in 2000 and 2030
Source: OECD Environment Directorate (2006), Working Party on Global and Structural Policies, Revised environmental baseline for the OECD environmental outlook to 2030, 20-21 November 2006, ENV/EPOC/GSP(2006)23
8

Main Features of the Project (Phase I)
• Long-term view of infrastructure development and investment
• 2 year duration (2005-2007)
• OECD countries + BRICs
• Telecoms, electricity, road, rail, water
• Time horizon 2030
• Project team – OECD IFP
• Steering Group (government, business, research)
• Collaboration across OrganisationOECD International Futures Programme 9

Phase 1: Assessment of needs, potential demand and the future evolution of the
sector
• Critical assessments of existing reports
• What are the key factors driving the future evolution of the sector?
• Longer term prospects for needs and potential demand
• Cross sectoral interdependencies/synergies
© OECD International Futures Programme 10

Electricity Sector Investment to 2030 (IEA, Trevor Morgan)
Reference scenario:
• OECD: 3,940 trillion $• Transition economies 0,653 trillion $• Developing countries: 5,205 trillion $• Total: 9,798 trillion $
IEA
© OECD International Futures Programme 11
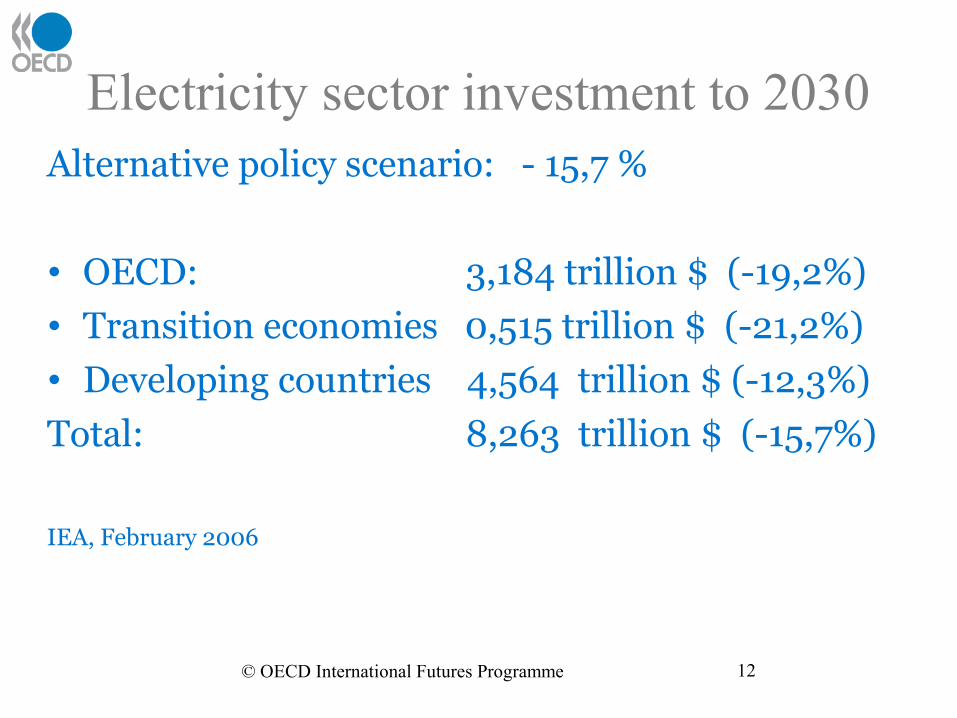
Electricity sector investment to 2030Alternative policy scenario: - 15,7 %
• OECD: 3,184 trillion $ (-19,2%)• Transition economies 0,515 trillion $ (-21,2%)• Developing countries 4,564 trillion $ (-12,3%)
Total: 8,263 trillion $ (-15,7%)
IEA, February 2006
© OECD International Futures Programme 12

Water investment to 2030(R. Ashley, A.Cashman, Sheffield, UK)
OECD and « big five » only :
• to 2015: 772 billion $ a year
• to 2025 1 trillion $ a year
© OECD International Futures Programme 13

Transport Investment to 2030(David Stambrook, Canada)
• Road transport: 220 to 290 billion $ a year
(2/3 in OECD countries)
• Rail transport: 50 to 60 billion $ a year (2/3 in OECD countries)
• Policy matters: potential shift of 10% from road to rail
© OECD International Futures Programme 14

Telecom Investment to 2030(Erik Bohlin, Simon Forge and al.,
Sweden and UK)
Global investment needs:
• 2005: 650 billion $• 2010: 745 billion $• 2020: 572 billion $• 2030: 148 billion $
© OECD International Futures Programme 15

Lessons learned:
Change of ranking:
-Water comes first (OECD +Big five): 770 Billion$/year, 1 trillion $ by 2025
-Telecom: range of 650, 745 and 572 Billion$/year (global)
- Electricity: 350 Billion$/year (global)
- Transport: 220-290 Billion$/year (Road) +
(50-60 Billion$/year Rail) on a global basis
© OECD International Futures Programme 16

Estimated average annual world infrastructure investment requirements 2003-2030
(additions and renewal) In USD Bn and as a percentage of world GDP
Table 1 p 29 - Infrastructure to 2030: Telecom, Land Transport, Water and Electricity (2006)
Type of infrastructure
2000-10 Approx. % of world GDP
2010-20 Approx. % of world GDP
2020-30 Approx. % of world GDP
Road 220 0.38 245 0.32 292 0.29
Rail 49 0.09 54 0.07 58 0.06
Telecoms1 654 1.14 646 0.85 171 0.17
Electricity2 127 0.22 180 0.24 241 0.24
Water1,3 576 1.01 772 1.01 1 037 1.03
1. Estimates apply to the years 2005, 2015 and 2025.2. Transmission and distribution only.3. Only OECD countries, Russia, China, India and Brazil are considered here.
17

Phase II- Possible challenges for project design and business models?
• Huge opportunities but a financial gap• From centralised to decentralised, smaller scale• From large equipment to small equipment and perhaps different suppliers• From ground to mobile/on board networked systems • From « conventional » to new policy challenges
(funding, back up systems, safety, liabilities..)• Shortage of human capital (quantitative and qualitative
basis)© OECD International Futures Programme 18

In OECD countries, public capital investment as a share of total government expenditure is
decliningGeneral Government GFCF
As a percentage of total government outlay
5.0
5.5
6.0
6.5
7.0
7.5
8.0
8.5
9.0
9.5
10.0
Ye a r s o f S u r v e y
Source: OECD Economic Outlook No. 80 database, November 2006. 19

Public sector finances increasingly less able to meet future infrastructure needs from traditional sources
Social expenditures have increased their share (from 16% of GDP in 1980 to 21% today)
Spending on public health and long-term care likely to increase from 6.7% of GDP today to between 10.1% and 12.8% by 2050
Pensions set to rise by 3-4 percentage points
Lower spending on education for the young and child benefits
But higher spending expected on secondary, tertiary and lifelong education
Tax base may come under pressure through ageing workforce
20© OECD International Futures Programme

Source : Intelligent Infrastrucutre Futures / The Scenarios – Towards 2055
Office of Science and Technology21© OECD International Futures
Programme

Extremes of exchanges in infrastructure changes with telecommunications substitutions
Infrastructure element Investment increase or decrease
First estimate % change increase (+ve) or decrease (-ve)
Road transport infrastructure -- -5 to -10%
Air travel (business) infrastructure
-- -5 to 10%
Fuel oil – car, air transport - -5%
Health care -- -10%
Education - or same -5 to -10%
Justice --- -20%
Electricity supply + +5%
Gas supply + +5%
Heating oil + +5%
Water supply + +5%
Sanitation + +5% 22

© OECD International Futures Programme 23

Phase III -17 policy recommendationsSource: Volume 2, Infrastructure to 2030 (OECD, 2007)
1- Innovative approaches to finance
2- Improving the regulatory and institutional framework conditions
3- Strengthening governance and strategic planning
4- Developing and integrating technology
5- Expanding and improving the toolkit
© OECD International Futures Programme 24

3.1 Innovative approaches to finance
Main findings and policy recommendations – Infrastructure to 2030 (2006)
• Encourage public private partnerships (PPPs) as a means of raising additional financing for infrastructure investment and diversifying business models.
• Encourage the investment of pension funds and other large institutional investors in infrastructures.
• Make greater use of user charges for funding infrastructures. They should be designed to signal prices, reflect real costs and contribute to demand management.
• Diversify and expand traditional revenue-raising sources.
25

3.2 Improving the Regulatory and Institutional Framework
• Examine the legal and regulatory framework conditions with a view to encouraging the emergence of fresh sources of capital and new business models for the construction, maintenance and operation of infrastructures.
• Encourage the emergence of new players and new business models through the creation and promotion of frameworks that stimulate the development of effective competition either in or for the market.
• Place greater emphasis on the issue of reliability of infrastructure functioning.
• Strengthen the framework for standards, as a tool for encouraging new operational models and for improving interoperability.
Main findings and policy recommendations – Infrastructure to 2030 (2006)26

3.3 Governance and Planning
Main findings and policy recommendations - Infrastructure to 2030 (2006)
• Support the development of long-term, co-ordinated approaches to infrastructure development.
• Reduce the vulnerability of long-term infrastructure planning and implementation to short-term thinking and priority setting.
• Ensure the involvement of a broader range of stakeholders in the process of needs assessment, prioritisation, design, planning and delivery of infrastructures.
• Strengthen international co-operation to improve the efficiency, reliability and security of flows of goods, services and information across transborder infrastructures.
27

3.4 Use technologies both to improve efficiency in infrastructure and to enhance demand management
• Intelligent transport systems and capacity improvement programmes
• New systems of road network pricing and tolling
• Remote metering• Further development of cross-border electrical transmission
interconnection• Microbial fuel cells for energy from wastewater• ICT-driven public transport management• Enhanced signalling and freight rail capacity
• Use of GIS to facilitate life-cycle management of assets28© OECD International Futures Programme

3.5 Improving the Toolkit
• Strengthen public capacity to inform decision-making, improve analysis, monitor performance, and develop the requisite interdisciplinary skills to address infrastructure issues.
• Data collection, research and analysis, accrual accounting and asset management, wider use of cost-benefit analysis, new interdisciplinary approaches to education and training.
29© OECD International Futures Programme

3.6 Impact of current crisis
• Financing/funding: short term retreat from bank financing increased gap for long maturity financing difficult time for increase of user charges, but hedge funds move to infras., concept of an asset class is more
popular, clubs of investors are created, dedicated funds are launched (see Canada, Switzerland..), national bonds in France..
• Differentiation between projects: some will be postponed, reconsidered, or re-designed, some should be accelerated with derogatory procedures, governments are required to act more proactively as catalysts and PV as integrators.
© OECD International Futures Programme 30

4- Transcontinental infrastructure (Phase II, ongoing 2009-2011)
• Project: 2009-2011• Major hubs: ports, airports, corridors, multimodal
platform ..(offshore, onshore, inland..)• Time horizon: 2015, 2030, 2040-50 with trends,
drivers..• Long term potential impacts: Panama, Kra canal,
northwest pole route, security issues, Siberian corridors etc..
• Mid term impacts on competitiveness: capacity shortages, funding..
© OECD International Futures Programme 31
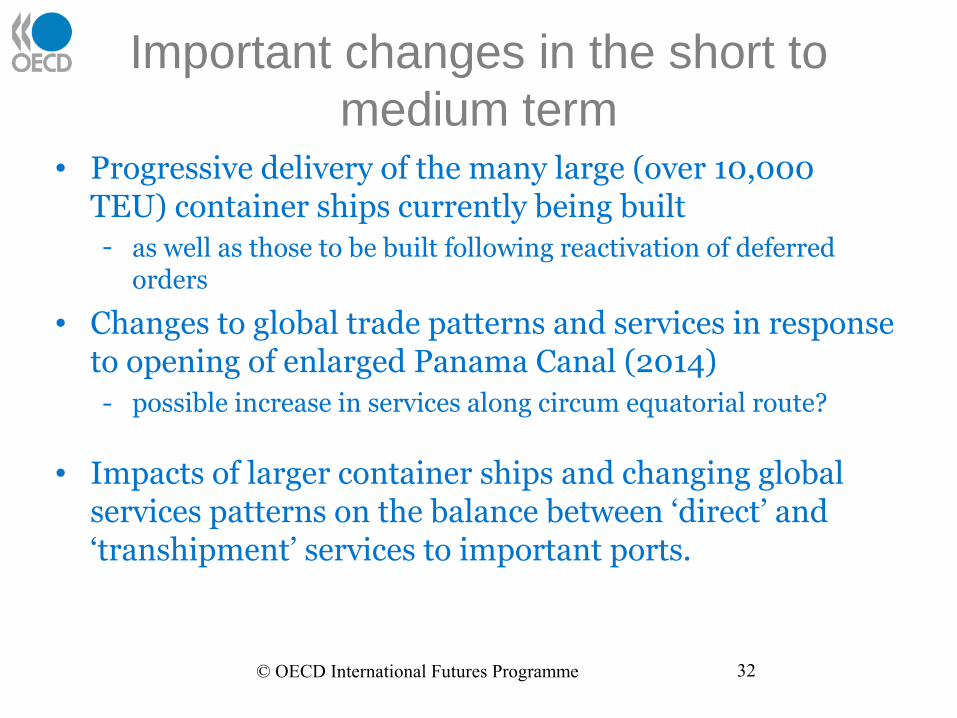
Important changes in the short to medium term
• Progressive delivery of the many large (over 10,000 TEU) container ships currently being built - as well as those to be built following reactivation of deferred
orders
• Changes to global trade patterns and services in response to opening of enlarged Panama Canal (2014)- possible increase in services along circum equatorial route?
• Impacts of larger container ships and changing global services patterns on the balance between ‘direct’ and ‘transhipment’ services to important ports.
32© OECD International Futures Programme

TEU Pre-Crisis Forecasts vs actual growth rates
33© OECD International Futures Programme

Emerging global maritime routes and markets
Source: J-P Rodrigue (2010) “Maritime Transportation Drivers for the Shipping and Port industries, ITF preparatory Session , Jan 2010, Paris
Increased volumes could reinforce circum equatorial route & trans-shipment 34

Higher volume trans-shipment locations
Source: Notteboom, T. and J-P Rodrigue (2010) “Foreland-Based Regionalization: Integrating Intermediate Hubs with Port Hinterlands”, Research in Transportation Economics.
Larger container vessels and container volumes will change service patterns – but how?

Increasing vessel sizes - Largest available container ships
Source: Notteboom, T. and J-P Rodrigue (2009) “The Future of Containerization: Perspectives from Maritime and Inland Freight Distribution”, Geojournal, Vol. 74, No. 1, pp. 7-22.
Increased number of large capacity liners to be delivered over next few years

Pre-Crisis Container Traffic 2007 (Millions of TEUs)
37

Asia – USA Container Traffic, 2005
Source: Mexico’s Infrastructure Program 2007-12 - Vice Minister T &C PPT, Sept 2008 38

Port Container Handling Projections Central America, Mexico total & 3 large ports
Source: Drewry Container Market 2009/10: Annual Review and Forecast; UNCTAD Review of Maritime Transport, 2009
Container volumes fell quickly – and could grow quite quickly as well39

Quality of Port Infrastructure
Source: Global Competitiveness Report 2009-10, World Economic Forum, 2009 40

Pre-Crisis Port Development plans
Source: Mexico’s Infrastructure Program 2007-12 - Vice Minister T &C PPT, Sept 200841

Options for Mexico
• OECD Project on Transcontinental Infrastructure Phase II- (2009-2010) ?
• Participation in OECD Space Forum (2009-2014) ?
• Project on Future Global Shocks (2009-2011) ?
• Project on Future of Family Structures (2009-2011) ?
© OECD International Futures Programme 42

Thank you.
Pierre-Alain Schieb
www.oecd.org/futures
© OECD International Futures Programme 43
Related Documents