ctrl DSS WT KO Supplementary information Figure S1. Histological scans and scores of whole colon “swiss roles”. (A) Representative images from the 4 experimental groups after five days are shown (Bars=2mm). (B) Histological scores of the 4 experimental groups determined in a blinded fashion as described in materials and methods. A B 0 5 10 15 20 25 30 35 40 Histological score *** ***

Welcome message from author
This document is posted to help you gain knowledge. Please leave a comment to let me know what you think about it! Share it to your friends and learn new things together.
Transcript
ctrl DSS
WT
KO
Supplementary information
Figure S1. Histological scans and scores of whole colon “swiss roles”.
(A) Representative images from the 4 experimental groups after five days are shown (Bars=2mm).
(B) Histological scores of the 4 experimental groups determined in a blinded fashion as described
in materials and methods.
A B
0
5
10
15
20
25
30
35
40
His
tolo
gic
al score
***
***
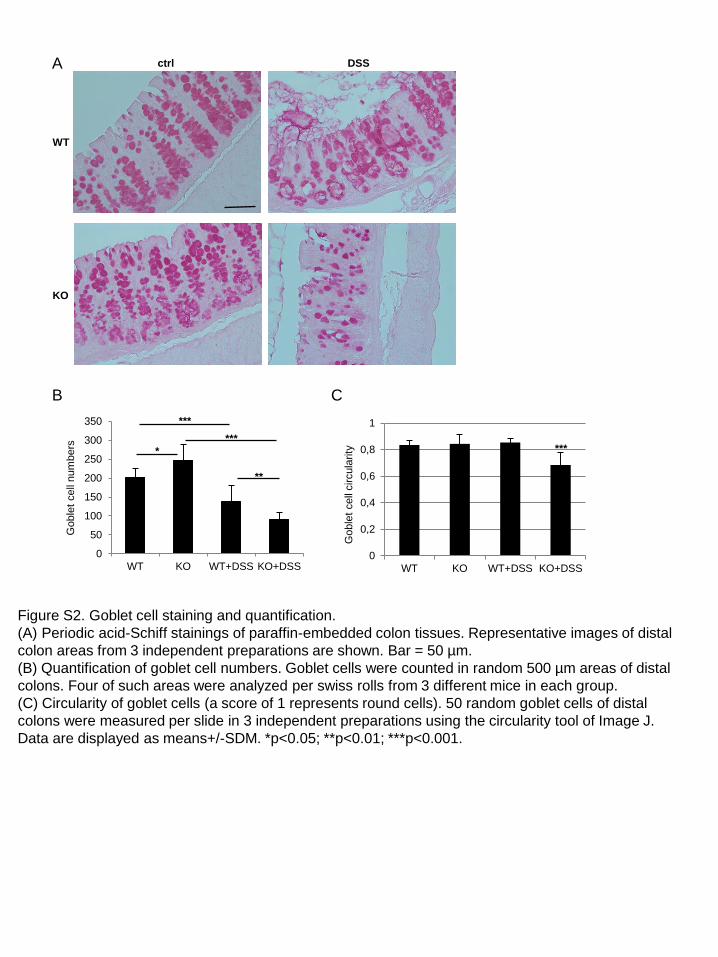
Figure S2. Goblet cell staining and quantification.
(A) Periodic acid-Schiff stainings of paraffin-embedded colon tissues. Representative images of distal
colon areas from 3 independent preparations are shown. Bar = 50 µm.
(B) Quantification of goblet cell numbers. Goblet cells were counted in random 500 µm areas of distal
colons. Four of such areas were analyzed per swiss rolls from 3 different mice in each group.
(C) Circularity of goblet cells (a score of 1 represents round cells). 50 random goblet cells of distal
colons were measured per slide in 3 independent preparations using the circularity tool of Image J.
Data are displayed as means+/-SDM. *p<0.05; **p<0.01; ***p<0.001.
B C
0
50
100
150
200
250
300
350
WT KO WT+DSS KO+DSS
Goble
t cell
num
bers
***
***
**
*
A ctrl DSS
WT
KO
0
0,2
0,4
0,6
0,8
1
WT KO WT+DSS KO+DSS
Goble
t cell
circula
rity
***
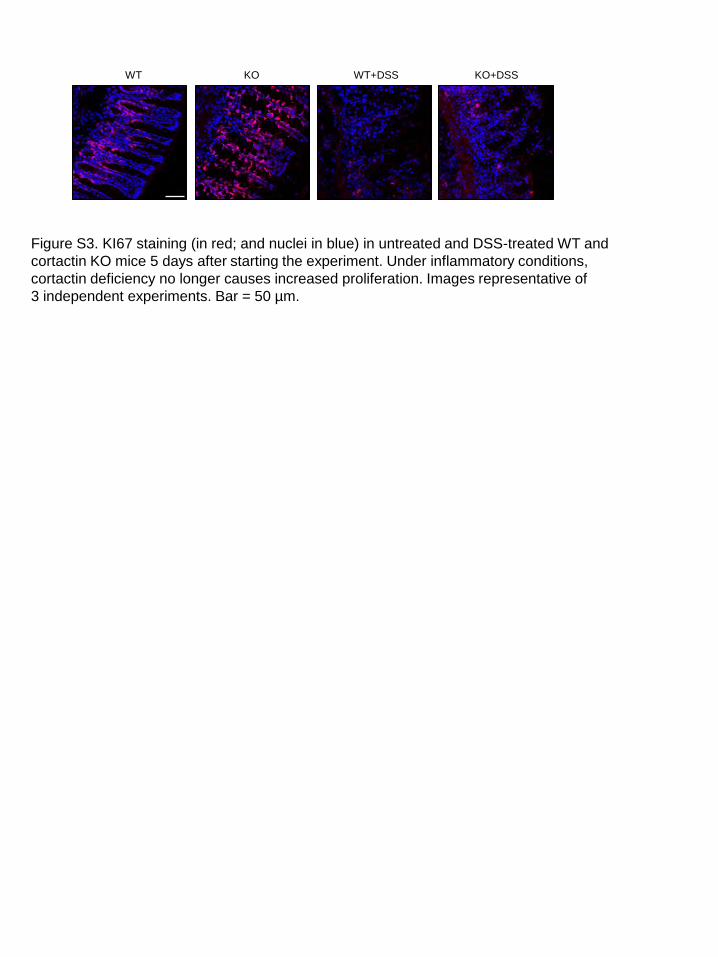
Figure S3. KI67 staining (in red; and nuclei in blue) in untreated and DSS-treated WT and
cortactin KO mice 5 days after starting the experiment. Under inflammatory conditions,
cortactin deficiency no longer causes increased proliferation. Images representative of
3 independent experiments. Bar = 50 µm.
WT KO WT+DSS KO+DSS
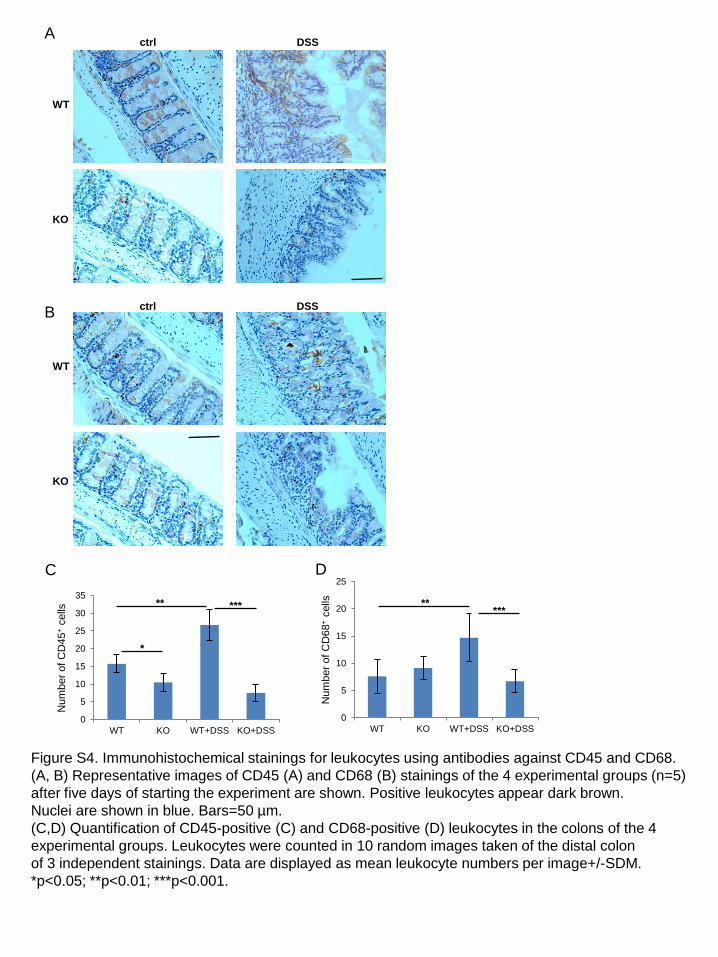
Figure S4. Immunohistochemical stainings for leukocytes using antibodies against CD45 and CD68.
(A, B) Representative images of CD45 (A) and CD68 (B) stainings of the 4 experimental groups (n=5)
after five days of starting the experiment are shown. Positive leukocytes appear dark brown.
Nuclei are shown in blue. Bars=50 µm.
(C,D) Quantification of CD45-positive (C) and CD68-positive (D) leukocytes in the colons of the 4
experimental groups. Leukocytes were counted in 10 random images taken of the distal colon
of 3 independent stainings. Data are displayed as mean leukocyte numbers per image+/-SDM.
*p<0.05; **p<0.01; ***p<0.001.
A
B
ctrl DSS
WT
KO
ctrl DSS
WT
KO
C D
0
5
10
15
20
25
30
35
WT KO WT+DSS KO+DSS
Num
ber
of
CD
45
+ c
ells
** ***
*
0
5
10
15
20
25
WT KO WT+DSS KO+DSS
Num
ber
of
CD
68
+ c
ells
** ***
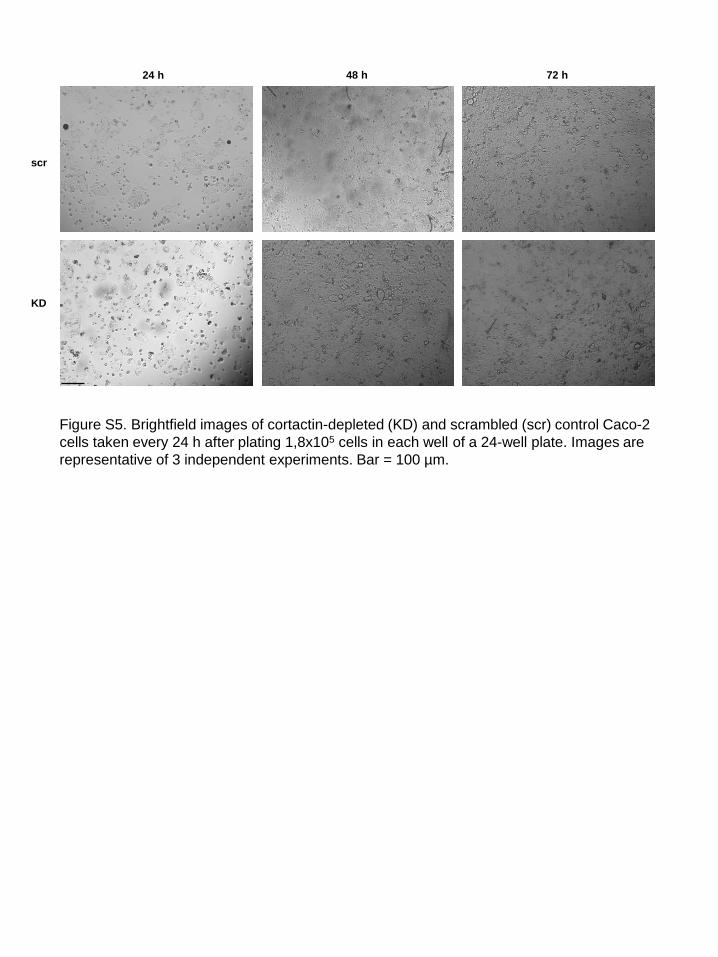
Figure S5. Brightfield images of cortactin-depleted (KD) and scrambled (scr) control Caco-2
cells taken every 24 h after plating 1,8x10⁵ cells in each well of a 24-well plate. Images are
representative of 3 independent experiments. Bar = 100 µm.
scr
KD
24 h 48 h 72 h
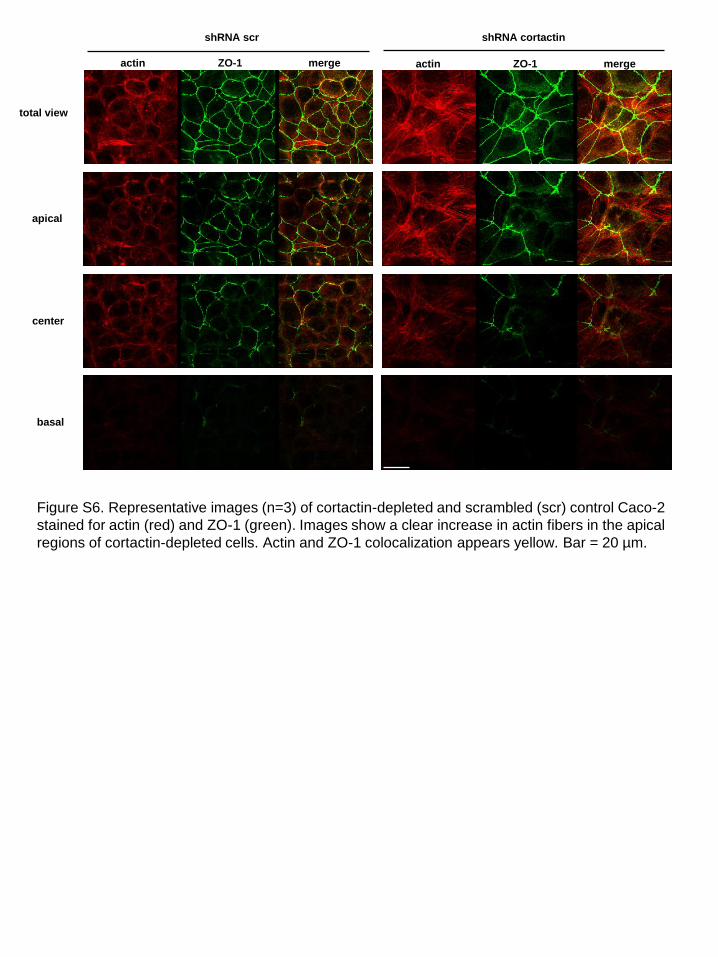
Figure S6. Representative images (n=3) of cortactin-depleted and scrambled (scr) control Caco-2
stained for actin (red) and ZO-1 (green). Images show a clear increase in actin fibers in the apical
regions of cortactin-depleted cells. Actin and ZO-1 colocalization appears yellow. Bar = 20 µm.
actin ZO-1 merge actin ZO-1 merge
shRNA scr shRNA cortactin
total view
apical
basal
center
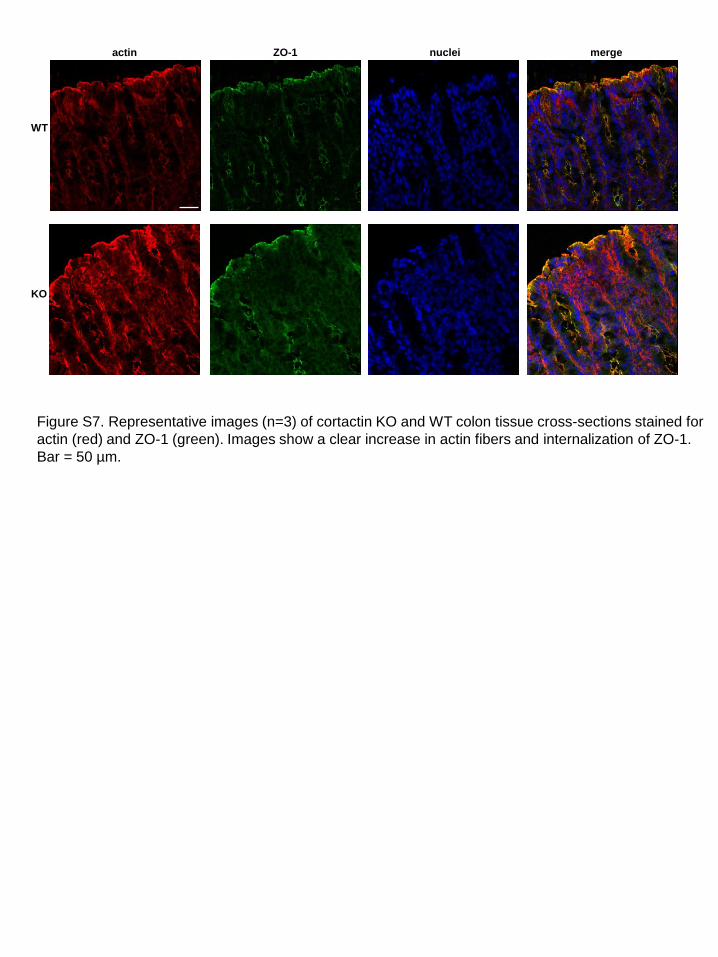
Figure S7. Representative images (n=3) of cortactin KO and WT colon tissue cross-sections stained for
actin (red) and ZO-1 (green). Images show a clear increase in actin fibers and internalization of ZO-1.
Bar = 50 µm.
WT
KO
actin ZO-1 nuclei merge
Related Documents